

CRYPTOMOJO_TA
1.7k Публикации

CRYPTOMOJO_TA
Отправить жалобу
Заблокировать пользователя
#Bitcoin and #Ethereum Learning Technical Analysis sharing margin or sport trades.
Случайный трейдер
8.1 г
17 подписок(и/а)
11.1K+ подписчиков(а)
5.1K+ понравилось
Посты
Все
Цитирования
Видео
·
--
Падение
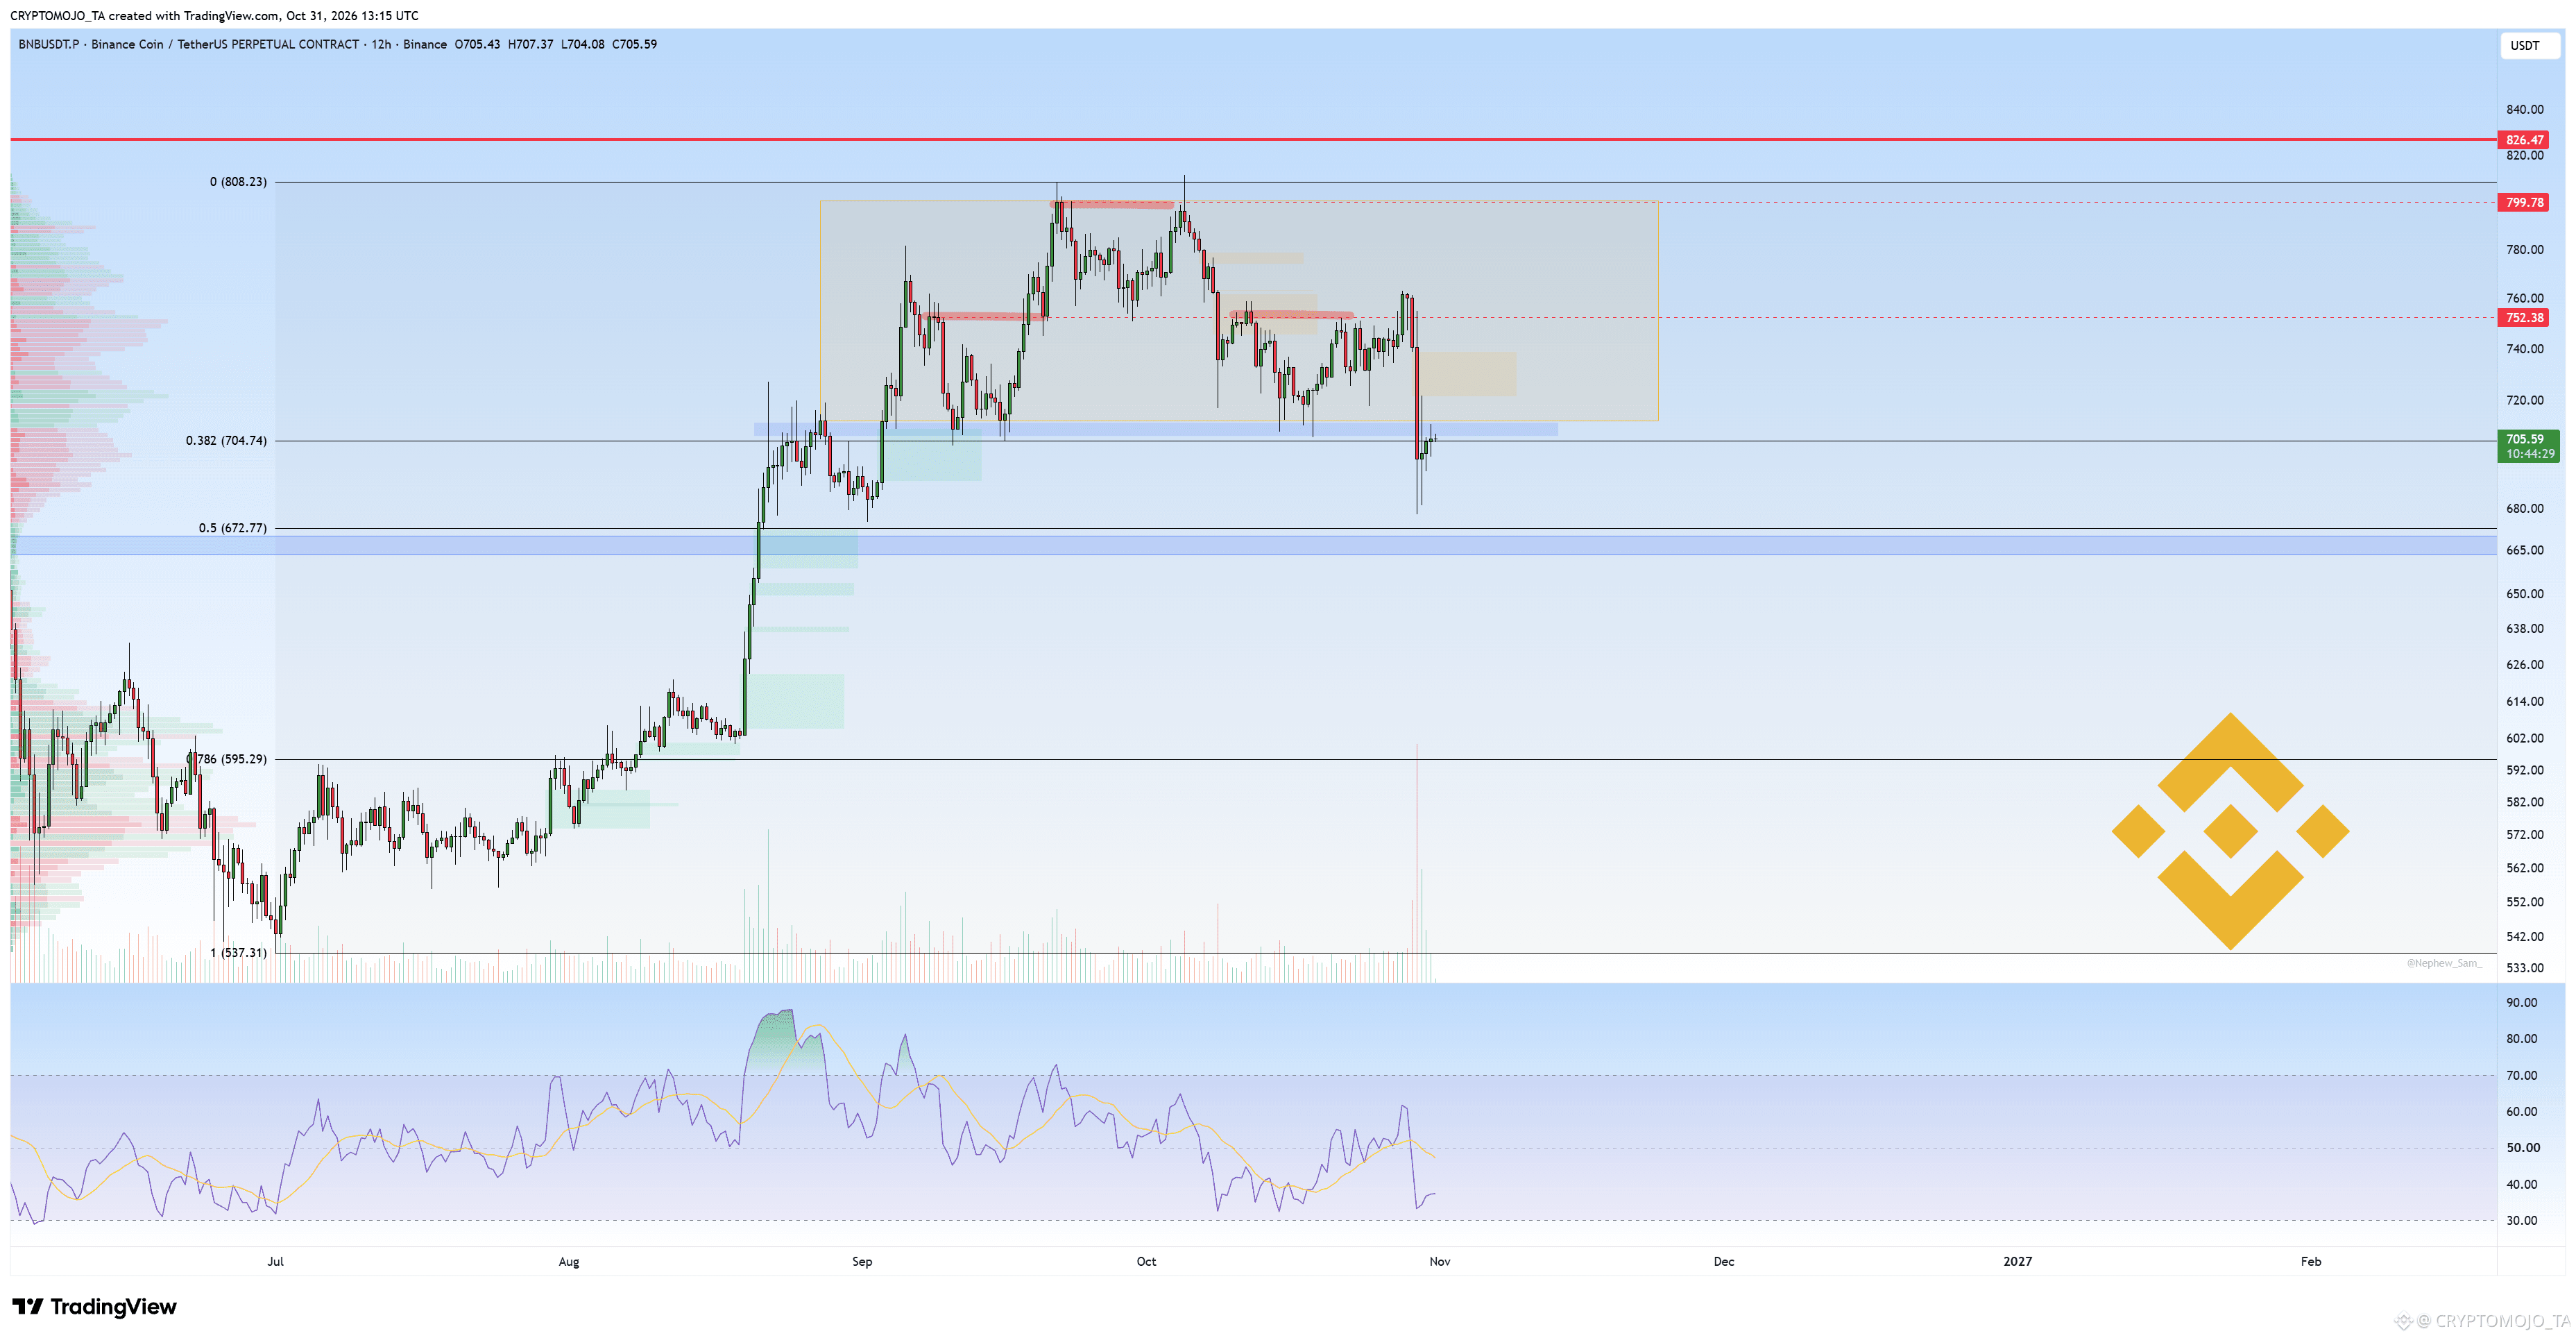
BNB is showing weakness after being rejected from the $750 resistance zone.
The price is now testing the $705 support. If we see a clean breakdown below this level, the next target is around $672, then $595.
The bearish case is still intact as long as BNB fails to reestablish the $750 zone. A break could trigger another strong leg down.
Let’s see if buyers can defend this support or if we continue lower.
194
·
--
Падение
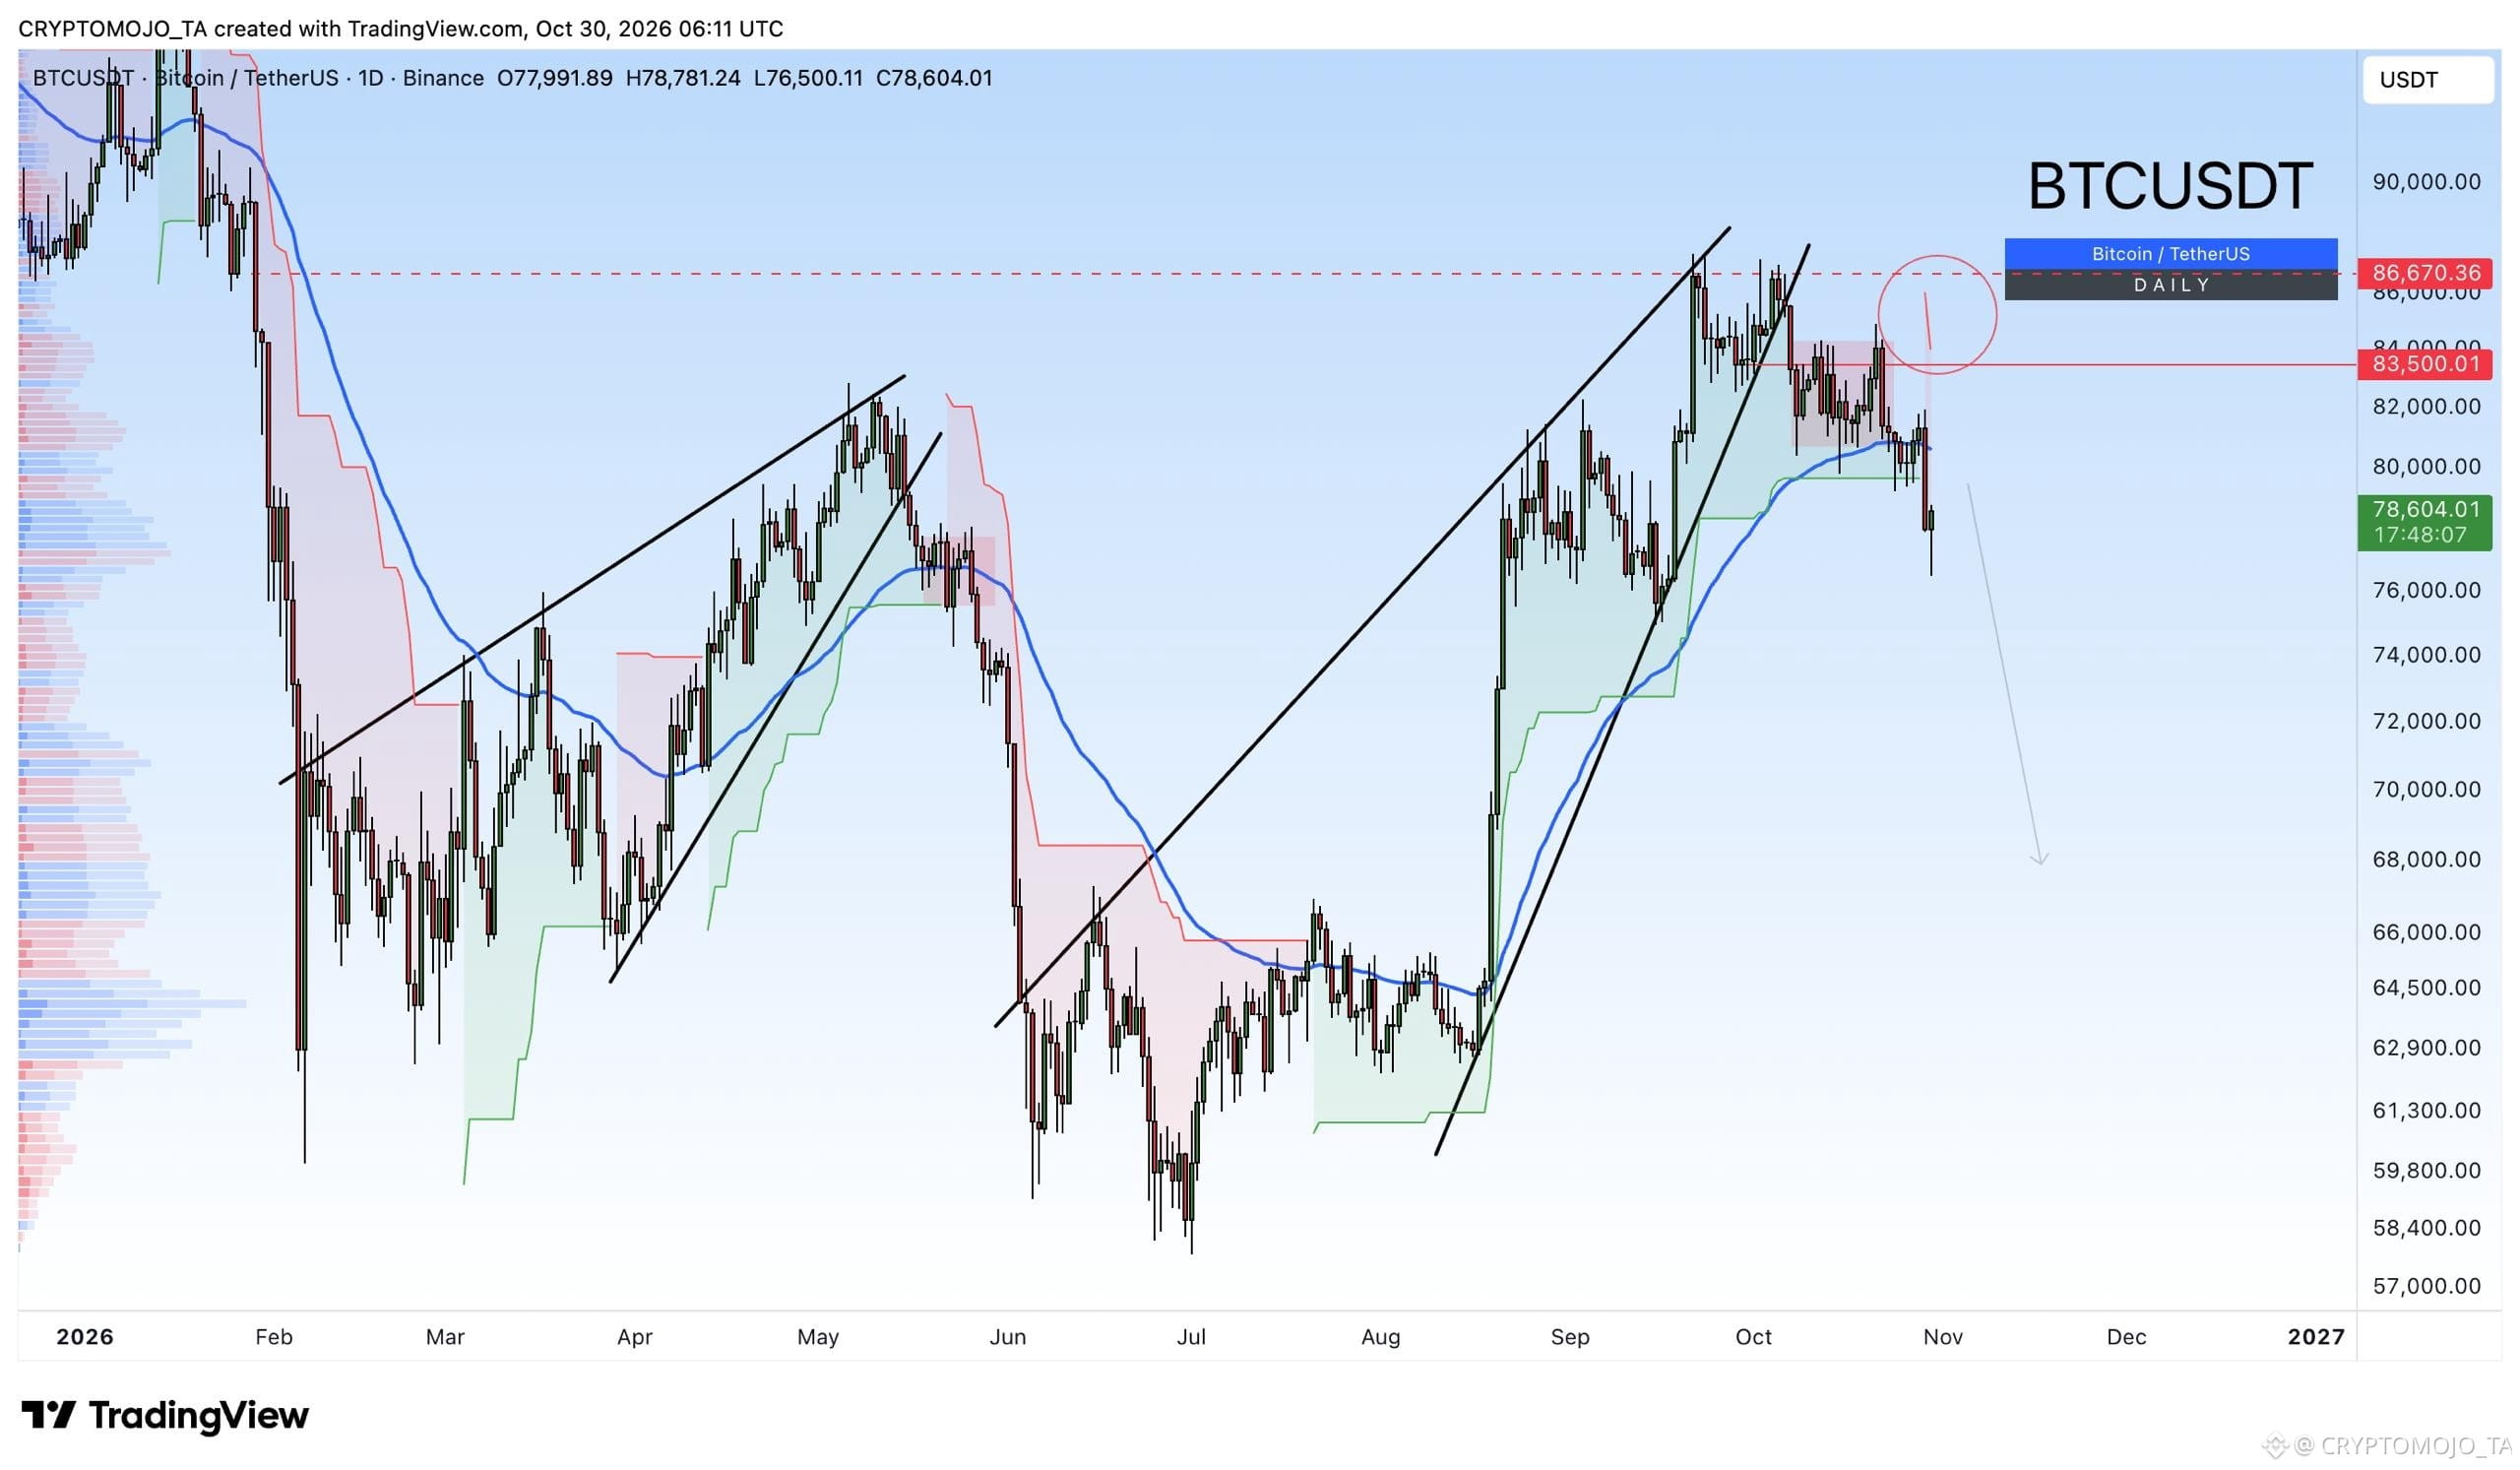
Finally, Supertrend has also turned RED and #BTC has already broken below 50 MA which makes the chart even more bearish.
What's your target price for this drop? What is your target for the BTC bottom? Will we see a new low?
Leave your opinion below.
Finally, Supertrend has also turned RED and #BTC has already broken below 50 MA which makes the chart even more bearish.
What's your target price for this drop? What is your target for the BTC bottom? Will we see a new low?
Leave your opinion below.
What's your target price for this drop? What is your target for the BTC bottom? Will we see a new low?
Leave your opinion below.
1
1.7k
·
--
Падение
BTC looks ready for $72K.
What's your opinion? Comment below.
BTC looks ready for $72K.
What's your opinion? Comment below.
What's your opinion? Comment below.
1
249
·
--
Падение
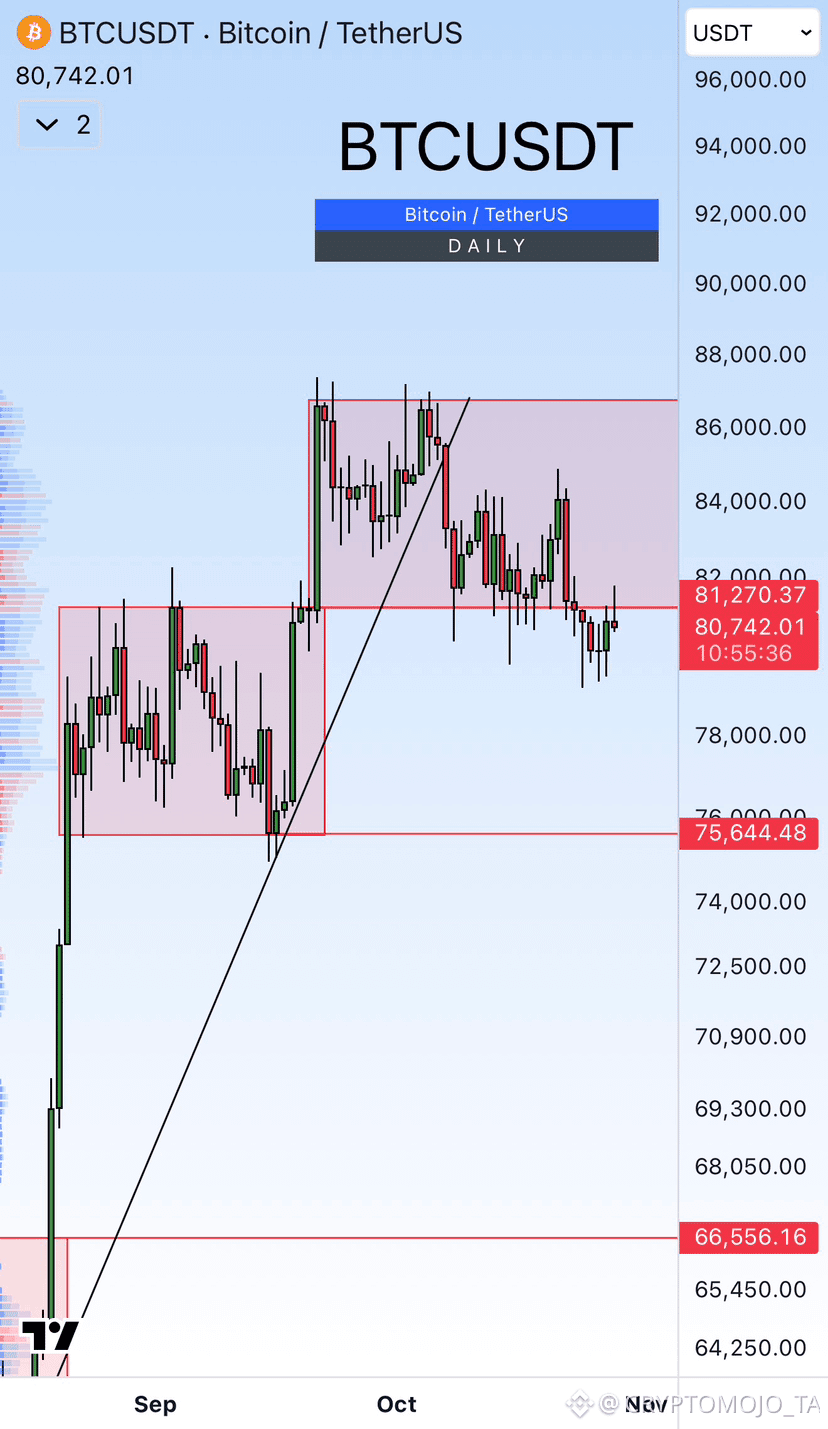
$BTC Update
BTC is still struggling to reclaim the $81.2K resistance after breaking below the previous range.
If this level continues to act as resistance, we could see another move toward $78K and potentially the major support zone around $75.6K
Let’s see whether BTC reclaims the range or continues lower. What do you think?
2
319
·
--
Падение
#BTCUSDT
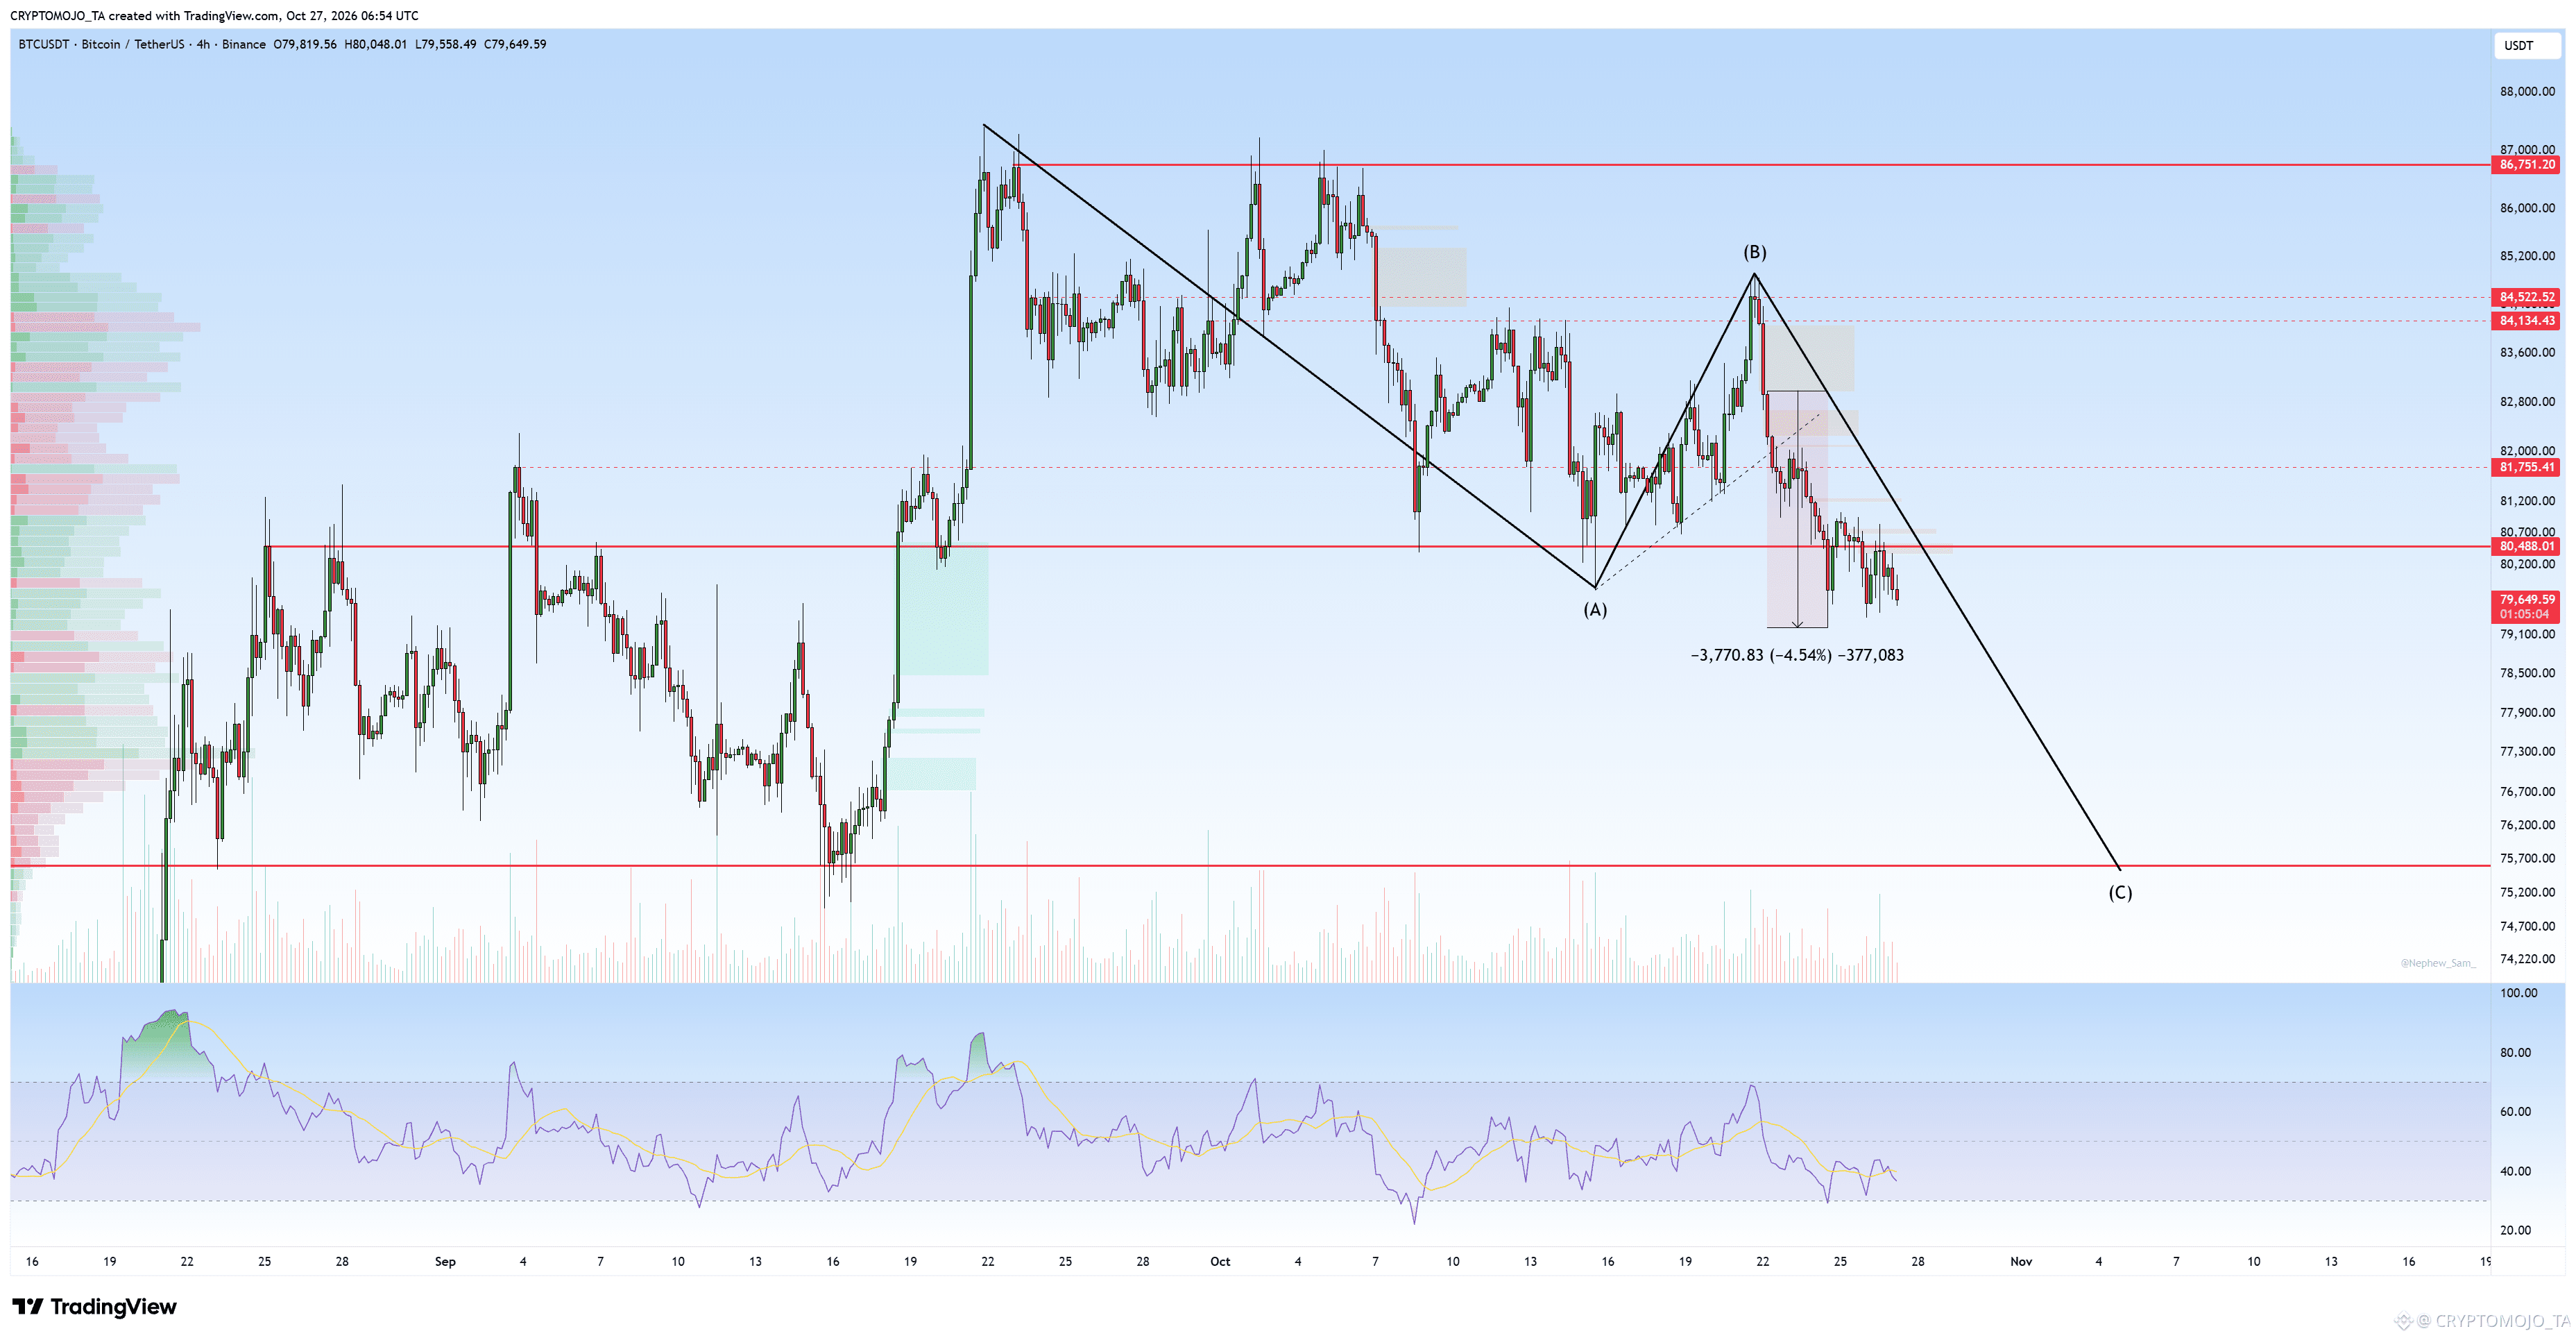
Bitcoin has moved exactly as expected.
After the rejection from the $84.5K–$85K zone, BTC has continued to move down and is now trading around $79.6K, breaking below the $80.5K support.
Current result: +4.5%🔥
The ABC corrective structure is still playing out, with the next major target around $75.5K–$76K.
Let’s see if BTC continues toward the C wave target.
#BTC
CRYPTOMOJO_TA
·
--
ПадениеBTC Is this the start of the next leg down? 👀
BTC is currently forming what looks like an ABC corrective structure. After completing the A leg, the bounce toward the 84.5K–85K area could be the B wave.
If this rejection continues, the C wave could take BTC toward the 75.5K–76K support zone shown on the chart.
The key invalidation is a strong reclaim above 84.5K, while 86.7K remains the major resistance.
Do you think the C wave is coming?
165
·
--
Падение
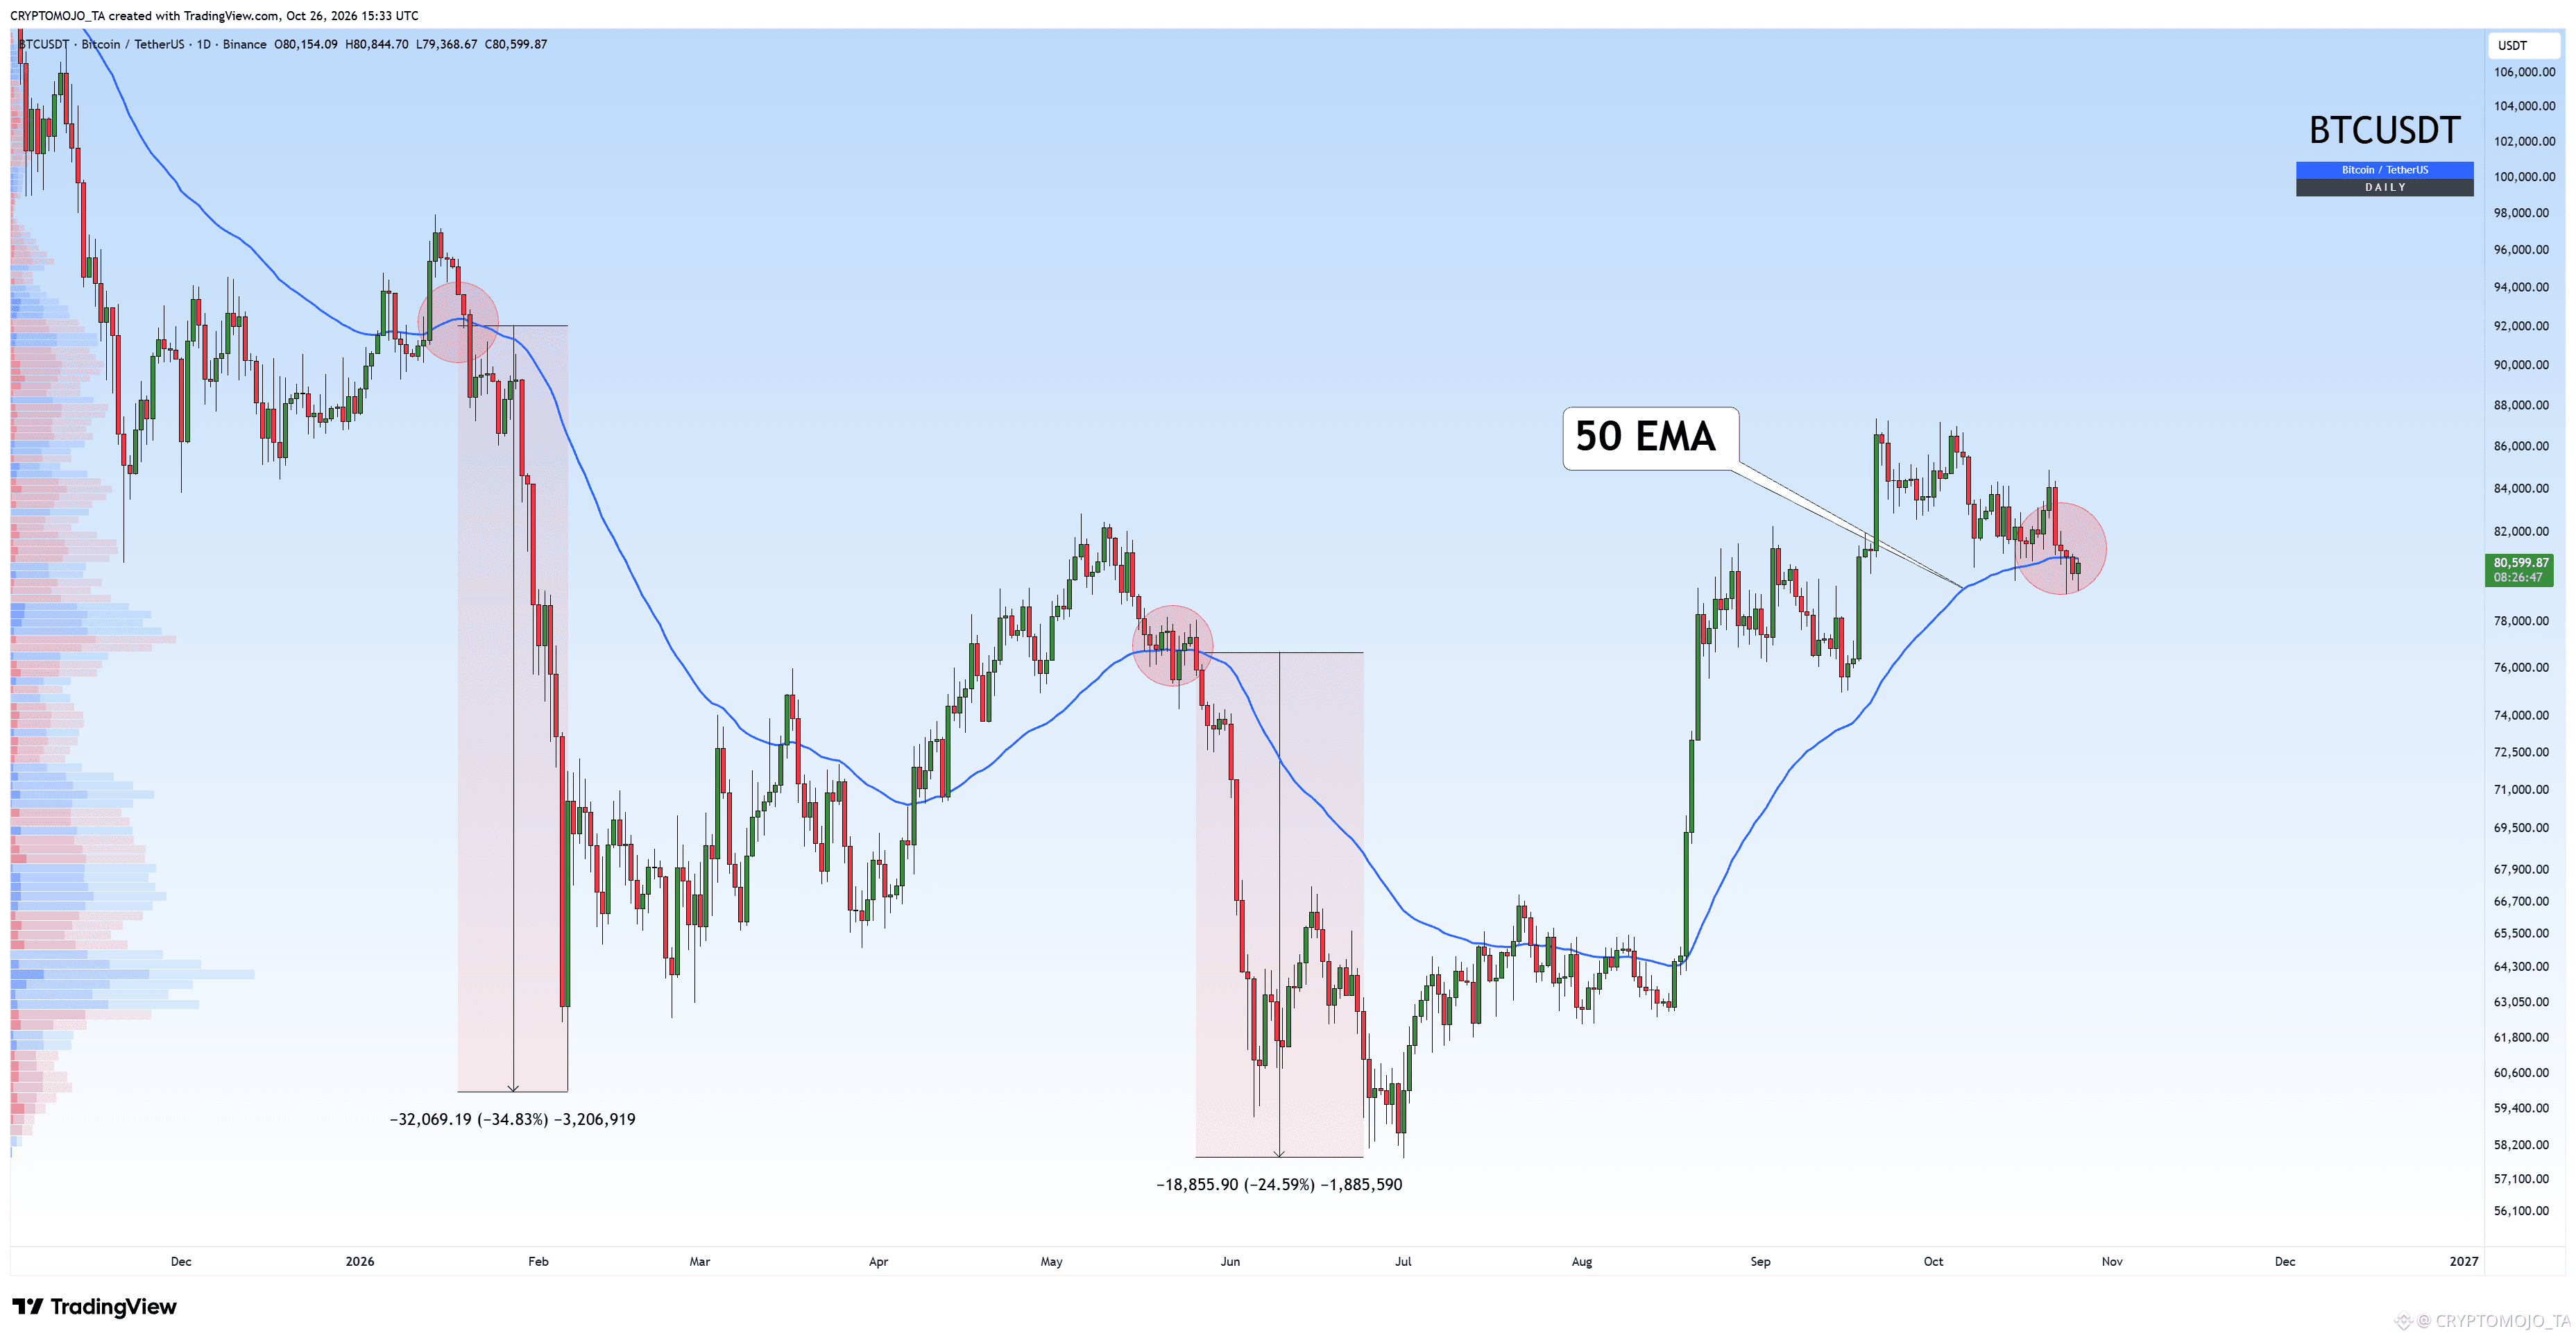
Breakdown confirmed.🚨
BTC has lost the daily 50 EMA, and previous breakdowns led to major drops of 25–35%.
Are we heading for a new low, or can BTC reclaim the 50 EMA?
What’s your opinion? Share it in the comments.
#BinancePick #BTC
Breakdown confirmed.🚨
BTC has lost the daily 50 EMA, and previous breakdowns led to major drops of 25–35%.
Are we heading for a new low, or can BTC reclaim the 50 EMA?
What’s your opinion? Share it in the comments.
#BinancePick #BTC
BTC has lost the daily 50 EMA, and previous breakdowns led to major drops of 25–35%.
Are we heading for a new low, or can BTC reclaim the 50 EMA?
What’s your opinion? Share it in the comments.
#BinancePick #BTC
151
·
--
Падение
$ETH Update
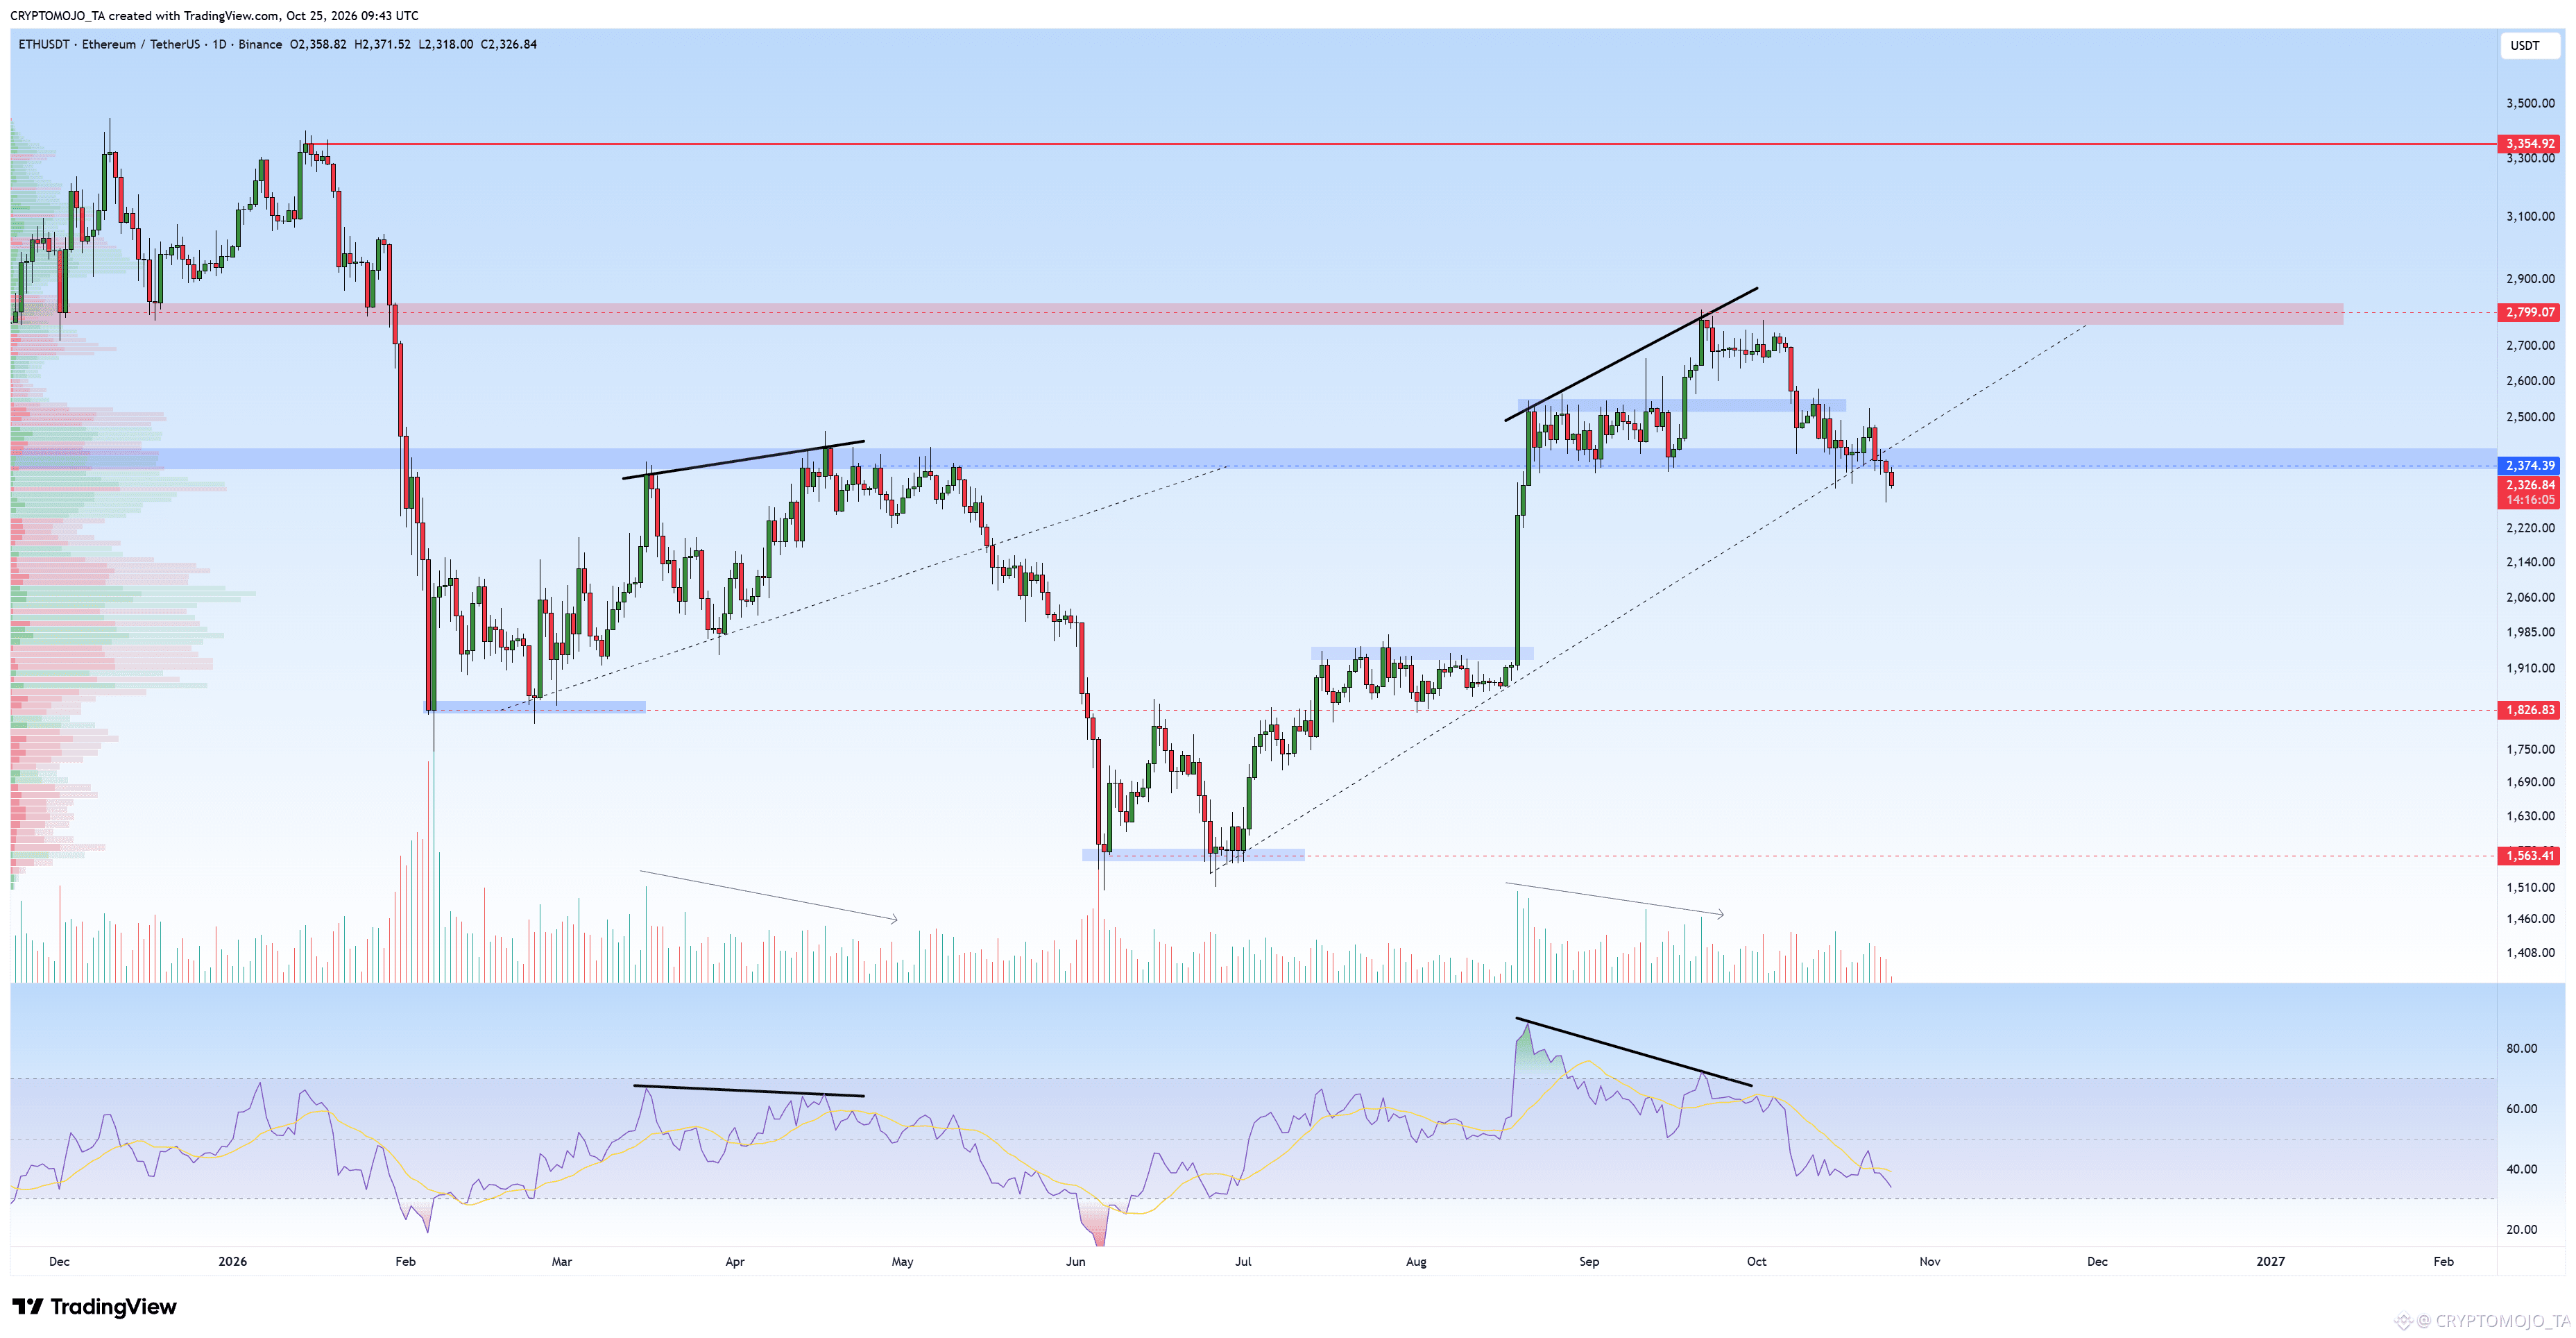
As you can see, ETH has broken below the trendline, and bearish momentum is picking up.
The weekly candle closes today, so I want to see how we finish the week. After that, we could see some sideways movement or a retest of the broken trendline before the next move down.
That's my view for now. Let's see how the weekly candle closes.
313
·
--
Падение
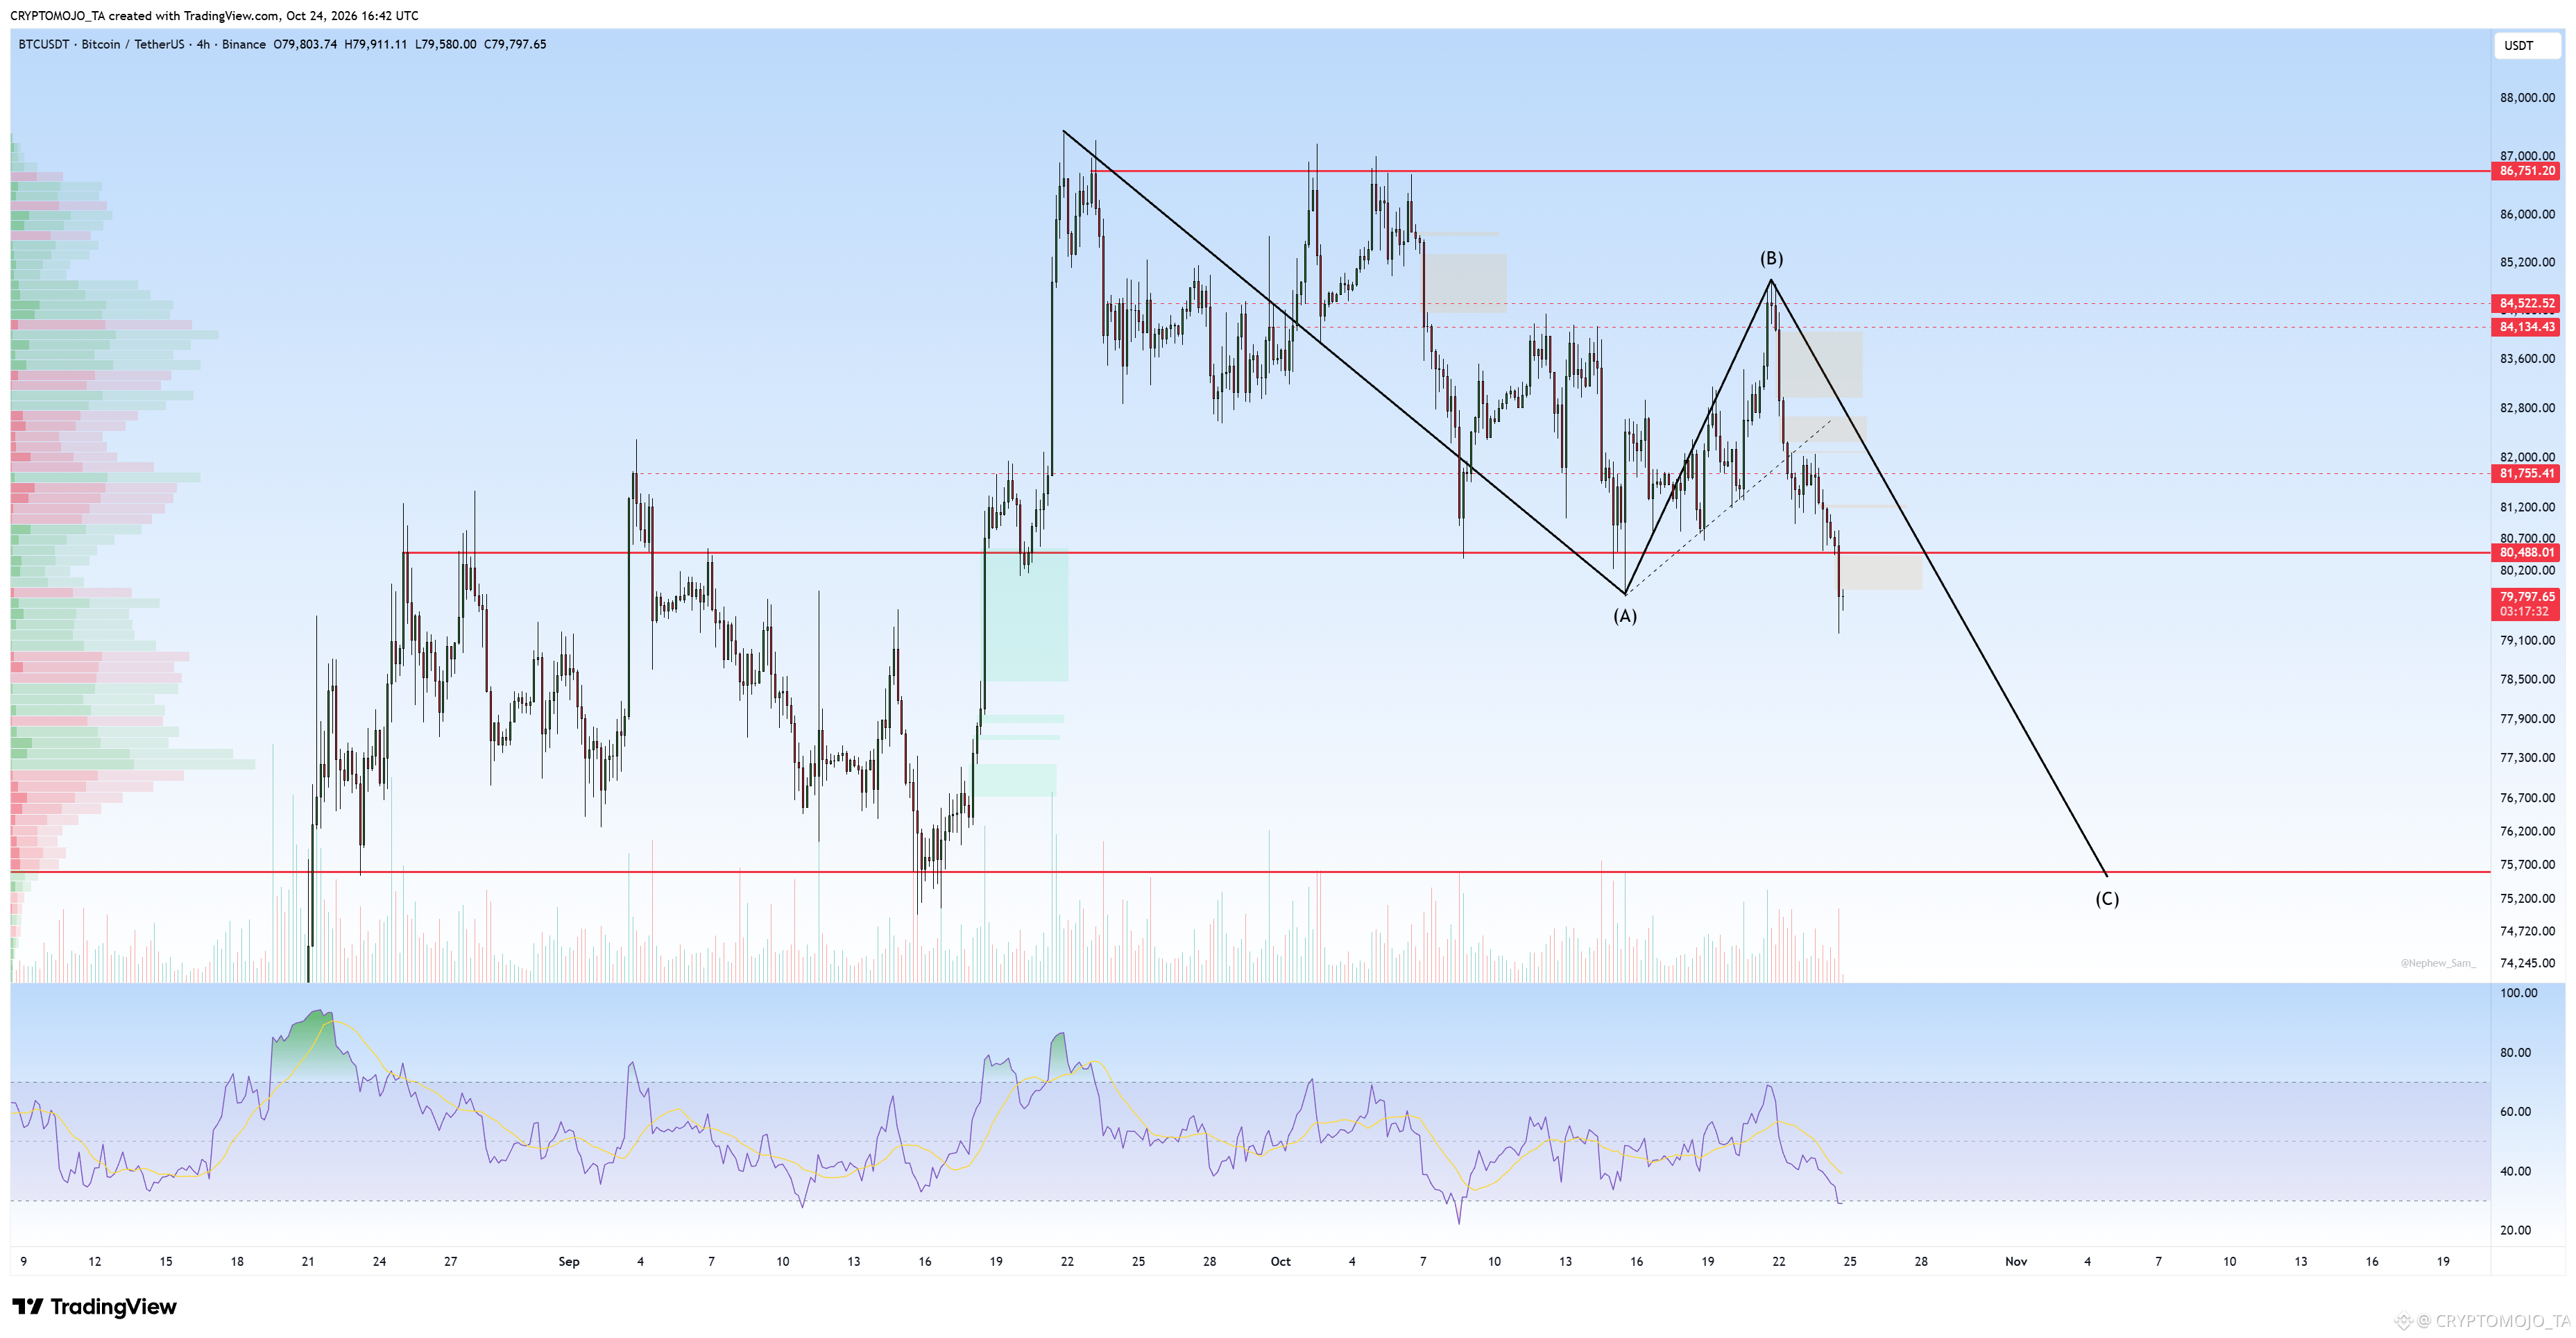
We have now broken below the $80,500 support, and the bearish momentum is getting stronger.
The next major target remains around $75,500, completing the projected ABC correction.
We have now broken below the $80,500 support, and the bearish momentum is getting stronger.
The next major target remains around $75,500, completing the projected ABC correction.
The next major target remains around $75,500, completing the projected ABC correction.
1
256
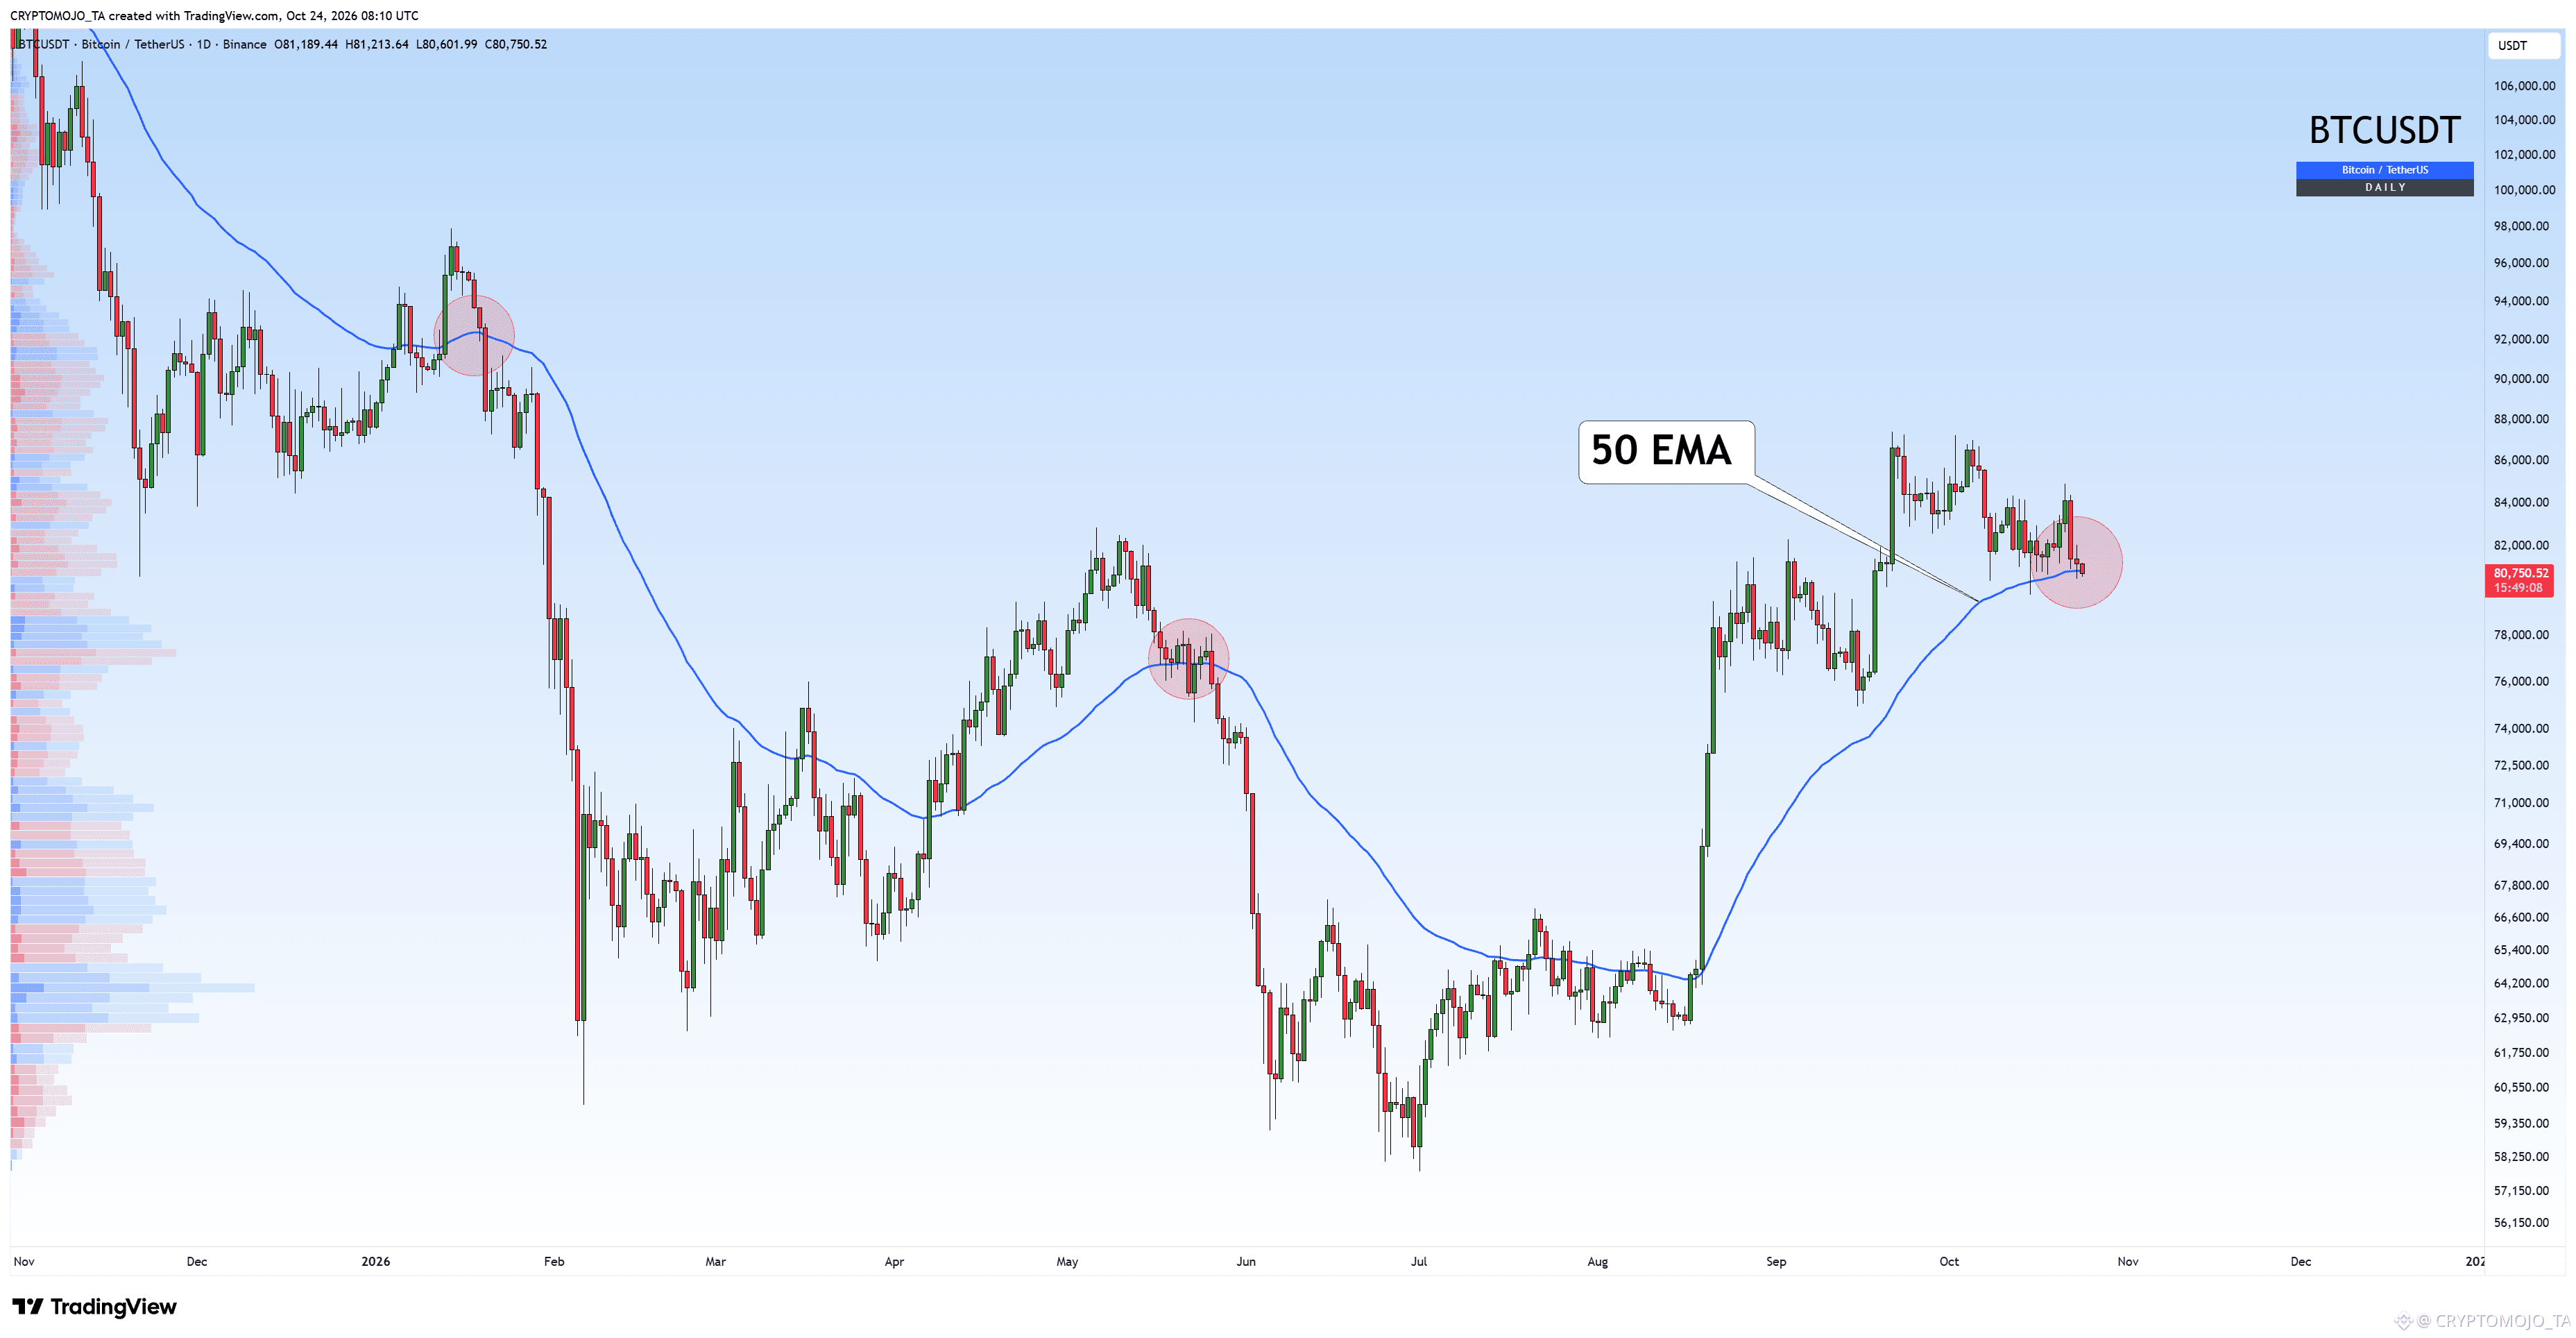
BTC is losing the daily 50 EMA.
Every previous breakdown marked on the chart led to a major drop.
If we lose this level again, are we heading for a new low? What do you think?
#BinancePick
BTC is losing the daily 50 EMA.
Every previous breakdown marked on the chart led to a major drop.
If we lose this level again, are we heading for a new low? What do you think?
#BinancePick
Every previous breakdown marked on the chart led to a major drop.
If we lose this level again, are we heading for a new low? What do you think?
#BinancePick
235
·
--
Падение
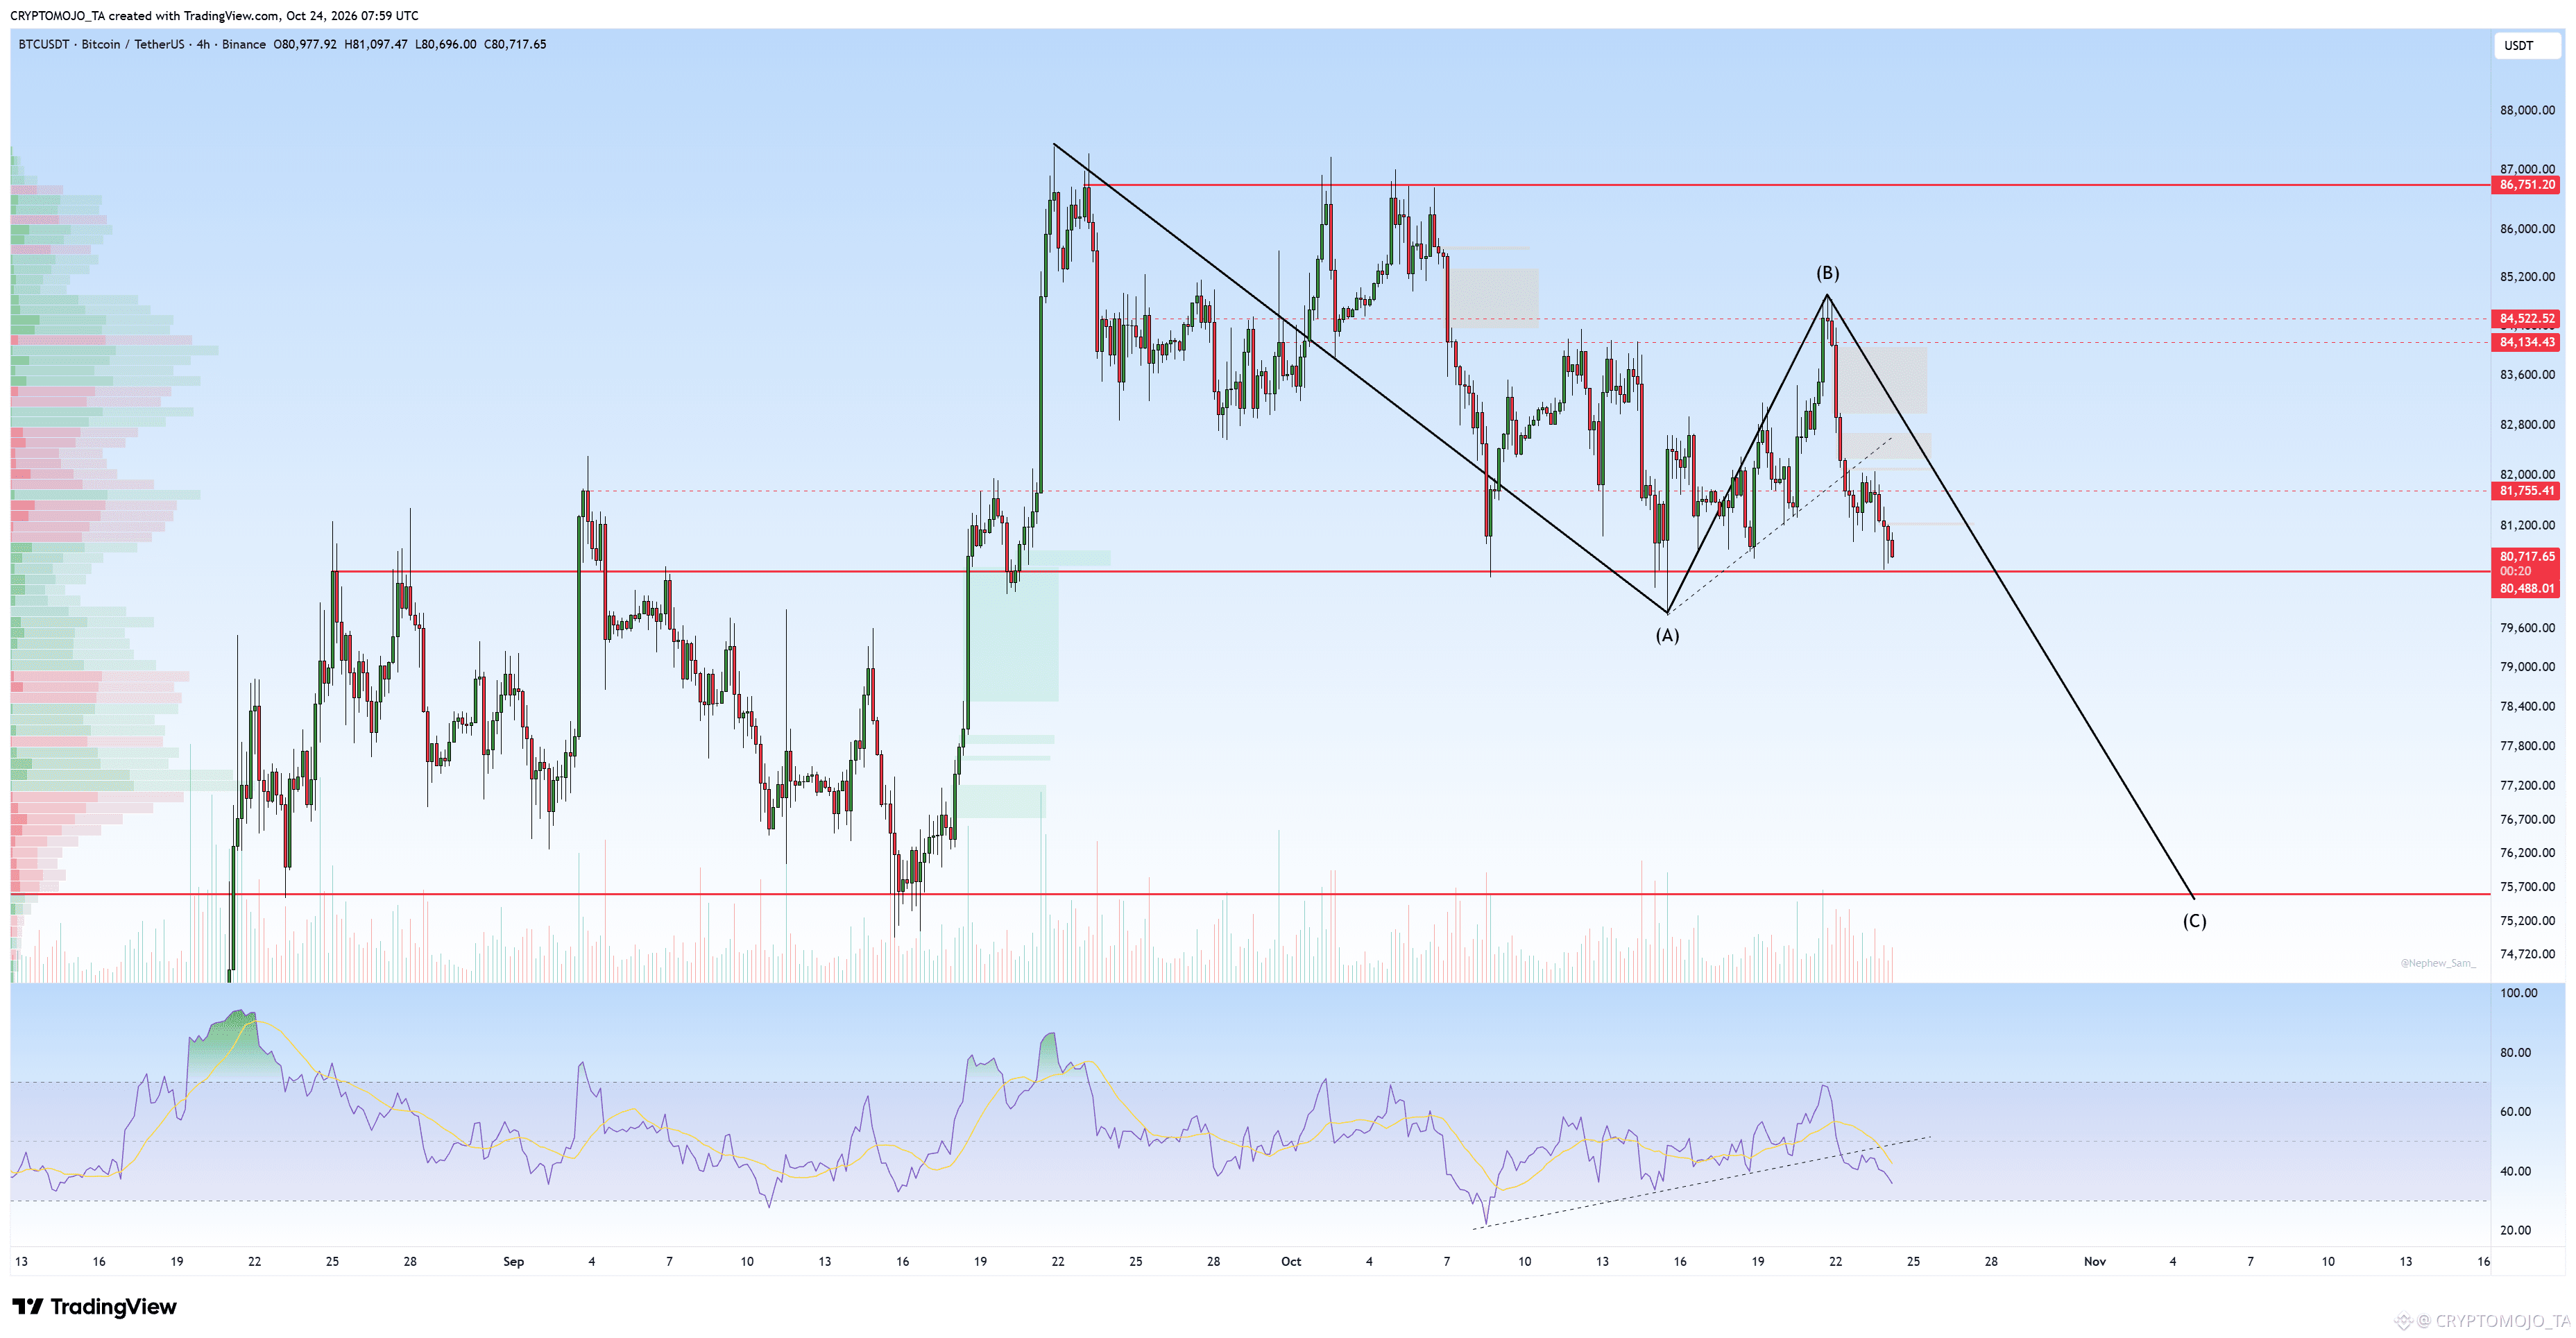
It is moving exactly as expected.
BTC has now reached the $80.5K support zone. This is an important level to watch.
If this support breaks and we get a clean confirmation below it, the next major target remains around $75.5K, which would complete the projected move.
For now, let’s see whether buyers can defend this support or if BTC finally breaks down.
CRYPTOMOJO_TA
·
--
ПадениеBTC Is this the start of the next leg down? 👀
BTC is currently forming what looks like an ABC corrective structure. After completing the A leg, the bounce toward the 84.5K–85K area could be the B wave.
If this rejection continues, the C wave could take BTC toward the 75.5K–76K support zone shown on the chart.
The key invalidation is a strong reclaim above 84.5K, while 86.7K remains the major resistance.
Do you think the C wave is coming?
BTC is currently forming what looks like an ABC corrective structure. After completing the A leg, the bounce toward the 84.5K–85K area could be the B wave.
If this rejection continues, the C wave could take BTC toward the 75.5K–76K support zone shown on the chart.
The key invalidation is a strong reclaim above 84.5K, while 86.7K remains the major resistance.
Do you think the C wave is coming?
152
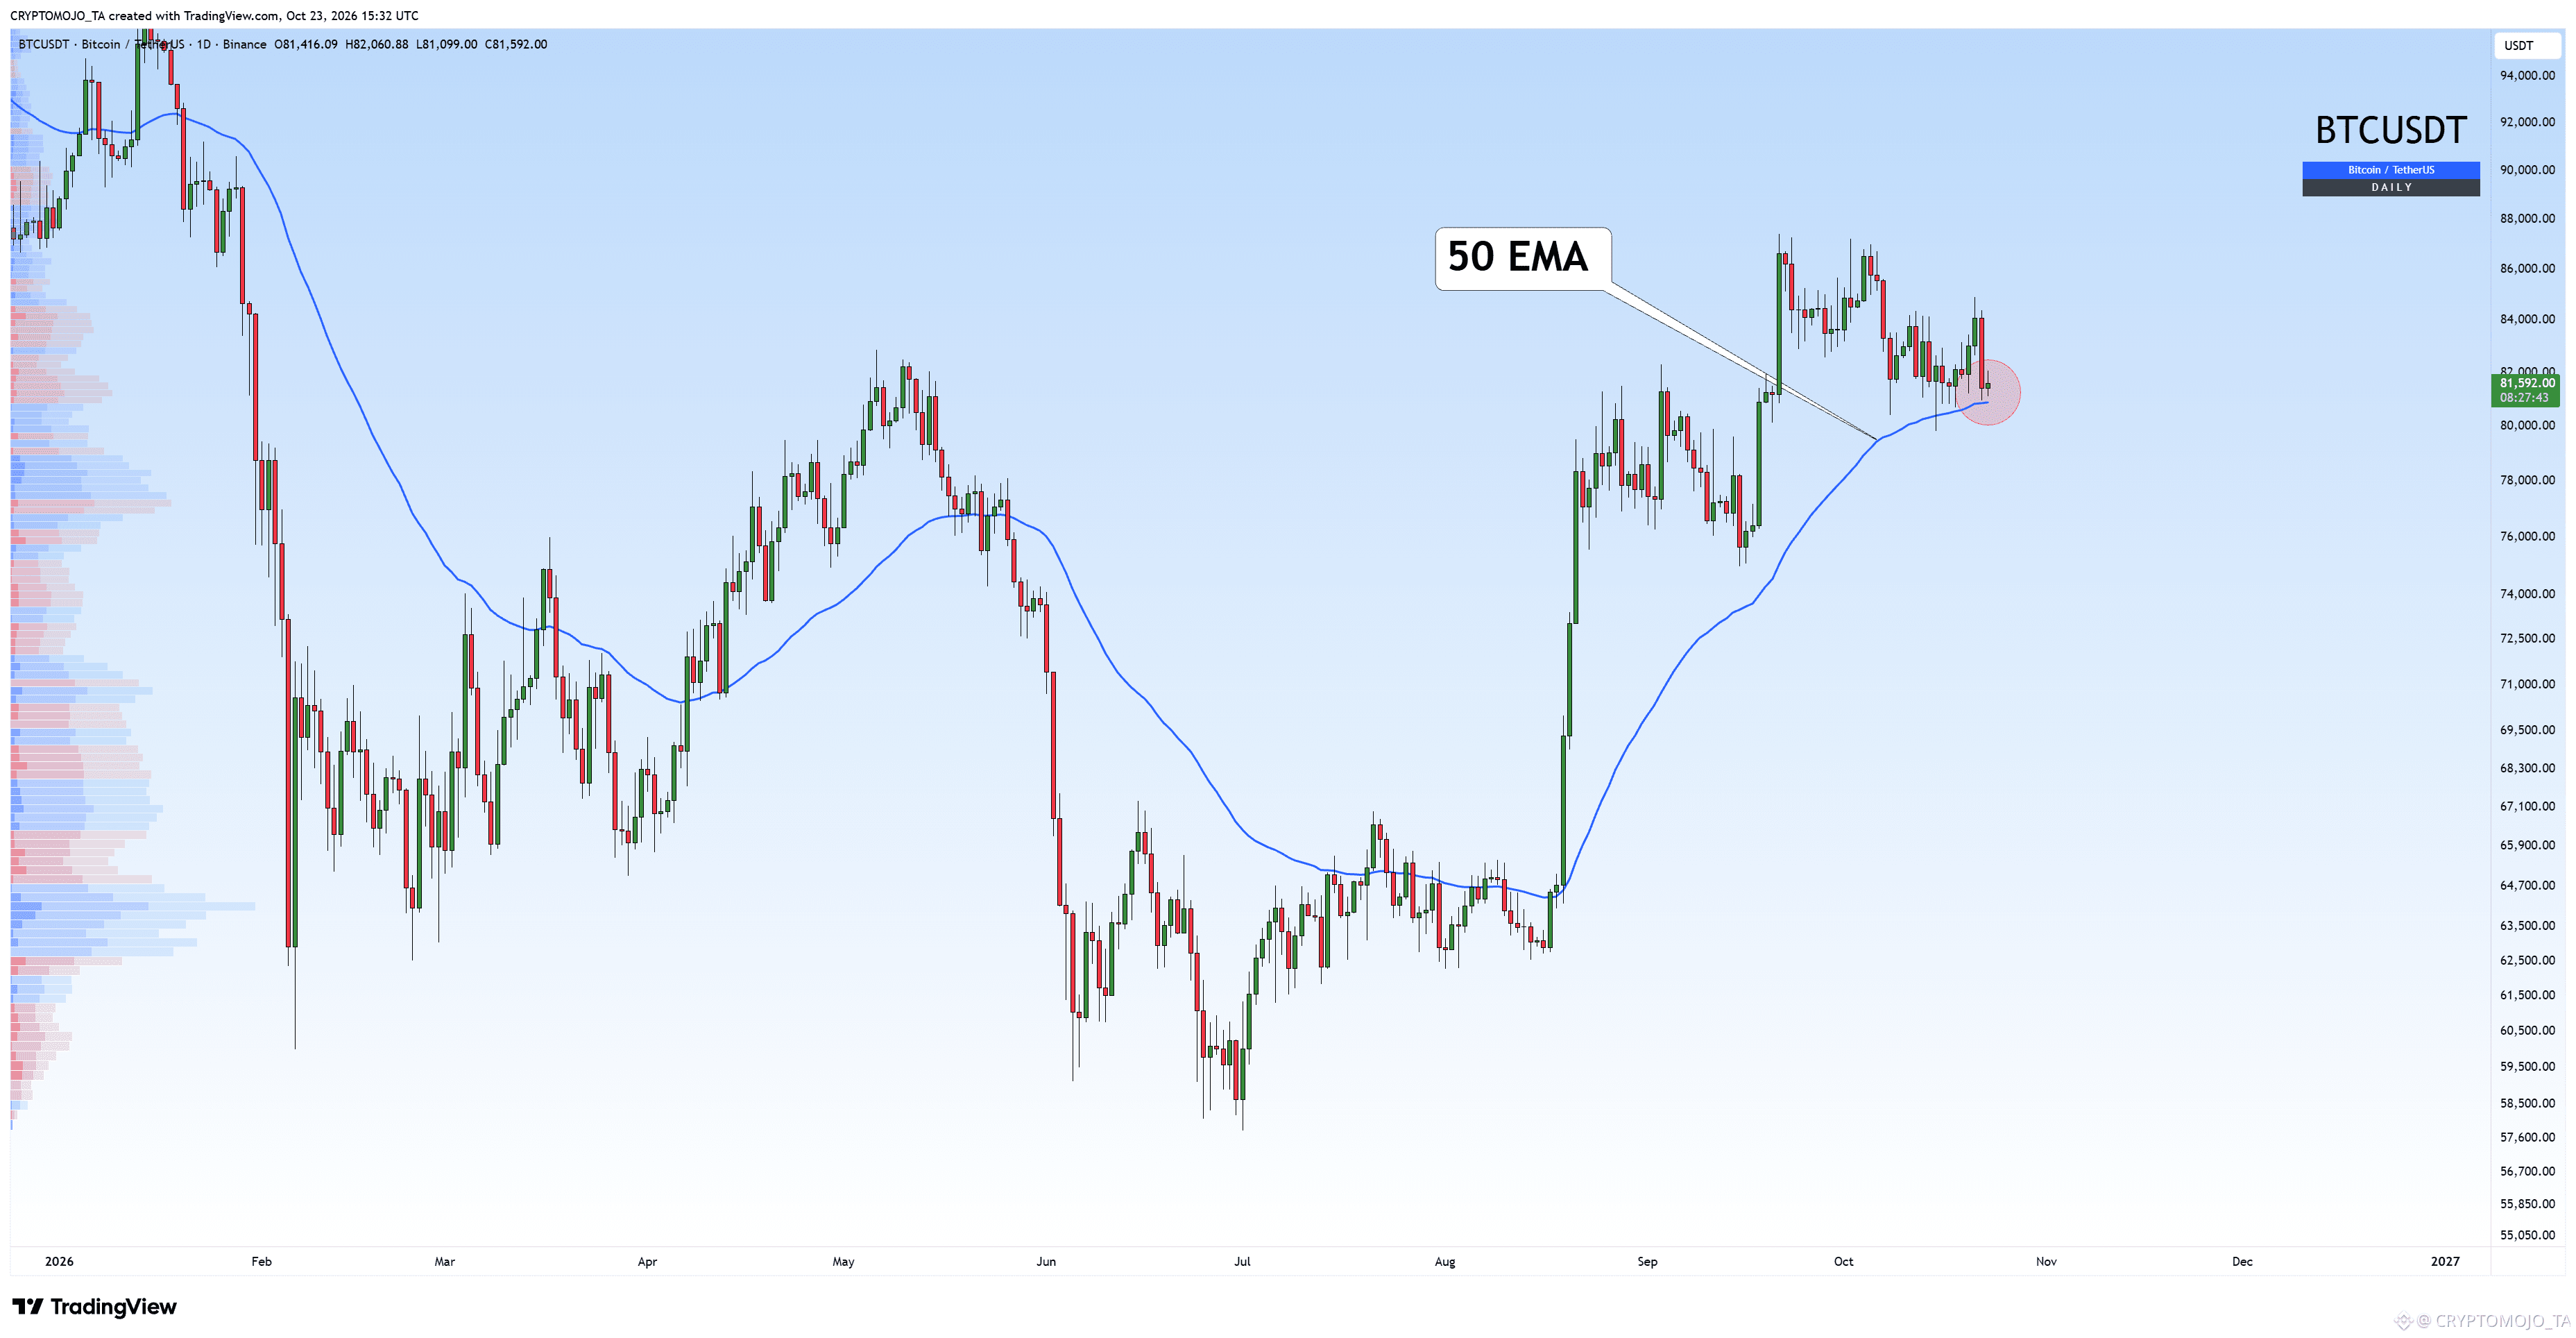
The 50 EMA is still holding as support on the daily timeframe. A breakdown could trigger further downside.
The 50 EMA is still holding as support on the daily timeframe. A breakdown could trigger further downside.
1
210
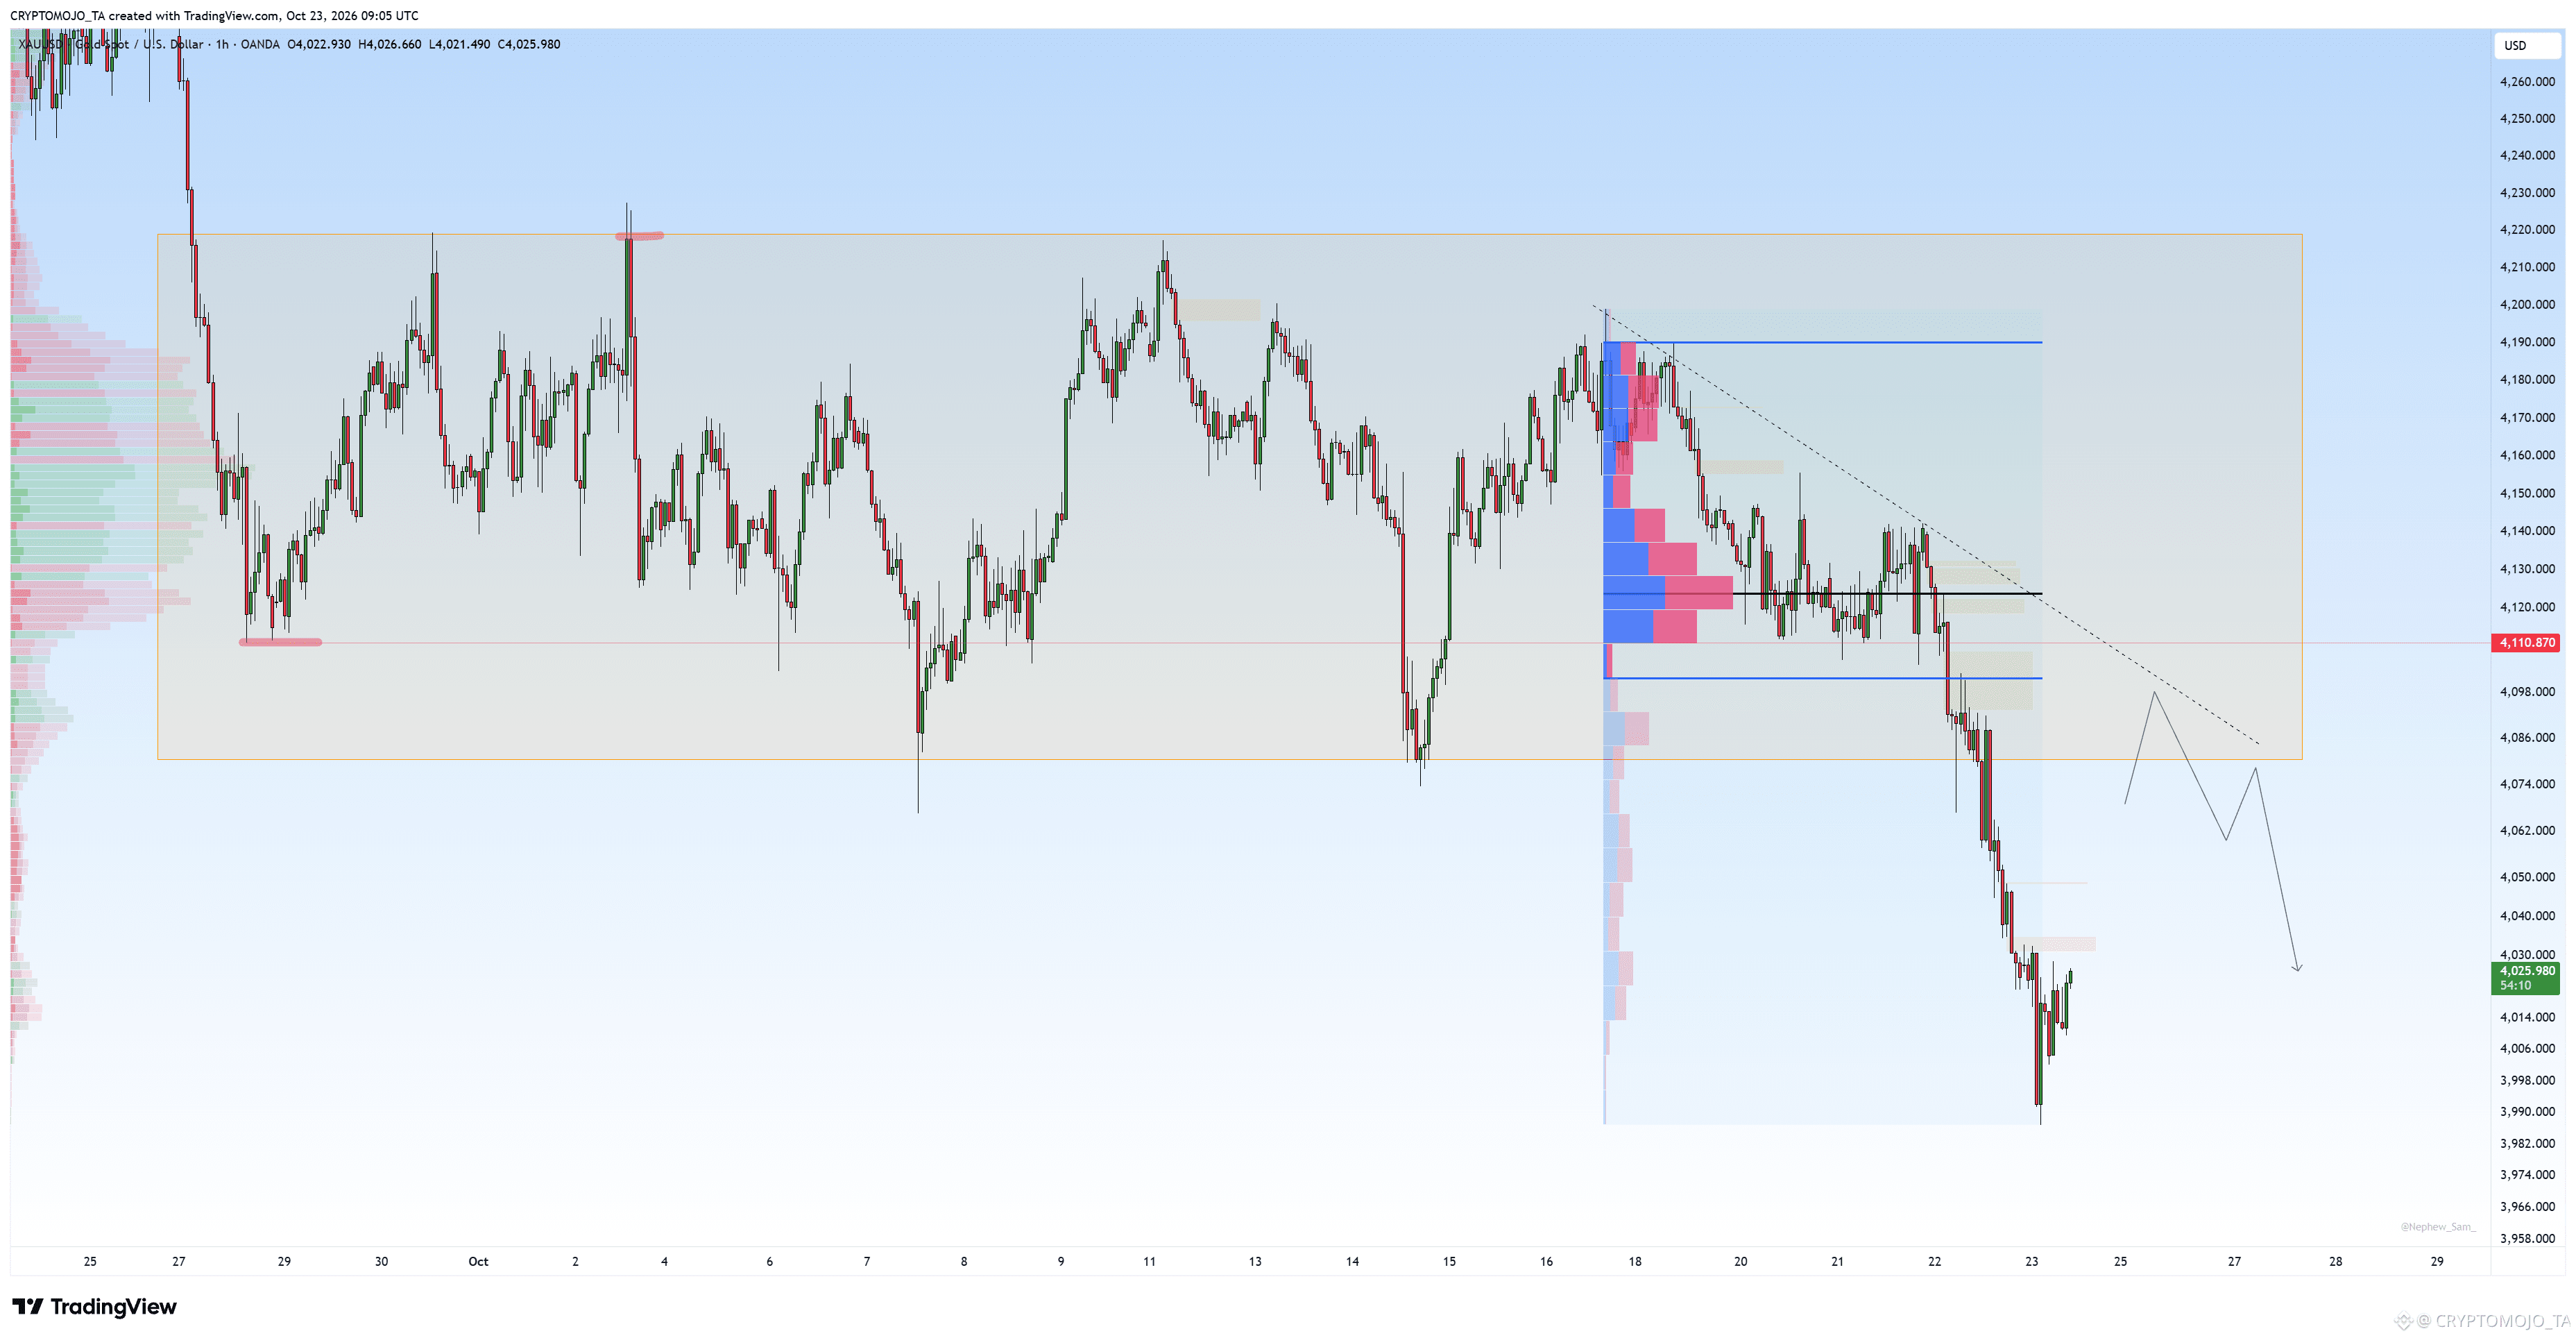
Gold finally broke down from the range we were watching and the move was sharp.
The $4,100–$4,110 area has now turned into an important resistance zone after the breakdown. Price has already swept below the previous range low and reached around $4,000, where we’re seeing a small bounce.
For me, this is where it gets interesting. If Gold gets a relief bounce, I’ll be watching $4,085–$4,110 for a possible rejection. A clean reclaim of $4,110 would weaken the bearish setup.
But if sellers stay in control and $4,000 breaks, I wouldn’t be surprised to see another leg lower.
Right now, the structure still looks bearish.
1
510
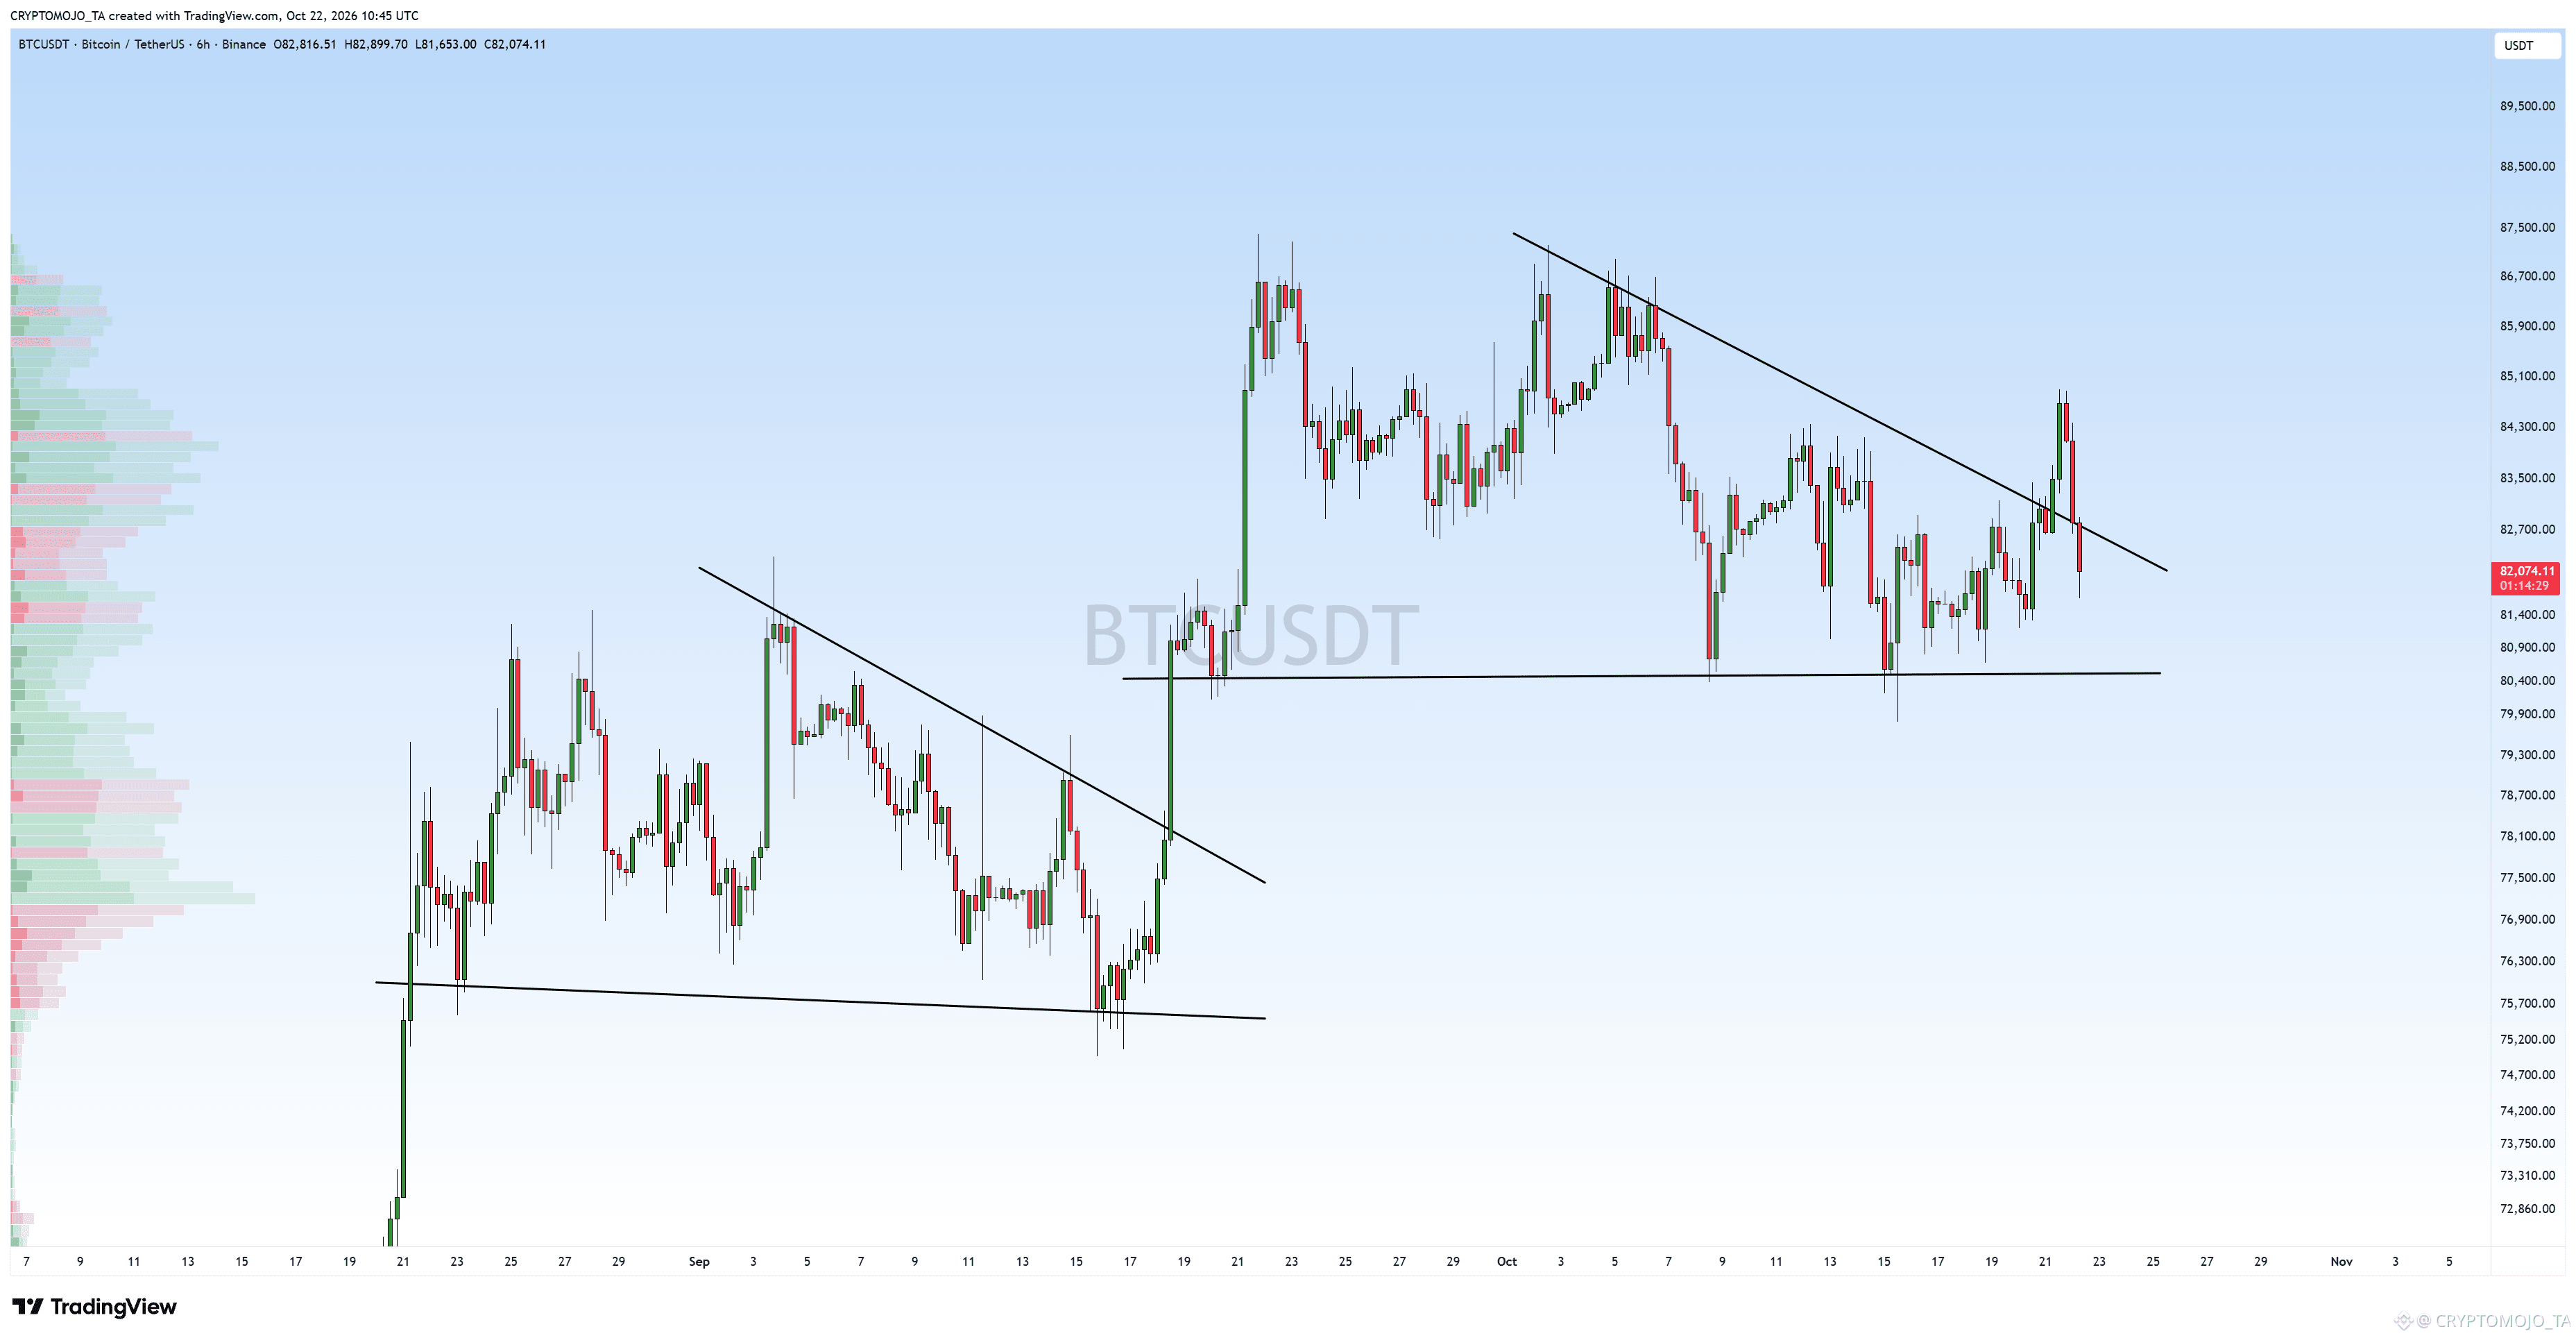
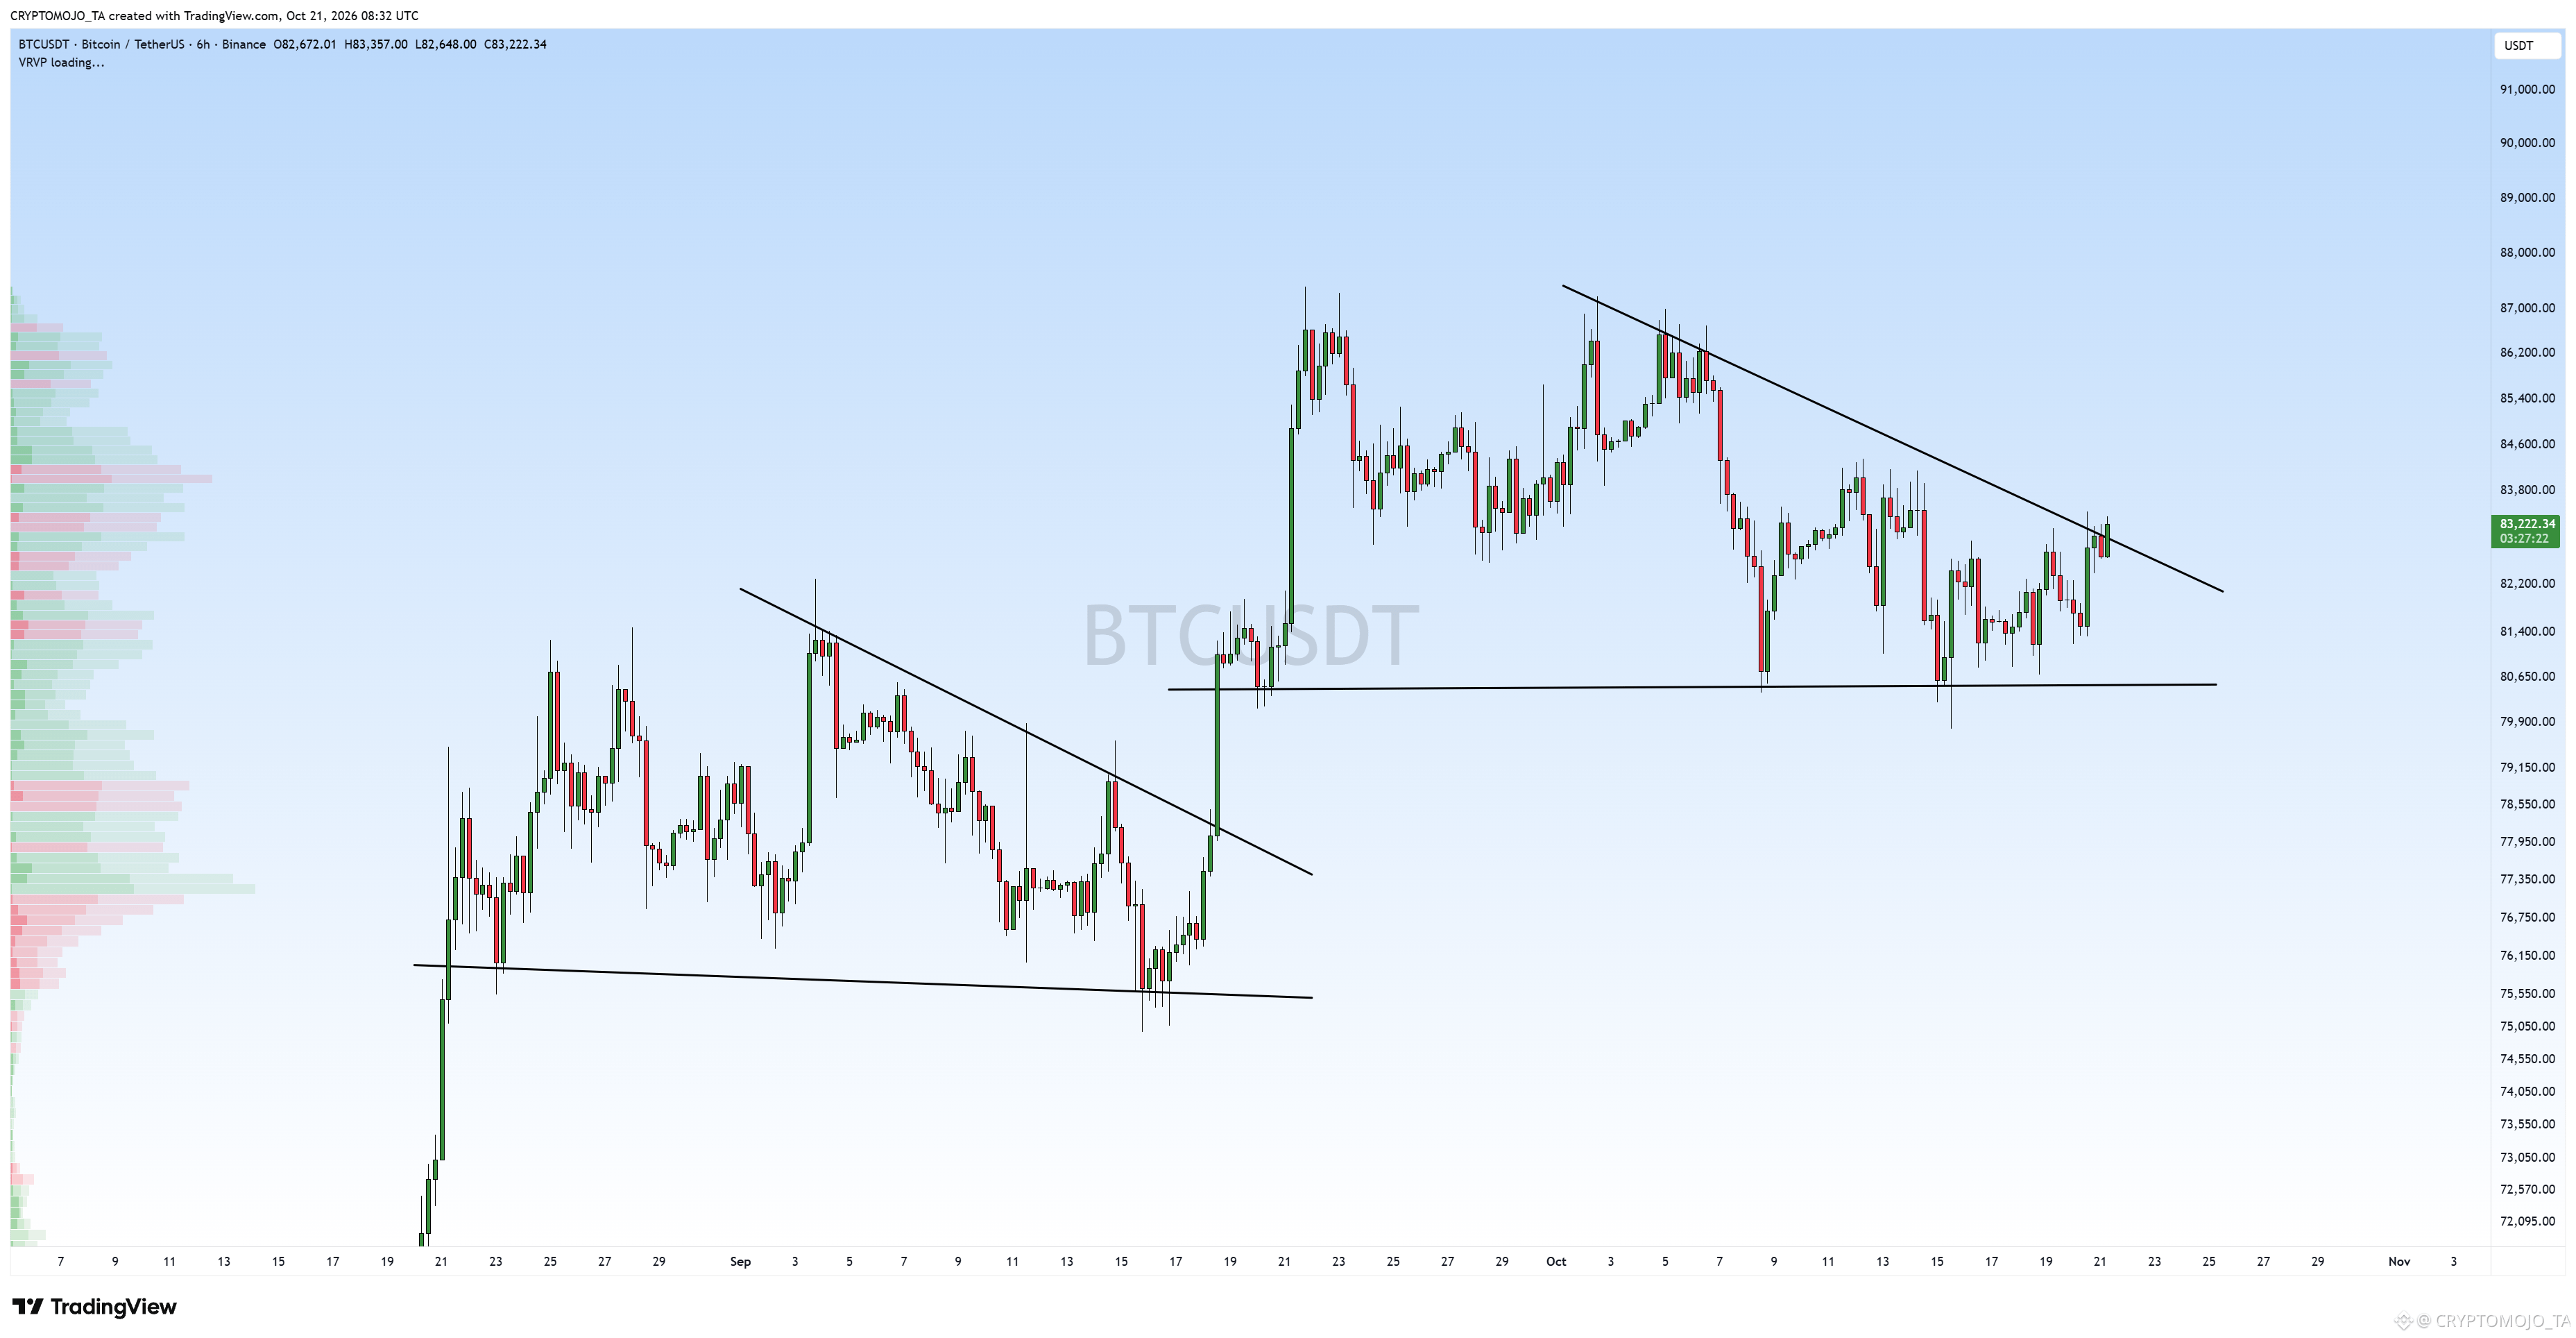
Nothing surprising, guys. BTC is back inside the triangle.
This is how crypto works.
Nothing surprising, guys. BTC is back inside the triangle.
This is how crypto works.
This is how crypto works.
CRYPTOMOJO_TA
·
--
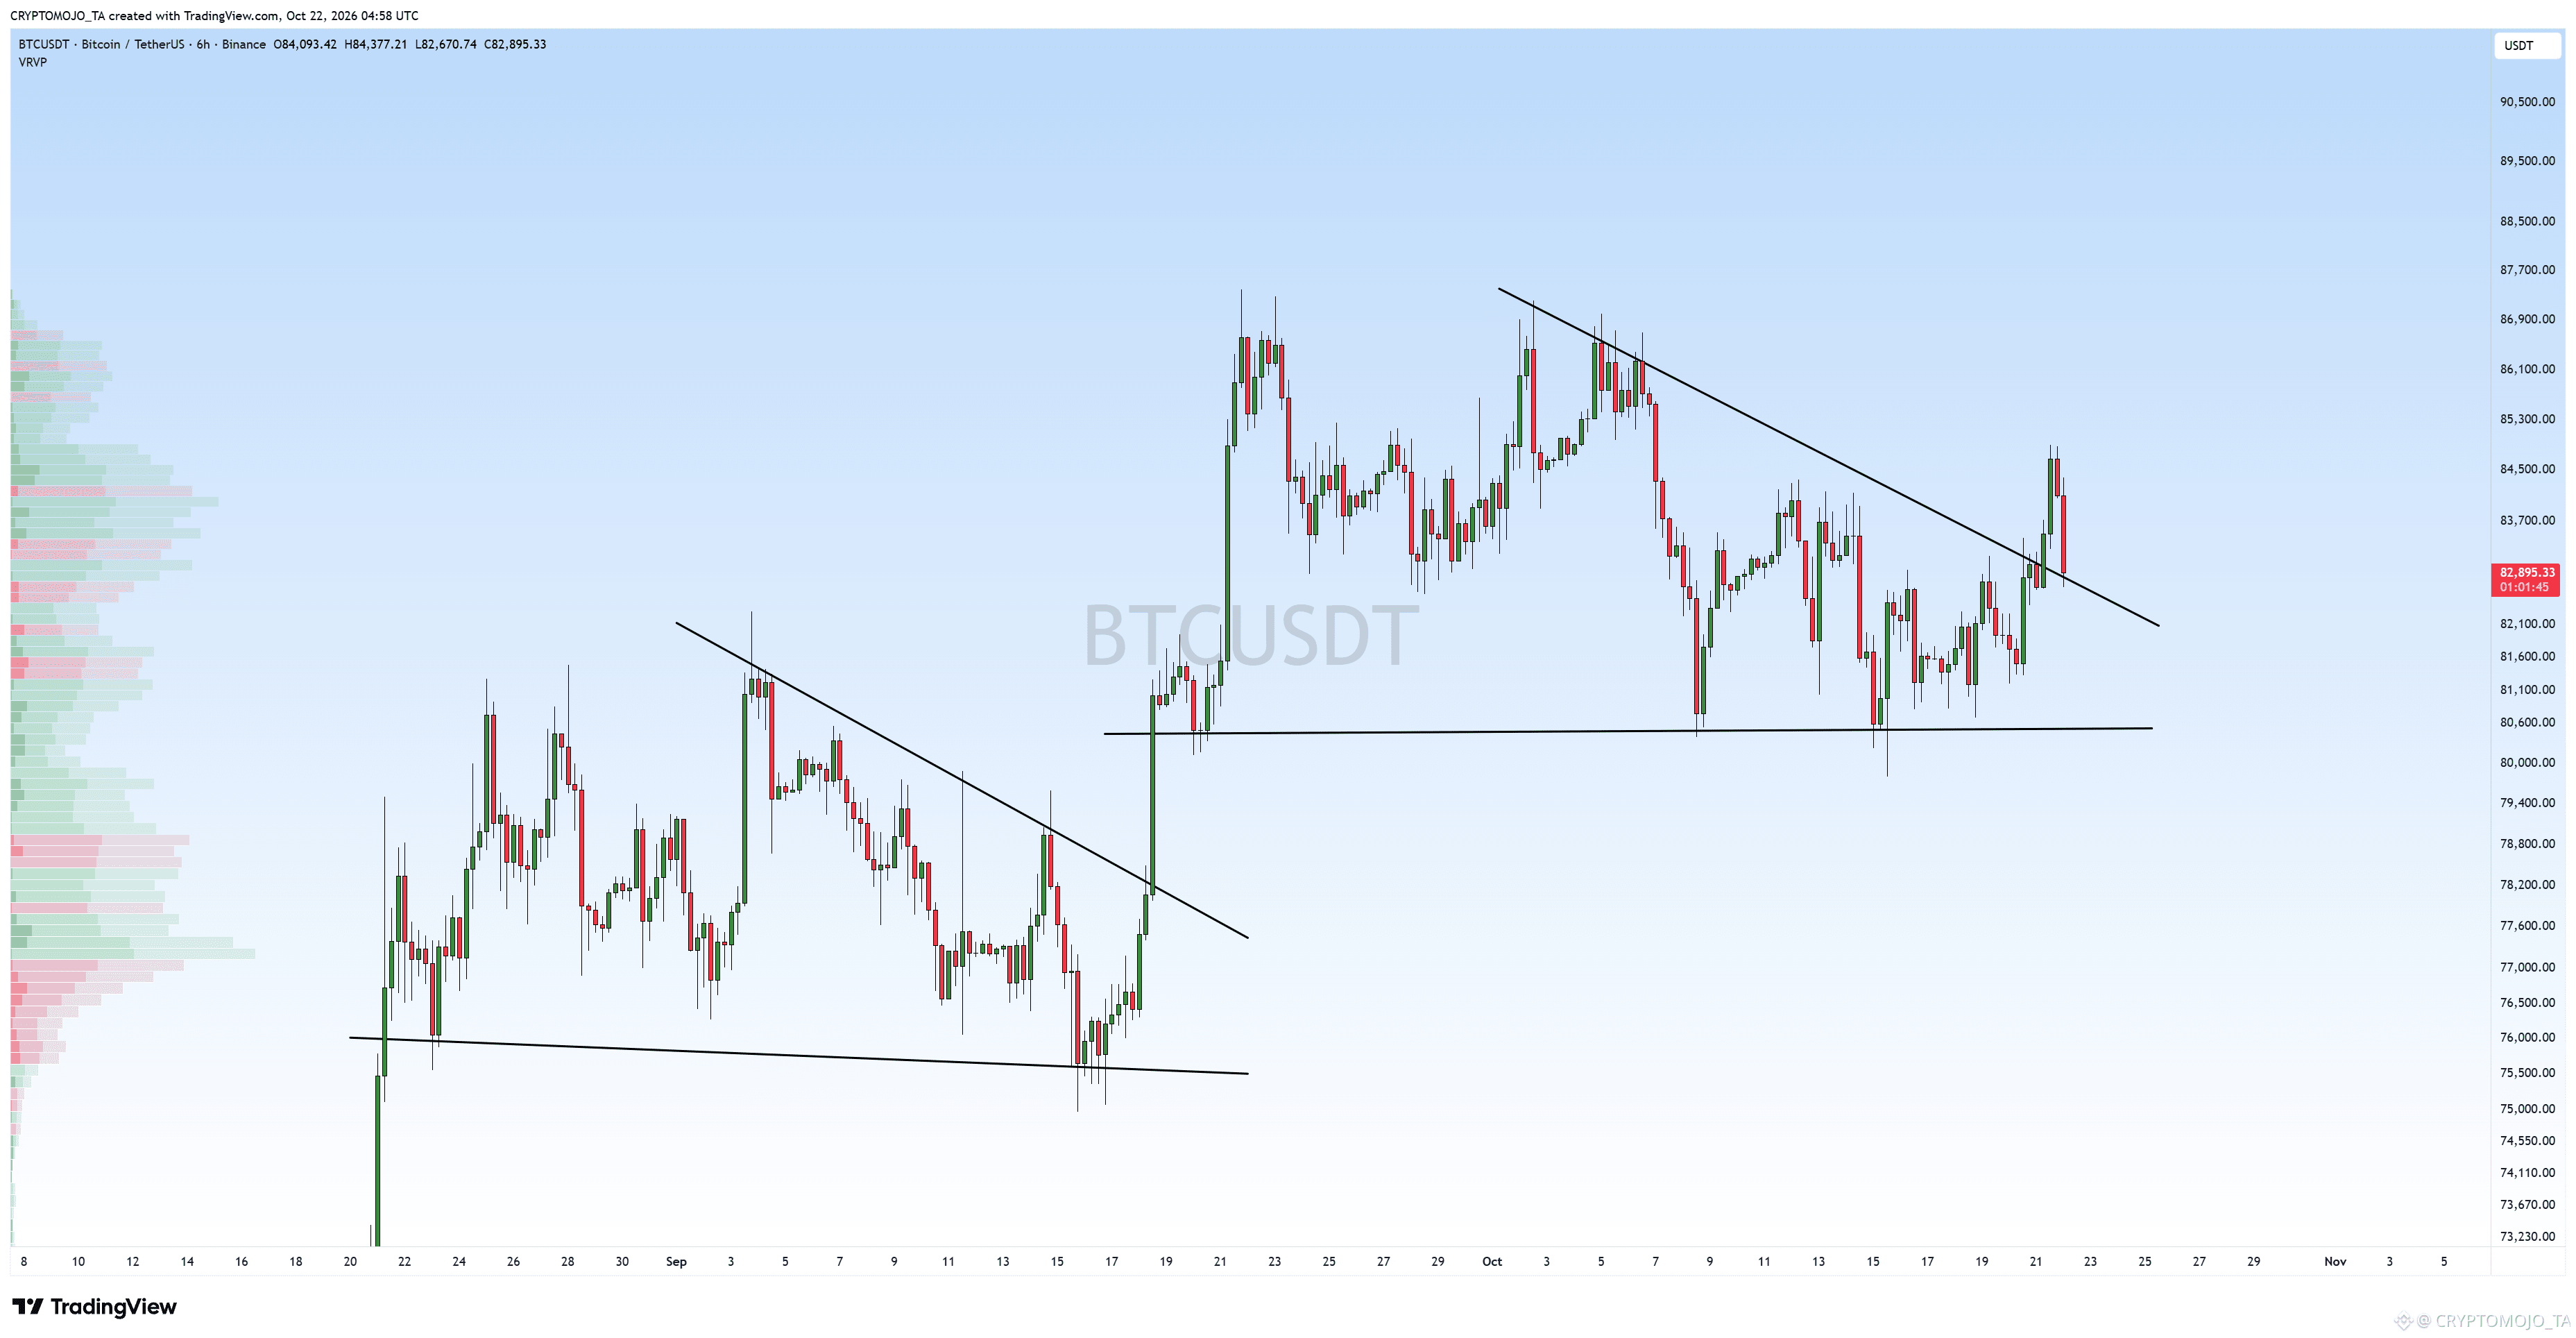
It looks like a retest. Let's see if it holds this level, or we are going back in.
144
·
--
Падение
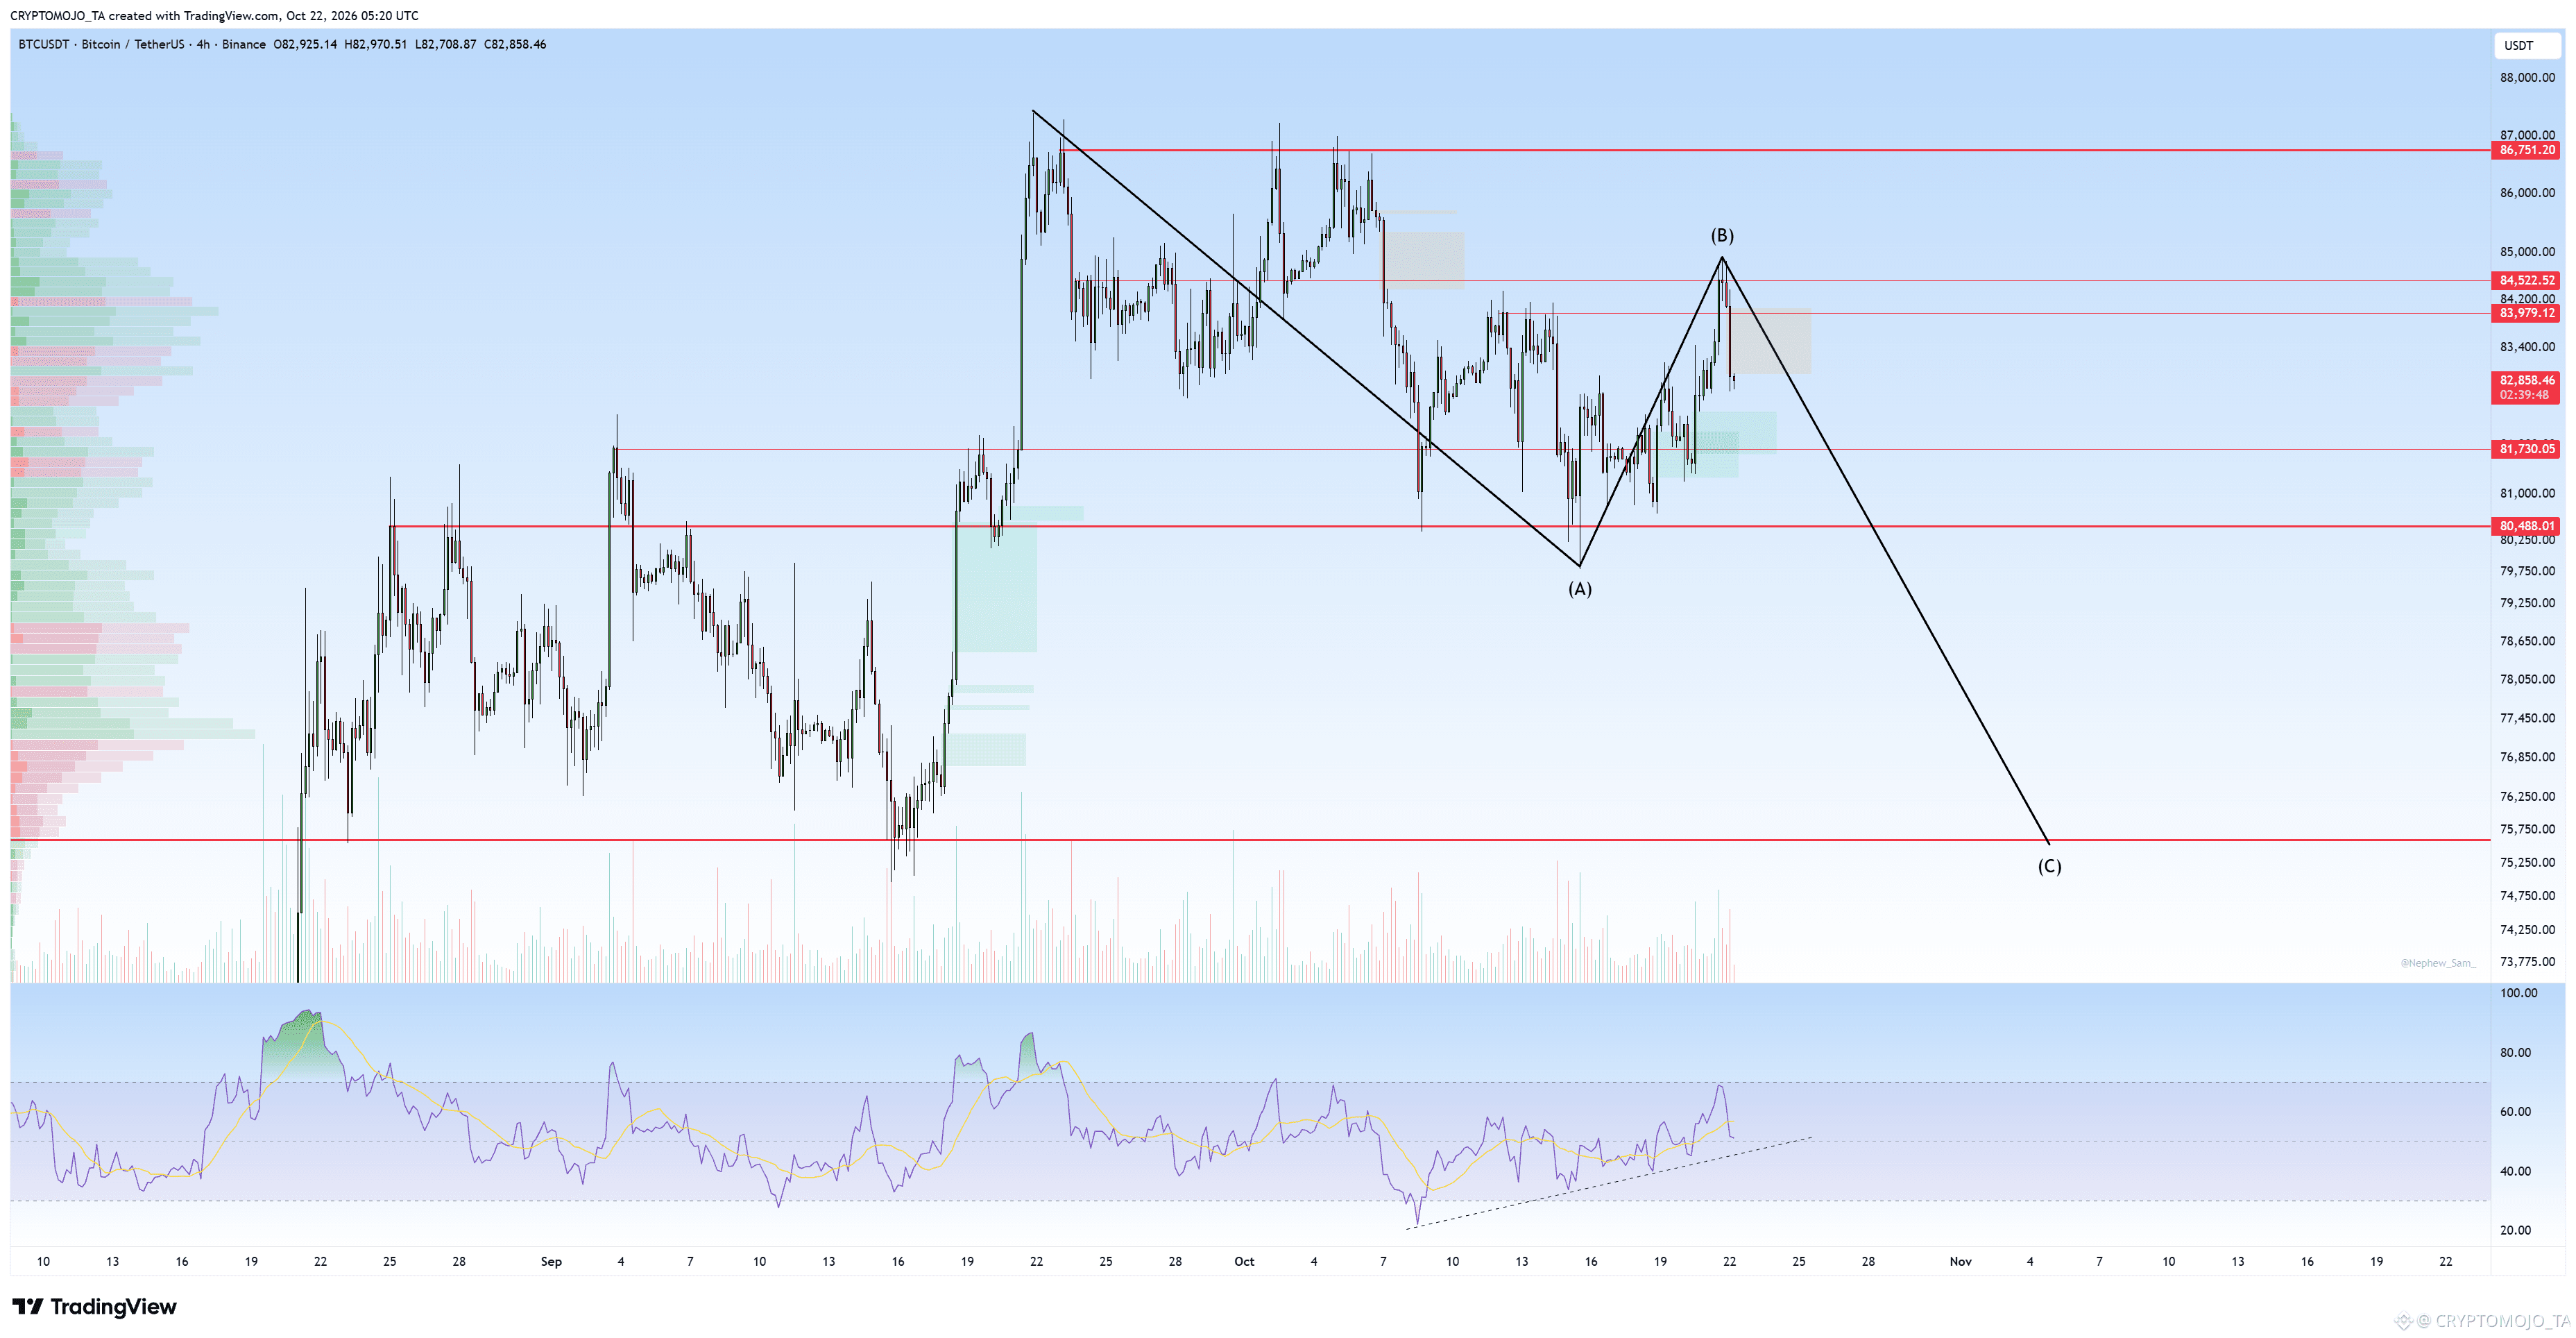
BTC Is this the start of the next leg down? 👀
BTC is currently forming what looks like an ABC corrective structure. After completing the A leg, the bounce toward the 84.5K–85K area could be the B wave.
If this rejection continues, the C wave could take BTC toward the 75.5K–76K support zone shown on the chart.
The key invalidation is a strong reclaim above 84.5K, while 86.7K remains the major resistance.
Do you think the C wave is coming?
2
782
It looks like a retest. Let's see if it holds this level, or we are going back in.
It looks like a retest. Let's see if it holds this level, or we are going back in.
1
1
196
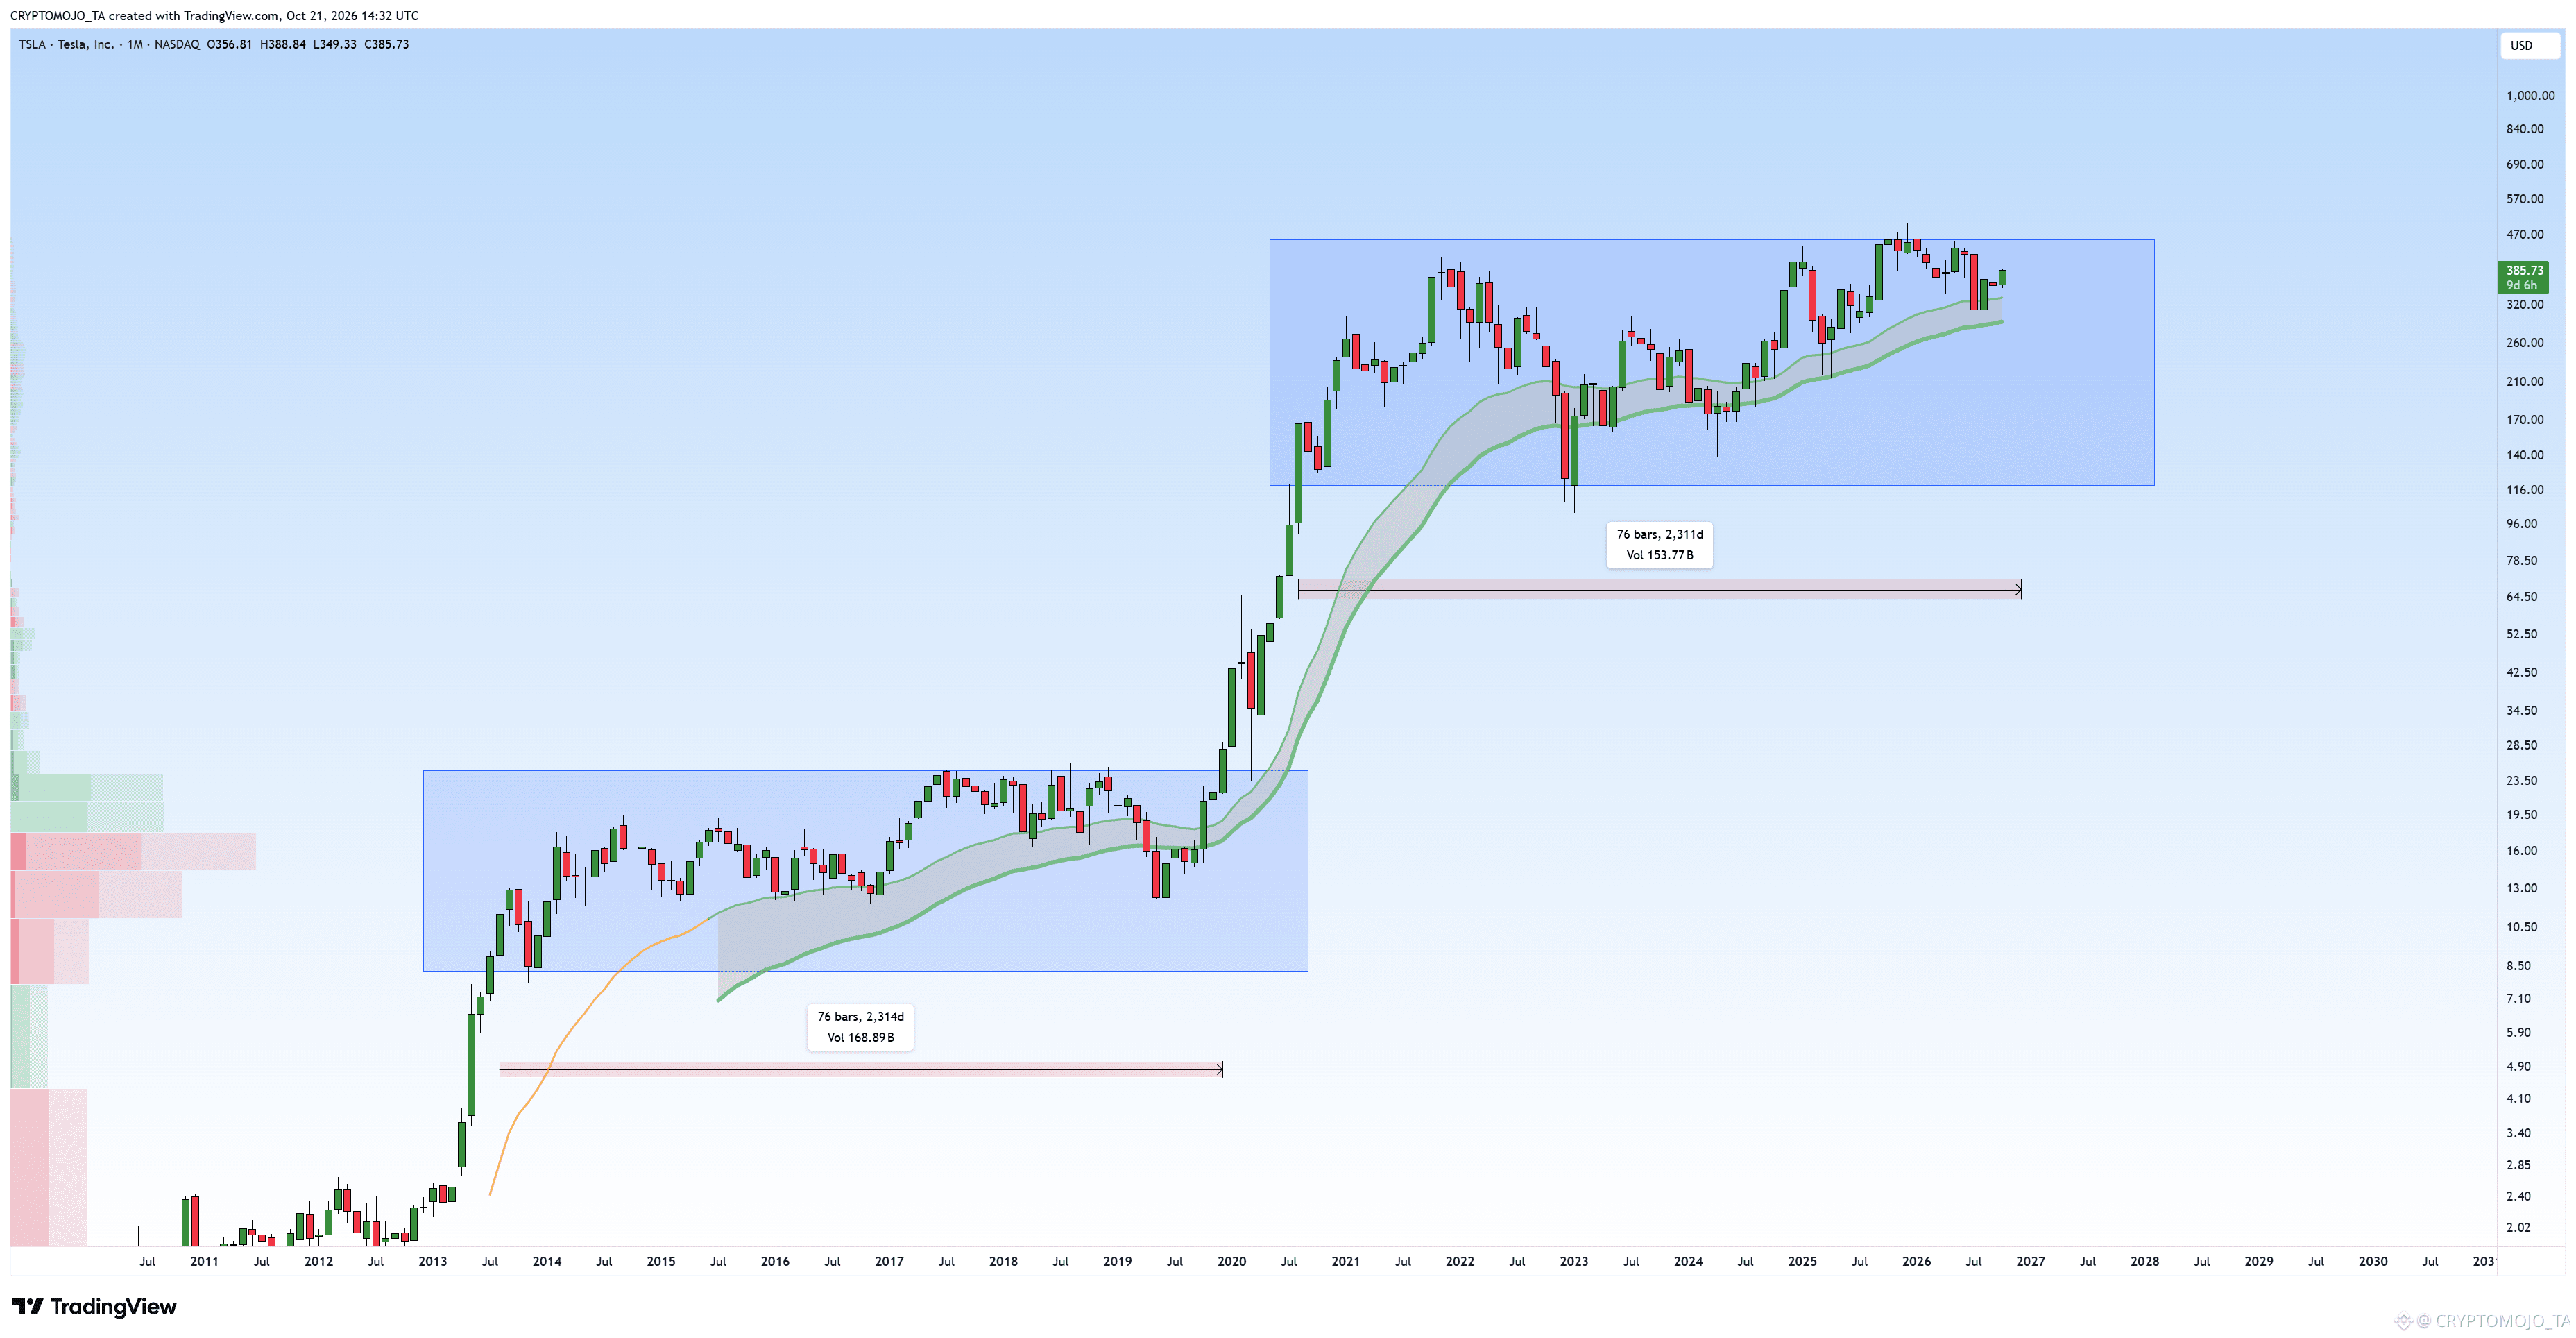
📊 TESLA ($TSLA): A MASSIVE LONG-TERM CONSOLIDATION RANGE
Tesla has been trading inside a broad monthly range after its explosive rally, with price currently around $385.
🔹 Resistance: $450–$470 — the upper boundary of the current range.
🔹 Support: $115–$120 — the lower boundary of the range.
🔹 Trend: The long-term moving averages are still rising, supporting the broader bullish structure.
Tesla has spent years consolidating within this wide range, and the next major move could depend on which boundary breaks decisively.
📈 A breakout above $470 could signal another bullish expansion.
📉 A breakdown below $115–$120 could weaken the long-term structure significantly.
For now, TSLA remains within its long-term range. The key is to watch for a confirmed breakout rather than anticipate one.
What’s your view will Tesla break above the range or continue consolidating?
#earningsseason
2
357
·
--
Рост
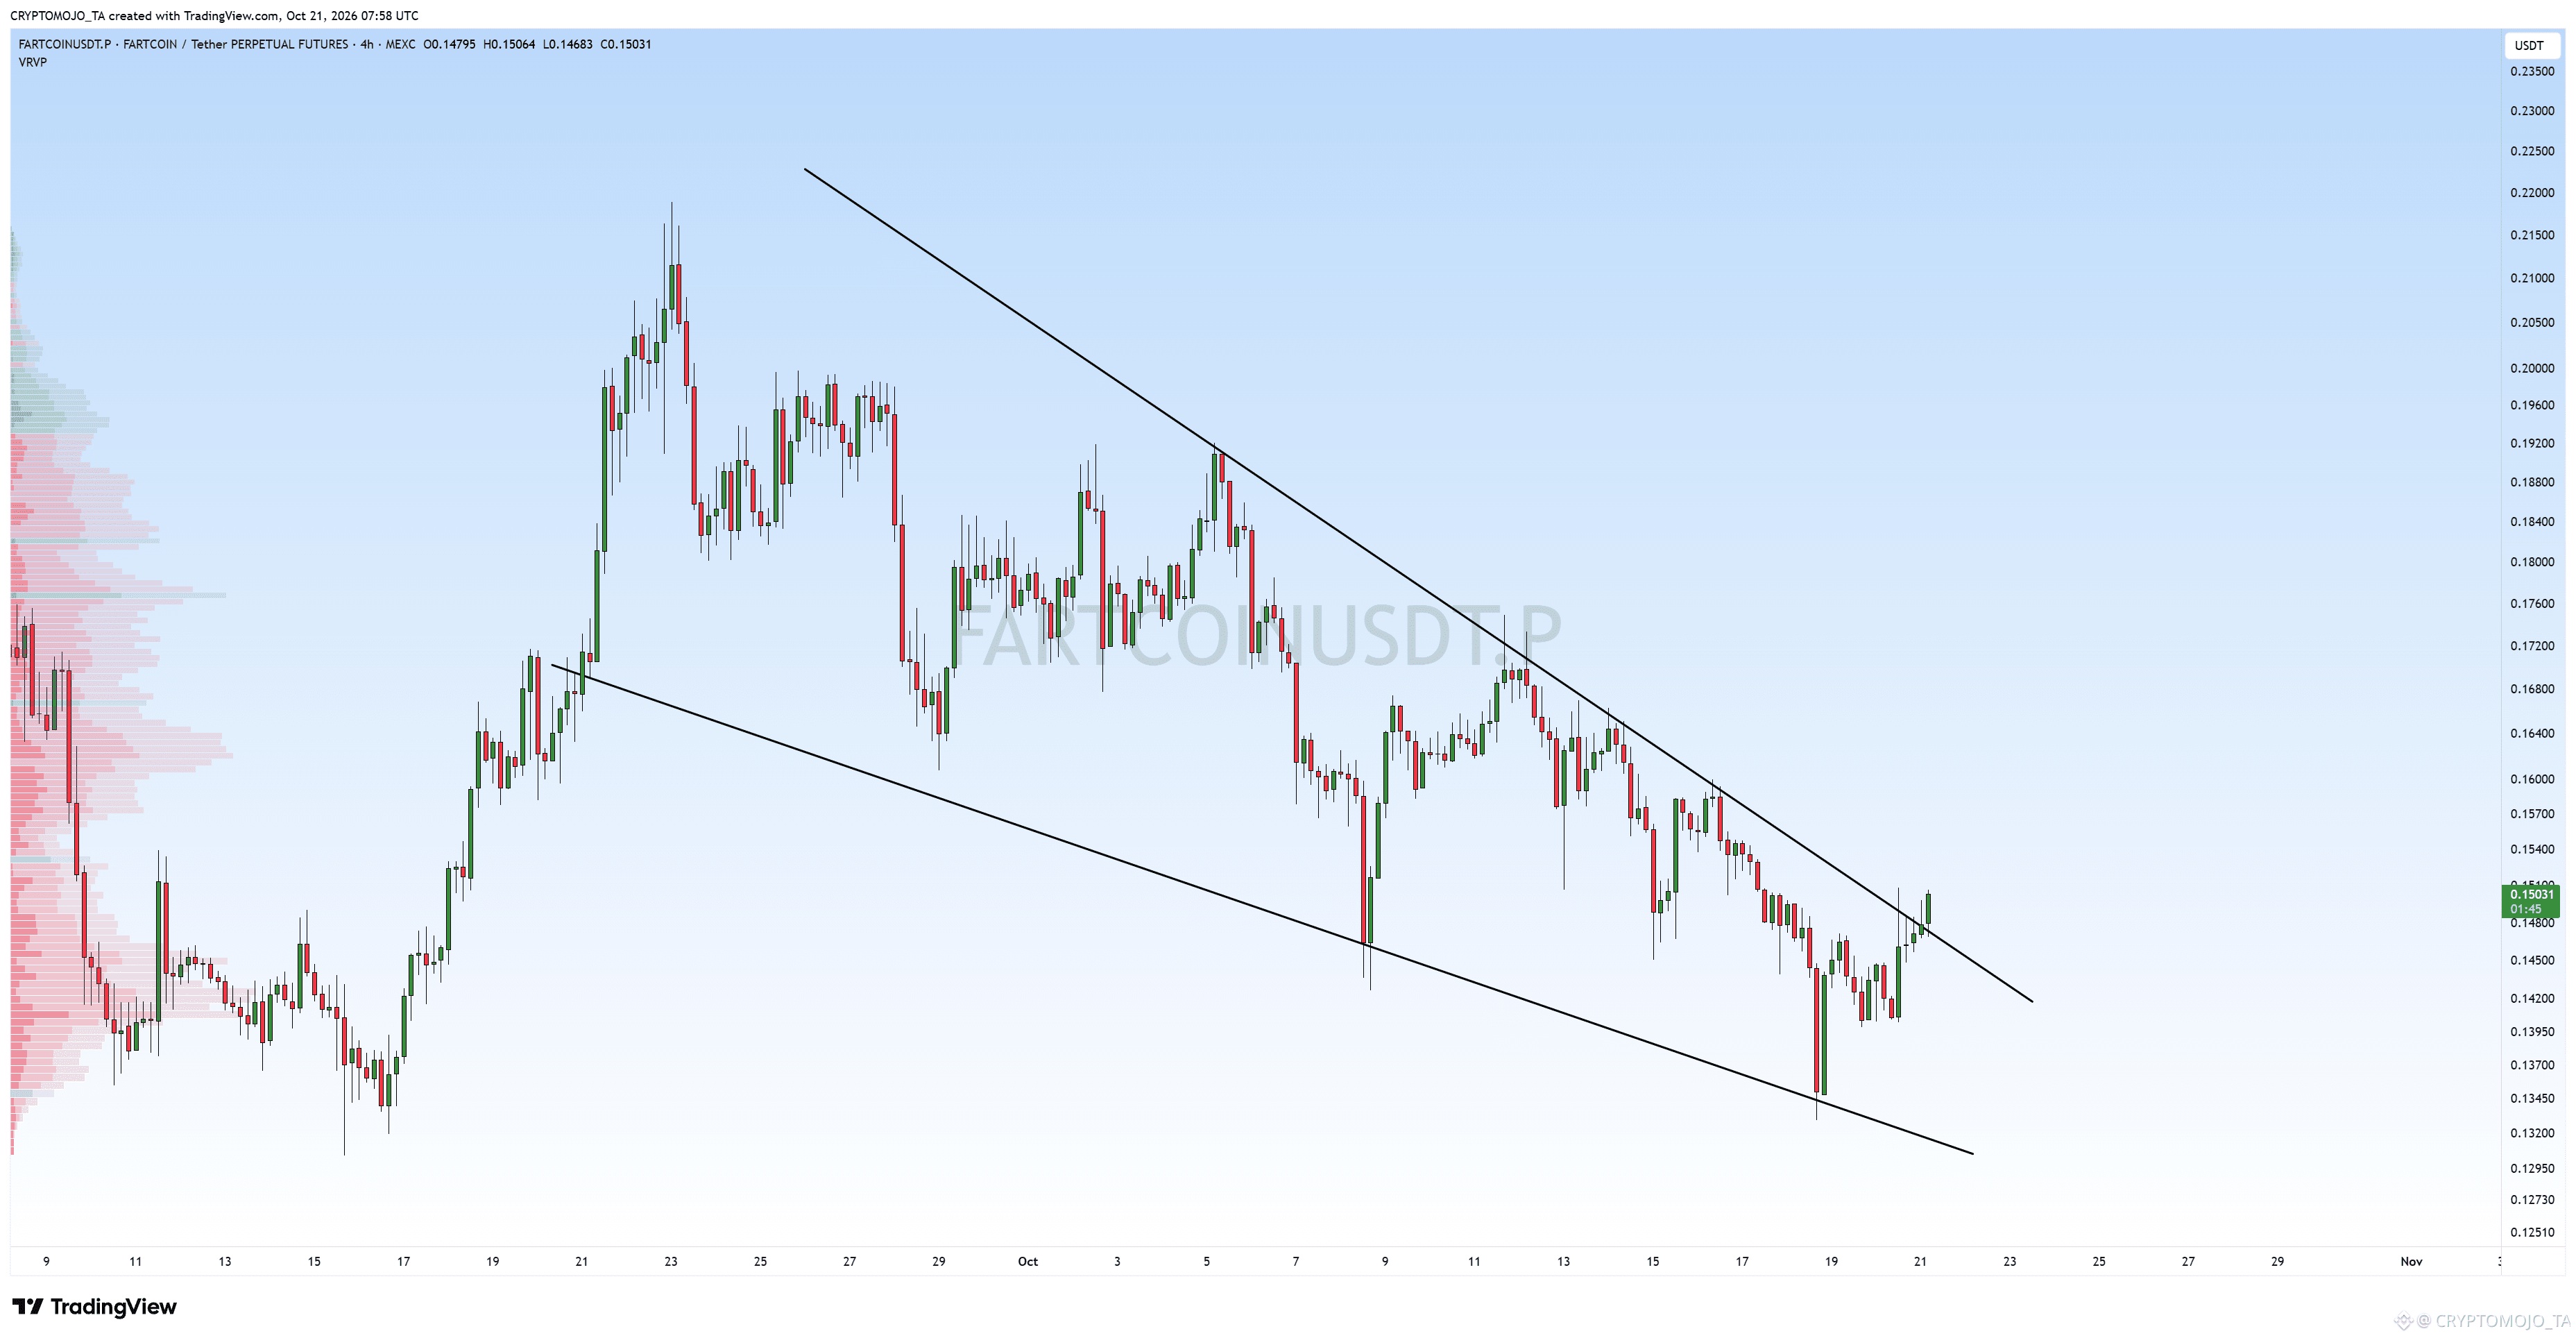
FARTCOIN has been trading inside a clear descending channel since the late-September high, but the latest move is getting interesting.
Price has now pushed above the upper trendline of the channel, currently around $0.150. This could be an early sign of a trend change, but I’d like to see confirmation rather than calling it a breakout immediately.
If FARTCOIN holds above the broken trendline, the first levels I’m watching are $0.157–$0.160, followed by $0.168–$0.170.
If price falls back below the trendline and gets rejected, the breakout could turn into a fakeout and the lower part of the channel comes back into focus.
For now, the key level is the broken trendline around $0.148–$0.150. Holding above it could be interesting.
1
510
·
--
Падение
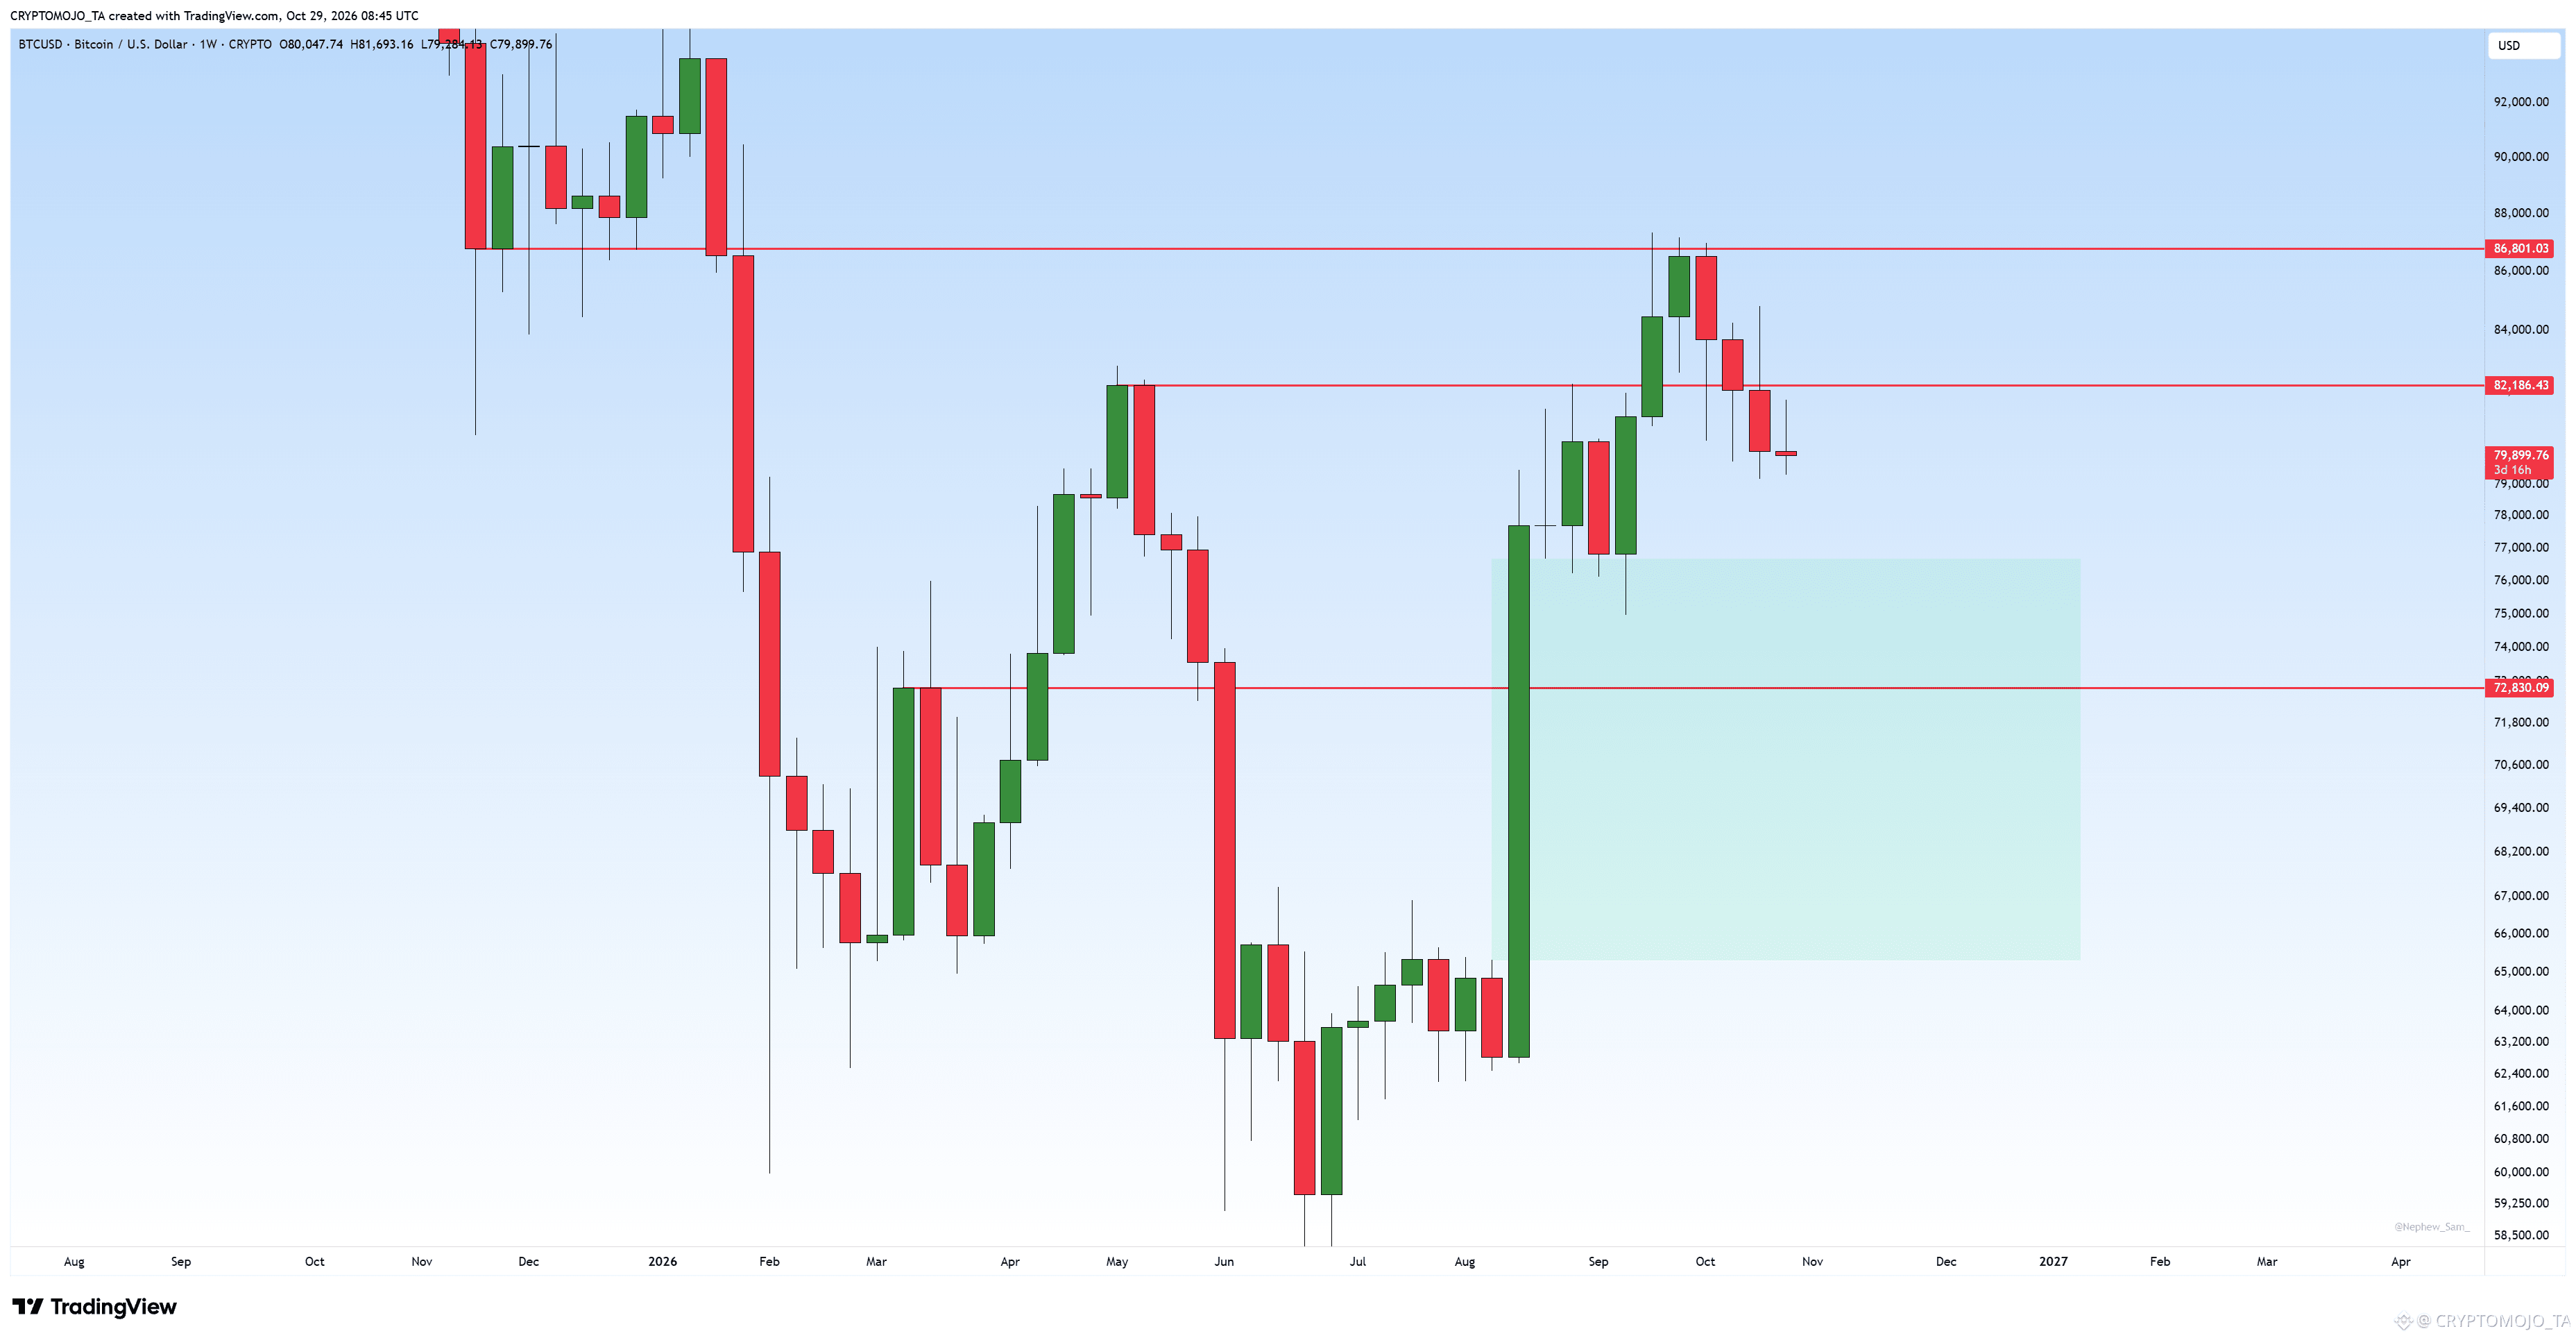
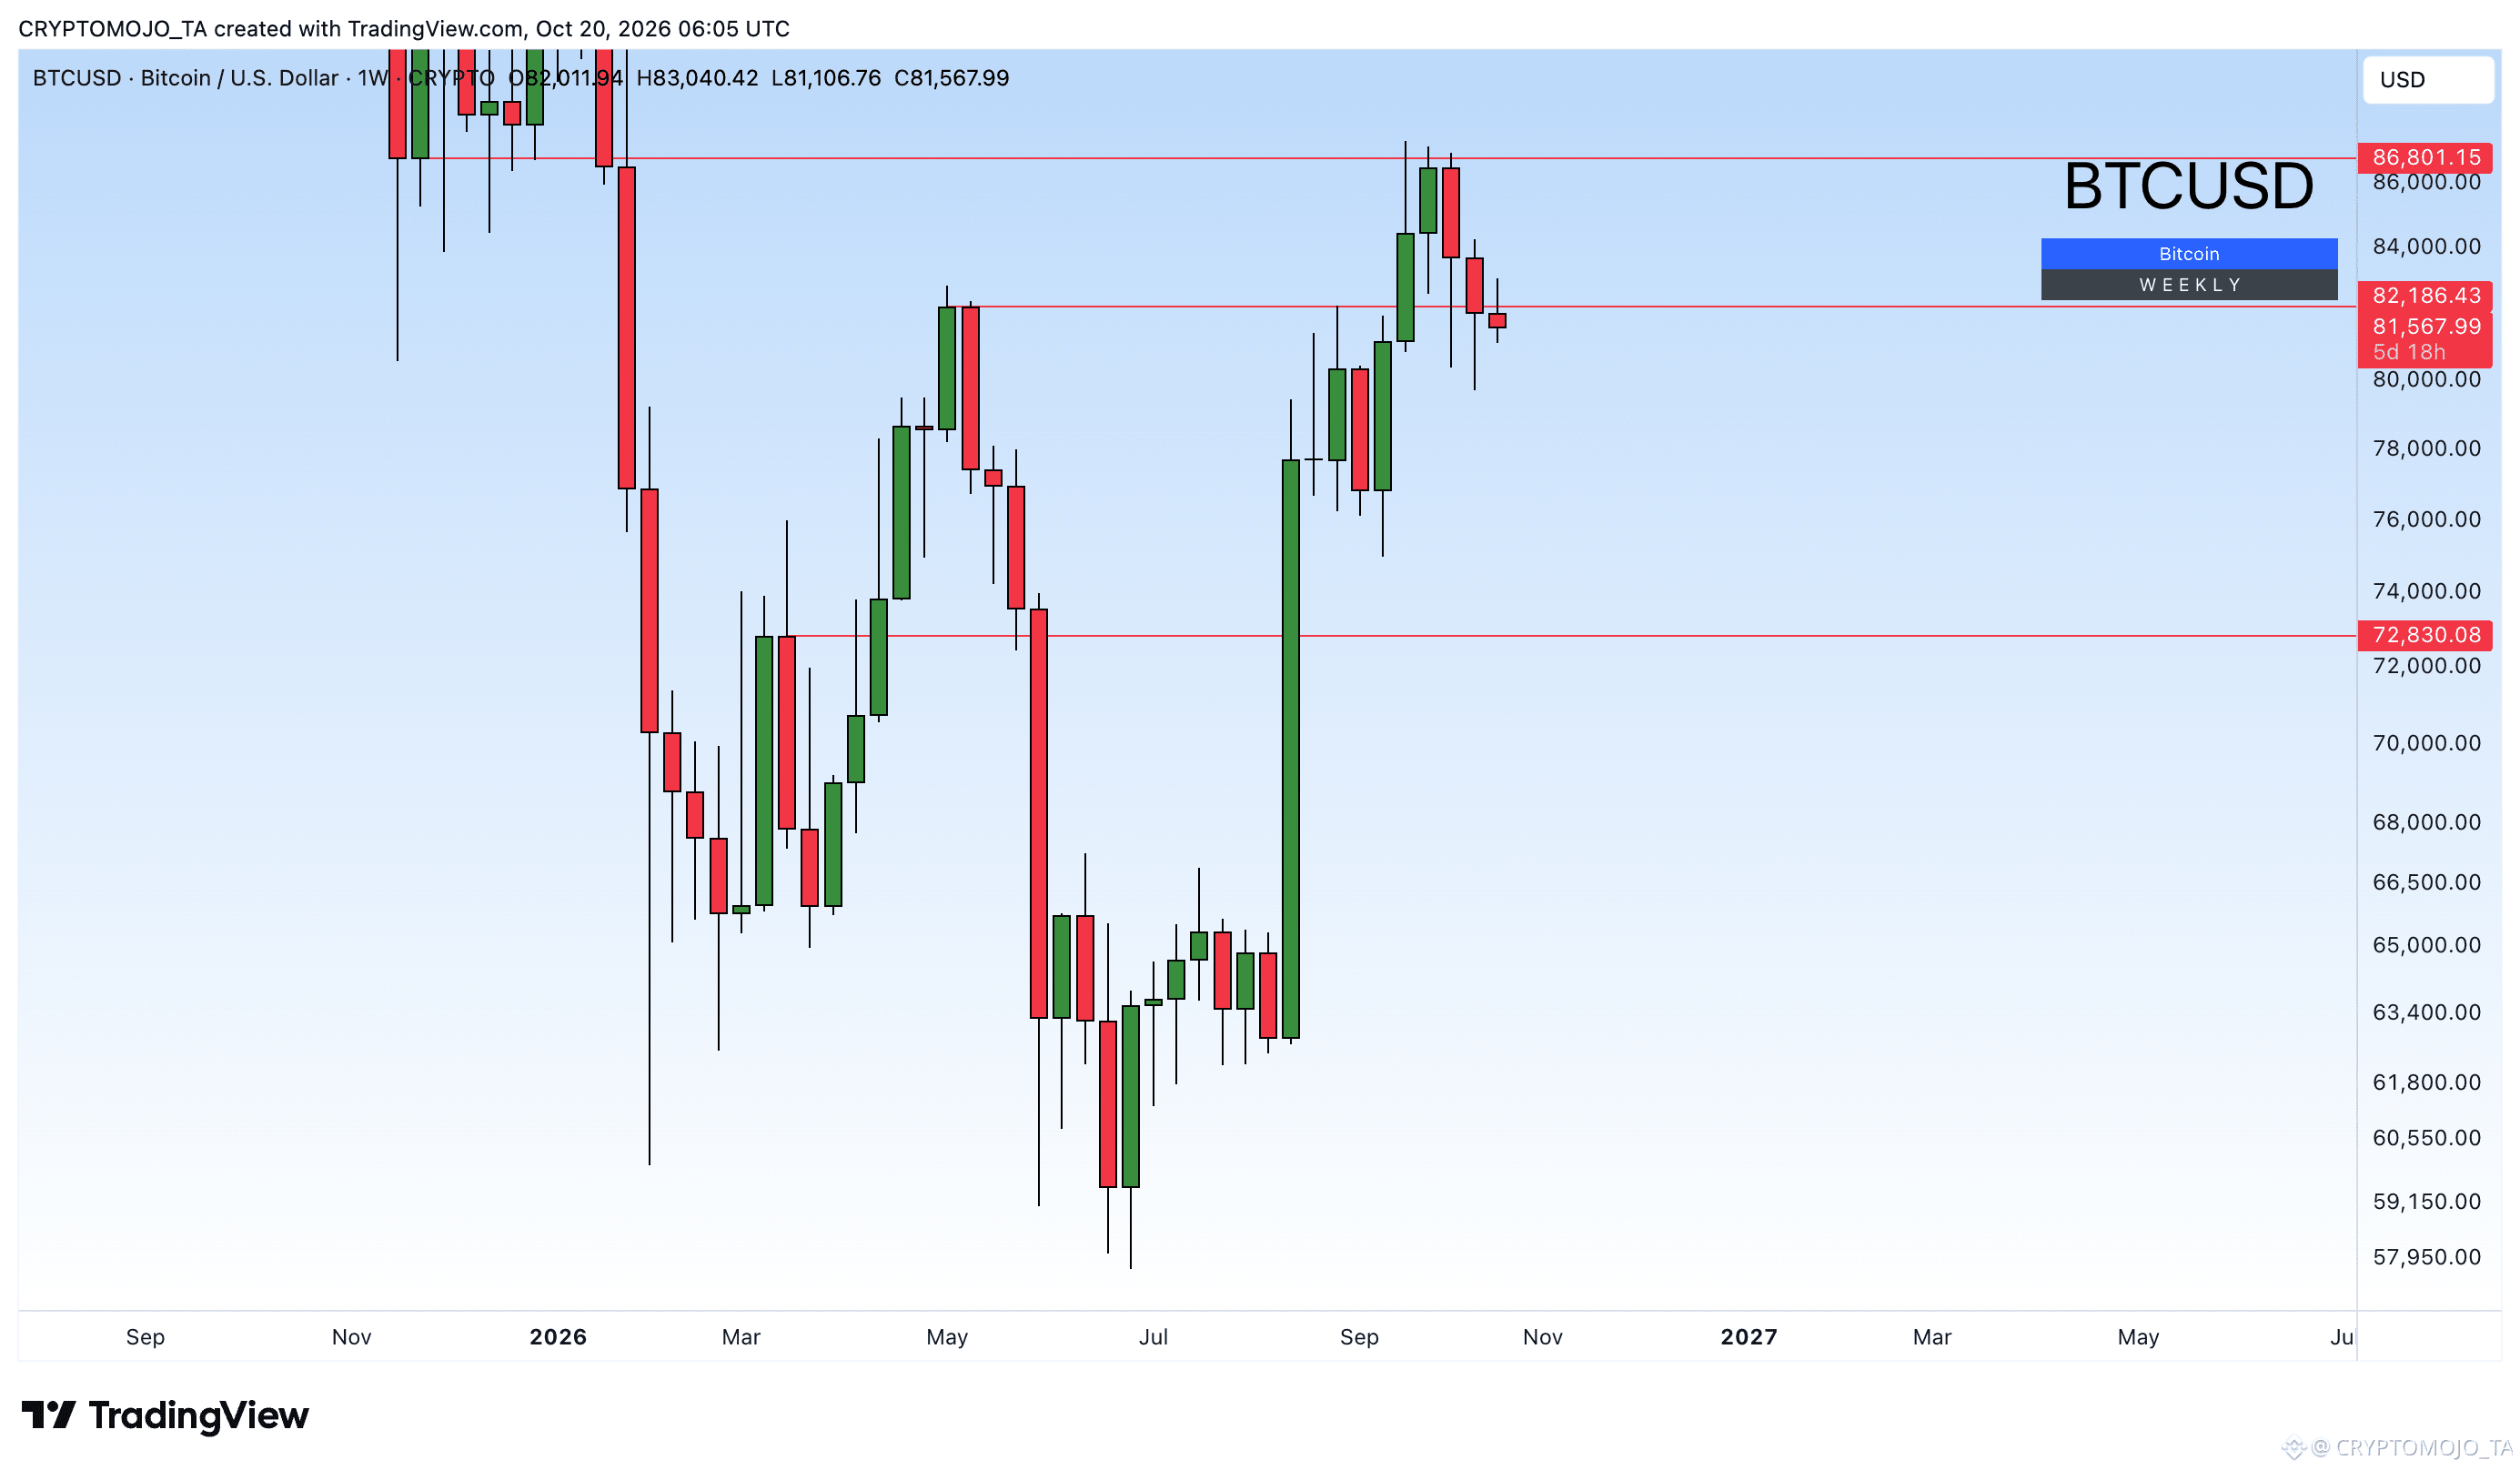
#Bitcoin has lost the crucial $82K weekly support.
With the weekly close below this level, BTC could face further downside toward $72.8K. The key now is whether BTC can reclaim $82K or if this former support turns into resistance.
Will BTC recover, or is another leg down coming?
#Bitcoin has lost the crucial $82K weekly support.
With the weekly close below this level, BTC could face further downside toward $72.8K. The key now is whether BTC can reclaim $82K or if this former support turns into resistance.
Will BTC recover, or is another leg down coming?
With the weekly close below this level, BTC could face further downside toward $72.8K. The key now is whether BTC can reclaim $82K or if this former support turns into resistance.
Will BTC recover, or is another leg down coming?
2
248
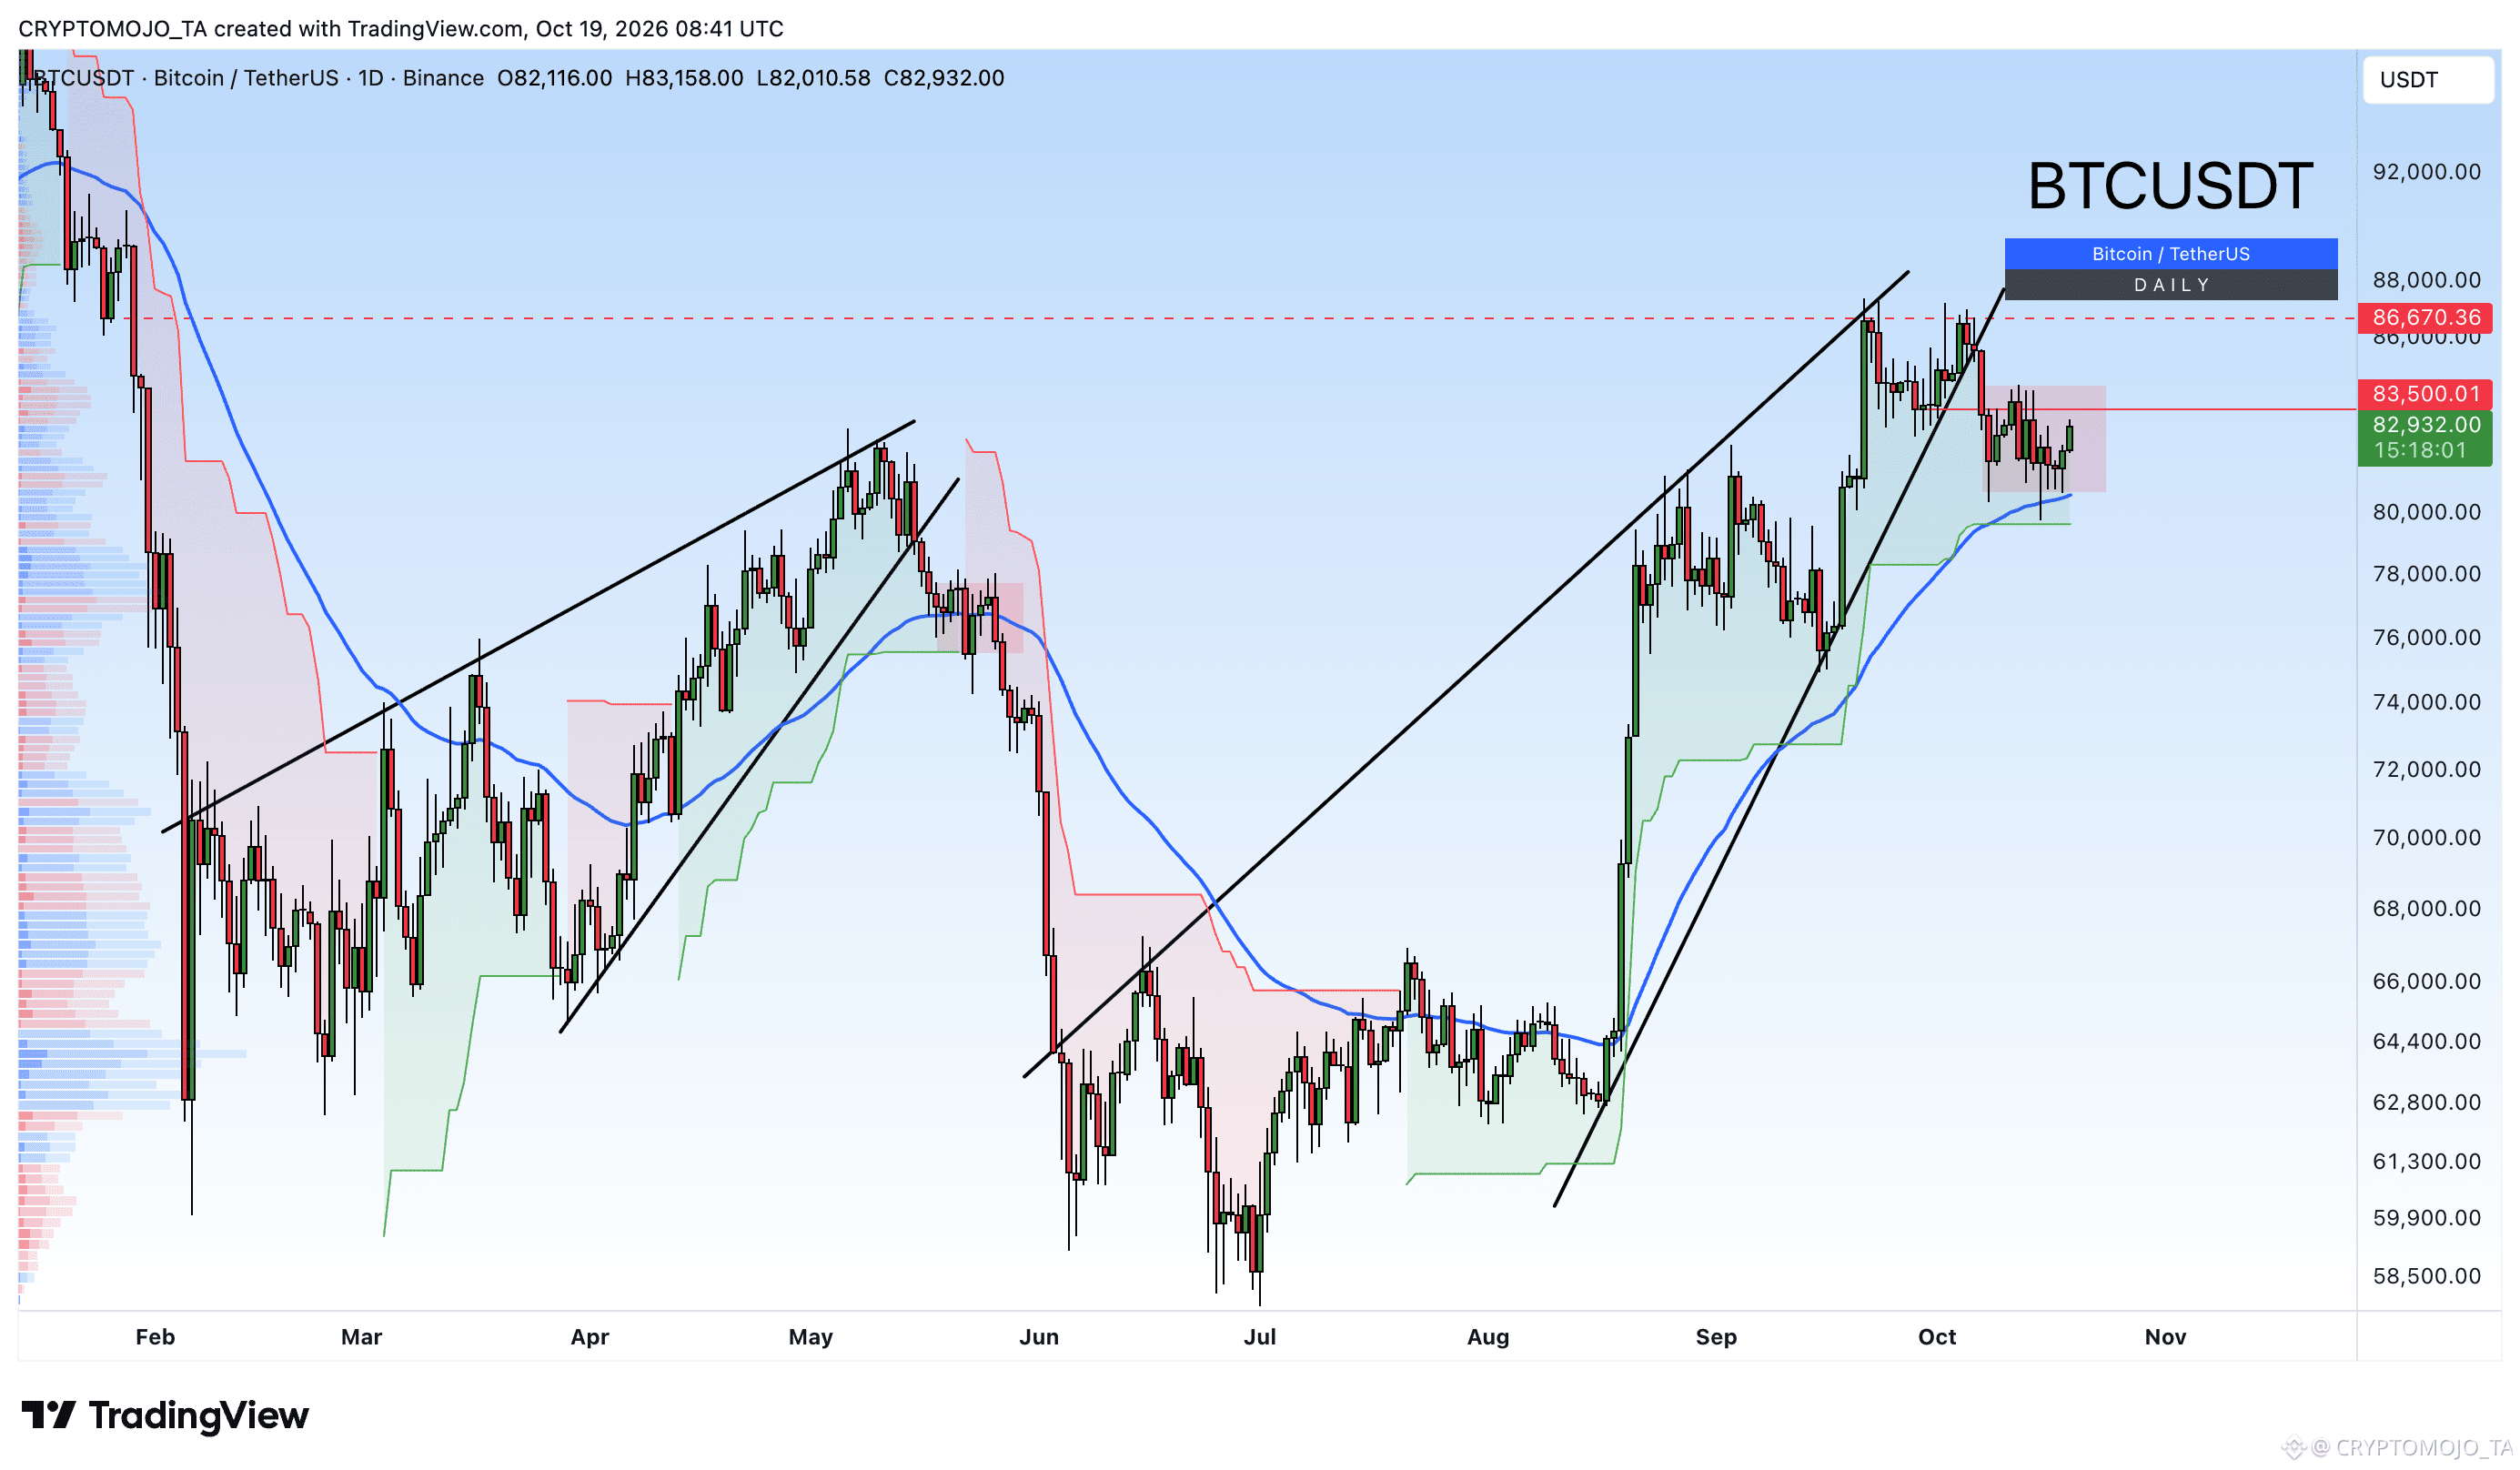
Are you really going to trust this Monday pump?
Are you really going to trust this Monday pump?
1
175
Войдите, чтобы посмотреть больше материала
Присоединяйтесь к пользователям криптовалют по всему миру на Binance Square
⚡️ Получайте новейшую и полезную информацию о криптоактивах.
💬 Нам доверяет крупнейшая в мире криптобиржа.
👍 Получите достоверные аналитические данные от верифицированных создателей контента.
Эл. почта/номер телефона
В тренде
BinanceSAFUFundTransferCompleted7499BTC
Просмотров: 29,387
689 обсуждают
Binance Says SAFU Fund Transfer Completed, Covering 7,499 BTC
Binance News
·Лайков: 38
·Просмотров: 20.2k
BinanceRecovery90% of stolen assets
Просмотров: 118,040
155 обсуждают
YiHe:ProofOfReserves:10TokensAt100%Backing
Просмотров: 122,362
688 обсуждают