

CryptoGates_io
445 Публикации

CryptoGates_io
Отправить жалобу
Заблокировать пользователя
No 1 FREE Crypto Strategy Builder 🧠
Crypto made simple, safer and profitable for everyone 📈
Build | Backtest | Optimize | Automate 🤖
Случайный трейдер
3.8 г
405 подписок(и/а)
66 подписчиков(а)
25 понравилось
Посты
Все
Видео
Binance Hack: What the Numbers Suggest 📊
Early headlines are loud, so here is the structure behind them.
One estimate puts total impact at about $6.3B, with roughly $3B already frozen. Frozen funds are expected to be re-minted and returned, while the originals stay frozen permanently.
🔹 $6.3B is about 3.91% of total Binance holdings
🔹 After the frozen portion is reissued, the remaining gap is about $3.3B, or roughly 2.05%
This is a contained loss on that math, unlike a liquidity collapse. It is an estimate, and a final figure has not been confirmed.
Why this matters for BTC: replacing $3.3B of missing assets could mean buying crypto, including BTC. If the attacker holds BTC rather than selling, available supply tightens. Execution and timing remain unknown.
What to watch:
Final confirmed loss figure
Withdrawal normalization
Attacker wallet movement
Funding rates and open interest
Volatility will stay elevated around headlines. Keep leverage low and position sizes small.
Verify first. Risk later. Scale slowly.
#Binance #Bitcoin
59
Binance Hack: What’s Confirmed vs What’s Still Estimated 🔍
Reported outflows include about $1.45B in $BTC and $875M in ETH. On-chain trackers put the wider total above $5.6B, but estimates still range from $1.7B to $5.7B, and no total has been confirmed.
What is confirmed so far: $2.54B frozen, deposits and withdrawals paused during security checks, and a commitment to cover user losses.
Why the split matters: stablecoin issuers can freeze funds. BTC and ETH cannot be frozen the same way, so recovery depends on very different tools.
Market impact 📉
$1.52B liquidated in 24h
84.5% longs vs 15.5% shorts
BTC $480.59M, ETH $364.89M liquidated
BTC near $78.3K, BNB near $717.57
A bounce after a forced flush is not a confirmed reversal. Price still needs to reclaim the 80K area before the structure changes.
Takeaway: exchange custody is counterparty risk. Check proof of reserves, spread your custody, and size positions for the event you can’t predict.
Verify first. Risk later. Scale slowly.
#BTC #BNB #CryptoSecurity

86
Before you copy a strategy, check if you can survive it. 🛡️
A whale running Grid with six figures has very different liquidation risk than a shrimp running the same grid with a few hundred dollars. Same bot, totally different exposure.
Look at Risk of Ruin and 95% Probable Drawdown, not just returns. If those numbers feel emotionally survivable, it’s likely a fit.
Run your numbers before risking capital...
#CryptoTrading #DCA #RiskManagement

74
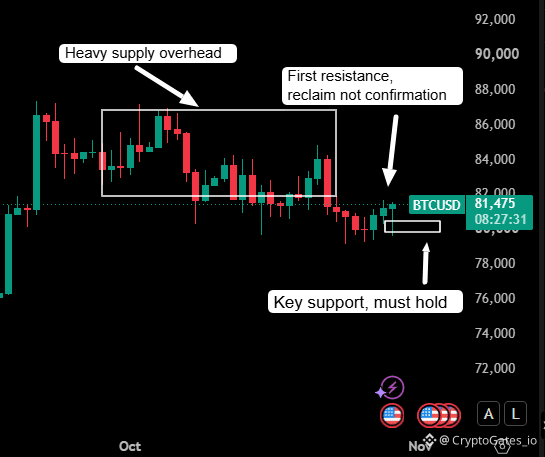
$BTC Daily: $81,475, Support and Resistance Mapped
BTC has bounced back above $81K, but the daily structure is still mixed.
🔹 $80K is the key support. A hold keeps the recovery intact.
🔹 The $82K area is the first resistance, with a heavy supply block stacked above it.
Reclaiming a level is not the same as confirming it. A daily close that holds above $82K would be the first real sign buyers are absorbing that supply. A break below $80K would turn this bounce into a relief move.
Plan scenarios first, then size positions around them.
Verify first. Risk later. Scale slowly.
#BTC #BTCUpdate #BinanceSquare
106
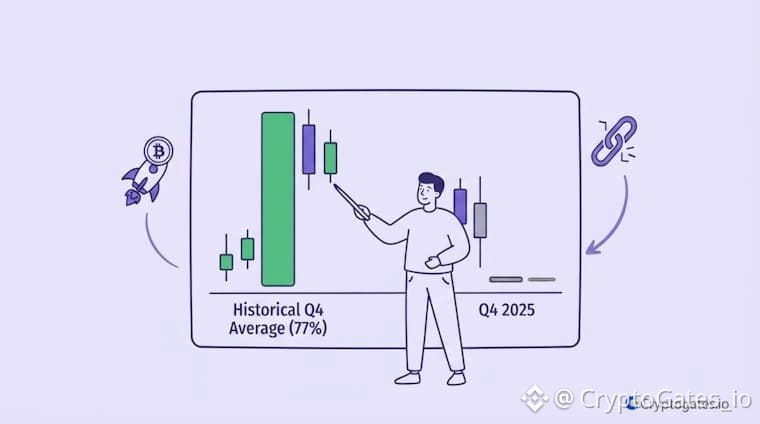
“Q4 is Bitcoin’s best season.” Ever heard that? 📊
Fact: Q4 has averaged around 77% (CoinGlass).
Also fact: Q4 2025 finished without a gain.
Both are true. That’s the point.
An average hides the spread. A few huge years inflate it, and plenty of ordinary years fall short.
Where beginners get hurt:
Hear “best quarter” → go all in → no exit plan → normal dip → panic sell.
Before you enter, decide:
Entry size (split it, don’t send it all at once)
Exit level
Max loss you can accept
Context check: Q3 is up strongly, but price is still about a third below its Oct 2025 high, with rising yields and U.S. elections ahead. Plan for both outcomes.
Trade your plan, not the calendar.
Stress-test your entry plan first...
#Bitcoin #CryptoTrading #DCA
49
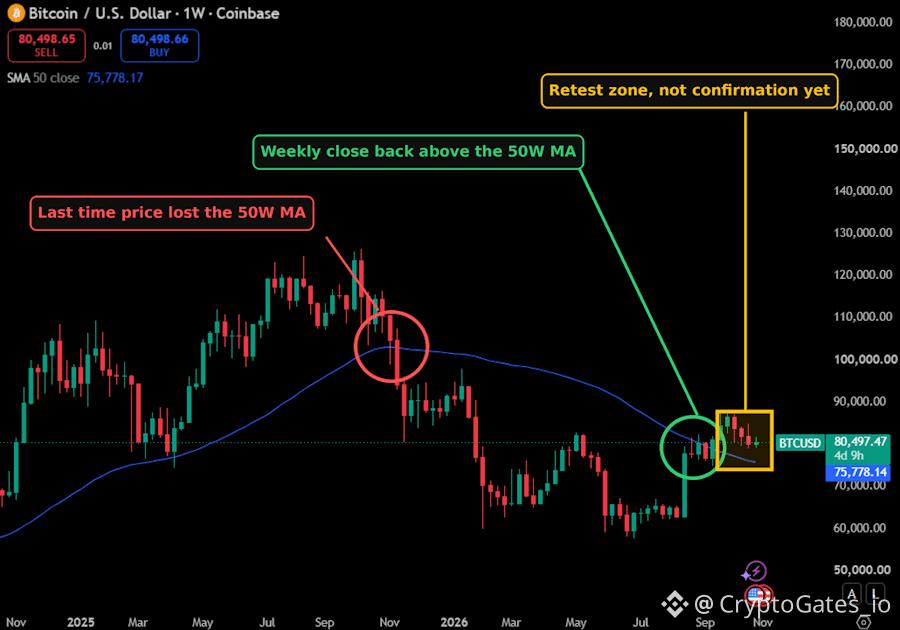
Bitcoin Reclaims the 50-Week MA: What the Data Says Next 📊
$BTC closed a week above its 50W MA for the first time in 45 weeks. Price is near 80.5K, about 6% above the MA at roughly 75.8K.
Historically, 11 of 13 weekly reclaims did not lead to a new cycle low. The 2 exceptions both came during the 2021-22 bear market. 📈
A reclaim is not a confirmed retest. The scenarios to watch:
Hold above the MA: resistance turns into support.
Weekly close back below: the September reclaim becomes a fakeout.
Sideways chop: indecision around the level.
With the FOMC decision today, short-term volatility is likely. The weekly close matters more than intraday wicks.
Verify first. Risk later. Scale slowly. 🛡️
#BTC #Bitcoin
54
$BTC Weekly Check: Reclaimed, Not Yet Confirmed 📊
BTC closed the current weekly candle near 81.4K, about 7% above the 50-week SMA at 75.8K.
📌 Price is holding above the long-term trend line
📌 The MA is still sloping down, so the trend has not turned yet
📌 Analysts remain divided: accumulation phase vs. one more leg toward 40K to 50K
A reclaim is a signal. A sustained hold is confirmation. With a Fed decision due today, short-term volatility can push price through either side of this level, so scenario planning matters more than direction calls.
Verify first. Risk later. Scale slowly.
#BTC #Bitcoin
46
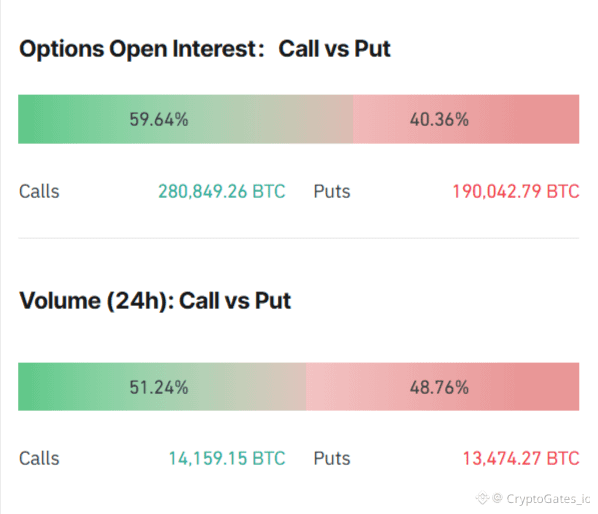
$BTC options put/call: OI and volume are not aligned.
OI shows 280,849 BTC in calls vs 190,043 BTC in puts, a 0.68 put/call ratio. 24h volume shows 14,159 BTC calls vs 13,474 BTC puts, a 0.95 ratio. 📊
Interpretation: the standing book is call-leaning, while new flow is close to neutral. Participants are not adding aggressively to either side.
Lesson: call-heavy OI is not a bullish signal on its own, since calls are also used for hedging and yield. The practical risk is crowded expectations meeting a range-bound market. That tends to produce fakeouts, so size positions and set boundaries accordingly.
Relevant if you run grid or DCA bots in a sideways market. Backtest your settings first.
#BTCOptions #PutCallRatio #Derivatives
97
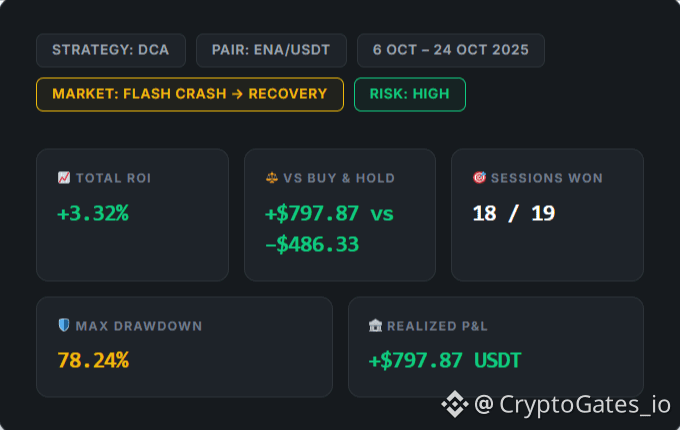
$ENA dropped 76% intraday on Oct 10, and most traders were either liquidated or frozen.
A DCA bot with a 4% step and 6 orders (max $3,500 capital) averaged down through the crash and closed 18 of 19 sessions in profit: +$797.87
Key lesson: the 78.24% max drawdown was unrealized exposure, not a realized loss.
The bot never sold at the low. Keep the full buffer liquid, and do not assume every crash recovers this fast.
#Binance #CryptoTrading #DCA
401
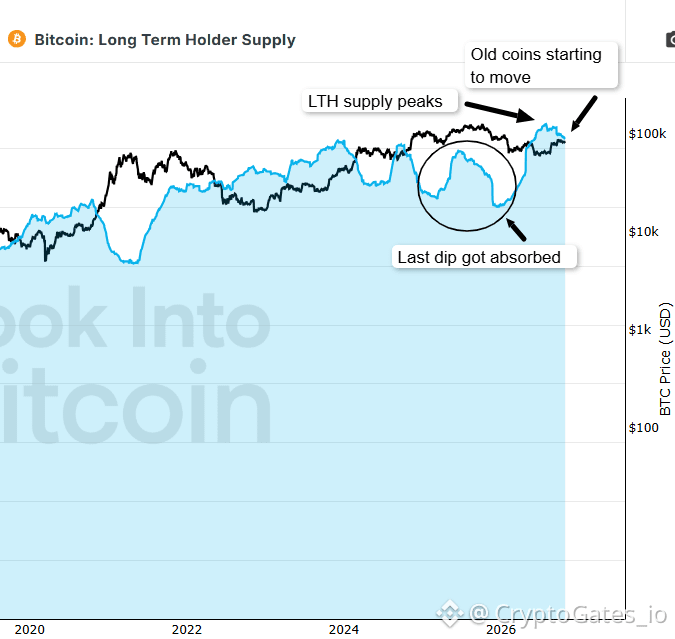
$BTC Long-Term Holder Supply: Down Close to 200K BTC in 4 Weeks
Long-term holder supply peaked near the top of its historical range and has started to roll over. Old coins are moving for the first time in a while.
Context matters here:
📊 A ~200K BTC drop on a base of roughly 16M BTC is small in relative terms
🔄 The previous dip (circled on the chart) was absorbed and supply recovered
The key question is whether these coins were sold or simply moved. Wallet migrations and custody changes can reset coin age without any selling pressure. Supply falling is not the same as price falling.
With FOMC tomorrow, volatility is likely. Scenarios to track:
Supply stabilizes after FOMC: structure intact
Supply keeps falling while price weakens: distribution, reduce risk
Supply falls while price holds: demand is absorbing it, but the move is more fragile
This is scenario mapping, not a prediction. Test your plan before you deploy it.
Verify first. Risk later. Scale slowly...
#BTC #OnChainData
61
$BTC : two-sided liquidity cluster on the Binance BTC/USDT perp 📊
24h liquidation heatmap shows:
Upper cluster: ~$88M near 81.1K
Lower cluster: ~$101M near 79.5K
Price is trading between them, closer to the lower zone.
Execution note: with leverage stacked on both sides and the Fed ahead, tight stops placed near these zones are exposed to sweeps. Wider invalidation and smaller size are the usual risk response in this kind of structure.
Heatmaps show where liquidity sits, not which way price goes.
See which strategy fits this market condition...
#BTC #LiquidationHeatmap #FuturesTrading
291
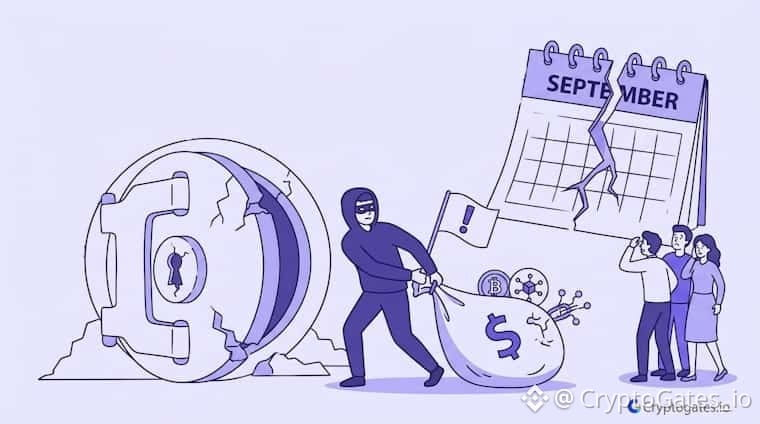
September 2026 hack losses: about $768M. 🛡️
Two events drove most of it: Bitget ($387.5M, wallet system breach) and Liquid Network ($318.7M, code flaw that allowed fake coins to be created).
The lesson for traders: exchange size is not a security guarantee. Concentrated funds mean concentrated risk.
Quick survival checklist:
Move idle coins to your own wallet.
Split funds across more than one platform.
Turn on 2FA and withdrawal whitelists.
Keep on exchanges only what you’re actively trading.
Backtest before you deploy...
#CryptoSecurity #Bitcoin #CryptoTrading
82
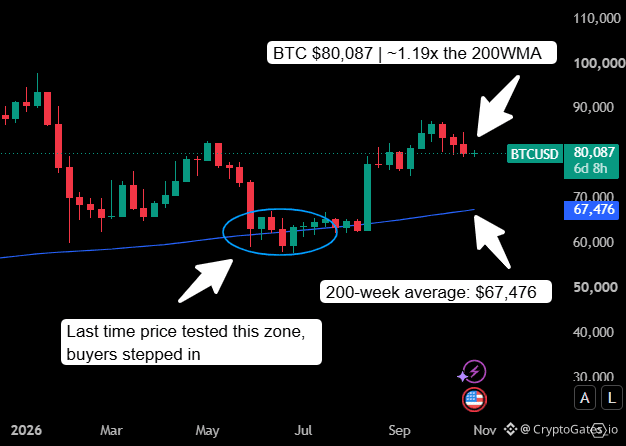
$BTC at $80,087 📊 vs the 200-week average at $67,476
That’s roughly 1.19x above the average on the weekly chart. The last time price came down here (May to Jul), buyers stepped in and price moved higher. That was a test of the level, not a confirmed bottom.
Three scenarios worth mapping:
Price holds above the average and consolidates: structure stays intact
Price drifts back toward it: watch the reaction, not just the level
A clear weekly close below it: the setup changes and risk needs to be reassessed
The 200WMA is a lagging indicator. It gives context, not a signal. Decide your invalidation and position size before price gets there, not after. 🛡️
Verify first. Risk later. Scale slowly...
#BTC #Bitcoin #CryptoAnalysis
1
78
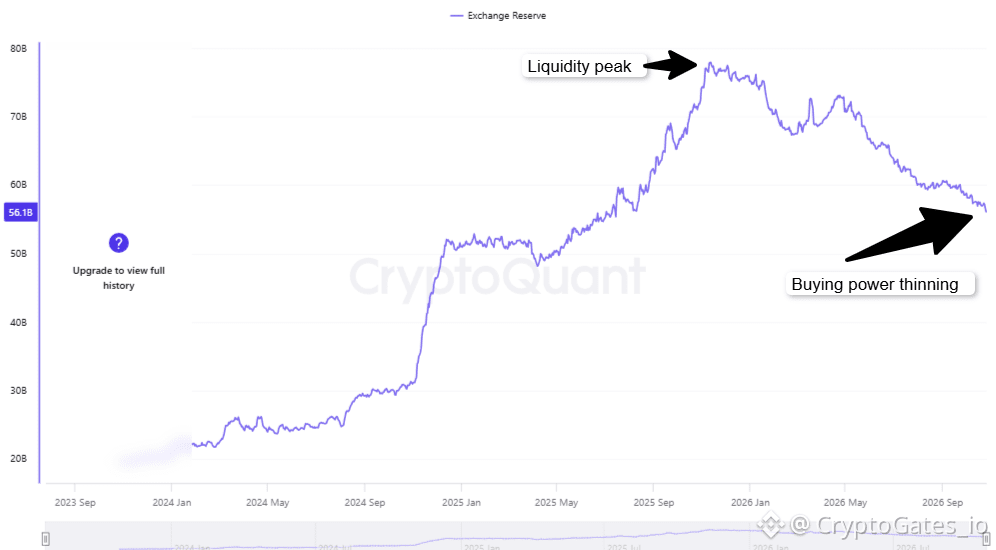
📉 Exchange Stablecoin Reserves: 56.1B
$BTC is holding near 80K into the Fed decision, but exchange stablecoin balances have been sliding since their late 2025 peak. These balances are the immediate buying power behind dip buys and rallies.
There are two readings. Either the capital is waiting off-exchange and can return quickly, or liquidity is leaving the market and bounces will fade faster.
Scenario map:
80K holds, 82.5K reclaimed with volume: the dry powder thesis gains weight. Wait for a retest to confirm.
Reserves keep falling while price ranges: rallies stay fragile.
80K breaks: 78.4K and 77.6K are the next levels to watch.
Fed decision on Wednesday is the main volatility event. Positioning matters more than prediction here.
Verify first. Risk later. Scale slowly.
#BTC #Stablecoin
60
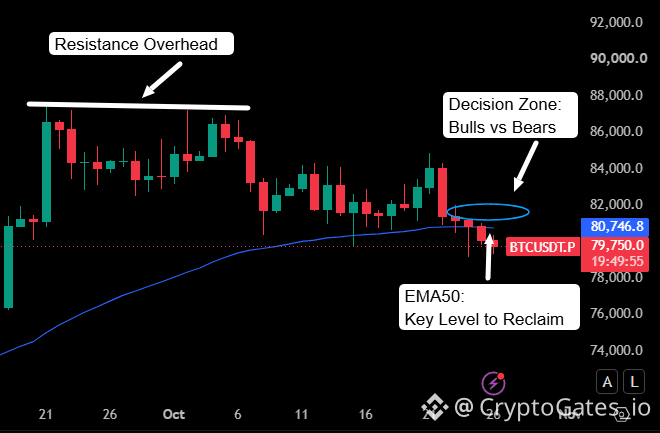
$BTC Under the Daily EMA50: What Matters Next 📊
💰 Price: 79,750
📉 Daily EMA50: 80,746.8
BTC is trading about 1K below its daily EMA50, a trend level that many systematic strategies use as a filter. That makes it a key reference for the next move.
Reclaiming a level is not the same as confirming it. A daily close above the EMA50 is the first checkpoint, and a successful retest is the second. Without both, a bounce is just a bounce.
Scenario map:
Bullish case: daily close above the EMA50 and a retest that holds. The next focus becomes the resistance overhead.
Bearish case: rejection at the EMA50. The 80K area turns into resistance and range-bound conditions continue.
The FOMC decision on October 28 can add volatility in either direction, so position sizing matters more than prediction.
Verify first. risk later. scale slowly...
#BTC #BitcoinAnalysis
96
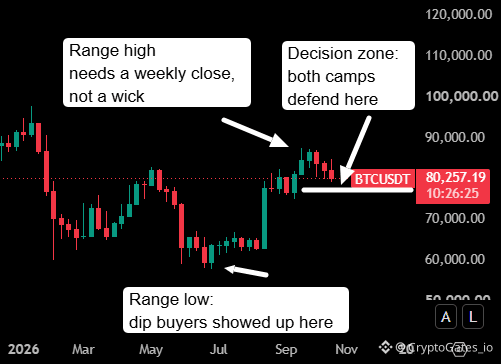
$BTC at 80,257: Where Two Theses Collide
The weekly chart shows BTC sitting right on the 80k line, and both camps are defending it. Bulls see a hold as the start of recovery. Bears see distribution.
Scenario map:
✅ 80k holds on a weekly close: dip buyers keep control of the range, with the 60k area as the last major defense.
⚠️ 80k lost on a weekly close: the range turns into resistance and 60k comes back into play.
🔎 Push toward the high just under 90k: only a weekly close above it counts. A wick is not confirmation.
A level is only useful when you know what you’ll do on each side of it. Test the plan before real capital is involved.
Verify first. Risk later. Scale slowly...
$BTC #Bitcoin
78
$BTC Holding the 80K Pivot 📊
BTC is trading near 80,877 on the daily chart, with today’s range tight between 80,771 and 81,033. 80K is acting as the key decision level.
What the structure suggests:
80K holds: price starts absorbing the dense supply zone near 80K to 82K. This is the first sign of acceptance, but a reclaim is not a confirmed retest.
80K lost: the recent advance may be a range high, with rotation back into the lower part of the range.
Sideways chop: tight daily ranges often precede expansion, but direction is not confirmed until price commits.
Risk management matters more than direction here. Avoid sizing up on a single candle, and define invalidation before entry. A level is only a hypothesis until it survives a retest.
Verify first. Risk later. Scale slowly. 🛡️
#BTC #Bitcoin

86
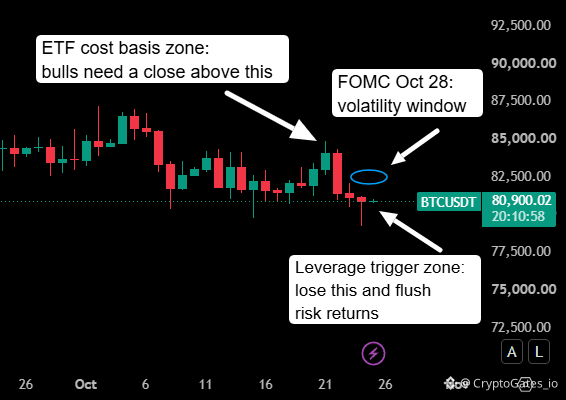
$BTC at 80.9K: Two Levels That Matter More Than Any Price Target
Narratives flipped fast: from “bottom at 40-50K” to “94K incoming” in a few weeks. Price is still range-bound, so here is a scenario map instead of a prediction.
▪️ Daily close above ~84.4K (ETF cohort cost basis): constructive only if funding stays under ~5% annualized and ETF inflows confirm. A close there with funding near 9% is a leveraged move and tends to get sold.
▪️ Loss of ~79.8K: leverage has rebuilt after two flushes this month, so a third flush is a live risk.
▪️ Flows are mixed: Friday saw -$137.9M in spot ETF outflows, while the week stays net positive.
FOMC on Oct 28 is the volatility window. Plan entries, size and invalidation before the event, not during it.
Verify first. Risk later. Scale slowly. 🛡️
#BTC #Bitcoin #BinanceSquare
85
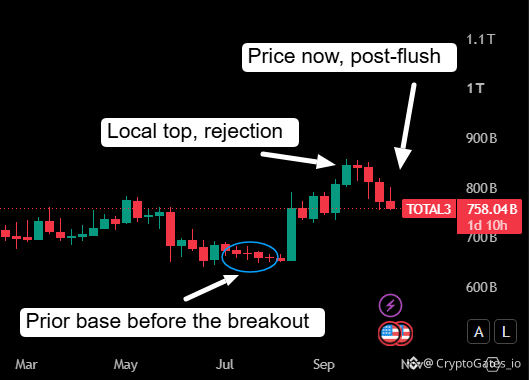
TOTAL3 Weekly: Altcoins Pull Back From the Local Top
TOTAL3 (crypto market cap excluding $BTC and ETH) is trading near $758B on the weekly chart, between the $700B and $800B marks.
The structure so far: a tight summer base, a breakout candle out of it, rejection at the Sep-Oct high, and now a pullback.
📉 Two scenarios worth mapping:
Price holds above the prior base. The pullback is a reset and the breakout structure stays intact.
Price slides back into the base. The breakout becomes a fakeout.
A bounce from here is not confirmation. Weekly closes and volume on the bounces matter more than the bounce itself.
Verify first. risk later. scale slowly...
#Altcoins #TOTAL3 #CryptoAnalysis
90
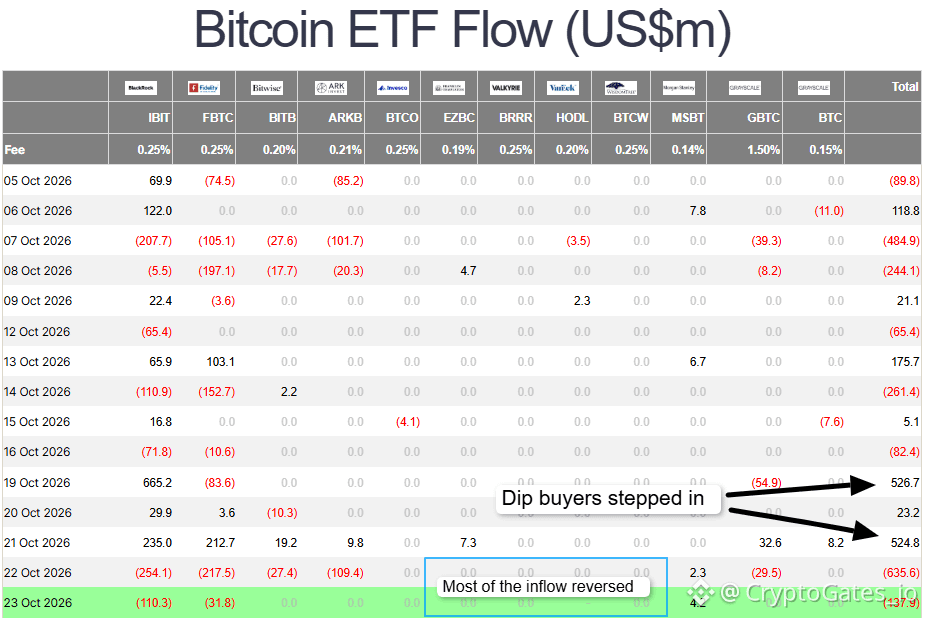
$BTC ETF flows flipped fast this week
Here is the sequence from US spot Bitcoin ETF
Mon: +$526.7M
Wed: +$524.8M
Thu: -$635.6M
Fri: -$137.9M
That is $1.05B of inflows followed by $773.5M of outflows within two days, so roughly 74% of the big inflows were reversed almost immediately.
Why it matters: a single strong inflow day tells you very little. What matters is whether inflows repeat. Net flow since Oct 5 is still negative at about -$606M, so the broader tape has not turned yet.
⚖️ Two scenarios to track:
Inflows stack for several sessions: dip buying was real demand
Outflows keep winning: the recent inflows were a bounce inside weak flows
Practical takeaway: treat flow data as confirmation, not a trigger. Wait for repeated days in one direction before drawing conclusions, and size exposure accordingly.
Verify first. risk later. scale slowly...
#BTC #ETFFlows
71
Войдите, чтобы посмотреть больше материала
Присоединяйтесь к пользователям криптовалют по всему миру на Binance Square
⚡️ Получайте новейшую и полезную информацию о криптоактивах.
💬 Нам доверяет крупнейшая в мире криптобиржа.
👍 Получите достоверные аналитические данные от верифицированных создателей контента.
Эл. почта/номер телефона
В тренде
EarningsSeason
Просмотров: 6.6M
33,056 обсуждают
Earnings Season Session 3: Will Google & Microsoft Beat Earnings Expectations?
Binance Square Official
·Лайков: 184
·Просмотров: 109.8k
USMidtermElections
Просмотров: 83,914
1,100 обсуждают
StrategySTRCReaches$99.95ForFirstTimeIn165Days
Просмотров: 605
31 обсуждают