

Crypto Signal Advisor
636 Публикации

Crypto Signal Advisor
Отправить жалобу
Заблокировать пользователя
Successful traders always manage risk.
Открытая сделка
Трейдер с частыми сделками
3.7 г
135 подписок(и/а)
9.6K+ подписчиков(а)
6.1K+ понравилось
Посты
Портфель
Все
Цитирования
·
--
Рост
Binance Hacking News!!!
Today we have a big news that someone from South Korea trying to hack binance, CZ also confirm this on twitter or X, but binance officials said that users funds are safe, but after this news, market shake so hard and so massive, at one moment i though that market going again towards 30k-35k but binance recover this very well.
But impact was unexpected, market shake, many coins lost their balance and lost their value, big coins solana, eth, bnb, and many more drops almost 10%-12%.
But if, we saw some confirmation from authorities side then ready for big dump, almost 700m liquidations already in just an hour, that was unexpected and unbelievable. More liquidations on 75k btc, and 2.1k for eth and solana done their job, so i think we are ready for another dump or go ahead for next level entry?
1
473
·
--
Рост
#BinancePick
Open Long position on xagusd, entry zone will be 52.50-70, 1st t.p will be on 52.9
2nd t.p 53.1
3rd t.p 53.3
4rth t.p 53.5
5th t.p 53.7
last t.p will be 54.01
Thankyou and thanks for your time
#BinancePick
Open Long position on xagusd, entry zone will be 52.50-70, 1st t.p will be on 52.9
2nd t.p 53.1
3rd t.p 53.3
4rth t.p 53.5
5th t.p 53.7
last t.p will be 54.01
Thankyou and thanks for your time
Open Long position on xagusd, entry zone will be 52.50-70, 1st t.p will be on 52.9
2nd t.p 53.1
3rd t.p 53.3
4rth t.p 53.5
5th t.p 53.7
last t.p will be 54.01
Thankyou and thanks for your time

635
·
--
Рост
Gold and Silver price Alert!
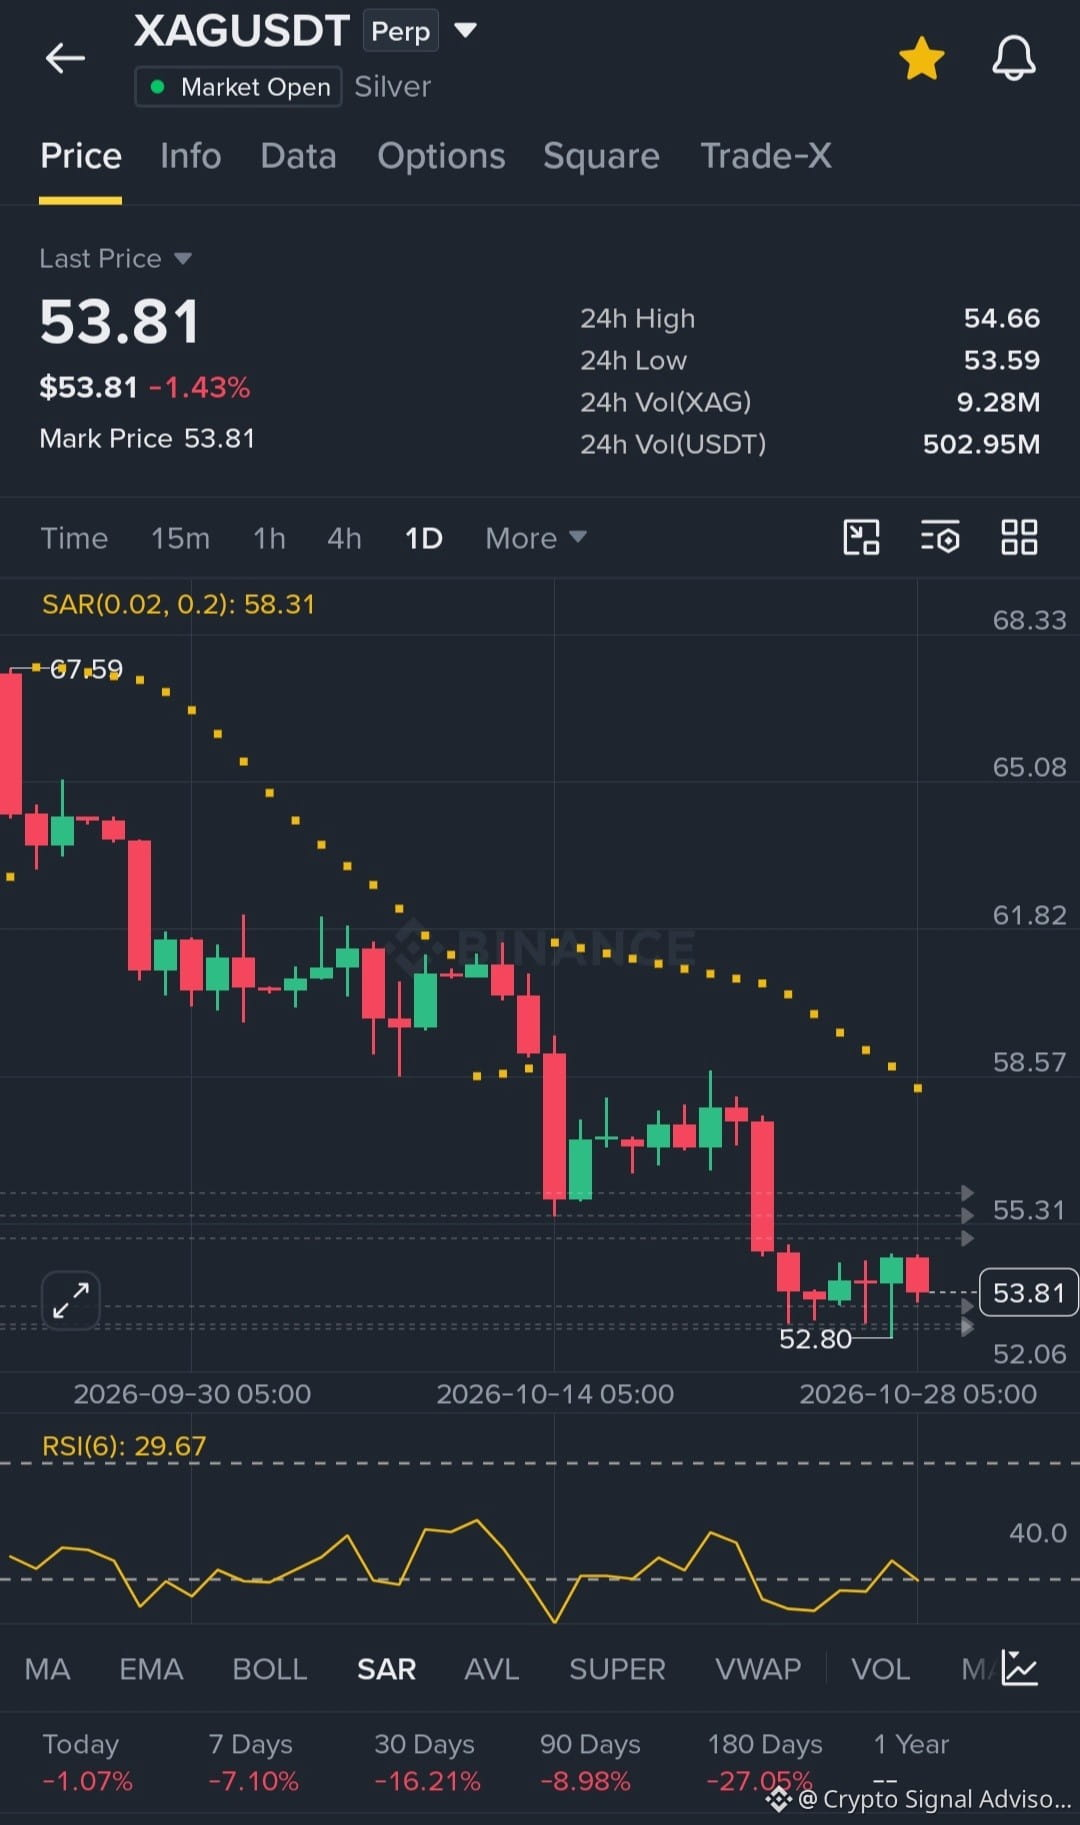
That was massive! silver touches too many times in recent 3-4 days at 53.1, even 1 time it break 53 support and touches neatest strongest support which is 52.80 but support push back silver towards 54 dollars, as per my analysis silver is trading in strongest buying zone. Here too many traders buy silver so that's why silver push back really hard. But...
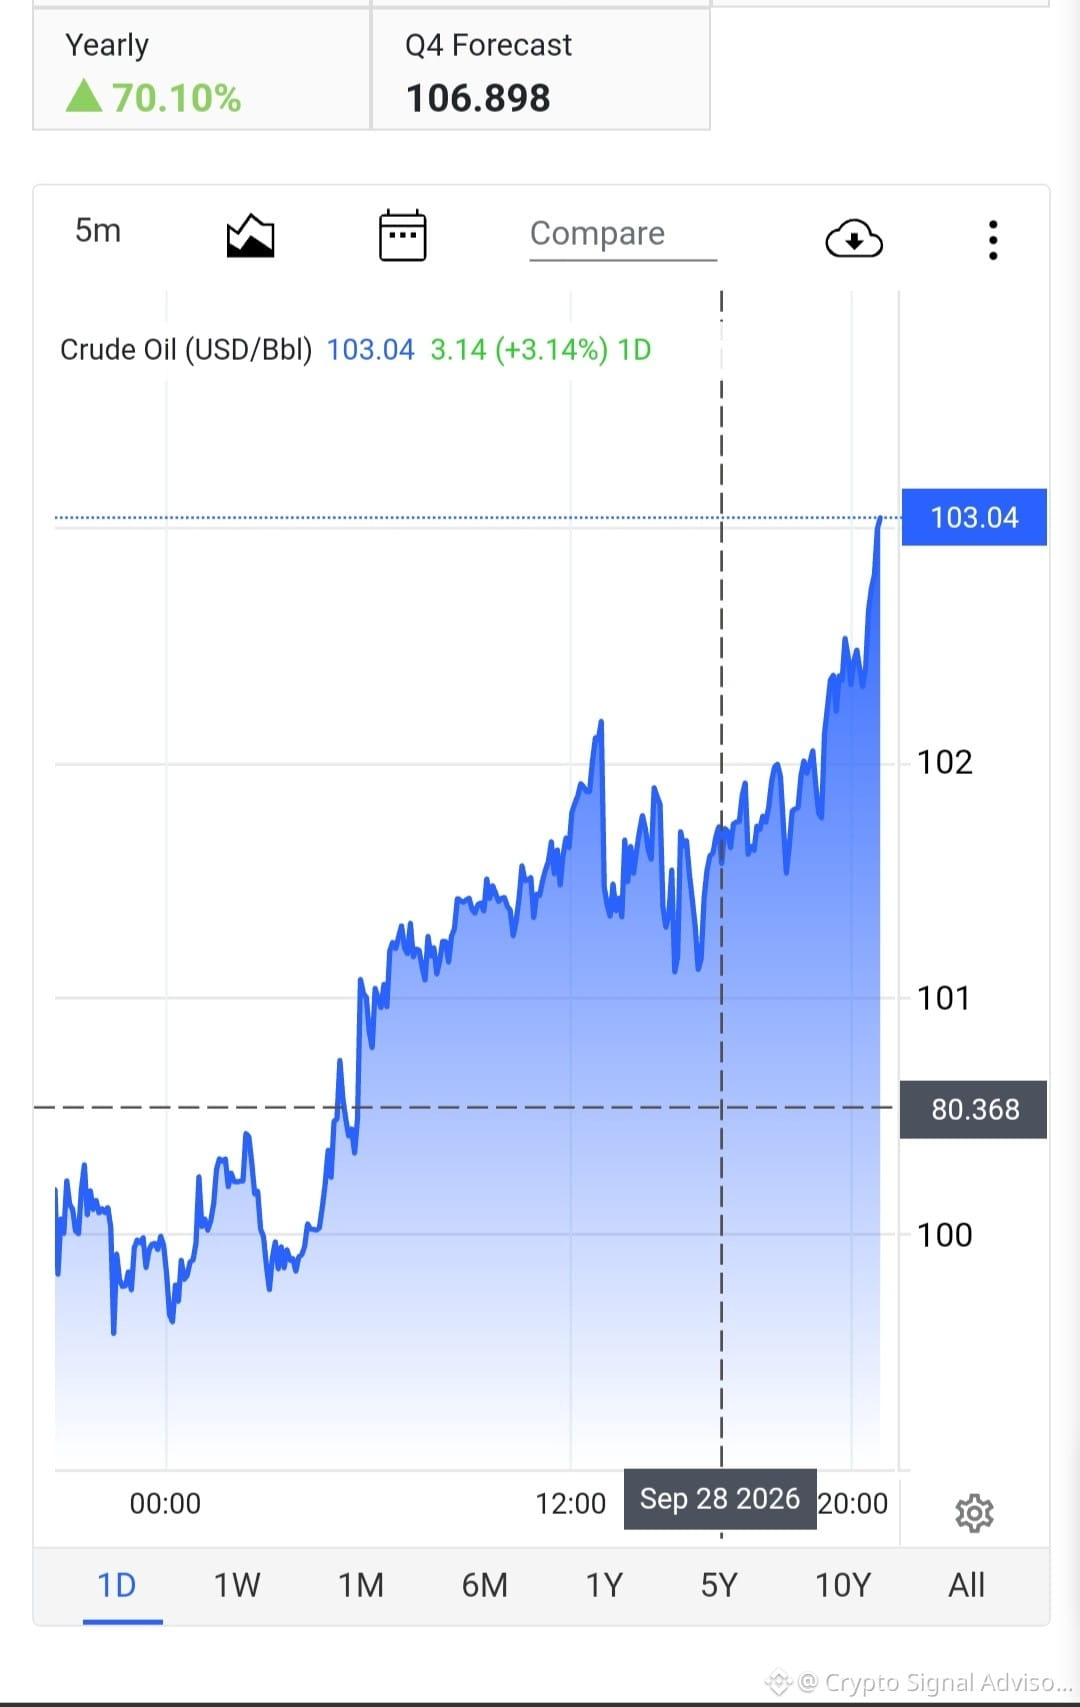
In recent news which is good for silver that after touches oil prices over 103 dollars, FED still hold their previous rates, before this wall street send some signals that fed raise rates almost 0.5%, but fed want to hold their rates for 2-3 months. But if oil prices jump more and government forced fed to raise some rates then what happed woth gold and silver if they are in that zone.
Gold drops below 3800 and touches 3750, silver drops below 50 dollars and maybe touches 48 dollars again, but fed continues with these rates then silver again push back towards 58 dollars and gold going for 4500. But till now silver and gold is trading in strongest buying zone. If you buy silver or gold here and waiting for fed cut rates which is possible in January to May, then gold trade above 6000, and silver above 150 dollars. bold claim but possible...
Thankyou
$XAU
{future}(XAUUSDT)
$XAG
{future}(XAGUSDT)
#FOMCWatch #GOLD #XAGUSDT实操指南
Gold and Silver price Alert!
That was massive! silver touches too many times in recent 3-4 days at 53.1, even 1 time it break 53 support and touches neatest strongest support which is 52.80 but support push back silver towards 54 dollars, as per my analysis silver is trading in strongest buying zone. Here too many traders buy silver so that's why silver push back really hard. But...
In recent news which is good for silver that after touches oil prices over 103 dollars, FED still hold their previous rates, before this wall street send some signals that fed raise rates almost 0.5%, but fed want to hold their rates for 2-3 months. But if oil prices jump more and government forced fed to raise some rates then what happed woth gold and silver if they are in that zone.
Gold drops below 3800 and touches 3750, silver drops below 50 dollars and maybe touches 48 dollars again, but fed continues with these rates then silver again push back towards 58 dollars and gold going for 4500. But till now silver and gold is trading in strongest buying zone. If you buy silver or gold here and waiting for fed cut rates which is possible in January to May, then gold trade above 6000, and silver above 150 dollars. bold claim but possible...
Thankyou
$XAU
$XAG
#FOMCWatch #GOLD #XAGUSDT实操指南
1.4k
#BinancePick
Gold and Silver doing what market actually want... So we can see them at 53 silver, and 4060 gold. But as expected fed cut rates on december instead of november then market goes up for gold and silver as fed officials said. But if fed raise rates if rapidly increase oil prices then we should see gold below 3800 and silver below 50 dollars. Huge and big liquidations alert....
Thankyou

24
#BinancePick
Entrt point on xag will be very strong below 53.50, and set your one time t.p at 54.20... Xag trade on their closest level, still till next month inbetween 4-6 nov xag maybe down more but before this it should decline and touches 52.20-52.40... so set your positions accordingly
#BinancePick
Entrt point on xag will be very strong below 53.50, and set your one time t.p at 54.20... Xag trade on their closest level, still till next month inbetween 4-6 nov xag maybe down more but before this it should decline and touches 52.20-52.40... so set your positions accordingly
Entrt point on xag will be very strong below 53.50, and set your one time t.p at 54.20... Xag trade on their closest level, still till next month inbetween 4-6 nov xag maybe down more but before this it should decline and touches 52.20-52.40... so set your positions accordingly

372
#BinancePick
So now as per my analysis now we will see btc again 72k-75k, btc going in strong buying zone till now but after market opening on monday, buyers decide market where to go, but now gold, silver also dumping very hard, very lower low from previous 16-17th months. so don't trade at the moment, analyse market and then trade... thankyou
So now as per my analysis now we will see btc again 72k-75k, btc going in strong buying zone till now but after market opening on monday, buyers decide market where to go, but now gold, silver also dumping very hard, very lower low from previous 16-17th months. so don't trade at the moment, analyse market and then trade... thankyou

75
#BinancePick
Btc going down very hard after oil prices surge, now as per my opinion btc again touches 72k-75k soon. Soon we will see eth at 2k. So take your positions accordingly....
#BinancePick
Btc going down very hard after oil prices surge, now as per my opinion btc again touches 72k-75k soon. Soon we will see eth at 2k. So take your positions accordingly....
Btc going down very hard after oil prices surge, now as per my opinion btc again touches 72k-75k soon. Soon we will see eth at 2k. So take your positions accordingly....

182
·
--
Рост
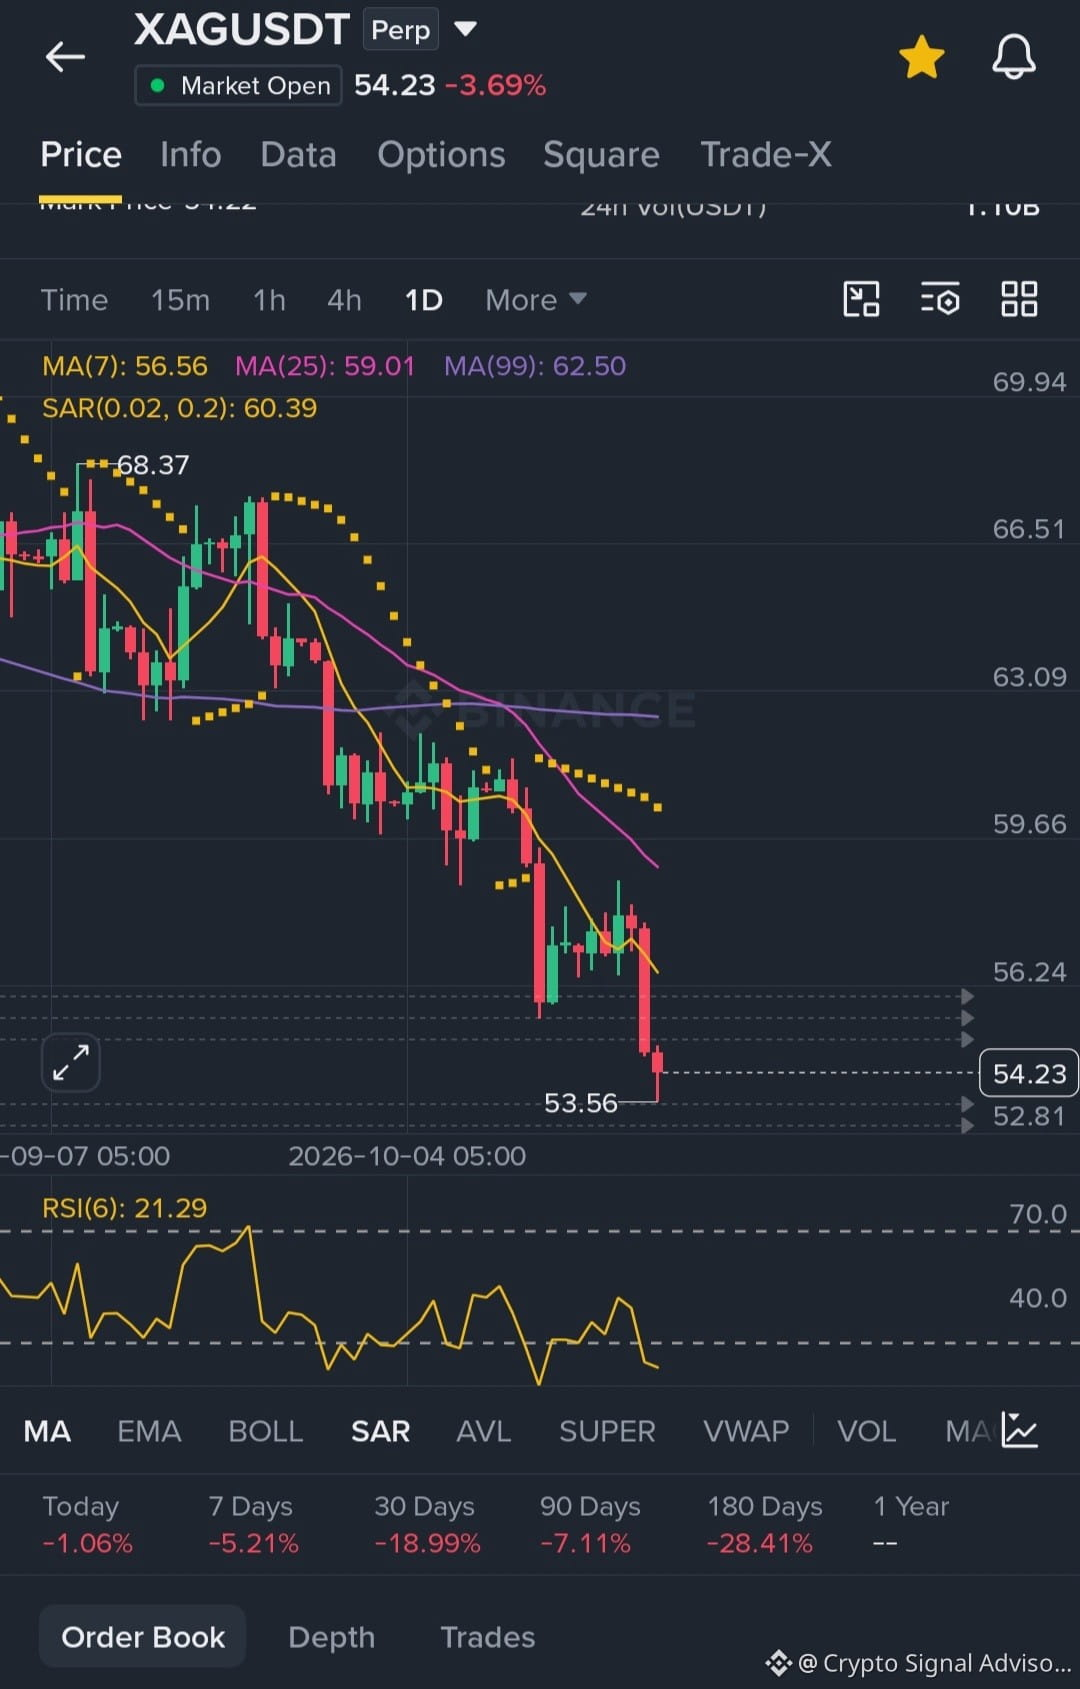
XAGUSDT (Daily Chart) – Big Trend is Down, But Watch for a Bounce! 📉
Looking at the daily chart, the overall trend for Silver (XAGUSDT) is clearly bearish. The price is trading far below all the major moving averages (MA7, MA25, and MA99), and the Parabolic SAR dots are sitting above the price, which confirms the downward pressure. The price recently hit a low around 53.56, and the order book shows heavy sell walls above, meaning sellers are still in control.
However, there is a potential short-term opportunity. The RSI (6) is at 21.29, which is in the oversold zone. This means the price has fallen very fast and could be due for a quick "relief bounce" or pullback. Latest News to Watch: According to the latest LBMA survey, delegates forecast silver could reach $94.70 within the next 12 months, supported by strong industrial and investment demand. Also, India has just issued import permits for up to 6,000 tonnes of silver ahead of Diwali, which could boost physical demand and ease supply constraints.
Trading Strategy & Risk Management:
· For Shorts (Safest): If the price breaks and closes below the 53.56 support, you can look for a short entry with targets around 52.00. Always use a stop loss above 55.50.
· For Longs (Risky): If you want to catch the bounce, wait for a clear green candle or a bounce off 53.56. Your first target would be the MA7 around 56.00 – 56.50, with a tight stop loss at 53.00.
· Pro Tip: Always use a stop loss! The market is volatile, and the trend is still down, so protect your capital first.
Disclaimer: This is technical analysis, not financial advice. Always do your own research. 🛡️
422
·
--
Падение
#BinancePick
Now market is crashing so hard, hold silver and even stock market also crshed. i think we will see silver on 50 dollars again. open short here till war.
Thankyou
#BinancePick
Now market is crashing so hard, hold silver and even stock market also crshed. i think we will see silver on 50 dollars again. open short here till war.
Thankyou
Now market is crashing so hard, hold silver and even stock market also crshed. i think we will see silver on 50 dollars again. open short here till war.
Thankyou

305
·
--
Рост
Частичная правда
Xagust Price Alert!
Silver is now at the bottom of previous many months, now buying is very high, so market definitely push their prices for short term, maybe for 56-57.
entry zone will be 54.5-54.8
1st t.p will be at 54.9
2nd will ve 55.20
3rd t.p at 55.50
4rth t.p will be 55.80
5th t.p will be 56.
kindly see above analysis and then open some trade.
Make some litle profit at the moment...
thankyou
see my trade$XAG #xag Analysis
1
675
#BinancePick
Binance square launch most intresting thing, with this we should open trade like something and we Don't lose any money, this is very helpfull for us for gaining rewards and much more. I appreciate this kind of binance progress.
Thankyou
#BinancePick
Binance square launch most intresting thing, with this we should open trade like something and we Don't lose any money, this is very helpfull for us for gaining rewards and much more. I appreciate this kind of binance progress.
Thankyou
Binance square launch most intresting thing, with this we should open trade like something and we Don't lose any money, this is very helpfull for us for gaining rewards and much more. I appreciate this kind of binance progress.
Thankyou

115
#BinancePick
Play with binance pick and darn points, and chance to win 1 million dollars. it's price pool game. Good for beginners and also professionals... i like this
Thankyou binance square
#BinancePick
Play with binance pick and darn points, and chance to win 1 million dollars. it's price pool game. Good for beginners and also professionals... i like this
Thankyou binance square
Play with binance pick and darn points, and chance to win 1 million dollars. it's price pool game. Good for beginners and also professionals... i like this
Thankyou binance square

97

·
--
Рост
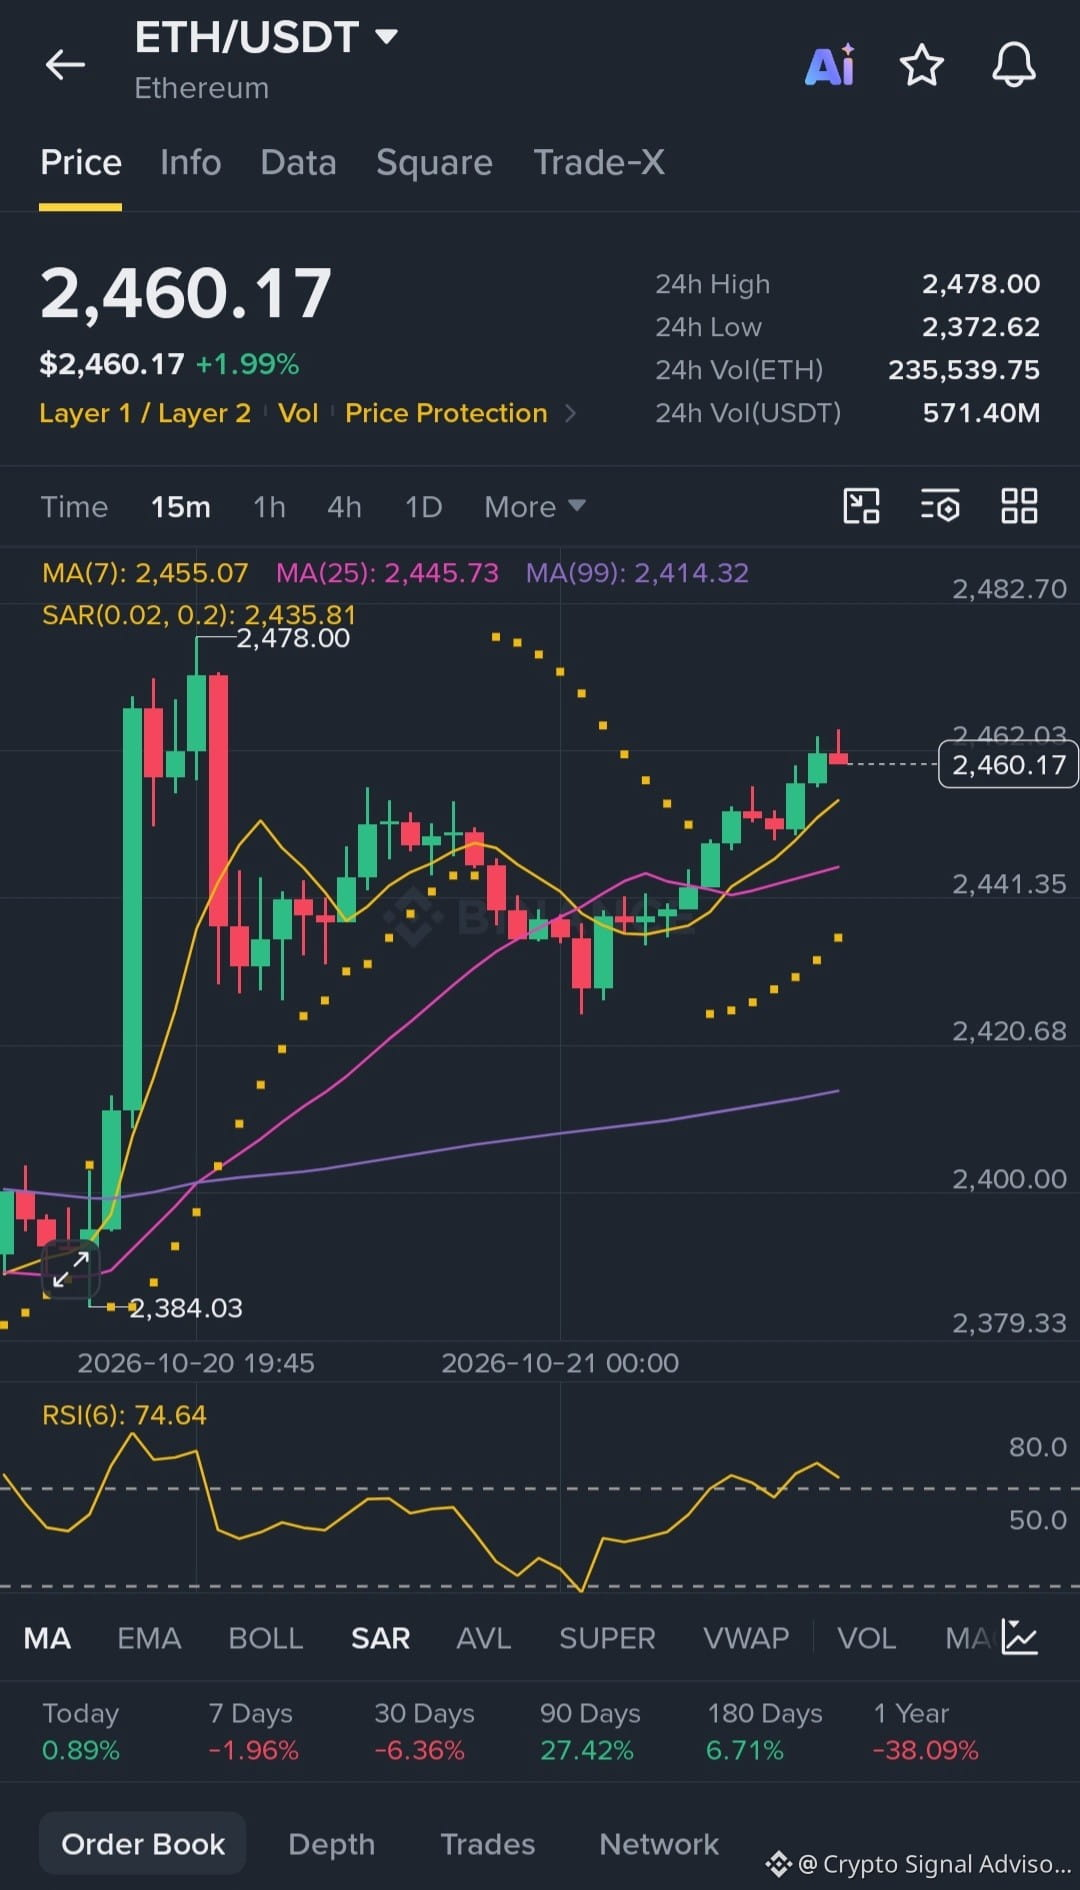
Ethereum Price Analysis!!
Ethereum looking strong right now on the 15-minute chart. The price is at 2460.17, which is up almost 2% today. After falling to a low of 2384, the price has bounced back up above its moving averages. The 7-day moving average at 2455 and the 25-day moving average at 2445 are now helping the price stay high. Also, the Parabolic SAR dots are now below the candles, which means buyers are in control right now.
But be careful if you are doing short-term trading. The RSI is very high at 74.64. This means the price is overbought and moved up too fast. So, a small price drop or moving sideways is very possible right now. The first big resistance is at the 24-hour high of 2478. If buyers break above 2478, the next target is 2500. On the lower side, the first strong support is at 2445, and then at 2414.
Here is the simple trading plan for Binance Square. If you want to buy, wait for a 15-minute candle to close above 2478. Then you can target 2500. If you want to sell, wait for the price to fail at 2478 and drop below 2445. Then you can target 2415. Because the RSI is overbought, do not buy right now at the top. Wait for a small price drop to the moving averages for a safer entry. Always use a stop loss to protect your money.
Thankyou
#etherreum $ETH
{future}(ETHUSDT)
Ethereum Price Analysis!!
Ethereum looking strong right now on the 15-minute chart. The price is at 2460.17, which is up almost 2% today. After falling to a low of 2384, the price has bounced back up above its moving averages. The 7-day moving average at 2455 and the 25-day moving average at 2445 are now helping the price stay high. Also, the Parabolic SAR dots are now below the candles, which means buyers are in control right now.
But be careful if you are doing short-term trading. The RSI is very high at 74.64. This means the price is overbought and moved up too fast. So, a small price drop or moving sideways is very possible right now. The first big resistance is at the 24-hour high of 2478. If buyers break above 2478, the next target is 2500. On the lower side, the first strong support is at 2445, and then at 2414.
Here is the simple trading plan for Binance Square. If you want to buy, wait for a 15-minute candle to close above 2478. Then you can target 2500. If you want to sell, wait for the price to fail at 2478 and drop below 2445. Then you can target 2415. Because the RSI is overbought, do not buy right now at the top. Wait for a small price drop to the moving averages for a safer entry. Always use a stop loss to protect your money.
Thankyou
#etherreum $ETH
1
1.1k

BTC Price Analysis (Shocking)
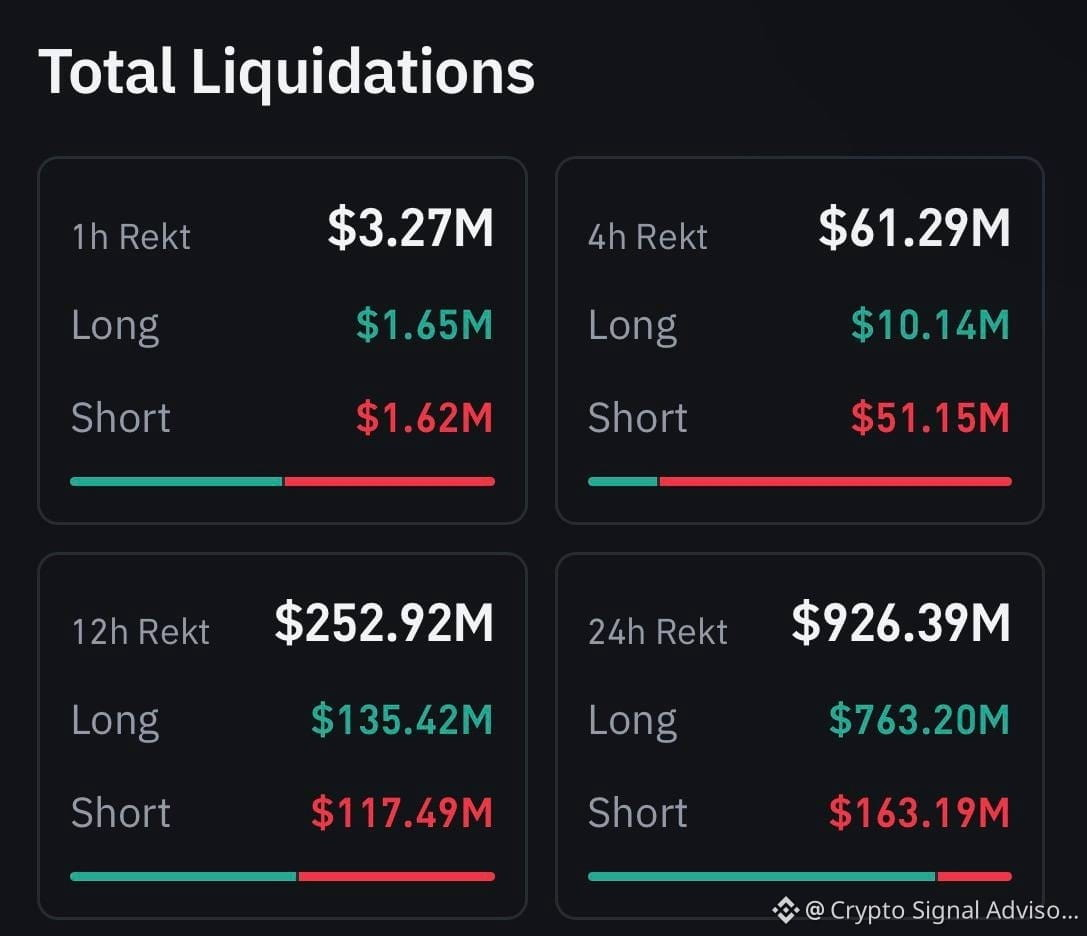
The image shows 926.39 million liquidated in 24 hours. 763.20 million of that was longs. That is exactly why BTC crashed to 82k. When inflation data came in hotter than expected, price started dropping. As it fell below key levels, those 763 million in long positions got forcefully sold. That forced selling pushed BTC down further, all the way to 79,805 before it bounced back to 82k.
Look at the 4-hour row: 61.29 million liquidated, but 51.15 million were shorts. This tells you what happened after the crash. Price hit 79.8k, then bounced hard. People who tried to short the breakdown got trapped and liquidated. That is why we are back at 82k instead of staying below 80k.
The 1-hour row is now almost perfectly balanced: 1.65M longs vs 1.62M shorts. This means the bloodbath is pausing. The forced selling is done for now. The 12-hour row shows 135.42M longs vs 117.49M shorts, meaning both sides got destroyed. This is a classic post-cascade exhaustion phase.
What to do now: 80,000 is the line. If BTC breaks below 79,805 again, the next long liquidations could push it to 78,000. If it holds above 80k, we chop sideways between 80k and 85k. Do not trade right now. The market is in shock, and so are you. Wait for stability.
Thankyou
#CPIWatch $BTC #BTC☀
{future}(BTCUSDT)
$ETH
{future}(ETHUSDT)
$ZEC
{future}(ZECUSDT)
BTC Price Analysis (Shocking)
The image shows 926.39 million liquidated in 24 hours. 763.20 million of that was longs. That is exactly why BTC crashed to 82k. When inflation data came in hotter than expected, price started dropping. As it fell below key levels, those 763 million in long positions got forcefully sold. That forced selling pushed BTC down further, all the way to 79,805 before it bounced back to 82k.
Look at the 4-hour row: 61.29 million liquidated, but 51.15 million were shorts. This tells you what happened after the crash. Price hit 79.8k, then bounced hard. People who tried to short the breakdown got trapped and liquidated. That is why we are back at 82k instead of staying below 80k.
The 1-hour row is now almost perfectly balanced: 1.65M longs vs 1.62M shorts. This means the bloodbath is pausing. The forced selling is done for now. The 12-hour row shows 135.42M longs vs 117.49M shorts, meaning both sides got destroyed. This is a classic post-cascade exhaustion phase.
What to do now: 80,000 is the line. If BTC breaks below 79,805 again, the next long liquidations could push it to 78,000. If it holds above 80k, we chop sideways between 80k and 85k. Do not trade right now. The market is in shock, and so are you. Wait for stability.
Thankyou
#CPIWatch $BTC #BTC☀
$ETH
$ZEC
646
·
--
Рост
RLC price Analysis and trade signals!!!
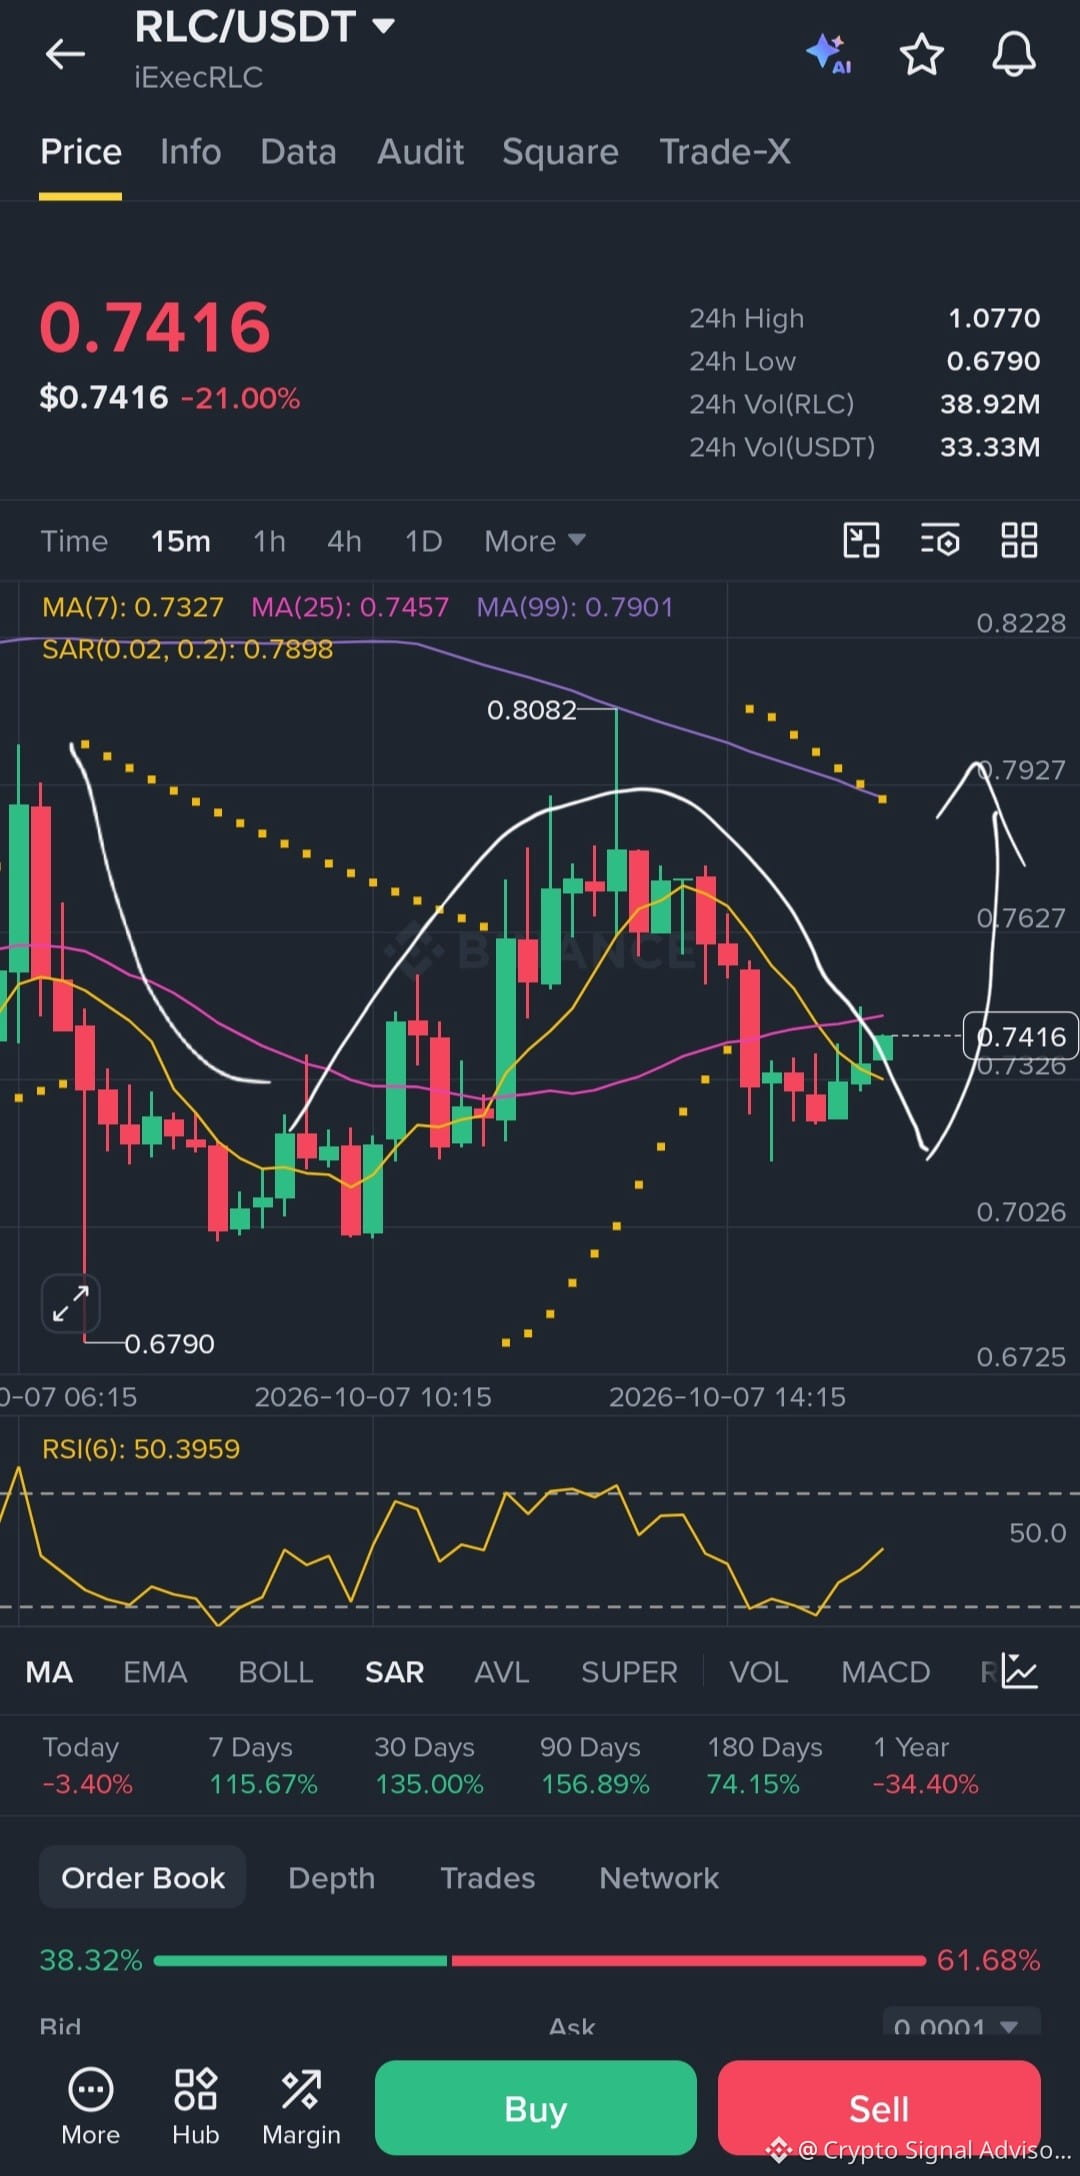
RLC is near 0.77 today, down about 17% in 24 hours after a huge rally from 0.36 to 1.07. Open interest jumped over 1,700%, causing a short squeeze. RSI was near 90, so a pullback was expected. Resistance is 0.80–0.83; support is 0.68–0.70.
Tomorrow, if buyers hold 0.68, price can bounce to 0.75 and then 0.80. A close above 0.83 would confirm recovery. If 0.68 breaks, next support is 0.625, then 0.36–0.40. MACD is still positive, but chasing is risky. Better entry is 0.60–0.65.
There is no real news from iExec since July 23. The move is mostly market mechanics, not fundamentals. Futures open interest is near 35 million, bigger than the 33 million market cap. Liquidity is thin, leverage is high, so RLC can move very fast both ways. Use small size, set stop loss, and avoid buying green candles without a plan. Please be careful.
Short term signals, now buy RLC
1st t.p 0.75
2nd t.p 0.78
3rd t.p 0.80
4rth t.p will be not more then 0.82-0.83.
Thankyou for your time
#RLC/USDT $RLC
{future}(RLCUSDT)
RLC price Analysis and trade signals!!!
RLC is near 0.77 today, down about 17% in 24 hours after a huge rally from 0.36 to 1.07. Open interest jumped over 1,700%, causing a short squeeze. RSI was near 90, so a pullback was expected. Resistance is 0.80–0.83; support is 0.68–0.70.
Tomorrow, if buyers hold 0.68, price can bounce to 0.75 and then 0.80. A close above 0.83 would confirm recovery. If 0.68 breaks, next support is 0.625, then 0.36–0.40. MACD is still positive, but chasing is risky. Better entry is 0.60–0.65.
There is no real news from iExec since July 23. The move is mostly market mechanics, not fundamentals. Futures open interest is near 35 million, bigger than the 33 million market cap. Liquidity is thin, leverage is high, so RLC can move very fast both ways. Use small size, set stop loss, and avoid buying green candles without a plan. Please be careful.
Short term signals, now buy RLC
1st t.p 0.75
2nd t.p 0.78
3rd t.p 0.80
4rth t.p will be not more then 0.82-0.83.
Thankyou for your time
#RLC/USDT $RLC
362
·
--
Рост
RLC Price Alert!
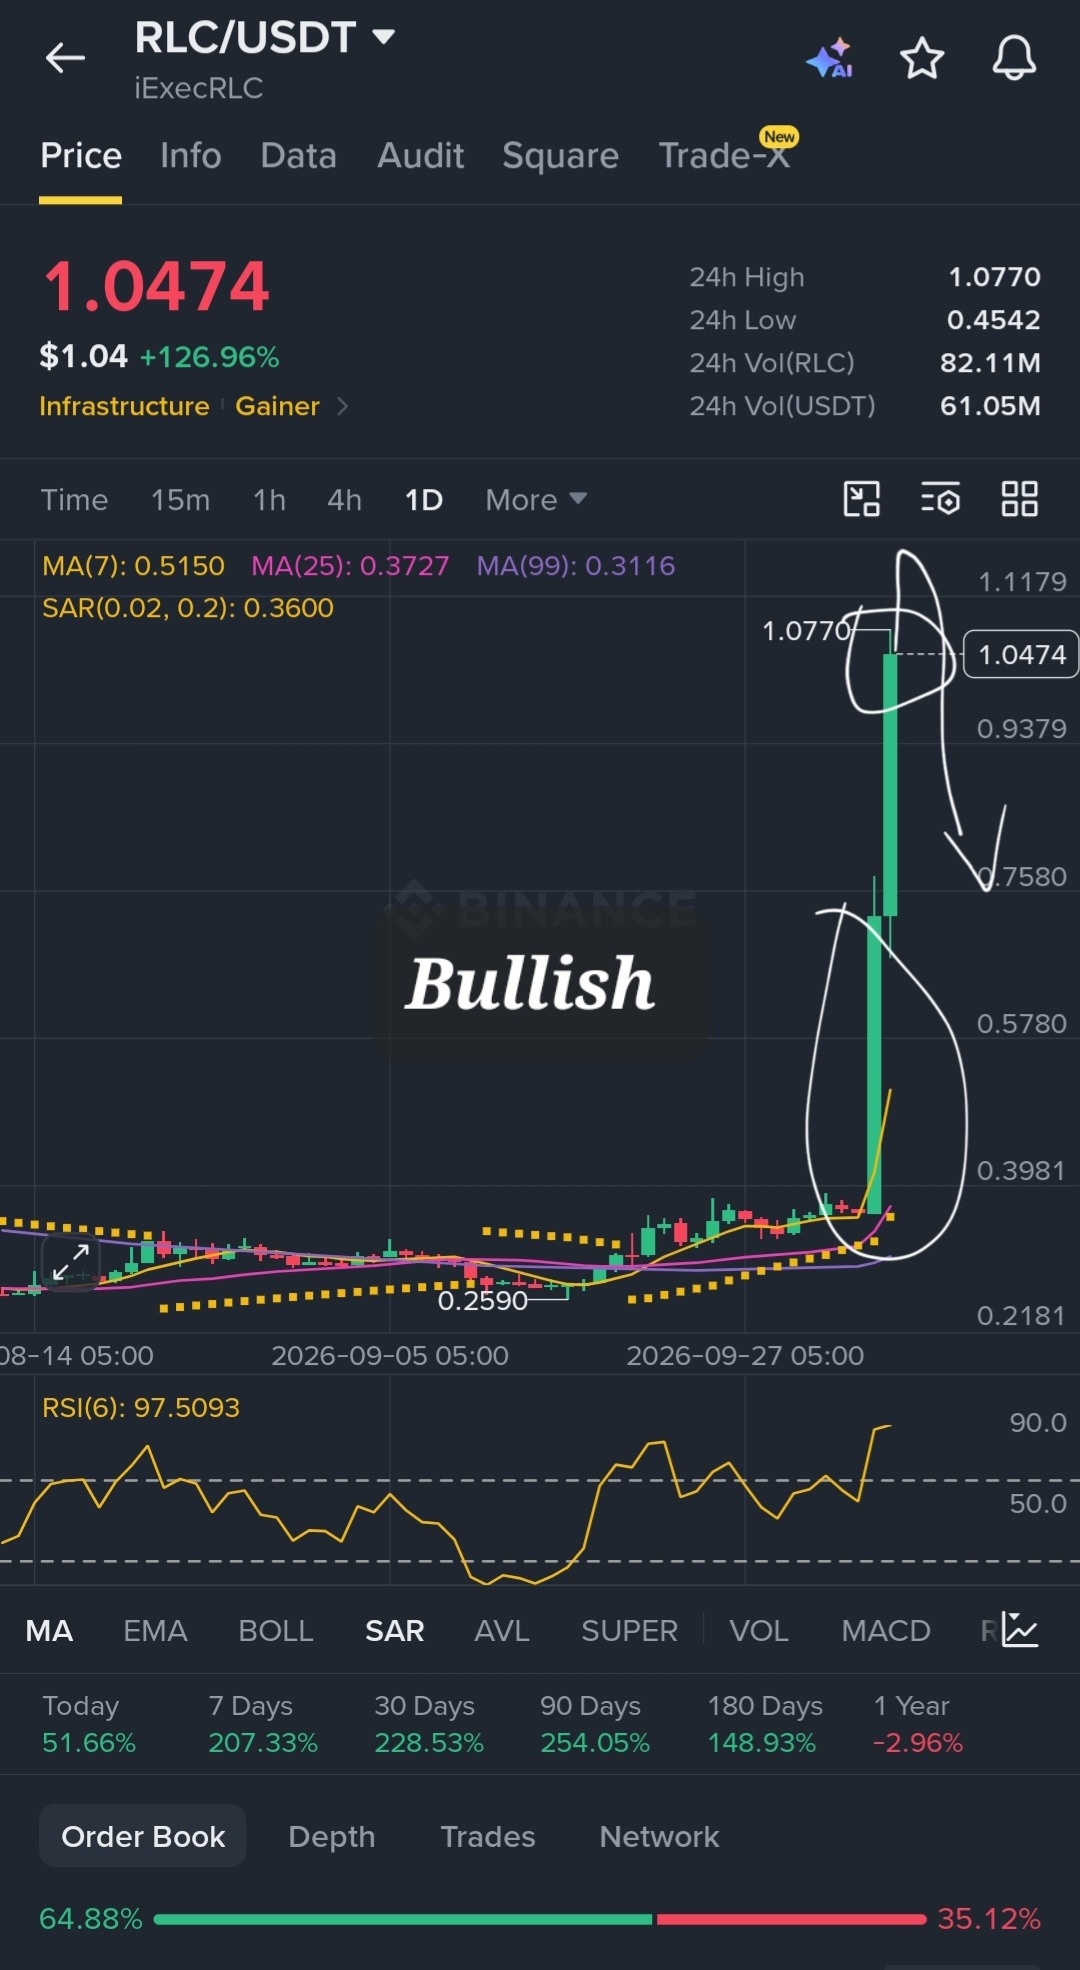
RLC is near 1.03 today. It jumped more than 136% in 24 hours. Before this, it was moving slowly between 0.35 and 0.39 for a week. Then it broke up very fast. Many traders who bet against it were forced to buy, so the price shot up. Total futures bets rose over 1,175% in one day. Funding was negative, meaning short sellers were trapped. RSI near 90 means it is very hot and overbought. Price is far above its normal range, so a quick fall can happen. First resistance is 0.79. If it breaks 0.80 with strong buying, it can go to 0.85–1.00.
Tomorrow, the main question is: can RLC stay up, or will it run out of power? If buyers protect 0.70, price can rest and then try 0.85 or even 1.00. If 0.70 breaks, support is around 0.55. After that, support is 0.39–0.40, where the rally started. Trend signals are still strong, but buying now is risky because price already moved too fast. A better entry for traders may be 0.55–0.60, not at the current high.
This rise is mostly because of market betting, not big news. iExec has no major news this week. Futures open interest is near 59 million, about three-fourths of the total market cap. Short bets are now more than long bets. This can cause big moves, but it is also very unstable. Market cap is only around 78 million, so liquidity is thin. Low-cap coins can go up fast and come down fast. So trade with small size, use stop loss, and don’t chase green candles without a clear plan.
#RLCpriceprediction $RLC
{future}(RLCUSDT)
RLC Price Alert!
RLC is near 1.03 today. It jumped more than 136% in 24 hours. Before this, it was moving slowly between 0.35 and 0.39 for a week. Then it broke up very fast. Many traders who bet against it were forced to buy, so the price shot up. Total futures bets rose over 1,175% in one day. Funding was negative, meaning short sellers were trapped. RSI near 90 means it is very hot and overbought. Price is far above its normal range, so a quick fall can happen. First resistance is 0.79. If it breaks 0.80 with strong buying, it can go to 0.85–1.00.
Tomorrow, the main question is: can RLC stay up, or will it run out of power? If buyers protect 0.70, price can rest and then try 0.85 or even 1.00. If 0.70 breaks, support is around 0.55. After that, support is 0.39–0.40, where the rally started. Trend signals are still strong, but buying now is risky because price already moved too fast. A better entry for traders may be 0.55–0.60, not at the current high.
This rise is mostly because of market betting, not big news. iExec has no major news this week. Futures open interest is near 59 million, about three-fourths of the total market cap. Short bets are now more than long bets. This can cause big moves, but it is also very unstable. Market cap is only around 78 million, so liquidity is thin. Low-cap coins can go up fast and come down fast. So trade with small size, use stop loss, and don’t chase green candles without a clear plan.
#RLCpriceprediction $RLC
447
·
--
Рост
Eth Price Analysis!!
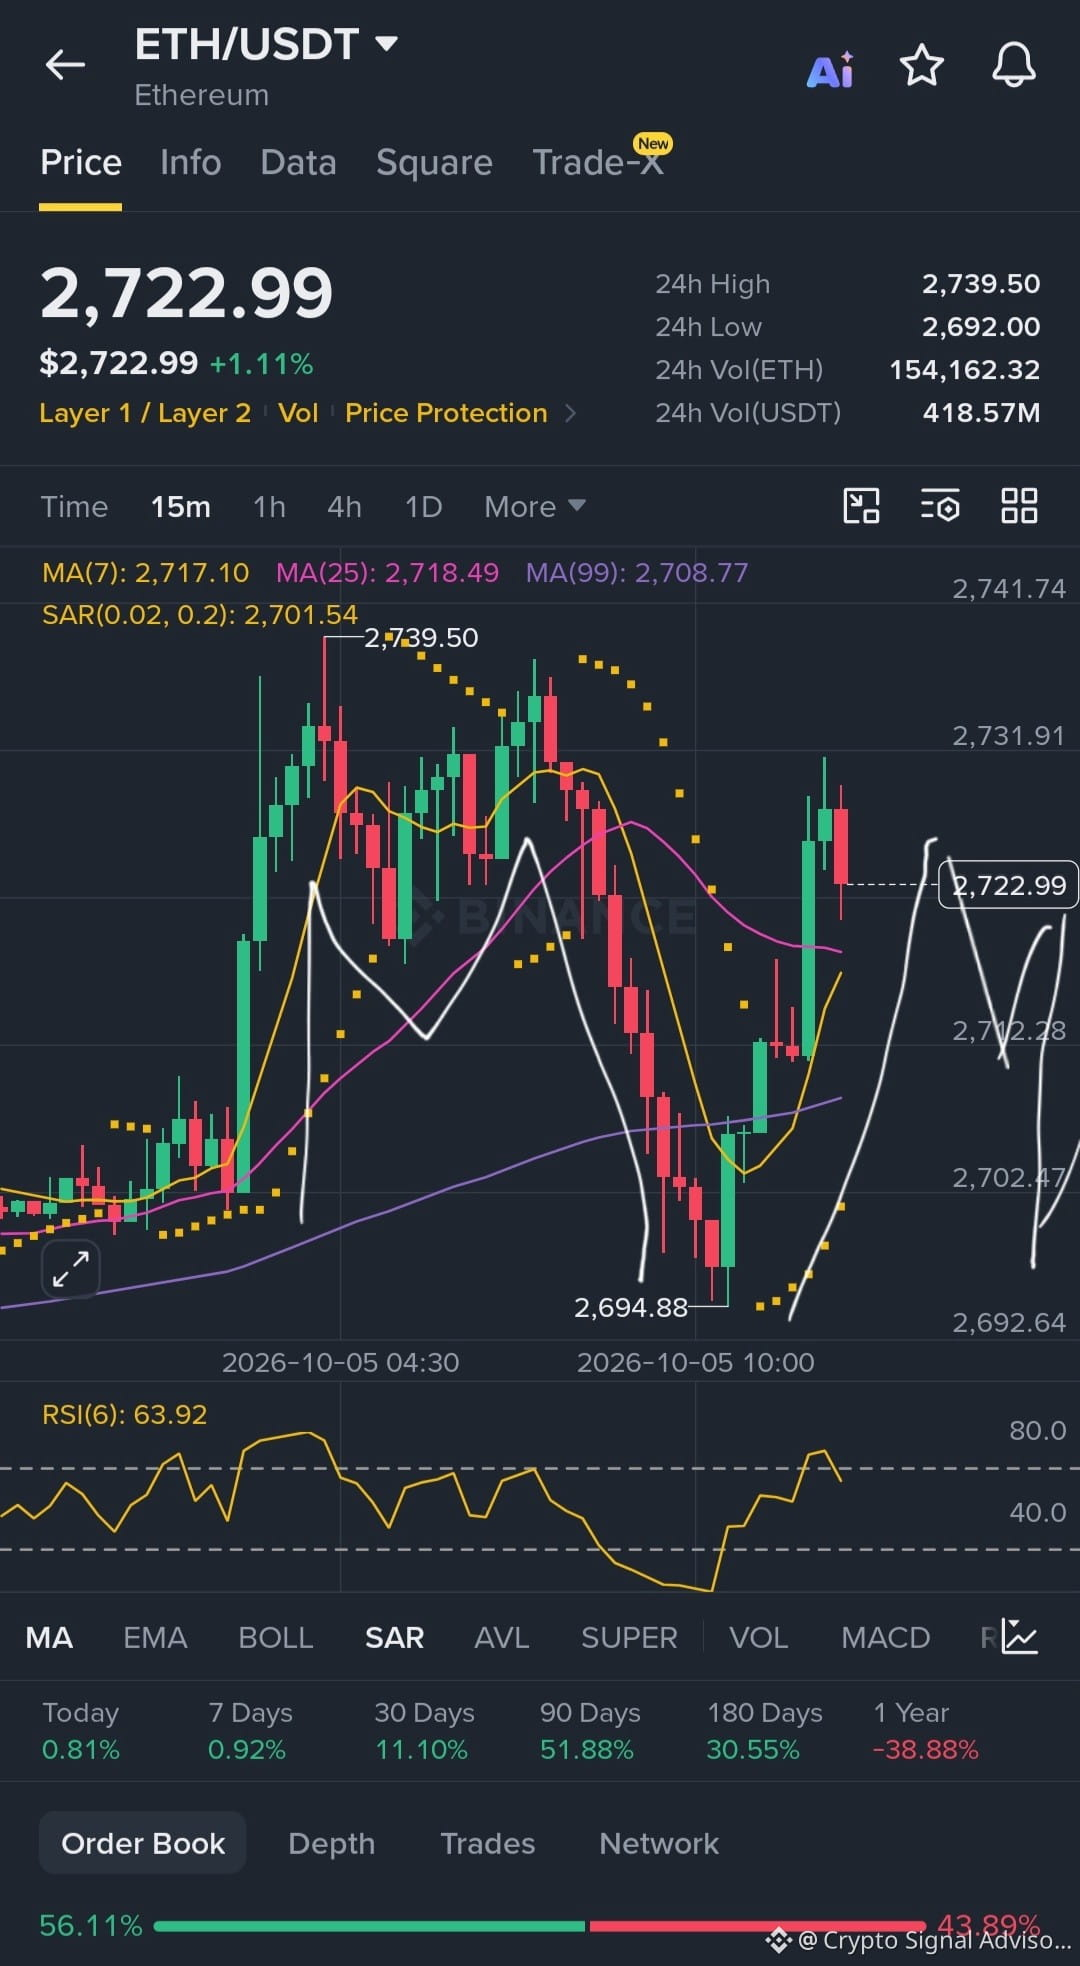
Ethereum is trading near 2,712 today, up about 0.6% in 24 hours after rebounding from an intraday low of 2,691. The price is holding above the key psychological support at 2,700, but it remains stuck below the 2,680–2,770 resistance zone that has capped gains for over a week. The 20-day EMA at 2,616 is the first major support on the downside, followed by the 50-day EMA at 2,445. The daily RSI is neutral, while the ADX at 41 shows the medium-term uptrend still has strength. For today, watch whether ETH can close above the pivot at 2,702, as holding above that level would keep the short-term bias tactically bullish.
Tomorrow, all eyes are on the Glamsterdam upgrade activation on the Sepolia testnet, expected around October 6. This upgrade focuses on Layer-1 scaling and gas efficiency, and the market sees it as a potential catalyst for a push toward 2,775 and then 3,000. A decisive daily close above 2,770 would open the door to the 2,800–2,830 region, where a large cluster of short liquidations sits. However, if the testnet launch disappoints or ETH loses the 2,640 consolidation low, the next supports are 2,617, 2,576, and then the 2,445–2,484 demand zone. The ATR of 85 means single-day swings of 85–170 are realistic, so tomorrow could see a move to either 2,754 or 2,576 if a directional trigger appears.
The broader picture is mixed. On the positive side, ETH ETFs still hold a net inflow of 41,041 ETH over the past seven days, and a whale recently withdrew 1,420 ETH and staked it via Lido. The 100-day EMA remains above the 200-day EMA, preserving a bullish medium-term structure. On the negative side, Ethereum ETFs saw a weekly net outflow of 138 million last week, with Fidelity's FETH shedding 74 million. MetaMask also began exiting roughly 523,000 ETH worth of validators after a security breach, and retail long positioning is crowded at 74.6%, which raises the risk of a long squeeze if support breaks.
Thankyou
#ETH🔥🔥🔥🔥🔥🔥 #EthereumValidatorExitQueueJumps392% $ETH
{future}(ETHUSDT)
Eth Price Analysis!!
Ethereum is trading near 2,712 today, up about 0.6% in 24 hours after rebounding from an intraday low of 2,691. The price is holding above the key psychological support at 2,700, but it remains stuck below the 2,680–2,770 resistance zone that has capped gains for over a week. The 20-day EMA at 2,616 is the first major support on the downside, followed by the 50-day EMA at 2,445. The daily RSI is neutral, while the ADX at 41 shows the medium-term uptrend still has strength. For today, watch whether ETH can close above the pivot at 2,702, as holding above that level would keep the short-term bias tactically bullish.
Tomorrow, all eyes are on the Glamsterdam upgrade activation on the Sepolia testnet, expected around October 6. This upgrade focuses on Layer-1 scaling and gas efficiency, and the market sees it as a potential catalyst for a push toward 2,775 and then 3,000. A decisive daily close above 2,770 would open the door to the 2,800–2,830 region, where a large cluster of short liquidations sits. However, if the testnet launch disappoints or ETH loses the 2,640 consolidation low, the next supports are 2,617, 2,576, and then the 2,445–2,484 demand zone. The ATR of 85 means single-day swings of 85–170 are realistic, so tomorrow could see a move to either 2,754 or 2,576 if a directional trigger appears.
The broader picture is mixed. On the positive side, ETH ETFs still hold a net inflow of 41,041 ETH over the past seven days, and a whale recently withdrew 1,420 ETH and staked it via Lido. The 100-day EMA remains above the 200-day EMA, preserving a bullish medium-term structure. On the negative side, Ethereum ETFs saw a weekly net outflow of 138 million last week, with Fidelity's FETH shedding 74 million. MetaMask also began exiting roughly 523,000 ETH worth of validators after a security breach, and retail long positioning is crowded at 74.6%, which raises the risk of a long squeeze if support breaks.
Thankyou
#ETH🔥🔥🔥🔥🔥🔥 #EthereumValidatorExitQueueJumps392% $ETH
185
·
--
Рост
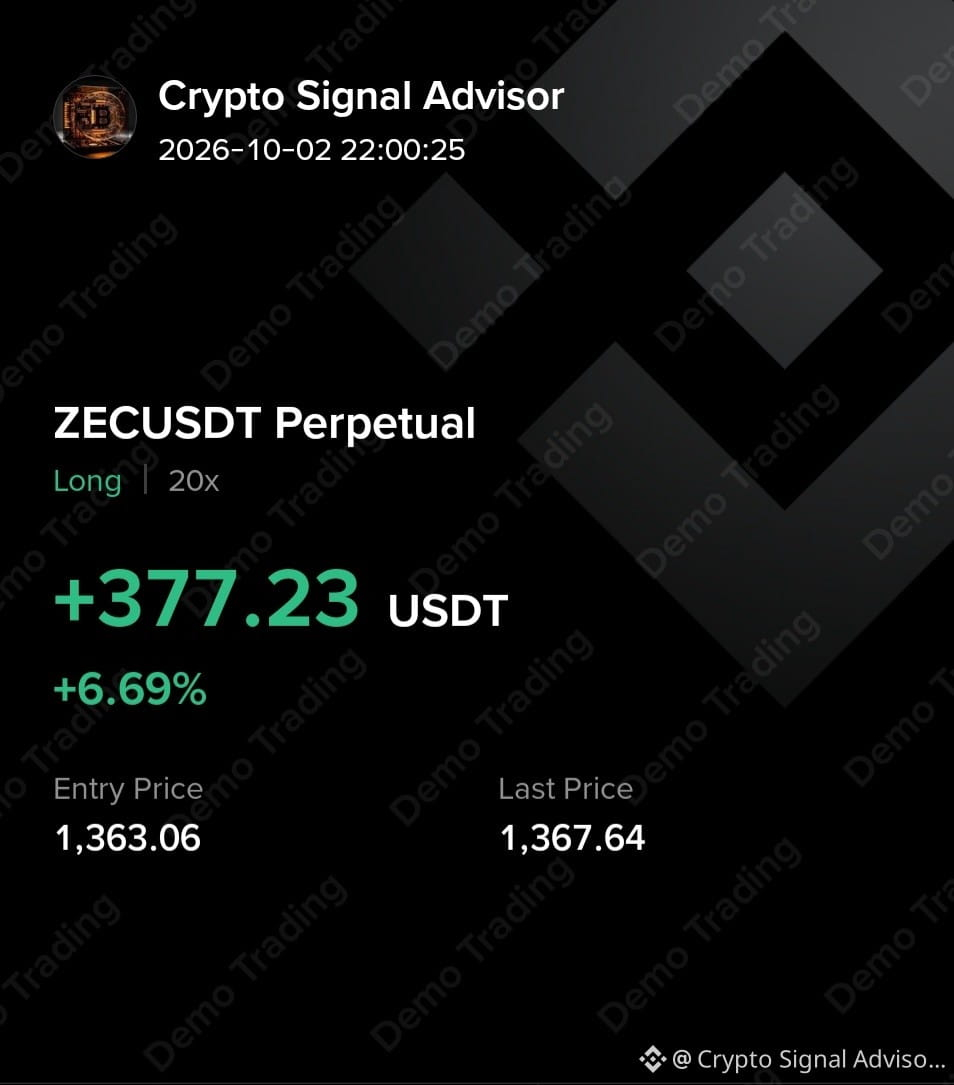
Zcash Price Analysis & trade signals!
Zcash is trading near 1,330 today, up about 2% in 24 hours after bouncing off the 200 EMA at 1,278.34. The price had fallen roughly 20% from its September peak of 1,680, but the latest candle pushed above a falling channel, signaling a possible short-term reversal. The daily RSI has cooled to neutral levels around 50, meaning the coin is neither overbought nor oversold right now. Immediate resistance sits at 1,355, and a clean break above that level could open the door to 1,400–1,450. On the downside, the critical support zone remains 1,280–1,330, a range where buyers have repeatedly stepped in.
For tomorrow, all eyes are on the NU7 testnet activation, expected around October 6, which will cut block times from 75 seconds to 25 seconds. If the testnet launch goes smoothly, it could give bulls the confidence to push ZEC back toward 1,400–1,450, with 1,500 and the previous 1,680 peak as longer-term targets. However, if the price fails to hold above 1,280, the next major support sits between 1,150 and 1,200, and a break below that zone would shift the medium-term outlook bearish. Traders should also watch whether ZEC can reclaim the 1,400 level, as holding above it would confirm that the correction is over and a new leg higher is underway.
The broader picture is mixed. Grayscale's spot Zcash ETF just recorded its first week of net outflows, shedding 93.56 million, which erased roughly 30% of the fund's inflows since its August debut. That said, Grayscale Research still holds a long-term bullish view, arguing that demand for privacy-preserving technology will grow as AI surveillance expands. On the positive side, THORChain activated its Zcash liquidity pool on October 2, adding a new venue for ZEC liquidity. The 50-day EMA remains above the 200-day EMA, keeping the medium-term trend intact, but if outflows continue and the NU7 testnet disappoints, the current support zone could come under serious pressure.
Thankyou
#ZECUSDT $ZEC
{future}(ZECUSDT)
Zcash Price Analysis & trade signals!
Zcash is trading near 1,330 today, up about 2% in 24 hours after bouncing off the 200 EMA at 1,278.34. The price had fallen roughly 20% from its September peak of 1,680, but the latest candle pushed above a falling channel, signaling a possible short-term reversal. The daily RSI has cooled to neutral levels around 50, meaning the coin is neither overbought nor oversold right now. Immediate resistance sits at 1,355, and a clean break above that level could open the door to 1,400–1,450. On the downside, the critical support zone remains 1,280–1,330, a range where buyers have repeatedly stepped in.
For tomorrow, all eyes are on the NU7 testnet activation, expected around October 6, which will cut block times from 75 seconds to 25 seconds. If the testnet launch goes smoothly, it could give bulls the confidence to push ZEC back toward 1,400–1,450, with 1,500 and the previous 1,680 peak as longer-term targets. However, if the price fails to hold above 1,280, the next major support sits between 1,150 and 1,200, and a break below that zone would shift the medium-term outlook bearish. Traders should also watch whether ZEC can reclaim the 1,400 level, as holding above it would confirm that the correction is over and a new leg higher is underway.
The broader picture is mixed. Grayscale's spot Zcash ETF just recorded its first week of net outflows, shedding 93.56 million, which erased roughly 30% of the fund's inflows since its August debut. That said, Grayscale Research still holds a long-term bullish view, arguing that demand for privacy-preserving technology will grow as AI surveillance expands. On the positive side, THORChain activated its Zcash liquidity pool on October 2, adding a new venue for ZEC liquidity. The 50-day EMA remains above the 200-day EMA, keeping the medium-term trend intact, but if outflows continue and the NU7 testnet disappoints, the current support zone could come under serious pressure.
Thankyou
#ZECUSDT $ZEC
414
Войдите, чтобы посмотреть больше материала
Присоединяйтесь к пользователям криптовалют по всему миру на Binance Square
⚡️ Получайте новейшую и полезную информацию о криптоактивах.
💬 Нам доверяет крупнейшая в мире криптобиржа.
👍 Получите достоверные аналитические данные от верифицированных создателей контента.
Эл. почта/номер телефона
В тренде
FedWatch
Просмотров: 16.4M
39,825 обсуждают
🚨 🇺🇸 PETER SCHIFF JUST THREW A BIG WARNING AT THE FED!
Peter Schiff is calling Kevin Warsh’s tough talk on inflation a “bluff,” and his prediction could have major implications for the markets.
Schiff believes the Fed could eventually return to money printing through quantitative easing (QE) and even cut interest rates next year, despite inflation continuing to rise.
Think about that for a moment.
🔥 Inflation could remain a problem. 🔥 The Fed could still move toward easier monetary policy. 🔥 More liquidity could flow into financial markets.
If this scenario plays out, it could create a very different market environment for stocks, gold, Bitcoin, and the wider crypto market.
But there’s a catch: if inflation stays high, the Fed could face a difficult choice between fighting rising prices and supporting the economy.
Will Warsh stick to a tough inflation policy, or will the Fed eventually change direction?
The next move could matter a lot for investors.
#FedWatch #EarningsSeason #USMidtermElections #BrazilCryptoExchangesMustApplyForLicensesByFriday #StanDruckenmillerBecomesInvestorInTradeXYZ
Jackson Liam
·Лайков: 4
·Просмотров: 8.9k
EarningsSeason
Просмотров: 6.5M
32,526 обсуждают
USMidtermElections
Просмотров: 66,430
835 обсуждают