

Global_Crypto_Research
2.5k Публикации

Global_Crypto_Research
Отправить жалобу
Заблокировать пользователя
🌍 GlobalCryptoResearch | Daily Crypto Analysis | Spot & Futures Trade Setups | Technical Analysis | Market Insights | Risk Management | DYOR
147 подписок(и/а)
258 подписчиков(а)
1.2K+ понравилось
Посты
Все
Цитирования
Видео
Активно
Gooooooooooooooooo
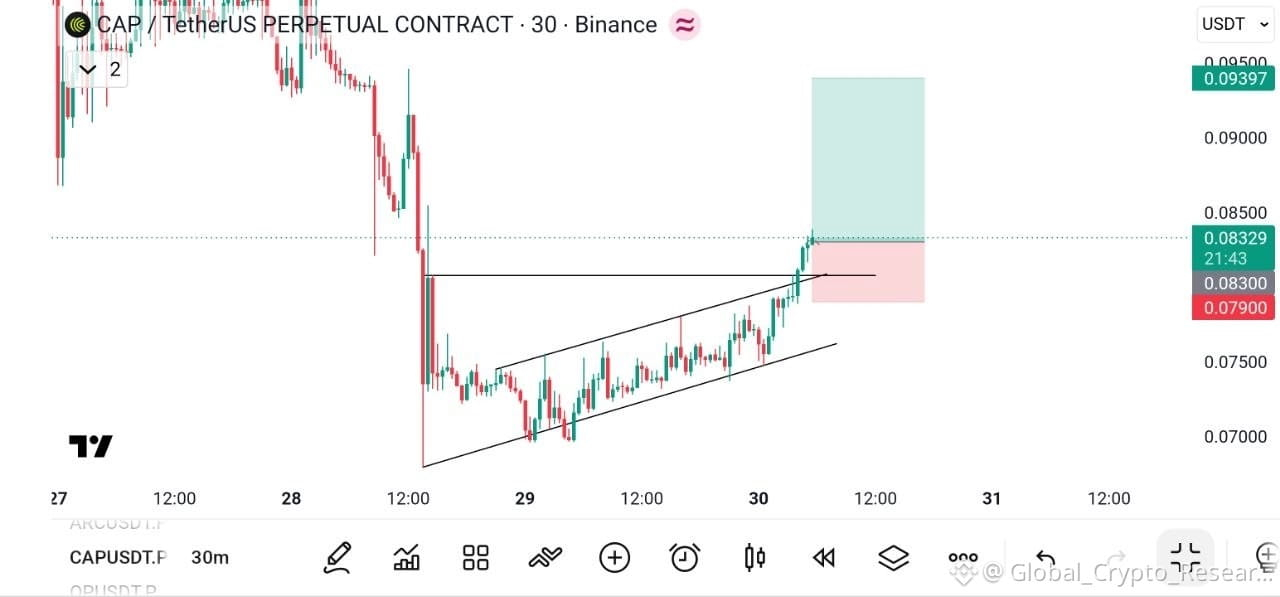
Coin $CAP
{future}(CAPUSDT)
Position: LONG
Leverage: Cross 20×
Entries: 0.0830 - 0.0810
Targets: 🎯 0.0860, 0.0895, 0.0940
Stop Loss: 0.0790 below
#BinanceSquareFamily
Gooooooooooooooooo
Coin $CAP
Position: LONG
Leverage: Cross 20×
Entries: 0.0830 - 0.0810
Targets: 🎯 0.0860, 0.0895, 0.0940
Stop Loss: 0.0790 below
#BinanceSquareFamily
Coin $CAP
Position: LONG
Leverage: Cross 20×
Entries: 0.0830 - 0.0810
Targets: 🎯 0.0860, 0.0895, 0.0940
Stop Loss: 0.0790 below
#BinanceSquareFamily
38
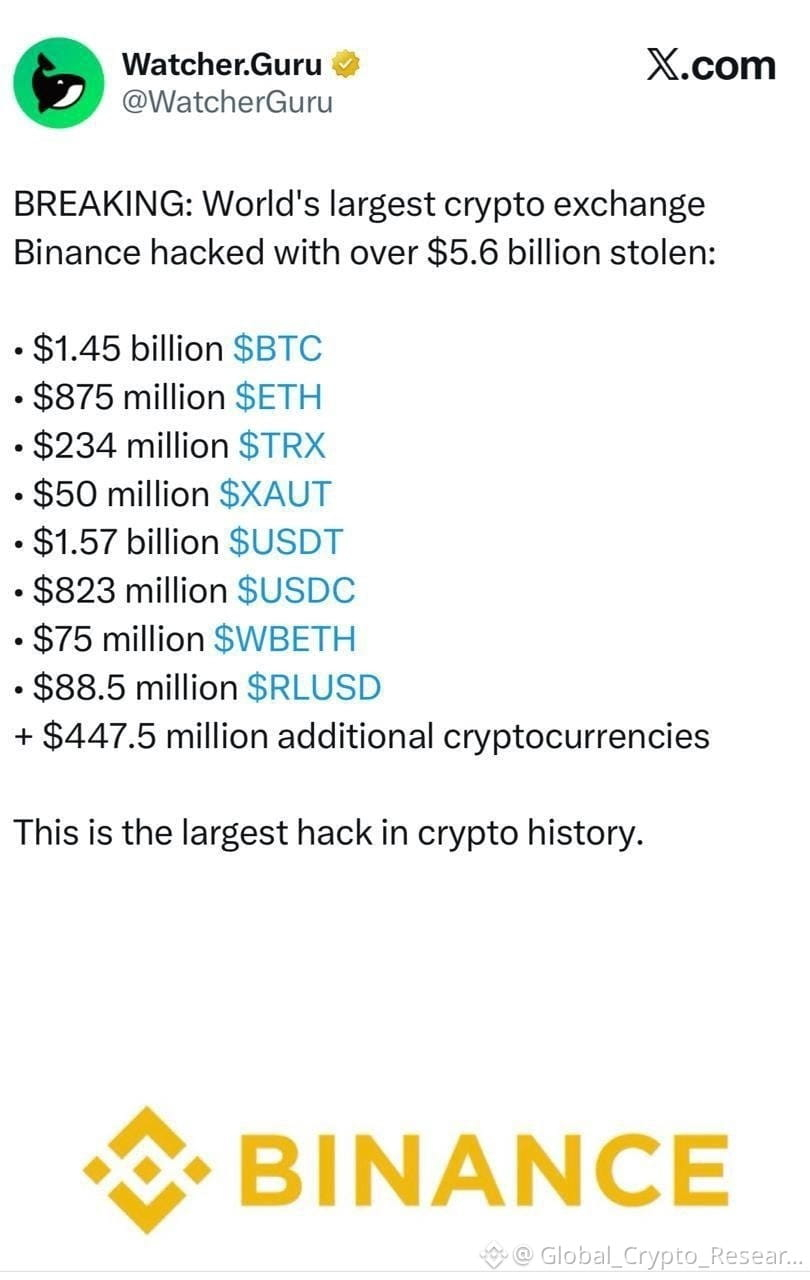
Is it true??if yes plz don't panic your funds are safu $BTC $ETH $SOL
Is it true??if yes plz don't panic your funds are safu $BTC $ETH $SOL
45
🔥 $MAGMA
{future}(MAGMAUSDT)
Is Up 11% #FedWatch Can Buyers Break the $0.2994 Barrier?
$MAGMA is trading near $0.29057, up 11.16% in 24 hours, after recovering from the $0.25762 low. Buyers are approaching the $0.29942 resistance zone, which could decide the next move. 📊
A confirmed breakout above $0.29942 could open the way toward $0.30598. If momentum fades, the $0.28000 area is worth monitoring, followed by support near $0.27394. 🤝💎
RSI readings are around 58–62, showing positive momentum without the extreme overbought conditions seen in some recent rallies. Watch for a strong candle close and sustained volume before assuming the breakout will hold. 🚀
🔥 $MAGMA
Is Up 11% #FedWatch Can Buyers Break the $0.2994 Barrier?
$MAGMA is trading near $0.29057, up 11.16% in 24 hours, after recovering from the $0.25762 low. Buyers are approaching the $0.29942 resistance zone, which could decide the next move. 📊
A confirmed breakout above $0.29942 could open the way toward $0.30598. If momentum fades, the $0.28000 area is worth monitoring, followed by support near $0.27394. 🤝💎
RSI readings are around 58–62, showing positive momentum without the extreme overbought conditions seen in some recent rallies. Watch for a strong candle close and sustained volume before assuming the breakout will hold. 🚀
157
🛢️ $BTC $ETH OIL NEAR $115! THE INFLATION RISK IS NOT DISAPPEARING!
Crypto traders often focus on Bitcoin's chart and forget that energy prices can influence the entire financial system.
On October 29, Brent crude settled near $114.88 per barrel, while US crude closed around $102.00. Prices eased slightly amid reports of renewed diplomatic efforts, but geopolitical supply concerns remained unresolved.
Here is the connection: expensive oil can increase transportation and production costs. If energy prices remain elevated, inflation could become harder to control. That may influence interest-rate expectations and investor demand for riskier assets.
📈 Positive possibility: Oil prices cool, inflation concerns ease, and risk appetite improves.
📉 Negative possibility: Supply disruptions intensify and financial markets become more defensive.
💡 Pro Tip: Follow oil prices alongside Treasury yields and Bitcoin volume. These indicators can provide useful context before entering a trade.
One headline does not decide the market. The bigger economic picture matters.
Educational commentary, not financial advice.
408
🔥 $AIAV Is Up Nearly 12% Can Buyers Break $0.000642?
$AIAV is trading near $0.000609, up 11.74% in 24 hours, and moving toward the $0.000642 resistance zone. Buyers are showing some recovery, but the next move depends on whether they can push through this barrier. 📊
A confirmed breakout above $0.000642 could open the way toward $0.000670. If momentum fades, the $0.000574 area is worth watching, followed by support near $0.000543. 🤝💎
The price is approaching resistance, so a rejection could trigger a pullback. Watch for a strong candle close and increased volume before assuming the rally will continue. 🚀$SOL
3
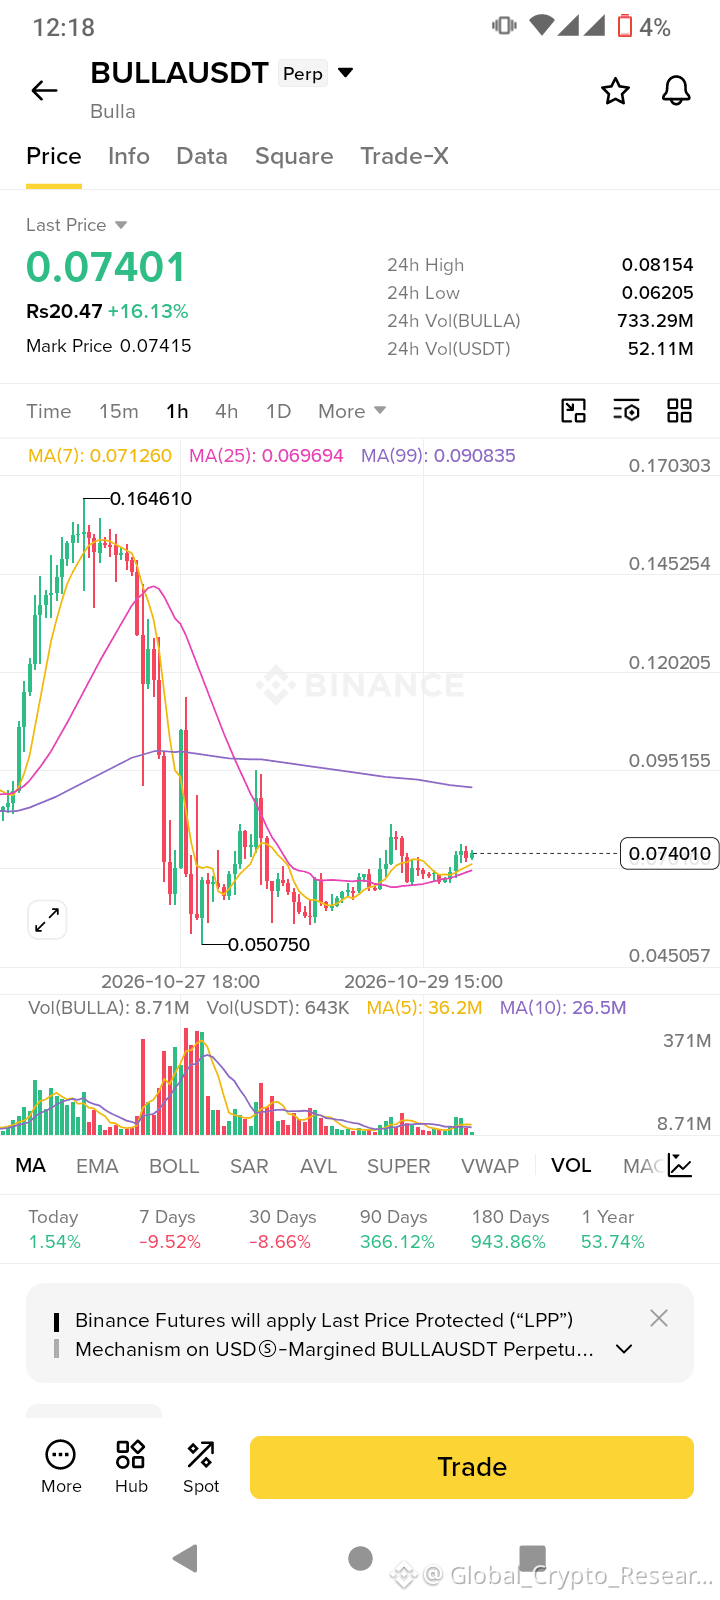
Alert 🔥 BULLA Is Up 16% Can Buyers Reclaim $0.0815?
$BULLA is trading near $0.07401, up 16.13% in 24 hours, after rebounding from the $0.06205 low. Buyers are pushing the price higher, but the $0.08154 daily high remains the key resistance to watch. 📊
A sustained move above $0.08154 could open the way toward $0.09515. If momentum weakens, the $0.07126 area is worth monitoring, followed by support near $0.06969. 🤝💎
The price is above the 7-period and 25-period moving averages, suggesting short-term recovery, but remains below the 99-period average near $0.09084. Watch for confirmation and volume before assuming the rally will continue. 🚀$HYPE
{spot}(HYPEUSDT)
$BULLA
{future}(BULLAUSDT)
#EarningsSeason
Alert 🔥 BULLA Is Up 16% Can Buyers Reclaim $0.0815?
$BULLA is trading near $0.07401, up 16.13% in 24 hours, after rebounding from the $0.06205 low. Buyers are pushing the price higher, but the $0.08154 daily high remains the key resistance to watch. 📊
A sustained move above $0.08154 could open the way toward $0.09515. If momentum weakens, the $0.07126 area is worth monitoring, followed by support near $0.06969. 🤝💎
The price is above the 7-period and 25-period moving averages, suggesting short-term recovery, but remains below the 99-period average near $0.09084. Watch for confirmation and volume before assuming the rally will continue. 🚀$HYPE
$BULLA
#EarningsSeason
251
🔥 $MERL
{future}(MERLUSDT)
Is Up 13%....Can Buyers Push Beyond $0.02988?
$MERL is trading near $0.02956, up 13.00% in 24 hours, and approaching its $0.02988 resistance after a strong upward move. Buyers are showing momentum, but the next resistance could be a key test. 📊
A confirmed breakout above $0.02988 could open the way toward $0.03048. If momentum fades, the $0.02914 area is worth watching, followed by support near $0.02755 and $0.02466. 🤝💎
RSI(6) is above 91, signaling an overheated short-term move. A pullback is possible, so watch for a confirmed candle close and sustained volume before assuming the rally will continue. 🚀Dyor
🔥 $MERL
Is Up 13%....Can Buyers Push Beyond $0.02988?
$MERL is trading near $0.02956, up 13.00% in 24 hours, and approaching its $0.02988 resistance after a strong upward move. Buyers are showing momentum, but the next resistance could be a key test. 📊
A confirmed breakout above $0.02988 could open the way toward $0.03048. If momentum fades, the $0.02914 area is worth watching, followed by support near $0.02755 and $0.02466. 🤝💎
RSI(6) is above 91, signaling an overheated short-term move. A pullback is possible, so watch for a confirmed candle close and sustained volume before assuming the rally will continue. 🚀Dyor
116
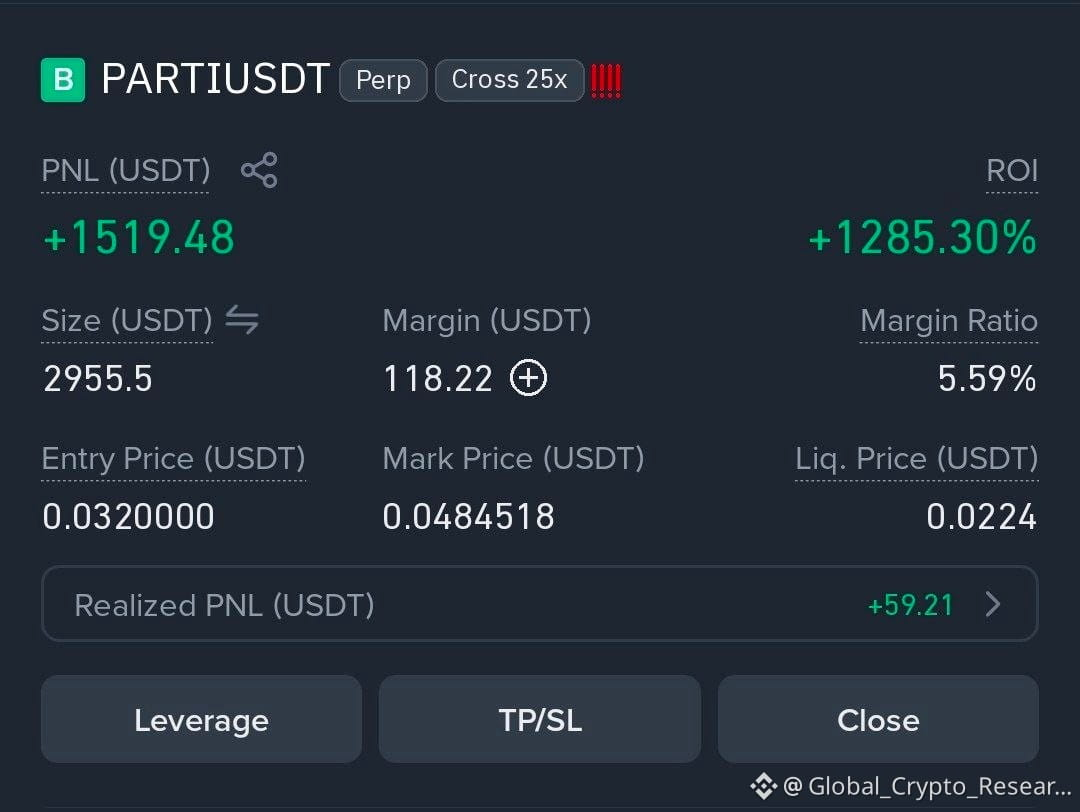
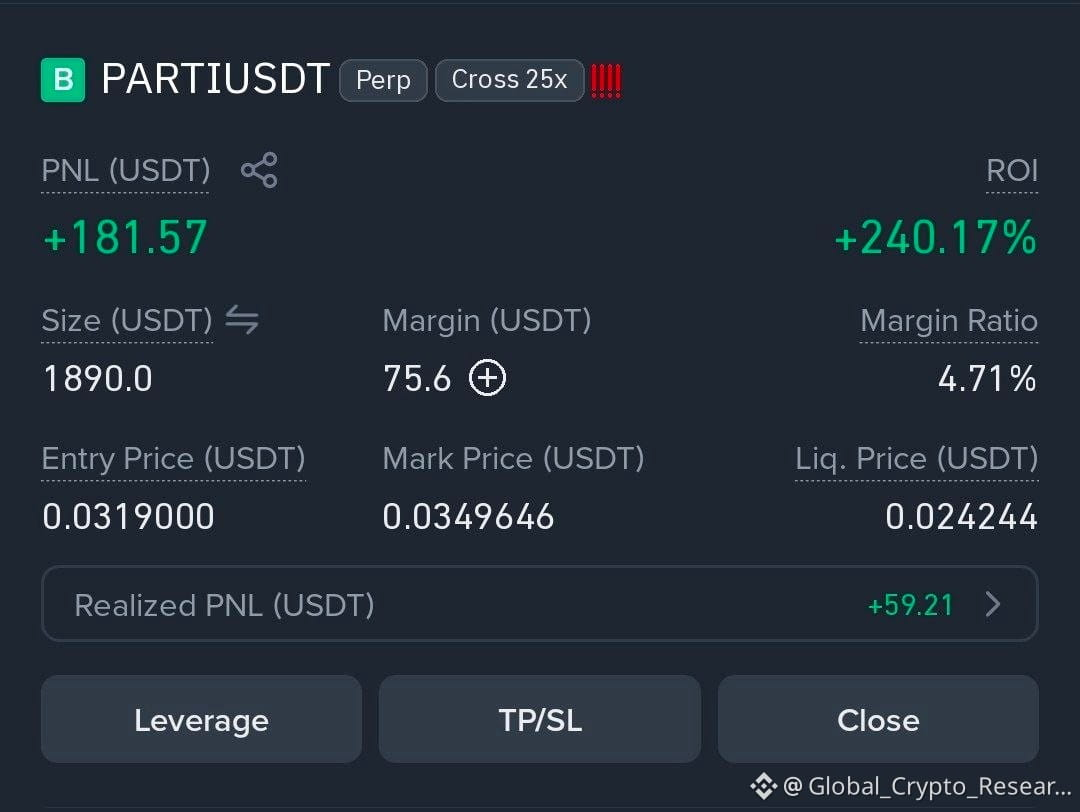
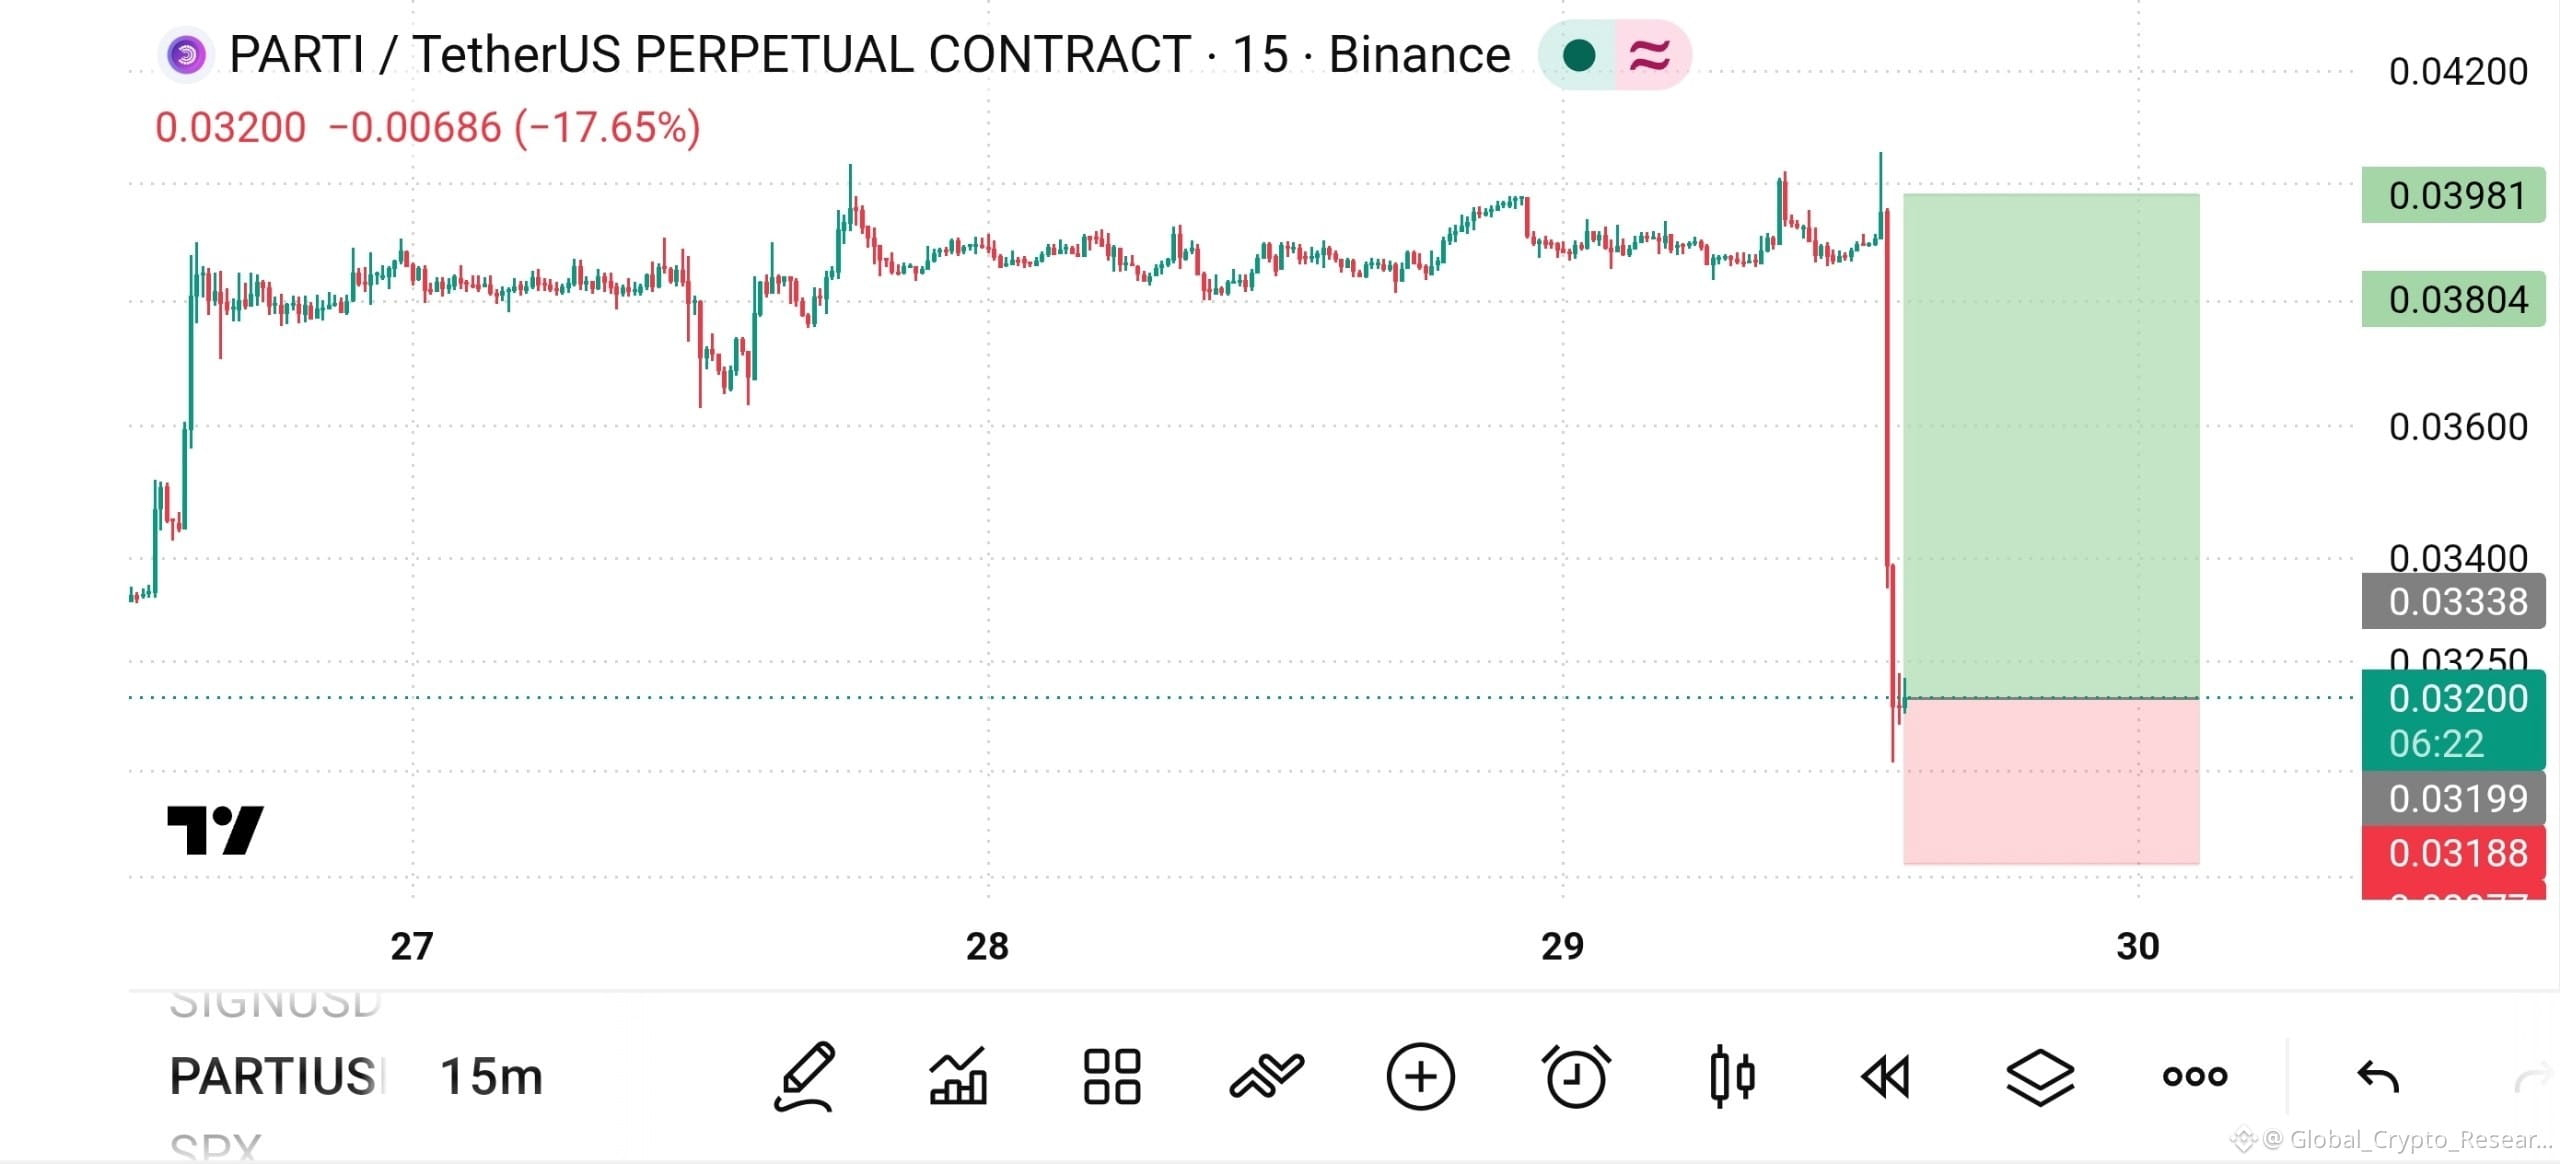
🪙 $PARTI $PARTI
{future}(PARTIUSDT)
💵 Profit: +240.17% 🔥
📊 Clean Setup • Real Results
👑 REAL UPDATES
#FedWatch #EarningsSeason
🪙 $PARTI $PARTI
💵 Profit: +240.17% 🔥
📊 Clean Setup • Real Results
👑 REAL UPDATES
#FedWatch #EarningsSeason
💵 Profit: +240.17% 🔥
📊 Clean Setup • Real Results
👑 REAL UPDATES
#FedWatch #EarningsSeason
Global_Crypto_Research
·
--
$PARTI
LONG
USE LOW MARGIN dyor
LONG
USE LOW MARGIN dyor
3
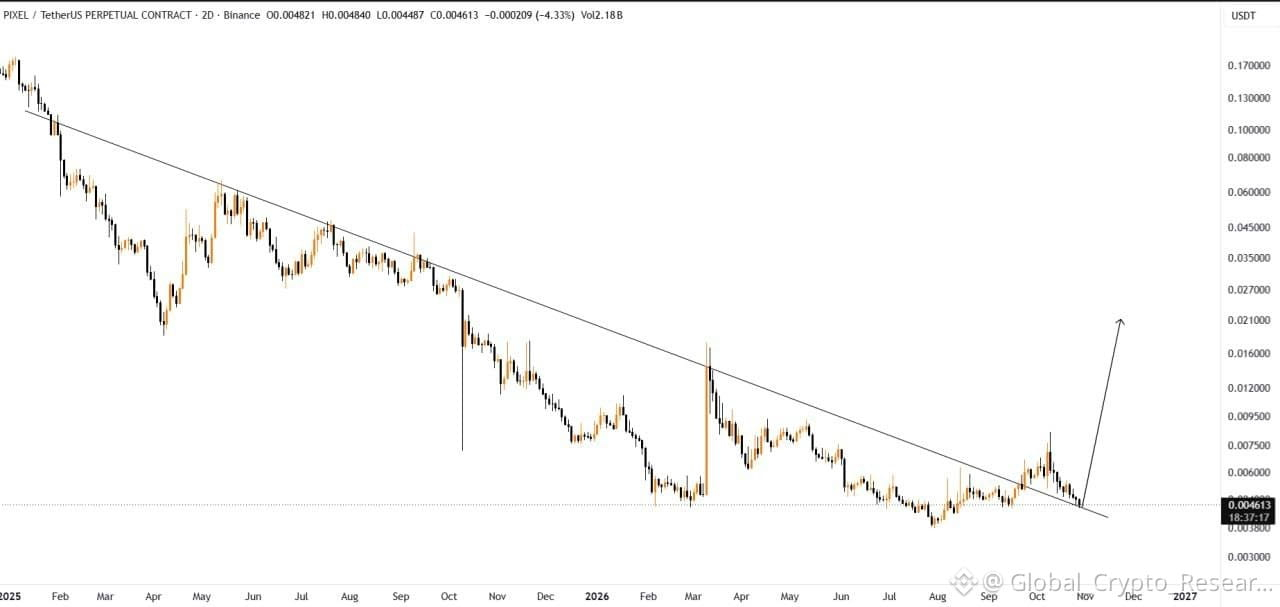
$PIXEL
{spot}(PIXELUSDT)
A successful retest of the trendline will provide a strong bullish rally
$PIXEL
A successful retest of the trendline will provide a strong bullish rally
A successful retest of the trendline will provide a strong bullish rally
3
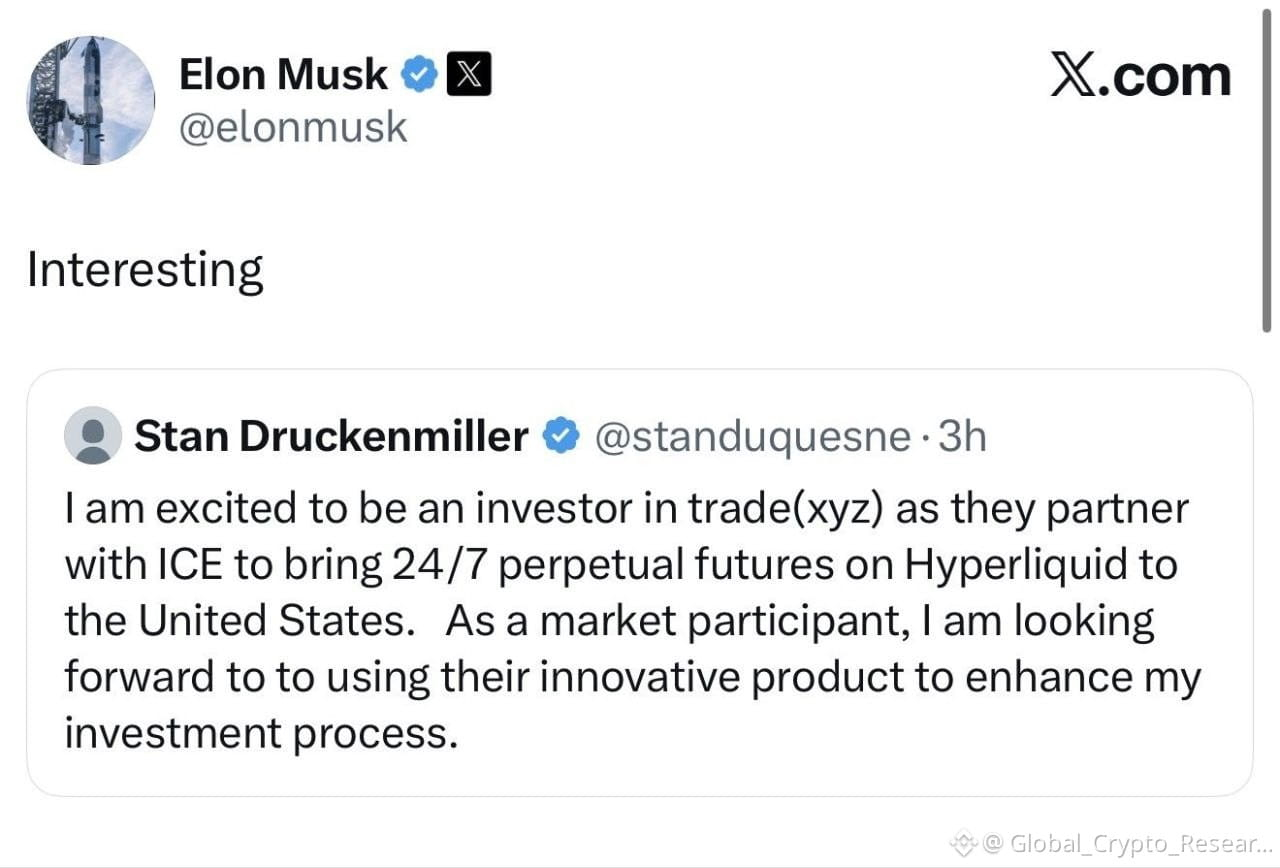
JUST IN: Elon Musk reacts to billionaire investor Stan Druckenmiller backing 24/7 Hyperliquid $HYPE
{future}(HYPEUSDT)
futures trading in the US:
"Interesting"
JUST IN: Elon Musk reacts to billionaire investor Stan Druckenmiller backing 24/7 Hyperliquid $HYPE
futures trading in the US:
"Interesting"
futures trading in the US:
"Interesting"
10
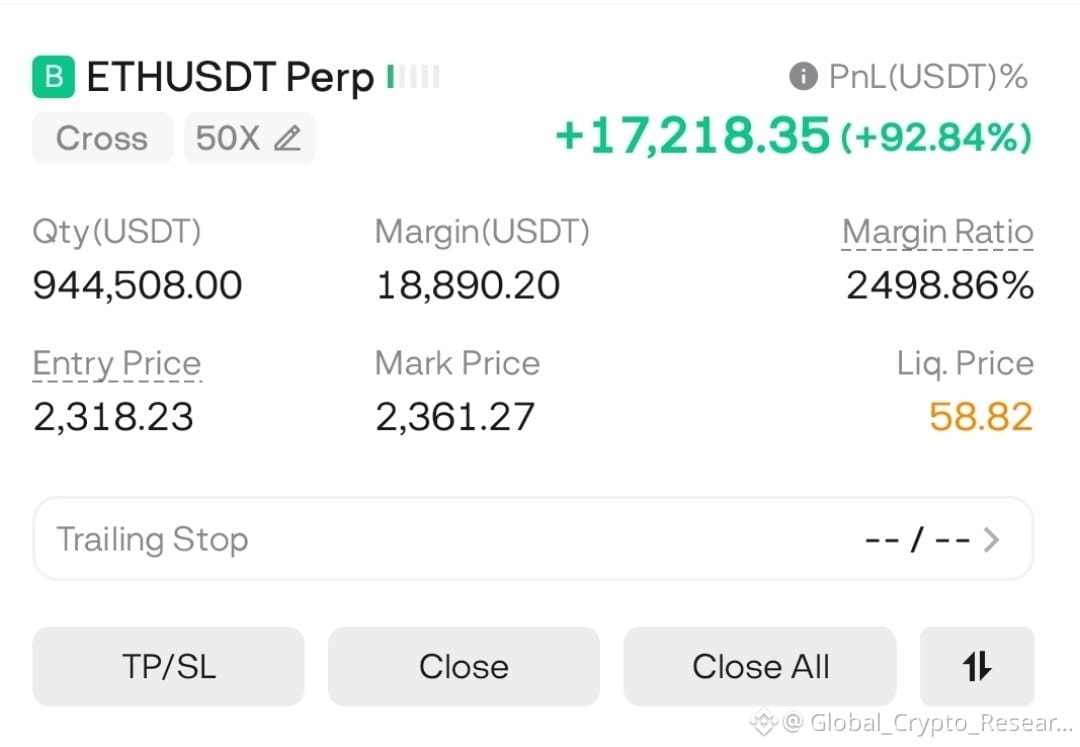
✅ $ETH
{future}(ETHUSDT)
Target 1 HIT!
💰+92% Profit !
My family keep in touch
✅ $ETH
Target 1 HIT!
💰+92% Profit !
My family keep in touch
Target 1 HIT!
💰+92% Profit !
My family keep in touch
Global_Crypto_Research
·
--
🟢 LONG $ETH
✅ Entry: 2315
🎯 TP: 2350 - 2380 - 2420 - 2470
🛑 SL: 2248 below #CanMicrosoftDeliverOnAI #EarningsSeason
✅ Entry: 2315
🎯 TP: 2350 - 2380 - 2420 - 2470
🛑 SL: 2248 below #CanMicrosoftDeliverOnAI #EarningsSeason
4
$IDOL $APR $SOL #Alert...... Binance Will List Predict (PREDICT) with Seed Tag Applied
Binance will list Predict (PREDICT) and open trading for the PREDICT/USDT, PREDICT/USDC, and PREDICT/TRY spot trading pairs at 2026-10-30 10:00 (UTC).
#Alert!! #ListingDay
$IDOL $APR $SOL #Alert...... Binance Will List Predict (PREDICT) with Seed Tag Applied
Binance will list Predict (PREDICT) and open trading for the PREDICT/USDT, PREDICT/USDC, and PREDICT/TRY spot trading pairs at 2026-10-30 10:00 (UTC).
#Alert!! #ListingDay
Binance will list Predict (PREDICT) and open trading for the PREDICT/USDT, PREDICT/USDC, and PREDICT/TRY spot trading pairs at 2026-10-30 10:00 (UTC).
#Alert!! #ListingDay

6
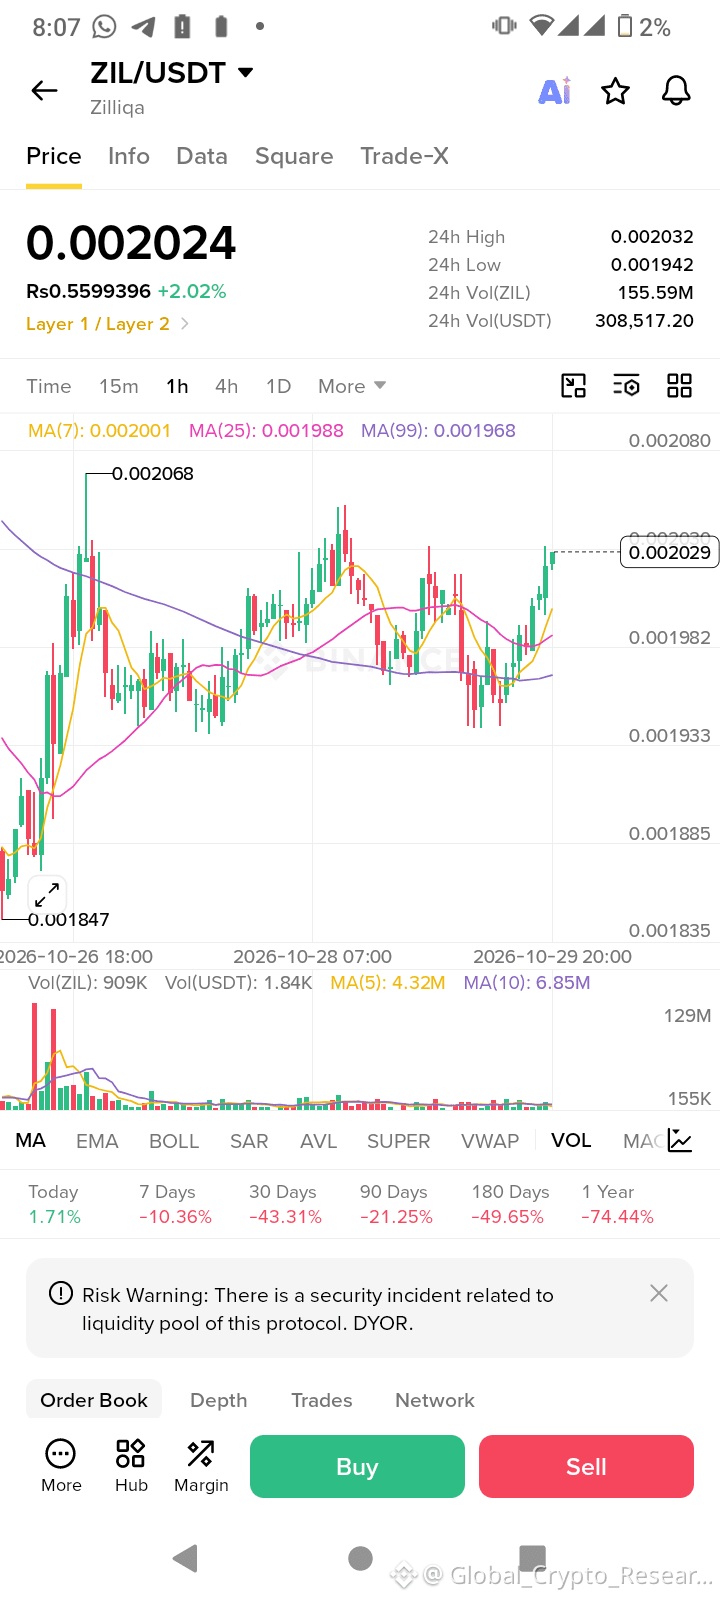
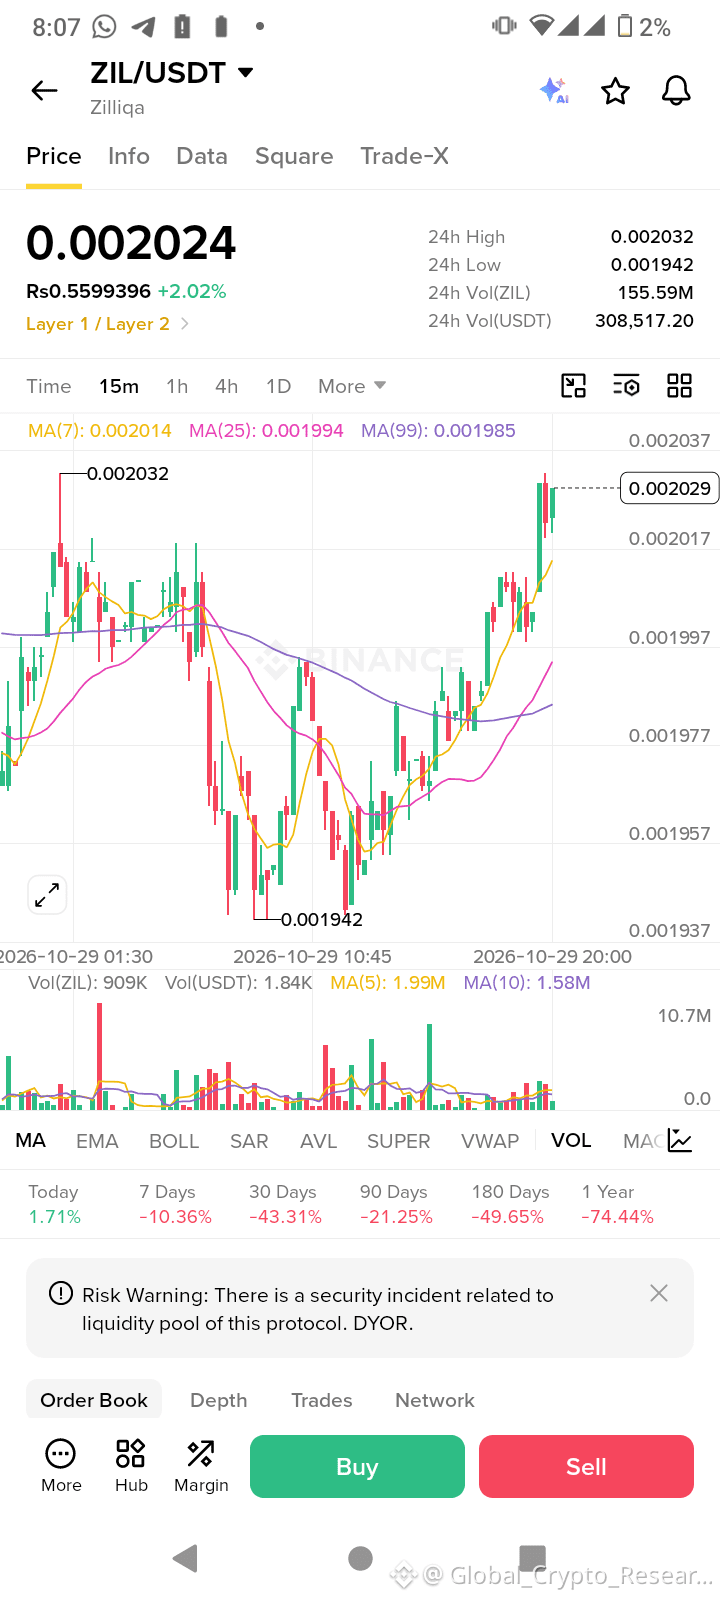
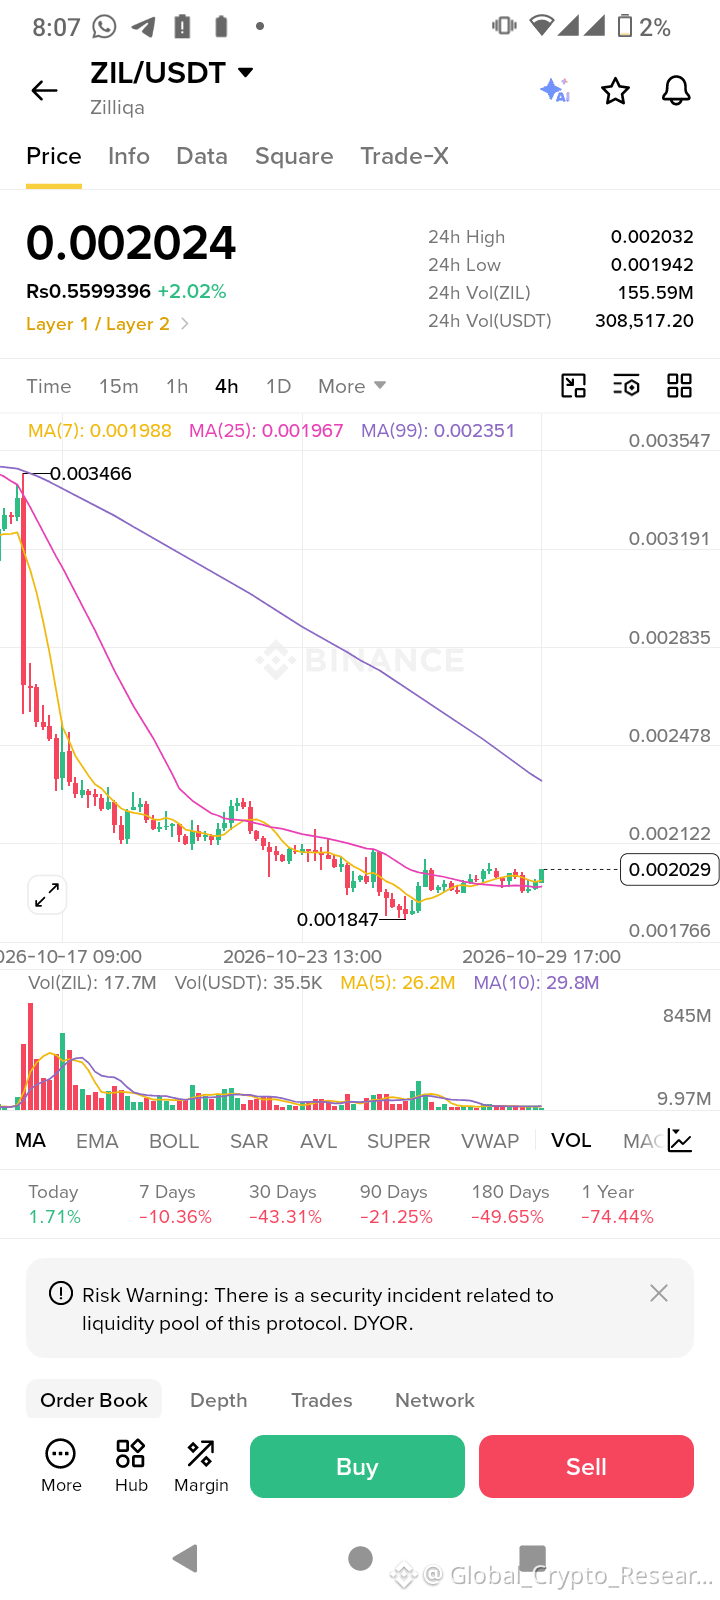
$BTC
{future}(BTCUSDT)
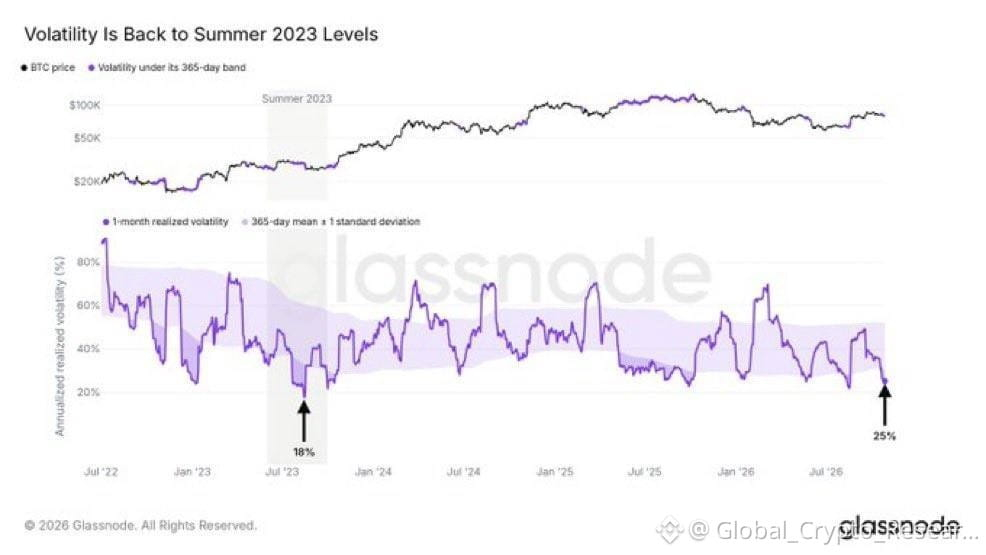
volatility has returned to summer 2023 levels, echoing that year’s sequence of a rally, meme/altcoin frenzy, and subsequent quiet market.😳 Dyor $ON $SOL
{future}(SOLUSDT)
$BTC
volatility has returned to summer 2023 levels, echoing that year’s sequence of a rally, meme/altcoin frenzy, and subsequent quiet market.😳 Dyor $ON $SOL
volatility has returned to summer 2023 levels, echoing that year’s sequence of a rally, meme/altcoin frenzy, and subsequent quiet market.😳 Dyor $ON $SOL
241
🚀 $CETUS
{future}(CETUSUSDT)
#FedWatch /USDT Is Up 15% Can Buyers Break the Next Resistance?
CETUS is trading near $0.02441, up 15.09% in 24 hours. Price is approaching the $0.02457 resistance zone, where the next move could determine whether bullish momentum continues.
📊 Technical View Buyers have pushed the price higher, but resistance is close. A confirmed breakout with stronger volume could support further upside, while rejection may bring a pullback.
🔑 Key Levels
Resistance: $0.02457
Near support: $0.02385
Lower support: $0.02231
Major support: $0.02060
Bullish Scenario: A strong candle close above $0.02457 could open the way toward $0.02515.
Bearish Scenario: Rejection at resistance could send price back toward $0.02385 or $0.02231.
💡 Pro Tip: Avoid chasing a fast rally right under resistance. Wait for a confirmed breakout or a clear retest before making a decision. 📈🤝💎
🚀 $CETUS
#FedWatch /USDT Is Up 15% Can Buyers Break the Next Resistance?
CETUS is trading near $0.02441, up 15.09% in 24 hours. Price is approaching the $0.02457 resistance zone, where the next move could determine whether bullish momentum continues.
📊 Technical View Buyers have pushed the price higher, but resistance is close. A confirmed breakout with stronger volume could support further upside, while rejection may bring a pullback.
🔑 Key Levels
Resistance: $0.02457
Near support: $0.02385
Lower support: $0.02231
Major support: $0.02060
Bullish Scenario: A strong candle close above $0.02457 could open the way toward $0.02515.
Bearish Scenario: Rejection at resistance could send price back toward $0.02385 or $0.02231.
💡 Pro Tip: Avoid chasing a fast rally right under resistance. Wait for a confirmed breakout or a clear retest before making a decision. 📈🤝💎
207
1
1
254
🚨 Bitcoin Rejected Near $81.8K.... Is Another Move Down Coming?
$BTC
{future}(BTCUSDT)
is trading around $80,179, down 0.51% in 24 hours. The 1-hour chart shows a sharp rejection near $81,800, followed by a strong drop and a small sideways recovery.
📊 Technical View: RSI readings are around 44–47, showing relatively weak momentum. Buyers are trying to stabilize the price, but bullish strength is not confirmed yet.
🔑 Key Levels
Resistance: $81,382
Near support: $80,000
Major support: $79,712
Bullish Scenario: BTC regains $80,768 and breaks above $81,382 with stronger volume.
Bearish Scenario: If $80,000 fails to hold, price could retest $79,712.
💡 Pro Tip: Watch the next 1-hour candle close. A small bounce after a sharp drop doesn’t automatically mean a trend reversal. 📉📊🤝
🚨 Bitcoin Rejected Near $81.8K.... Is Another Move Down Coming?
$BTC
is trading around $80,179, down 0.51% in 24 hours. The 1-hour chart shows a sharp rejection near $81,800, followed by a strong drop and a small sideways recovery.
📊 Technical View: RSI readings are around 44–47, showing relatively weak momentum. Buyers are trying to stabilize the price, but bullish strength is not confirmed yet.
🔑 Key Levels
Resistance: $81,382
Near support: $80,000
Major support: $79,712
Bullish Scenario: BTC regains $80,768 and breaks above $81,382 with stronger volume.
Bearish Scenario: If $80,000 fails to hold, price could retest $79,712.
💡 Pro Tip: Watch the next 1-hour candle close. A small bounce after a sharp drop doesn’t automatically mean a trend reversal. 📉📊🤝
16
If the neckline support breaks and $BTC
{future}(BTCUSDT)
confirms the breakdown, a small SHORT opportunity could develop.
If the neckline support breaks and $BTC
confirms the breakdown, a small SHORT opportunity could develop.
confirms the breakdown, a small SHORT opportunity could develop.
16
Войдите, чтобы посмотреть больше материала
Присоединяйтесь к пользователям криптовалют по всему миру на Binance Square
⚡️ Получайте новейшую и полезную информацию о криптоактивах.
💬 Нам доверяет крупнейшая в мире криптобиржа.
👍 Получите достоверные аналитические данные от верифицированных создателей контента.
Эл. почта/номер телефона
В тренде
EarningsSeason
Просмотров: 6.6M
33,023 обсуждают
Earnings Season Session 3: Will Google & Microsoft Beat Earnings Expectations?
Binance Square Official
·Лайков: 184
·Просмотров: 109.7k
USMidtermElections
Просмотров: 83,010
1,080 обсуждают
StrategySTRCReaches$99.95ForFirstTimeIn165Days
Просмотров: 539
31 обсуждают