

Coinspeaker
12.5k Публикации

Coinspeaker
 Square Verified+
Отправить жалобу
Заблокировать пользователя
Coinspeaker
0 подписок(и/а)
71.6K+ подписчиков(а)
107.5K+ понравилось
Посты
·
--
Статья
Bitcoin ETFs Take in $424 Million, but BTC Slips Below $80,000: What Bitcoin News Could November ...U.S. spot Bitcoin exchange-traded funds took in $137.3 million on Wednesday, October 28, their third straight day of inflows, while the Federal Reserve held interest rates at 3.75% to 4% and two of its officials voted for a hike. The buying didn’t hold the price for long. Bitcoin rose to $81,788 after the decision, then fell to $79,710 overnight as a selloff in chip stocks spread to crypto.
BTC trades at $79,899, down 1.2% in 24 hours and 4.4% for October, which is on track to be its second losing October in a row. For traders following Bitcoin news into November, the calendar is crowded: the midterm elections, fresh jobs and inflation data, and a December rate hike that prediction markets now price at 79%.
So what do the ETF flows, the Fed and November’s record say?
The Fed holds steady.
The decision is 10-2.
Lisa Cook and Beth Hammack voted for an increase. pic.twitter.com/nUKDM6n8Zp
— Nick Timiraos (@NickTimiraos) October 28, 2026
DISCOVER: Meme coin supercycle: Top performers this week
Bitcoin News: How Much Have Bitcoin ETFs Taken In This Week?
About $424 million in three sessions. SoSoValue’s daily figures show almost all of it went through BlackRock:
Monday, October 26: $110.3 million, all into BlackRock’s iShares Bitcoin Trust (IBIT).
Tuesday, October 27: $176.0 million, with none of the 12 funds losing money.
Wednesday, October 28: $137.3 million, of which IBIT took $136.0 million and Bitwise’s BITB $1.3 million.
The run follows a rough patch. On October 22 the funds lost $635.6 million in a day, their biggest outflow since June, with IBIT and Fidelity’s FBTC each shedding more than $200 million. Through Monday, October was still about $202 million in the red. The two days since have tipped it slightly positive, by roughly $110 million.
The 12 funds now hold $104.9 billion, about 6.4% of all Bitcoin by value, and have taken in $57.6 billion net since they launched in January 2024. IBIT alone holds $66.1 billion.
What Did the Fed Decide, and How Did Bitcoin React?
A hold, but not a quiet one. The Fed’s statement passed 10–2, with Governor Lisa Cook and Cleveland Fed President Beth Hammack voting for a quarter-point hike. It said the economy is “expanding at a strong pace” and inflation is still too high, and it left the next step to “the accumulation of more information.”
Chair Kevin Warsh gave no hint about December. “I don’t believe in forward guidance, absent exigent circumstances, absent a crisis,” he told reporters, adding that politics “played no role” six days before the midterms. Traders read the dissents as a lean toward tightening. Polymarket’s December market prices a quarter-point hike at 77%, about where it stood before the meeting.
Bitcoin took the decision calmly at first. It traded at $80,860 at 2 p.m. ET and rose 1.1% to $81,788 over the next two hours. The drop came later, during Asian trading, after Samsung’s chip unit missed analysts’ estimates and its shares fell more than 5%, pulling tech stocks lower.
BTC fell to $79,710 by 02:00 UTC, and more than $350 million in leveraged crypto bets were liquidated over 24 hours.
Bitcoin News for November: What Should Traders Expect?
A month of data that will decide whether December’s hike happens. The dates to watch:
Thursday, October 29: September’s PCE inflation and third-quarter GDP at 8:30 a.m. ET, then Coinbase and Strategy earnings after the close.
Friday, October 30: Deribit’s monthly options expiry, with about 135,700 BTC, roughly $10.8 billion, in open contracts.
Tuesday, November 3: the U.S. midterm elections.
Friday, November 6: the October jobs report, after September’s 29,000 new jobs.
Tuesday, November 10: October consumer prices, on the date set in the BLS release calendar. September’s CPI rose 3.7% from a year earlier.
December 9: the Fed’s next decision.
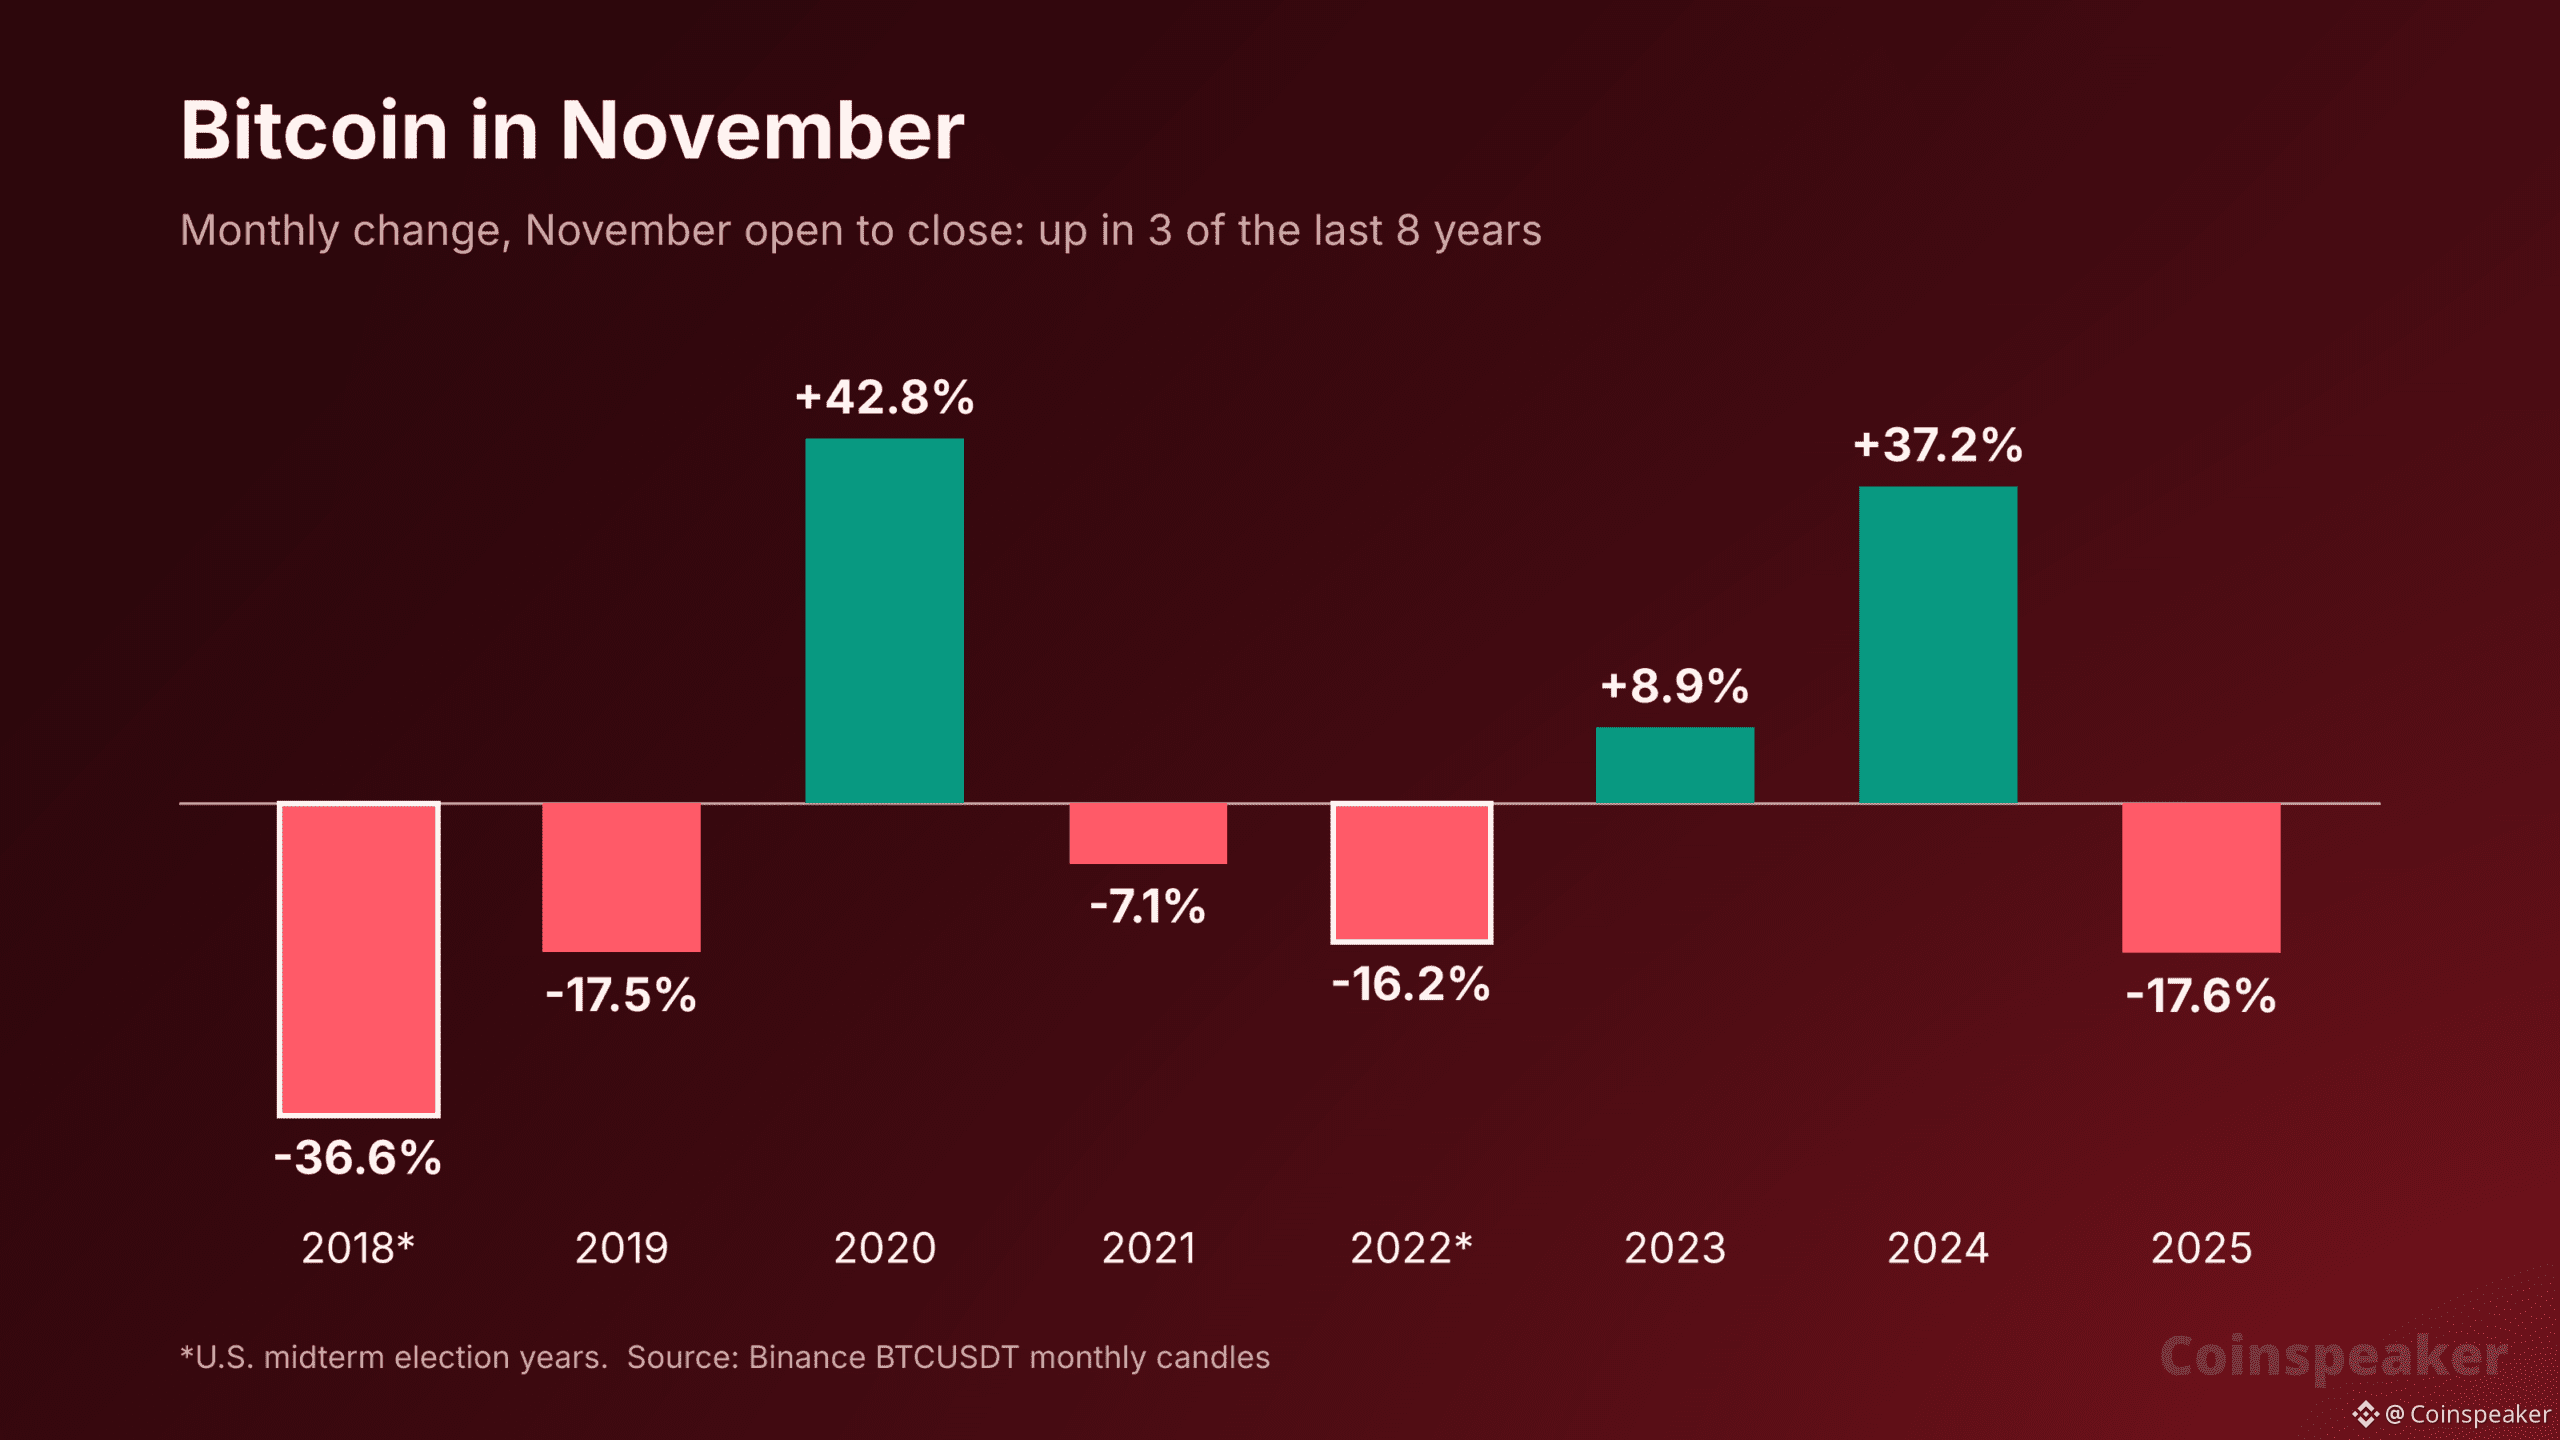
November’s reputation as a strong month for Bitcoin rests mostly on two years. On Binance, BTC rose in only three of the last eight Novembers. The big gains, 42.8% in 2020 and 37.2% in 2024, both came right after presidential elections. The two midterm years, 2018 and 2022, ended November down 36.6% and 16.2%.
Bitcoin’s November returns since 2018. Source: Binance
Eight years is a small sample, and both midterm Novembers fell in the middle of bear markets. Options traders aren’t betting on a big move either way. Deribit’s DVOL index, which tracks the 30-day volatility implied by Bitcoin options, stood at 36.5 on Wednesday, just under the 37 to 39 range it held for the previous two weeks.
Bitcoin Price Analysis: Can BTC Hold $79,221 Into November?
It is testing the area now. BTC trades at $79,899 on Binance, back under its 50-day exponential moving average (EMA) at $80,789, a line it has crossed three times in the past week. The October 24 low of $79,221 is the floor that has held so far.
The one-year view is steadier than the week. The 200-day EMA has climbed from about $72,300 in late August to $76,476, and the 50-day crossed above it on September 12, the first such cross since it fell below in November 2025.
Resistance: $84,898, the October 21 high, where the last rally stopped.
Support: $79,221, the October 24 low. Below it, $76,264 to $76,476, the September 2 low and the 200-day EMA.
BTCUSDT Chart 1D TradingView
Outlook Trigger Level to watch Rebound A daily close back above the 50-day EMA at $80,789 $84,898, the October 21 high Holding pattern Holding between $79,221 and $84,898 More sideways trade around the 50-day EMA Sell-off A daily close below $79,221 $76,264 to $76,476, the September 2 low and the 200-day EMA
The ETF buyers came back this week, but the Fed left December open and the price is still hostage to tech stocks. For Bitcoin news in the days ahead, the first test is today’s PCE report, and the next is the November 6 jobs data.
EXPLORE: Bitcoin Whale Sends $35M to Coinbase at a $15M Loss as October Turns Red: What Moves BTC Next?
next
The post Bitcoin ETFs Take In $424 Million, but BTC Slips Below $80,000: What Bitcoin News Could November Bring? appeared first on Coinspeaker.
Bitcoin ETFs Take in $424 Million, but BTC Slips Below $80,000: What Bitcoin News Could November ...
U.S. spot Bitcoin exchange-traded funds took in $137.3 million on Wednesday, October 28, their third straight day of inflows, while the Federal Reserve held interest rates at 3.75% to 4% and two of its officials voted for a hike. The buying didn’t hold the price for long. Bitcoin rose to $81,788 after the decision, then fell to $79,710 overnight as a selloff in chip stocks spread to crypto.
BTC trades at $79,899, down 1.2% in 24 hours and 4.4% for October, which is on track to be its second losing October in a row. For traders following Bitcoin news into November, the calendar is crowded: the midterm elections, fresh jobs and inflation data, and a December rate hike that prediction markets now price at 79%.
So what do the ETF flows, the Fed and November’s record say?
The Fed holds steady.
The decision is 10-2.
Lisa Cook and Beth Hammack voted for an increase. pic.twitter.com/nUKDM6n8Zp
— Nick Timiraos (@NickTimiraos) October 28, 2026
DISCOVER: Meme coin supercycle: Top performers this week
Bitcoin News: How Much Have Bitcoin ETFs Taken In This Week?
About $424 million in three sessions. SoSoValue’s daily figures show almost all of it went through BlackRock:
Monday, October 26: $110.3 million, all into BlackRock’s iShares Bitcoin Trust (IBIT).
Tuesday, October 27: $176.0 million, with none of the 12 funds losing money.
Wednesday, October 28: $137.3 million, of which IBIT took $136.0 million and Bitwise’s BITB $1.3 million.
The run follows a rough patch. On October 22 the funds lost $635.6 million in a day, their biggest outflow since June, with IBIT and Fidelity’s FBTC each shedding more than $200 million. Through Monday, October was still about $202 million in the red. The two days since have tipped it slightly positive, by roughly $110 million.
The 12 funds now hold $104.9 billion, about 6.4% of all Bitcoin by value, and have taken in $57.6 billion net since they launched in January 2024. IBIT alone holds $66.1 billion.
What Did the Fed Decide, and How Did Bitcoin React?
A hold, but not a quiet one. The Fed’s statement passed 10–2, with Governor Lisa Cook and Cleveland Fed President Beth Hammack voting for a quarter-point hike. It said the economy is “expanding at a strong pace” and inflation is still too high, and it left the next step to “the accumulation of more information.”
Chair Kevin Warsh gave no hint about December. “I don’t believe in forward guidance, absent exigent circumstances, absent a crisis,” he told reporters, adding that politics “played no role” six days before the midterms. Traders read the dissents as a lean toward tightening. Polymarket’s December market prices a quarter-point hike at 77%, about where it stood before the meeting.
Bitcoin took the decision calmly at first. It traded at $80,860 at 2 p.m. ET and rose 1.1% to $81,788 over the next two hours. The drop came later, during Asian trading, after Samsung’s chip unit missed analysts’ estimates and its shares fell more than 5%, pulling tech stocks lower.
BTC fell to $79,710 by 02:00 UTC, and more than $350 million in leveraged crypto bets were liquidated over 24 hours.
Bitcoin News for November: What Should Traders Expect?
A month of data that will decide whether December’s hike happens. The dates to watch:
Thursday, October 29: September’s PCE inflation and third-quarter GDP at 8:30 a.m. ET, then Coinbase and Strategy earnings after the close.
Friday, October 30: Deribit’s monthly options expiry, with about 135,700 BTC, roughly $10.8 billion, in open contracts.
Tuesday, November 3: the U.S. midterm elections.
Friday, November 6: the October jobs report, after September’s 29,000 new jobs.
Tuesday, November 10: October consumer prices, on the date set in the BLS release calendar. September’s CPI rose 3.7% from a year earlier.
December 9: the Fed’s next decision.
November’s reputation as a strong month for Bitcoin rests mostly on two years. On Binance, BTC rose in only three of the last eight Novembers. The big gains, 42.8% in 2020 and 37.2% in 2024, both came right after presidential elections. The two midterm years, 2018 and 2022, ended November down 36.6% and 16.2%.
Bitcoin’s November returns since 2018. Source: Binance
Eight years is a small sample, and both midterm Novembers fell in the middle of bear markets. Options traders aren’t betting on a big move either way. Deribit’s DVOL index, which tracks the 30-day volatility implied by Bitcoin options, stood at 36.5 on Wednesday, just under the 37 to 39 range it held for the previous two weeks.
Bitcoin Price Analysis: Can BTC Hold $79,221 Into November?
It is testing the area now. BTC trades at $79,899 on Binance, back under its 50-day exponential moving average (EMA) at $80,789, a line it has crossed three times in the past week. The October 24 low of $79,221 is the floor that has held so far.
The one-year view is steadier than the week. The 200-day EMA has climbed from about $72,300 in late August to $76,476, and the 50-day crossed above it on September 12, the first such cross since it fell below in November 2025.
Resistance: $84,898, the October 21 high, where the last rally stopped.
Support: $79,221, the October 24 low. Below it, $76,264 to $76,476, the September 2 low and the 200-day EMA.
BTCUSDT Chart 1D TradingView
Outlook Trigger Level to watch Rebound A daily close back above the 50-day EMA at $80,789 $84,898, the October 21 high Holding pattern Holding between $79,221 and $84,898 More sideways trade around the 50-day EMA Sell-off A daily close below $79,221 $76,264 to $76,476, the September 2 low and the 200-day EMA
The ETF buyers came back this week, but the Fed left December open and the price is still hostage to tech stocks. For Bitcoin news in the days ahead, the first test is today’s PCE report, and the next is the November 6 jobs data.
EXPLORE: Bitcoin Whale Sends $35M to Coinbase at a $15M Loss as October Turns Red: What Moves BTC Next?
next
The post Bitcoin ETFs Take In $424 Million, but BTC Slips Below $80,000: What Bitcoin News Could November Bring? appeared first on Coinspeaker.
220
·
--
Статья
MIKA Crypto Crashes 99% After Influencer Posts Her Dev Wallet’s Private Key: Are Celebrity Tokens...Crypto influencer Mika (@mikadontlouz) posted what traders say was her token’s developer wallet private key instead of its contract address. The MIKA crypto token she had just launched crashed about 99% in a single sale minutes later.
For an account with 126,000 followers, that is the equivalent of tweeting your bank PIN with the caption “free yourselves.” Which, as it happens, is roughly what the post said.
Half an hour later she launched again, this time with one wallet holding half the supply. That one is down about 84% from its peak. Bad luck, a botched launch or a tidy exit with a ready-made excuse?
And while we’re asking: after Hunter Biden’s LAPTOP token went the same way in September, are celebrity tokens back, and does anyone actually need them?
Mika just tried to launch a pump coin and instead of tweeting the CA she tweeted the devs wallet private key instead…😭 pic.twitter.com/pjsA0vY7bl
— Connor (@Connoreo) October 28, 2026
DISCOVER: Best Meme Coins to Buy in 2026
Another Day Another Horrible Launch: What Happened With MIKA Crypto?
Two launches, two crashes, one afternoon. More or less this is the timeline:
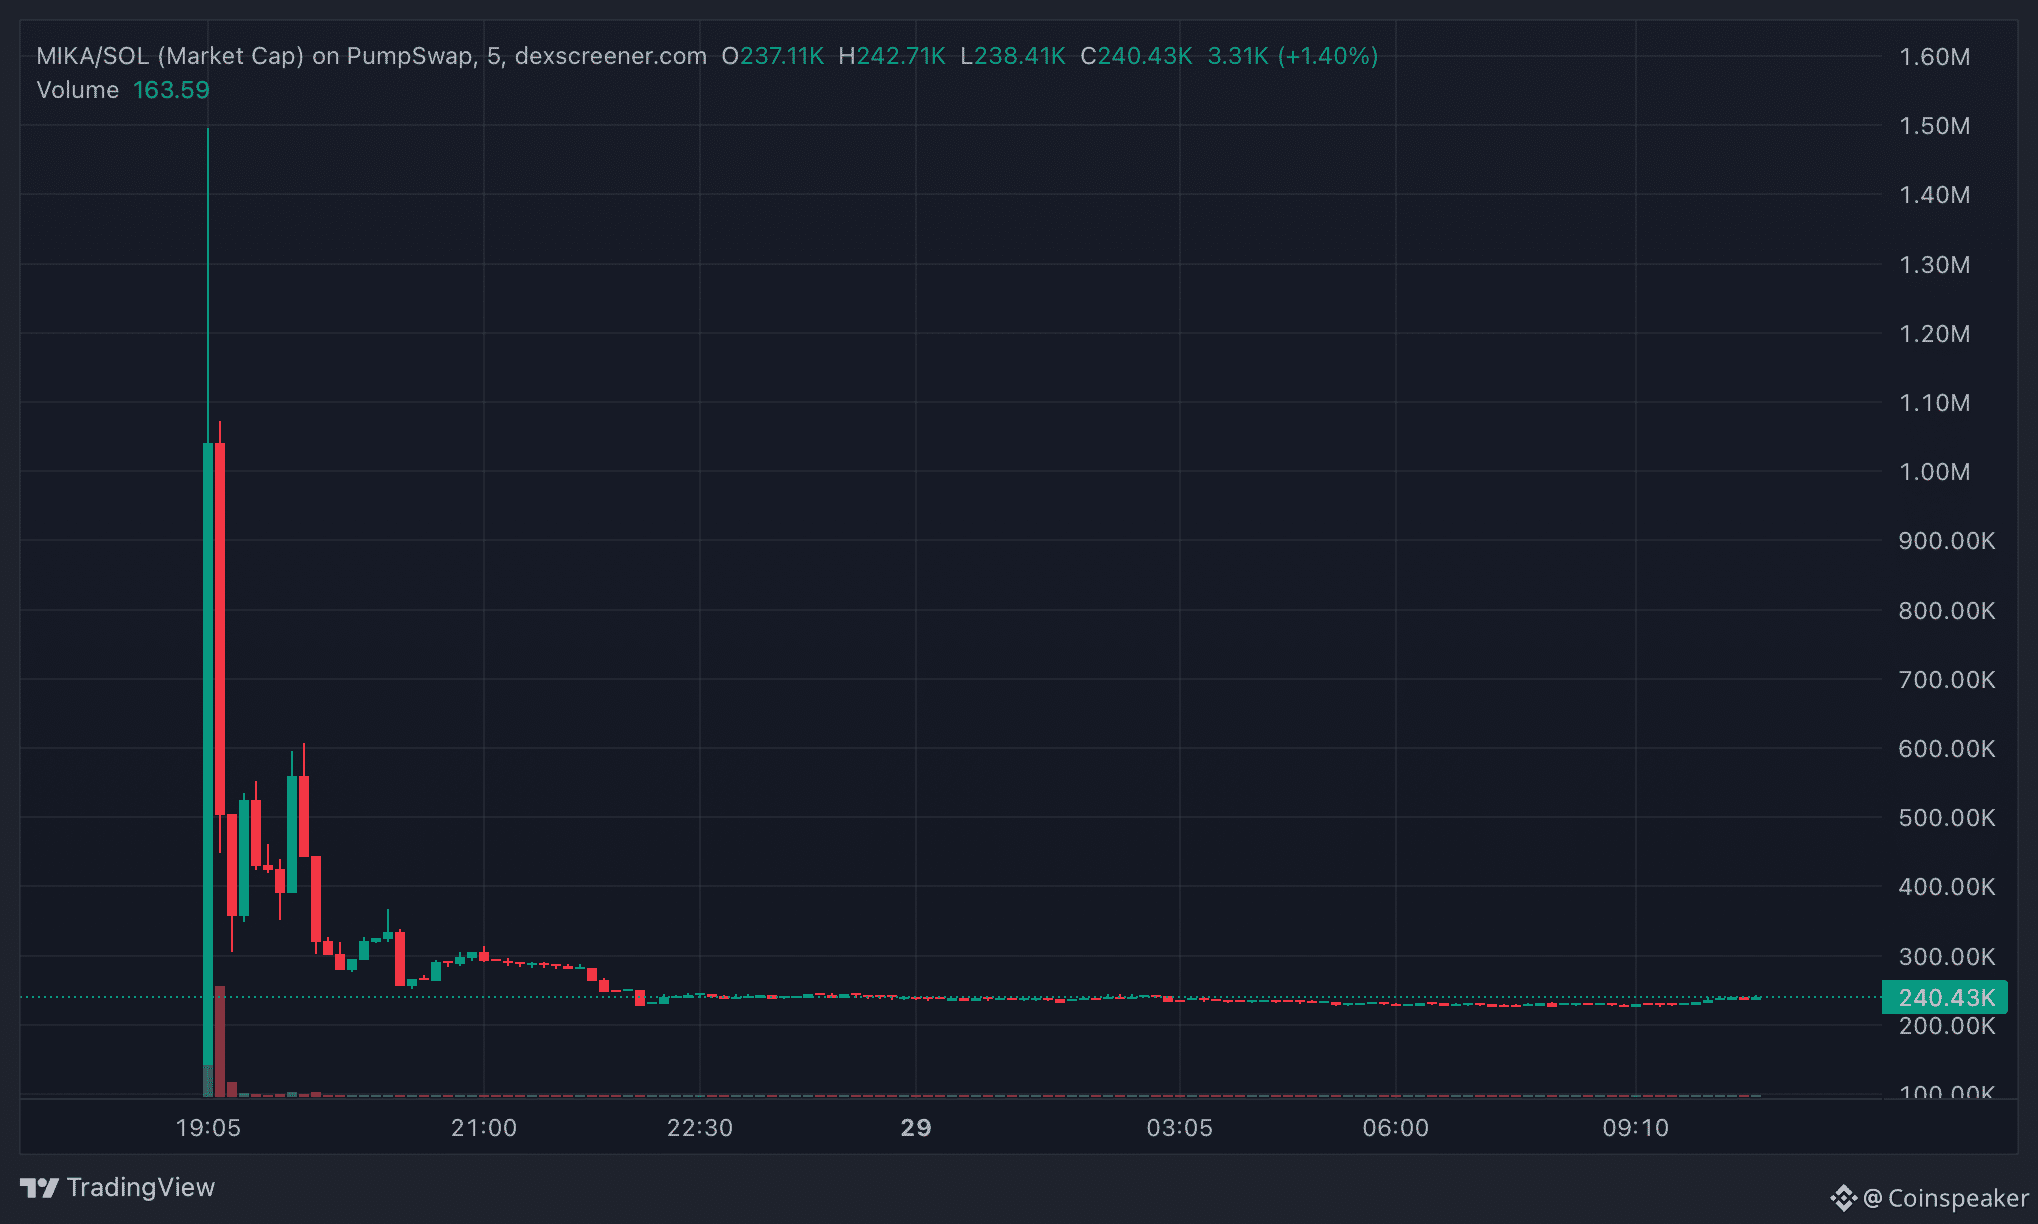
1:36 p.m.: a token called Free Mika (MIKA) goes live on pump.fun and runs to a $1.6 million market cap in about three minutes.
1:40 p.m.: Mika posts “free yourselves knights / its time to eat. no cabal.” followed by an 87-character string. A contract address on Solana is 44 characters. Traders quickly pointed out it was the dev wallet’s private key.
Minutes later: Odaily traced the creator address sending about 500.44 million MIKA, half the initial supply, to another wallet, which sold about 500.83 million on PumpSwap seven seconds later. The next trades printed about 99% lower. By 1:53 p.m. the market cap was $85,500.
2:08 p.m.: a second Free Mika token launches, and Mika posts its contract address a minute later, this time the right string. On GeckoTerminal, it peaks near a $1.5 million market cap within minutes and is below $300,000 within the hour.
The relaunch now sits at a market cap of about $240,000, with $41,700 of liquidity and $1.65 million traded in 24 hours. The internet, meanwhile, did what it does: DexScreener lists more than a dozen copycats with names like Free Mika King, Jail Mika and Mute Mika.
FREE MIKA Source: Dexscreener
Was the MIKA Crypto Key Post Really a Mistake?
Maybe. But it was a very specific kind of mistake. Copying a private key instead of a contract address means opening the wallet’s export screen, revealing a string twice as long as the one you meant to share, and pasting it under a caption that starts with “free yourselves.” Plenty of people in crypto have done dumber things. Few have done them with such good copywriting.
The story split in two within the hour:
The sympathy version: a widely shared post said Mika had been “drained for 40k” and was hosting an X Spaces “in tears.”
The skeptic version: Solana trader fabiano.sol, who has 88,000 followers, said the loss was staged. His screenshot shows the wallet as a System Program account holding 80 bytes of data, the size of a durable nonce account, a setup that can stop whoever holds a leaked key from moving the funds. He also flagged that, in the relaunch, the dev held about 50% of supply, and called the holder map “awful.”
Ouhhhh man I'm tired@mikadontlouz "accidentally" posted her private key and "lost $40K"
(was fake.. she put a nonce on the wallet before posting it)
She then posted a CA
– 400k spawner – dev holds 50% – awful bubblemaps pic.twitter.com/TSsTj8LdFC
— fabiano.sol (@FabianoSolana) October 28, 2026
Whether it was an outsider who copied the key or an existing owner is still unknown, and from the transaction alone the two are hard to tell apart.
To be fair to Mika, none of this proves she meant it. A rushed launch, a clipboard mix-up and a panicked relaunch would leave a similar trail. But a leak that hands the blame for the dump to “whoever copied the key,” a claimed $40,000 loss that may not have happened, and a relaunch where one wallet held half the tokens add up to a lot of coincidences for one afternoon.
DISCOVER: PUMP vs FOMO: Can Signing $40M TRUMP Trader Kimchi Help Pump.fun Win the Launchpad War?
Are Celebrity Tokens Back?
They never really left, they just keep ending the same way. The latest big one came seven weeks ago. Hunter Biden’s LAPTOP token launched on Base on September 9 and jumped to $190.81 two minutes in, on a pool holding about $48,000 of liquidity, then fell to $3.70 within the hour. Biden blamed a market maker and denied his team sold. Bubblemaps found about 80% of LAPTOP traders ended up underwater.
But that is just one in a long list of failed launches by these “celebrities”:
TRUMP (January 2025): launched three days before the inauguration and peaked at $73.43 on January 19. It trades at $1.67.
MELANIA (January 2025): peaked at $13.05 the same day and is now worth about 8 cents.
LIBRA (February 2025): Argentina’s President Javier Milei posted about it, the market cap shot past $4 billion, and it lost more than 90% within hours. He deleted the post.
YZY (August 2025): Kanye West’s token peaked at $2.95 and trades at $0.29.
HAWK (December 2024): “Hawk Tuah” influencer Hailey Welch’s token lost more than 90% within hours of launch.
MOTHER (May 2024): Iggy Azalea’s token is 99.9% below its peak.
Celebrity tokens, drop from all-time high. Source: CoinGecko
The pattern barely changes. A famous name brings the buyers, insiders or snipers own a large share of the supply, liquidity is thin, and the chart looks like a ski jump. The famous name moves on to the next interview. The people who bought the third green candle don’t.
Do We Really Need Celebrity Tokens?
Short answer: the buyers apparently think so, the charts disagree. A celebrity token has no product, no cash flow and, in most cases, no plan beyond launch day. What it sells is access to a name, and that lasts about as long as the first big holder’s patience.
The tools for spotting trouble keep getting better, too. A Bubblemaps holder map showed the relaunch’s 50% wallet within the hour, and on-chain sleuths had the nonce account screenshotted before the Spaces ended. The second token still traded $1.65 million in 24 hours.
MIKA crypto will probably be forgotten by next week, replaced by the next name with a ticker. If there is a lesson, it’s the oldest one in memecoins: when someone posts “its time to eat,” check who is setting the table.
EXPLORE: CZ Says AI Won’t Break Bitcoin, but Leaked Data Will Hurt Its Users: Can BTC Turn the $81,000 Floor Into a Bounce?
next
The post MIKA Crypto Crashes 99% After Influencer Posts Her Dev Wallet’s Private Key: Are Celebrity Tokens Back, and Does Anyone Need Them? appeared first on Coinspeaker.
MIKA Crypto Crashes 99% After Influencer Posts Her Dev Wallet’s Private Key: Are Celebrity Tokens...
Crypto influencer Mika (@mikadontlouz) posted what traders say was her token’s developer wallet private key instead of its contract address. The MIKA crypto token she had just launched crashed about 99% in a single sale minutes later.
For an account with 126,000 followers, that is the equivalent of tweeting your bank PIN with the caption “free yourselves.” Which, as it happens, is roughly what the post said.
Half an hour later she launched again, this time with one wallet holding half the supply. That one is down about 84% from its peak. Bad luck, a botched launch or a tidy exit with a ready-made excuse?
And while we’re asking: after Hunter Biden’s LAPTOP token went the same way in September, are celebrity tokens back, and does anyone actually need them?
Mika just tried to launch a pump coin and instead of tweeting the CA she tweeted the devs wallet private key instead…😭 pic.twitter.com/pjsA0vY7bl
— Connor (@Connoreo) October 28, 2026
DISCOVER: Best Meme Coins to Buy in 2026
Another Day Another Horrible Launch: What Happened With MIKA Crypto?
Two launches, two crashes, one afternoon. More or less this is the timeline:
1:36 p.m.: a token called Free Mika (MIKA) goes live on pump.fun and runs to a $1.6 million market cap in about three minutes.
1:40 p.m.: Mika posts “free yourselves knights / its time to eat. no cabal.” followed by an 87-character string. A contract address on Solana is 44 characters. Traders quickly pointed out it was the dev wallet’s private key.
Minutes later: Odaily traced the creator address sending about 500.44 million MIKA, half the initial supply, to another wallet, which sold about 500.83 million on PumpSwap seven seconds later. The next trades printed about 99% lower. By 1:53 p.m. the market cap was $85,500.
2:08 p.m.: a second Free Mika token launches, and Mika posts its contract address a minute later, this time the right string. On GeckoTerminal, it peaks near a $1.5 million market cap within minutes and is below $300,000 within the hour.
The relaunch now sits at a market cap of about $240,000, with $41,700 of liquidity and $1.65 million traded in 24 hours. The internet, meanwhile, did what it does: DexScreener lists more than a dozen copycats with names like Free Mika King, Jail Mika and Mute Mika.
FREE MIKA Source: Dexscreener
Was the MIKA Crypto Key Post Really a Mistake?
Maybe. But it was a very specific kind of mistake. Copying a private key instead of a contract address means opening the wallet’s export screen, revealing a string twice as long as the one you meant to share, and pasting it under a caption that starts with “free yourselves.” Plenty of people in crypto have done dumber things. Few have done them with such good copywriting.
The story split in two within the hour:
The sympathy version: a widely shared post said Mika had been “drained for 40k” and was hosting an X Spaces “in tears.”
The skeptic version: Solana trader fabiano.sol, who has 88,000 followers, said the loss was staged. His screenshot shows the wallet as a System Program account holding 80 bytes of data, the size of a durable nonce account, a setup that can stop whoever holds a leaked key from moving the funds. He also flagged that, in the relaunch, the dev held about 50% of supply, and called the holder map “awful.”
Ouhhhh man I'm tired@mikadontlouz "accidentally" posted her private key and "lost $40K"
(was fake.. she put a nonce on the wallet before posting it)
She then posted a CA
– 400k spawner – dev holds 50% – awful bubblemaps pic.twitter.com/TSsTj8LdFC
— fabiano.sol (@FabianoSolana) October 28, 2026
Whether it was an outsider who copied the key or an existing owner is still unknown, and from the transaction alone the two are hard to tell apart.
To be fair to Mika, none of this proves she meant it. A rushed launch, a clipboard mix-up and a panicked relaunch would leave a similar trail. But a leak that hands the blame for the dump to “whoever copied the key,” a claimed $40,000 loss that may not have happened, and a relaunch where one wallet held half the tokens add up to a lot of coincidences for one afternoon.
DISCOVER: PUMP vs FOMO: Can Signing $40M TRUMP Trader Kimchi Help Pump.fun Win the Launchpad War?
Are Celebrity Tokens Back?
They never really left, they just keep ending the same way. The latest big one came seven weeks ago. Hunter Biden’s LAPTOP token launched on Base on September 9 and jumped to $190.81 two minutes in, on a pool holding about $48,000 of liquidity, then fell to $3.70 within the hour. Biden blamed a market maker and denied his team sold. Bubblemaps found about 80% of LAPTOP traders ended up underwater.
But that is just one in a long list of failed launches by these “celebrities”:
TRUMP (January 2025): launched three days before the inauguration and peaked at $73.43 on January 19. It trades at $1.67.
MELANIA (January 2025): peaked at $13.05 the same day and is now worth about 8 cents.
LIBRA (February 2025): Argentina’s President Javier Milei posted about it, the market cap shot past $4 billion, and it lost more than 90% within hours. He deleted the post.
YZY (August 2025): Kanye West’s token peaked at $2.95 and trades at $0.29.
HAWK (December 2024): “Hawk Tuah” influencer Hailey Welch’s token lost more than 90% within hours of launch.
MOTHER (May 2024): Iggy Azalea’s token is 99.9% below its peak.
Celebrity tokens, drop from all-time high. Source: CoinGecko
The pattern barely changes. A famous name brings the buyers, insiders or snipers own a large share of the supply, liquidity is thin, and the chart looks like a ski jump. The famous name moves on to the next interview. The people who bought the third green candle don’t.
Do We Really Need Celebrity Tokens?
Short answer: the buyers apparently think so, the charts disagree. A celebrity token has no product, no cash flow and, in most cases, no plan beyond launch day. What it sells is access to a name, and that lasts about as long as the first big holder’s patience.
The tools for spotting trouble keep getting better, too. A Bubblemaps holder map showed the relaunch’s 50% wallet within the hour, and on-chain sleuths had the nonce account screenshotted before the Spaces ended. The second token still traded $1.65 million in 24 hours.
MIKA crypto will probably be forgotten by next week, replaced by the next name with a ticker. If there is a lesson, it’s the oldest one in memecoins: when someone posts “its time to eat,” check who is setting the table.
EXPLORE: CZ Says AI Won’t Break Bitcoin, but Leaked Data Will Hurt Its Users: Can BTC Turn the $81,000 Floor Into a Bounce?
next
The post MIKA Crypto Crashes 99% After Influencer Posts Her Dev Wallet’s Private Key: Are Celebrity Tokens Back, and Does Anyone Need Them? appeared first on Coinspeaker.
538
·
--
Статья
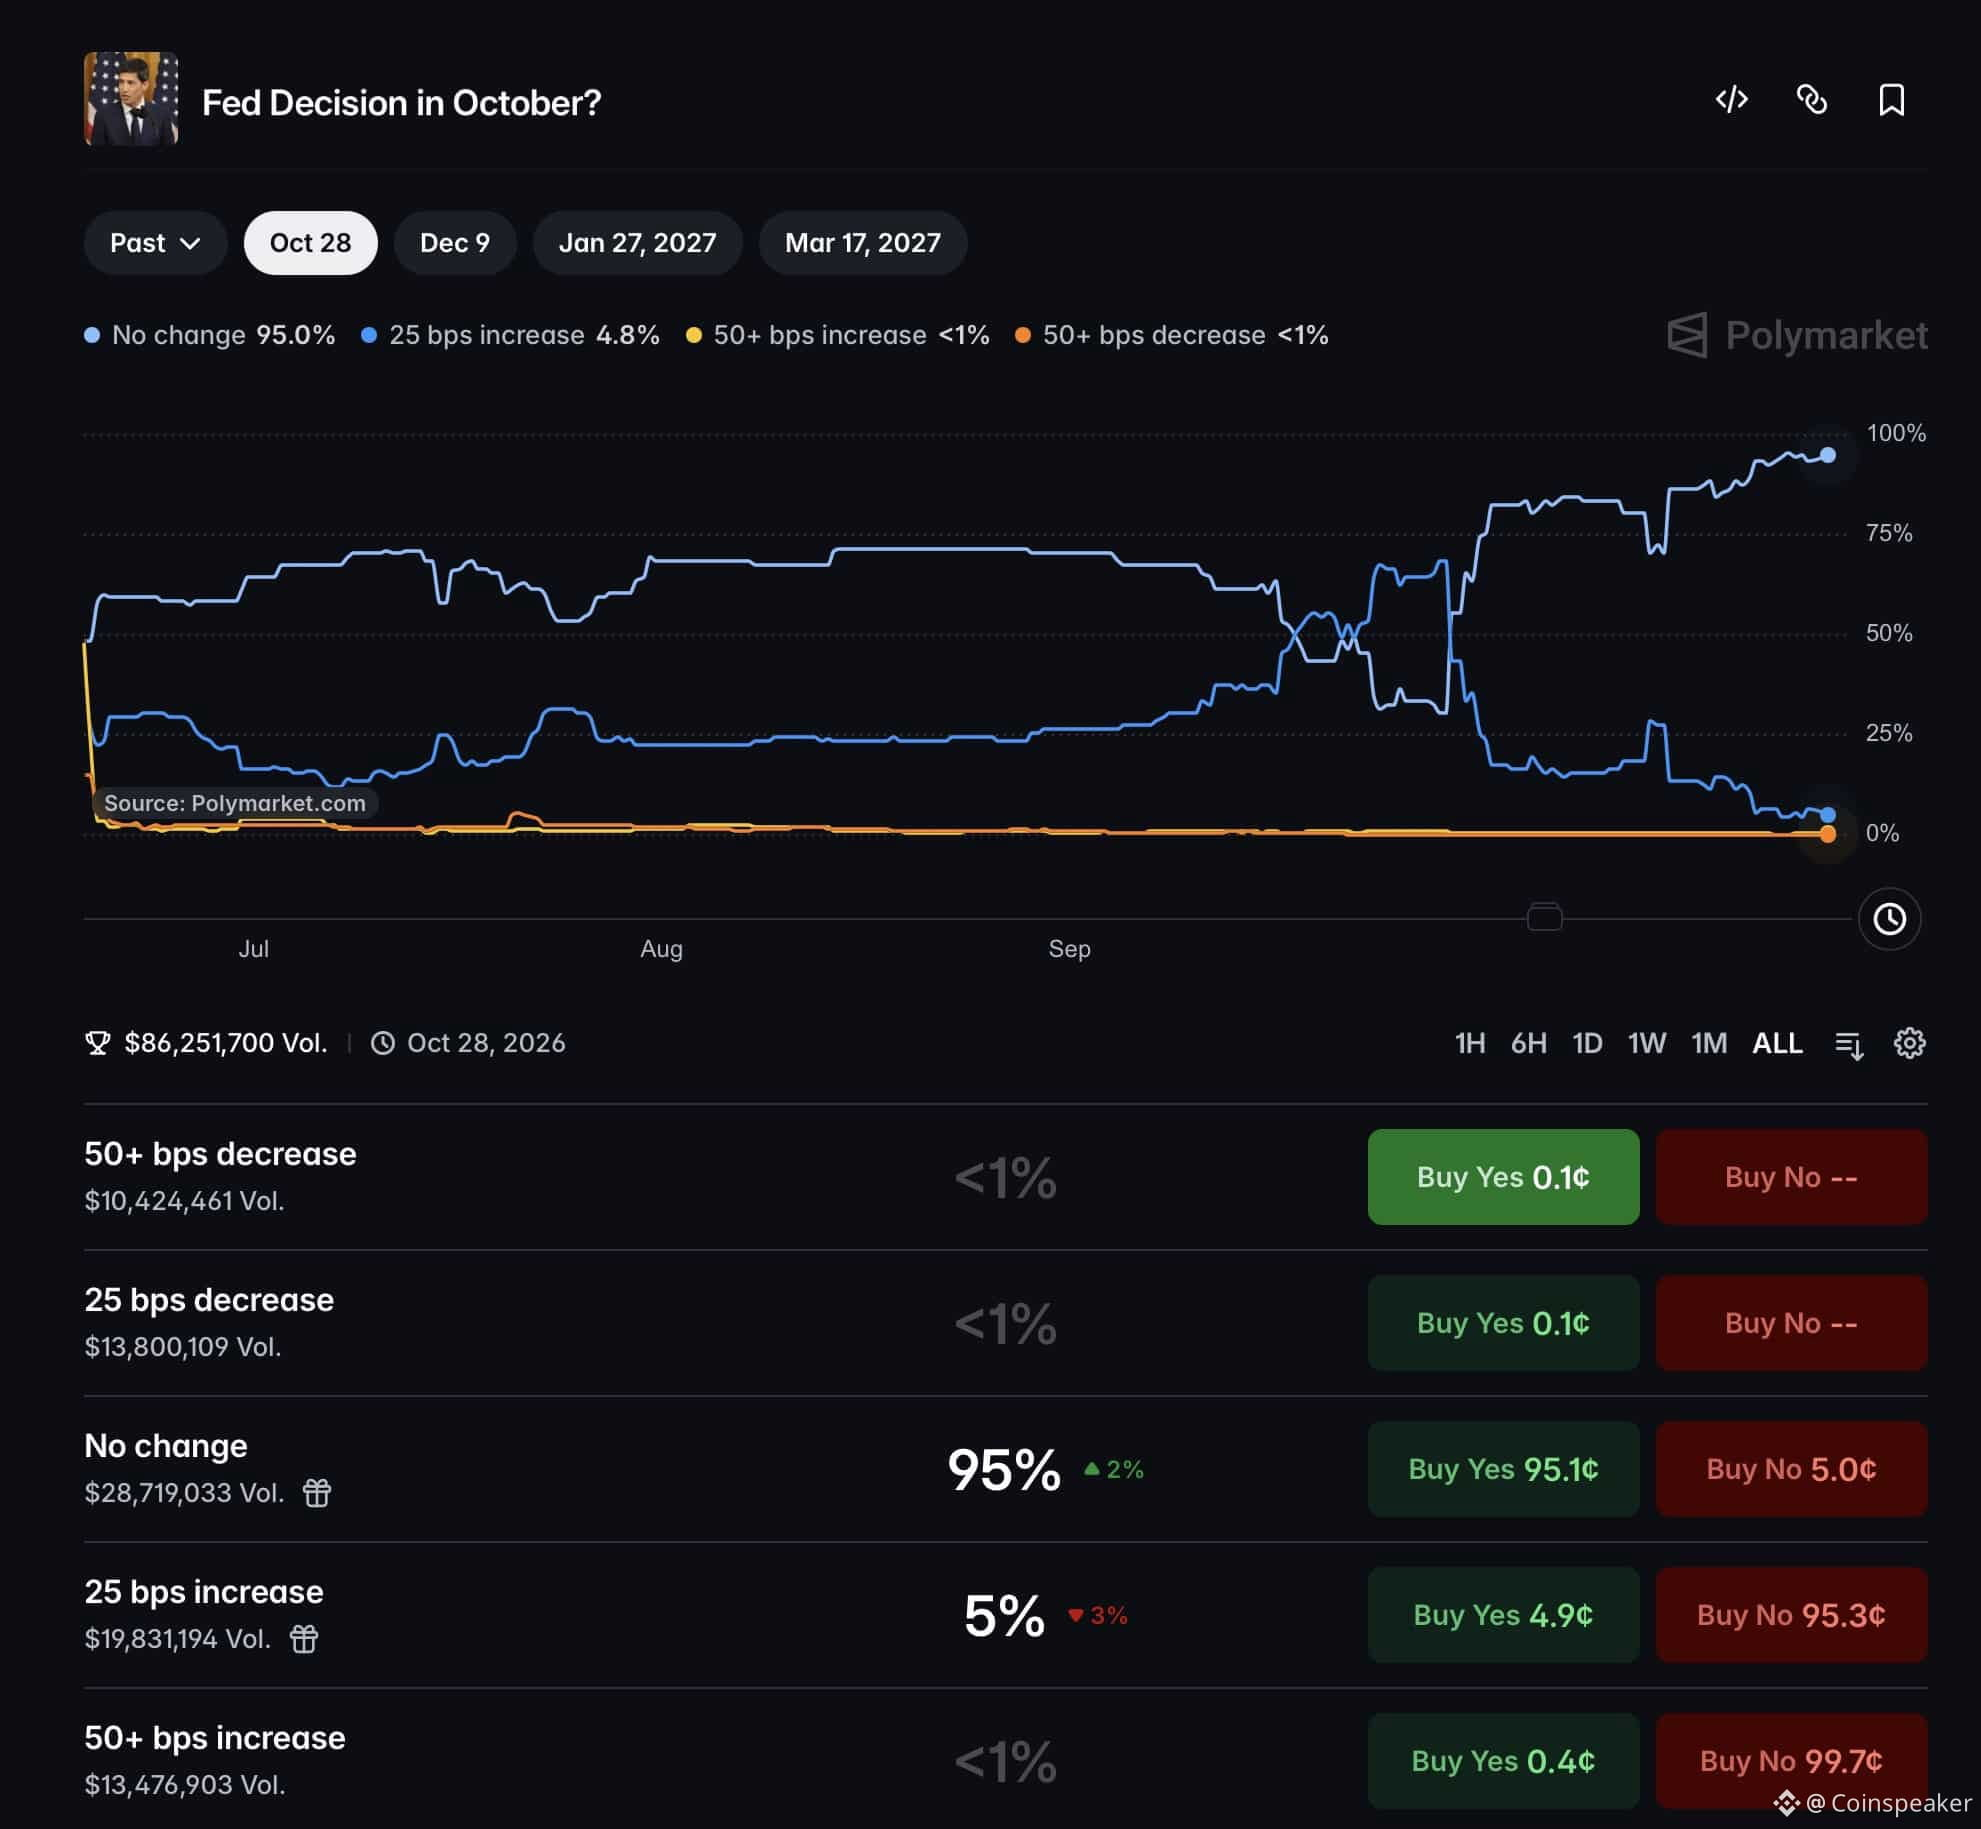
Fed Meeting Today: Traders Price a 95% Hold and a 79% December Hike. What Does It Mean for Crypto?The Federal Reserve is expected to keep its policy rate at 3.75% to 4.00% when its two-day Fed meeting ends on Wednesday, October 28, as officials weigh 3.7% inflation against a weakening job market six days before the U.S. midterms. Polymarket traders give a hold 94.9% odds ahead of the 2 p.m. ET statement. The decision itself is mostly priced in. December isn’t: the same markets see a 79% chance of another hike then, so crypto traders will be watching Chair Kevin Warsh’s press conference at 2:30 p.m. more than the statement.
Bitcoin trades at $81,430, up 1.9% in 24 hours.
Fed Decision in October
DISCOVER: Best Meme Coins to Buy in 2026
What Are the Rate Odds for the Fed Meeting?
A hold is close to certain, and the betting is now on December. Prediction markets, futures and economists line up:
Source Hold today Hike today Hike in December Polymarket 94.9% 4.8% 78.8% Kalshi 96% 5% 79% CME FedWatch (futures) Above 90% – 73% Reuters poll of economists 94 of 100 – –
Polymarket’s October market alone has drawn $86 million in bets. Its most likely three-meeting path, at 59%, is a hold today, a hike in December and a hold in January. The December figures add the 25 and 50 basis-point hike markets on each platform.
The bond market agrees. The two-year Treasury yield stood at 4.68% on Monday, 68 basis points above the top of the Fed’s range and up from 4.17% in late August. Traders don’t demand that much more than the Fed pays unless they expect it to keep raising rates.
What Are Traders Expecting From Warsh?
A hawkish hold: no move today, but no promise of a pause either. The case for waiting is that the data are pulling in two directions. September’s consumer prices rose 3.7% from a year earlier, up from 3.4% in August, with Brent crude still near $111 a barrel. At the same time, employers added just 29,000 jobs in September and unemployment rose to 4.2%.
The Fed raised rates by a quarter point on September 16, by a 12–0 vote. Its statement said inflation was still too high and that “the Committee will deliver price stability.” Warsh has largely avoided forward guidance as chair and has said he doesn’t “prejudge meetings.”
The number to watch is the dissents. Cleveland’s Beth Hammack, Dallas’s Lorie Logan and Minneapolis’s Neel Kashkari voted for a hike in July, when the rest of the committee held. On Polymarket, two dissents are the most likely outcome at 33.5%, ahead of three (28%) and none (23%). Matt Weller of FOREX.com calls two or more dissents a “true hawkish hold,” while zero would cast doubt on December.
Timing adds a political layer. “The Fed doesn’t want to poke the White House in the eye six days before an election,” SMBC chief economist Joseph LaVorgna said ahead of the meeting.
The most plausible outcome is a hold with two hawkish dissents, a statement that again calls inflation too high, and a press conference in which Warsh keeps December open without committing to it. That would leave the December odds roughly where they are, between 73% and 79%. The bigger surprise risk is on the dovish side: no dissents, or Warsh arguing that 5% ten-year yields are already doing the Fed’s work.
DISCOVER: Bitcoin Whale Sends $35M to Coinbase at a $15M Loss as October Turns Red: What Moves BTC Next?
What Does the Fed Meeting Mean for Crypto?
History this year says the reaction matters more than the decision. Bitcoin fell in the 24 hours after three of the five holds in 2026, by an average of 2.6% across all five, with the biggest drops after January (−6.2%) and June (−5.1%). The one hike, on September 16, was followed by a 1.1% gain in a day and 11.3% in a week, as the uncertainty that had built up before it cleared.
Bitcoin after each 2026 Fed decision. Source: Binance
Options traders aren’t expecting much this time. Deribit’s DVOL index, which tracks the 30-day volatility implied by Bitcoin options, stood at 37.3 on Wednesday and has stayed between about 37 and 39 for the past two weeks. That leaves room for a surprise in either direction. A firm signal for December would lift yields and the dollar, which has tended to weigh on Bitcoin. A softer Warsh would do the opposite.
The calendar doesn’t end tonight. September’s PCE inflation and third-quarter GDP arrive on Thursday, Deribit’s monthly options expire on Friday, and the midterms follow on November 3.
DISCOVER: Meme coin supercycle: Top performers this week
Bitcoin Price Analysis: Can BTC Get Back Above $83,624 After the Fed?
Bitcoin has some room above its moving averages but hasn’t retaken October’s open. It trades at $81,430 on Binance, above its 50-day exponential moving average (EMA) at $80,829 and the 200-day EMA at $76,442.
Resistance: $83,624, the October open. A close above it would put the month back in the green.
Support: $79,221, the October 24 low, which held through three dips this week.
BTCUSDT Chart 1D
Outlook Trigger Level to watch Rebound A daily close above $83,624 after a balanced Warsh $84,898, the October 21 high Holding pattern Holding between $79,221 and $83,624 The 50-day EMA at $80,829 Sell-off A daily close below $79,221 on a firm December signal $76,442, the 200-day EMA
Today’s Fed meeting is expected to end in a hold. What moves markets will be the dissents and Warsh’s answers about December, and Thursday’s PCE report will show whether the inflation case for a hike is getting stronger.
EXPLORE: Bitcoin Holds $79,200 Before the Fed, Coinbase Earnings and a $10.9B Expiry: Which Way Next?
next
The post Fed Meeting Today: Traders Price a 95% Hold and a 79% December Hike. What Does It Mean for Crypto? appeared first on Coinspeaker.
Fed Meeting Today: Traders Price a 95% Hold and a 79% December Hike. What Does It Mean for Crypto?
The Federal Reserve is expected to keep its policy rate at 3.75% to 4.00% when its two-day Fed meeting ends on Wednesday, October 28, as officials weigh 3.7% inflation against a weakening job market six days before the U.S. midterms. Polymarket traders give a hold 94.9% odds ahead of the 2 p.m. ET statement. The decision itself is mostly priced in. December isn’t: the same markets see a 79% chance of another hike then, so crypto traders will be watching Chair Kevin Warsh’s press conference at 2:30 p.m. more than the statement.
Bitcoin trades at $81,430, up 1.9% in 24 hours.
Fed Decision in October
DISCOVER: Best Meme Coins to Buy in 2026
What Are the Rate Odds for the Fed Meeting?
A hold is close to certain, and the betting is now on December. Prediction markets, futures and economists line up:
Source Hold today Hike today Hike in December Polymarket 94.9% 4.8% 78.8% Kalshi 96% 5% 79% CME FedWatch (futures) Above 90% – 73% Reuters poll of economists 94 of 100 – –
Polymarket’s October market alone has drawn $86 million in bets. Its most likely three-meeting path, at 59%, is a hold today, a hike in December and a hold in January. The December figures add the 25 and 50 basis-point hike markets on each platform.
The bond market agrees. The two-year Treasury yield stood at 4.68% on Monday, 68 basis points above the top of the Fed’s range and up from 4.17% in late August. Traders don’t demand that much more than the Fed pays unless they expect it to keep raising rates.
What Are Traders Expecting From Warsh?
A hawkish hold: no move today, but no promise of a pause either. The case for waiting is that the data are pulling in two directions. September’s consumer prices rose 3.7% from a year earlier, up from 3.4% in August, with Brent crude still near $111 a barrel. At the same time, employers added just 29,000 jobs in September and unemployment rose to 4.2%.
The Fed raised rates by a quarter point on September 16, by a 12–0 vote. Its statement said inflation was still too high and that “the Committee will deliver price stability.” Warsh has largely avoided forward guidance as chair and has said he doesn’t “prejudge meetings.”
The number to watch is the dissents. Cleveland’s Beth Hammack, Dallas’s Lorie Logan and Minneapolis’s Neel Kashkari voted for a hike in July, when the rest of the committee held. On Polymarket, two dissents are the most likely outcome at 33.5%, ahead of three (28%) and none (23%). Matt Weller of FOREX.com calls two or more dissents a “true hawkish hold,” while zero would cast doubt on December.
Timing adds a political layer. “The Fed doesn’t want to poke the White House in the eye six days before an election,” SMBC chief economist Joseph LaVorgna said ahead of the meeting.
The most plausible outcome is a hold with two hawkish dissents, a statement that again calls inflation too high, and a press conference in which Warsh keeps December open without committing to it. That would leave the December odds roughly where they are, between 73% and 79%. The bigger surprise risk is on the dovish side: no dissents, or Warsh arguing that 5% ten-year yields are already doing the Fed’s work.
DISCOVER: Bitcoin Whale Sends $35M to Coinbase at a $15M Loss as October Turns Red: What Moves BTC Next?
What Does the Fed Meeting Mean for Crypto?
History this year says the reaction matters more than the decision. Bitcoin fell in the 24 hours after three of the five holds in 2026, by an average of 2.6% across all five, with the biggest drops after January (−6.2%) and June (−5.1%). The one hike, on September 16, was followed by a 1.1% gain in a day and 11.3% in a week, as the uncertainty that had built up before it cleared.
Bitcoin after each 2026 Fed decision. Source: Binance
Options traders aren’t expecting much this time. Deribit’s DVOL index, which tracks the 30-day volatility implied by Bitcoin options, stood at 37.3 on Wednesday and has stayed between about 37 and 39 for the past two weeks. That leaves room for a surprise in either direction. A firm signal for December would lift yields and the dollar, which has tended to weigh on Bitcoin. A softer Warsh would do the opposite.
The calendar doesn’t end tonight. September’s PCE inflation and third-quarter GDP arrive on Thursday, Deribit’s monthly options expire on Friday, and the midterms follow on November 3.
DISCOVER: Meme coin supercycle: Top performers this week
Bitcoin Price Analysis: Can BTC Get Back Above $83,624 After the Fed?
Bitcoin has some room above its moving averages but hasn’t retaken October’s open. It trades at $81,430 on Binance, above its 50-day exponential moving average (EMA) at $80,829 and the 200-day EMA at $76,442.
Resistance: $83,624, the October open. A close above it would put the month back in the green.
Support: $79,221, the October 24 low, which held through three dips this week.
BTCUSDT Chart 1D
Outlook Trigger Level to watch Rebound A daily close above $83,624 after a balanced Warsh $84,898, the October 21 high Holding pattern Holding between $79,221 and $83,624 The 50-day EMA at $80,829 Sell-off A daily close below $79,221 on a firm December signal $76,442, the 200-day EMA
Today’s Fed meeting is expected to end in a hold. What moves markets will be the dissents and Warsh’s answers about December, and Thursday’s PCE report will show whether the inflation case for a hike is getting stronger.
EXPLORE: Bitcoin Holds $79,200 Before the Fed, Coinbase Earnings and a $10.9B Expiry: Which Way Next?
next
The post Fed Meeting Today: Traders Price a 95% Hold and a 79% December Hike. What Does It Mean for Crypto? appeared first on Coinspeaker.
385
·
--
Статья
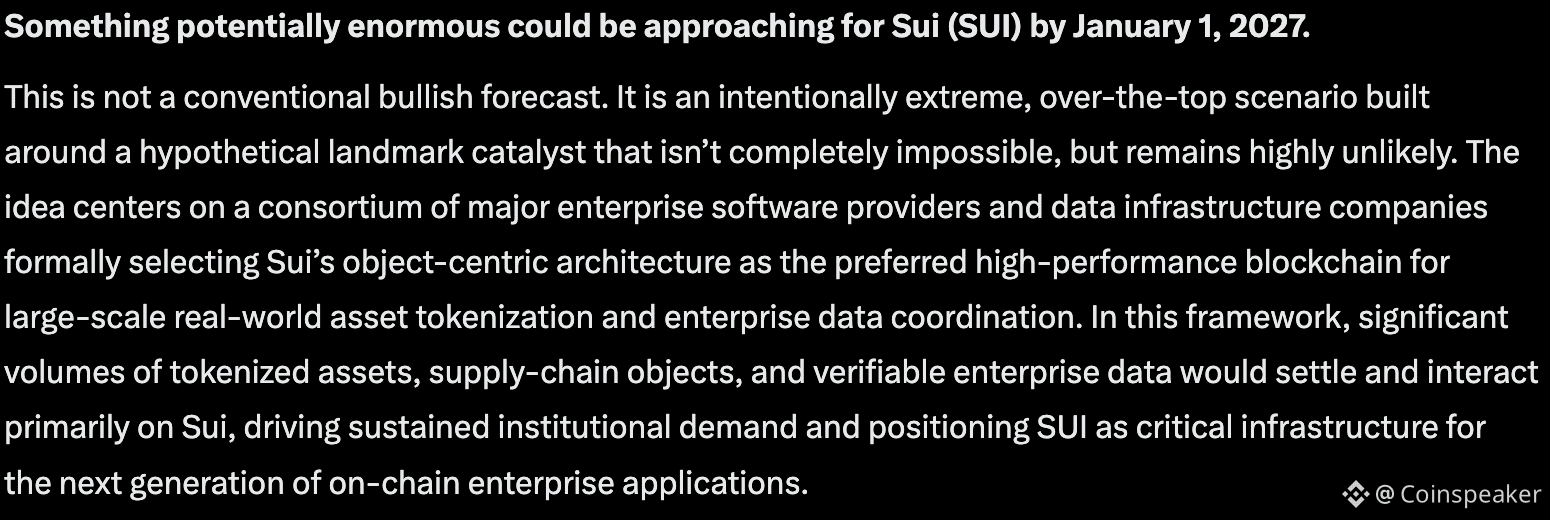
Meta AI Predicts a Generational Q4 Move for SUI CryptoMark Zuckerberg’s Meta AI predicts that something potentially significant could be on the horizon for Sui (SUI) by January 1, 2027. This isn’t a typical bullish prediction; it is an intentionally exaggerated scenario built around a hypothetical landmark event that, while not impossible, remains unlikely.
The concept involves a consortium of major enterprise software providers and data infrastructure companies formally choosing Sui’s object-centric architecture as the preferred high-performance blockchain for large-scale tokenization of real-world assets and coordination of enterprise data.
In this scenario, substantial volumes of tokenized assets, supply chain objects, and verifiable enterprise data would primarily settle and interact on the Sui platform. This would drive sustained institutional demand and position SUI as essential infrastructure for the next generation of on-chain enterprise applications.
(SOURCE: Meta AI Predicts Huge SUI Move)
SUI Crypto Technical Analysis: How Crucial is a $1 Reclaim to the Meta AI Prediction?
On the higher timeframes, SUI has been consolidating in the $0.92–$0.95 region after a broader pullback from higher levels earlier in the cycle. Price continues to hold above key intermediate supports while facing resistance around the $1.00–$1.10 zone.
In a standard bull market, a sustained breakout above $1.30–$1.50 would confirm intermediate strength and open the path toward higher cycle targets and a longer-term recovery toward the prior all-time high near $5.35.
Under the extreme enterprise RWA and data-coordination adoption scenario outlined above, clearing significant resistance levels would likely trigger powerful measured-move extensions and multi-cycle Fibonacci projections from the longer-term base.
(SOURCE: TradingView)
Momentum indicators currently sit in neutral-to-oversold territory with substantial room to run into the extreme overbought readings typical of parabolic advances.
Key nearer-term supports sit near $0.90–$0.92 and $0.85–$0.88; holding those levels would keep the broader recovery structure intact.
EXPLORE: China’s AI Bubble Bursts With $480Bn Wiped Out: Is the US Next, and Is Bitcoin Exposed?
Supporting Catalysts Beyond SUI: Rate Cuts, Iran/US Conflict, and a Potentail Russia/Ukraine Ceasefire
TODAY'S FOMC IS THE MOST IMPORTANT ONE IN Q4.
And the reason is inflation.
Since the last FOMC meeting, CPI has hit a 4-month high while PPI is almost at a 4-year high.
When the Fed hiked rates at the last FOMC meeting, Kevin Warsh said that the Fed is committed to bringing… pic.twitter.com/dUSSRC07WF
— Crypto Rover (@cryptorover) October 28, 2026
Several external factors could enhance this optimistic outlook. Globally, a lasting resolution to major geopolitical conflicts, such as the Russia-Ukraine war or a stable ceasefire involving Iran, along with the normalization of the Strait of Hormuz, could lower risk premiums and encourage capital to flow back into growth and technology sectors.
From an economic perspective, a clear shift by major central banks toward more accommodative monetary policies, coupled with elevated liquidity conditions, would promote risk-taking across markets.
In the cryptocurrency space, continued growth in Bitcoin and Ethereum ETF inflows, broader institutional adoption of high-performance Layer-1 networks, increasing volumes in real-world asset tokenization, and a sustained return of interest in altcoins would create a favorable liquidity environment. This would particularly benefit object-centric, high-throughput chains like Sui.
Meta AI Predicts: The Big SUI Price Reveal
Under this highly speculative scenario, and assuming a full-blown crypto bull market returns alongside supportive external conditions, Sui (SUI) could reach between $28 and $50, with a stretch target toward $75+ by January 1, 2027.
This remains pure speculation and entertainment, not a realistic base-case outlook. The core catalyst would require extraordinary coordination among major enterprise technology companies and the Sui ecosystem that is currently highly unlikely.
DISCOVER: Best Meme Coins to Buy in 2026
next
The post Meta AI Predicts a Generational Q4 Move for SUI Crypto appeared first on Coinspeaker.
Meta AI Predicts a Generational Q4 Move for SUI Crypto
Mark Zuckerberg’s Meta AI predicts that something potentially significant could be on the horizon for Sui (SUI) by January 1, 2027. This isn’t a typical bullish prediction; it is an intentionally exaggerated scenario built around a hypothetical landmark event that, while not impossible, remains unlikely.
The concept involves a consortium of major enterprise software providers and data infrastructure companies formally choosing Sui’s object-centric architecture as the preferred high-performance blockchain for large-scale tokenization of real-world assets and coordination of enterprise data.
In this scenario, substantial volumes of tokenized assets, supply chain objects, and verifiable enterprise data would primarily settle and interact on the Sui platform. This would drive sustained institutional demand and position SUI as essential infrastructure for the next generation of on-chain enterprise applications.
(SOURCE: Meta AI Predicts Huge SUI Move)
SUI Crypto Technical Analysis: How Crucial is a $1 Reclaim to the Meta AI Prediction?
On the higher timeframes, SUI has been consolidating in the $0.92–$0.95 region after a broader pullback from higher levels earlier in the cycle. Price continues to hold above key intermediate supports while facing resistance around the $1.00–$1.10 zone.
In a standard bull market, a sustained breakout above $1.30–$1.50 would confirm intermediate strength and open the path toward higher cycle targets and a longer-term recovery toward the prior all-time high near $5.35.
Under the extreme enterprise RWA and data-coordination adoption scenario outlined above, clearing significant resistance levels would likely trigger powerful measured-move extensions and multi-cycle Fibonacci projections from the longer-term base.
(SOURCE: TradingView)
Momentum indicators currently sit in neutral-to-oversold territory with substantial room to run into the extreme overbought readings typical of parabolic advances.
Key nearer-term supports sit near $0.90–$0.92 and $0.85–$0.88; holding those levels would keep the broader recovery structure intact.
EXPLORE: China’s AI Bubble Bursts With $480Bn Wiped Out: Is the US Next, and Is Bitcoin Exposed?
Supporting Catalysts Beyond SUI: Rate Cuts, Iran/US Conflict, and a Potentail Russia/Ukraine Ceasefire
TODAY'S FOMC IS THE MOST IMPORTANT ONE IN Q4.
And the reason is inflation.
Since the last FOMC meeting, CPI has hit a 4-month high while PPI is almost at a 4-year high.
When the Fed hiked rates at the last FOMC meeting, Kevin Warsh said that the Fed is committed to bringing… pic.twitter.com/dUSSRC07WF
— Crypto Rover (@cryptorover) October 28, 2026
Several external factors could enhance this optimistic outlook. Globally, a lasting resolution to major geopolitical conflicts, such as the Russia-Ukraine war or a stable ceasefire involving Iran, along with the normalization of the Strait of Hormuz, could lower risk premiums and encourage capital to flow back into growth and technology sectors.
From an economic perspective, a clear shift by major central banks toward more accommodative monetary policies, coupled with elevated liquidity conditions, would promote risk-taking across markets.
In the cryptocurrency space, continued growth in Bitcoin and Ethereum ETF inflows, broader institutional adoption of high-performance Layer-1 networks, increasing volumes in real-world asset tokenization, and a sustained return of interest in altcoins would create a favorable liquidity environment. This would particularly benefit object-centric, high-throughput chains like Sui.
Meta AI Predicts: The Big SUI Price Reveal
Under this highly speculative scenario, and assuming a full-blown crypto bull market returns alongside supportive external conditions, Sui (SUI) could reach between $28 and $50, with a stretch target toward $75+ by January 1, 2027.
This remains pure speculation and entertainment, not a realistic base-case outlook. The core catalyst would require extraordinary coordination among major enterprise technology companies and the Sui ecosystem that is currently highly unlikely.
DISCOVER: Best Meme Coins to Buy in 2026
next
The post Meta AI Predicts a Generational Q4 Move for SUI Crypto appeared first on Coinspeaker.
1
498
·
--
Статья
Bitcoin Whale Sends $35M to Coinbase At a $15M Loss As October Turns Red: What Moves BTC Next?A Bitcoin whale tracked by Arkham Intelligence deposited 438.37 BTC, worth $35.38 million, into Coinbase Prime early on October 28, 16 months after pulling 615.4 BTC out of the same custody service at an average price of $105,271. The deposit adds to a run of Bitcoin news about whales moving coins to exchanges, and this one comes with a $15 million paper loss.
It is a fitting end to a month that was supposed to be “Uptober.” Bitcoin trades at $81,445, up 2.2% in 24 hours but down 2.5% since October 1, with three days left.
So are whales really heading for the exits, and which dates could decide where Bitcoin goes from here?
Bitcoin Whale: $35M to Coinbase Prime
Whale bc1q9 deposited 438.37 BTC ($35.38M) overnight, 16 months after withdrawing 615.4 BTC from Coinbase Prime Custody at an average price of $105,271.
BTC is $80,807. He's down over $15M on the stack and still holds $14.31M. pic.twitter.com/ASH6nopd0x
— Arkham (@arkham) October 28, 2026
DISCOVER: Best Meme Coins to Buy in 2026
Bitcoin News: Are Whales Sending BTC to Exchanges?
This one is, but the wider flows are mixed. The address bc1q9kaa…l77q had sat dormant since June 24, 2025, when it received 615.4 BTC from Coinbase Prime Custody. On October 28 at 00:48 UTC, it sent 438.37 BTC to a Coinbase Prime deposit address and kept 177.03 BTC, which the blockchain confirms it still holds.
A deposit to an exchange is usually read as a step toward selling. The whale has not said why it moved, and Coinbase Prime also serves institutions that hedge or lend against their coins.
The market as a whole pulled the other way on Tuesday. CryptoQuant’s preliminary data showed a net 12,570 BTC, about $1.01 billion, leaving exchanges on October 27, a day after a net inflow of more than 7,000 BTC.
On Binance, the 30-day average of whale deposits has fallen from $5.9 billion in late August to $3.8 billion, analyst Darkfost noted, while retail deposits have been rising since September.
DISCOVER: Bitcoin Holds $79,200 Before the Fed, Coinbase Earnings and a $10.9B Expiry: Which Way Next?
October has been disappointing enough to threaten a pattern. Bitcoin opened the month at $83,624 on Binance, touched $87,220 on October 2, then lost the high ground and fell as low as $79,221 on October 24.
To finish the month green, it needs to close Saturday above $83,624, about 2.7% above the current price. If it doesn’t, 2026 will bring the first back-to-back losing Octobers in more than a decade, after October 2025 closed 3.9% lower on Binance.
Before 2025, Bitcoin’s only red Octobers since 2013 came in 2014 and 2018.
What Events Could Move Bitcoin’s Price Next?
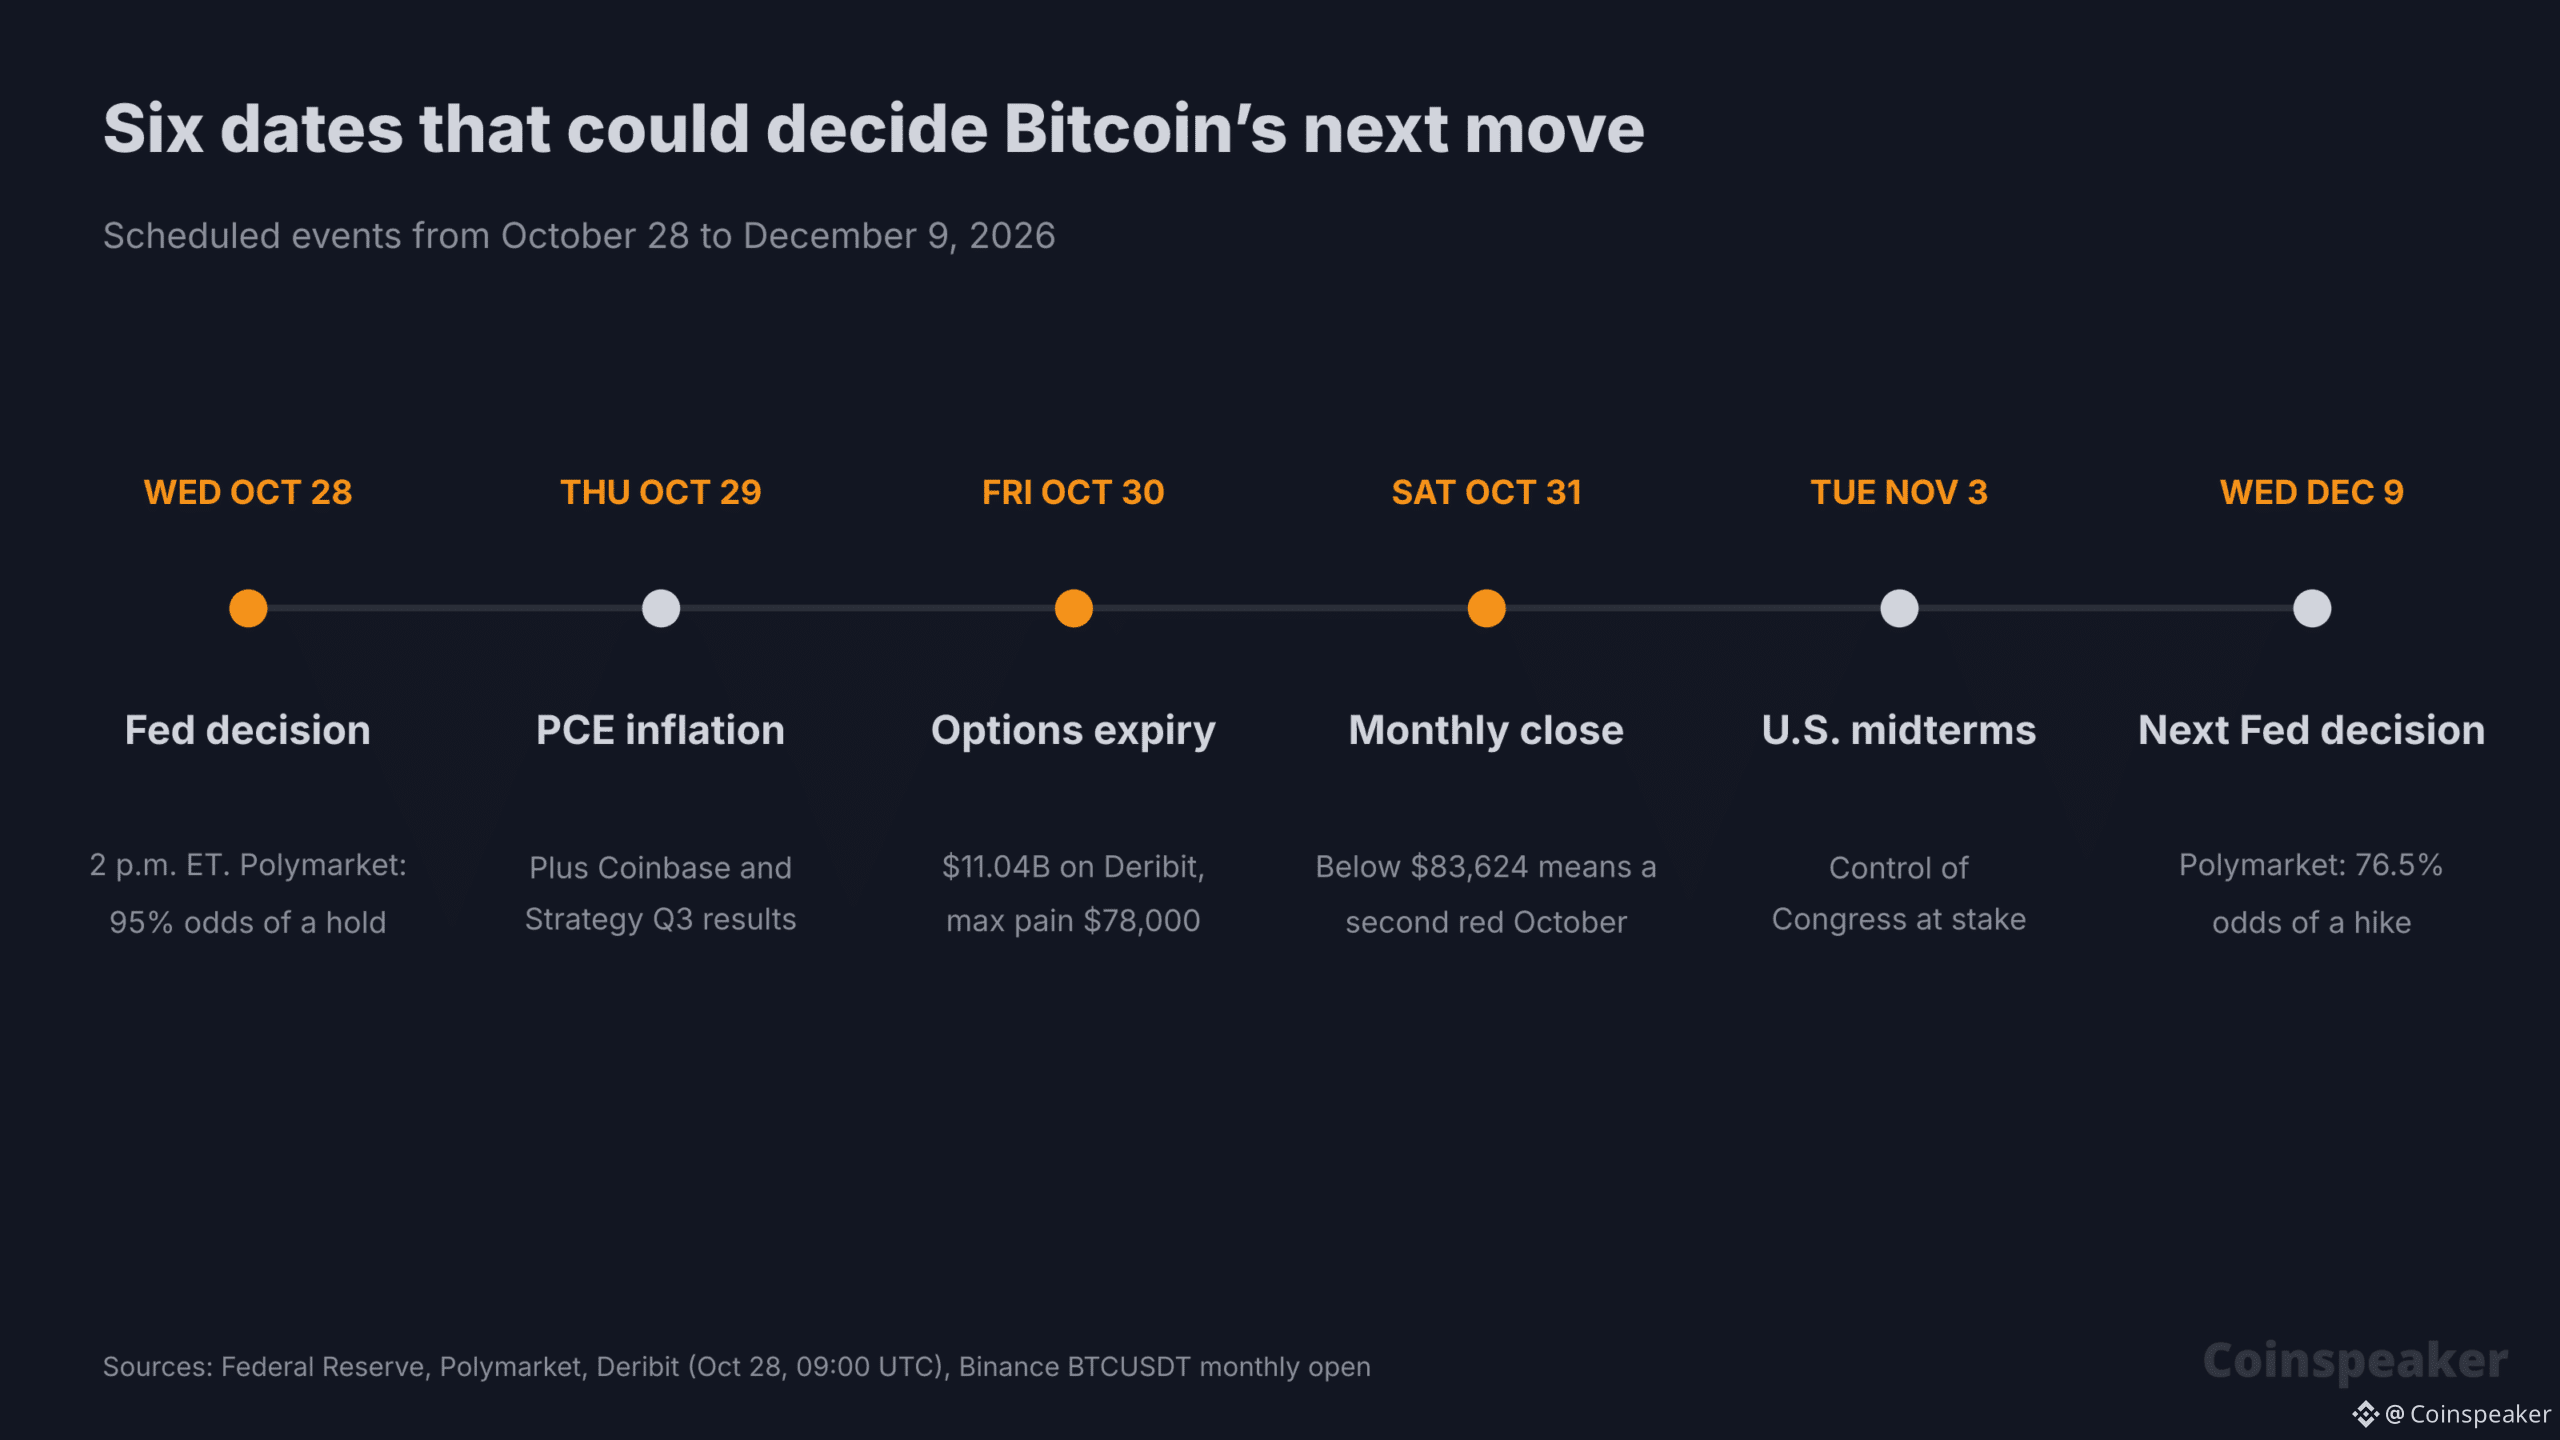
The Federal Reserve comes first, today, and it is the Bitcoin news traders are waiting for. Then the next five weeks bring an options expiry, the monthly close, the U.S. midterms and another Fed meeting that markets already lean toward a hike.
Key dates for Bitcoin, October 28 to December 9, 2026. Sources: Federal Reserve, Polymarket, Deribit
Fed decision, October 28: the statement lands at 2 p.m. ET, with Chair Kevin Warsh’s press conference at 2:30. After a 25 basis-point hike in September to 3.75%–4.00%, Polymarket traders give a hold 95% odds.
PCE and earnings, October 29: September’s PCE inflation follows a hotter-than-expected 3.7% CPI print. Coinbase and Strategy report third-quarter results after the U.S. close.
Options expiry, October 30: Deribit’s monthly Bitcoin options settle at 08:00 UTC. Open interest on that date stands at 135,452 BTC, about $11.04 billion and 34.4% of Deribit’s total, with a put-call ratio of 0.53 and max pain, the strike where option buyers lose the most, at $78,000.
Midterms, November 3: control of Congress, and with it the pace of crypto legislation, is on the ballot.
Fed, December 9: Polymarket puts a December hike at 76.5%.
DISCOVER: Meme coin supercycle: Top performers this week
Bitcoin Price Analysis: Can BTC Get Back to $83,624 Before the Month Ends?
It has the room, but not the momentum yet. Bitcoin sits just above its 50-day EMA at $80,833 after bouncing from $79,221 on Saturday, with the 200-day EMA far below at $76,443.
The line for October: $83,624, the monthly open. A close above it turns the month green.
Resistance: $84,898, the October 21 high that started last week’s drop.
Support: $79,221, the October 24 low that held through three more dips this week.
BTCUSDT Chart 1D TradingView
Outlook Trigger Level to watch Rebound A daily close above $83,624 $84,898, the October 21 high Holding pattern Holding between $79,221 and $83,624 A red October close above the 50-day EMA at $80,833 Sell-off A daily close below $79,221 $76,443, the 200-day EMA
One whale’s deposit won’t decide the month. Warsh’s tone this afternoon might. A hawkish press conference that sends Bitcoin back toward Friday’s $78,000 max pain would all but lock in a second red October; a calm one leaves $83,624 within reach.
EXPLORE: China’s AI Bubble Bursts With $480 Billion Wiped Out: Is the US Next, and Is Bitcoin Exposed?
next
The post Bitcoin Whale Sends $35M to Coinbase at a $15M Loss as October Turns Red: What Moves BTC Next? appeared first on Coinspeaker.
Bitcoin Whale Sends $35M to Coinbase At a $15M Loss As October Turns Red: What Moves BTC Next?
A Bitcoin whale tracked by Arkham Intelligence deposited 438.37 BTC, worth $35.38 million, into Coinbase Prime early on October 28, 16 months after pulling 615.4 BTC out of the same custody service at an average price of $105,271. The deposit adds to a run of Bitcoin news about whales moving coins to exchanges, and this one comes with a $15 million paper loss.
It is a fitting end to a month that was supposed to be “Uptober.” Bitcoin trades at $81,445, up 2.2% in 24 hours but down 2.5% since October 1, with three days left.
So are whales really heading for the exits, and which dates could decide where Bitcoin goes from here?
Bitcoin Whale: $35M to Coinbase Prime
Whale bc1q9 deposited 438.37 BTC ($35.38M) overnight, 16 months after withdrawing 615.4 BTC from Coinbase Prime Custody at an average price of $105,271.
BTC is $80,807. He's down over $15M on the stack and still holds $14.31M. pic.twitter.com/ASH6nopd0x
— Arkham (@arkham) October 28, 2026
DISCOVER: Best Meme Coins to Buy in 2026
Bitcoin News: Are Whales Sending BTC to Exchanges?
This one is, but the wider flows are mixed. The address bc1q9kaa…l77q had sat dormant since June 24, 2025, when it received 615.4 BTC from Coinbase Prime Custody. On October 28 at 00:48 UTC, it sent 438.37 BTC to a Coinbase Prime deposit address and kept 177.03 BTC, which the blockchain confirms it still holds.
A deposit to an exchange is usually read as a step toward selling. The whale has not said why it moved, and Coinbase Prime also serves institutions that hedge or lend against their coins.
The market as a whole pulled the other way on Tuesday. CryptoQuant’s preliminary data showed a net 12,570 BTC, about $1.01 billion, leaving exchanges on October 27, a day after a net inflow of more than 7,000 BTC.
On Binance, the 30-day average of whale deposits has fallen from $5.9 billion in late August to $3.8 billion, analyst Darkfost noted, while retail deposits have been rising since September.
DISCOVER: Bitcoin Holds $79,200 Before the Fed, Coinbase Earnings and a $10.9B Expiry: Which Way Next?
October has been disappointing enough to threaten a pattern. Bitcoin opened the month at $83,624 on Binance, touched $87,220 on October 2, then lost the high ground and fell as low as $79,221 on October 24.
To finish the month green, it needs to close Saturday above $83,624, about 2.7% above the current price. If it doesn’t, 2026 will bring the first back-to-back losing Octobers in more than a decade, after October 2025 closed 3.9% lower on Binance.
Before 2025, Bitcoin’s only red Octobers since 2013 came in 2014 and 2018.
What Events Could Move Bitcoin’s Price Next?
The Federal Reserve comes first, today, and it is the Bitcoin news traders are waiting for. Then the next five weeks bring an options expiry, the monthly close, the U.S. midterms and another Fed meeting that markets already lean toward a hike.
Key dates for Bitcoin, October 28 to December 9, 2026. Sources: Federal Reserve, Polymarket, Deribit
Fed decision, October 28: the statement lands at 2 p.m. ET, with Chair Kevin Warsh’s press conference at 2:30. After a 25 basis-point hike in September to 3.75%–4.00%, Polymarket traders give a hold 95% odds.
PCE and earnings, October 29: September’s PCE inflation follows a hotter-than-expected 3.7% CPI print. Coinbase and Strategy report third-quarter results after the U.S. close.
Options expiry, October 30: Deribit’s monthly Bitcoin options settle at 08:00 UTC. Open interest on that date stands at 135,452 BTC, about $11.04 billion and 34.4% of Deribit’s total, with a put-call ratio of 0.53 and max pain, the strike where option buyers lose the most, at $78,000.
Midterms, November 3: control of Congress, and with it the pace of crypto legislation, is on the ballot.
Fed, December 9: Polymarket puts a December hike at 76.5%.
DISCOVER: Meme coin supercycle: Top performers this week
Bitcoin Price Analysis: Can BTC Get Back to $83,624 Before the Month Ends?
It has the room, but not the momentum yet. Bitcoin sits just above its 50-day EMA at $80,833 after bouncing from $79,221 on Saturday, with the 200-day EMA far below at $76,443.
The line for October: $83,624, the monthly open. A close above it turns the month green.
Resistance: $84,898, the October 21 high that started last week’s drop.
Support: $79,221, the October 24 low that held through three more dips this week.
BTCUSDT Chart 1D TradingView
Outlook Trigger Level to watch Rebound A daily close above $83,624 $84,898, the October 21 high Holding pattern Holding between $79,221 and $83,624 A red October close above the 50-day EMA at $80,833 Sell-off A daily close below $79,221 $76,443, the 200-day EMA
One whale’s deposit won’t decide the month. Warsh’s tone this afternoon might. A hawkish press conference that sends Bitcoin back toward Friday’s $78,000 max pain would all but lock in a second red October; a calm one leaves $83,624 within reach.
EXPLORE: China’s AI Bubble Bursts With $480 Billion Wiped Out: Is the US Next, and Is Bitcoin Exposed?
next
The post Bitcoin Whale Sends $35M to Coinbase at a $15M Loss as October Turns Red: What Moves BTC Next? appeared first on Coinspeaker.
282
·
--
Проверено
Статья
China’s AI Bubble Bursts With $480 Billion Wiped Out: Is the US Next, and Is Bitcoin Exposed?China’s AI bubble has burst: the STAR50 index of Chinese AI and chip leaders has lost about 40% in under four months, erasing roughly $480 billion. Reuters’ analysis showed on Monday, October 26, how stretched valuations and Western equipment bans broke the rally. The selling didn’t stop there. On Tuesday, Cambricon, China’s answer to Nvidia, fell another 5.7%.
The damage has spread across Asia, and U.S. chip stocks are already 24% below their June high. So is America’s AI trade next, and what would that mean for Bitcoin and AI crypto tokens?
The AI bubble in China has officially bursted.
The burst wiped out $480 BILLION in value and has affected all of the Chinese market. pic.twitter.com/LV1lKcnRGD
— ToonHive (@ToonHive) October 27, 2026
DISCOVER: Best Meme Coins to Buy in 2026
China AI Bubble Burst: What Happened?
A rally that ran far ahead of earnings. At its peak, the STAR50 traded near 250 times trailing earnings; even after the crash, it sits around 100 times, against roughly 30 for the Nasdaq 100.
The individual names tell the story. Robot maker Unitree, whose IPO retail buyers oversubscribed 8,000 times, has halved since its August debut. GPU makers MetaX and Moore Threads have each roughly halved since July. Optical suppliers Zhongji Innolight and Eoptolink are down about 60% from their summer highs as Washington moves to bar them from U.S. data centers. Cambricon is down 42.8% from its June 30 close and SMIC 49.3%.
There was no single trigger. Traders pointed to valuations, tax bills and the equipment bans, while state-backed investors sold into rallies as regulators cracked down on leverage and high-frequency trading. With AI stocks making up 42% of China’s market value and 57% of its turnover, by Goldman Sachs’ count, the slide pulled the CSI 300 about 20% below its June high.
Korea took the hit too. SK Hynix, the memory maker at the heart of the AI chip trade, is down 49.4% since June 30, and the KOSPI is down 33.5%.
DISCOVER: Anthropic IPO Filing Puts “ANT” on Nasdaq: Could the Claude Maker Debut Bigger Than Bitcoin?
Is the US AI Bubble Next?
Partly, it is already here. The Philadelphia Semiconductor Index closed Monday 24.3% below its June 22 high, past the 20% line that marks a bear market. Nvidia is 9.7% off its October 6 high.
The broad market has held up far better. The Nasdaq Composite is only 5.2% below its record, and Nasdaq 100 futures were up 0.1% on Tuesday morning. The valuation gap is the main buffer: U.S. AI leaders trade at about a third of the STAR50’s multiple and, unlike most of China’s chip names, earn large profits.
Traders aren’t pricing a U.S. crash. A Polymarket contract on whether the AI bubble bursts gives 9.4% for 2026 and 22.5% by June 30, 2027. The next tests come fast: the Fed decides on Wednesday, and Anthropic’s IPO will soon ask investors for billions more for AI.
DISCOVER: Meme coin supercycle: Top performers this week
What Does the AI Bubble Mean for Bitcoin and AI Crypto?
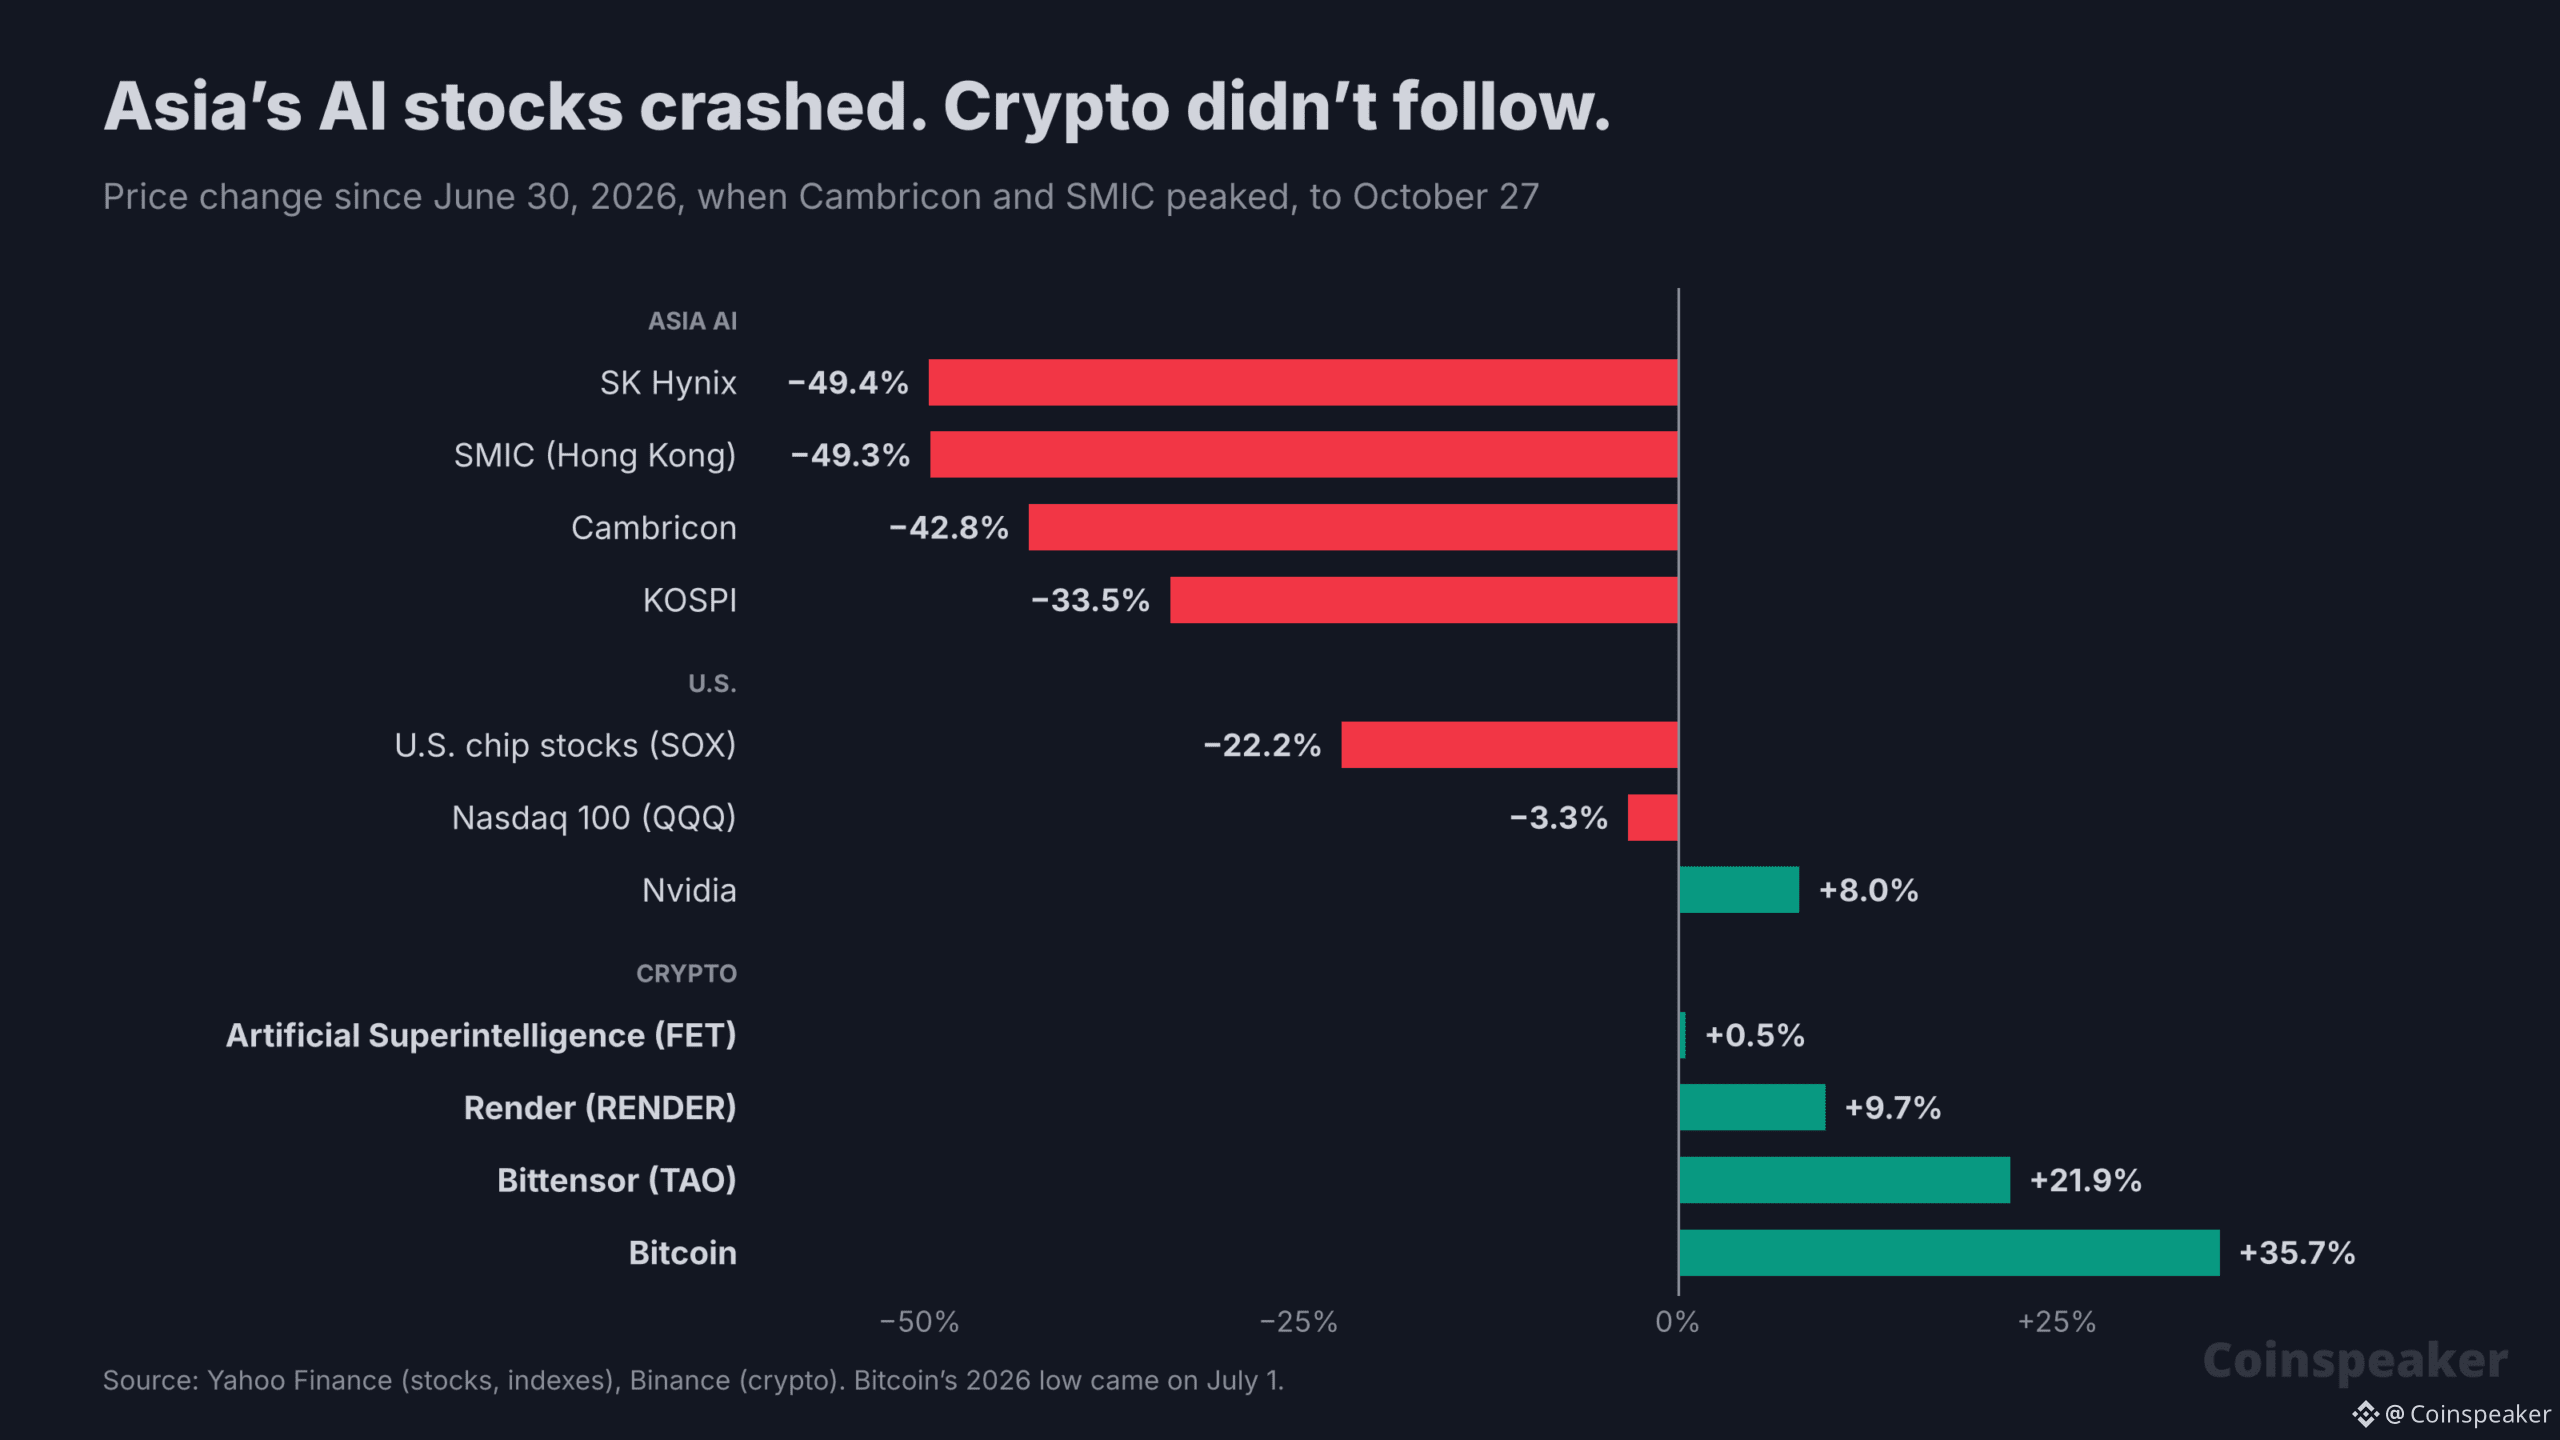
So far, very little. Since June 30, when Cambricon and SMIC peaked, Bitcoin has gained 35.7%, Bittensor’s TAO 21.9%, and Render 9.7%, while the Artificial Superintelligence Alliance’s FET is flat. Bitcoin’s 2026 low came on July 1, so the window flatters it, but the direction is clear.
Price change since June 30, 2026. Source: Yahoo Finance, Binance
Over the past 90 days, the daily moves of Bitcoin and TAO have shown almost no link to Cambricon’s, with correlations of −0.06 and −0.08. China’s domestic AI crash has stayed in China.
A U.S. sell-off would be different. Bitcoin’s daily moves have tracked the Nasdaq 100 more closely, with a correlation of 0.37, and AI tokens follow Bitcoin first: TAO’s correlation with Bitcoin is 0.71, against 0.36 with U.S. chip stocks. When the market turns, AI tokens fall harder.
Over the past 30 days, TAO lost 25%, FET 29%, and Virtuals Protocol 25%, while Bitcoin lost 6.4%.
Bitcoin Price Analysis: Can BTC Hold $79,221?
Bitcoin trades at $79,517, down 1.1% in 24 hours and below its 50-day EMA at $80,752. Saturday’s low of $79,221 is the support that buyers have defended twice, and Tuesday’s dip stopped at $79,421, just above it.
Resistance sits at $81,480, where last week’s rebounds stalled, then $82,850. Below $79,221, the next floor is the 200-day EMA at $76,379.
BTCUSDT Chart 1D TradingView
Scenario What it takes Where BTC could go Breakout A daily close above $81,480 $82,850, last week’s ceiling Range Holding between $79,221 and $81,480 Back and forth around the 50-day EMA at $80,752 Breakdown A daily close below $79,221 $76,379, the 200-day EMA
China’s AI bubble burst without touching crypto. The one to watch is the U.S. version: if the Nasdaq follows its chip stocks lower, Bitcoin is likely to feel it, and AI tokens more.
EXPLORE: Bitcoin Holds $79,200 Before the Fed, Coinbase Earnings and a $10.9B Expiry: Which Way Next?
next
The post China’s AI Bubble Bursts With $480 Billion Wiped Out: Is the US Next, and Is Bitcoin Exposed? appeared first on Coinspeaker.
China’s AI Bubble Bursts With $480 Billion Wiped Out: Is the US Next, and Is Bitcoin Exposed?
China’s AI bubble has burst: the STAR50 index of Chinese AI and chip leaders has lost about 40% in under four months, erasing roughly $480 billion. Reuters’ analysis showed on Monday, October 26, how stretched valuations and Western equipment bans broke the rally. The selling didn’t stop there. On Tuesday, Cambricon, China’s answer to Nvidia, fell another 5.7%.
The damage has spread across Asia, and U.S. chip stocks are already 24% below their June high. So is America’s AI trade next, and what would that mean for Bitcoin and AI crypto tokens?
The AI bubble in China has officially bursted.
The burst wiped out $480 BILLION in value and has affected all of the Chinese market. pic.twitter.com/LV1lKcnRGD
— ToonHive (@ToonHive) October 27, 2026
DISCOVER: Best Meme Coins to Buy in 2026
China AI Bubble Burst: What Happened?
A rally that ran far ahead of earnings. At its peak, the STAR50 traded near 250 times trailing earnings; even after the crash, it sits around 100 times, against roughly 30 for the Nasdaq 100.
The individual names tell the story. Robot maker Unitree, whose IPO retail buyers oversubscribed 8,000 times, has halved since its August debut. GPU makers MetaX and Moore Threads have each roughly halved since July. Optical suppliers Zhongji Innolight and Eoptolink are down about 60% from their summer highs as Washington moves to bar them from U.S. data centers. Cambricon is down 42.8% from its June 30 close and SMIC 49.3%.
There was no single trigger. Traders pointed to valuations, tax bills and the equipment bans, while state-backed investors sold into rallies as regulators cracked down on leverage and high-frequency trading. With AI stocks making up 42% of China’s market value and 57% of its turnover, by Goldman Sachs’ count, the slide pulled the CSI 300 about 20% below its June high.
Korea took the hit too. SK Hynix, the memory maker at the heart of the AI chip trade, is down 49.4% since June 30, and the KOSPI is down 33.5%.
DISCOVER: Anthropic IPO Filing Puts “ANT” on Nasdaq: Could the Claude Maker Debut Bigger Than Bitcoin?
Is the US AI Bubble Next?
Partly, it is already here. The Philadelphia Semiconductor Index closed Monday 24.3% below its June 22 high, past the 20% line that marks a bear market. Nvidia is 9.7% off its October 6 high.
The broad market has held up far better. The Nasdaq Composite is only 5.2% below its record, and Nasdaq 100 futures were up 0.1% on Tuesday morning. The valuation gap is the main buffer: U.S. AI leaders trade at about a third of the STAR50’s multiple and, unlike most of China’s chip names, earn large profits.
Traders aren’t pricing a U.S. crash. A Polymarket contract on whether the AI bubble bursts gives 9.4% for 2026 and 22.5% by June 30, 2027. The next tests come fast: the Fed decides on Wednesday, and Anthropic’s IPO will soon ask investors for billions more for AI.
DISCOVER: Meme coin supercycle: Top performers this week
What Does the AI Bubble Mean for Bitcoin and AI Crypto?
So far, very little. Since June 30, when Cambricon and SMIC peaked, Bitcoin has gained 35.7%, Bittensor’s TAO 21.9%, and Render 9.7%, while the Artificial Superintelligence Alliance’s FET is flat. Bitcoin’s 2026 low came on July 1, so the window flatters it, but the direction is clear.
Price change since June 30, 2026. Source: Yahoo Finance, Binance
Over the past 90 days, the daily moves of Bitcoin and TAO have shown almost no link to Cambricon’s, with correlations of −0.06 and −0.08. China’s domestic AI crash has stayed in China.
A U.S. sell-off would be different. Bitcoin’s daily moves have tracked the Nasdaq 100 more closely, with a correlation of 0.37, and AI tokens follow Bitcoin first: TAO’s correlation with Bitcoin is 0.71, against 0.36 with U.S. chip stocks. When the market turns, AI tokens fall harder.
Over the past 30 days, TAO lost 25%, FET 29%, and Virtuals Protocol 25%, while Bitcoin lost 6.4%.
Bitcoin Price Analysis: Can BTC Hold $79,221?
Bitcoin trades at $79,517, down 1.1% in 24 hours and below its 50-day EMA at $80,752. Saturday’s low of $79,221 is the support that buyers have defended twice, and Tuesday’s dip stopped at $79,421, just above it.
Resistance sits at $81,480, where last week’s rebounds stalled, then $82,850. Below $79,221, the next floor is the 200-day EMA at $76,379.
BTCUSDT Chart 1D TradingView
Scenario What it takes Where BTC could go Breakout A daily close above $81,480 $82,850, last week’s ceiling Range Holding between $79,221 and $81,480 Back and forth around the 50-day EMA at $80,752 Breakdown A daily close below $79,221 $76,379, the 200-day EMA
China’s AI bubble burst without touching crypto. The one to watch is the U.S. version: if the Nasdaq follows its chip stocks lower, Bitcoin is likely to feel it, and AI tokens more.
EXPLORE: Bitcoin Holds $79,200 Before the Fed, Coinbase Earnings and a $10.9B Expiry: Which Way Next?
next
The post China’s AI Bubble Bursts With $480 Billion Wiped Out: Is the US Next, and Is Bitcoin Exposed? appeared first on Coinspeaker.
2
772
·
--
Статья
Willy Woo Runs 10,000 Bitcoin Simulations and Finds a 2028 Top Near $413,000: How Real Is It?On-chain analyst Willy Woo posted 10,000 simulated price paths for Bitcoin on Monday, October 26, from a random-walk model trained on BTC’s history that builds in the shrinking returns of each cycle, to map where the next tops and bottoms could land. The Bitcoin news traders noticed: the median path peaks at $413,000 in December 2028.
Woo himself is more cautious. “She’s optimistic,” he wrote, naming the band between roughly the 28th and 50th percentile as reasonable, a 2028 top between $241,000 and $413,000, and adding: “It’s a simulation, NOT my prediction.”
Bitcoin trades at $79,770 today. So what did the model find, and what does it leave out?
10,000 POSSIBLE FUTURE PATHS
A random-walk simulation trained on BTC accounting for power law degradation of returns.
She's optimistic, I think between 28th and 50th percentile is reasonable.
i.e. 2028 top between 241k-413k
It's a simulation, NOT my prediction. pic.twitter.com/RpjaRKkSQJ
— Willy Woo (@willywoo) October 26, 2026
Market Intelligence: Crypto Analyst Predicts Best Low-Cap Crypto
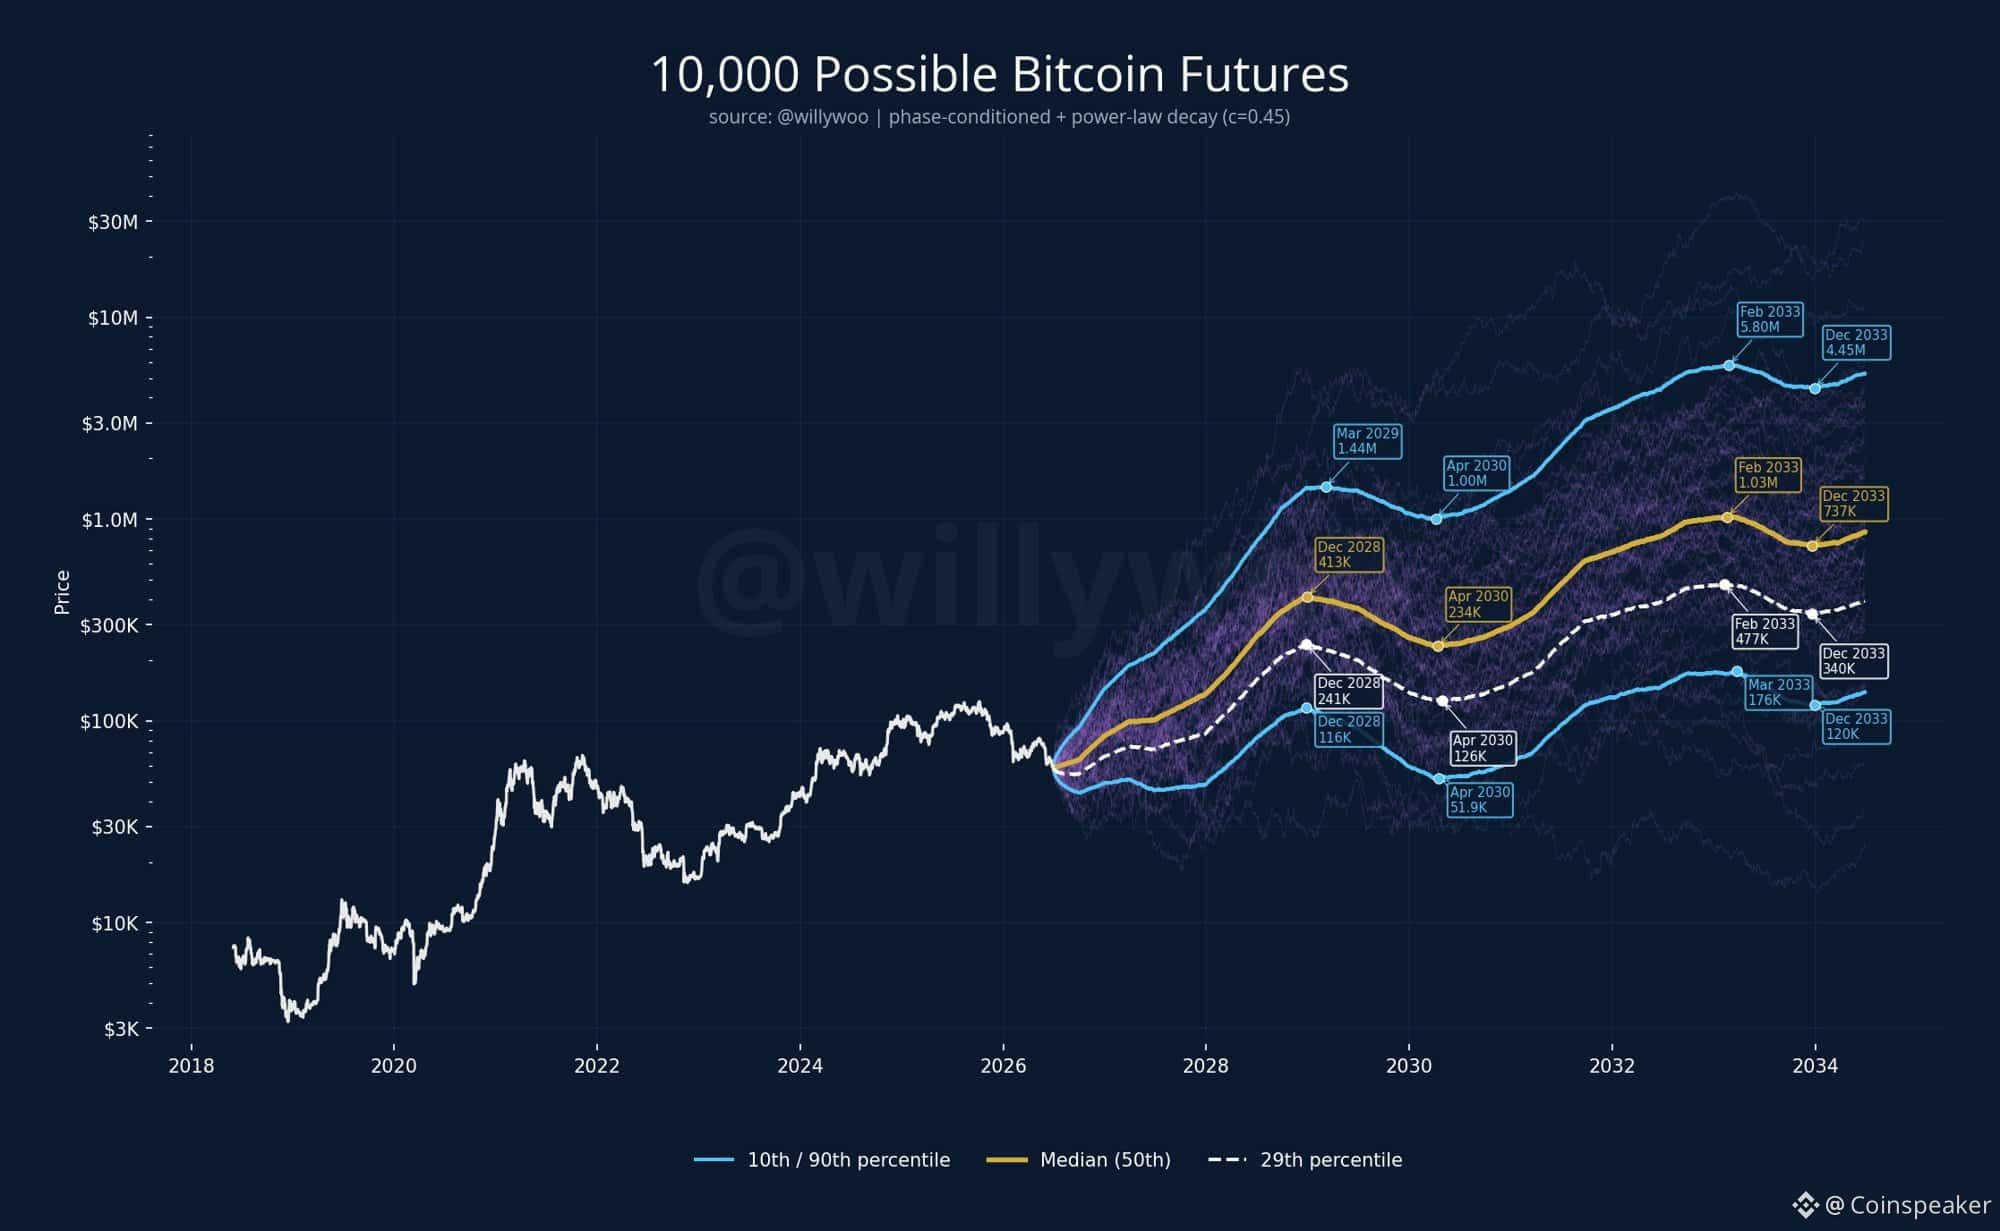
Bitcoin News: What Did Willy Woo’s 10,000 Simulated Paths Show?
A rising staircase with deep steps. Every percentile line keeps Bitcoin’s four-year rhythm: a top in late 2028 or early 2029, a bear-market low around April 2030, and another peak in February 2033.
Path 2028–29 top April 2030 low February 2033 top 90th percentile $1.44 million (March 2029) $1.00 million $5.80 million Median $413,000 (December 2028) $234,000 $1.03 million 29th percentile $241,000 (December 2028) $126,000 $477,000 10th percentile $116,000 (December 2028) $51,900 $176,000
The spread is the real result. By February 2033, the 90th percentile sits 33 times above the 10th. Even the gloomy 10th percentile ends 2033 at $120,000, but its 2030 low of $51,900 is about 35% below today’s price.
10,000 simulated Bitcoin price paths. Source: Willy Woo on X
What is the “power-law degradation of returns”? It is the idea that each Bitcoin cycle grows by less than the one before. The bigger the asset gets, the more money it takes to move it.
The history fits. Bitcoin went from about $1,150 at its 2013 top to nearly $20,000 in late 2017, a 17-fold gain. The 2021 top of $69,000 was about 3.5 times that, and October 2025’s record of $126,080 was only 1.8 times.
A power law describes that slide: returns fade steadily over time instead of in random jumps. The “c=0.45” in the chart’s subtitle sets how fast they fade. “Phase-conditioned” means each simulated day is drawn to match where Bitcoin sits in its cycle, whether rally, top, bear market, or recovery, which is why all 10,000 paths keep the four-year shape.
Next to that history, the median still looks generous. A $413,000 top would be 3.3 times the 2025 peak, almost double the last cycle’s gain. Woo’s lower bound, $241,000, is 1.9 times the peak, in line with the 1.8 times of the last cycle.
DISCOVER: Is Something Huge Brewing for Bitcoin? Perplexity AI Predicts a Big Move on the Horizon
What Does the Simulation Leave Out?
A lot, which is why Woo calls it a simulation. A random walk trained on past prices assumes Bitcoin will keep moving the way it has, with similar swings and the same four-year rhythm. The market around it has changed.
New buyers: U.S. spot ETFs hold about $102.8 billion of Bitcoin, and Strategy alone holds 848,517 BTC. Neither existed in earlier cycles, and their flows don’t follow the halving.
Rates and liquidity: the Federal Reserve raised rates in September and decides again on Wednesday. Every past cycle top came with easy money.
Supply: 20.1 million of the 21 million coins are already mined, so each halving cuts new supply by less in dollar terms.
Rules and risks: regulation, competition, and technical threats such as quantum computing are outside any price model.
A small sample: Bitcoin has had only four full cycles, so 10,000 paths still rest on four tops.
So the chart is a map of possibilities, with no price target and no timing in it.
Bitcoin Price Today: What Are the Levels to Watch?
Bitcoin trades at $79,770, down 2.1% in a week and 36.7% below its October 2025 record. It sits under the 50-day EMA at $80,765, and buyers defended $79,221 on Saturday and again on Monday.
Resistance comes at $81,480, where last week’s bounces stalled, and then at $82,850. Support sits at $79,221, Saturday’s low, with the 200-day EMA at $76,382 below it.
BTCUSDT 1D chart. Source: TradingView
Scenario What it takes Where BTC could go Breakout A daily close above $81,480 $82,850, last week’s ceiling Range Holding between $79,221 and $81,480 Back and forth around the 50-day EMA at $80,765 Breakdown A daily close below $79,221 $76,382, the 200-day EMA
To reach even the low end of Woo’s band by 2028, Bitcoin would need to triple from here. The Bitcoin news that matters this week is smaller: whether $79,221 holds through Wednesday’s Fed decision.
EXPLORE: Bitcoin Holds $79,200 Before the Fed, Coinbase Earnings and a $10.9B Expiry: Which Way Next?
next
The post Willy Woo Runs 10,000 Bitcoin Simulations and Finds a 2028 Top Near $413,000: How Real Is It? appeared first on Coinspeaker.
Willy Woo Runs 10,000 Bitcoin Simulations and Finds a 2028 Top Near $413,000: How Real Is It?
On-chain analyst Willy Woo posted 10,000 simulated price paths for Bitcoin on Monday, October 26, from a random-walk model trained on BTC’s history that builds in the shrinking returns of each cycle, to map where the next tops and bottoms could land. The Bitcoin news traders noticed: the median path peaks at $413,000 in December 2028.
Woo himself is more cautious. “She’s optimistic,” he wrote, naming the band between roughly the 28th and 50th percentile as reasonable, a 2028 top between $241,000 and $413,000, and adding: “It’s a simulation, NOT my prediction.”
Bitcoin trades at $79,770 today. So what did the model find, and what does it leave out?
10,000 POSSIBLE FUTURE PATHS
A random-walk simulation trained on BTC accounting for power law degradation of returns.
She's optimistic, I think between 28th and 50th percentile is reasonable.
i.e. 2028 top between 241k-413k
It's a simulation, NOT my prediction. pic.twitter.com/RpjaRKkSQJ
— Willy Woo (@willywoo) October 26, 2026
Market Intelligence: Crypto Analyst Predicts Best Low-Cap Crypto
Bitcoin News: What Did Willy Woo’s 10,000 Simulated Paths Show?
A rising staircase with deep steps. Every percentile line keeps Bitcoin’s four-year rhythm: a top in late 2028 or early 2029, a bear-market low around April 2030, and another peak in February 2033.
Path 2028–29 top April 2030 low February 2033 top 90th percentile $1.44 million (March 2029) $1.00 million $5.80 million Median $413,000 (December 2028) $234,000 $1.03 million 29th percentile $241,000 (December 2028) $126,000 $477,000 10th percentile $116,000 (December 2028) $51,900 $176,000
The spread is the real result. By February 2033, the 90th percentile sits 33 times above the 10th. Even the gloomy 10th percentile ends 2033 at $120,000, but its 2030 low of $51,900 is about 35% below today’s price.
10,000 simulated Bitcoin price paths. Source: Willy Woo on X
What is the “power-law degradation of returns”? It is the idea that each Bitcoin cycle grows by less than the one before. The bigger the asset gets, the more money it takes to move it.
The history fits. Bitcoin went from about $1,150 at its 2013 top to nearly $20,000 in late 2017, a 17-fold gain. The 2021 top of $69,000 was about 3.5 times that, and October 2025’s record of $126,080 was only 1.8 times.
A power law describes that slide: returns fade steadily over time instead of in random jumps. The “c=0.45” in the chart’s subtitle sets how fast they fade. “Phase-conditioned” means each simulated day is drawn to match where Bitcoin sits in its cycle, whether rally, top, bear market, or recovery, which is why all 10,000 paths keep the four-year shape.
Next to that history, the median still looks generous. A $413,000 top would be 3.3 times the 2025 peak, almost double the last cycle’s gain. Woo’s lower bound, $241,000, is 1.9 times the peak, in line with the 1.8 times of the last cycle.
DISCOVER: Is Something Huge Brewing for Bitcoin? Perplexity AI Predicts a Big Move on the Horizon
What Does the Simulation Leave Out?
A lot, which is why Woo calls it a simulation. A random walk trained on past prices assumes Bitcoin will keep moving the way it has, with similar swings and the same four-year rhythm. The market around it has changed.
New buyers: U.S. spot ETFs hold about $102.8 billion of Bitcoin, and Strategy alone holds 848,517 BTC. Neither existed in earlier cycles, and their flows don’t follow the halving.
Rates and liquidity: the Federal Reserve raised rates in September and decides again on Wednesday. Every past cycle top came with easy money.
Supply: 20.1 million of the 21 million coins are already mined, so each halving cuts new supply by less in dollar terms.
Rules and risks: regulation, competition, and technical threats such as quantum computing are outside any price model.
A small sample: Bitcoin has had only four full cycles, so 10,000 paths still rest on four tops.
So the chart is a map of possibilities, with no price target and no timing in it.
Bitcoin Price Today: What Are the Levels to Watch?
Bitcoin trades at $79,770, down 2.1% in a week and 36.7% below its October 2025 record. It sits under the 50-day EMA at $80,765, and buyers defended $79,221 on Saturday and again on Monday.
Resistance comes at $81,480, where last week’s bounces stalled, and then at $82,850. Support sits at $79,221, Saturday’s low, with the 200-day EMA at $76,382 below it.
BTCUSDT 1D chart. Source: TradingView
Scenario What it takes Where BTC could go Breakout A daily close above $81,480 $82,850, last week’s ceiling Range Holding between $79,221 and $81,480 Back and forth around the 50-day EMA at $80,765 Breakdown A daily close below $79,221 $76,382, the 200-day EMA
To reach even the low end of Woo’s band by 2028, Bitcoin would need to triple from here. The Bitcoin news that matters this week is smaller: whether $79,221 holds through Wednesday’s Fed decision.
EXPLORE: Bitcoin Holds $79,200 Before the Fed, Coinbase Earnings and a $10.9B Expiry: Which Way Next?
next
The post Willy Woo Runs 10,000 Bitcoin Simulations and Finds a 2028 Top Near $413,000: How Real Is It? appeared first on Coinspeaker.
457
·
--
Проверено
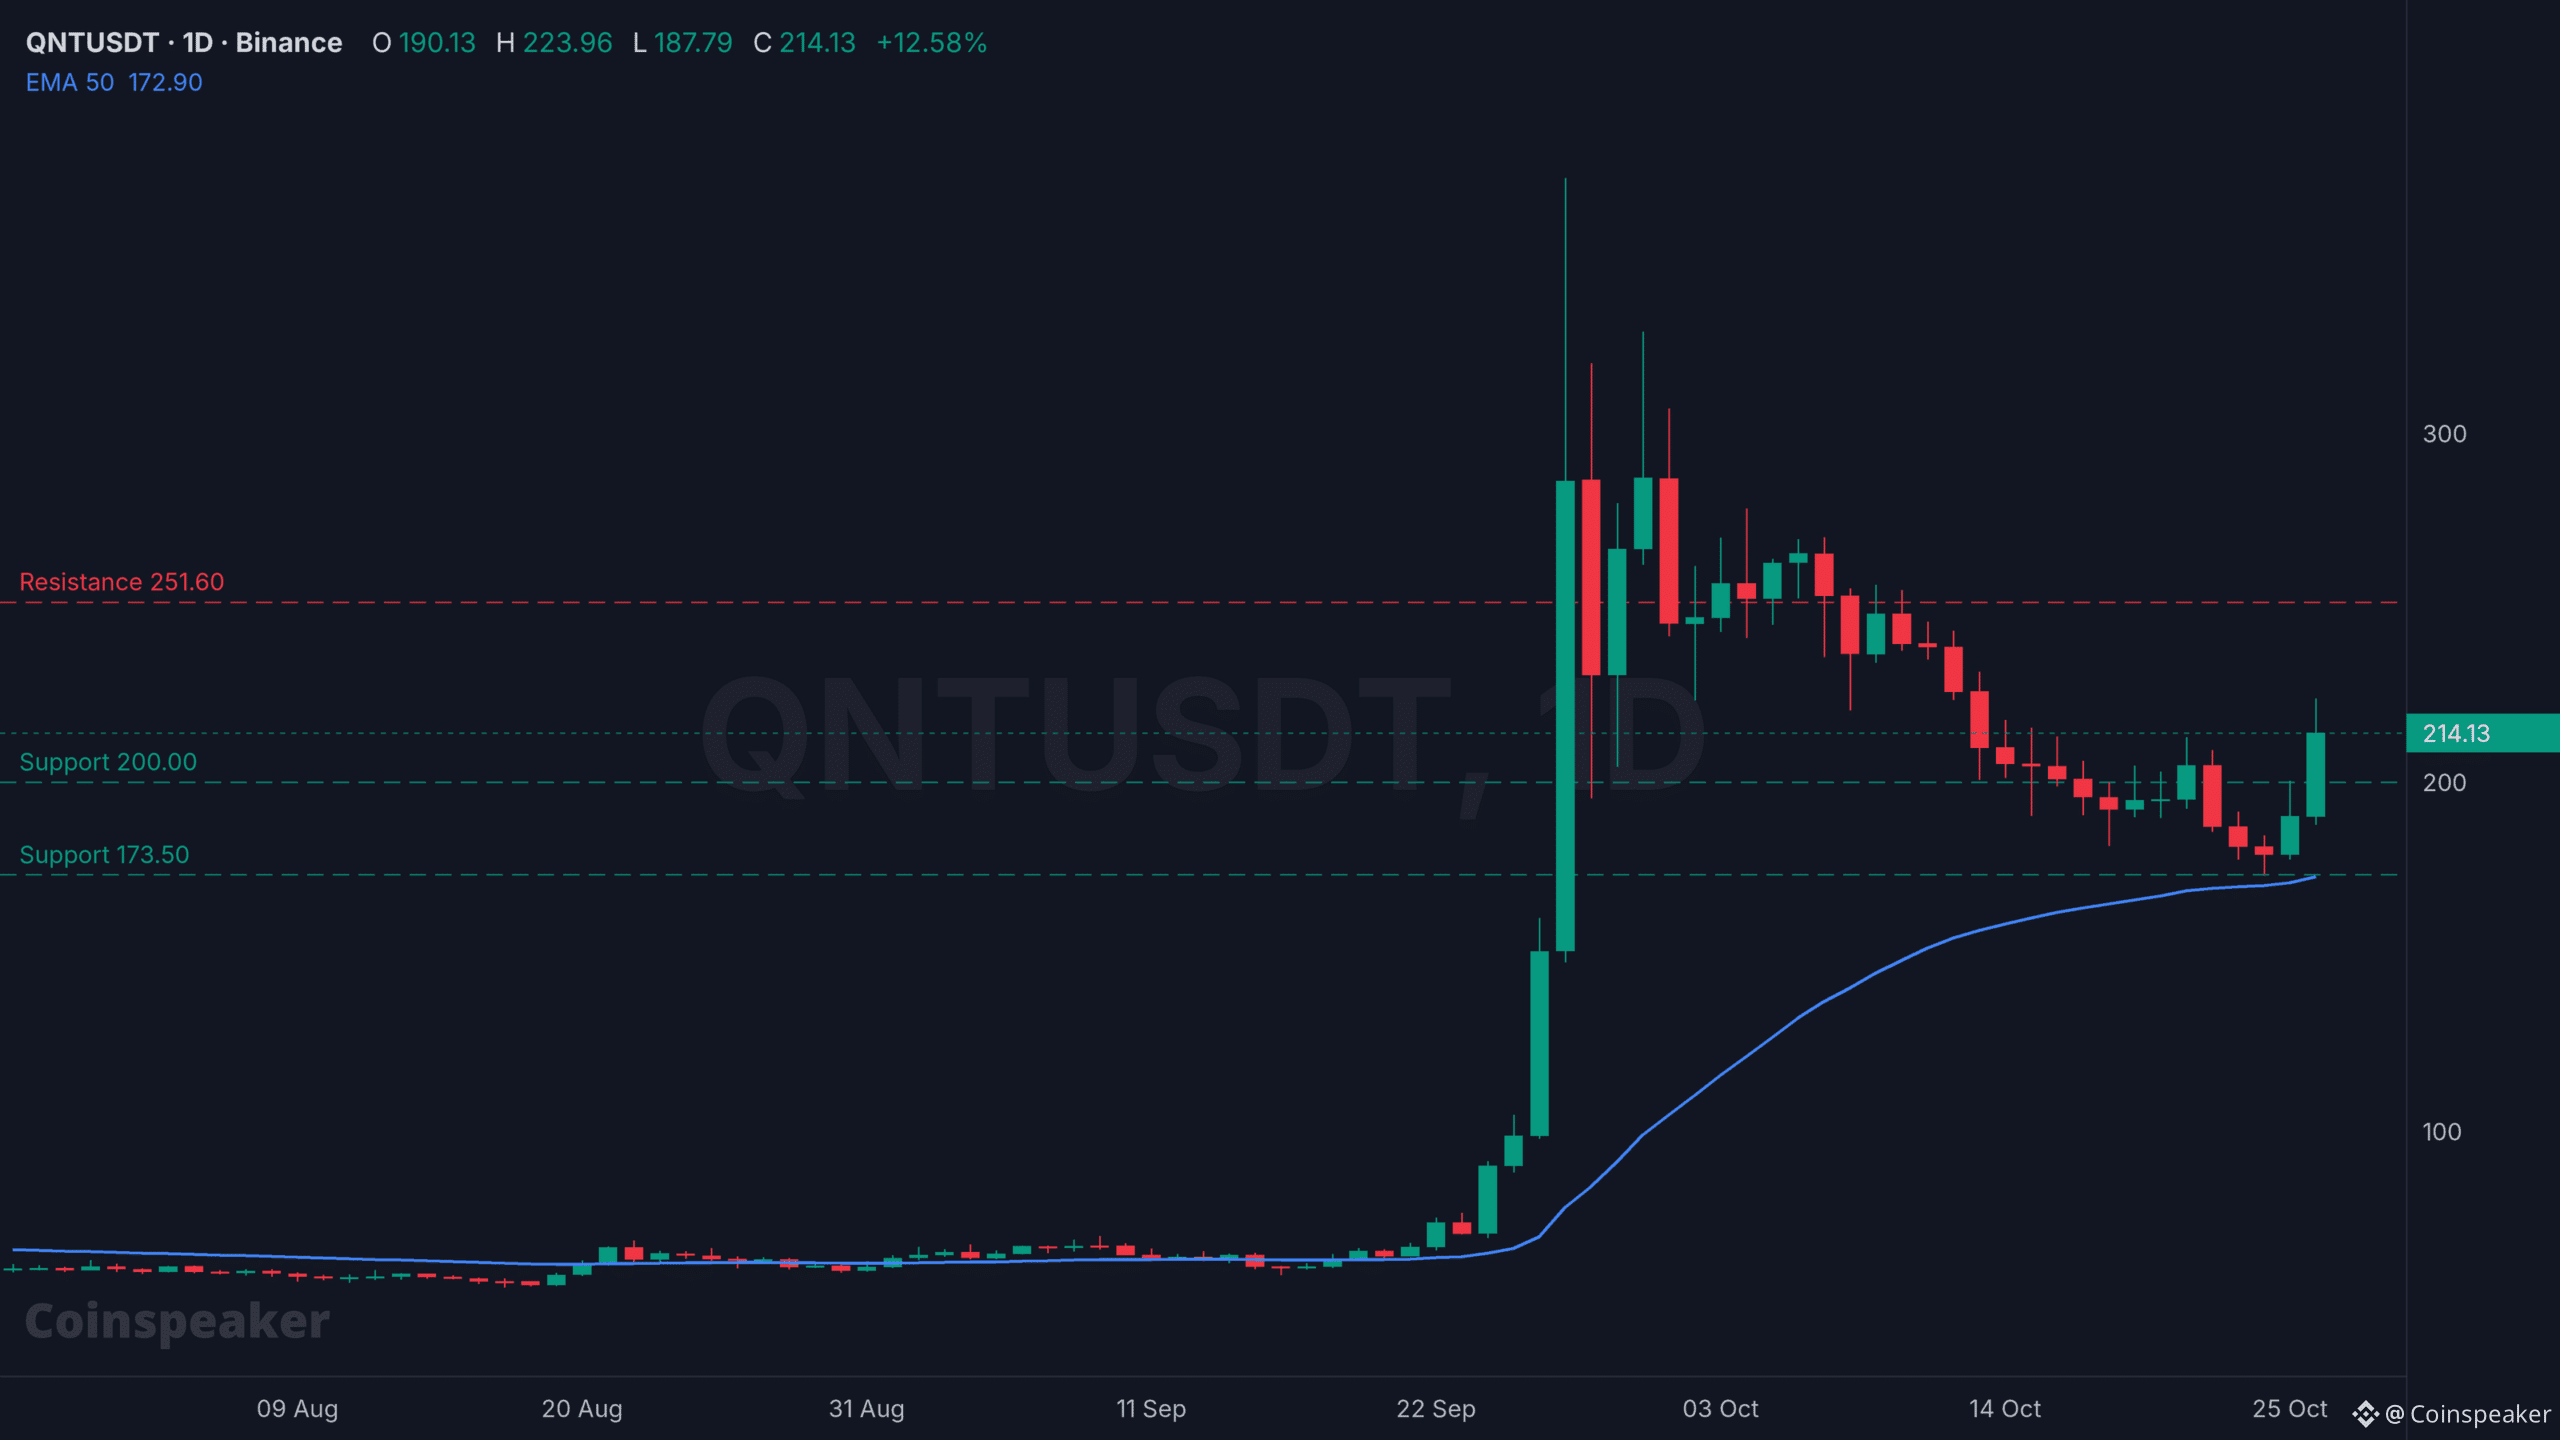
Статья
QNT Crypto Jumps 13% While the Market Bleeds: Who Is Buying Quant Without a Fresh Headline?Quant’s QNT crypto token jumped 13% on Monday, October 26, to about $214, the best performance of any top-100 coin. Bitcoin and Ethereum slipped and the total crypto market cap fell 1.6%. But why the sudden pump? No new announcement came with it. The buyers simply came back to a story they already knew: The Clearing House’s tokenized-deposit network for America’s biggest banks.
QNT touched $223.96 on Binance before easing, and it is now up almost 100% in a month. What is driving the green candles, and is the rally built to last?
$QNT rising from the grave by the necromancer pic.twitter.com/HUFVlQIK2i
— AltsDaddy (@AltsDaddycom) October 26, 2026
Market Intelligence: Crypto Analyst Predicts Best Low-Cap Crypto
Green Candle in a Red Market: Why Is QNT Crypto Rising Today?
Spot buying, not leverage. Binance’s QNT spot pair had traded $27.4 million by 15:00 UTC, more than double its daily average over the past week, and most of it arrived between 08:00 and 12:00 UTC.
The derivatives market barely moved. Open interest in OKX’s QNT perpetual is only about $340,000, and funding there is slightly negative, which means traders betting against QNT are paying the ones betting on it. A rally that shorts are paying for has not been built on borrowed money.
The buying is also coming from the U.S. After Binance, the largest QNT market today is Coinbase’s dollar pair, with about $26 million in volume, and Kraken’s ranks third. That fits the story behind the token.
What Is the Clearing House Deal Behind QNT?
💥BREAKING: Quant selected by The Clearing House for the interoperability layer of its US tokenized deposit network. Trillions of dollars will be on chain though #Quant pic.twitter.com/mPxO1i22Ae
— CRYPTO CAPTAIN (@UniverseTwenty) October 26, 2026
It is the reason QNT quadrupled in four days in September, from $70.62 to $286.26. On September 24, The Clearing House, the payments company owned by the largest U.S. banks, chose Quant to run the interoperability layer of its On-Chain Money Initiative. The network will let banks settle tokenized deposits, digital versions of ordinary bank deposits, and connect them to the RTP and CHIPS payment systems.
The timeline is long. Design and bank integration run through the autumn, the first banks are due to be onboarded in the first quarter of 2027, and live transactions are targeted for the second quarter. Revenue for Quant is still a 2027 event.
DISCOVER: JPMorgan Puts JPM Coin on Ethereum Mainnet: Institutional Clients Get a Second Public Chain Beyond Base
Supply makes the moves sharper. Of a maximum 14.6 million QNT, 14.56 million already circulate, so there are no large unlocks waiting to meet new demand. With a market cap of about $3.1 billion, it does not take much buying to move the price.
QNT Price Analysis: Can It Reclaim $250?
QNTUSDT Chart 1D TradingView
The chart explains why buyers chose this week. QNT’s month-long pullback from the September 27 high of $373 ended on Saturday at $173.56, right on its 50-day EMA, now $172.91, and close to the 61.8% Fibonacci retracement of the August-to-September rally at $176.65. Monday’s candle then broke the October 21 high of $212.87.
Support sits at $200, where the 4-hour swing lows from last week cluster, and then at $173.50, the 50-day EMA and Saturday’s low. A daily close back below $200 would turn Monday’s breakout into a failed one.
Resistance stands at $251.60, the 38.2% retracement, close to the $255 highs that capped every bounce from October 8 to 10. A close above it would open the way to the early-October highs near $270. QNT is still 43% below its September high and half its 2021 record of $427.42. But on a red day, the QNT crypto chart shows spot buyers, many of them trading in dollars, paying up for a token tied to the U.S. banking system, with very little leverage behind them.
Market Intelligence: Crypto Analyst Predicts Best New Crypto to Hodl
next
The post QNT Crypto Jumps 13% While the Market Bleeds: Who Is Buying Quant Without a Fresh Headline? appeared first on Coinspeaker.
QNT Crypto Jumps 13% While the Market Bleeds: Who Is Buying Quant Without a Fresh Headline?
Quant’s QNT crypto token jumped 13% on Monday, October 26, to about $214, the best performance of any top-100 coin. Bitcoin and Ethereum slipped and the total crypto market cap fell 1.6%. But why the sudden pump? No new announcement came with it. The buyers simply came back to a story they already knew: The Clearing House’s tokenized-deposit network for America’s biggest banks.
QNT touched $223.96 on Binance before easing, and it is now up almost 100% in a month. What is driving the green candles, and is the rally built to last?
$QNT rising from the grave by the necromancer pic.twitter.com/HUFVlQIK2i
— AltsDaddy (@AltsDaddycom) October 26, 2026
Market Intelligence: Crypto Analyst Predicts Best Low-Cap Crypto
Green Candle in a Red Market: Why Is QNT Crypto Rising Today?
Spot buying, not leverage. Binance’s QNT spot pair had traded $27.4 million by 15:00 UTC, more than double its daily average over the past week, and most of it arrived between 08:00 and 12:00 UTC.
The derivatives market barely moved. Open interest in OKX’s QNT perpetual is only about $340,000, and funding there is slightly negative, which means traders betting against QNT are paying the ones betting on it. A rally that shorts are paying for has not been built on borrowed money.
The buying is also coming from the U.S. After Binance, the largest QNT market today is Coinbase’s dollar pair, with about $26 million in volume, and Kraken’s ranks third. That fits the story behind the token.
What Is the Clearing House Deal Behind QNT?
💥BREAKING: Quant selected by The Clearing House for the interoperability layer of its US tokenized deposit network. Trillions of dollars will be on chain though #Quant pic.twitter.com/mPxO1i22Ae
— CRYPTO CAPTAIN (@UniverseTwenty) October 26, 2026
It is the reason QNT quadrupled in four days in September, from $70.62 to $286.26. On September 24, The Clearing House, the payments company owned by the largest U.S. banks, chose Quant to run the interoperability layer of its On-Chain Money Initiative. The network will let banks settle tokenized deposits, digital versions of ordinary bank deposits, and connect them to the RTP and CHIPS payment systems.
The timeline is long. Design and bank integration run through the autumn, the first banks are due to be onboarded in the first quarter of 2027, and live transactions are targeted for the second quarter. Revenue for Quant is still a 2027 event.
DISCOVER: JPMorgan Puts JPM Coin on Ethereum Mainnet: Institutional Clients Get a Second Public Chain Beyond Base
Supply makes the moves sharper. Of a maximum 14.6 million QNT, 14.56 million already circulate, so there are no large unlocks waiting to meet new demand. With a market cap of about $3.1 billion, it does not take much buying to move the price.
QNT Price Analysis: Can It Reclaim $250?
QNTUSDT Chart 1D TradingView
The chart explains why buyers chose this week. QNT’s month-long pullback from the September 27 high of $373 ended on Saturday at $173.56, right on its 50-day EMA, now $172.91, and close to the 61.8% Fibonacci retracement of the August-to-September rally at $176.65. Monday’s candle then broke the October 21 high of $212.87.
Support sits at $200, where the 4-hour swing lows from last week cluster, and then at $173.50, the 50-day EMA and Saturday’s low. A daily close back below $200 would turn Monday’s breakout into a failed one.
Resistance stands at $251.60, the 38.2% retracement, close to the $255 highs that capped every bounce from October 8 to 10. A close above it would open the way to the early-October highs near $270. QNT is still 43% below its September high and half its 2021 record of $427.42. But on a red day, the QNT crypto chart shows spot buyers, many of them trading in dollars, paying up for a token tied to the U.S. banking system, with very little leverage behind them.
Market Intelligence: Crypto Analyst Predicts Best New Crypto to Hodl
next
The post QNT Crypto Jumps 13% While the Market Bleeds: Who Is Buying Quant Without a Fresh Headline? appeared first on Coinspeaker.
2
697
·
--
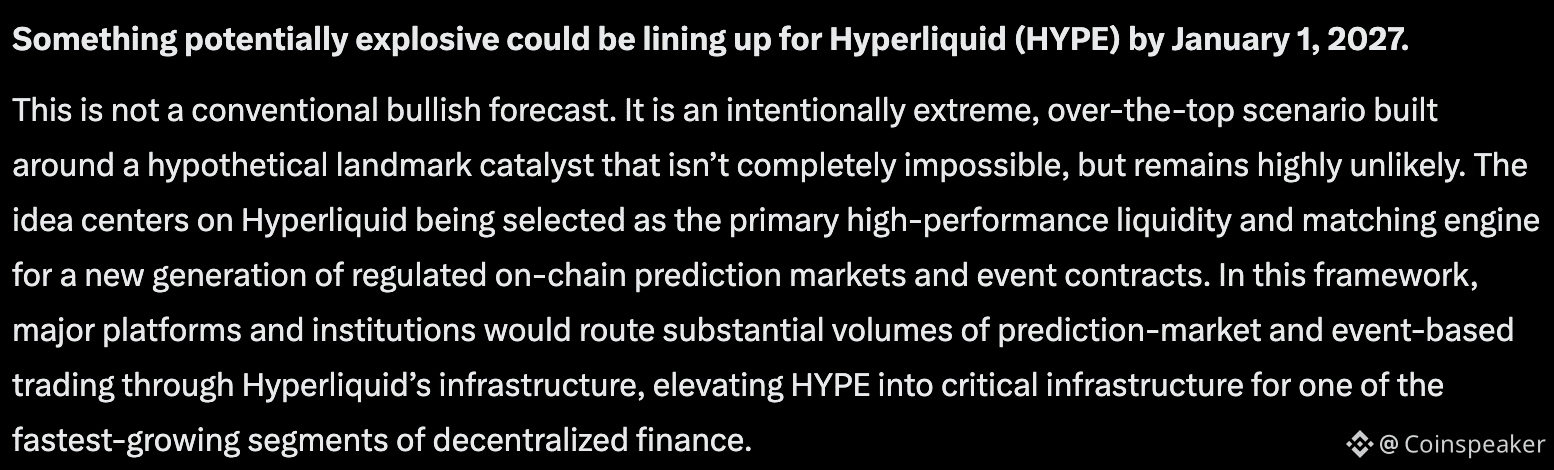
Статья
Google Gemini AI Predicts a Huge Q4 Move for HyperliquidA potentially explosive development for Hyperliquid could hit by January 1, 2027, as Google Gemini AI predicts that in an intentionally extreme, hypothetical scenario built around a landmark catalyst, HYPE could soar to new highs over Q4.
The scenario envisions Hyperliquid being selected as the primary high-performance liquidity and matching engine for a new generation of regulated on-chain prediction markets and event contracts.
In this context, major platforms and institutions would route substantial volumes of prediction-market and event-based trading through Hyperliquid’s infrastructure, positioning HYPE as a critical component in one of decentralized finance’s fastest-growing segments.
(SOURCE: Google Gemini AI Predicts Bullish Move for HYPE)
Hyperliquid Technical Analysis: HYPE Price Consolidates $75
On higher timeframes, HYPE has been consolidating in the $75–$78 region after pulling back from its recent all-time high near $98. Price continues to hold above key intermediate support while facing resistance around the $80–$85 zone.
In a standard bull market, a sustained breakout above $100–$120 would confirm intermediate strength and open the path toward significant new price discovery.
(SOURCE: TradingView)
Under the extreme prediction-market infrastructure adoption scenario outlined above, clearing prior highs would likely trigger powerful measured-move extensions and multi-cycle Fibonacci projections from the longer-term base.
Momentum indicators currently sit in neutral-to-corrective territory with substantial room to run into the extreme overbought levels typical of parabolic advances.
Key near-term support sits near $74–$75 and $68–$70; holding those levels would keep the broader structure intact while the market prices in major narrative developments.
EXPLORE: Best Meme Coins to Buy in 2026
Supporting Catalysts Beyond Hyperliquid
US forces in the Middle East are prepared to launch new, potentially major, military operations against Iran "within 96 hours of receiving" an order from President Donald Trump, according to two US officials. https://t.co/jtUlvDmP9h pic.twitter.com/WzGmojsprb
— CNN (@CNN) October 26, 2026
Several external developments could amplify this bullish scenario. On the global stage, a durable resolution to major geopolitical conflicts, such as the Russia-Ukraine war or a lasting ceasefire involving Iran and normalization of the Strait of Hormuz, could reduce risk premiums and encourage capital to rotate back into higher-beta growth assets.
Economically, a clear pivot by major central banks toward more accommodative monetary policy, combined with elevated liquidity conditions, would support risk-taking across markets.
Within crypto, continued expansion of Bitcoin and Ethereum ETF inflows, broader institutional adoption of decentralized derivatives, rising volumes in prediction markets and on-chain speculation, and a sustained return of altcoin risk appetite would create a favorable environment that disproportionately benefits high-performance trading platforms like Hyperliquid.
Google Gemini AI Predicts a Historic Move for HYPE: The Big Reveal
Under this highly speculative scenario, and assuming a full-blown crypto bull market returns alongside supportive external conditions, Hyperliquid (HYPE) could reach somewhere between $500 and $900, with a stretch target toward $1,400+ by January 1, 2027.
This remains pure speculation and entertainment, not a realistic base-case outlook. The core catalyst would require extraordinary coordination among prediction-market platforms, regulators, and the Hyperliquid ecosystem, which is currently highly unlikely.
DISCOVER: Meme coin Supercycle: Top Performers This Week
next
The post Google Gemini AI Predicts a Huge Q4 Move for Hyperliquid appeared first on Coinspeaker.
Google Gemini AI Predicts a Huge Q4 Move for Hyperliquid
A potentially explosive development for Hyperliquid could hit by January 1, 2027, as Google Gemini AI predicts that in an intentionally extreme, hypothetical scenario built around a landmark catalyst, HYPE could soar to new highs over Q4.
The scenario envisions Hyperliquid being selected as the primary high-performance liquidity and matching engine for a new generation of regulated on-chain prediction markets and event contracts.
In this context, major platforms and institutions would route substantial volumes of prediction-market and event-based trading through Hyperliquid’s infrastructure, positioning HYPE as a critical component in one of decentralized finance’s fastest-growing segments.
(SOURCE: Google Gemini AI Predicts Bullish Move for HYPE)
Hyperliquid Technical Analysis: HYPE Price Consolidates $75
On higher timeframes, HYPE has been consolidating in the $75–$78 region after pulling back from its recent all-time high near $98. Price continues to hold above key intermediate support while facing resistance around the $80–$85 zone.
In a standard bull market, a sustained breakout above $100–$120 would confirm intermediate strength and open the path toward significant new price discovery.
(SOURCE: TradingView)
Under the extreme prediction-market infrastructure adoption scenario outlined above, clearing prior highs would likely trigger powerful measured-move extensions and multi-cycle Fibonacci projections from the longer-term base.
Momentum indicators currently sit in neutral-to-corrective territory with substantial room to run into the extreme overbought levels typical of parabolic advances.
Key near-term support sits near $74–$75 and $68–$70; holding those levels would keep the broader structure intact while the market prices in major narrative developments.
EXPLORE: Best Meme Coins to Buy in 2026
Supporting Catalysts Beyond Hyperliquid
US forces in the Middle East are prepared to launch new, potentially major, military operations against Iran "within 96 hours of receiving" an order from President Donald Trump, according to two US officials. https://t.co/jtUlvDmP9h pic.twitter.com/WzGmojsprb
— CNN (@CNN) October 26, 2026
Several external developments could amplify this bullish scenario. On the global stage, a durable resolution to major geopolitical conflicts, such as the Russia-Ukraine war or a lasting ceasefire involving Iran and normalization of the Strait of Hormuz, could reduce risk premiums and encourage capital to rotate back into higher-beta growth assets.
Economically, a clear pivot by major central banks toward more accommodative monetary policy, combined with elevated liquidity conditions, would support risk-taking across markets.
Within crypto, continued expansion of Bitcoin and Ethereum ETF inflows, broader institutional adoption of decentralized derivatives, rising volumes in prediction markets and on-chain speculation, and a sustained return of altcoin risk appetite would create a favorable environment that disproportionately benefits high-performance trading platforms like Hyperliquid.
Google Gemini AI Predicts a Historic Move for HYPE: The Big Reveal
Under this highly speculative scenario, and assuming a full-blown crypto bull market returns alongside supportive external conditions, Hyperliquid (HYPE) could reach somewhere between $500 and $900, with a stretch target toward $1,400+ by January 1, 2027.
This remains pure speculation and entertainment, not a realistic base-case outlook. The core catalyst would require extraordinary coordination among prediction-market platforms, regulators, and the Hyperliquid ecosystem, which is currently highly unlikely.
DISCOVER: Meme coin Supercycle: Top Performers This Week
next
The post Google Gemini AI Predicts a Huge Q4 Move for Hyperliquid appeared first on Coinspeaker.
331
·
--
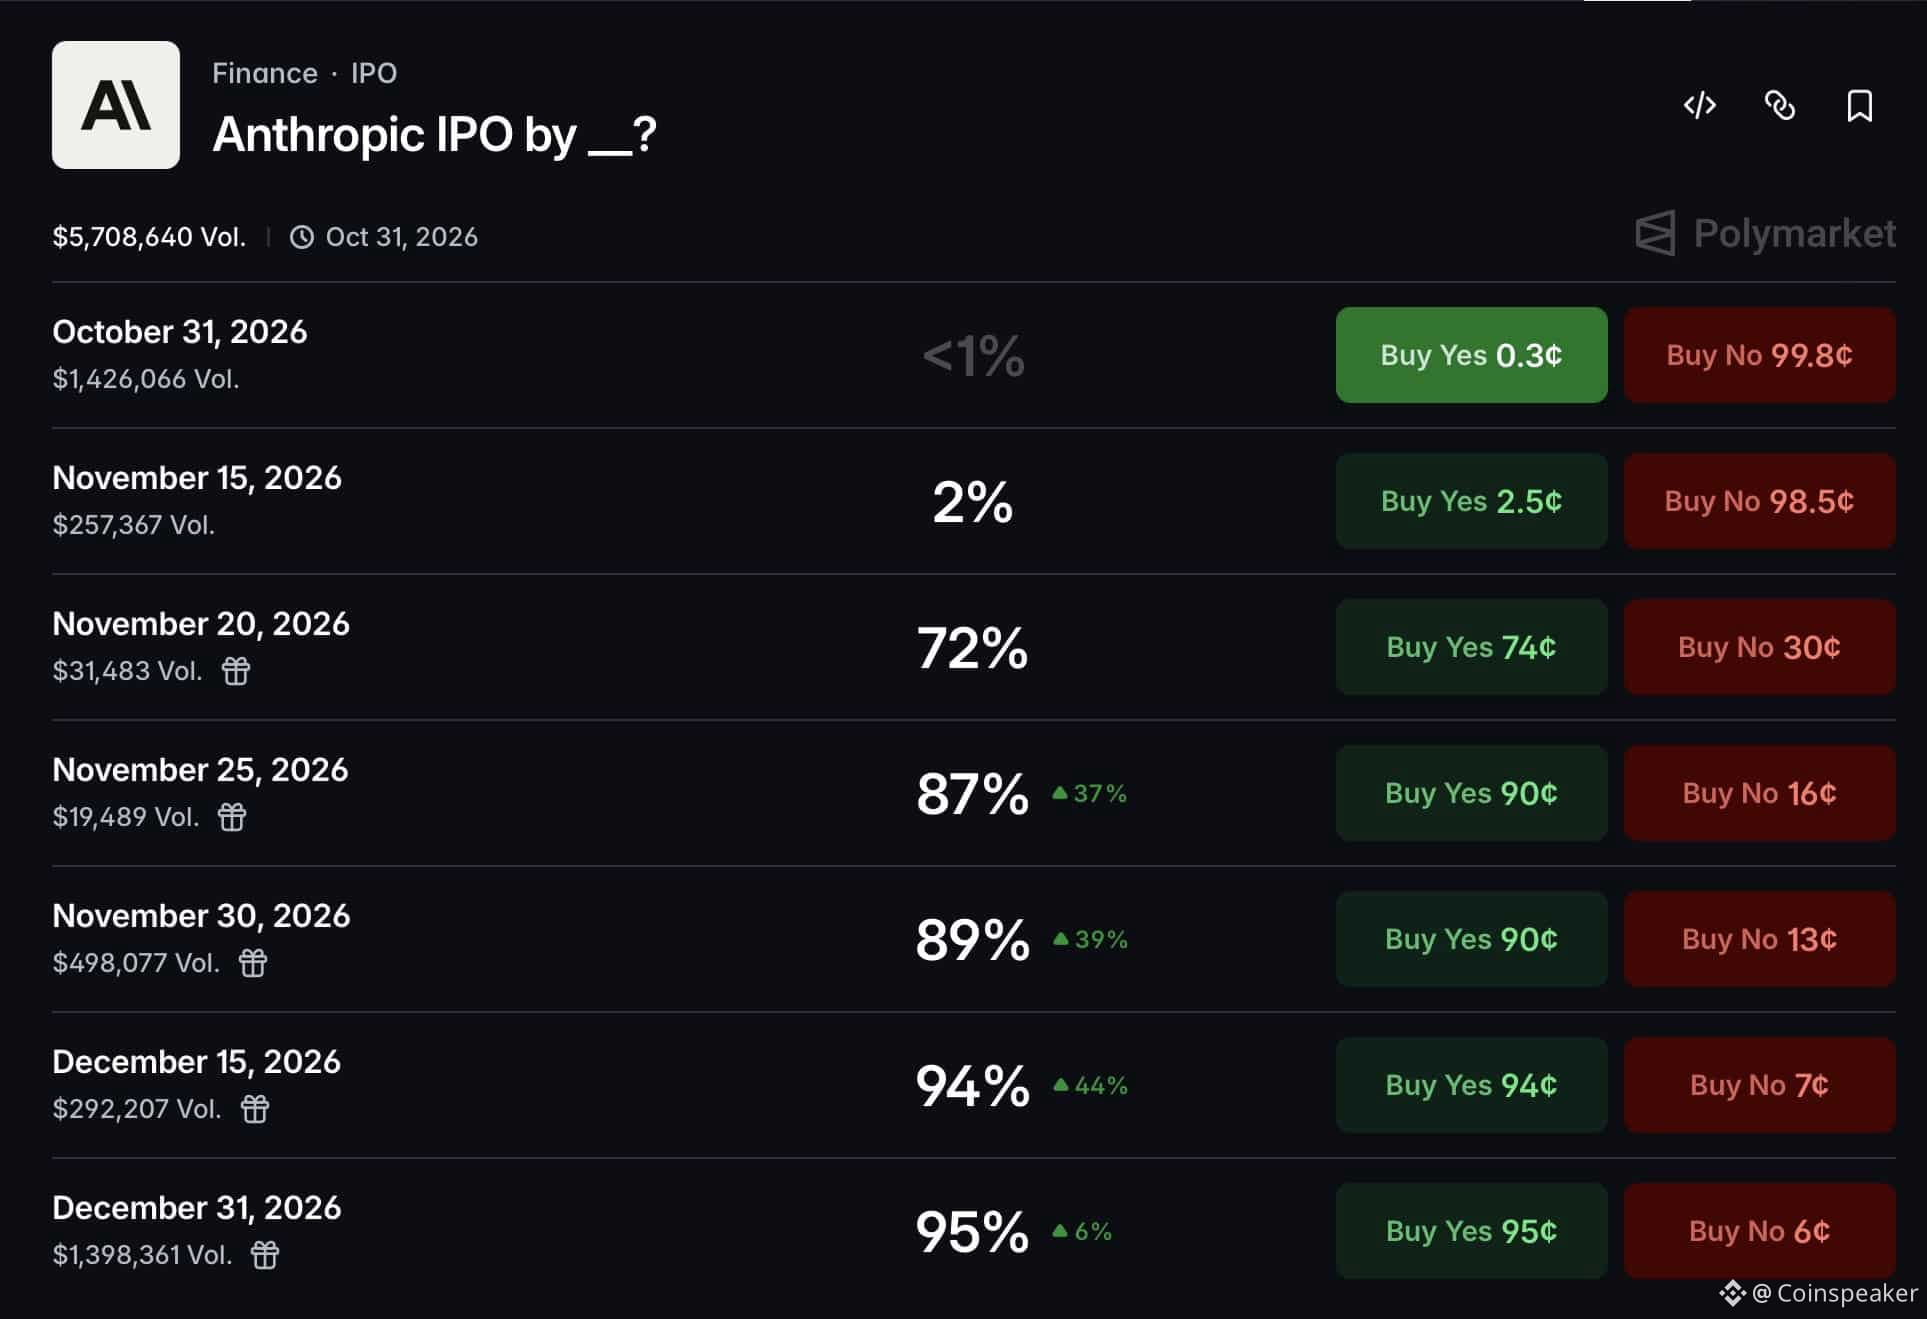
Статья
Anthropic IPO Filing Puts “ANT” on Nasdaq: Could the Claude Maker Debut Bigger Than Bitcoin?Anthropic, the company behind the Claude AI models, publicly filed for its IPO with the SEC on Monday, October 26, applying to list Class A shares on the Nasdaq Global Select Market under the ticker “ANT”. It could be the largest stock market debut on record, yet the filing leaves the price range blank. The numbers inside it are anything but.
The Anthropic IPO prospectus shows revenue of $16.3 billion in the first half of 2026, up from $1.2 billion a year earlier. And prediction markets now price a 74.5% chance that Anthropic will be worth more than Bitcoin by the end of the year. So what did the S-1 reveal, and what could a listing this size mean for crypto?
Anthropic has filed an S-1 registration statement with the SEC related to its proposed IPO.
Read more: https://t.co/zuRMrxXzNx
Legal disclaimer: A registration statement relating to these securities has been filed with the SEC but has not yet become effective. These securities…
— Anthropic (@AnthropicAI) October 26, 2026
DISCOVER: Best Meme Coins to Buy in 2026
Anthropic IPO: What Did the S-1 Reveal?
A company growing faster than its losses. The S-1 shows revenue rising from $4.6 billion in all of 2025 to $16.3 billion in the first six months of 2026, a fourteen-fold jump on the same half a year earlier.
The headline loss looks alarming: $80.7 billion for the half. But $72.4 billion of it is a non-cash charge, the rising fair value of convertible notes and SAFEs issued to early backers as the company’s valuation climbed. The operating loss, what the business itself lost, narrowed to $693 million from $2.1 billion a year earlier.
Goldman Sachs, Morgan Stanley and J.P. Morgan top a list of 22 underwriters. The price range, share count and the size of the raise will come in a later amendment.
DISCOVER: Andreessen Horowitz Renames a16z Crypto to a16z Frontier: Where Will the Money Go Now?
Who Will Control Anthropic After the IPO?
Not the buyers of the shares. Public investors get Class A stock with one vote per share, but a single Class F share, held by a company owned by the seven co-founders, including CEO Dario Amodei and President Daniela Amodei, carries 50.1% of the votes.
A separate body, the Long-Term Benefit Trust, will elect a majority of the board through its own Class T share. Anthropic will also be a “controlled company” under Nasdaq rules. As a public benefit corporation, it must weigh its mission of developing AI safely alongside shareholder returns, and it has already placed 5% of its shares in a new Public Benefit Fund.
The IPO date will be most likely in November. On Polymarket, traders give an 83.5% chance that the shares start trading by November 30, and about 50% by November 20.
Anthropic IPO by __?
The valuation is the bigger question. Anthropic was last valued at $965 billion in its $65 billion Series H round in May. Polymarket’s most likely IPO valuation range is now $1.5 trillion to $1.75 trillion, at 58%, close to double that private price only five months later.
Could Anthropic Be Worth More Than Bitcoin?
The market thinks so. Bitcoin’s market capitalisation stands at about $1.61 trillion at $80,100, and Polymarket gives 74.5% that Anthropic’s value passes it by December 31. Traders put the most weight on a first-day closing value of $1.75 trillion to $2 trillion.
For crypto, the filing was a non-event on the screen. Bitcoin slipped 0.3% on the day and AI tokens barely moved: Bittensor’s TAO was up 1.2% and Render 2.2%. The risk comes later. A raise of this size will need buyers, and the same growth investors who hold Bitcoin and AI tokens may sell some to make room for ANT.
BTC USDT Chart 1D TradingView
Bitcoin is trading just below its 50-day EMA at $80,801. Resistance sits at $82,850, where every bounce stalled last week, and support at $79,221, Saturday’s low. A close below that floor would put the 200-day EMA at $76,347 in play.
The Anthropic IPO will be the first time public investors can buy a stake in a frontier AI lab directly. If it prices near the top of Polymarket’s range, the company behind Claude will open its first day of trading worth more than the world’s largest cryptocurrency.
DISCOVER: Meme coin supercycle: Top performers this week
next
The post Anthropic IPO Filing Puts “ANT” on Nasdaq: Could the Claude Maker Debut Bigger Than Bitcoin? appeared first on Coinspeaker.
Anthropic IPO Filing Puts “ANT” on Nasdaq: Could the Claude Maker Debut Bigger Than Bitcoin?
Anthropic, the company behind the Claude AI models, publicly filed for its IPO with the SEC on Monday, October 26, applying to list Class A shares on the Nasdaq Global Select Market under the ticker “ANT”. It could be the largest stock market debut on record, yet the filing leaves the price range blank. The numbers inside it are anything but.
The Anthropic IPO prospectus shows revenue of $16.3 billion in the first half of 2026, up from $1.2 billion a year earlier. And prediction markets now price a 74.5% chance that Anthropic will be worth more than Bitcoin by the end of the year. So what did the S-1 reveal, and what could a listing this size mean for crypto?
Anthropic has filed an S-1 registration statement with the SEC related to its proposed IPO.
Read more: https://t.co/zuRMrxXzNx
Legal disclaimer: A registration statement relating to these securities has been filed with the SEC but has not yet become effective. These securities…
— Anthropic (@AnthropicAI) October 26, 2026
DISCOVER: Best Meme Coins to Buy in 2026
Anthropic IPO: What Did the S-1 Reveal?
A company growing faster than its losses. The S-1 shows revenue rising from $4.6 billion in all of 2025 to $16.3 billion in the first six months of 2026, a fourteen-fold jump on the same half a year earlier.
The headline loss looks alarming: $80.7 billion for the half. But $72.4 billion of it is a non-cash charge, the rising fair value of convertible notes and SAFEs issued to early backers as the company’s valuation climbed. The operating loss, what the business itself lost, narrowed to $693 million from $2.1 billion a year earlier.
Goldman Sachs, Morgan Stanley and J.P. Morgan top a list of 22 underwriters. The price range, share count and the size of the raise will come in a later amendment.
DISCOVER: Andreessen Horowitz Renames a16z Crypto to a16z Frontier: Where Will the Money Go Now?
Who Will Control Anthropic After the IPO?
Not the buyers of the shares. Public investors get Class A stock with one vote per share, but a single Class F share, held by a company owned by the seven co-founders, including CEO Dario Amodei and President Daniela Amodei, carries 50.1% of the votes.
A separate body, the Long-Term Benefit Trust, will elect a majority of the board through its own Class T share. Anthropic will also be a “controlled company” under Nasdaq rules. As a public benefit corporation, it must weigh its mission of developing AI safely alongside shareholder returns, and it has already placed 5% of its shares in a new Public Benefit Fund.
The IPO date will be most likely in November. On Polymarket, traders give an 83.5% chance that the shares start trading by November 30, and about 50% by November 20.
Anthropic IPO by __?
The valuation is the bigger question. Anthropic was last valued at $965 billion in its $65 billion Series H round in May. Polymarket’s most likely IPO valuation range is now $1.5 trillion to $1.75 trillion, at 58%, close to double that private price only five months later.
Could Anthropic Be Worth More Than Bitcoin?
The market thinks so. Bitcoin’s market capitalisation stands at about $1.61 trillion at $80,100, and Polymarket gives 74.5% that Anthropic’s value passes it by December 31. Traders put the most weight on a first-day closing value of $1.75 trillion to $2 trillion.
For crypto, the filing was a non-event on the screen. Bitcoin slipped 0.3% on the day and AI tokens barely moved: Bittensor’s TAO was up 1.2% and Render 2.2%. The risk comes later. A raise of this size will need buyers, and the same growth investors who hold Bitcoin and AI tokens may sell some to make room for ANT.
BTC USDT Chart 1D TradingView
Bitcoin is trading just below its 50-day EMA at $80,801. Resistance sits at $82,850, where every bounce stalled last week, and support at $79,221, Saturday’s low. A close below that floor would put the 200-day EMA at $76,347 in play.
The Anthropic IPO will be the first time public investors can buy a stake in a frontier AI lab directly. If it prices near the top of Polymarket’s range, the company behind Claude will open its first day of trading worth more than the world’s largest cryptocurrency.
DISCOVER: Meme coin supercycle: Top performers this week
next
The post Anthropic IPO Filing Puts “ANT” on Nasdaq: Could the Claude Maker Debut Bigger Than Bitcoin? appeared first on Coinspeaker.
197
·
--
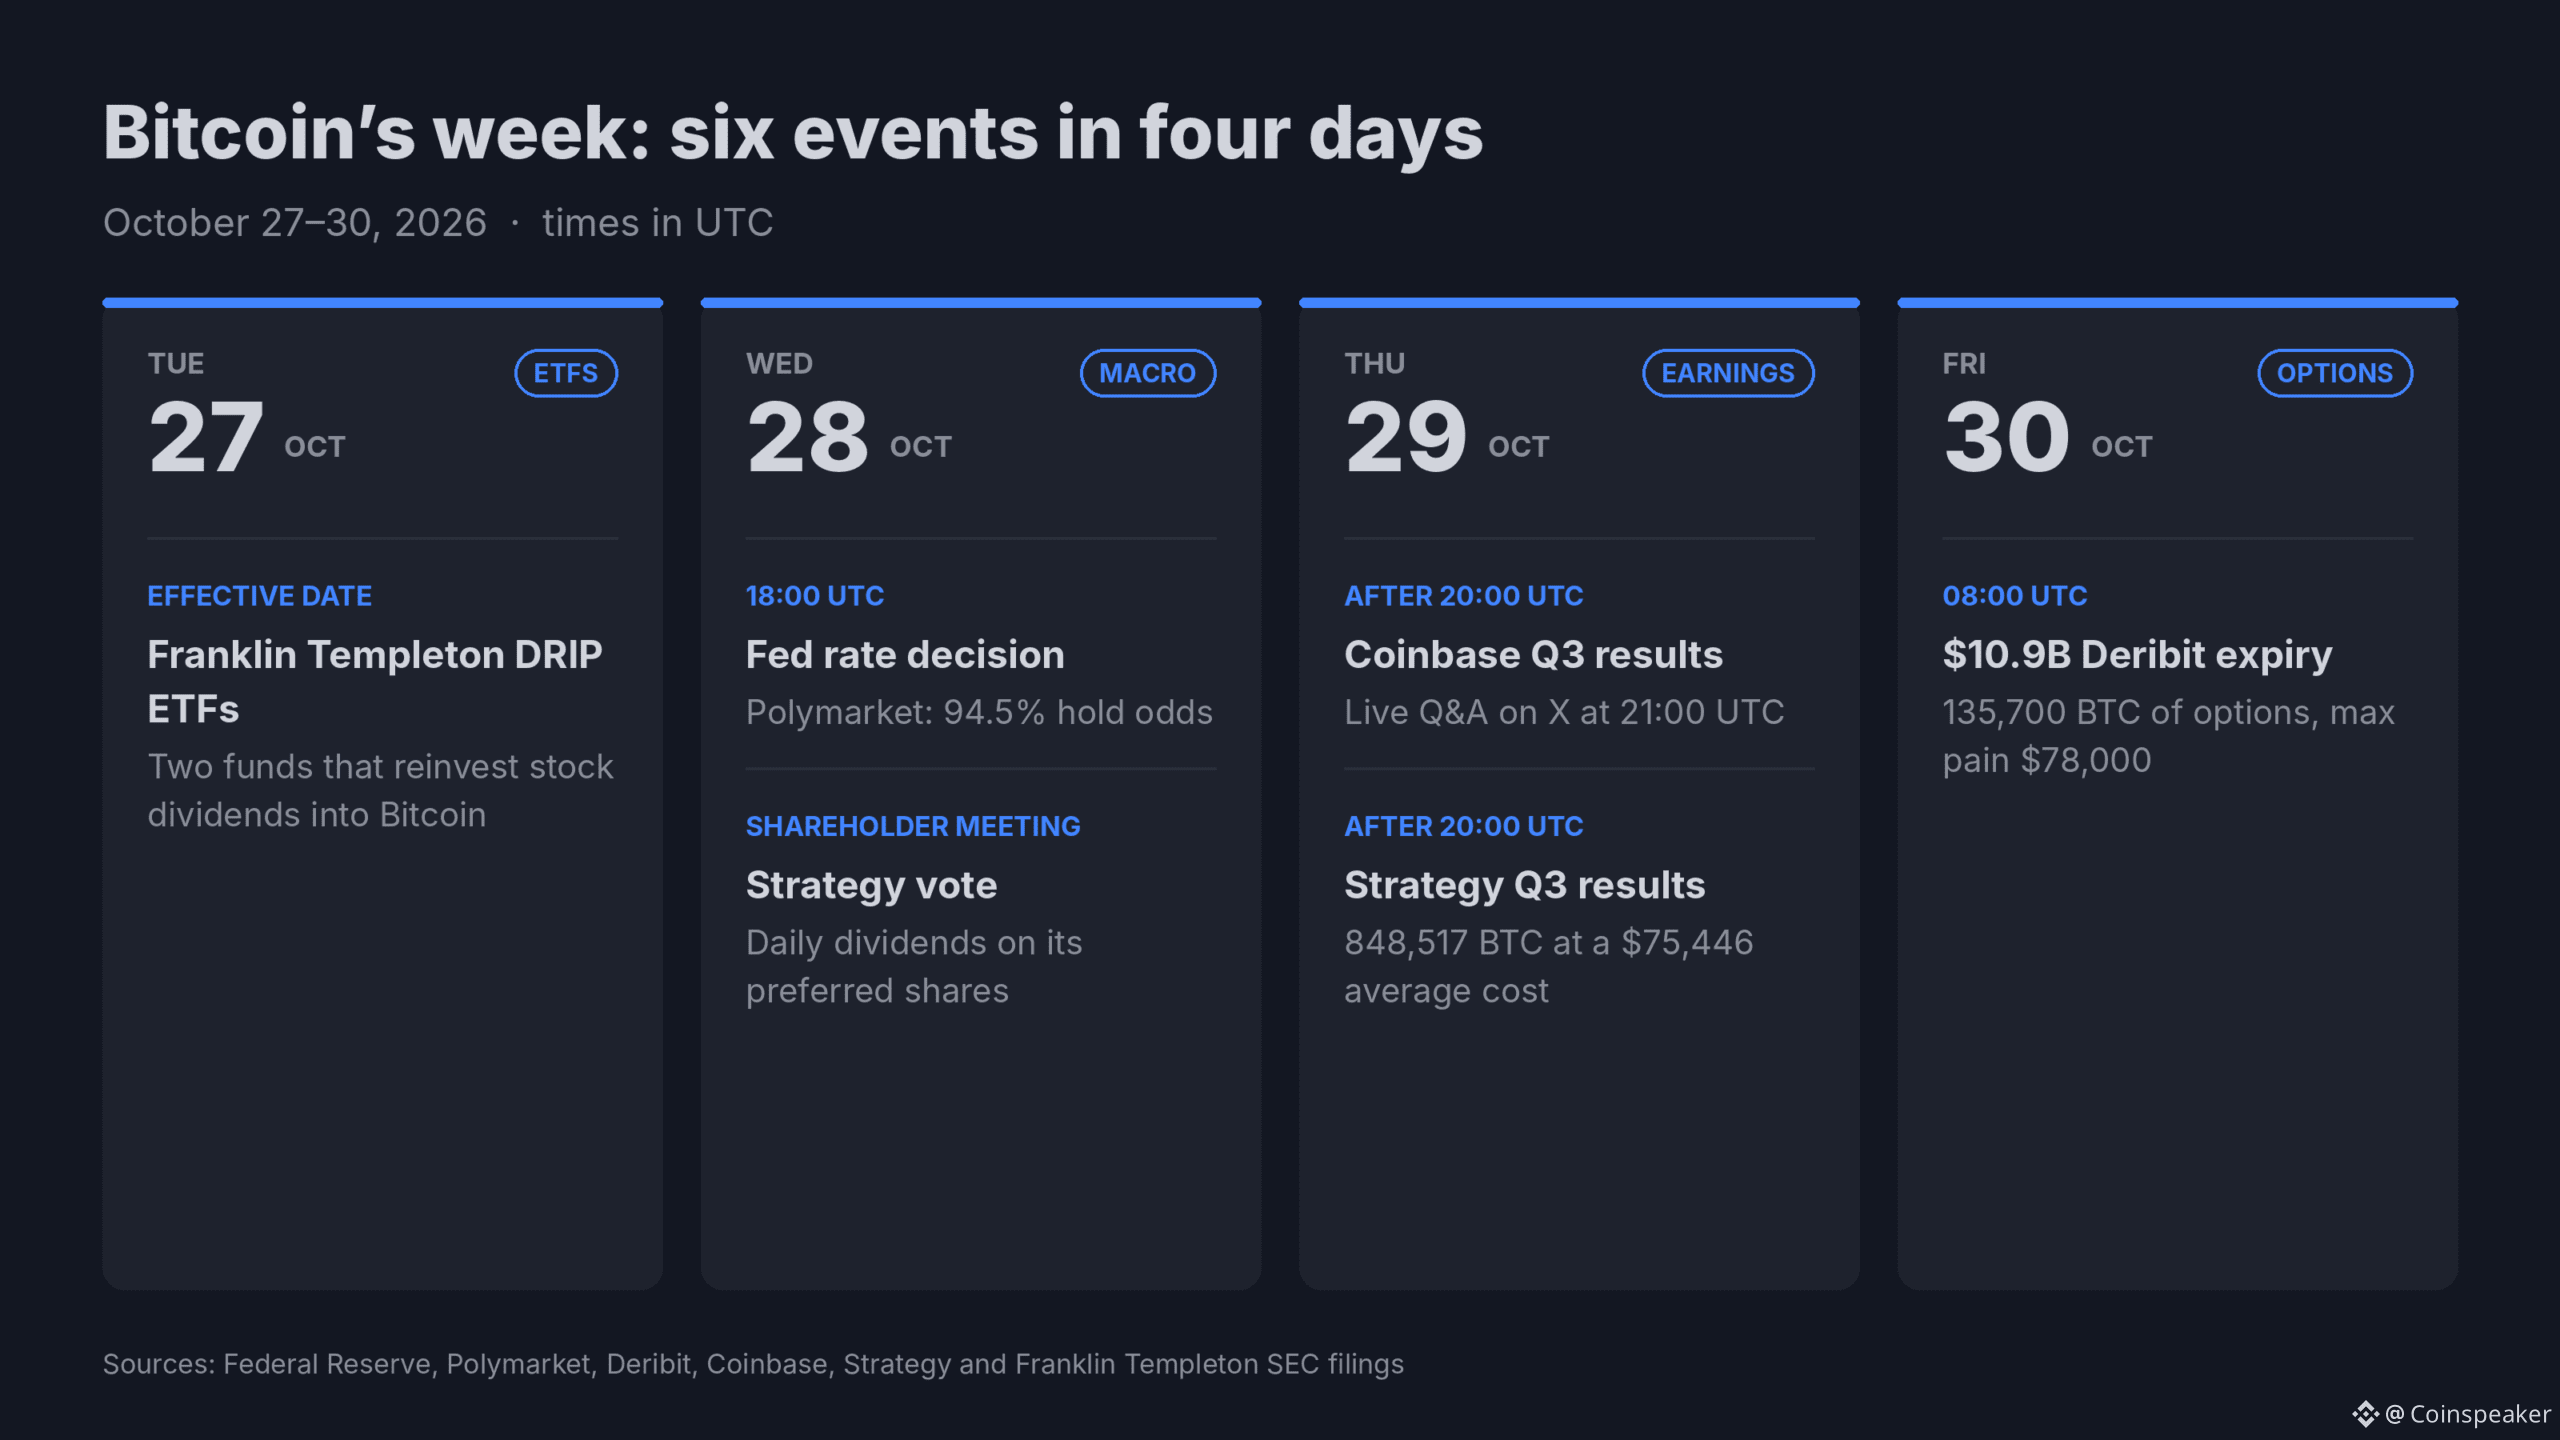
Статья
Bitcoin Holds $79,200 Before the Fed, Coinbase Earnings and a $10.9B Expiry: Which Way Next?Bitcoin held above $79,200 for a third straight day on Monday, October 26, as traders braced for a week that puts Wednesday’s Federal Reserve decision, Thursday’s Coinbase and Strategy earnings and Friday’s $10.9 billion options expiry into three back-to-back sessions. Nobody wants to be early. The key Bitcoin news this week is the calendar.
Bitcoin trades near $80,300, flat on the day and down 2.4% in a week. Monday’s dip to $79,369 was bought within hours, just as Saturday’s low of $79,221, the lowest since September 18, was.
So what is pressing on the price, and which levels decide the break?
FED EXPECTED TO HOLD RATES AS DECEMBER HIKE LOOMS
The Federal Reserve is expected to hold rates this week, with markets heavily favoring another hike in December.
Chair Kevin Warsh faces a key communication challenge: explaining the pause despite persistent inflation driven by…
— *Walter Bloomberg (@DeItaone) October 26, 2026
DISCOVER: Meme coin supercycle: Top performers this week
Bitcoin News: What Is Pushing the Price Down?
Five things, and most of them come from outside crypto.
ETF buyers turned sellers: U.S. spot Bitcoin ETFs lost $635.6 million on Thursday, the biggest one-day outflow since June 2025, and another $137.9 million on Friday. BlackRock’s IBIT and Fidelity’s FBTC led both days. That reversed more than two-thirds of the $1.07 billion the funds took in earlier in the week. Monday’s figures arrive after the U.S. close.
The Fed is still leaning hawkish: Traders aren’t expecting a cut. Polymarket puts a 94.5% chance on the Fed holding rates on Wednesday, after September’s hike, and 5.5% on another raise. The statement matters less than Chair Kevin Warsh’s press conference: with the 10-year Treasury yield at 4.99%, any hint of a December hike would weigh on risk assets again.
Oil is still above $100: Brent trades near $110 on Monday, down from Friday’s $116.72 close after tanker attacks near the Strait of Hormuz. U.S. crude is back above $101. Expensive oil keeps inflation sticky, and sticky inflation keeps the Fed cautious.
Leverage has been flushed out: Saturday’s drop to $79,221 cleared about $820 million in crypto liquidations, mostly from traders betting on higher prices. The reset is visible in funding: perpetual futures on OKX and Hyperliquid now pay the neutral base rate of 0.01% every eight hours, so neither side is crowded going into the Fed.
A big options expiry on Friday: About 135,700 BTC of Bitcoin options, worth roughly $10.9 billion, expire on at 08:00 UTC, 35% of all open contracts on the exchange. Max pain, where the most options expire worthless, sits at $78,000. Calls still outnumber puts almost two to one, with the largest bets at $95,000 and $100,000, but the puts that matter are lower: the biggest put positions, the market’s downside hedges, sit at $75,000 and $70,000.
DISCOVER: Bitcoin Slides From $84,900 to $82,200 as Oil Jumps on Iran Strike Plans: Is the US-Iran War About to Restart?
What Else Is on the Bitcoin Calendar This Week?
More than the Fed. The week’s events in order:
Strategy is the one to watch for buying. Its latest filing, on October 19, showed 267 BTC bought at about $82,900, taking holdings to 848,517 BTC at an average cost of $75,446. It had not filed a new purchase by Monday’s U.S. morning.
Bitcoin Price: What Are the Levels to Watch?
Bitcoin closed Sunday at $80,154, below its 50-day EMA at $80,808 for the first time since mid-August, and Monday has not won it back. Reclaiming that line is the first job for buyers.
BTCUSDT Chart 1D TradingView
Above it, $81,390 to $81,840 is the next barrier, where the 4-hour 50 and 200 EMAs meet. Then comes $82,850, which capped every bounce last week.
On the downside, $79,221 to $79,369 is the floor: Saturday’s low and Monday’s. A daily close below it would open the way to Friday’s max pain at $78,000 and then the 200-day EMA at $76,348, with Strategy’s $75,446 cost basis and the $75,000 put wall just beneath.
EXPLORE: Ten Iran Deal Headlines Have Whipsawed Oil Since March and Bitcoin Rallied on Eight of Them
With leverage cleared and funding neutral, the next move will come from the calendar rather than the liquidation engine. Three sessions, three catalysts: the Bitcoin news that decides which side of $80,000 the month closes on starts Wednesday, and until then $79,221 is the line buyers can’t afford to lose.
next
The post Bitcoin Holds $79,200 Before the Fed, Coinbase Earnings and a $10.9B Expiry: Which Way Next? appeared first on Coinspeaker.
Bitcoin Holds $79,200 Before the Fed, Coinbase Earnings and a $10.9B Expiry: Which Way Next?
Bitcoin held above $79,200 for a third straight day on Monday, October 26, as traders braced for a week that puts Wednesday’s Federal Reserve decision, Thursday’s Coinbase and Strategy earnings and Friday’s $10.9 billion options expiry into three back-to-back sessions. Nobody wants to be early. The key Bitcoin news this week is the calendar.
Bitcoin trades near $80,300, flat on the day and down 2.4% in a week. Monday’s dip to $79,369 was bought within hours, just as Saturday’s low of $79,221, the lowest since September 18, was.
So what is pressing on the price, and which levels decide the break?
FED EXPECTED TO HOLD RATES AS DECEMBER HIKE LOOMS
The Federal Reserve is expected to hold rates this week, with markets heavily favoring another hike in December.
Chair Kevin Warsh faces a key communication challenge: explaining the pause despite persistent inflation driven by…
— *Walter Bloomberg (@DeItaone) October 26, 2026
DISCOVER: Meme coin supercycle: Top performers this week
Bitcoin News: What Is Pushing the Price Down?
Five things, and most of them come from outside crypto.
ETF buyers turned sellers: U.S. spot Bitcoin ETFs lost $635.6 million on Thursday, the biggest one-day outflow since June 2025, and another $137.9 million on Friday. BlackRock’s IBIT and Fidelity’s FBTC led both days. That reversed more than two-thirds of the $1.07 billion the funds took in earlier in the week. Monday’s figures arrive after the U.S. close.
The Fed is still leaning hawkish: Traders aren’t expecting a cut. Polymarket puts a 94.5% chance on the Fed holding rates on Wednesday, after September’s hike, and 5.5% on another raise. The statement matters less than Chair Kevin Warsh’s press conference: with the 10-year Treasury yield at 4.99%, any hint of a December hike would weigh on risk assets again.
Oil is still above $100: Brent trades near $110 on Monday, down from Friday’s $116.72 close after tanker attacks near the Strait of Hormuz. U.S. crude is back above $101. Expensive oil keeps inflation sticky, and sticky inflation keeps the Fed cautious.
Leverage has been flushed out: Saturday’s drop to $79,221 cleared about $820 million in crypto liquidations, mostly from traders betting on higher prices. The reset is visible in funding: perpetual futures on OKX and Hyperliquid now pay the neutral base rate of 0.01% every eight hours, so neither side is crowded going into the Fed.
A big options expiry on Friday: About 135,700 BTC of Bitcoin options, worth roughly $10.9 billion, expire on at 08:00 UTC, 35% of all open contracts on the exchange. Max pain, where the most options expire worthless, sits at $78,000. Calls still outnumber puts almost two to one, with the largest bets at $95,000 and $100,000, but the puts that matter are lower: the biggest put positions, the market’s downside hedges, sit at $75,000 and $70,000.
DISCOVER: Bitcoin Slides From $84,900 to $82,200 as Oil Jumps on Iran Strike Plans: Is the US-Iran War About to Restart?
What Else Is on the Bitcoin Calendar This Week?
More than the Fed. The week’s events in order:
Strategy is the one to watch for buying. Its latest filing, on October 19, showed 267 BTC bought at about $82,900, taking holdings to 848,517 BTC at an average cost of $75,446. It had not filed a new purchase by Monday’s U.S. morning.
Bitcoin Price: What Are the Levels to Watch?
Bitcoin closed Sunday at $80,154, below its 50-day EMA at $80,808 for the first time since mid-August, and Monday has not won it back. Reclaiming that line is the first job for buyers.
BTCUSDT Chart 1D TradingView
Above it, $81,390 to $81,840 is the next barrier, where the 4-hour 50 and 200 EMAs meet. Then comes $82,850, which capped every bounce last week.
On the downside, $79,221 to $79,369 is the floor: Saturday’s low and Monday’s. A daily close below it would open the way to Friday’s max pain at $78,000 and then the 200-day EMA at $76,348, with Strategy’s $75,446 cost basis and the $75,000 put wall just beneath.
EXPLORE: Ten Iran Deal Headlines Have Whipsawed Oil Since March and Bitcoin Rallied on Eight of Them
With leverage cleared and funding neutral, the next move will come from the calendar rather than the liquidation engine. Three sessions, three catalysts: the Bitcoin news that decides which side of $80,000 the month closes on starts Wednesday, and until then $79,221 is the line buyers can’t afford to lose.
next
The post Bitcoin Holds $79,200 Before the Fed, Coinbase Earnings and a $10.9B Expiry: Which Way Next? appeared first on Coinspeaker.
276
·
--
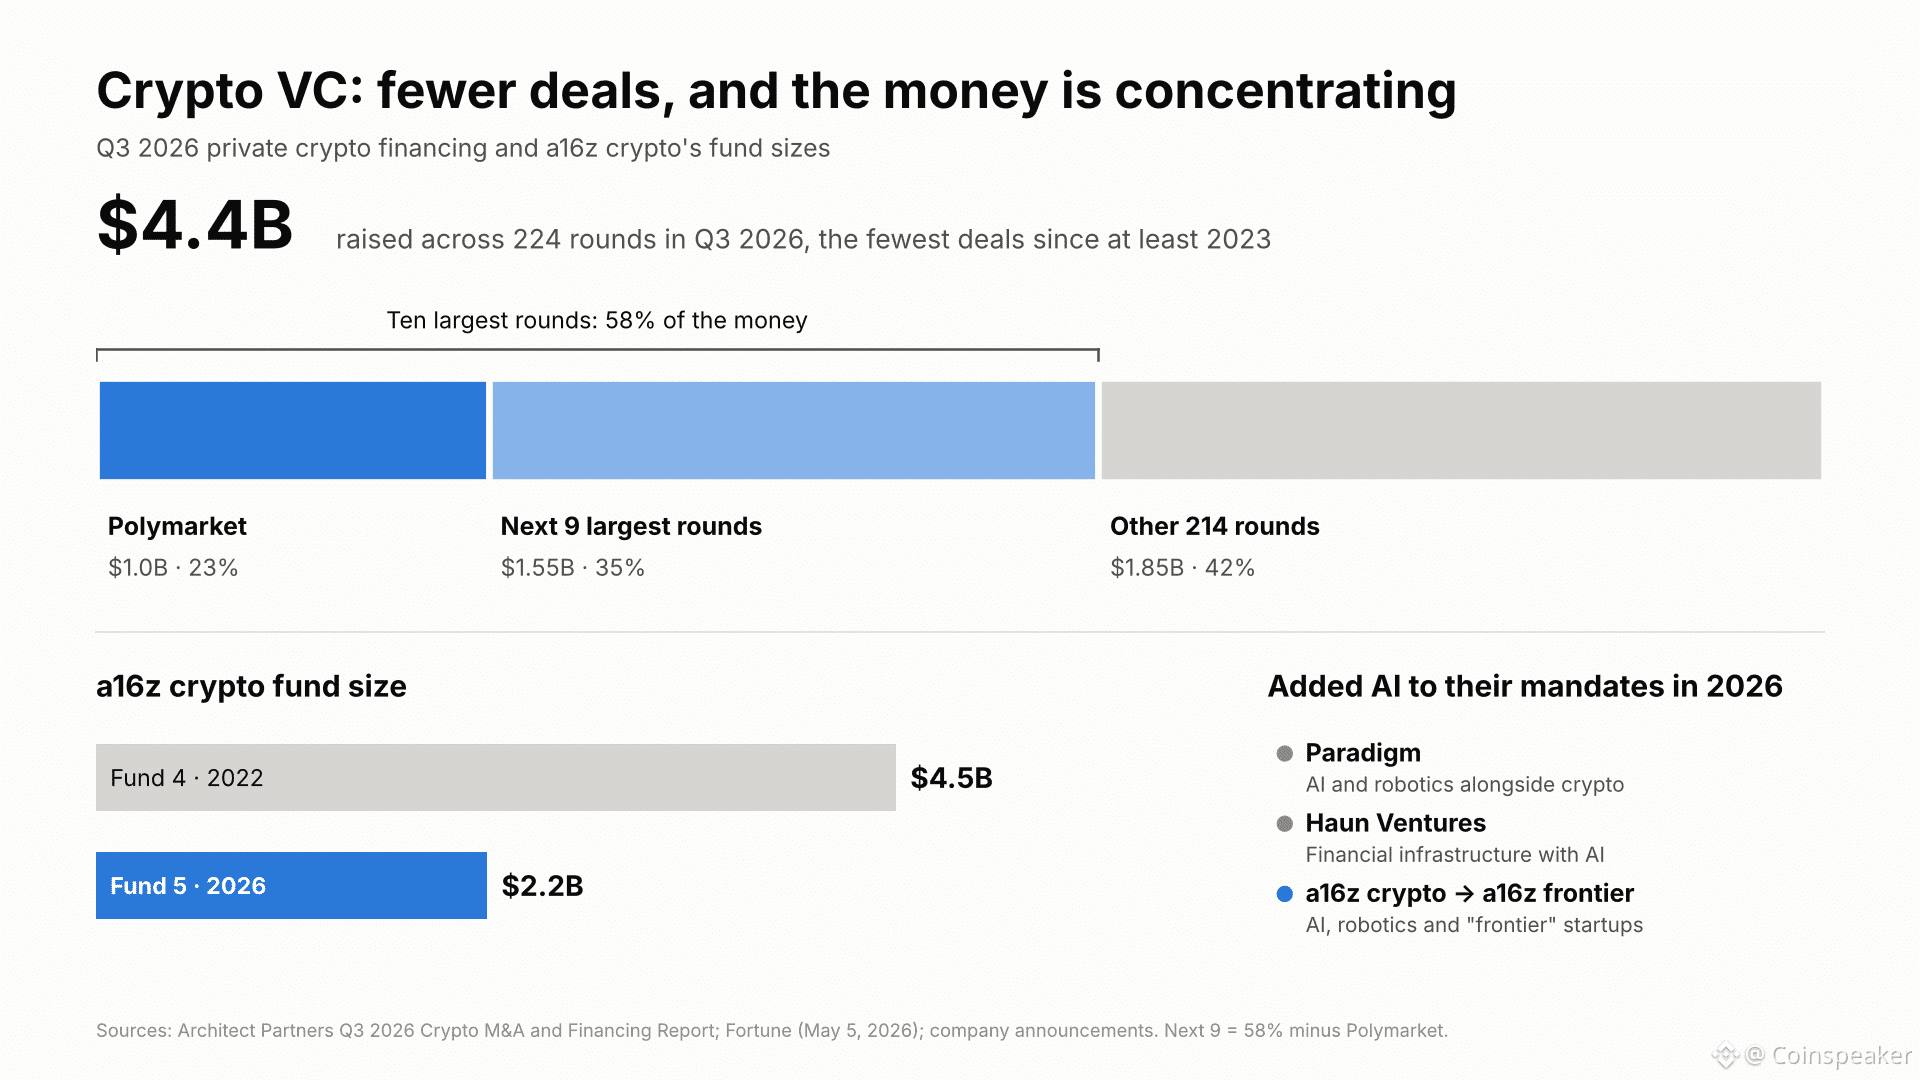
Статья
Andreessen Horowitz Renames A16z Crypto to A16z Frontier: Where Will the Money Go Now?Andreessen Horowitz renamed its blockchain arm a16z crypto to a16z frontier on Thursday, October 22, widening its $2.2 billion fifth fund to AI, robotics and other early-stage technology as crypto startup funding hits a three-year low in deal count. Chris Dixon, who started a16z crypto in 2018, called it “an expansion,” not an exit. The same day, general partner Ali Yahya said he is leaving.
The timing stands out. In May, a spokesperson told Fortune that Fund 5 was “100% dedicated to investing in crypto entrepreneurs.” So what changed, and how much of that money will still reach crypto founders?
https://t.co/pQssLkjGX8
— Chris Dixon (@cdixon) October 22, 2026
DISCOVER: Meme coin supercycle: Top performers this week
a16z Crypto Becomes a16z Frontier: What Changes?
The scope, not the team. In Dixon’s announcement on X, a16z frontier will back “companies building new technologies and creating markets that may take years to develop.” He named AI products, autonomous machines that “perceive, reason, and act in the physical world,” biology, and networks that connect people with AI agents.
Dixon will run the fund with Marc Andreessen, Ben Horowitz and general partners Eddy Lazzarin and Guy Wuollet. The operating teams that support portfolio companies stay in place, and the firm will keep lobbying for “sensible crypto regulation.”
In practice, the shift had already started. The Information’s Leo Schwartz, who broke the story hours earlier, noted that a16z crypto had already backed non-blockchain startups such as prediction market Kalshi and AI compute marketplace Ornn.
Why Is a16z Moving Beyond Crypto Now?
Dixon’s answer is that the label stopped meaning much. He wrote:
Wall Street and fintech companies now regularly launch products built on blockchains. Does that make them crypto companies? The label matters less now.
The funding numbers give a second answer. Crypto private financing came to $4.4 billion across 224 rounds in the third quarter, the lowest number of deals since at least 2023, and the ten largest rounds took 58% of the money. Polymarket’s $1 billion raise alone was almost a quarter of the total.
Fund 5 itself was less than half the size of the $4.5 billion a16z crypto raised in 2022. With fewer crypto deals to fund, a wider mandate gives the firm more places to put the money.
a16z frontier also follows Paradigm and Haun Ventures, which both added AI to their mandates this year.
DISCOVER: Best Meme Coins to Buy in 2026
What Comes Next for a16z Frontier? Dixon Outlines the Fund’s New Direction
A supporting one, on Dixon’s account. He sees blockchains as the payment layer for the AI economy: “Crypto has given the internet money rails that are fast, cheap, global, and programmable.” Stablecoins are “quickly becoming a standard tool” for fintechs and banks, and crypto can “enable machine-to-machine transactions” between AI agents.
That points to which crypto startups should keep getting checks: stablecoin payments and tools that let AI agents pay each other. A token project without a business behind it will now compete with robotics and AI labs for the same partners’ attention.
a16z frontier loses one of the people who built a16z crypto. Ali Yahya joined from Google Brain in 2017, when the crypto team “consisted of only” Dixon, and later became a general partner. He said he is moving to San Francisco to start a company.
Big personal news today: I have decided to leave @a16z, move to SF, and start a company.
It's time to build 🙂
It has been almost 10 years since I joined the firm. I met @cdixon, @bhorowitz, and @pmarca in 2017. At the time, I was an engineer at Google Brain working on…
— Ali Yahya (@alive_) October 22, 2026
He gave no reason beyond wanting to build, and nothing links his departure to the rename. Still, the fund now enters its new phase without the partner who helped write its crypto playbook.
a16z crypto spent eight years and $9.8 billion making the case that crypto deserved its own fund. a16z frontier’s next deals will show whether crypto is still a category for the firm, or just one of the tools its startups use.
EXPLORE: Ripple Prime Opens 24/7 RWA Perpetual Swaps: Institutional Capital Hits Tokenized Stocks and Commodities
next
The post Andreessen Horowitz Renames a16z Crypto to a16z Frontier: Where Will the Money Go Now? appeared first on Coinspeaker.
Andreessen Horowitz Renames A16z Crypto to A16z Frontier: Where Will the Money Go Now?
Andreessen Horowitz renamed its blockchain arm a16z crypto to a16z frontier on Thursday, October 22, widening its $2.2 billion fifth fund to AI, robotics and other early-stage technology as crypto startup funding hits a three-year low in deal count. Chris Dixon, who started a16z crypto in 2018, called it “an expansion,” not an exit. The same day, general partner Ali Yahya said he is leaving.
The timing stands out. In May, a spokesperson told Fortune that Fund 5 was “100% dedicated to investing in crypto entrepreneurs.” So what changed, and how much of that money will still reach crypto founders?
https://t.co/pQssLkjGX8
— Chris Dixon (@cdixon) October 22, 2026
DISCOVER: Meme coin supercycle: Top performers this week
a16z Crypto Becomes a16z Frontier: What Changes?
The scope, not the team. In Dixon’s announcement on X, a16z frontier will back “companies building new technologies and creating markets that may take years to develop.” He named AI products, autonomous machines that “perceive, reason, and act in the physical world,” biology, and networks that connect people with AI agents.
Dixon will run the fund with Marc Andreessen, Ben Horowitz and general partners Eddy Lazzarin and Guy Wuollet. The operating teams that support portfolio companies stay in place, and the firm will keep lobbying for “sensible crypto regulation.”
In practice, the shift had already started. The Information’s Leo Schwartz, who broke the story hours earlier, noted that a16z crypto had already backed non-blockchain startups such as prediction market Kalshi and AI compute marketplace Ornn.
Why Is a16z Moving Beyond Crypto Now?
Dixon’s answer is that the label stopped meaning much. He wrote:
Wall Street and fintech companies now regularly launch products built on blockchains. Does that make them crypto companies? The label matters less now.
The funding numbers give a second answer. Crypto private financing came to $4.4 billion across 224 rounds in the third quarter, the lowest number of deals since at least 2023, and the ten largest rounds took 58% of the money. Polymarket’s $1 billion raise alone was almost a quarter of the total.
Fund 5 itself was less than half the size of the $4.5 billion a16z crypto raised in 2022. With fewer crypto deals to fund, a wider mandate gives the firm more places to put the money.
a16z frontier also follows Paradigm and Haun Ventures, which both added AI to their mandates this year.
DISCOVER: Best Meme Coins to Buy in 2026
What Comes Next for a16z Frontier? Dixon Outlines the Fund’s New Direction
A supporting one, on Dixon’s account. He sees blockchains as the payment layer for the AI economy: “Crypto has given the internet money rails that are fast, cheap, global, and programmable.” Stablecoins are “quickly becoming a standard tool” for fintechs and banks, and crypto can “enable machine-to-machine transactions” between AI agents.
That points to which crypto startups should keep getting checks: stablecoin payments and tools that let AI agents pay each other. A token project without a business behind it will now compete with robotics and AI labs for the same partners’ attention.
a16z frontier loses one of the people who built a16z crypto. Ali Yahya joined from Google Brain in 2017, when the crypto team “consisted of only” Dixon, and later became a general partner. He said he is moving to San Francisco to start a company.
Big personal news today: I have decided to leave @a16z, move to SF, and start a company.
It's time to build 🙂
It has been almost 10 years since I joined the firm. I met @cdixon, @bhorowitz, and @pmarca in 2017. At the time, I was an engineer at Google Brain working on…
— Ali Yahya (@alive_) October 22, 2026
He gave no reason beyond wanting to build, and nothing links his departure to the rename. Still, the fund now enters its new phase without the partner who helped write its crypto playbook.
a16z crypto spent eight years and $9.8 billion making the case that crypto deserved its own fund. a16z frontier’s next deals will show whether crypto is still a category for the firm, or just one of the tools its startups use.
EXPLORE: Ripple Prime Opens 24/7 RWA Perpetual Swaps: Institutional Capital Hits Tokenized Stocks and Commodities
next
The post Andreessen Horowitz Renames a16z Crypto to a16z Frontier: Where Will the Money Go Now? appeared first on Coinspeaker.
777
·
--
Проверено
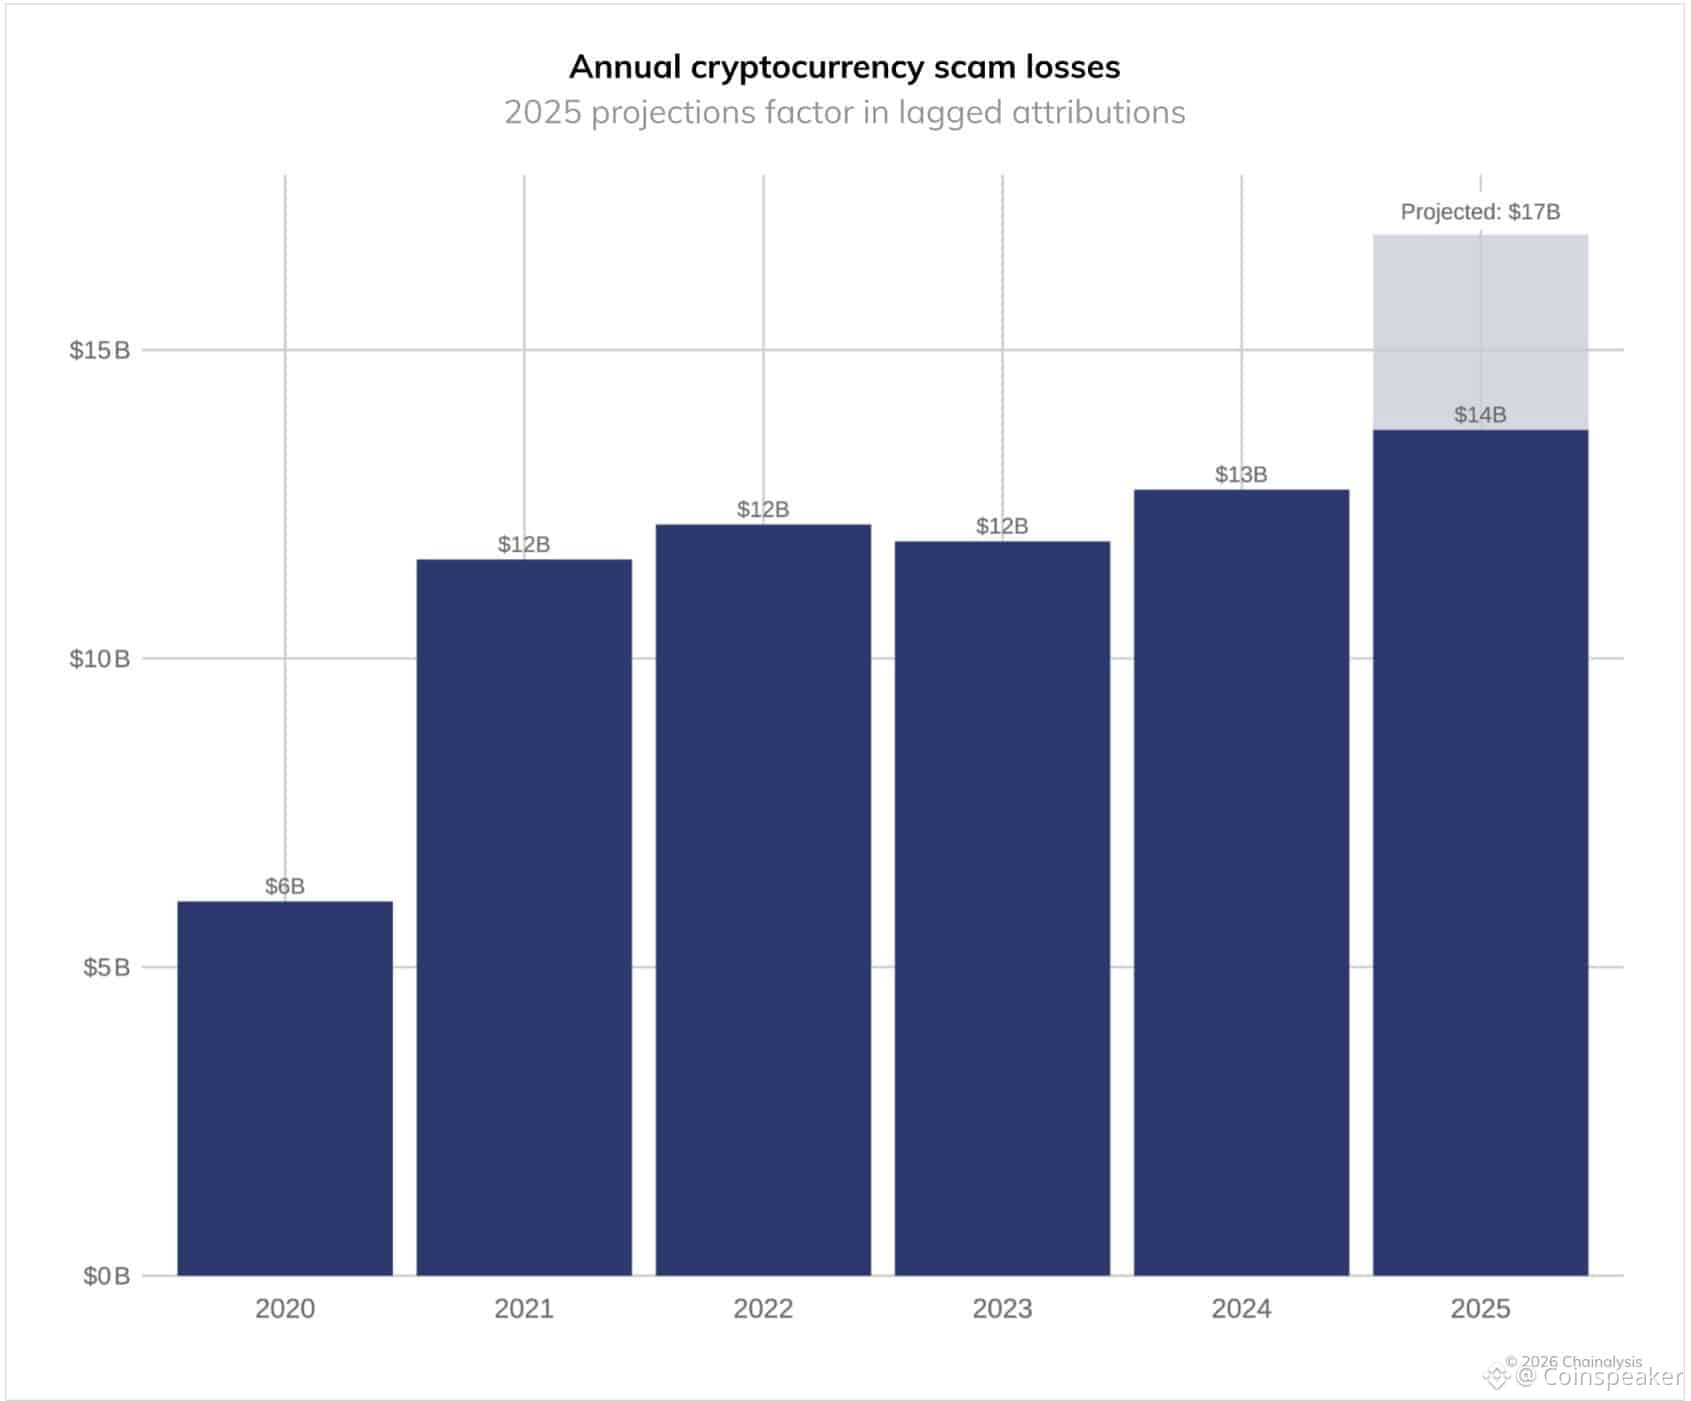
Статья
CZ Says AI Won’t Break Bitcoin, but Leaked Data Will Hurt Its Users: Can BTC Turn the $81,000 Flo...Binance founder Changpeng “CZ” Zhao said on Friday, October 23, that fears of AI hacking crypto are misplaced. Both the internet and banking systems run on weaker encryption, but he warned that AI is already making phishing and social engineering more dangerous for ordinary users. CZ’s post led Friday’s Bitcoin news as the price sat at $81,817, down 0.8% in 24 hours.
Bitcoin held $81,000 overnight. Whale wallets kept buying. So, are the AI and quantum threats real, and what does BTC need to bounce from here?
Everyone worried about AI hacking crypto, but the internet and banking systems rely on weaker encryption.
That said, AI doesn’t need to break Bitcoin’s cryptography to cause damage, leaked data already enables more phishing, social engineering, etc,
Stay SAFU!
— CZ 🔶 BNB (@cz_binance) October 23, 2026
DISCOVER: Meme coin supercycle: Top performers this week
Bitcoin News: Are AI and Quantum Computing a Real Threat?
Not to the code, at least for now. AI models can find software bugs and write convincing scams, but they cannot solve the math that protects a Bitcoin private key. CZ’s point is that the same family of public-key cryptography also secures web traffic and online banking. Any machine able to crack Bitcoin keys would put those systems at risk too.
Quantum computers are the longer-term worry. No existing machine can break Bitcoin’s signatures. Still, the Quantum Alliance, a group of nine crypto companies, estimates that 6.4 million BTC, 30% of supply, sit in addresses whose public keys are already visible on-chain. That includes coins attributed to Satoshi Nakamoto.
Experts disagree on timing. Postquant Labs CTO Richard Carback sees 2028 as a realistic timeframe for a machine capable of breaking today’s cryptography. Others won’t name a date.
Bitcoin developers are discussing BIP-360, a proposal for quantum-resistant addresses, but it remains a draft.
So why are the users the weak point? Because attackers don’t need to break anything. Stolen emails, phone numbers, and purchase histories let scammers write messages that look like they came from an exchange or a wallet provider. AI makes those messages cheaper to produce and harder to spot.
The numbers back CZ up. AI-enabled scams were 4.5 times more profitable than traditional ones in 2025, and impersonation scams grew more than 1,400%, Chainalysis found. Total crypto scam revenue reached an estimated $17 billion.
Scam losses 2025
This was CZ’s second security warning in three days. On Wednesday, he told users to be careful on any website after two critical PHP flaws left millions of servers exposed.
DISCOVER: CZ Warns Crypto Users to Be “Extra Careful”: PHP Vulnerabilities Hit the Code Behind 70% of Websites
Bitcoin Price Analysis: Can the Bounce Start From $81,000?
Buyers have defended the level twice in two days. BTC dipped to $80,940 on Thursday and $81,118 on Friday, both times just above its 50-day EMA at $80,880.
BTCUSDT Chart 1H
Large wallets are adding. Since October 1, 40 newly created wallets have withdrawn 9,458 BTC, worth about $771.5 million, from market maker Wintermute. New wallets don’t always mean new buyers, but the pattern fits steady accumulation.
The first resistance is $82,100 to $82,850, where the 4-hour moving averages meet the last swing high. Above that, $84,900, Wednesday’s high, is the level that would turn this into a real bounce. Below, a daily close under $80,394 would open the way to the 200-day EMA near $76,200.
DISCOVER: Best Meme Coins to Buy in 2026
What Are the Major Factors for Bitcoin From Here?
Oil comes first. Brent crude trades at $114 a barrel with the Strait of Hormuz still largely shut and the U.S. blockade of Iranian oil in place. The New York Times reported this week that U.S. and Israeli forces have plans to resume strikes on Iran after the midterms, though nothing has been approved.
The Fed is the second factor, and rate cuts are off the table. The Fed raised rates in September to a range of 3.75% to 4.00%. Traders put about 94% odds on a hold at the October 28 decision and more than 70% on another hike in December, prediction market data compiled by DeFi Rate shows. That is the main headwind for BTC.
Fed Rate Odds Defirate
Then come the November 3 midterms. Polymarket gives Democrats a 92.5% chance of winning the House and 68.5% for the Senate. A Democratic Congress facing a Republican White House would make new crypto legislation harder to pass next year.
AI won’t break Bitcoin’s cryptography anytime soon. For now, the Bitcoin news that moves the price is oil, the Fed and an election 11 days away.
EXPLORE: Bitcoin Slides From $84,900 to $82,200 as Oil Jumps on Iran Strike Plans
next
The post CZ Says AI Won’t Break Bitcoin, but Leaked Data Will Hurt Its Users: Can BTC Turn the $81,000 Floor Into a Bounce? appeared first on Coinspeaker.
CZ Says AI Won’t Break Bitcoin, but Leaked Data Will Hurt Its Users: Can BTC Turn the $81,000 Flo...
Binance founder Changpeng “CZ” Zhao said on Friday, October 23, that fears of AI hacking crypto are misplaced. Both the internet and banking systems run on weaker encryption, but he warned that AI is already making phishing and social engineering more dangerous for ordinary users. CZ’s post led Friday’s Bitcoin news as the price sat at $81,817, down 0.8% in 24 hours.
Bitcoin held $81,000 overnight. Whale wallets kept buying. So, are the AI and quantum threats real, and what does BTC need to bounce from here?
Everyone worried about AI hacking crypto, but the internet and banking systems rely on weaker encryption.
That said, AI doesn’t need to break Bitcoin’s cryptography to cause damage, leaked data already enables more phishing, social engineering, etc,
Stay SAFU!
— CZ 🔶 BNB (@cz_binance) October 23, 2026
DISCOVER: Meme coin supercycle: Top performers this week
Bitcoin News: Are AI and Quantum Computing a Real Threat?
Not to the code, at least for now. AI models can find software bugs and write convincing scams, but they cannot solve the math that protects a Bitcoin private key. CZ’s point is that the same family of public-key cryptography also secures web traffic and online banking. Any machine able to crack Bitcoin keys would put those systems at risk too.
Quantum computers are the longer-term worry. No existing machine can break Bitcoin’s signatures. Still, the Quantum Alliance, a group of nine crypto companies, estimates that 6.4 million BTC, 30% of supply, sit in addresses whose public keys are already visible on-chain. That includes coins attributed to Satoshi Nakamoto.
Experts disagree on timing. Postquant Labs CTO Richard Carback sees 2028 as a realistic timeframe for a machine capable of breaking today’s cryptography. Others won’t name a date.
Bitcoin developers are discussing BIP-360, a proposal for quantum-resistant addresses, but it remains a draft.
So why are the users the weak point? Because attackers don’t need to break anything. Stolen emails, phone numbers, and purchase histories let scammers write messages that look like they came from an exchange or a wallet provider. AI makes those messages cheaper to produce and harder to spot.
The numbers back CZ up. AI-enabled scams were 4.5 times more profitable than traditional ones in 2025, and impersonation scams grew more than 1,400%, Chainalysis found. Total crypto scam revenue reached an estimated $17 billion.
Scam losses 2025
This was CZ’s second security warning in three days. On Wednesday, he told users to be careful on any website after two critical PHP flaws left millions of servers exposed.
DISCOVER: CZ Warns Crypto Users to Be “Extra Careful”: PHP Vulnerabilities Hit the Code Behind 70% of Websites
Bitcoin Price Analysis: Can the Bounce Start From $81,000?
Buyers have defended the level twice in two days. BTC dipped to $80,940 on Thursday and $81,118 on Friday, both times just above its 50-day EMA at $80,880.
BTCUSDT Chart 1H
Large wallets are adding. Since October 1, 40 newly created wallets have withdrawn 9,458 BTC, worth about $771.5 million, from market maker Wintermute. New wallets don’t always mean new buyers, but the pattern fits steady accumulation.
The first resistance is $82,100 to $82,850, where the 4-hour moving averages meet the last swing high. Above that, $84,900, Wednesday’s high, is the level that would turn this into a real bounce. Below, a daily close under $80,394 would open the way to the 200-day EMA near $76,200.
DISCOVER: Best Meme Coins to Buy in 2026
What Are the Major Factors for Bitcoin From Here?
Oil comes first. Brent crude trades at $114 a barrel with the Strait of Hormuz still largely shut and the U.S. blockade of Iranian oil in place. The New York Times reported this week that U.S. and Israeli forces have plans to resume strikes on Iran after the midterms, though nothing has been approved.
The Fed is the second factor, and rate cuts are off the table. The Fed raised rates in September to a range of 3.75% to 4.00%. Traders put about 94% odds on a hold at the October 28 decision and more than 70% on another hike in December, prediction market data compiled by DeFi Rate shows. That is the main headwind for BTC.
Fed Rate Odds Defirate
Then come the November 3 midterms. Polymarket gives Democrats a 92.5% chance of winning the House and 68.5% for the Senate. A Democratic Congress facing a Republican White House would make new crypto legislation harder to pass next year.
AI won’t break Bitcoin’s cryptography anytime soon. For now, the Bitcoin news that moves the price is oil, the Fed and an election 11 days away.
EXPLORE: Bitcoin Slides From $84,900 to $82,200 as Oil Jumps on Iran Strike Plans
next
The post CZ Says AI Won’t Break Bitcoin, but Leaked Data Will Hurt Its Users: Can BTC Turn the $81,000 Floor Into a Bounce? appeared first on Coinspeaker.
1
808
·
--
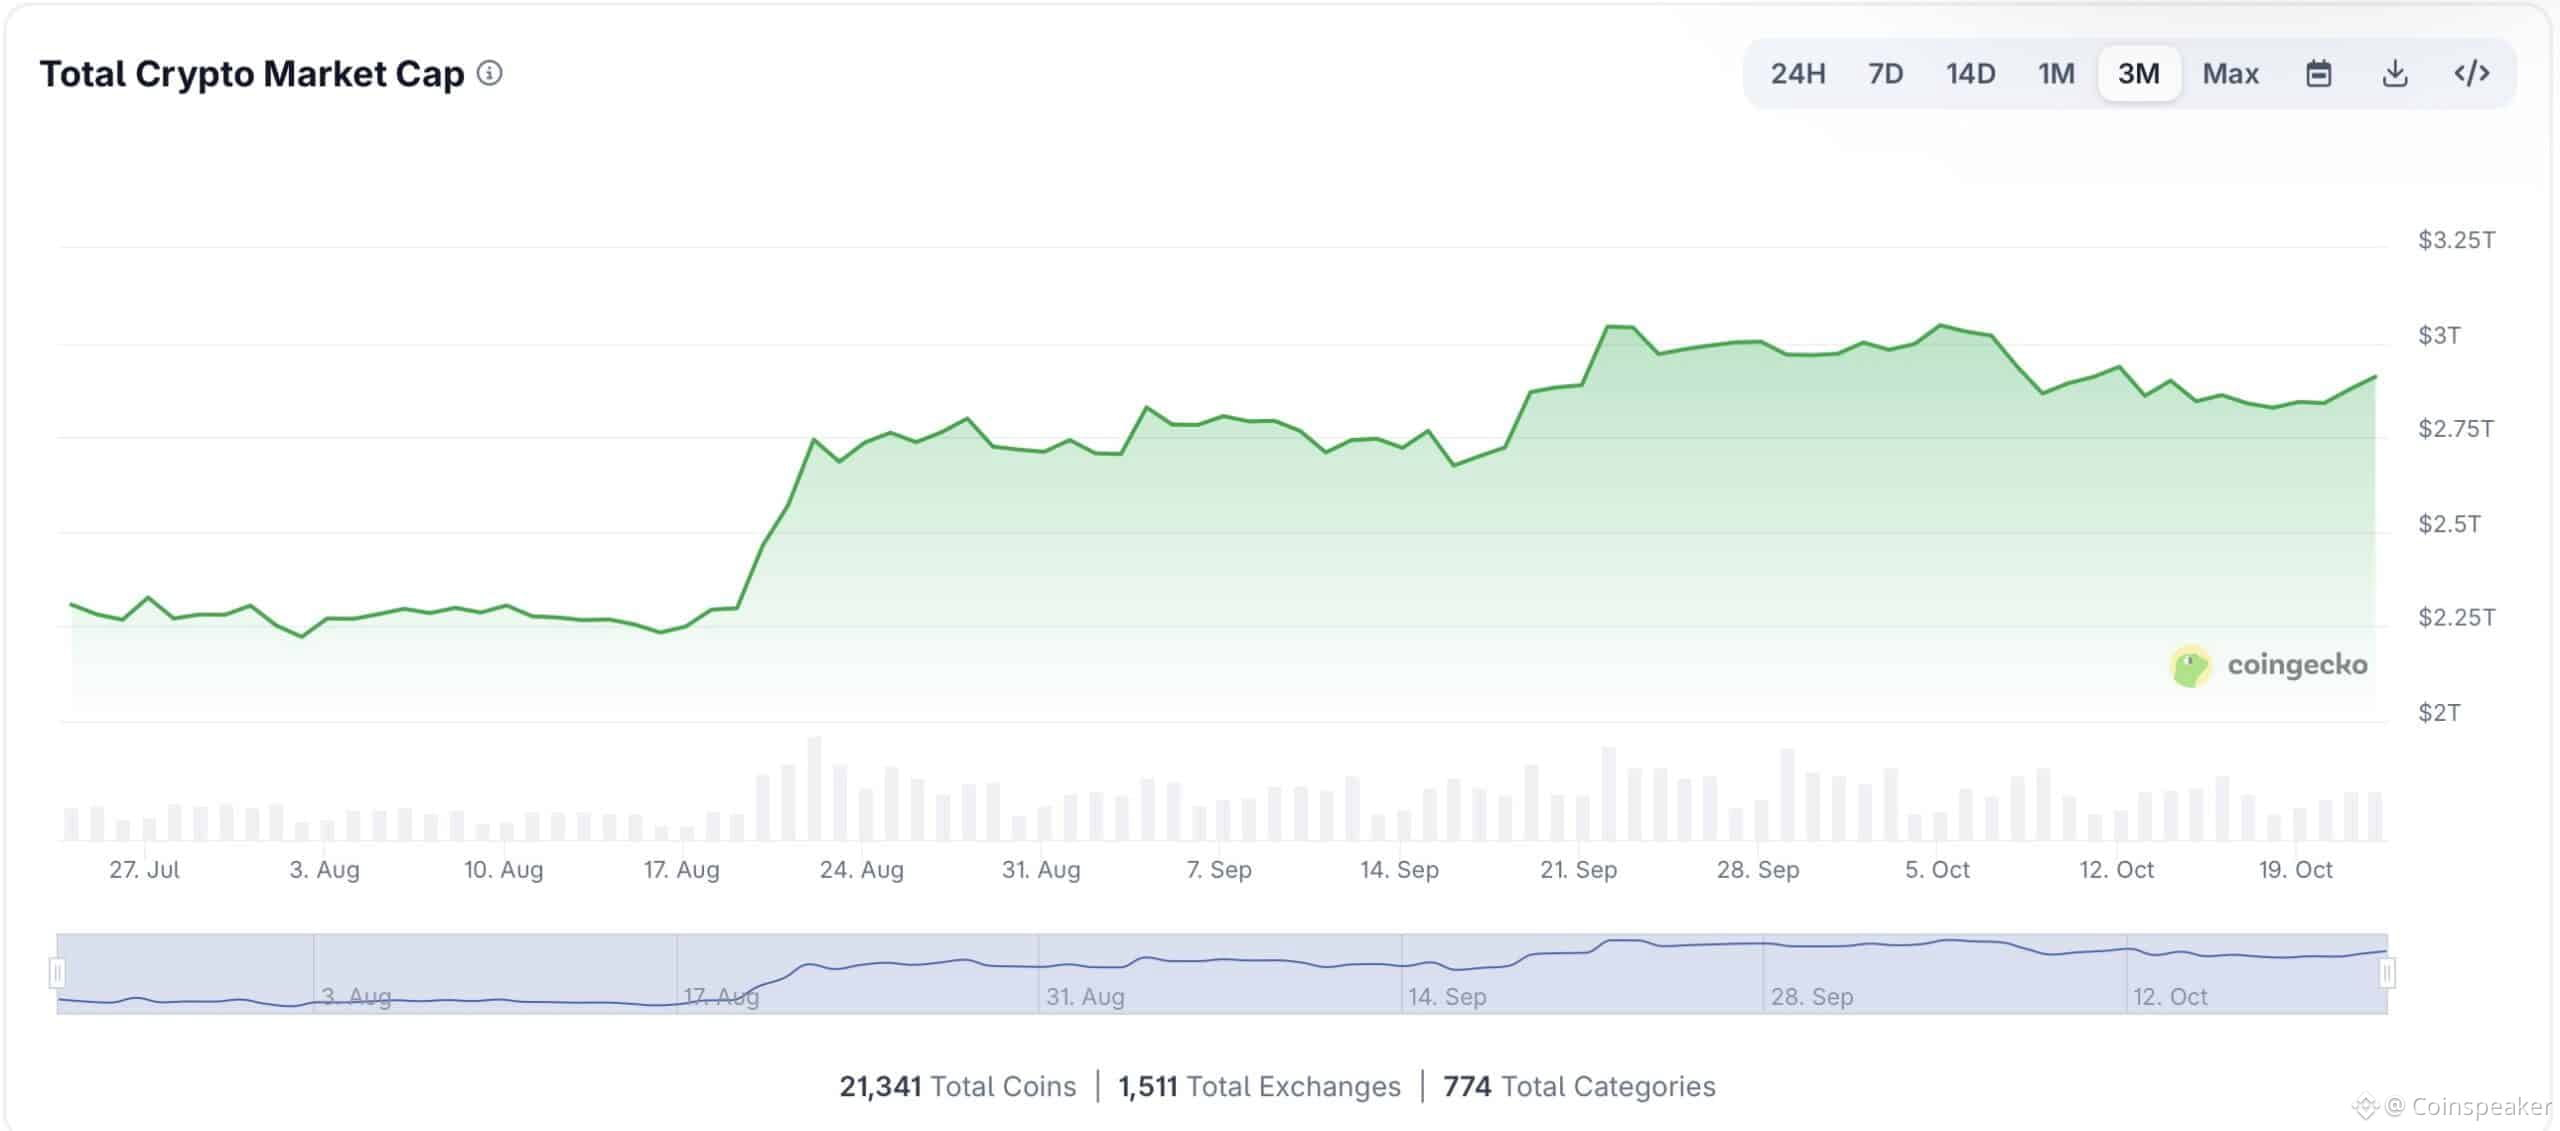
Статья
CZ Warns Crypto Users to Be “Extra Careful”: PHP Vulnerabilities Hit the Code Behind 70% of WebsitesBinance founder Changpeng “CZ” Zhao told his followers on Wednesday, October 21, to be “extra careful” visiting any website for the next few days. Why? PHP rushed out fixes for two PHP vulnerabilities that let attackers take over web servers without logging in. Plenty of sites won’t patch this week. Some never will.
The flaws, CVE-2026-109618 and CVE-2026-109619, have been nicknamed PHP2Shell. Each scores 9.2 out of 10 for severity, and the FBI’s Cyber Division told organizations that can’t update to take their systems offline. So what does a bug on someone else’s server mean for your crypto?
Call me paranoid, but be extra careful visiting ANY web site in the next few days, as some web admins are not always up-to-date with security patches.
Two vulnerabilities (CVE-2026-109618 and CVE-2026-109619) reported for PHP, the web programming language, affecting servers…
— CZ 🔶 BNB (@cz_binance) October 21, 2026
DISCOVER: Best Meme Coins to Buy in 2026
What Are the PHP Vulnerabilities, and Why Is Everyone Worried?
They let a stranger run their own code on a website’s server with a single request, before the site’s own software even loads. PHP’s release notice urged all users to update to version 8.5.12, 8.4.27, 8.3.36 or 8.2.35 immediately. Version 8.1 and older get no official fix.
The reach is huge. PHP runs 70.5% of the websites whose server language is known, W3Techs data shows. Sansec lists 11 apps where the attack has been confirmed, from WordPress and Magento to phpMyAdmin.
Attackers didn’t wait for the patch. Details leaked on October 20, a day before release, and Amazon’s honeypot logged an exploit attempt as early as October 17.
Security researcher Kevin Beaumont called it “one of the biggest vulns in years.”
Two critical vulnerabilities have been identified in PHP, a widely used programming language that powers websites and web applications. These vulnerabilities (CVE-2026-109618 and CVE-2026-109619) could allow malicious cyber actors to remotely execute code in PHP core, potentially… pic.twitter.com/tnwiQv5v0F
— FBI Cyber Division (@FBICyberDiv) October 21, 2026
DISCOVER: Meme coin supercycle: Top performers this week
Why Is a Server Bug Dangerous for Crypto Users?
Because whoever controls the server controls the page you see. An attacker can slip a fake “connect wallet” button, or a drainer, a script that empties your wallet once you sign, onto a site you already trust.
It has happened before. In June 2025, hackers took over Cointelegraph’s front end and showed readers a fake airdrop pop-up. One of the new bugs can also leak a server’s memory, which may hold passwords, login sessions and API keys.
The big platforms say they’re clear. BNB Chain said its tech stack “does not use PHP,” and Trust Wallet said the same. That doesn’t cover the blogs, token pages and dashboards people click through on the way to them.
What to do this week:
Open exchanges and wallets from bookmarks, never from links.
Read every wallet signature request before approving it.
Turn on two-factor login and withdrawal-address allowlists.
Keep long-term coins on a hardware wallet.
DISCOVER: Ethereum Foundation Partners With SEAL to Combat Wallet Drainers
Crypto Market Overview: Is the PHP Scare Hitting Prices?
Total Crypto Market Cap Coingecko
Coin Price 24h change Bitcoin (BTC) $81,991 −1.5% Ethereum (ETH) $2,409 −1.6% BNB (BNB) $734.59 −1.4% XRP (XRP) $1.33 −1.5% Solana (SOL) $104.55 −1.5%
Not so far. The crypto market is worth $2.74 trillion, and the biggest coins are all down about 1.5% in 24 hours, a dip that tracks oil and the Iran headlines more than any hack.
Bitcoin holds 60% of the market, and the Crypto Fear & Greed Index reads 68, “Greed,” up from 63 a day earlier. No exchange or wallet has reported a loss tied to PHP2Shell yet.
The patches for both PHP vulnerabilities are out. The risk now sits with every admin who hasn’t installed them, and with anyone who visits their sites.
EXPLORE: Bitcoin Slides From $84,900 to $82,200 as Oil Jumps on Iran Strike Plans
next
The post CZ Warns Crypto Users to Be “Extra Careful”: PHP Vulnerabilities Hit the Code Behind 70% of Websites appeared first on Coinspeaker.
CZ Warns Crypto Users to Be “Extra Careful”: PHP Vulnerabilities Hit the Code Behind 70% of Websites
Binance founder Changpeng “CZ” Zhao told his followers on Wednesday, October 21, to be “extra careful” visiting any website for the next few days. Why? PHP rushed out fixes for two PHP vulnerabilities that let attackers take over web servers without logging in. Plenty of sites won’t patch this week. Some never will.
The flaws, CVE-2026-109618 and CVE-2026-109619, have been nicknamed PHP2Shell. Each scores 9.2 out of 10 for severity, and the FBI’s Cyber Division told organizations that can’t update to take their systems offline. So what does a bug on someone else’s server mean for your crypto?
Call me paranoid, but be extra careful visiting ANY web site in the next few days, as some web admins are not always up-to-date with security patches.
Two vulnerabilities (CVE-2026-109618 and CVE-2026-109619) reported for PHP, the web programming language, affecting servers…
— CZ 🔶 BNB (@cz_binance) October 21, 2026
DISCOVER: Best Meme Coins to Buy in 2026
What Are the PHP Vulnerabilities, and Why Is Everyone Worried?
They let a stranger run their own code on a website’s server with a single request, before the site’s own software even loads. PHP’s release notice urged all users to update to version 8.5.12, 8.4.27, 8.3.36 or 8.2.35 immediately. Version 8.1 and older get no official fix.
The reach is huge. PHP runs 70.5% of the websites whose server language is known, W3Techs data shows. Sansec lists 11 apps where the attack has been confirmed, from WordPress and Magento to phpMyAdmin.
Attackers didn’t wait for the patch. Details leaked on October 20, a day before release, and Amazon’s honeypot logged an exploit attempt as early as October 17.
Security researcher Kevin Beaumont called it “one of the biggest vulns in years.”
Two critical vulnerabilities have been identified in PHP, a widely used programming language that powers websites and web applications. These vulnerabilities (CVE-2026-109618 and CVE-2026-109619) could allow malicious cyber actors to remotely execute code in PHP core, potentially… pic.twitter.com/tnwiQv5v0F
— FBI Cyber Division (@FBICyberDiv) October 21, 2026
DISCOVER: Meme coin supercycle: Top performers this week
Why Is a Server Bug Dangerous for Crypto Users?
Because whoever controls the server controls the page you see. An attacker can slip a fake “connect wallet” button, or a drainer, a script that empties your wallet once you sign, onto a site you already trust.
It has happened before. In June 2025, hackers took over Cointelegraph’s front end and showed readers a fake airdrop pop-up. One of the new bugs can also leak a server’s memory, which may hold passwords, login sessions and API keys.
The big platforms say they’re clear. BNB Chain said its tech stack “does not use PHP,” and Trust Wallet said the same. That doesn’t cover the blogs, token pages and dashboards people click through on the way to them.
What to do this week:
Open exchanges and wallets from bookmarks, never from links.
Read every wallet signature request before approving it.
Turn on two-factor login and withdrawal-address allowlists.
Keep long-term coins on a hardware wallet.
DISCOVER: Ethereum Foundation Partners With SEAL to Combat Wallet Drainers
Crypto Market Overview: Is the PHP Scare Hitting Prices?
Total Crypto Market Cap Coingecko
Coin Price 24h change Bitcoin (BTC) $81,991 −1.5% Ethereum (ETH) $2,409 −1.6% BNB (BNB) $734.59 −1.4% XRP (XRP) $1.33 −1.5% Solana (SOL) $104.55 −1.5%
Not so far. The crypto market is worth $2.74 trillion, and the biggest coins are all down about 1.5% in 24 hours, a dip that tracks oil and the Iran headlines more than any hack.
Bitcoin holds 60% of the market, and the Crypto Fear & Greed Index reads 68, “Greed,” up from 63 a day earlier. No exchange or wallet has reported a loss tied to PHP2Shell yet.
The patches for both PHP vulnerabilities are out. The risk now sits with every admin who hasn’t installed them, and with anyone who visits their sites.
EXPLORE: Bitcoin Slides From $84,900 to $82,200 as Oil Jumps on Iran Strike Plans
next
The post CZ Warns Crypto Users to Be “Extra Careful”: PHP Vulnerabilities Hit the Code Behind 70% of Websites appeared first on Coinspeaker.
399
·
--
Статья
Is Something Huge Brewing for Bitcoin? Perplexity AI Predicts a Big Move on the HorizonSomething potentially massive could be on the horizon for Bitcoin (BTC USD) by January 1, 2027. Perplexity AI predicts a huge move in Bitcoin’s price by year-end in an intentionally extreme, over-the-top scenario built around an unlikely, hypothetical landmark catalyst.
The idea centers on a coordinated announcement by several of the world’s largest sovereign wealth funds and national pension systems, collectively managing trillions of dollars, that they are allocating a meaningful share of their long-term reserves to Bitcoin.
(SOURCE: Perplexity AI Predicts a Huge Move for BTC)
Framed as a strategic hedge against fiat debasement, geopolitical fragmentation, and monetary uncertainty, such a move would instantly legitimize Bitcoin as a core reserve asset at the highest institutional level and trigger a wave of forced accumulation across global finance.
Bitcoin price is currently trading at $83,300, up +2.4% on the day after a strong rebound from the low $80,000s. Daily trading volume has also spiked to $28.2Bn, up from $21Bn the day prior. Stick around until the end to see what incredible price Perplexity AI believes BTC USD could hit by the beginning of 2027.
DISCOVER: Meme Coin Supercycle: Best Tokens to Buy Right Now
Bitcoin Technical Analysis: How Does BTC Get Back to Six Figures?
(SOURCE: TradingView)
On higher timeframes, Bitcoin has been consolidating in the low-to-mid $80,000s after repeatedly failing to hold above the $85,000–$87,000 zone. Price continues to defend key support around $80,000–$81,000 while forming a series of higher lows relative to earlier troughs in the cycle.
In a standard bull market, a decisive weekly close above $90,000–$95,000 would confirm intermediate strength and open the path toward the prior all-time high near $126,000.
Under the extreme sovereign-wealth and pension-fund allocation scenario described above, clearing that previous high would likely unleash powerful measured-move extensions and multi-cycle Fibonacci projections from the multi-year base.
Momentum indicators currently sit in neutral territory with substantial room to travel into the extreme overbought readings characteristic of parabolic advances.
Key near-term support sits in the $80,000–$81,000 and $76,000–$78,000 zones; holding those levels would preserve the broader recovery structure while the market digests any major narrative developments.
Perplexity AI Predicts the Bitcoin Price by January 1, 2027: The Big Reveal
HUGEE 💥
BINANCE FOUNDER CZ SAYS:“SOON, MILLIONAIRES WON’T BE ABLE TO AFFORD 1 FULL #BITCOIN. pic.twitter.com/POcnMCb99O
— BITCOINLFG® (@bitcoinlfgo) October 15, 2026
Under this highly speculative scenario, and assuming a full-blown crypto bull market returns, Perplexity AI predicts Bitcoin could reach between $750,000 and $1,400,000, with a stretch target of $2,000,000+ by January 1, 2027.
This remains pure speculation and entertainment, not a realistic base-case outlook. The catalyst would require extraordinary coordination among the world’s largest capital pools that is currently highly unlikely.
EXPLORE: Best Meme Coins to Buy in 2026
next
The post Is Something Huge Brewing for Bitcoin? Perplexity AI Predicts a Big Move on the Horizon appeared first on Coinspeaker.
Is Something Huge Brewing for Bitcoin? Perplexity AI Predicts a Big Move on the Horizon
Something potentially massive could be on the horizon for Bitcoin (BTC USD) by January 1, 2027. Perplexity AI predicts a huge move in Bitcoin’s price by year-end in an intentionally extreme, over-the-top scenario built around an unlikely, hypothetical landmark catalyst.
The idea centers on a coordinated announcement by several of the world’s largest sovereign wealth funds and national pension systems, collectively managing trillions of dollars, that they are allocating a meaningful share of their long-term reserves to Bitcoin.
(SOURCE: Perplexity AI Predicts a Huge Move for BTC)
Framed as a strategic hedge against fiat debasement, geopolitical fragmentation, and monetary uncertainty, such a move would instantly legitimize Bitcoin as a core reserve asset at the highest institutional level and trigger a wave of forced accumulation across global finance.
Bitcoin price is currently trading at $83,300, up +2.4% on the day after a strong rebound from the low $80,000s. Daily trading volume has also spiked to $28.2Bn, up from $21Bn the day prior. Stick around until the end to see what incredible price Perplexity AI believes BTC USD could hit by the beginning of 2027.
DISCOVER: Meme Coin Supercycle: Best Tokens to Buy Right Now
Bitcoin Technical Analysis: How Does BTC Get Back to Six Figures?
(SOURCE: TradingView)
On higher timeframes, Bitcoin has been consolidating in the low-to-mid $80,000s after repeatedly failing to hold above the $85,000–$87,000 zone. Price continues to defend key support around $80,000–$81,000 while forming a series of higher lows relative to earlier troughs in the cycle.
In a standard bull market, a decisive weekly close above $90,000–$95,000 would confirm intermediate strength and open the path toward the prior all-time high near $126,000.
Under the extreme sovereign-wealth and pension-fund allocation scenario described above, clearing that previous high would likely unleash powerful measured-move extensions and multi-cycle Fibonacci projections from the multi-year base.
Momentum indicators currently sit in neutral territory with substantial room to travel into the extreme overbought readings characteristic of parabolic advances.
Key near-term support sits in the $80,000–$81,000 and $76,000–$78,000 zones; holding those levels would preserve the broader recovery structure while the market digests any major narrative developments.
Perplexity AI Predicts the Bitcoin Price by January 1, 2027: The Big Reveal
HUGEE 💥
BINANCE FOUNDER CZ SAYS:“SOON, MILLIONAIRES WON’T BE ABLE TO AFFORD 1 FULL #BITCOIN. pic.twitter.com/POcnMCb99O
— BITCOINLFG® (@bitcoinlfgo) October 15, 2026
Under this highly speculative scenario, and assuming a full-blown crypto bull market returns, Perplexity AI predicts Bitcoin could reach between $750,000 and $1,400,000, with a stretch target of $2,000,000+ by January 1, 2027.
This remains pure speculation and entertainment, not a realistic base-case outlook. The catalyst would require extraordinary coordination among the world’s largest capital pools that is currently highly unlikely.
EXPLORE: Best Meme Coins to Buy in 2026
next
The post Is Something Huge Brewing for Bitcoin? Perplexity AI Predicts a Big Move on the Horizon appeared first on Coinspeaker.
288
·
--
Проверено
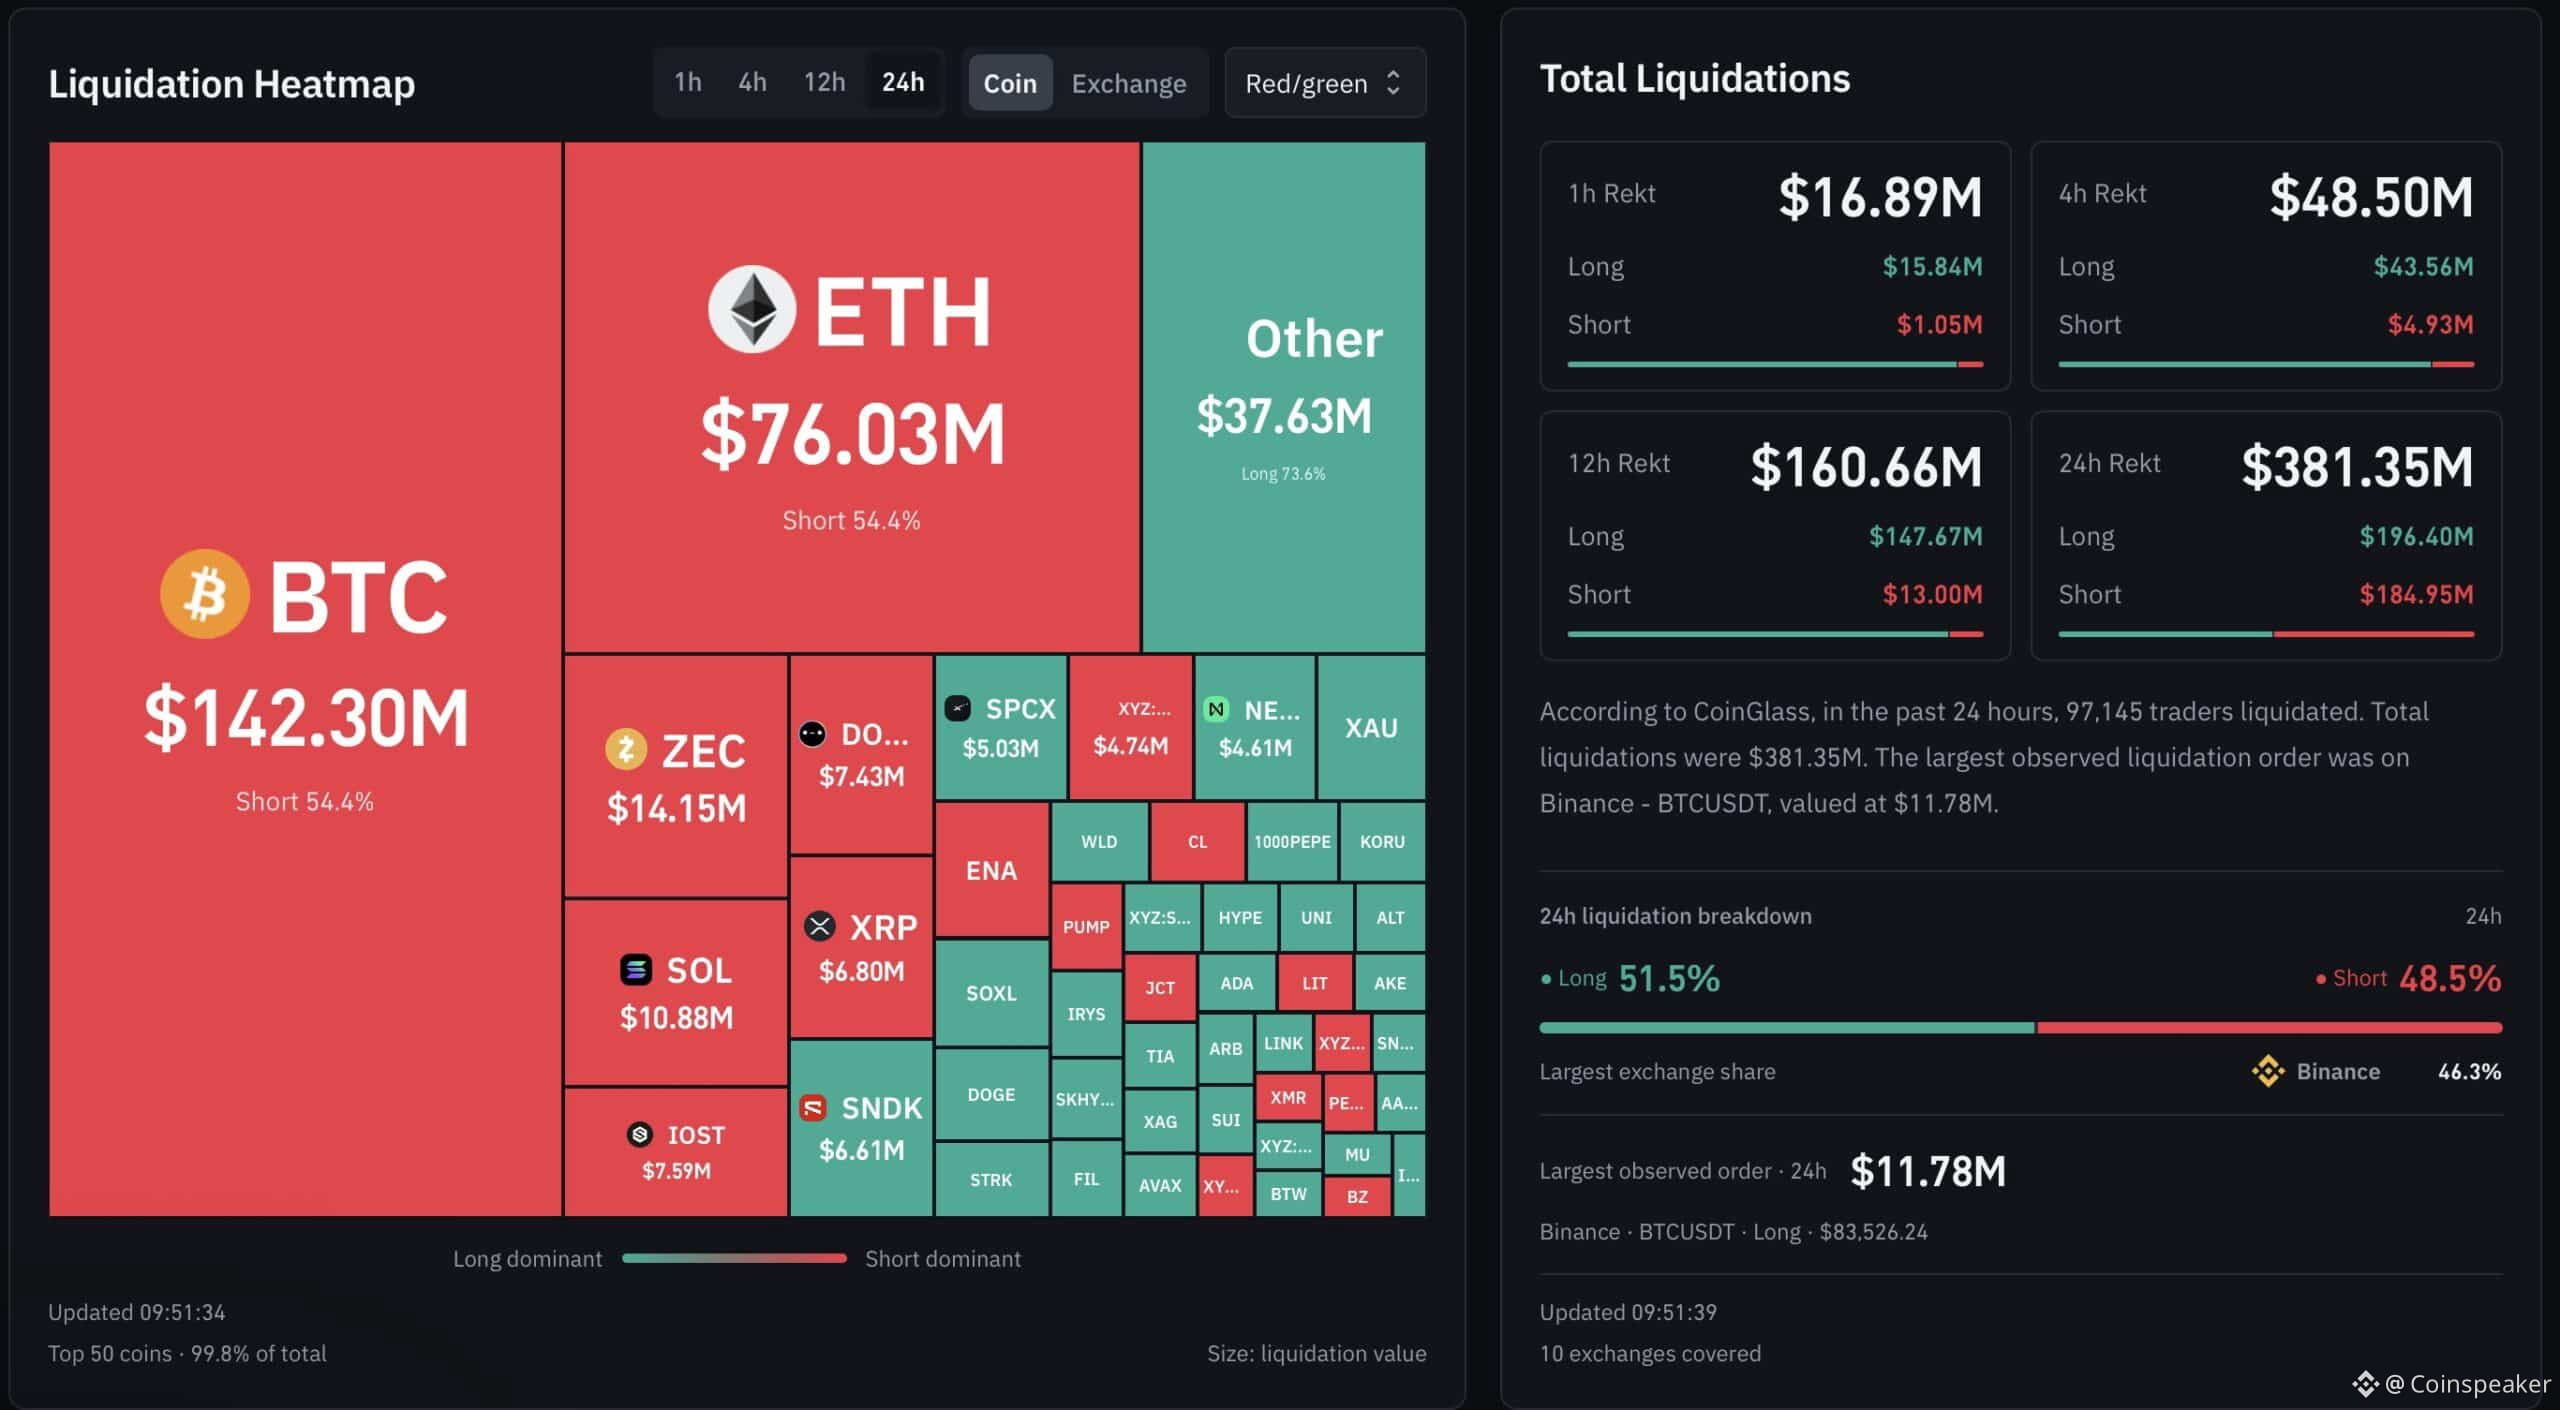
Статья
Bitcoin Slides From $84,900 to $82,200 As Oil Jumps on Iran Strike Plans: Is the US-Iran War Abou...In today’s Bitcoin news, the BTC price is down 2.1% on the day and Brent crude is up 2.7% to $111.73 a barrel. Bitcoin fell from nearly $85,000 to about $82,200 early on Thursday, October 22.
The New York Times reported that the U.S. and Israeli militaries have drawn up plans to resume strikes on Iran after the November 3 midterms, sending oil higher. The report hit just after midnight UTC. The selling started an hour later.
So how close are Washington and Tehran to fighting again, and how low can Bitcoin go?
If Bitcoin does this now and I don't tweet again. I committed seppuko. Just a heads up. pic.twitter.com/VIYPPajt7P
— VikingXBT (@VikingXBT) October 22, 2026
Bitcoin News: Why Did BTC Drop From $84,800 to $82,190 Today?
Because the Iran trade flipped. On Wednesday, BTC rallied to $84,898 while U.S. spot Bitcoin ETFs took in $524.8 million, Farside data shows. Then the strike report landed at about 00:35 UTC, and BTC lost about $800 in the 01:00 UTC hour alone.
Leverage did the rest. OKX’s public data shows Bitcoin futures open interest, the value of all open bets, fell from $3.47 billion at midnight to $3.27 billion by 07:00 UTC. That’s about $200 million of positions closed or wiped out on one exchange in seven hours.
Liquidation Heatmap Coinglass
DISCOVER: AI Predicts Bitcoin Shrugs Off $110 Oil as Last Year’s Sellers Quietly Disappear
Is the US-Iran Tension Escalating Again?
Yes, on paper. The Times, citing U.S. officials, said the plan is a “short but intensive” campaign against Iran’s nuclear sites, missiles, drones and energy infrastructure. Defense Secretary Pete Hegseth met Benjamin Netanyahu in Israel this week, and the two air forces have rehearsed over Iraq.
No Iran strikes are approved yet. Trump has vetoed a return to major combat several times this year, and the White House said it doesn’t comment on plans “that may or may not exist.” Earlier this month, Trump said the U.S. wouldn’t strike before the midterms, citing “productive discussions.”
Those talks look stuck. The June deal brokered by Pakistan and Qatar has stalled over shipping in the Strait of Hormuz, and Iran said on Wednesday it sees little reason to expect progress.
DISCOVER: Best Meme Coins to Buy in 2026
Bitcoin Price Analysis: Can $80,400 Hold As Oil Price Is Soaring
How do oil prices affect Bitcoin? The mechanism runs through rates: an oil price of $111 sustains high inflation, while the 10-year Treasury yield climbed to 5.15% today. When bonds offer that return, a coin yielding nothing must compete more strongly for investors.
$80,400 is the line to watch. BTC sits about $1,400 above its 50-day exponential moving average (EMA) at $80,874, with the $80,394 swing low just below.
BTCUSDT Chart 1D TradingView
The levels on the daily chart:
The first ceiling: $82,850, the old swing high BTC just fell back under.
The real ceiling: $84,100 to $84,900, Wednesday’s close and high.
The first floor: $80,394 to $80,874, the swing low and the 50-day EMA.
The deeper floor: $76,182, the 200-day EMA.
If tensions ease, Brent could fall below $110 and BTC could reclaim $84,900. If prices remain volatile, BTC may trade between $80,400 and $84,900 until the Fed meets on October 27–28. However, a strike order or attack on the Strait of Hormuz could push oil higher and send BTC below the 50-day EMA toward $76,182.
The strikes may never happen. But until November 3 passes, every Iran headline is Bitcoin news.
DISCOVER: Meme coin supercycle: Top performers this week
next
The post Bitcoin Slides From $84,900 to $82,200 as Oil Jumps on Iran Strike Plans: Is the US-Iran War About to Restart? appeared first on Coinspeaker.
Bitcoin Slides From $84,900 to $82,200 As Oil Jumps on Iran Strike Plans: Is the US-Iran War Abou...
In today’s Bitcoin news, the BTC price is down 2.1% on the day and Brent crude is up 2.7% to $111.73 a barrel. Bitcoin fell from nearly $85,000 to about $82,200 early on Thursday, October 22.
The New York Times reported that the U.S. and Israeli militaries have drawn up plans to resume strikes on Iran after the November 3 midterms, sending oil higher. The report hit just after midnight UTC. The selling started an hour later.
So how close are Washington and Tehran to fighting again, and how low can Bitcoin go?
If Bitcoin does this now and I don't tweet again. I committed seppuko. Just a heads up. pic.twitter.com/VIYPPajt7P
— VikingXBT (@VikingXBT) October 22, 2026
Bitcoin News: Why Did BTC Drop From $84,800 to $82,190 Today?
Because the Iran trade flipped. On Wednesday, BTC rallied to $84,898 while U.S. spot Bitcoin ETFs took in $524.8 million, Farside data shows. Then the strike report landed at about 00:35 UTC, and BTC lost about $800 in the 01:00 UTC hour alone.
Leverage did the rest. OKX’s public data shows Bitcoin futures open interest, the value of all open bets, fell from $3.47 billion at midnight to $3.27 billion by 07:00 UTC. That’s about $200 million of positions closed or wiped out on one exchange in seven hours.
Liquidation Heatmap Coinglass
DISCOVER: AI Predicts Bitcoin Shrugs Off $110 Oil as Last Year’s Sellers Quietly Disappear
Is the US-Iran Tension Escalating Again?
Yes, on paper. The Times, citing U.S. officials, said the plan is a “short but intensive” campaign against Iran’s nuclear sites, missiles, drones and energy infrastructure. Defense Secretary Pete Hegseth met Benjamin Netanyahu in Israel this week, and the two air forces have rehearsed over Iraq.
No Iran strikes are approved yet. Trump has vetoed a return to major combat several times this year, and the White House said it doesn’t comment on plans “that may or may not exist.” Earlier this month, Trump said the U.S. wouldn’t strike before the midterms, citing “productive discussions.”
Those talks look stuck. The June deal brokered by Pakistan and Qatar has stalled over shipping in the Strait of Hormuz, and Iran said on Wednesday it sees little reason to expect progress.
DISCOVER: Best Meme Coins to Buy in 2026
Bitcoin Price Analysis: Can $80,400 Hold As Oil Price Is Soaring
How do oil prices affect Bitcoin? The mechanism runs through rates: an oil price of $111 sustains high inflation, while the 10-year Treasury yield climbed to 5.15% today. When bonds offer that return, a coin yielding nothing must compete more strongly for investors.
$80,400 is the line to watch. BTC sits about $1,400 above its 50-day exponential moving average (EMA) at $80,874, with the $80,394 swing low just below.
BTCUSDT Chart 1D TradingView
The levels on the daily chart:
The first ceiling: $82,850, the old swing high BTC just fell back under.
The real ceiling: $84,100 to $84,900, Wednesday’s close and high.
The first floor: $80,394 to $80,874, the swing low and the 50-day EMA.
The deeper floor: $76,182, the 200-day EMA.
If tensions ease, Brent could fall below $110 and BTC could reclaim $84,900. If prices remain volatile, BTC may trade between $80,400 and $84,900 until the Fed meets on October 27–28. However, a strike order or attack on the Strait of Hormuz could push oil higher and send BTC below the 50-day EMA toward $76,182.
The strikes may never happen. But until November 3 passes, every Iran headline is Bitcoin news.
DISCOVER: Meme coin supercycle: Top performers this week
next
The post Bitcoin Slides From $84,900 to $82,200 as Oil Jumps on Iran Strike Plans: Is the US-Iran War About to Restart? appeared first on Coinspeaker.
650
·
--
Проверено
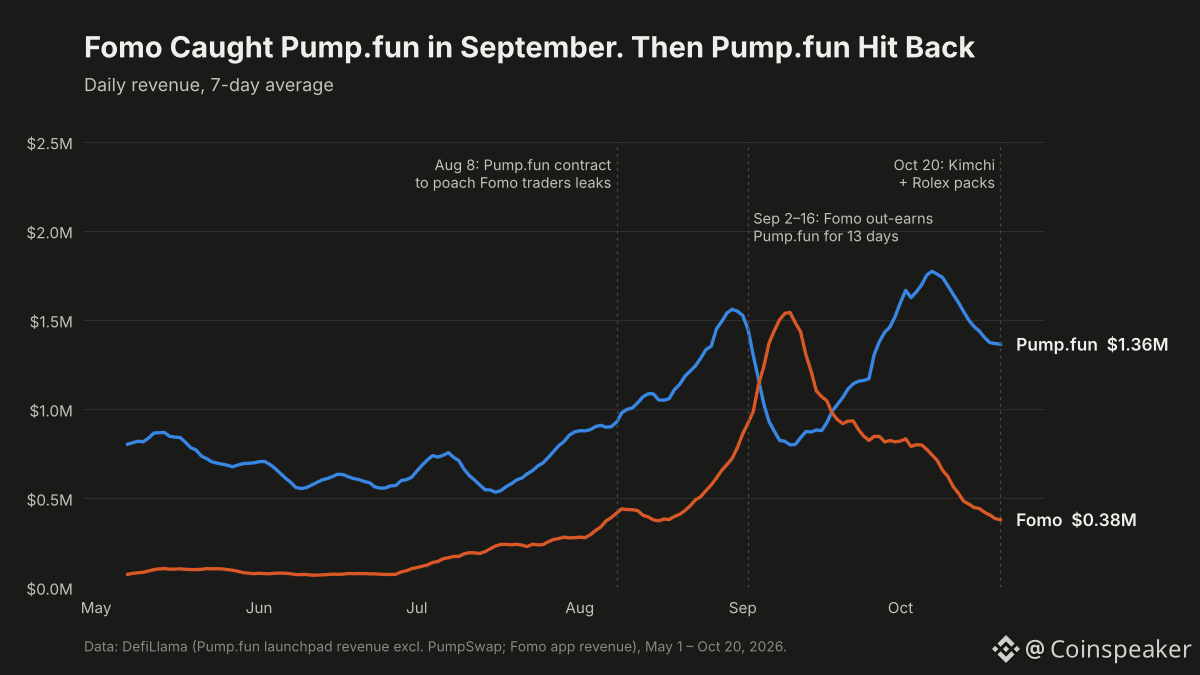
Статья
PUMP Vs FOMO: Can Signing $40M TRUMP Trader Kimchi Help Pump.fun Win the Launchpad War?Pump.fun signed Solana trader Kimchi as a creative partner on Tuesday, October 20, the same day the meme coin launchpad’s app started selling Rolex prize packs, as it tries to pull retail users from rival trading app Fomo. The pump crypto playbook used to be cheap tokens and fast launches. Now it’s a celebrity and a watch.
The PUMP price, the platform’s token, is up 9.16% in 24 hours to $0.004801, with $189.6 million traded. So is Pump.fun buying its way back to the top, or just buying headlines?
Kimchi is the first person to truly cross the chasm between crypto and pop culture; the first ever example of a trader becoming a celebrity.
He represents exactly where we’re heading: a massive social trading ecosystem that onboards retail and grows to 10x the size we were last… https://t.co/jJztM2hiNp
— alon (@a1lon9) October 20, 2026
DISCOVER: Best Meme Coins to Buy in 2026
Who Is Kimchi, and Why Did Pump.fun Sign Him?
In Kimchi crypto lore, the story is simple. Kimchi (@kimchi1x) is a pseudonymous meme coin trader who says he made about $40 million trading the official TRUMP token after its January 2025 launch. The claim made his name, and “a Kimchi” became crypto slang for $40 million. It has never been proven on-chain, and some traders have picked apart the luxury cars and watches that fill his feed.
That lifestyle is the point. Pump.fun co-founder Alon called him “the first ever example of a trader becoming a celebrity” and said the next wave of users “does not come from CT,” crypto Twitter, “it comes from the masses.” Kimchi will help set Pump.fun’s “creative direction,” he wrote.
The trenches reacted the way they always do. A KIMCHI meme coin hit about $35 million in market cap within an hour, and an account called Pump.fun Ecosystem posted that Kimchi “made $32,000,000 on Pumpfun 30 mins after joining.”
That number is paper value: on-chain analyst Ai Yi, reported by Odaily, says Kimchi held 75.32% of the coin’s supply, so most of that $32 million exists only until he tries to sell into a thin pool.
The same analyst spotted him withdrawing 1.35 billion PUMP, worth about $6.43 million, over three hours.
Pump Crypto War: Why Is Pump.fun Fighting So Hard for Users?
Because Fomo nearly took its crown. DefiLlama data shows the Fomo app, a Benchmark-backed social trading platform, earned more than Pump.fun’s launchpad on 13 days between September 2 and 16. It took about 60% of the two apps’ combined revenue in the first two weeks of September.
PUMP vs FOMO
Pump.fun hit back hard. In August, a leaked contract showed it offering Fomo traders a $20,000 signing bonus and $30,000 a month to move their trading to Pump.fun, with one condition: delete their Fomo accounts. A day earlier, it had rolled out a social feed and alerts much like Fomo’s.
It’s working, for now. Over the past 30 days, DefiLlama puts Pump.fun’s launchpad revenue at $45.4 million against Fomo’s $19 million. On Tuesday alone, the launchpad earned $1.46 million and Fomo $365,000. Fomo’s share is back to about one-fifth.
Pump.fun now sells Collector Crypt packs, NFTs backed by vaulted collectibles and redeemable for USDC. Packs run $25 to $5,000, some holding Rolexes worth $20,000. Roughly $2 million sold within hours: 4,013 packs yielded 18 watches, several won by its own influencers.
My entire timeline is flooded with low effort shills from pretty much every CT KOL promoting Pumpfun packs
Hoping to see a cycle where all of the OGs come back, teaching the rookies how it’s done and hopefully setting the tone for the entire cycle
— Aeon (@Cryptoaeon) October 20, 2026
DISCOVER: Democrats Are Favorites to Flip the House, and Crypto’s CLARITY Act Is Watching
PUMP Price Analysis: Can the Kimchi Bounce Hold?
PUMP jumped from $0.0044 to $0.00496 in a day, but it is still 29% below its October 4 high of $0.006806 and 46% under its September 2025 record of $0.008819.
PUMPUSDT Chart 1D
The levels on the daily chart:
The line to clear: $0.004867, a swing high just above today’s price.
The next target: $0.005447, then the October high at $0.006806.
The first floor: $0.004659, the 50-day exponential moving average (EMA), which PUMP just reclaimed.
The deeper floor: $0.00375, the last swing low, with the 200-day EMA at $0.003396 under it.
There is a steady buyer under the price. Pump.fun spends about half its daily revenue buying back and burning PUMP, roughly $900,000 a day this week, and its token page shows $490.7 million bought back so far, 17.3% of the supply.
Pump.fun has bought itself a celebrity, a prize machine and a lead. Whether the pump crypto crowd stays once the watches run out is the part no buyback can pay for.
DISCOVER: Meme coin supercycle: Top performers this week
next
The post PUMP vs FOMO: Can Signing $40M TRUMP Trader Kimchi Help Pump.fun Win the Launchpad War? appeared first on Coinspeaker.
PUMP Vs FOMO: Can Signing $40M TRUMP Trader Kimchi Help Pump.fun Win the Launchpad War?
Pump.fun signed Solana trader Kimchi as a creative partner on Tuesday, October 20, the same day the meme coin launchpad’s app started selling Rolex prize packs, as it tries to pull retail users from rival trading app Fomo. The pump crypto playbook used to be cheap tokens and fast launches. Now it’s a celebrity and a watch.
The PUMP price, the platform’s token, is up 9.16% in 24 hours to $0.004801, with $189.6 million traded. So is Pump.fun buying its way back to the top, or just buying headlines?
Kimchi is the first person to truly cross the chasm between crypto and pop culture; the first ever example of a trader becoming a celebrity.
He represents exactly where we’re heading: a massive social trading ecosystem that onboards retail and grows to 10x the size we were last… https://t.co/jJztM2hiNp
— alon (@a1lon9) October 20, 2026
DISCOVER: Best Meme Coins to Buy in 2026
Who Is Kimchi, and Why Did Pump.fun Sign Him?
In Kimchi crypto lore, the story is simple. Kimchi (@kimchi1x) is a pseudonymous meme coin trader who says he made about $40 million trading the official TRUMP token after its January 2025 launch. The claim made his name, and “a Kimchi” became crypto slang for $40 million. It has never been proven on-chain, and some traders have picked apart the luxury cars and watches that fill his feed.
That lifestyle is the point. Pump.fun co-founder Alon called him “the first ever example of a trader becoming a celebrity” and said the next wave of users “does not come from CT,” crypto Twitter, “it comes from the masses.” Kimchi will help set Pump.fun’s “creative direction,” he wrote.
The trenches reacted the way they always do. A KIMCHI meme coin hit about $35 million in market cap within an hour, and an account called Pump.fun Ecosystem posted that Kimchi “made $32,000,000 on Pumpfun 30 mins after joining.”
That number is paper value: on-chain analyst Ai Yi, reported by Odaily, says Kimchi held 75.32% of the coin’s supply, so most of that $32 million exists only until he tries to sell into a thin pool.
The same analyst spotted him withdrawing 1.35 billion PUMP, worth about $6.43 million, over three hours.
Pump Crypto War: Why Is Pump.fun Fighting So Hard for Users?
Because Fomo nearly took its crown. DefiLlama data shows the Fomo app, a Benchmark-backed social trading platform, earned more than Pump.fun’s launchpad on 13 days between September 2 and 16. It took about 60% of the two apps’ combined revenue in the first two weeks of September.
PUMP vs FOMO
Pump.fun hit back hard. In August, a leaked contract showed it offering Fomo traders a $20,000 signing bonus and $30,000 a month to move their trading to Pump.fun, with one condition: delete their Fomo accounts. A day earlier, it had rolled out a social feed and alerts much like Fomo’s.
It’s working, for now. Over the past 30 days, DefiLlama puts Pump.fun’s launchpad revenue at $45.4 million against Fomo’s $19 million. On Tuesday alone, the launchpad earned $1.46 million and Fomo $365,000. Fomo’s share is back to about one-fifth.
Pump.fun now sells Collector Crypt packs, NFTs backed by vaulted collectibles and redeemable for USDC. Packs run $25 to $5,000, some holding Rolexes worth $20,000. Roughly $2 million sold within hours: 4,013 packs yielded 18 watches, several won by its own influencers.
My entire timeline is flooded with low effort shills from pretty much every CT KOL promoting Pumpfun packs
Hoping to see a cycle where all of the OGs come back, teaching the rookies how it’s done and hopefully setting the tone for the entire cycle
— Aeon (@Cryptoaeon) October 20, 2026
DISCOVER: Democrats Are Favorites to Flip the House, and Crypto’s CLARITY Act Is Watching
PUMP Price Analysis: Can the Kimchi Bounce Hold?
PUMP jumped from $0.0044 to $0.00496 in a day, but it is still 29% below its October 4 high of $0.006806 and 46% under its September 2025 record of $0.008819.
PUMPUSDT Chart 1D
The levels on the daily chart:
The line to clear: $0.004867, a swing high just above today’s price.
The next target: $0.005447, then the October high at $0.006806.
The first floor: $0.004659, the 50-day exponential moving average (EMA), which PUMP just reclaimed.
The deeper floor: $0.00375, the last swing low, with the 200-day EMA at $0.003396 under it.
There is a steady buyer under the price. Pump.fun spends about half its daily revenue buying back and burning PUMP, roughly $900,000 a day this week, and its token page shows $490.7 million bought back so far, 17.3% of the supply.
Pump.fun has bought itself a celebrity, a prize machine and a lead. Whether the pump crypto crowd stays once the watches run out is the part no buyback can pay for.
DISCOVER: Meme coin supercycle: Top performers this week
next
The post PUMP vs FOMO: Can Signing $40M TRUMP Trader Kimchi Help Pump.fun Win the Launchpad War? appeared first on Coinspeaker.
1
964
·
--
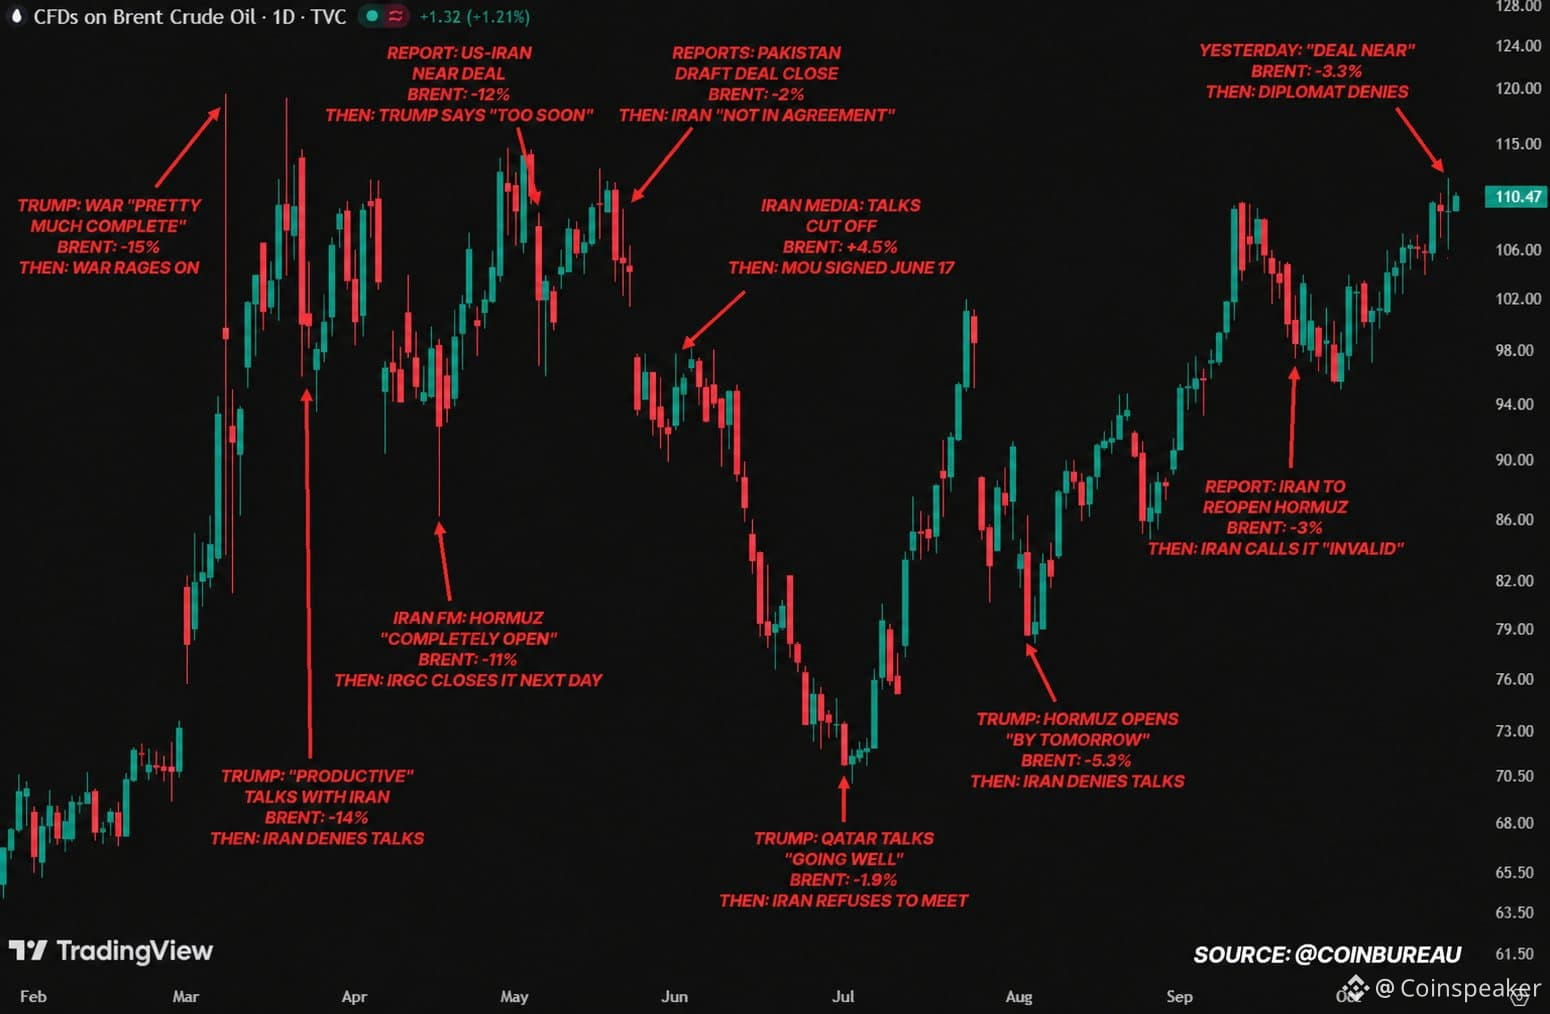
Статья
Ten Iran Deal Headlines Have Whipsawed Oil Since March and Bitcoin Rallied on Eight of ThemBitcoin rose 2.19% to $83,105 on October 21, after an unconfirmed report that the U.S. and Iran were close to a deal knocked Brent crude down as much as 3.3% on Tuesday, before a diplomat in the talks denied it. That makes ten. Ten Iran headlines since March that moved oil hard and then fell apart, and the Bitcoin news cycle has danced to almost every one.
The latest swing was big even by this year’s standards. Saxo’s morning note has Brent hitting a five-month high above $111 a barrel on Tuesday, then reversing to settle at $108.79. It was back near $110.40 this morning.
So is Bitcoin now just an oil trade with a different ticker?
BREAKING: US oil prices rebound on reports stating that other reports claiming the US and Iran have reached a deal are false.
We now have reports on reports that are moving hundreds of billions of dollars in market cap. pic.twitter.com/QDr3q2wkTQ
— The Kobeissi Letter (@KobeissiLetter) October 20, 2026
DISCOVER: Meme coin supercycle: Top performers this week
How Often Have Iran Headlines Moved Oil This Year?
Ten times, with Brent dropping as much as 15% in minutes. Each report was later denied, disputed or never delivered.
Brent Crude Oil CoinBureau
The pattern started early. On March 9, President Trump told CBS the war was “pretty much complete.” Brent fall from a $119.50 session high to below $90 in Asian trading. The war ran for months more. On April 17, Iran’s foreign minister Abbas Araghchi wrote that the Strait of Hormuz was “completely open.” The Revolutionary Guards contradicted him within hours and shut it fully the next day.
It cuts both ways. On June 1, Iranian media said talks were off and Brent jumped 4.5%. Sixteen days later, the two sides signed a memorandum of understanding.
DISCOVER: AI Predicts Bitcoin Shrugs Off $110 Oil as Last Year’s Sellers Quietly Disappear
Bitcoin News: Does BTC Trade Iran Headlines Like Oil?
Brent Crude vs Bitcoin
Yes, but in reverse. On the nine days an Iran deal headline promised peace or an open Hormuz, Bitcoin closed higher eight times, by 1.74% on average. On the one day a headline pointed to escalation, it fell 3.08%.
And when the denial landed, some of it came back. Bitcoin gave up 1.79% the day after Araghchi’s Hormuz post and 1.77% the day after the May 6 report.
The link runs through the Federal Reserve. High oil prices keep inflation hot, and hot inflation keeps the Fed hiking. September’s consumer prices rose 3.7% from a year earlier, with gasoline alone up 9.1% in the month, after the Fed raised rates on September 16. A peace headline reads as cheaper oil, fewer hikes and more room for risk. A denial undoes all three.
Is anyone planting these reports on purpose? The tape can’t prove it. What it shows is that unconfirmed, single-source headlines move two markets at once, and the traders who react first take the other side of everyone who reacts second.
Ten headlines in, the lesson for anyone trading Bitcoin news is simple. Wait for both governments to say it before trading it.
EXPLORE: Claude AI Predicts Bitcoin After Buyers Defended $80,400 Twice in a Week
next
The post Ten Iran Deal Headlines Have Whipsawed Oil Since March and Bitcoin Rallied on Eight of Them appeared first on Coinspeaker.
Ten Iran Deal Headlines Have Whipsawed Oil Since March and Bitcoin Rallied on Eight of Them
Bitcoin rose 2.19% to $83,105 on October 21, after an unconfirmed report that the U.S. and Iran were close to a deal knocked Brent crude down as much as 3.3% on Tuesday, before a diplomat in the talks denied it. That makes ten. Ten Iran headlines since March that moved oil hard and then fell apart, and the Bitcoin news cycle has danced to almost every one.
The latest swing was big even by this year’s standards. Saxo’s morning note has Brent hitting a five-month high above $111 a barrel on Tuesday, then reversing to settle at $108.79. It was back near $110.40 this morning.
So is Bitcoin now just an oil trade with a different ticker?
BREAKING: US oil prices rebound on reports stating that other reports claiming the US and Iran have reached a deal are false.
We now have reports on reports that are moving hundreds of billions of dollars in market cap. pic.twitter.com/QDr3q2wkTQ
— The Kobeissi Letter (@KobeissiLetter) October 20, 2026
DISCOVER: Meme coin supercycle: Top performers this week
How Often Have Iran Headlines Moved Oil This Year?
Ten times, with Brent dropping as much as 15% in minutes. Each report was later denied, disputed or never delivered.
Brent Crude Oil CoinBureau
The pattern started early. On March 9, President Trump told CBS the war was “pretty much complete.” Brent fall from a $119.50 session high to below $90 in Asian trading. The war ran for months more. On April 17, Iran’s foreign minister Abbas Araghchi wrote that the Strait of Hormuz was “completely open.” The Revolutionary Guards contradicted him within hours and shut it fully the next day.
It cuts both ways. On June 1, Iranian media said talks were off and Brent jumped 4.5%. Sixteen days later, the two sides signed a memorandum of understanding.
DISCOVER: AI Predicts Bitcoin Shrugs Off $110 Oil as Last Year’s Sellers Quietly Disappear
Bitcoin News: Does BTC Trade Iran Headlines Like Oil?
Brent Crude vs Bitcoin
Yes, but in reverse. On the nine days an Iran deal headline promised peace or an open Hormuz, Bitcoin closed higher eight times, by 1.74% on average. On the one day a headline pointed to escalation, it fell 3.08%.
And when the denial landed, some of it came back. Bitcoin gave up 1.79% the day after Araghchi’s Hormuz post and 1.77% the day after the May 6 report.
The link runs through the Federal Reserve. High oil prices keep inflation hot, and hot inflation keeps the Fed hiking. September’s consumer prices rose 3.7% from a year earlier, with gasoline alone up 9.1% in the month, after the Fed raised rates on September 16. A peace headline reads as cheaper oil, fewer hikes and more room for risk. A denial undoes all three.
Is anyone planting these reports on purpose? The tape can’t prove it. What it shows is that unconfirmed, single-source headlines move two markets at once, and the traders who react first take the other side of everyone who reacts second.
Ten headlines in, the lesson for anyone trading Bitcoin news is simple. Wait for both governments to say it before trading it.
EXPLORE: Claude AI Predicts Bitcoin After Buyers Defended $80,400 Twice in a Week
next
The post Ten Iran Deal Headlines Have Whipsawed Oil Since March and Bitcoin Rallied on Eight of Them appeared first on Coinspeaker.
4
1k
·
--
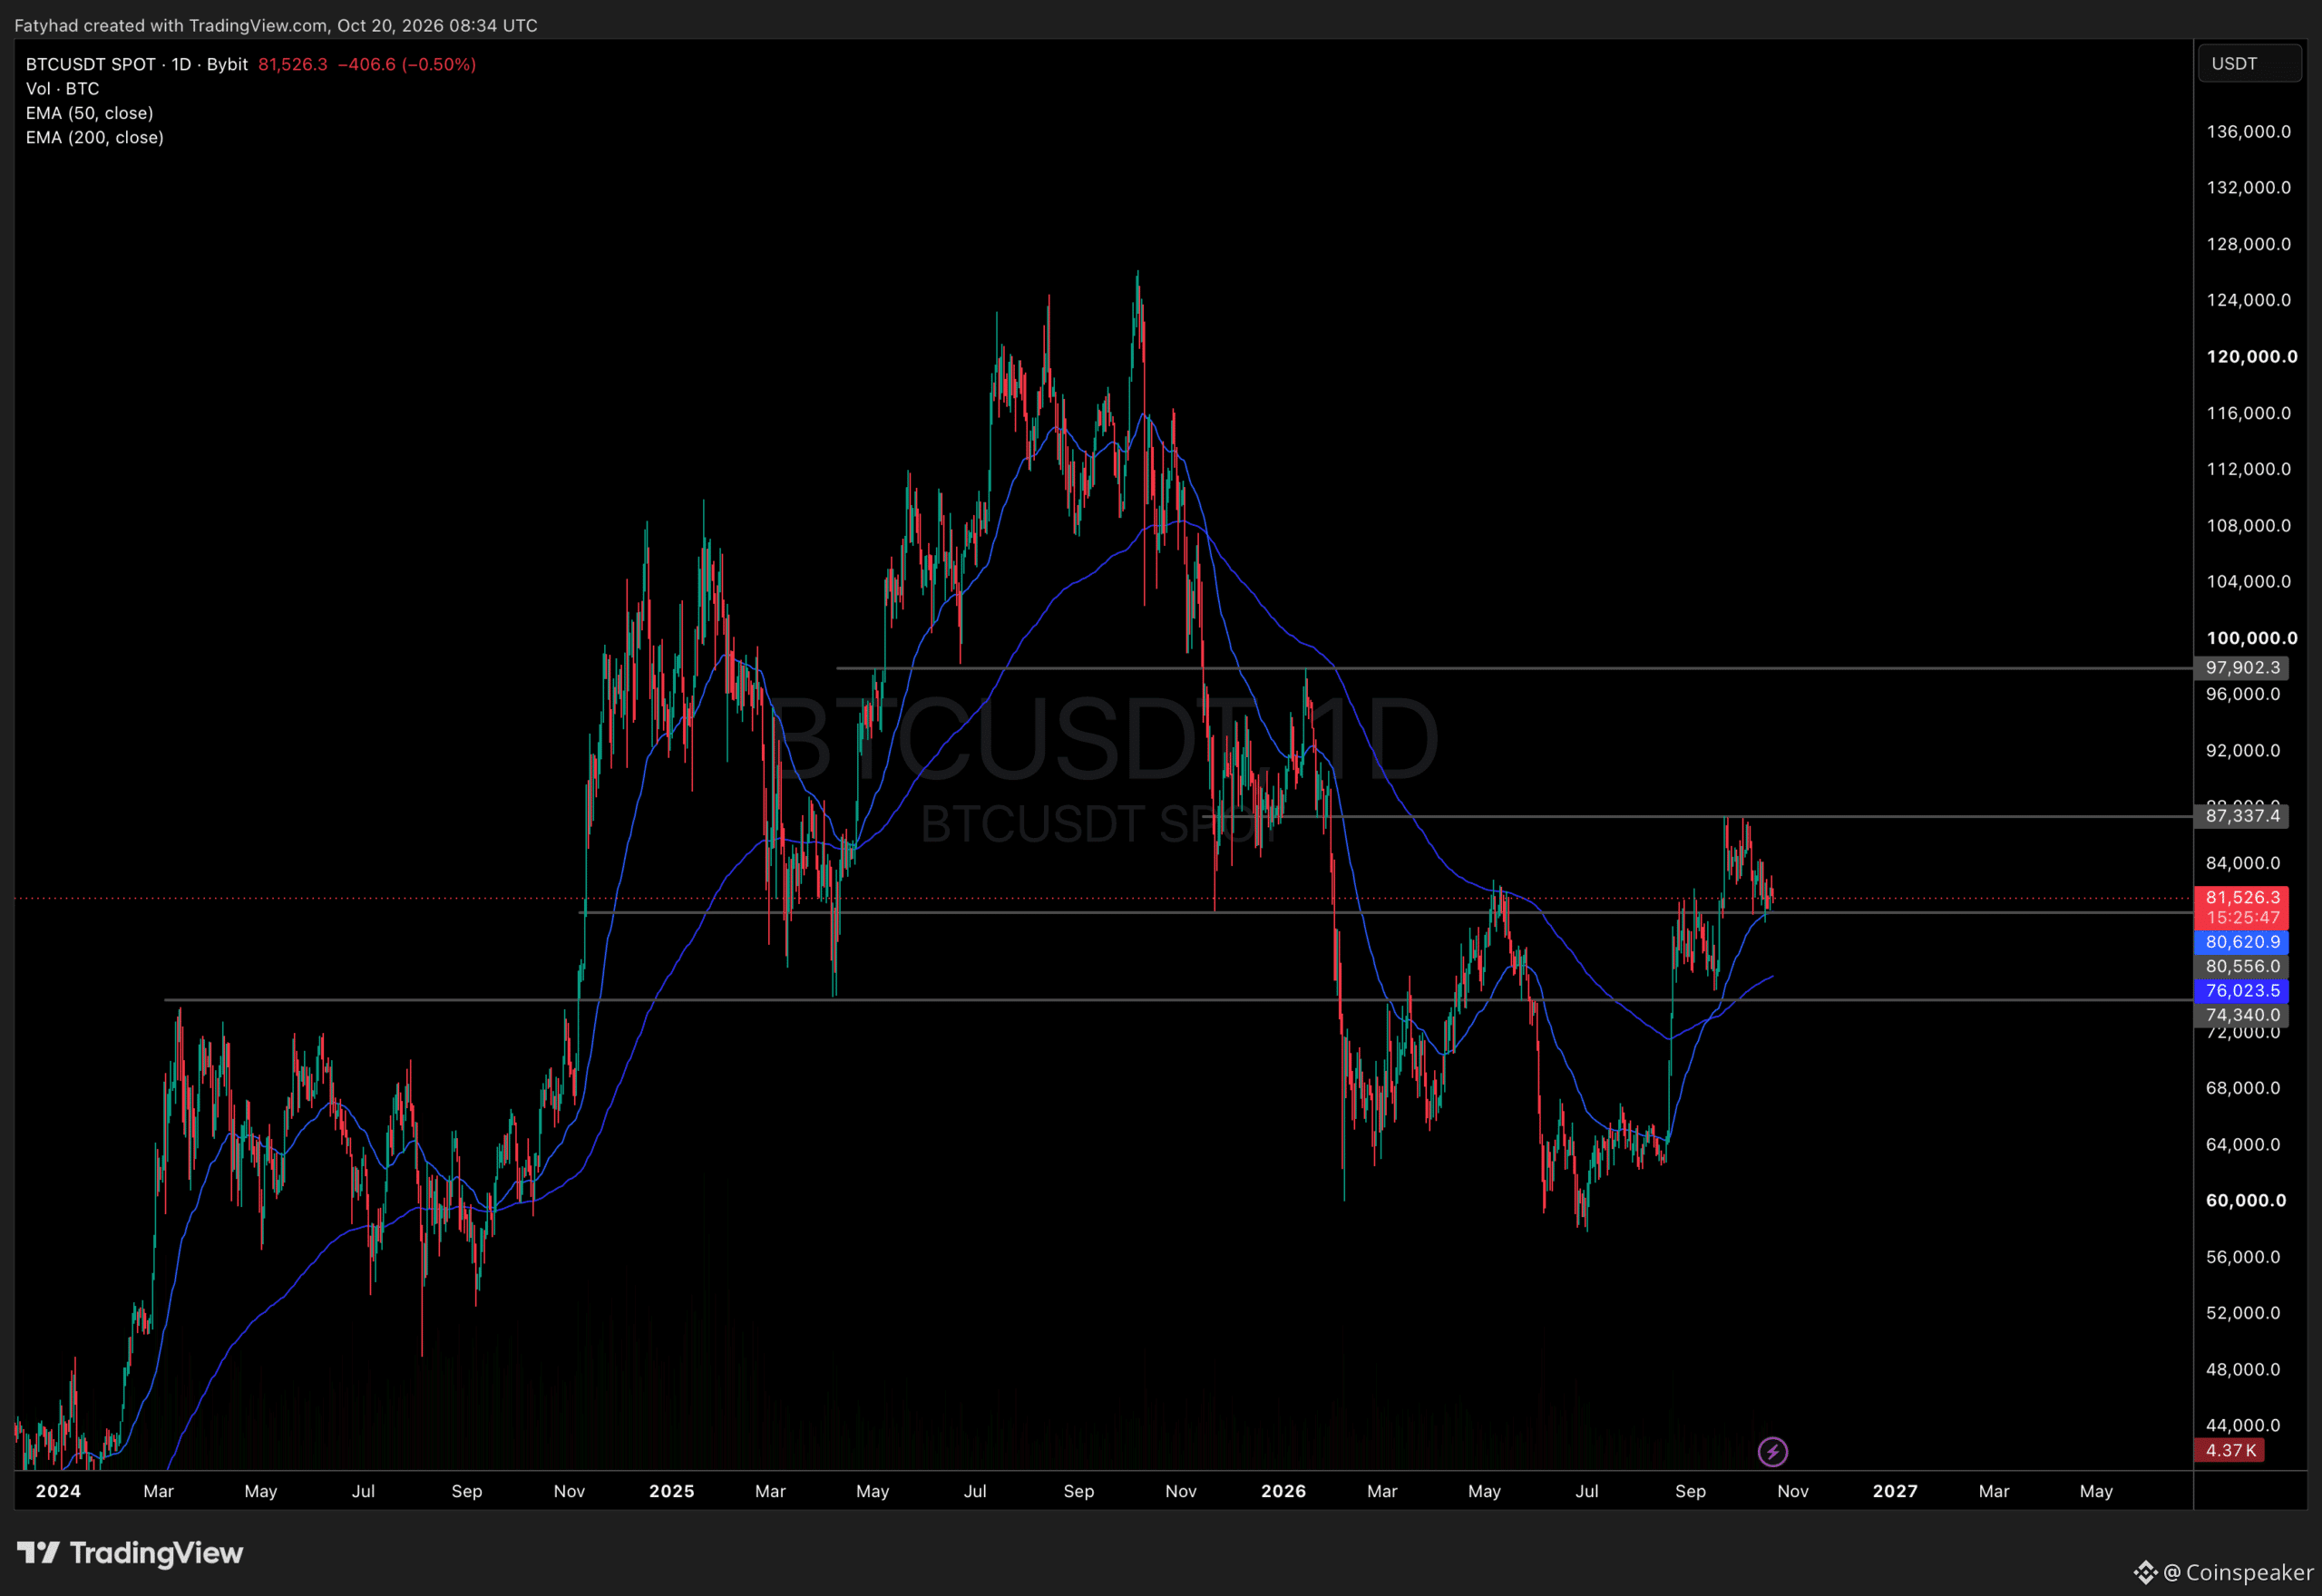
Статья
Bitcoin Price Forecast: MSCI Decision Could Impact BTC USD PriceThe Bitcoin price is stuck in a range while its biggest corporate buyer spends its cash elsewhere. BTC trades at $81,394, down 1.72% over 24 hours on $24.89 billion in volume, still above $80,000 after a wick to $79,800 last Thursday. Sentiment hasn’t cracked either, with the Fear & Greed Index at 55. The question for this Bitcoin price forecast: does MSCI’s new index rule hit Bitcoin itself, or mostly the companies that hold it?
MSCI finalized its new rules on October 15, making “non-operating companies” ineligible for its Global Investable Market Indexes. A company that fails a core test for operating assets gets screened on five financial ratios, and tripping four of them flags the stock. The final list lands on November 11, and removals take effect after the November 30 close. Two Bitcoin treasury companies, Strategy and Metaplanet, were flagged in MSCI’s May simulation, along with uranium holder Yellow Cake.
The stock market took it harder than crypto did. Strategy MSTR shares closed at $136.83 on Friday, down 9.56% in one session.
🚨 MSCI is killing entire countries stock markets.
Turkey's stock market has crashed 23% since MSCI issued its first warning in June, saying it could review Turkey's market status.
Indonesia's stock market also crashed 18% in just 3 days after MSCI warned it could cut the… pic.twitter.com/SHtBvkI9SI
— Bull Theory (@BullTheoryio) October 19, 2026
Join Coinspeaker’s $1,000 Prize Drop on Bybit Where Did Strategy’s Money Go Last Week?
Strategy has repurchased $193M of $STRC and acquired 267 $BTC. As of 10/18/26, we hold 848,517 BTC and $5.3B of USD Assets. We have also increased the size of our Digital Credit Securities Repurchase Program from $2.0B to $3.0B. $MSTRhttps://t.co/4o0bQBaTb0
— Strategy (@Strategy) October 19, 2026
October 19 filing with the SEC shows it bought 267 BTC for $22.1 million between October 12 and October 18, at an average of $82,900 per coin. In the same week, it repurchased $193.1 million of STRC, its variable-rate preferred, and raised that buyback program from $2.0 billion to $3.0 billion.
In other words, the company spent close to nine times more propping up its own paper than buying Bitcoin. The coins were paid for with $22.0 million from MSTR share sales and $0.1 million of cash. Holdings now stand at 848,517 BTC, bought at an average of $75,446.
That share-sale machine is exactly what the index rule threatens. JPMorgan analysts led by Nikolaos Panigirtzoglou estimated last November that an MSCI exclusion could pull $2.8 billion out of Strategy stock, and $8.8 billion if other index providers follow. Those would be equity outflows. Strategy doesn’t have to sell a single coin to meet them, but a cheaper MSTR means every new share sale buys less Bitcoin.
Market Intelligence: Crypto Analyst Predicts Best Low-Cap Crypto
Bitcoin Price Forecast: Can BTC Reclaim $84,000?
BTCUSDT Price 1D TradingView
Not yet. BTC sits about 3% under $84,000, a ceiling it tagged four days in a row from October 11 to October 14 without a single close above it. The 50-day exponential moving average (EMA), a moving average that weights recent prices more heavily, is at $80,620. The 200-day EMA sits at $76,025. Price is hugging the first and well clear of the second.
The first wall: $82,300 and $82,850. Both are recent swing highs, and the October 19 push to $83,158 couldn’t hold above them.
The real test: $84,352, last week’s top. Above it, the September 21 high at $87,396.
The floor to defend: $80,394, then the $79,800 low from October 15.
In the bull case, a daily close above $82,850 puts $84,352 back in play, and a break there opens the way to $87,396. In the base case, BTC chops between $80,394 and $82,850 until MSCI publishes its list on November 11. In the bear case, a daily close below $79,800 drags price toward the 200-day EMA.
MSCI-related equity outflows could weaken the financing channel used by some Bitcoin-treasury firms, but the connection to spot BTC demand remains uncertain. For a wider demand frame, this Bitcoin price outlook on exchange-traded fund (ETF) inflows examines how fund flows may interact with support and resistance. A separate macro-resilience analysis adds context on broader Bitcoin price forecast catalysts. Neither replaces the November constituent list.
DISCOVER: Meme coin supercycle: Top performers this week
Bitcoin Hyper Targets Early Mover Upside as Bitcoin Tests Key Levels
If BTC loses $80,000, near-term traders may face renewed downside pressure; if it holds, the market still has to clear resistance before the chart confirms a stronger recovery. That leaves an awkward middle ground: MSCI’s rule change is concrete, but its direct effect on Bitcoin demand is not. For investors looking beyond BTC itself, early-stage infrastructure carries a different risk profile.
Bitcoin Hyper ($HYPER) is presented as a Bitcoin Layer 2 with Solana Virtual Machine (SVM) integration, aiming to bring smart-contract execution to Bitcoin. The project describes its system as the first Bitcoin Layer 2 with SVM integration and claims faster performance than Solana itself.
The listed token price is $0.0136875, and the project reports $33,183,126.77 raised.
Its stated features include low-latency Layer 2 processing, a decentralized canonical bridge for BTC transfers, and low-cost transactions.
Those curious can research LiquidChain directly before drawing conclusions.
Layer 3 Is Already Here, Smart Money Knows It – Do You? next
The post Bitcoin Price Forecast: MSCI Decision Could Impact BTC USD Price appeared first on Coinspeaker.
Bitcoin Price Forecast: MSCI Decision Could Impact BTC USD Price
The Bitcoin price is stuck in a range while its biggest corporate buyer spends its cash elsewhere. BTC trades at $81,394, down 1.72% over 24 hours on $24.89 billion in volume, still above $80,000 after a wick to $79,800 last Thursday. Sentiment hasn’t cracked either, with the Fear & Greed Index at 55. The question for this Bitcoin price forecast: does MSCI’s new index rule hit Bitcoin itself, or mostly the companies that hold it?
MSCI finalized its new rules on October 15, making “non-operating companies” ineligible for its Global Investable Market Indexes. A company that fails a core test for operating assets gets screened on five financial ratios, and tripping four of them flags the stock. The final list lands on November 11, and removals take effect after the November 30 close. Two Bitcoin treasury companies, Strategy and Metaplanet, were flagged in MSCI’s May simulation, along with uranium holder Yellow Cake.
The stock market took it harder than crypto did. Strategy MSTR shares closed at $136.83 on Friday, down 9.56% in one session.
🚨 MSCI is killing entire countries stock markets.
Turkey's stock market has crashed 23% since MSCI issued its first warning in June, saying it could review Turkey's market status.
Indonesia's stock market also crashed 18% in just 3 days after MSCI warned it could cut the… pic.twitter.com/SHtBvkI9SI
— Bull Theory (@BullTheoryio) October 19, 2026
Join Coinspeaker’s $1,000 Prize Drop on Bybit Where Did Strategy’s Money Go Last Week?
Strategy has repurchased $193M of $STRC and acquired 267 $BTC. As of 10/18/26, we hold 848,517 BTC and $5.3B of USD Assets. We have also increased the size of our Digital Credit Securities Repurchase Program from $2.0B to $3.0B. $MSTRhttps://t.co/4o0bQBaTb0
— Strategy (@Strategy) October 19, 2026
October 19 filing with the SEC shows it bought 267 BTC for $22.1 million between October 12 and October 18, at an average of $82,900 per coin. In the same week, it repurchased $193.1 million of STRC, its variable-rate preferred, and raised that buyback program from $2.0 billion to $3.0 billion.
In other words, the company spent close to nine times more propping up its own paper than buying Bitcoin. The coins were paid for with $22.0 million from MSTR share sales and $0.1 million of cash. Holdings now stand at 848,517 BTC, bought at an average of $75,446.
That share-sale machine is exactly what the index rule threatens. JPMorgan analysts led by Nikolaos Panigirtzoglou estimated last November that an MSCI exclusion could pull $2.8 billion out of Strategy stock, and $8.8 billion if other index providers follow. Those would be equity outflows. Strategy doesn’t have to sell a single coin to meet them, but a cheaper MSTR means every new share sale buys less Bitcoin.
Market Intelligence: Crypto Analyst Predicts Best Low-Cap Crypto
Bitcoin Price Forecast: Can BTC Reclaim $84,000?
BTCUSDT Price 1D TradingView
Not yet. BTC sits about 3% under $84,000, a ceiling it tagged four days in a row from October 11 to October 14 without a single close above it. The 50-day exponential moving average (EMA), a moving average that weights recent prices more heavily, is at $80,620. The 200-day EMA sits at $76,025. Price is hugging the first and well clear of the second.
The first wall: $82,300 and $82,850. Both are recent swing highs, and the October 19 push to $83,158 couldn’t hold above them.
The real test: $84,352, last week’s top. Above it, the September 21 high at $87,396.
The floor to defend: $80,394, then the $79,800 low from October 15.
In the bull case, a daily close above $82,850 puts $84,352 back in play, and a break there opens the way to $87,396. In the base case, BTC chops between $80,394 and $82,850 until MSCI publishes its list on November 11. In the bear case, a daily close below $79,800 drags price toward the 200-day EMA.
MSCI-related equity outflows could weaken the financing channel used by some Bitcoin-treasury firms, but the connection to spot BTC demand remains uncertain. For a wider demand frame, this Bitcoin price outlook on exchange-traded fund (ETF) inflows examines how fund flows may interact with support and resistance. A separate macro-resilience analysis adds context on broader Bitcoin price forecast catalysts. Neither replaces the November constituent list.
DISCOVER: Meme coin supercycle: Top performers this week
Bitcoin Hyper Targets Early Mover Upside as Bitcoin Tests Key Levels
If BTC loses $80,000, near-term traders may face renewed downside pressure; if it holds, the market still has to clear resistance before the chart confirms a stronger recovery. That leaves an awkward middle ground: MSCI’s rule change is concrete, but its direct effect on Bitcoin demand is not. For investors looking beyond BTC itself, early-stage infrastructure carries a different risk profile.
Bitcoin Hyper ($HYPER) is presented as a Bitcoin Layer 2 with Solana Virtual Machine (SVM) integration, aiming to bring smart-contract execution to Bitcoin. The project describes its system as the first Bitcoin Layer 2 with SVM integration and claims faster performance than Solana itself.
The listed token price is $0.0136875, and the project reports $33,183,126.77 raised.
Its stated features include low-latency Layer 2 processing, a decentralized canonical bridge for BTC transfers, and low-cost transactions.
Those curious can research LiquidChain directly before drawing conclusions.
Layer 3 Is Already Here, Smart Money Knows It – Do You? next
The post Bitcoin Price Forecast: MSCI Decision Could Impact BTC USD Price appeared first on Coinspeaker.
332
·
--
Проверено
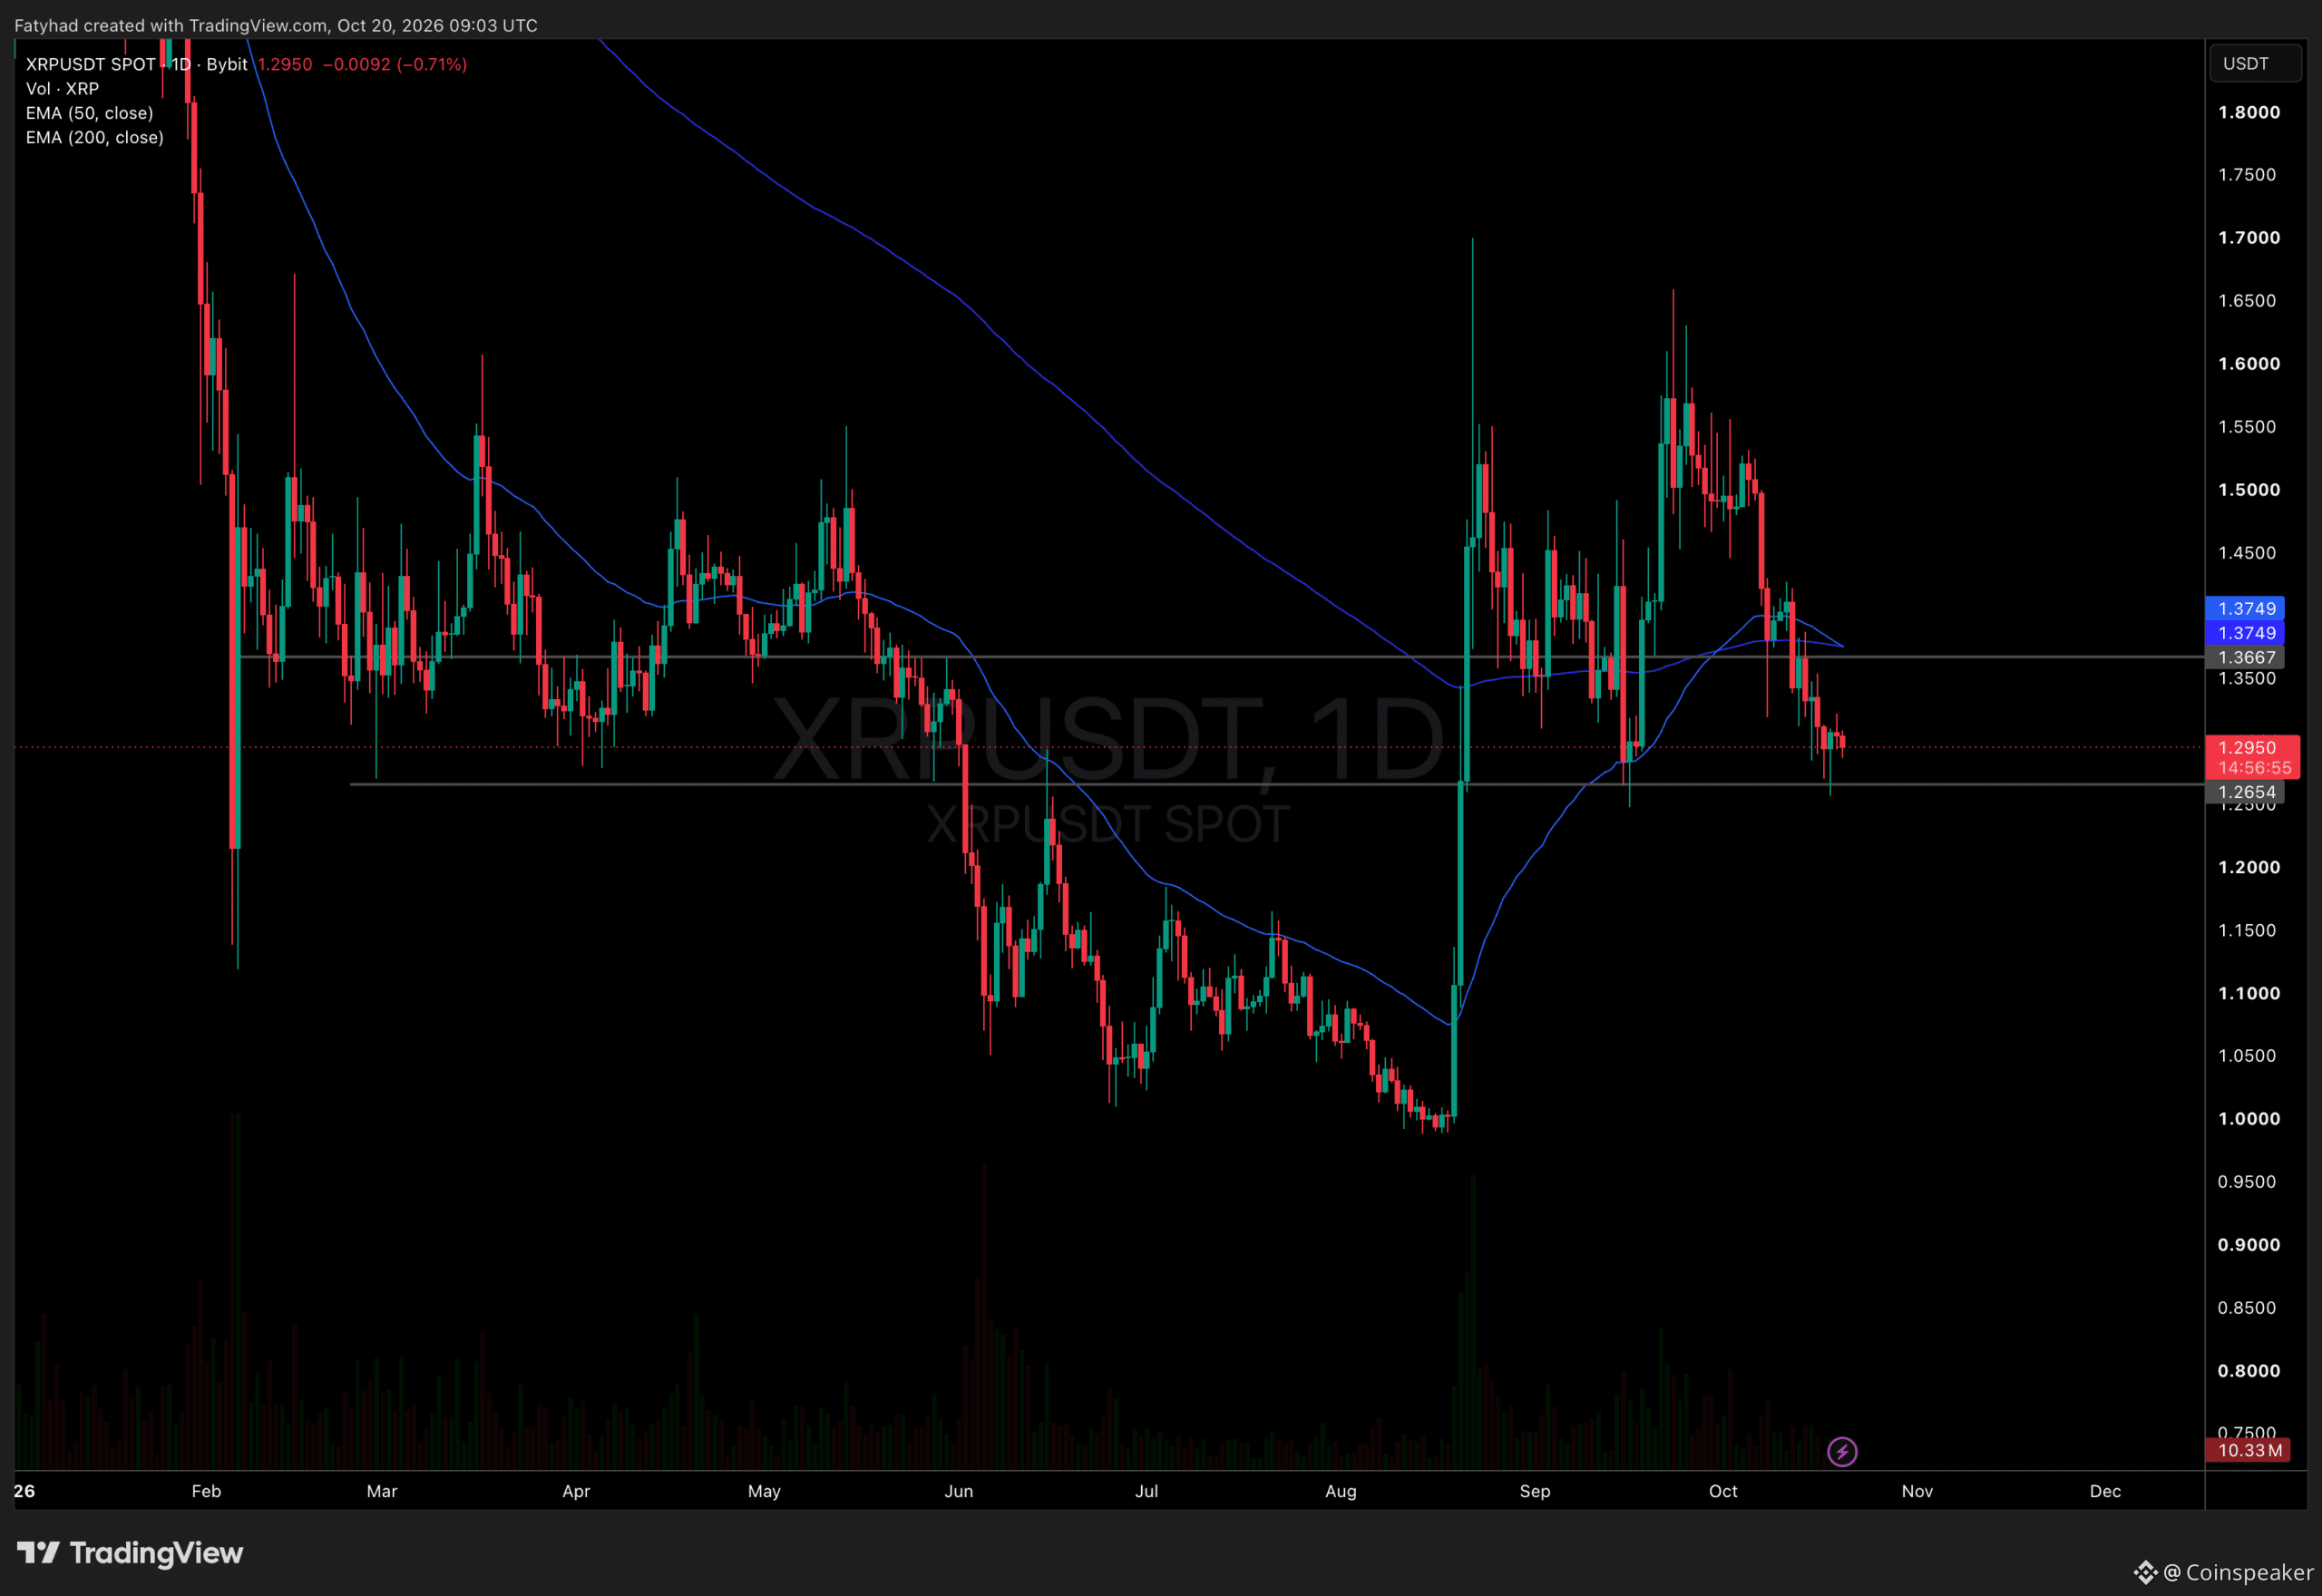
Статья
Ripple Prime Opens 24/7 RWA Perpetual Swaps: Institutional Capital Hits Tokenized Stocks and Comm...The biggest Ripple news of the week has nothing to do with the XRP Ledger. Ripple Prime, the prime broker Ripple built from its $1.25 billion Hidden Road deal, now lets institutions trade exposure to stocks, metals, energy and currencies around the clock, weekends included. Ripple announced on October 15 that its new real-world asset (RWA) perpetual swaps cover more than 100 reference markets, and market maker Virtu is already trading them.
So what does a Wall Street desk get out of this Ripple news that it couldn’t get on a Friday night before? And does any of it touch XRP?
2026 is the year of RWA perps, and today, @Ripple Prime is enabling institutional clients to trade and settle RWA swaps against over 100 reference markets, cross-margined against other asset classes 24/7.
Single counterparty relationship, centralized risk management and…
— Ripple (@Ripple) October 15, 2026
Sign Up With MergeX And Trade Crypto How Do Ripple Prime’s RWA Swaps Work?
Ripple Prime sits in the middle. It acts as principal on every swap, and each swap tracks a perpetual futures contract that Trade.xyz lists on Hyperliquid, the onchain derivatives exchange. That is what makes them RWA perpetual swaps: a perpetual is a futures contract with no expiry date, so a position can stay open as long as the margin holds.
The client never touches Hyperliquid directly. It deals with one counterparty, sees its margin and risk in one place, and gets price exposure only. Nobody owns the underlying shares or commodities.
The money side is where it gets interesting for crypto. Clients can cross-margin the swaps against the other asset classes Ripple Prime handles, so positions that offset each other need less collateral. They can also post Ripple USD (RLUSD), Ripple’s stablecoin, as collateral, although Ripple says that depends on the client’s jurisdiction.
There is one big limit. The product runs only out of Ripple Prime’s CIV British Virgin Islands (BVI) license for now. Ripple says it wants to offer it from more regions, but gave no markets or timeline.
Why Does 24/7 Access Matter to Institutions?
Because the news doesn’t stop at the closing bell. A weekend headline can move oil or the dollar before the Monday open, and until now a fund had no clean way to hedge it. These swaps keep trading while the underlying exchanges are shut.
“RWA swaps are where traditional and digital markets meet,” said Michael Higgins, International CEO of Ripple Prime.
Virtu put it in trader terms. Scotte Moegling, its head of business development for digital assets, said Ripple Prime’s 24/7 cross-margining across asset classes helps the firm “expand our presence more efficiently as markets move toward round-the-clock access.”
The launch builds on Ripple Prime’s Hyperliquid integration from February, which first let institutional clients reach the venue with margin managed alongside their other positions. Ripple, which says it holds more than 85 licenses, is pitching Ripple Prime as one account for digital assets, FX, fixed income and derivatives.
Its leveraged ETF swaps and nonbank financing are part of the firm’s broader work in institutional-market services, while the current launch adds round-the-clock RWA swap access to that mix.
DISCOVER: Best Meme Coins to Buy in 2026
What Does This Ripple News Mean for XRP Price?
Not much directly. The swaps reference Hyperliquid contracts and take RLUSD as collateral, so XRP isn’t in the plumbing.
The XRP price says the same. XRP (XRP USD) trades at $1.3000, down 1.39% over 24 hours and 5.90% over the week, on $1.28 billion in volume.
XRPUSDT Chart 1D
The 50-day exponential moving average (EMA), which gives recent prices more weight, has slid to $1.3750. The 200-day EMA is at $1.3749. A week ago the 50-day was 1.4 cents above the 200-day. Now the gap is a hundredth of a cent, so a death cross, the 50 dropping under the 200, is one weak close away.
The first ceiling: $1.3661, with the EMA pair at $1.375 right above it.
The bigger hurdle: $1.4835, the next swing high.
The floor to defend: $1.2468, under Sunday’s $1.2562 low.
Ripple keeps adding Wall Street products while XRP keeps drifting. If buyers can’t reclaim $1.375 before the averages cross, the market will have told Ripple what it thinks the RWA business is worth to the token.
DISCOVER: Meme coin supercycle: Top performers this week
next
The post Ripple Prime Opens 24/7 RWA Perpetual Swaps: Institutional Capital Hits Tokenized Stocks and Commodities appeared first on Coinspeaker.
Ripple Prime Opens 24/7 RWA Perpetual Swaps: Institutional Capital Hits Tokenized Stocks and Comm...
The biggest Ripple news of the week has nothing to do with the XRP Ledger. Ripple Prime, the prime broker Ripple built from its $1.25 billion Hidden Road deal, now lets institutions trade exposure to stocks, metals, energy and currencies around the clock, weekends included. Ripple announced on October 15 that its new real-world asset (RWA) perpetual swaps cover more than 100 reference markets, and market maker Virtu is already trading them.
So what does a Wall Street desk get out of this Ripple news that it couldn’t get on a Friday night before? And does any of it touch XRP?
2026 is the year of RWA perps, and today, @Ripple Prime is enabling institutional clients to trade and settle RWA swaps against over 100 reference markets, cross-margined against other asset classes 24/7.
Single counterparty relationship, centralized risk management and…
— Ripple (@Ripple) October 15, 2026
Sign Up With MergeX And Trade Crypto How Do Ripple Prime’s RWA Swaps Work?
Ripple Prime sits in the middle. It acts as principal on every swap, and each swap tracks a perpetual futures contract that Trade.xyz lists on Hyperliquid, the onchain derivatives exchange. That is what makes them RWA perpetual swaps: a perpetual is a futures contract with no expiry date, so a position can stay open as long as the margin holds.
The client never touches Hyperliquid directly. It deals with one counterparty, sees its margin and risk in one place, and gets price exposure only. Nobody owns the underlying shares or commodities.
The money side is where it gets interesting for crypto. Clients can cross-margin the swaps against the other asset classes Ripple Prime handles, so positions that offset each other need less collateral. They can also post Ripple USD (RLUSD), Ripple’s stablecoin, as collateral, although Ripple says that depends on the client’s jurisdiction.
There is one big limit. The product runs only out of Ripple Prime’s CIV British Virgin Islands (BVI) license for now. Ripple says it wants to offer it from more regions, but gave no markets or timeline.
Why Does 24/7 Access Matter to Institutions?
Because the news doesn’t stop at the closing bell. A weekend headline can move oil or the dollar before the Monday open, and until now a fund had no clean way to hedge it. These swaps keep trading while the underlying exchanges are shut.
“RWA swaps are where traditional and digital markets meet,” said Michael Higgins, International CEO of Ripple Prime.
Virtu put it in trader terms. Scotte Moegling, its head of business development for digital assets, said Ripple Prime’s 24/7 cross-margining across asset classes helps the firm “expand our presence more efficiently as markets move toward round-the-clock access.”
The launch builds on Ripple Prime’s Hyperliquid integration from February, which first let institutional clients reach the venue with margin managed alongside their other positions. Ripple, which says it holds more than 85 licenses, is pitching Ripple Prime as one account for digital assets, FX, fixed income and derivatives.
Its leveraged ETF swaps and nonbank financing are part of the firm’s broader work in institutional-market services, while the current launch adds round-the-clock RWA swap access to that mix.
DISCOVER: Best Meme Coins to Buy in 2026
What Does This Ripple News Mean for XRP Price?
Not much directly. The swaps reference Hyperliquid contracts and take RLUSD as collateral, so XRP isn’t in the plumbing.
The XRP price says the same. XRP (XRP USD) trades at $1.3000, down 1.39% over 24 hours and 5.90% over the week, on $1.28 billion in volume.
XRPUSDT Chart 1D
The 50-day exponential moving average (EMA), which gives recent prices more weight, has slid to $1.3750. The 200-day EMA is at $1.3749. A week ago the 50-day was 1.4 cents above the 200-day. Now the gap is a hundredth of a cent, so a death cross, the 50 dropping under the 200, is one weak close away.
The first ceiling: $1.3661, with the EMA pair at $1.375 right above it.
The bigger hurdle: $1.4835, the next swing high.
The floor to defend: $1.2468, under Sunday’s $1.2562 low.
Ripple keeps adding Wall Street products while XRP keeps drifting. If buyers can’t reclaim $1.375 before the averages cross, the market will have told Ripple what it thinks the RWA business is worth to the token.
DISCOVER: Meme coin supercycle: Top performers this week
next
The post Ripple Prime Opens 24/7 RWA Perpetual Swaps: Institutional Capital Hits Tokenized Stocks and Commodities appeared first on Coinspeaker.
1
382
Войдите, чтобы посмотреть больше материала
Присоединяйтесь к пользователям криптовалют по всему миру на Binance Square
⚡️ Получайте новейшую и полезную информацию о криптоактивах.
💬 Нам доверяет крупнейшая в мире криптобиржа.
👍 Получите достоверные аналитические данные от верифицированных создателей контента.
Эл. почта/номер телефона
В тренде
FedWatch
Просмотров: 16.3M
39,383 обсуждают
🚨 🇺🇸 PETER SCHIFF JUST THREW A BIG WARNING AT THE FED!
Peter Schiff is calling Kevin Warsh’s tough talk on inflation a “bluff,” and his prediction could have major implications for the markets.
Schiff believes the Fed could eventually return to money printing through quantitative easing (QE) and even cut interest rates next year, despite inflation continuing to rise.
Think about that for a moment.
🔥 Inflation could remain a problem. 🔥 The Fed could still move toward easier monetary policy. 🔥 More liquidity could flow into financial markets.
If this scenario plays out, it could create a very different market environment for stocks, gold, Bitcoin, and the wider crypto market.
But there’s a catch: if inflation stays high, the Fed could face a difficult choice between fighting rising prices and supporting the economy.
Will Warsh stick to a tough inflation policy, or will the Fed eventually change direction?
The next move could matter a lot for investors.
#FedWatch #EarningsSeason #USMidtermElections #BrazilCryptoExchangesMustApplyForLicensesByFriday #StanDruckenmillerBecomesInvestorInTradeXYZ
Jackson Liam
·Лайков: 4
·Просмотров: 8.3k
EarningsSeason
Просмотров: 6.4M
32,084 обсуждают
USMidtermElections
Просмотров: 40,850
615 обсуждают