

ProTrader365
201 Публикации

ProTrader365
Отправить жалобу
Заблокировать пользователя
"Over 8 years in crypto have taught us one thing: winning isn’t luck; it’s strategy. We're here to help you master yours." ProTrader | Investor | Content Creator | Analyzer
0 подписок(и/а)
1 подписчиков(а)
6 понравилось
Посты
·
--
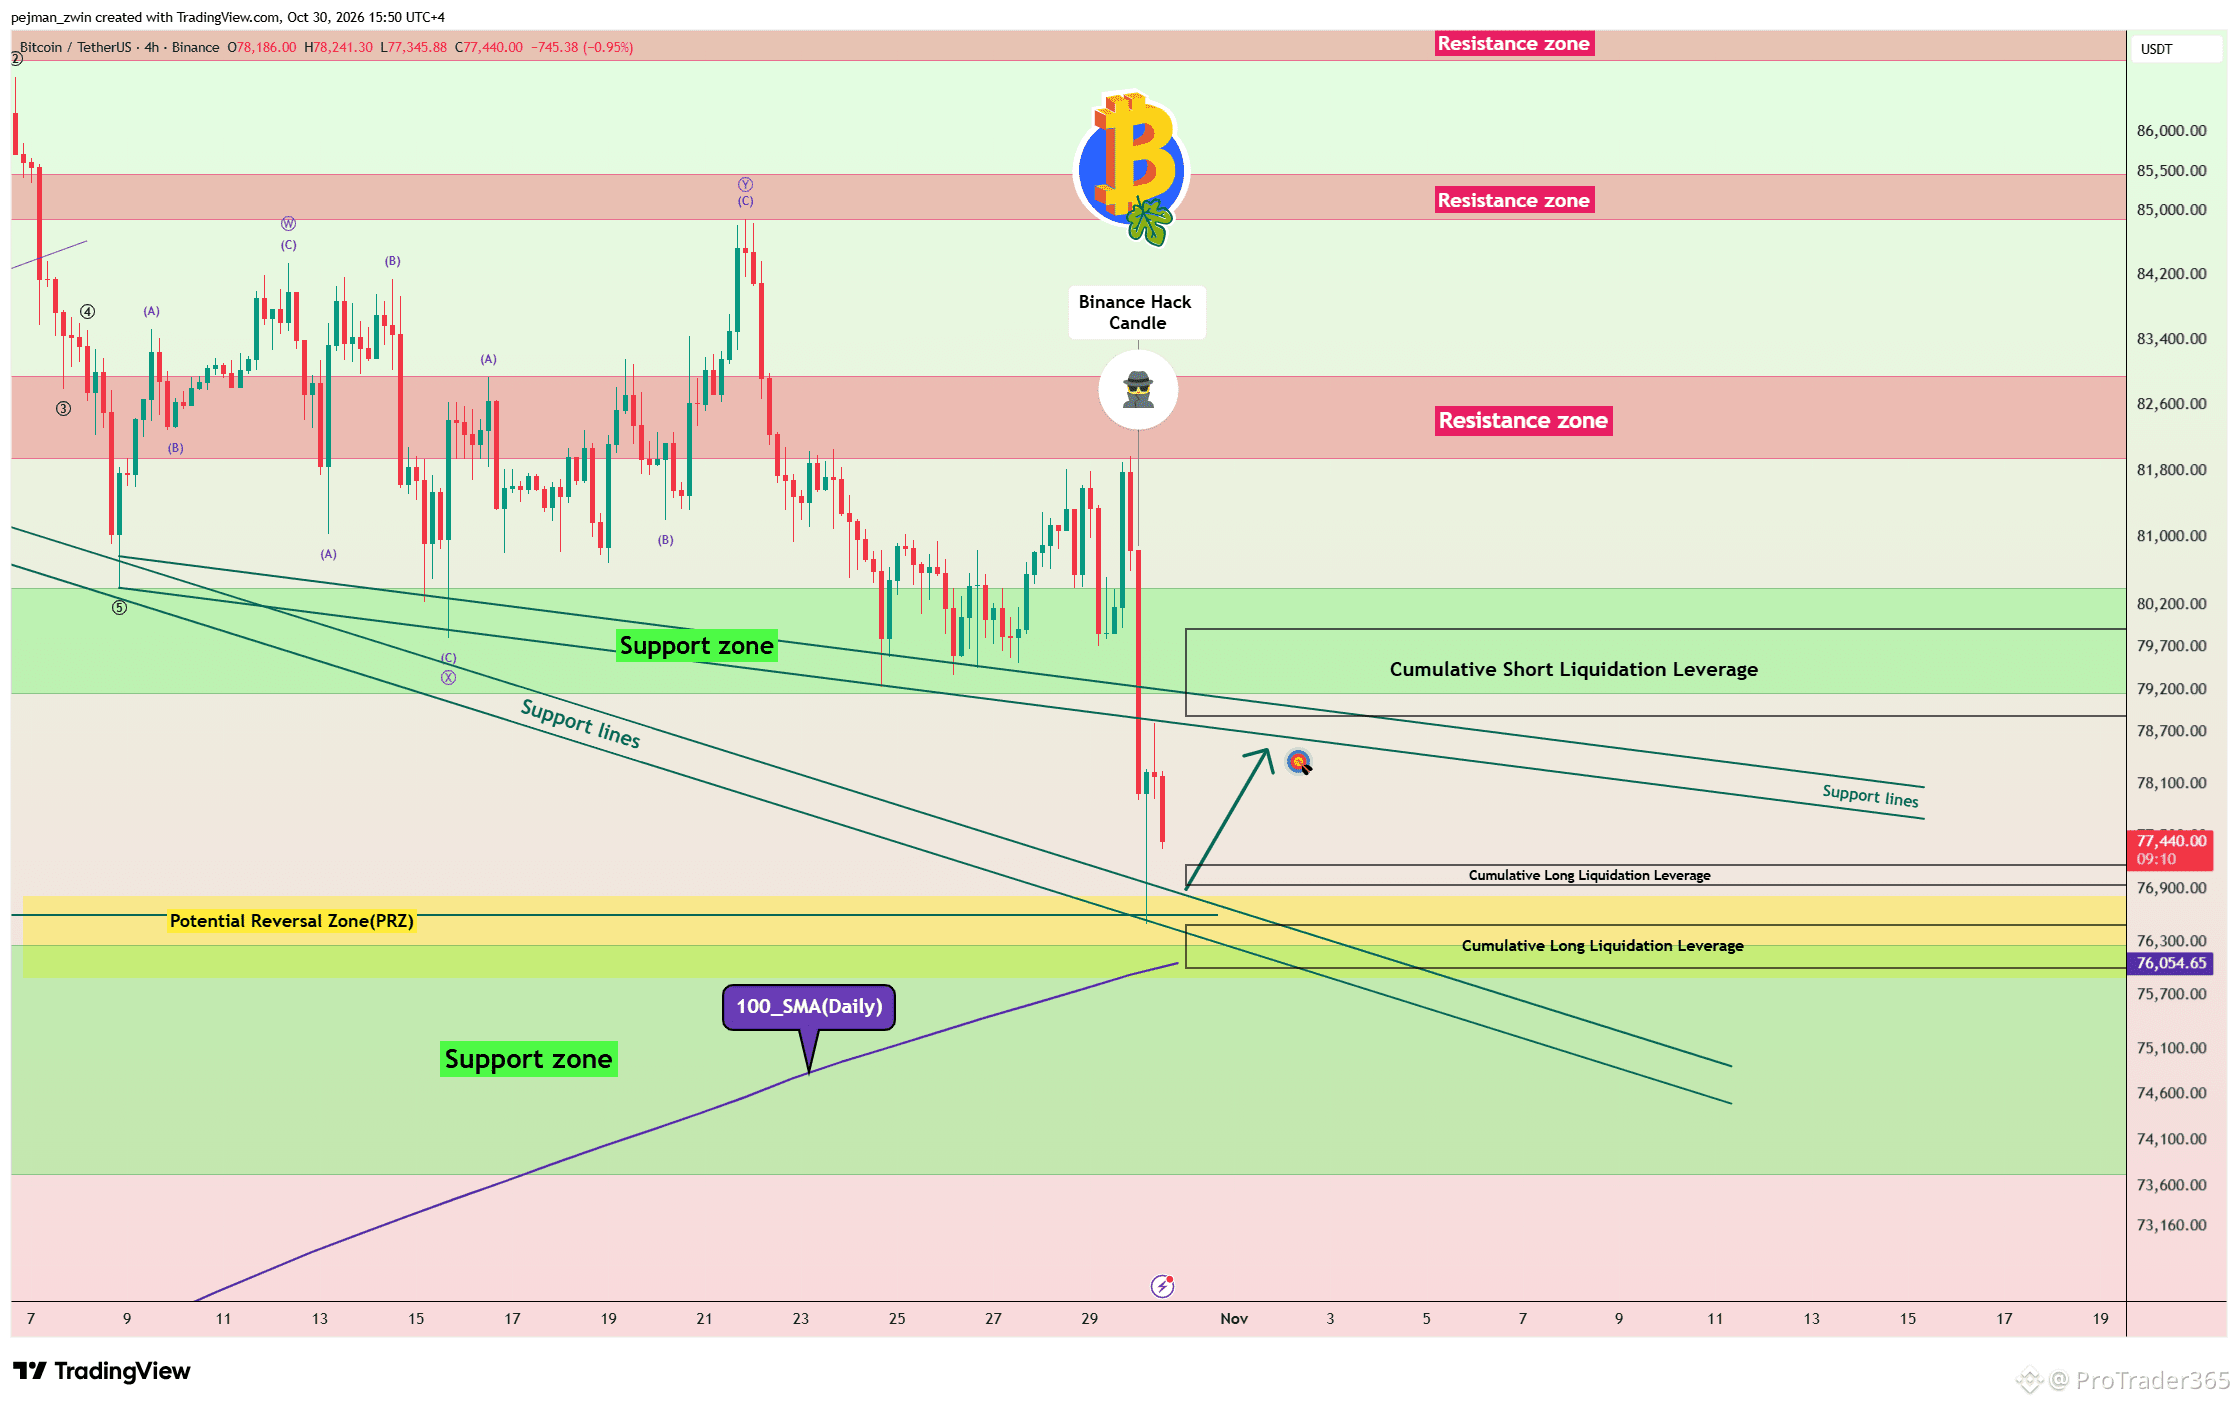
$BTC Breaks Below $80,000 — Rebound First, Then Another Drop? Bitcoin started falling from around $82,000 after reports of a Binance hack triggered another wave of selling, while weak U.S. equities and Middle East uncertainty added even more pressure. BTC has now lost the Support Zone($79,150-$80,400), but the story becomes more interesting lower down. Price reacted from the Support Zone($73,720-$76,260), the Potential Reversal Zone(PRZ)($75,900-$76,800), and the 100_SMA(Daily). In the very short term, I expect a bullish correction from the Cumulative Long Liquidation Leverage($76,940-$77,170) and ($76,000-$76,480). If the weekend passes without a major geopolitical escalation, Bitcoin could consolidate between roughly $76,000 and $80,000. But for me, the broader structure is still bearish. After a temporary recovery, sellers could attack ($73,720-$76,260) again. Losing this zone would open the door to a deeper move below $76,000. TP: $78,540 SL: $75,760(Worst) Rebound toward $78,540 first, or breakdown below $76,000? If you found this analysis useful, follow for more. #BTC Price Analysis# #Binance
$BTC Breaks Below $80,000 — Rebound First, Then Another Drop? Bitcoin started falling from around $82,000 after reports of a Binance hack triggered another wave of selling, while weak U.S. equities and Middle East uncertainty added even more pressure. BTC has now lost the Support Zone($79,150-$80,400), but the story becomes more interesting lower down. Price reacted from the Support Zone($73,720-$76,260), the Potential Reversal Zone(PRZ)($75,900-$76,800), and the 100_SMA(Daily). In the very short term, I expect a bullish correction from the Cumulative Long Liquidation Leverage($76,940-$77,170) and ($76,000-$76,480). If the weekend passes without a major geopolitical escalation, Bitcoin could consolidate between roughly $76,000 and $80,000. But for me, the broader structure is still bearish. After a temporary recovery, sellers could attack ($73,720-$76,260) again. Losing this zone would open the door to a deeper move below $76,000. TP: $78,540 SL: $75,760(Worst) Rebound toward $78,540 first, or breakdown below $76,000? If you found this analysis useful, follow for more. #BTC Price Analysis# #Binance
27
·
--
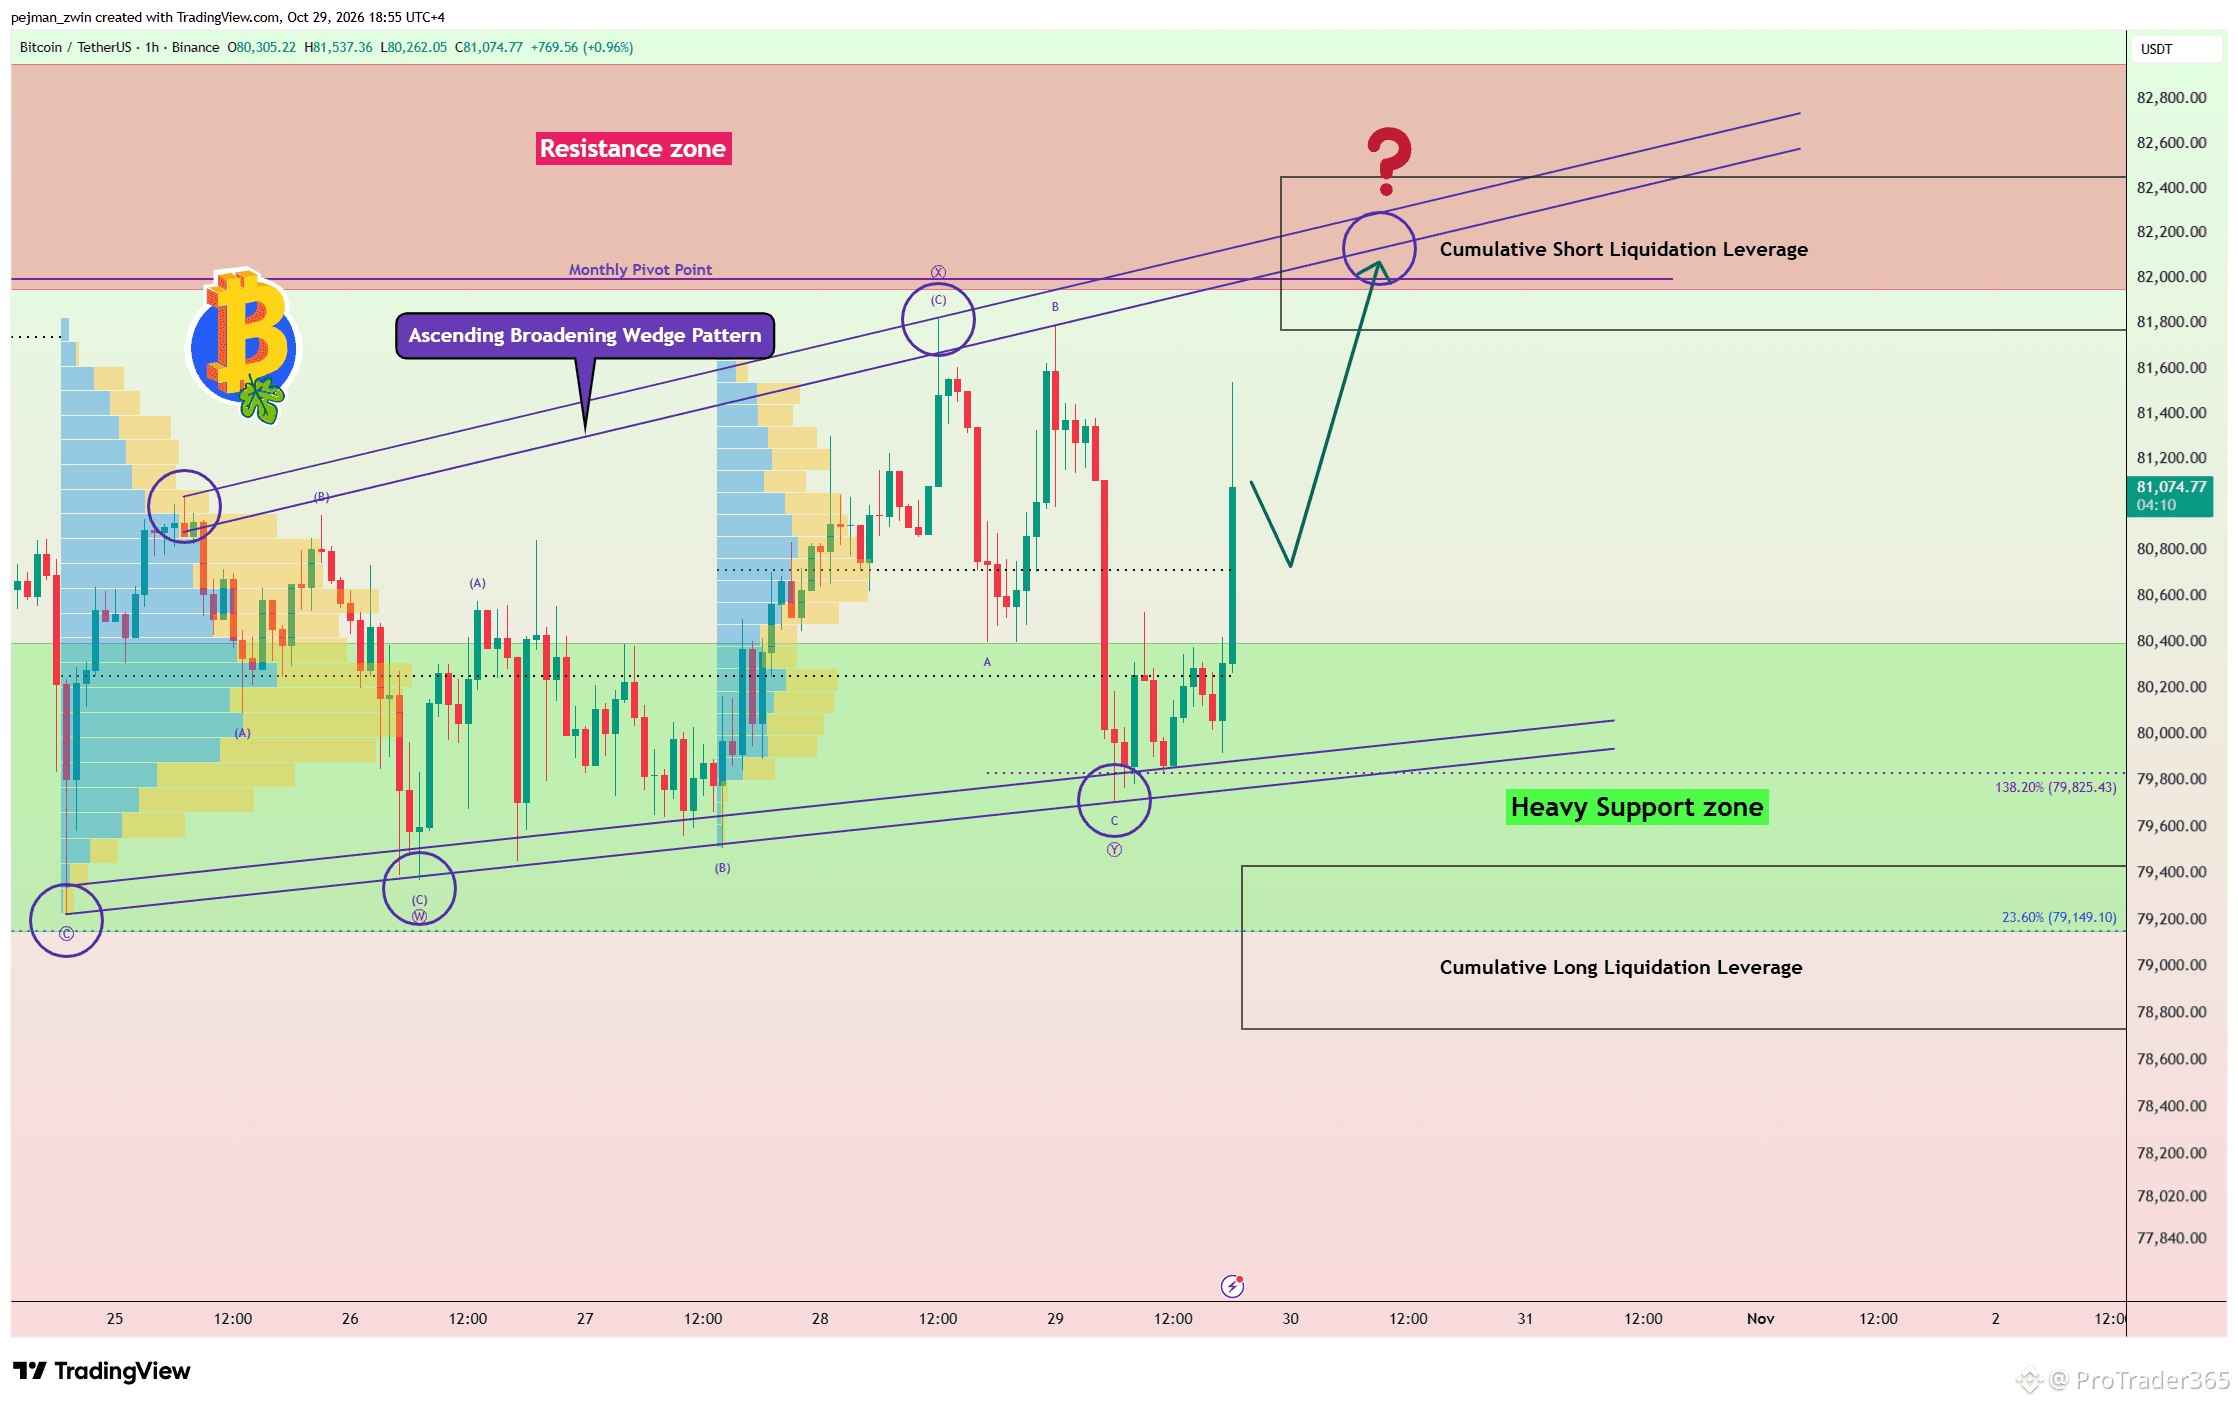
$BTC Recovery Builds — Can Buyers Reach $81,970 Before the Options Expiry? Bitcoin started moving higher before reaching the Heavy Support Zone($79,150-$80,400), reacting from an area near the key $81,250 trading level. Now the short-term recovery is gaining momentum, but tomorrow’s major options expiry could make the next move much more volatile. On the 1-hour timeframe, Bitcoin appears to be forming an Ascending Broadening Wedge. If buyers keep control, I expect BTC to continue toward the Resistance Zone($81,950-$83,000) and the Cumulative Short Liquidation Leverage($81,770-$82,450). A test of the upper trendline of the pattern could also follow. More than $11 billion in Bitcoin options are scheduled to expire on October 30, so I would not rule out sharp moves or False Breakouts before the market chooses its next direction. TP: $81,970 SL: $79,680(Worst) Which level comes first? 🟢 $81,970 🔴 $79,680 If you found this analysis useful, follow for more. #BTC Price Analysis#
$BTC Recovery Builds — Can Buyers Reach $81,970 Before the Options Expiry? Bitcoin started moving higher before reaching the Heavy Support Zone($79,150-$80,400), reacting from an area near the key $81,250 trading level. Now the short-term recovery is gaining momentum, but tomorrow’s major options expiry could make the next move much more volatile. On the 1-hour timeframe, Bitcoin appears to be forming an Ascending Broadening Wedge. If buyers keep control, I expect BTC to continue toward the Resistance Zone($81,950-$83,000) and the Cumulative Short Liquidation Leverage($81,770-$82,450). A test of the upper trendline of the pattern could also follow. More than $11 billion in Bitcoin options are scheduled to expire on October 30, so I would not rule out sharp moves or False Breakouts before the market chooses its next direction. TP: $81,970 SL: $79,680(Worst) Which level comes first? 🟢 $81,970 🔴 $79,680 If you found this analysis useful, follow for more. #BTC Price Analysis#
38
·
--
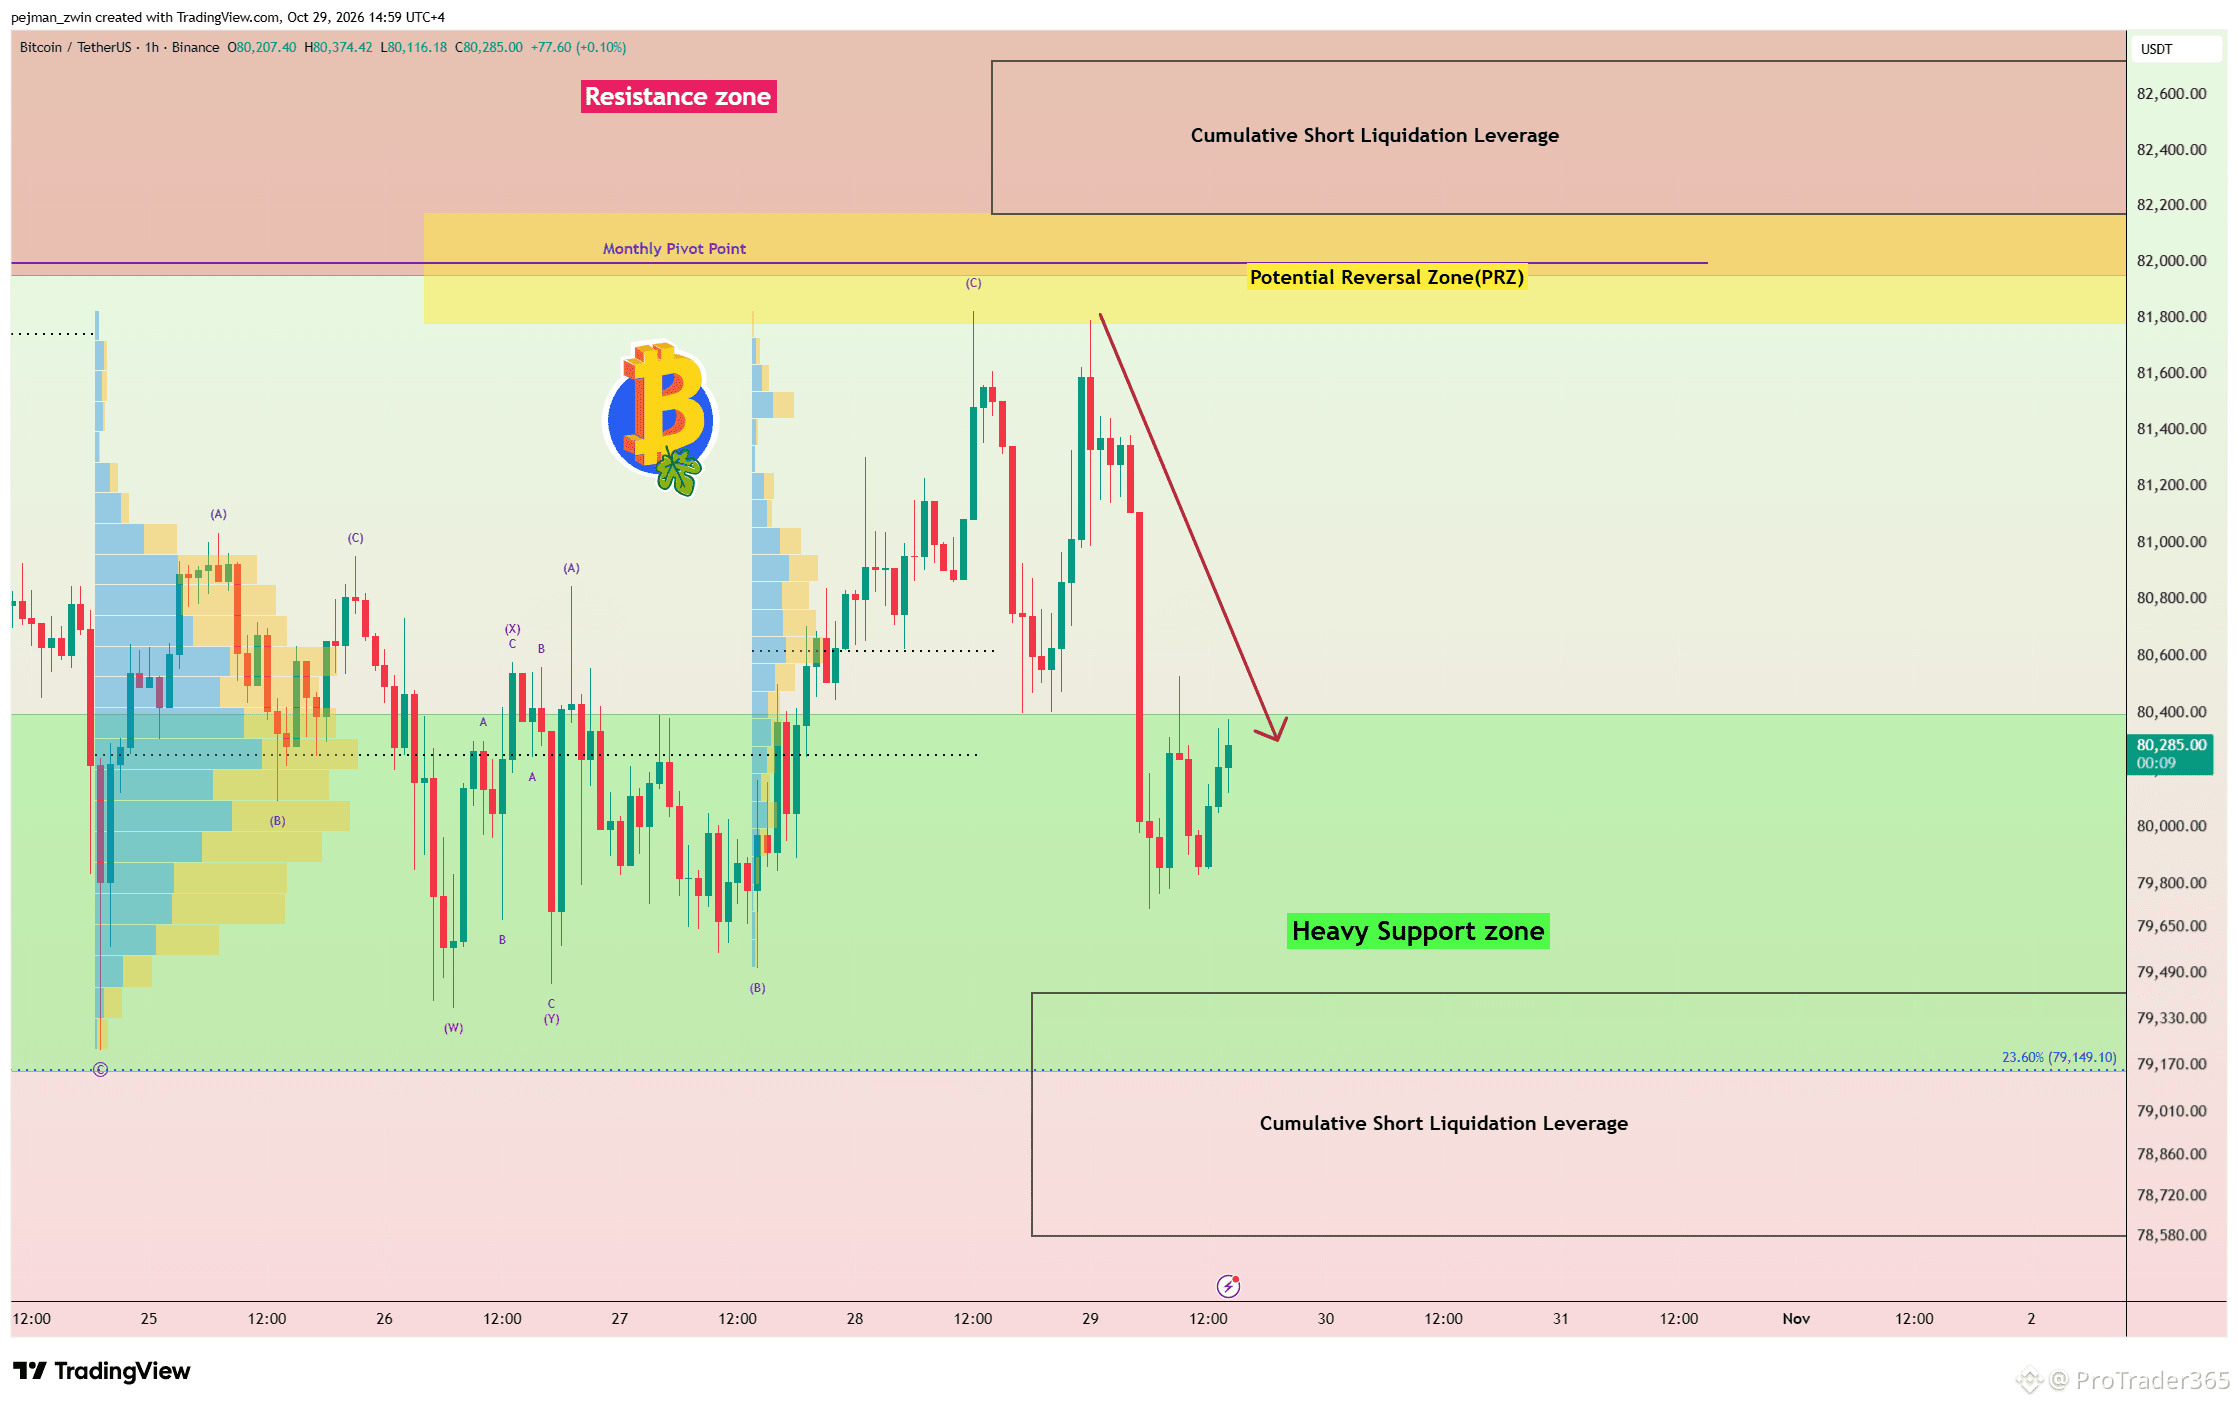
$BTC Full Target Hit — The FOMC Volatility Played Out Exactly as Expected Yesterday’s Fed decision brought the volatility we were waiting for. Warsh’s tone was more hawkish-to-neutral than dovish. Rates stayed at 4.00%, inflation remains elevated, two officials favored a hike, and Warsh avoided committing to December. Bitcoin initially moved with the FOMC noise—but once the market settled, the technical story took control. BTC reacted from exactly where I was watching: the Potential Reversal Zone(PRZ)($81,780-$82,180). Sellers stepped in from this area, and Bitcoin eventually reached the Full Target of the analysis. Now price has returned to the Heavy Support Zone($79,150-$80,400), where the next battle begins. This is why I always say: watch the zones, especially during high-volatility events. Price can become emotional, but strong technical areas often tell the story once the noise disappears. I hope this analysis was profitable and useful for you. Seeing these setups play out is what gives me the energy to keep sharing more. Bitcoin update coming next. If you found this analysis useful, follow for more. #Bitcoin Price Prediction: What is Bitcoins next move?# #BTC Price Analysis#
$BTC Full Target Hit — The FOMC Volatility Played Out Exactly as Expected Yesterday’s Fed decision brought the volatility we were waiting for. Warsh’s tone was more hawkish-to-neutral than dovish. Rates stayed at 4.00%, inflation remains elevated, two officials favored a hike, and Warsh avoided committing to December. Bitcoin initially moved with the FOMC noise—but once the market settled, the technical story took control. BTC reacted from exactly where I was watching: the Potential Reversal Zone(PRZ)($81,780-$82,180). Sellers stepped in from this area, and Bitcoin eventually reached the Full Target of the analysis. Now price has returned to the Heavy Support Zone($79,150-$80,400), where the next battle begins. This is why I always say: watch the zones, especially during high-volatility events. Price can become emotional, but strong technical areas often tell the story once the noise disappears. I hope this analysis was profitable and useful for you. Seeing these setups play out is what gives me the energy to keep sharing more. Bitcoin update coming next. If you found this analysis useful, follow for more. #Bitcoin Price Prediction: What is Bitcoins next move?# #BTC Price Analysis#
58
·
--
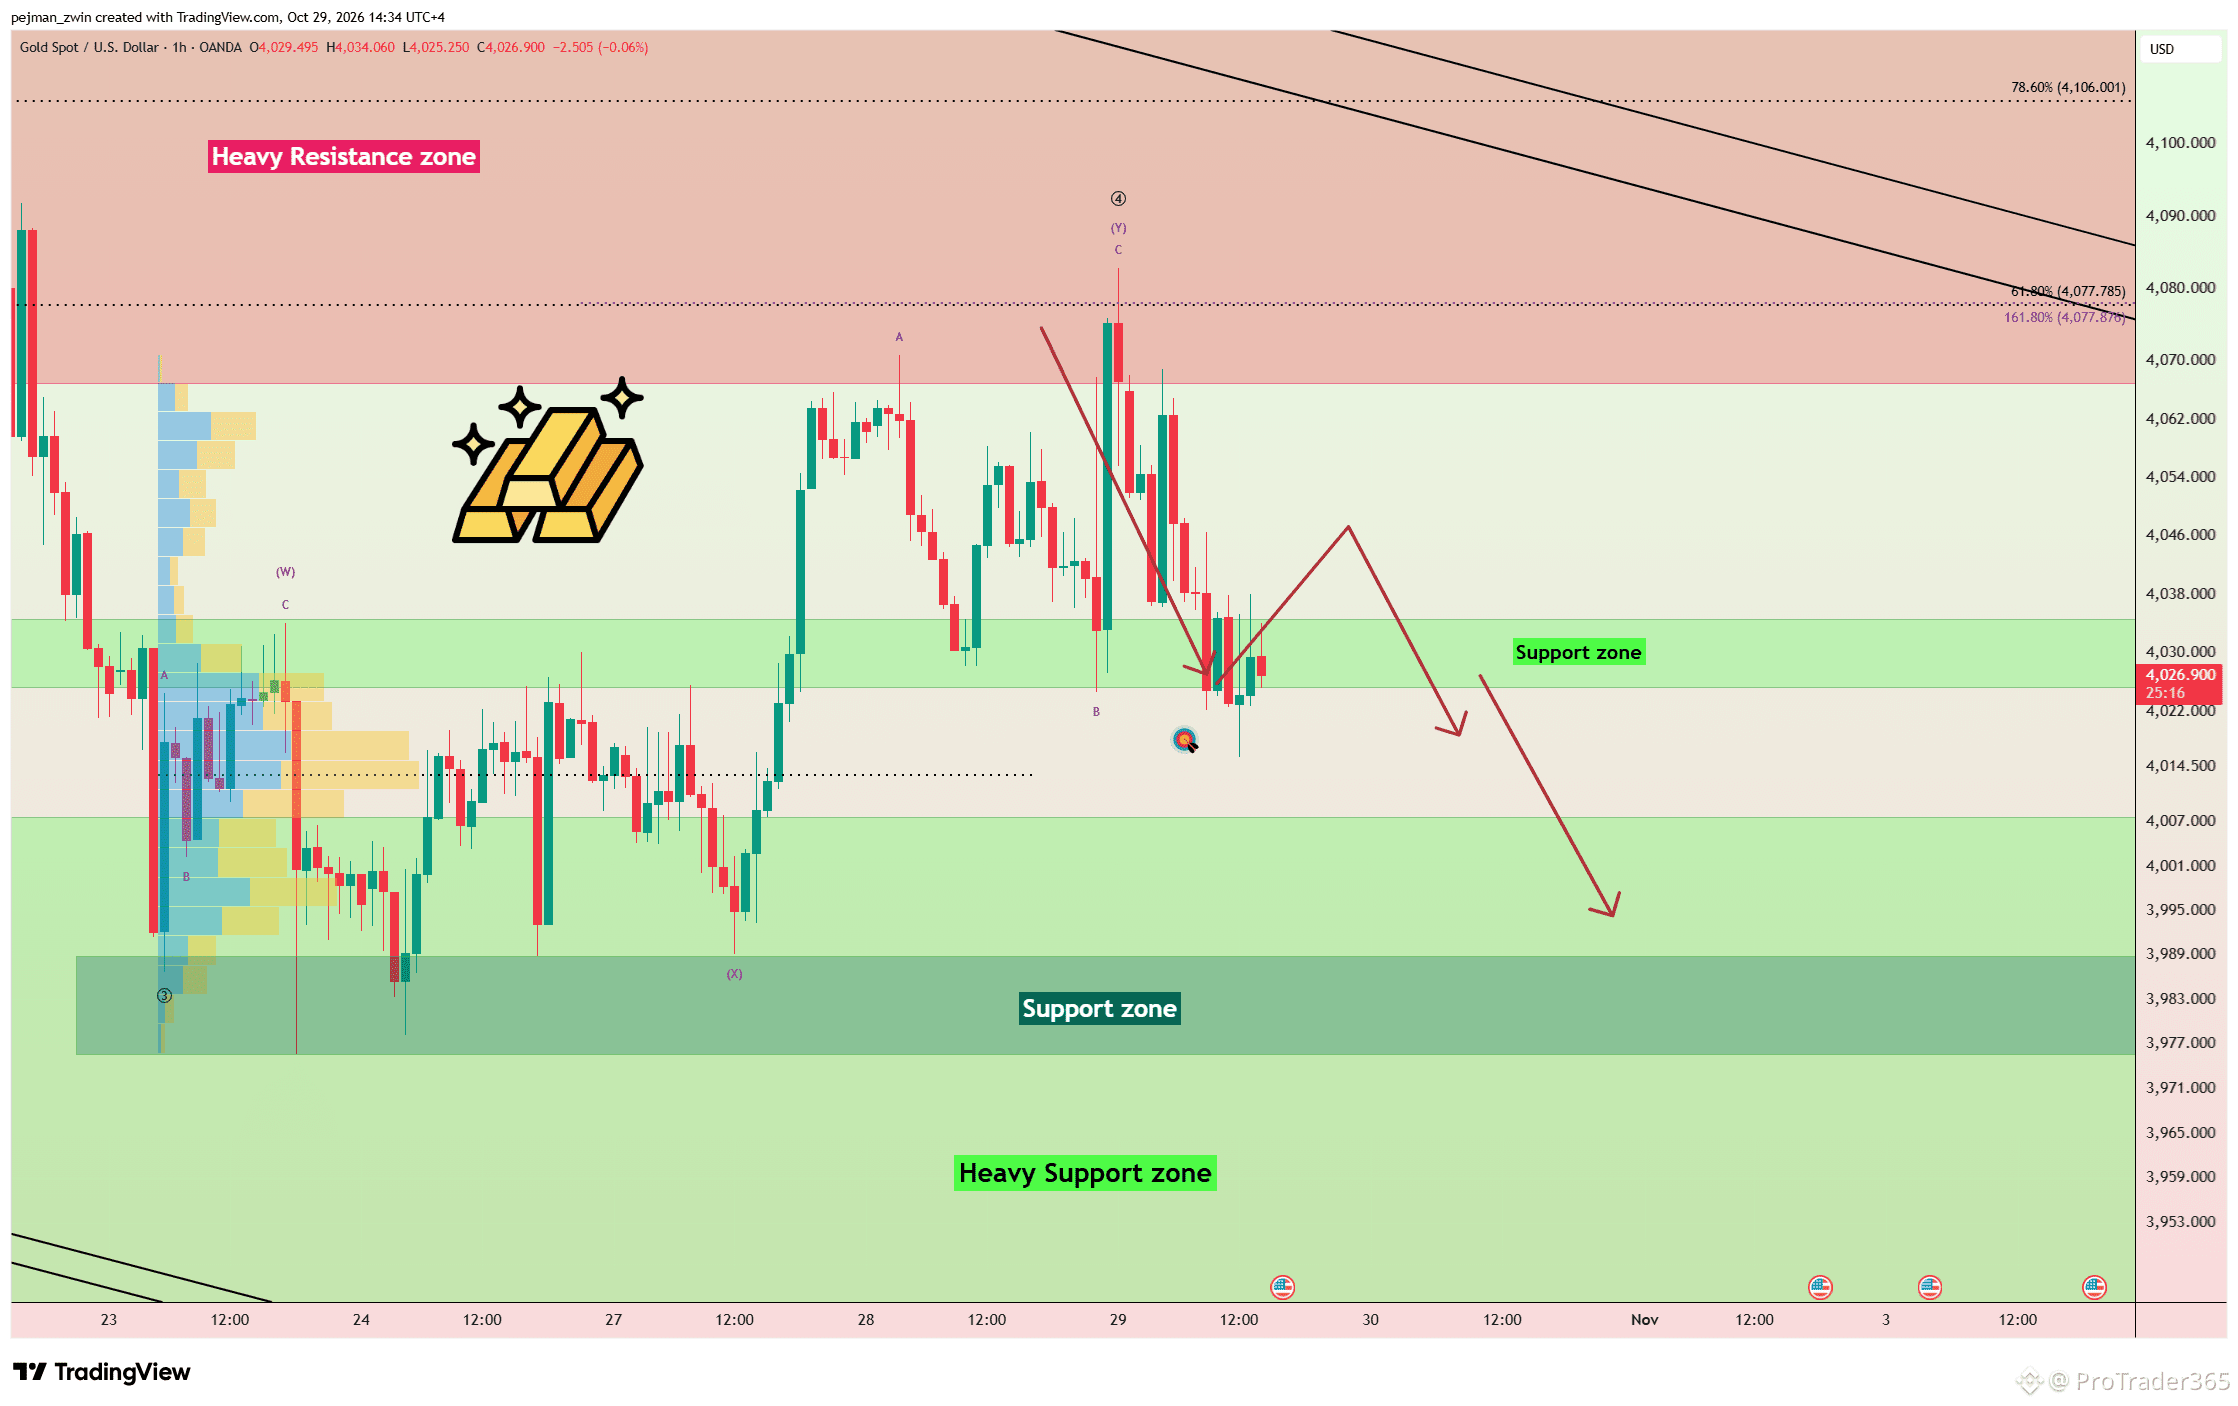
$XAUt First Target Hit — FOMC Noise, Technical Structure Wins The Fed delivered exactly the kind of volatility I expected. Warsh’s tone was hawkish-to-neutral rather than dovish. Rates stayed at 4.00%, inflation remains elevated, growth is still strong, and two officials even favored a hike. At the same time, Warsh said policy is starting to work and the economy is not overheating. Gold moved sharply during the announcement, but once the initial noise settled, the chart told the real story. Price failed again at the Heavy Resistance Zone($4,067-$4,122) and started moving lower, successfully reaching the First Target. Now Gold is testing the Support Zone($4,025-$4,035) and the key $4,012 trading level. If sellers confirm a breakdown below this structure, bearish momentum could strengthen further. This is why I never judge FOMC by the first candle. Macro creates the volatility, but important technical zones often decide what happens next. What is your view on Gold after the FOMC? If you found this analysis useful, follow for more. #Gold #FOMC
$XAUt First Target Hit — FOMC Noise, Technical Structure Wins The Fed delivered exactly the kind of volatility I expected. Warsh’s tone was hawkish-to-neutral rather than dovish. Rates stayed at 4.00%, inflation remains elevated, growth is still strong, and two officials even favored a hike. At the same time, Warsh said policy is starting to work and the economy is not overheating. Gold moved sharply during the announcement, but once the initial noise settled, the chart told the real story. Price failed again at the Heavy Resistance Zone($4,067-$4,122) and started moving lower, successfully reaching the First Target. Now Gold is testing the Support Zone($4,025-$4,035) and the key $4,012 trading level. If sellers confirm a breakdown below this structure, bearish momentum could strengthen further. This is why I never judge FOMC by the first candle. Macro creates the volatility, but important technical zones often decide what happens next. What is your view on Gold after the FOMC? If you found this analysis useful, follow for more. #Gold #FOMC
71
·
--
$BTC Recovery Faces Resistance — Is Another Downside Move Coming? Bitcoin started to recover after oil suddenly dropped from around $110 toward $105, triggering a temporary risk-on reaction across U.S. equities and Gold. However, oil has started moving higher again, while Middle East tensions remain elevated. Technical Analysis On the 1-hour timeframe, Bitcoin is trading inside a resistance area. As long as price remains below the key $83,350 trading level, I believe the bearish scenario remains valid. From a classical technical analysis perspective, Bitcoin also appears to be forming a Rising Wedge Pattern. A move below the key $82,000 level could significantly increase the probability of breaking the lower trendline and continuing the broader downside move. With Bitcoin still relatively close to $83,350, the current structure could offer an attractive Risk-to-Reward setup for a potential Short Position, but only with proper confirmation and strict risk management. Can Bitcoin reclaim $83,350, or will sellers regain control? If you found this analysis useful, follow for more. #BTC Price Analysis# #Bitcoin Price Prediction: What is Bitcoins next move?#
$BTC Recovery Faces Resistance — Is Another Downside Move Coming? Bitcoin started to recover after oil suddenly dropped from around $110 toward $105, triggering a temporary risk-on reaction across U.S. equities and Gold. However, oil has started moving higher again, while Middle East tensions remain elevated. Technical Analysis On the 1-hour timeframe, Bitcoin is trading inside a resistance area. As long as price remains below the key $83,350 trading level, I believe the bearish scenario remains valid. From a classical technical analysis perspective, Bitcoin also appears to be forming a Rising Wedge Pattern. A move below the key $82,000 level could significantly increase the probability of breaking the lower trendline and continuing the broader downside move. With Bitcoin still relatively close to $83,350, the current structure could offer an attractive Risk-to-Reward setup for a potential Short Position, but only with proper confirmation and strict risk management. Can Bitcoin reclaim $83,350, or will sellers regain control? If you found this analysis useful, follow for more. #BTC Price Analysis# #Bitcoin Price Prediction: What is Bitcoins next move?#
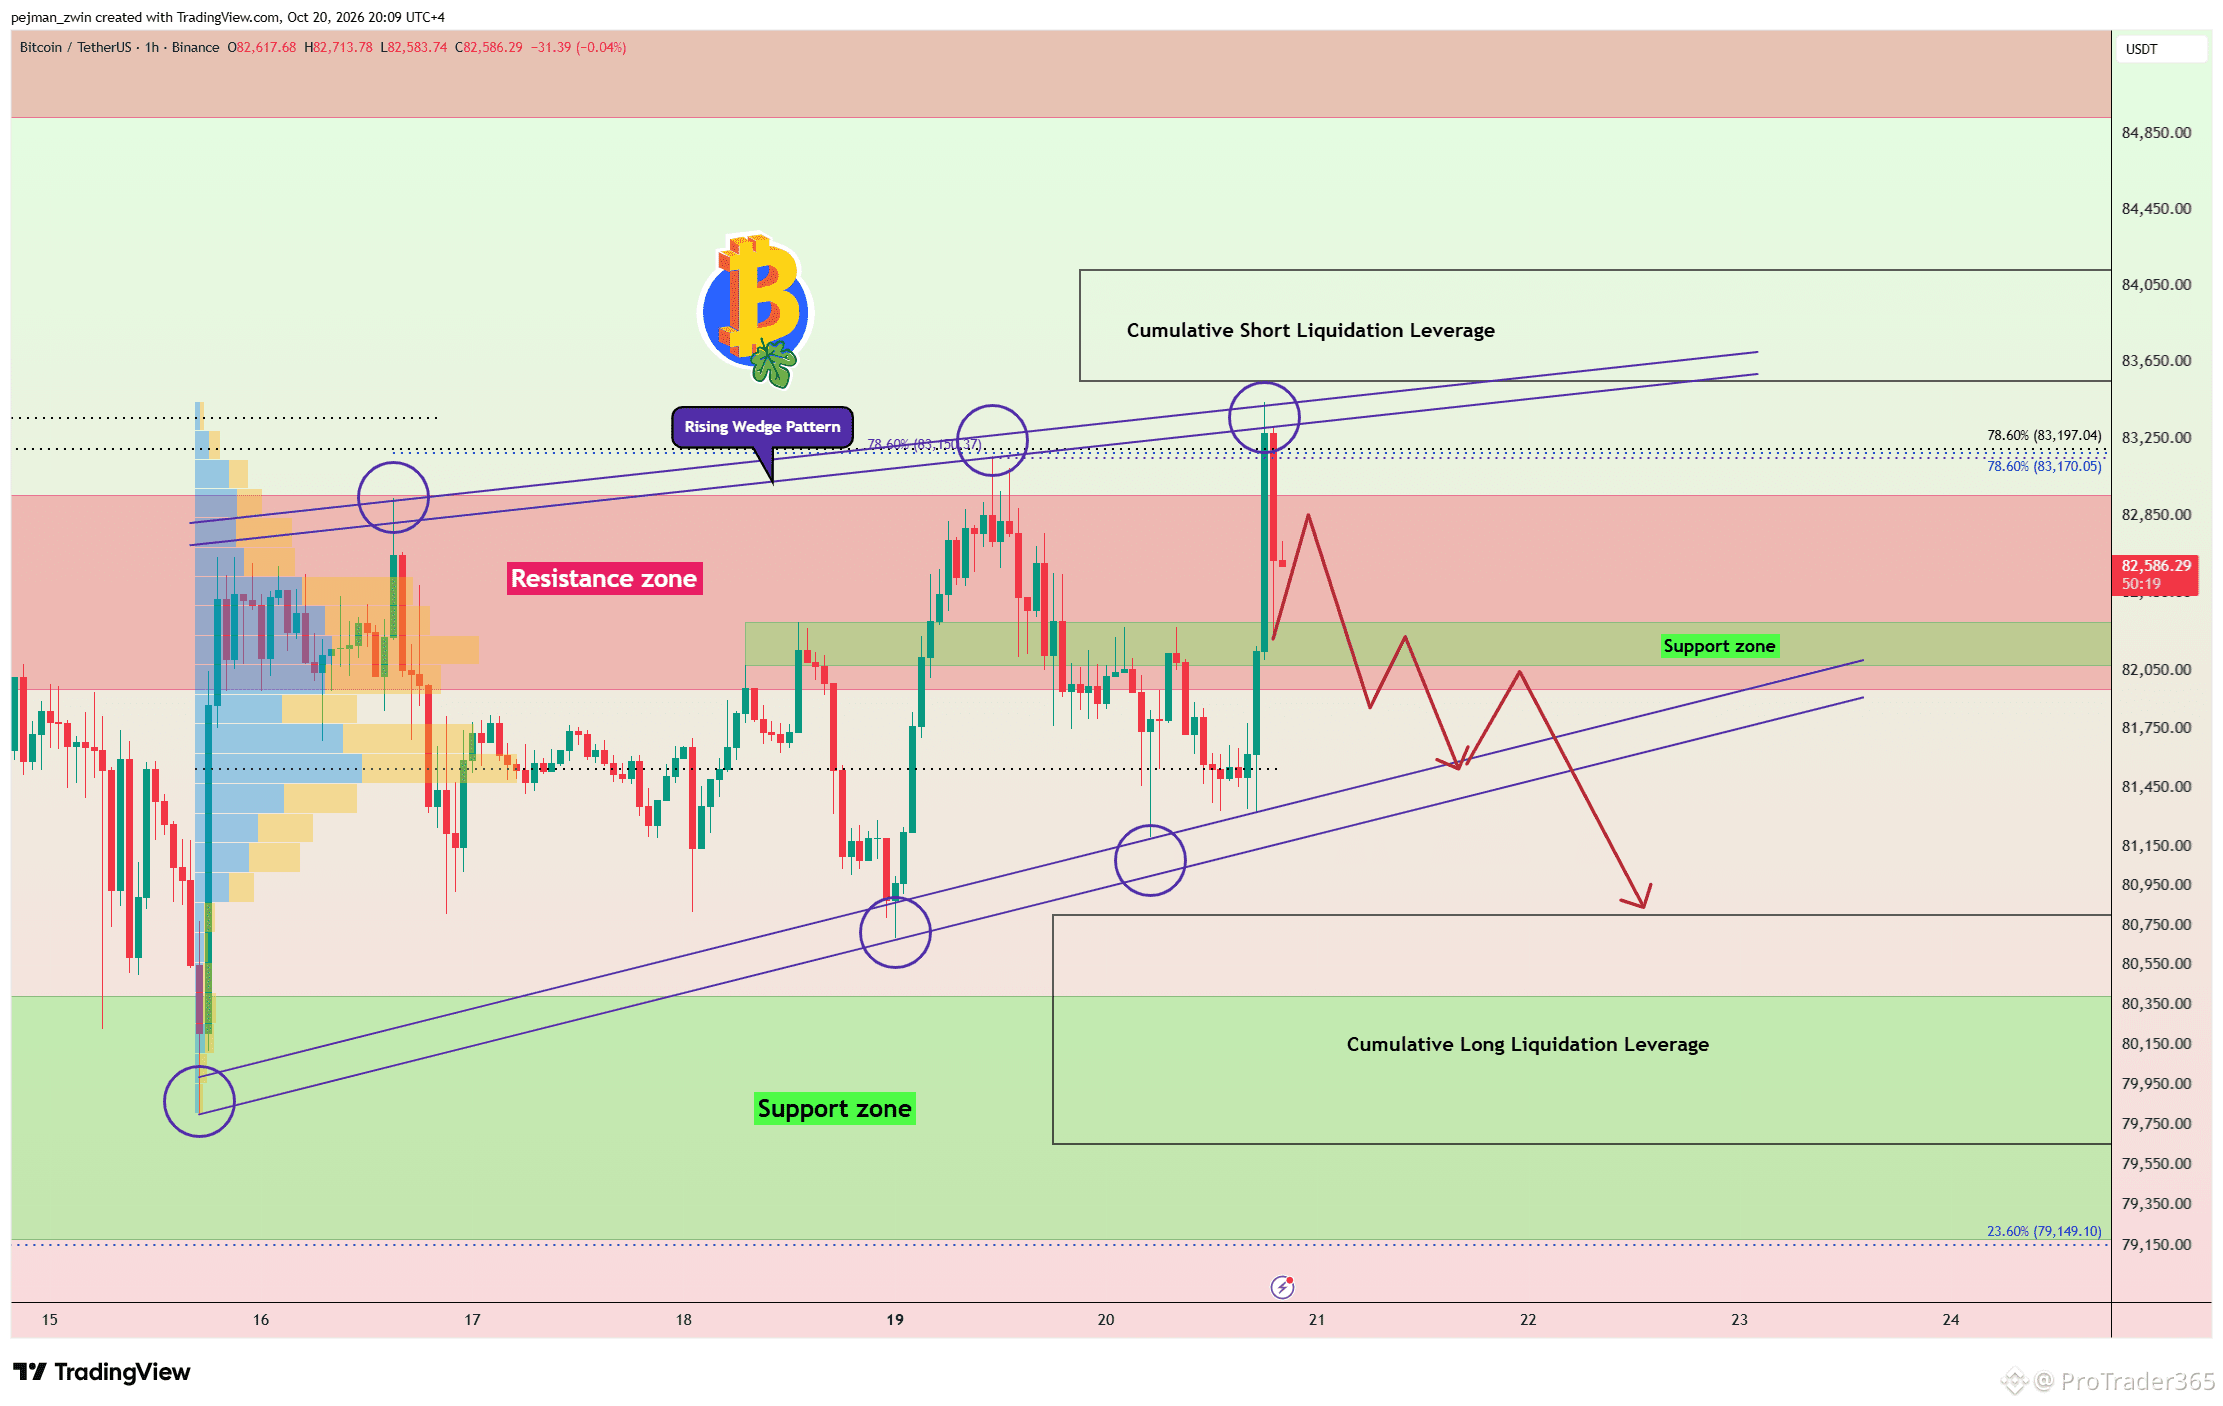
89
·
--
$TRUMP Nears Critical Support — Can the November Dinner Trigger a Recovery? Official Trump is approaching an important technical area as the November 22 dinner for the top 185 token holders draws closer. The event could attract renewed speculative demand, although supply concentration and future token unlocks remain important risks. Technical Analysis On the 4-hour timeframe, TRUMP is approaching the Support Zone($1.36-$1.56), its historical low area, and the key $1.60 trading level. Price also appears to be moving inside a Falling Wedge Pattern, while a bullish divergence between consecutive lows and declining selling volume suggest bearish momentum may be weakening. I expect a potential bullish reaction from the Cumulative Long Liquidation Leverage($1.58-$1.66), with at least 15% upside possible. The key resistance is $1.92. A confirmed breakout above it could significantly strengthen the bullish scenario. Can TRUMP recover above $1.92 before the November dinner? If you found this analysis useful, follow for more. #TRUMP
$TRUMP Nears Critical Support — Can the November Dinner Trigger a Recovery? Official Trump is approaching an important technical area as the November 22 dinner for the top 185 token holders draws closer. The event could attract renewed speculative demand, although supply concentration and future token unlocks remain important risks. Technical Analysis On the 4-hour timeframe, TRUMP is approaching the Support Zone($1.36-$1.56), its historical low area, and the key $1.60 trading level. Price also appears to be moving inside a Falling Wedge Pattern, while a bullish divergence between consecutive lows and declining selling volume suggest bearish momentum may be weakening. I expect a potential bullish reaction from the Cumulative Long Liquidation Leverage($1.58-$1.66), with at least 15% upside possible. The key resistance is $1.92. A confirmed breakout above it could significantly strengthen the bullish scenario. Can TRUMP recover above $1.92 before the November dinner? If you found this analysis useful, follow for more. #TRUMP
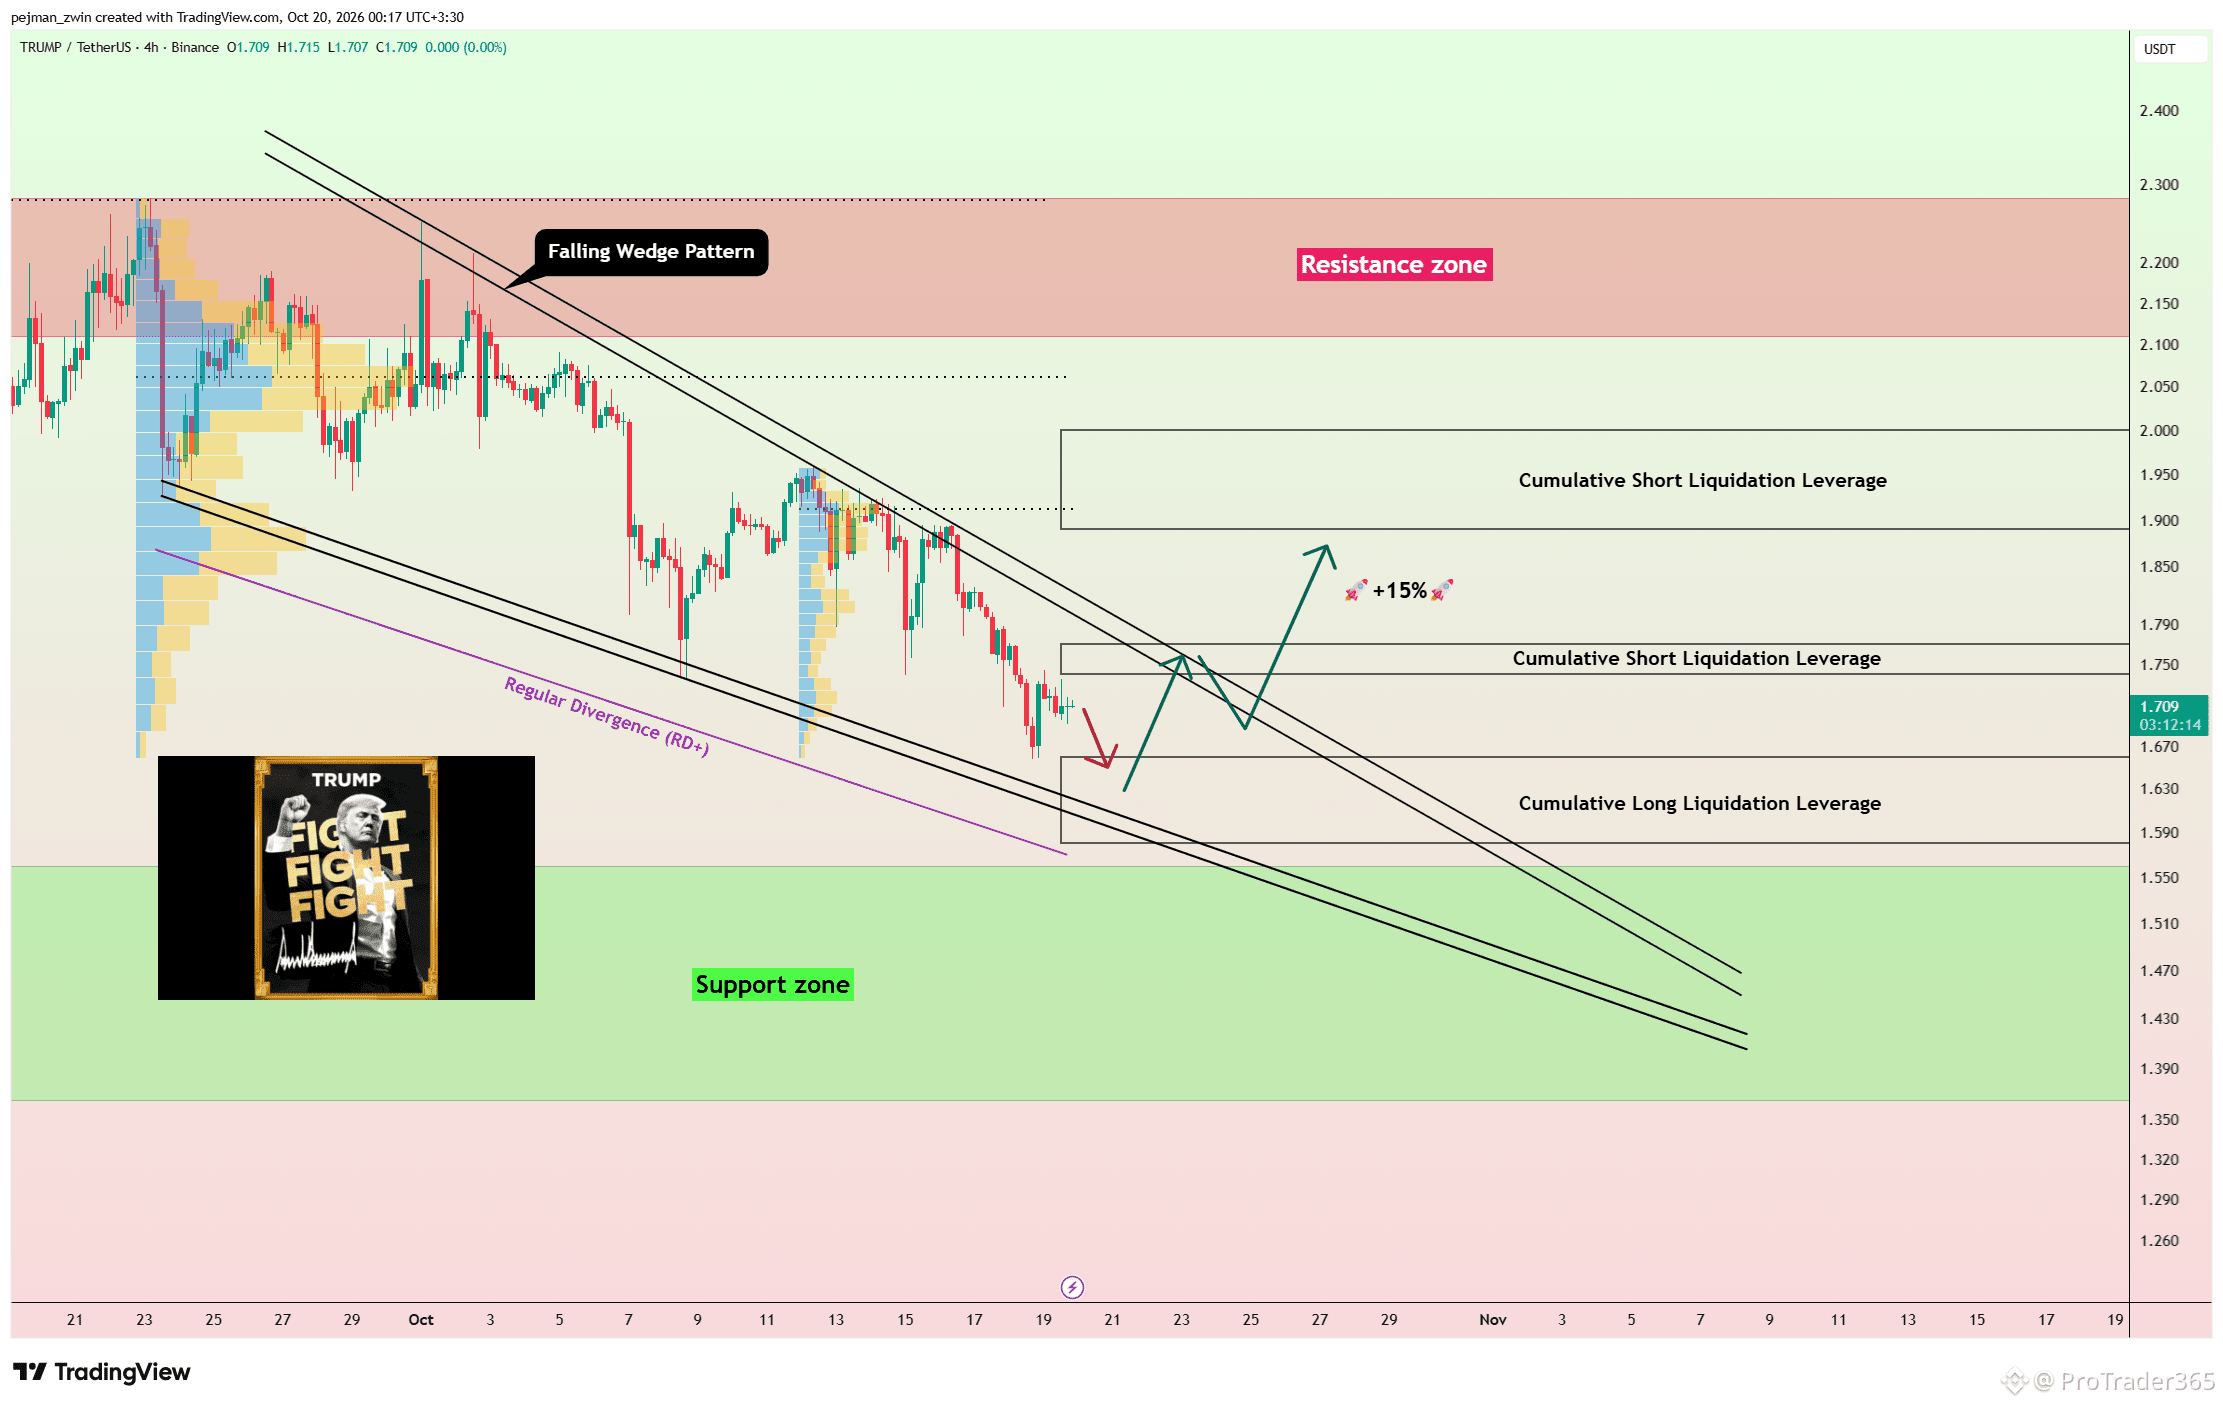
46
·
--
Gold Rejects the Descending Channel — Is $4,113 the Next Target? $XAUt appears to have failed to break above the upper trendline of the Descending Channel, while the latest 1-hour candle is approaching a close below the key $4,167 and $4,156 trading levels. Technical Analysis The rejection from the upper trendline suggests buyers have not yet gained enough strength to confirm a bullish breakout. A confirmed 1-hour candle close below $4,167 and $4,156 could provide additional bearish confirmation. I expect Gold to continue lower toward $4,125 and then $4,113, while another test of the Support Zone($4,067-$4,122) remains possible. If this Support Zone fails, the probability of a deeper correction could increase significantly. Stop Loss(SL): $4,192(Worst) Which level will Gold reach first: $4,113 or $4,192? If you found this analysis useful, follow for more. #Gold
Gold Rejects the Descending Channel — Is $4,113 the Next Target? $XAUt appears to have failed to break above the upper trendline of the Descending Channel, while the latest 1-hour candle is approaching a close below the key $4,167 and $4,156 trading levels. Technical Analysis The rejection from the upper trendline suggests buyers have not yet gained enough strength to confirm a bullish breakout. A confirmed 1-hour candle close below $4,167 and $4,156 could provide additional bearish confirmation. I expect Gold to continue lower toward $4,125 and then $4,113, while another test of the Support Zone($4,067-$4,122) remains possible. If this Support Zone fails, the probability of a deeper correction could increase significantly. Stop Loss(SL): $4,192(Worst) Which level will Gold reach first: $4,113 or $4,192? If you found this analysis useful, follow for more. #Gold
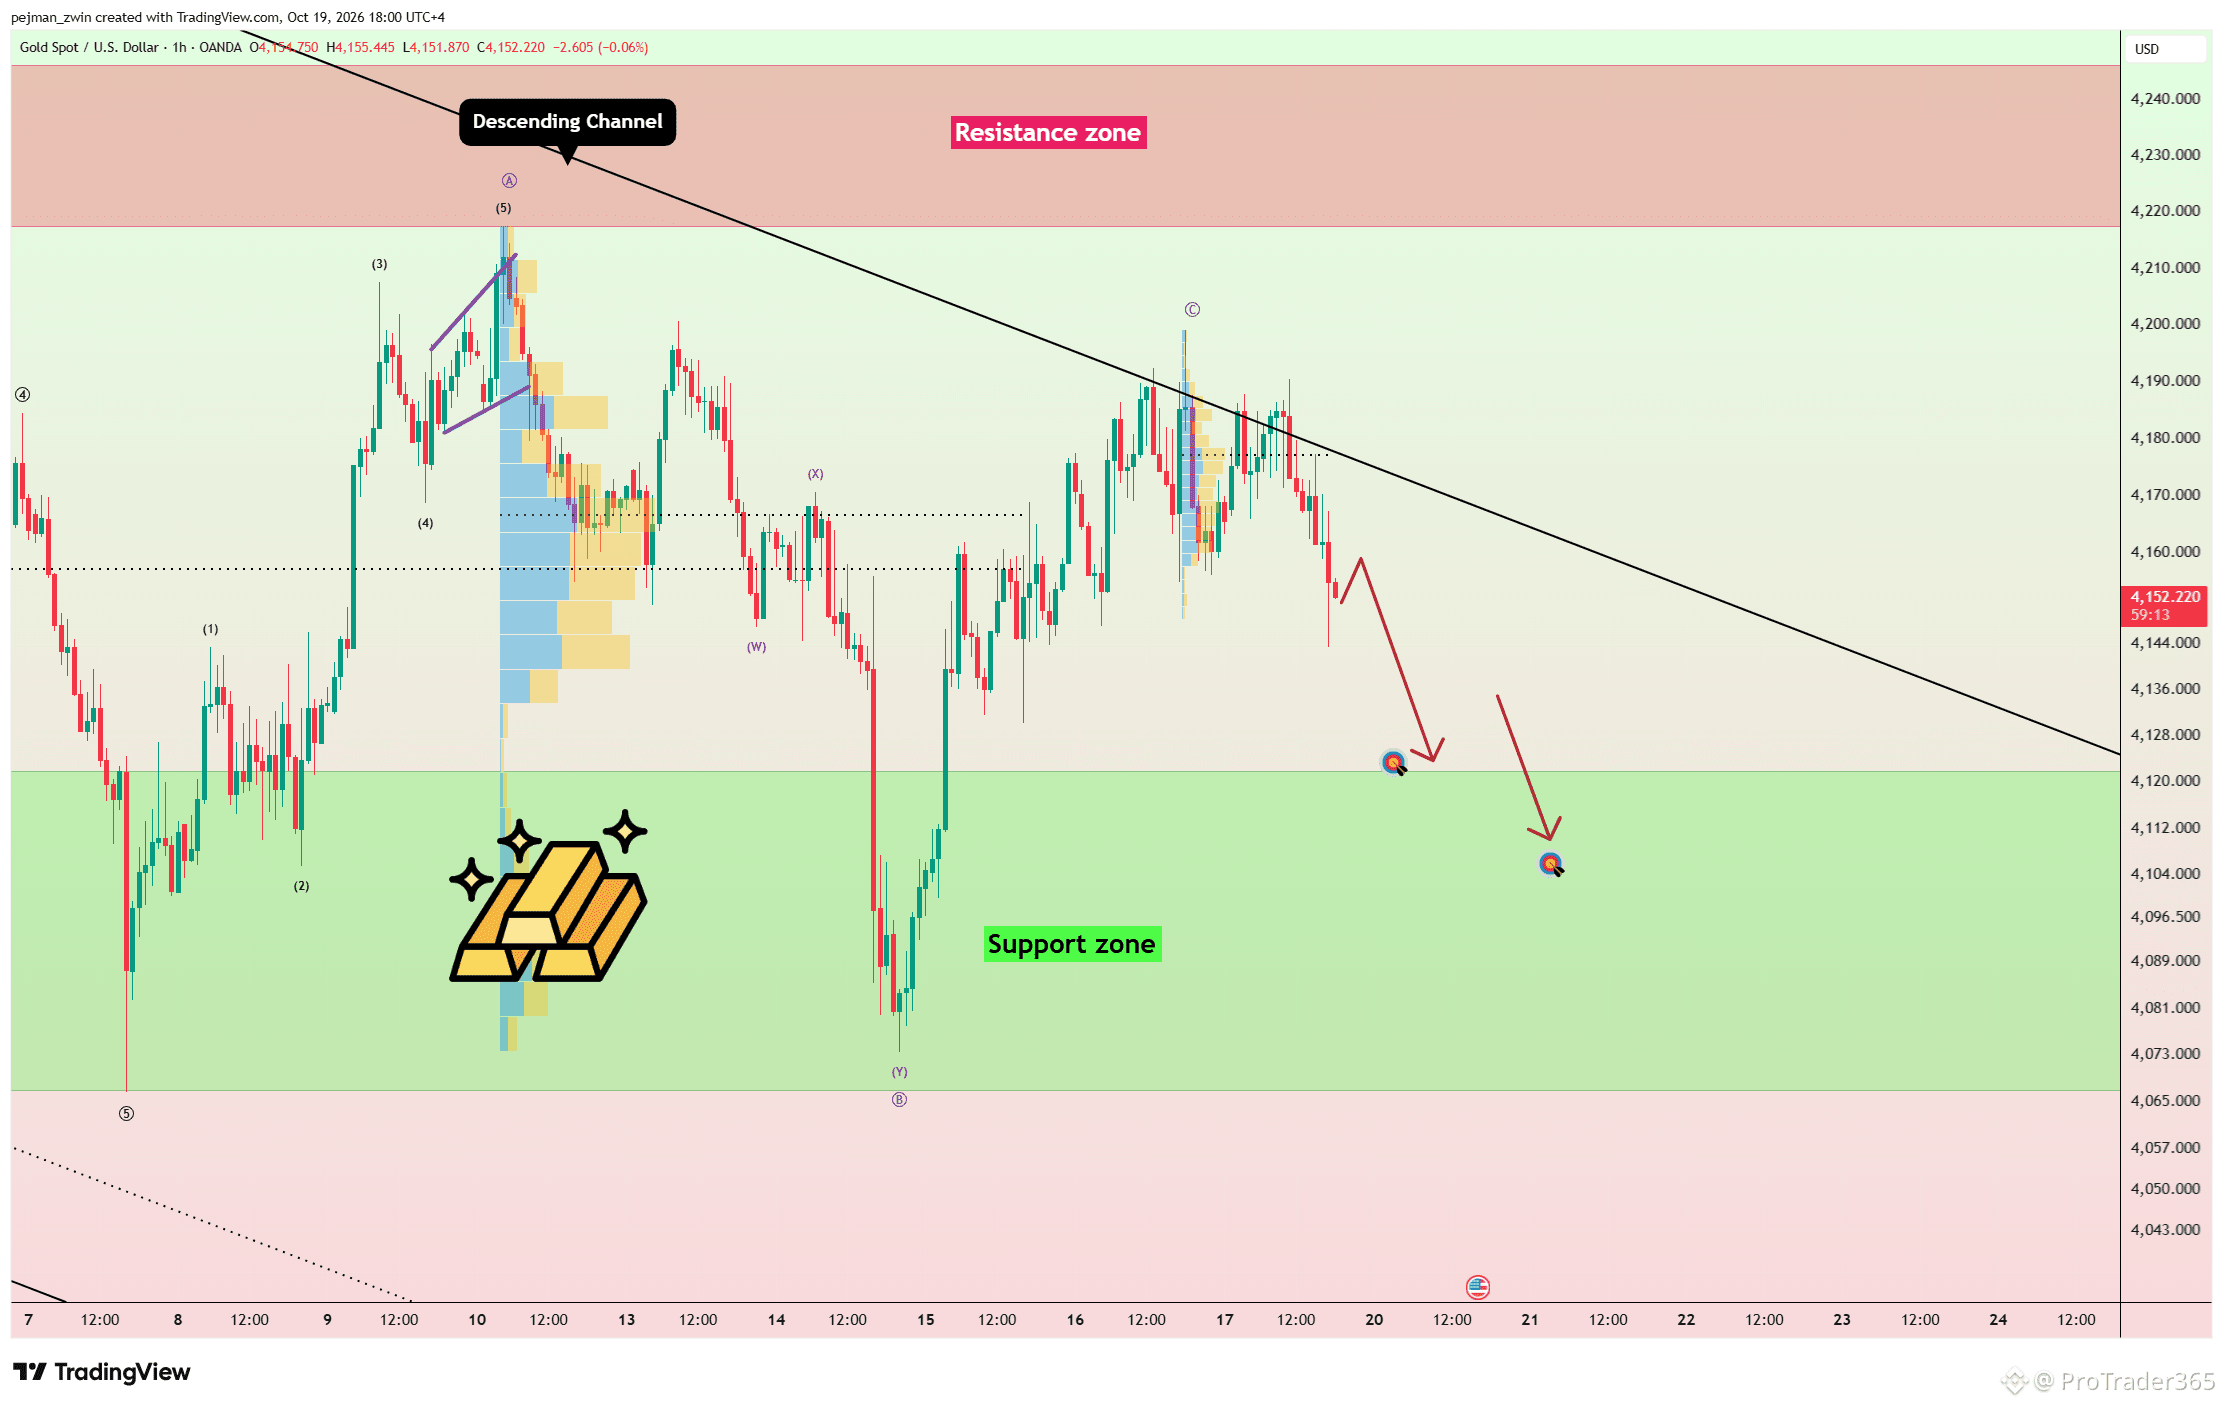
48
·
--
$BTC Rejected at Resistance — Is Another Move Below $80,000 Coming? Bitcoin resumed its bullish move as financial markets opened, but selling pressure returned near the Resistance Zone($81,950-$82,960), the Resistance Lines, and the key $83,350 trading level. Technical Analysis From an Elliott Wave perspective, Bitcoin appears to have completed a Zigzag Correction(A-B-C), suggesting that another Bearish Wave could now begin. I expect Bitcoin to continue lower. A temporary reaction could develop near $81,550, but renewed selling pressure may then push price toward the Cumulative Long Liquidation Leverage($79,650-$80,800). First Take Profit(TP): $81,823 Second Take Profit(TP): ($79,650-$80,800) Stop Loss(SL): $83,420(Worst) Middle East geopolitical developments remain an additional volatility risk. Which level will Bitcoin reach first: $79,650-$80,800 or $83,420? If you found this analysis useful, follow for more. #BTC Price Analysis# #Bitcoin Price Prediction: What is Bitcoins next move?#
$BTC Rejected at Resistance — Is Another Move Below $80,000 Coming? Bitcoin resumed its bullish move as financial markets opened, but selling pressure returned near the Resistance Zone($81,950-$82,960), the Resistance Lines, and the key $83,350 trading level. Technical Analysis From an Elliott Wave perspective, Bitcoin appears to have completed a Zigzag Correction(A-B-C), suggesting that another Bearish Wave could now begin. I expect Bitcoin to continue lower. A temporary reaction could develop near $81,550, but renewed selling pressure may then push price toward the Cumulative Long Liquidation Leverage($79,650-$80,800). First Take Profit(TP): $81,823 Second Take Profit(TP): ($79,650-$80,800) Stop Loss(SL): $83,420(Worst) Middle East geopolitical developments remain an additional volatility risk. Which level will Bitcoin reach first: $79,650-$80,800 or $83,420? If you found this analysis useful, follow for more. #BTC Price Analysis# #Bitcoin Price Prediction: What is Bitcoins next move?#
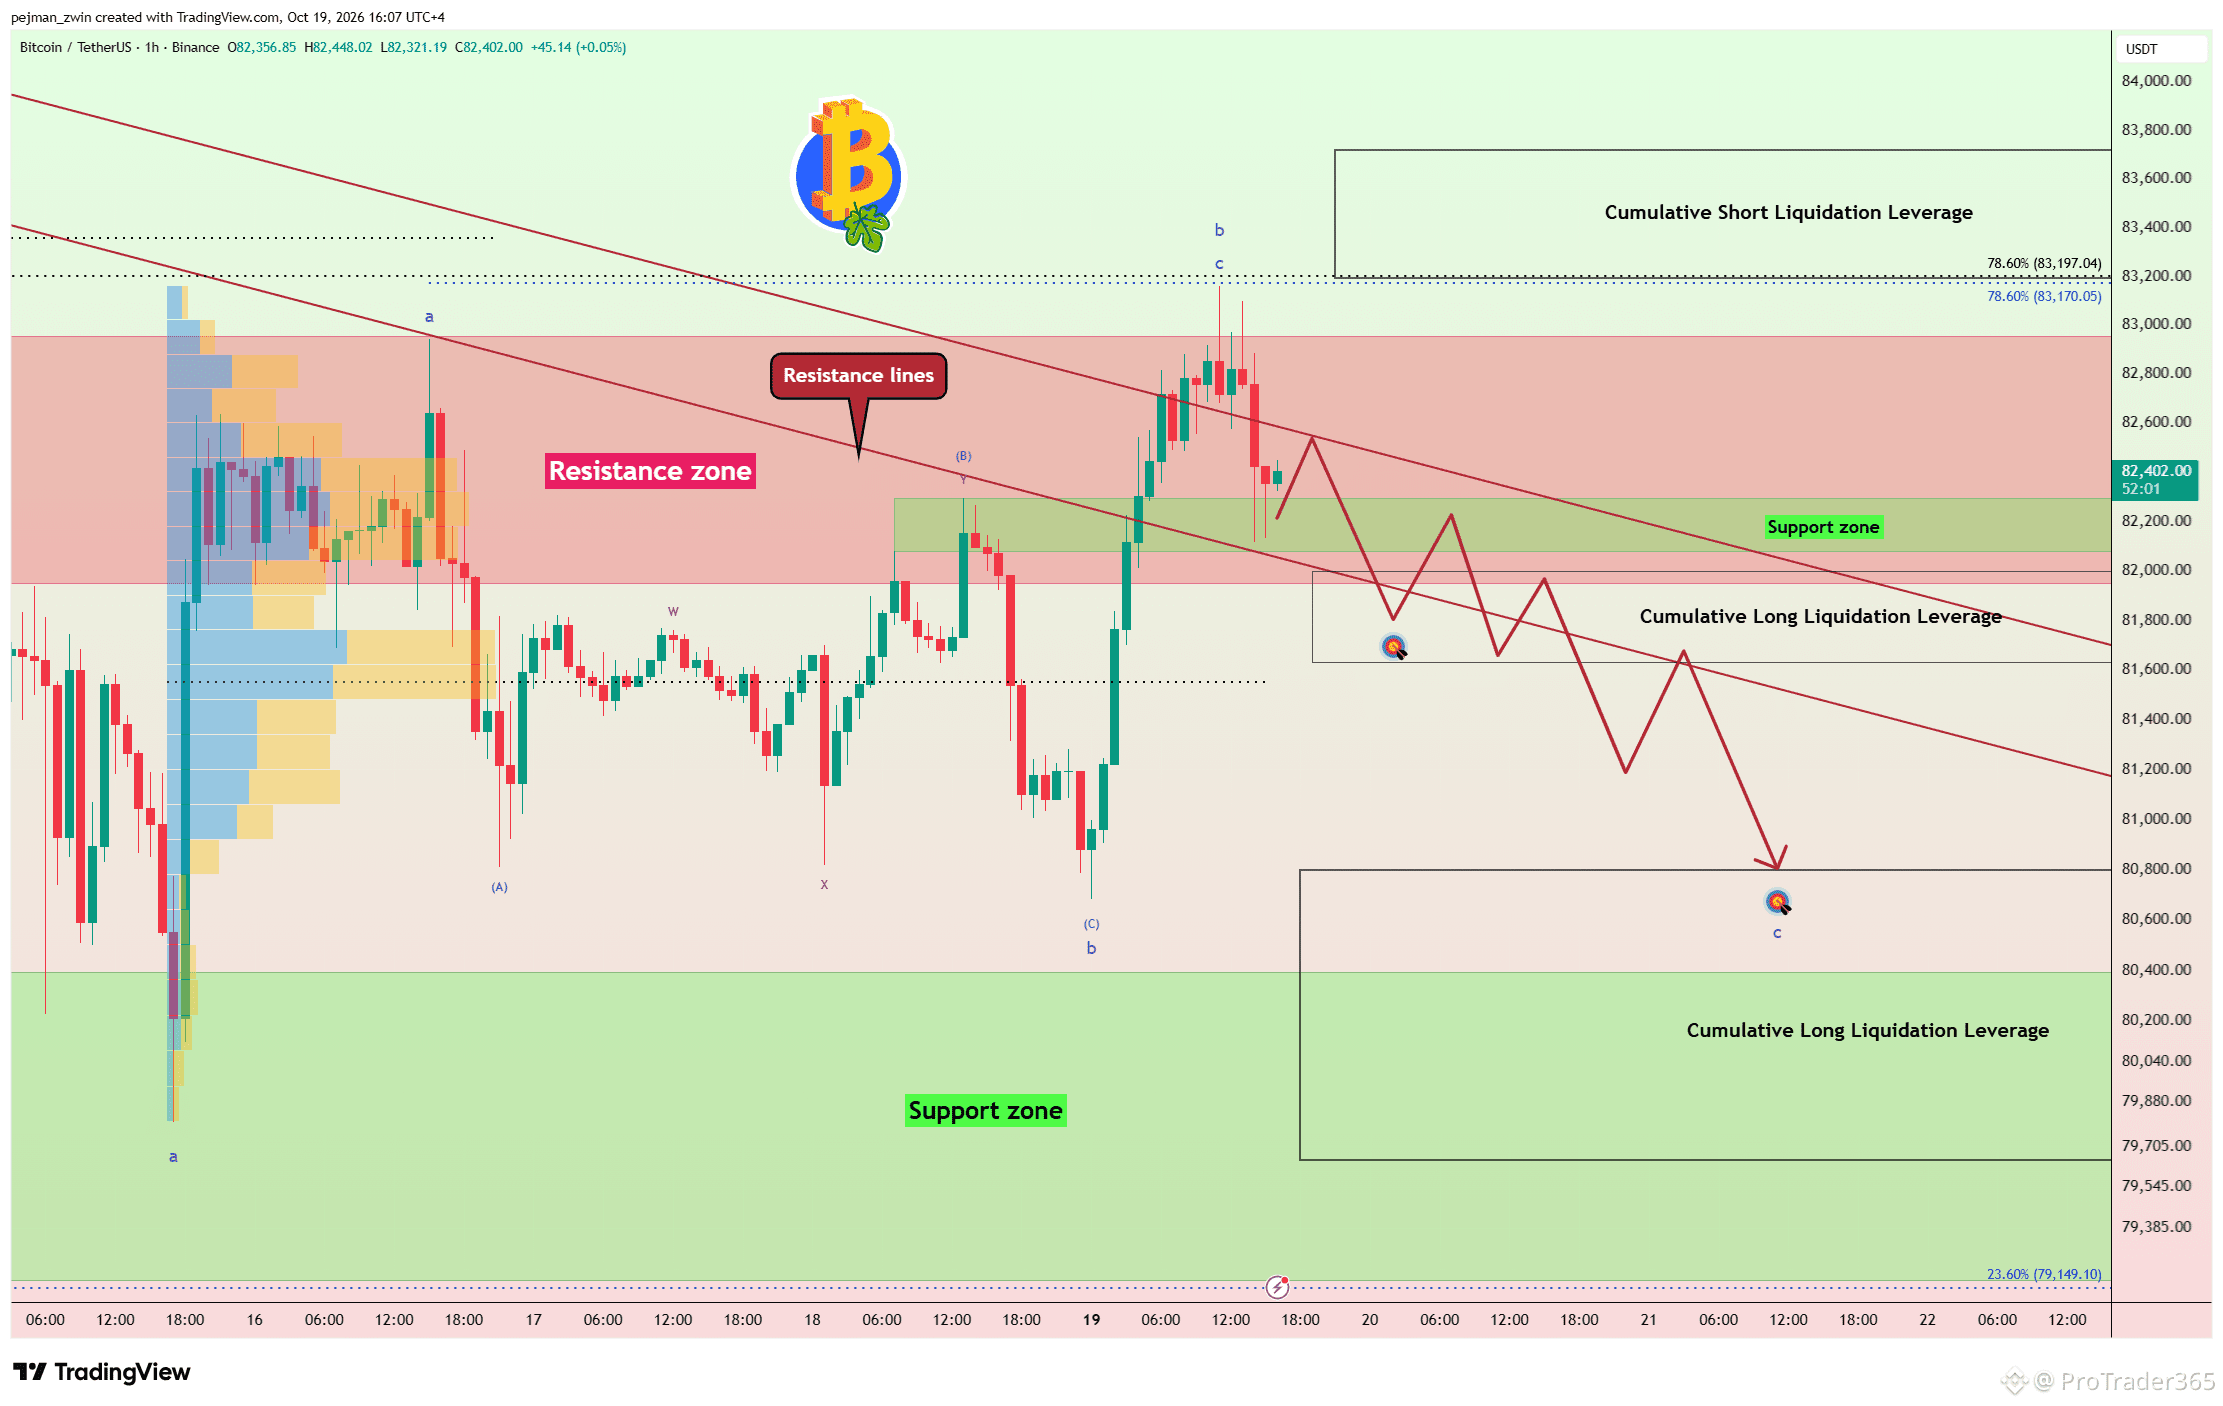
66
·
--
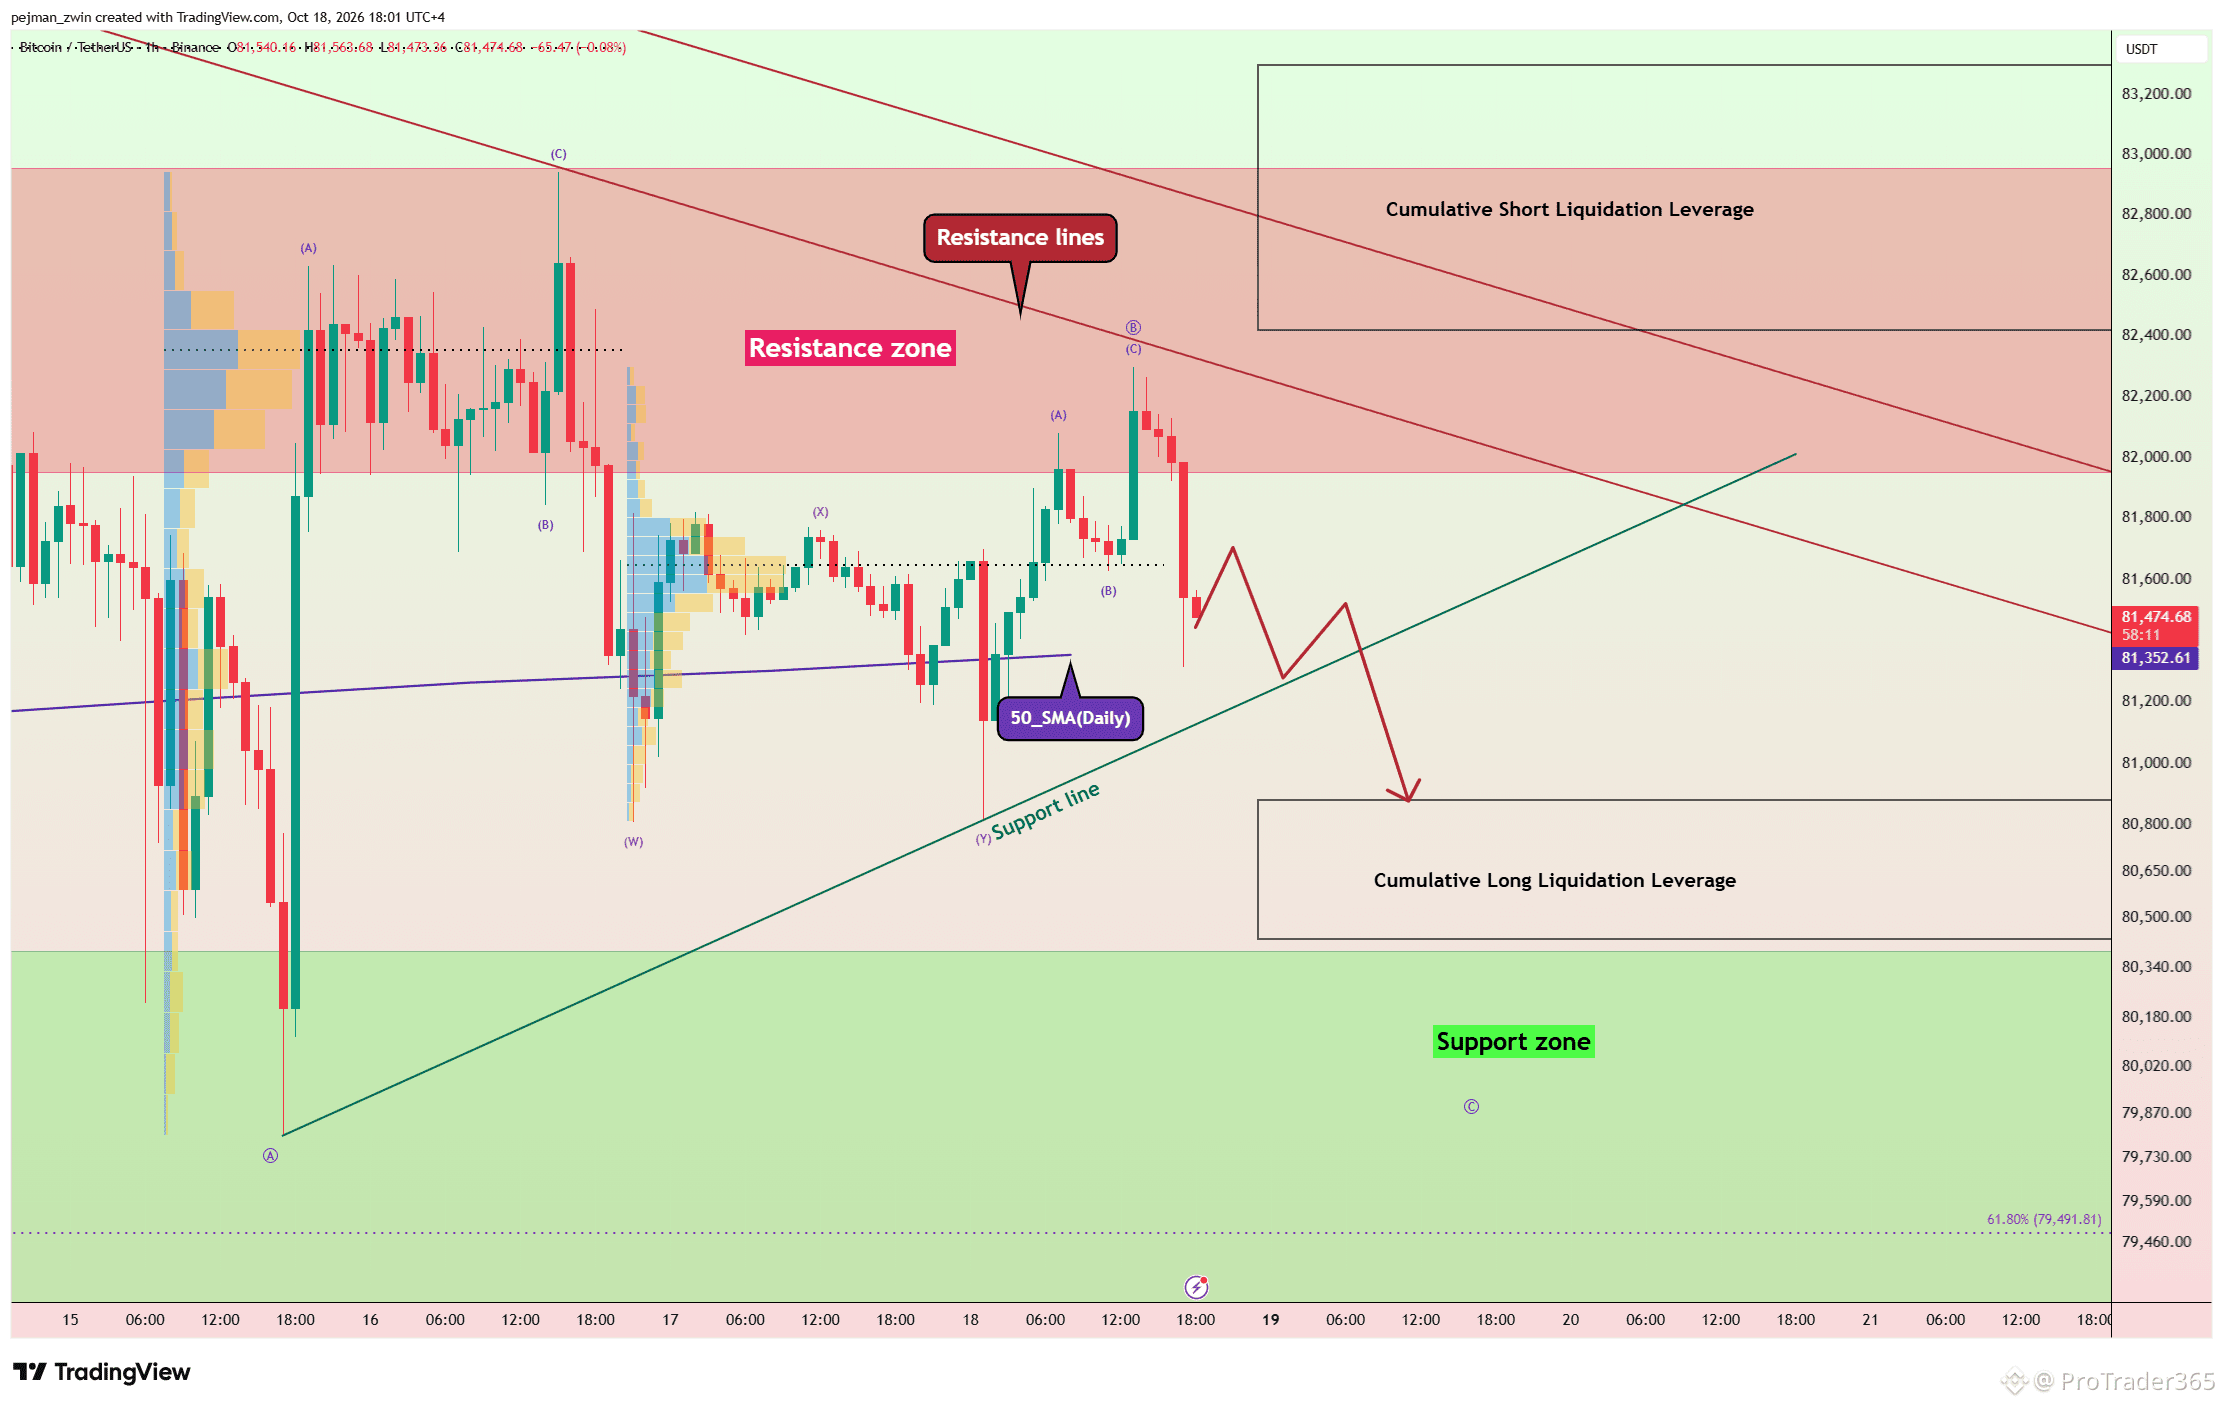
$BTC Rejected Again — Is a Break Below $80,000 Coming Next? Bitcoin started to move lower again after entering the Resistance Zone($81,950-$82,960) and reacting to a key trading level. More importantly, the 1-hour candle closed below the key $81,650 trading level, increasing the probability that Bitcoin could break the current Support Line and potentially lose the 50_SMA(Daily) this time. If the bearish structure continues, I expect the decline to extend toward the Cumulative Long Liquidation Leverage($80,430-$80,880). With U.S. financial markets approaching their opening hours, volatility and momentum could increase significantly. For now, the 50_SMA(Daily) remains critical. A confirmed breakdown could increase the probability of a move below the psychological $80,000 level. Can buyers defend the 50_SMA(Daily), or will Bitcoin break below $80,000? If you found this analysis useful, follow for more. #BTC Price Analysis#
$BTC Rejected Again — Is a Break Below $80,000 Coming Next? Bitcoin started to move lower again after entering the Resistance Zone($81,950-$82,960) and reacting to a key trading level. More importantly, the 1-hour candle closed below the key $81,650 trading level, increasing the probability that Bitcoin could break the current Support Line and potentially lose the 50_SMA(Daily) this time. If the bearish structure continues, I expect the decline to extend toward the Cumulative Long Liquidation Leverage($80,430-$80,880). With U.S. financial markets approaching their opening hours, volatility and momentum could increase significantly. For now, the 50_SMA(Daily) remains critical. A confirmed breakdown could increase the probability of a move below the psychological $80,000 level. Can buyers defend the 50_SMA(Daily), or will Bitcoin break below $80,000? If you found this analysis useful, follow for more. #BTC Price Analysis#
56
·
--
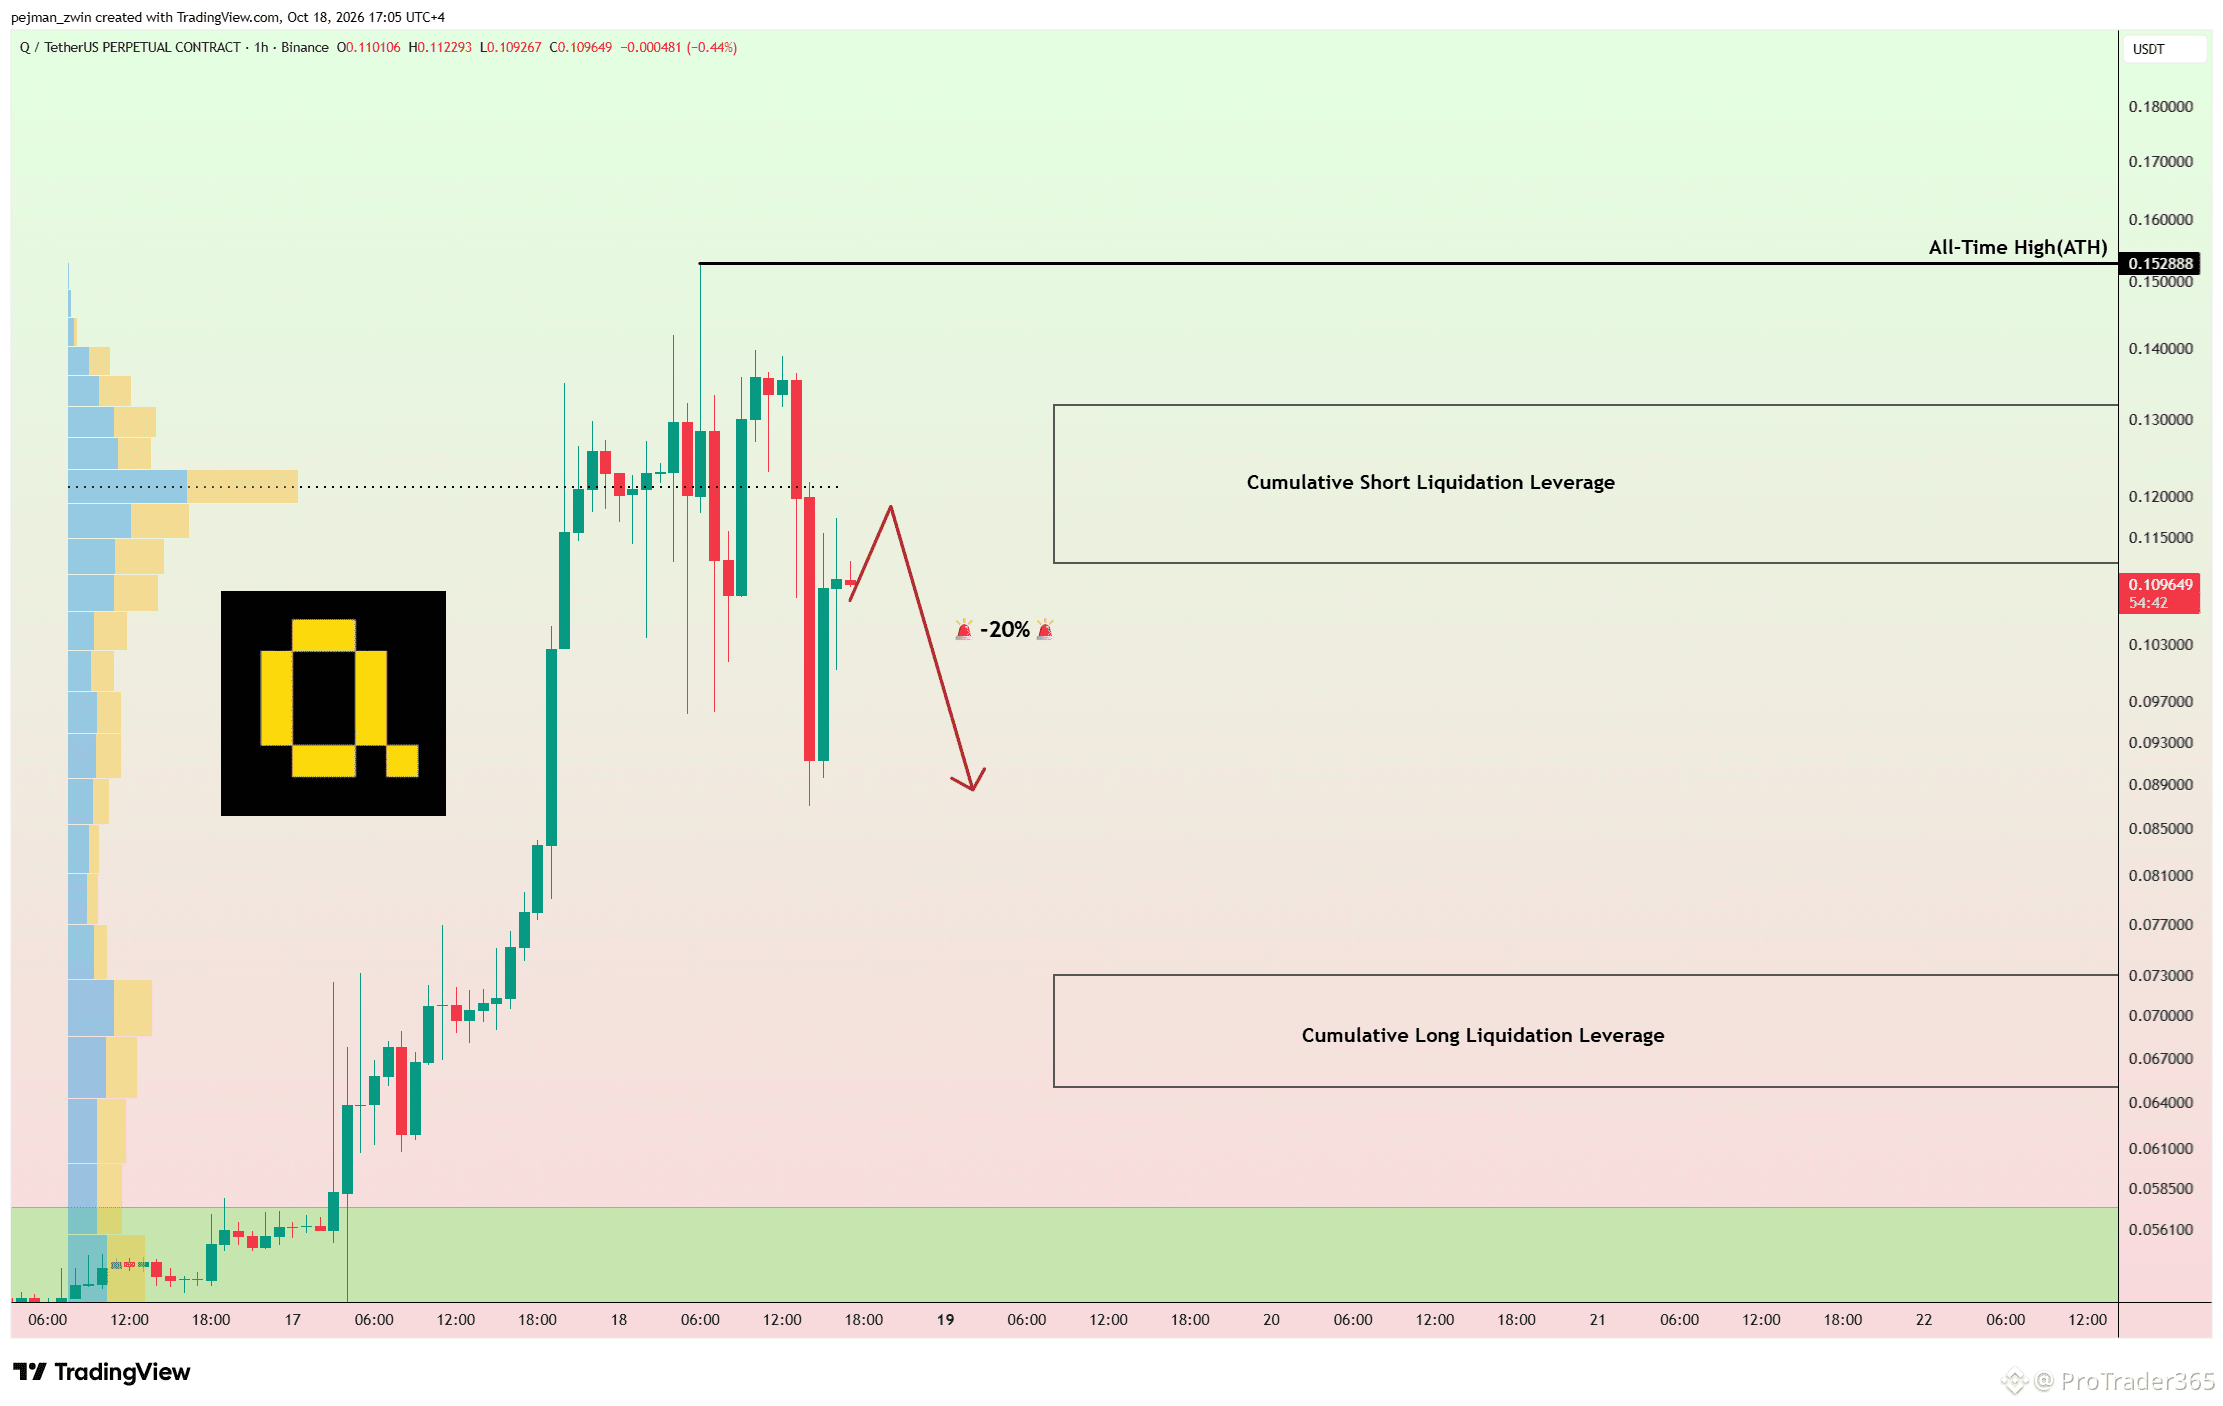
$Q Surges 100% — Is a 20% Correction Coming Next? Quack AI has gained more than 100% over the past 24 hours, driven mainly by renewed interest in AI-related cryptocurrencies, rising trading volume, FOMO, speculative buying, and a potential Short Squeeze. While the previous Bithumb listing and Q402 payment infrastructure provide fundamental context, no major new partnership, listing, or product launch has been confirmed as the direct catalyst behind this rally. Technical Analysis On the 1-hour timeframe, analysis is more challenging because Q has repeatedly printed new ATHs, leaving limited historical price structure and significant market noise. Q is currently trading near the Cumulative Short Liquidation Leverage($0.112-$0.129) and the key $0.121 trading level. With downside momentum strengthening, I expect another test of the previous intraday low. Continued selling pressure could trigger a correction of more than 20%. Given the extreme volatility, waiting for a clear trigger and using strict risk management remain essential. Can Q extend its rally, or is a deeper correction beginning? If you found this analysis useful, follow for more. #AI Agents 🤖#
$Q Surges 100% — Is a 20% Correction Coming Next? Quack AI has gained more than 100% over the past 24 hours, driven mainly by renewed interest in AI-related cryptocurrencies, rising trading volume, FOMO, speculative buying, and a potential Short Squeeze. While the previous Bithumb listing and Q402 payment infrastructure provide fundamental context, no major new partnership, listing, or product launch has been confirmed as the direct catalyst behind this rally. Technical Analysis On the 1-hour timeframe, analysis is more challenging because Q has repeatedly printed new ATHs, leaving limited historical price structure and significant market noise. Q is currently trading near the Cumulative Short Liquidation Leverage($0.112-$0.129) and the key $0.121 trading level. With downside momentum strengthening, I expect another test of the previous intraday low. Continued selling pressure could trigger a correction of more than 20%. Given the extreme volatility, waiting for a clear trigger and using strict risk management remain essential. Can Q extend its rally, or is a deeper correction beginning? If you found this analysis useful, follow for more. #AI Agents 🤖#
78
·
--
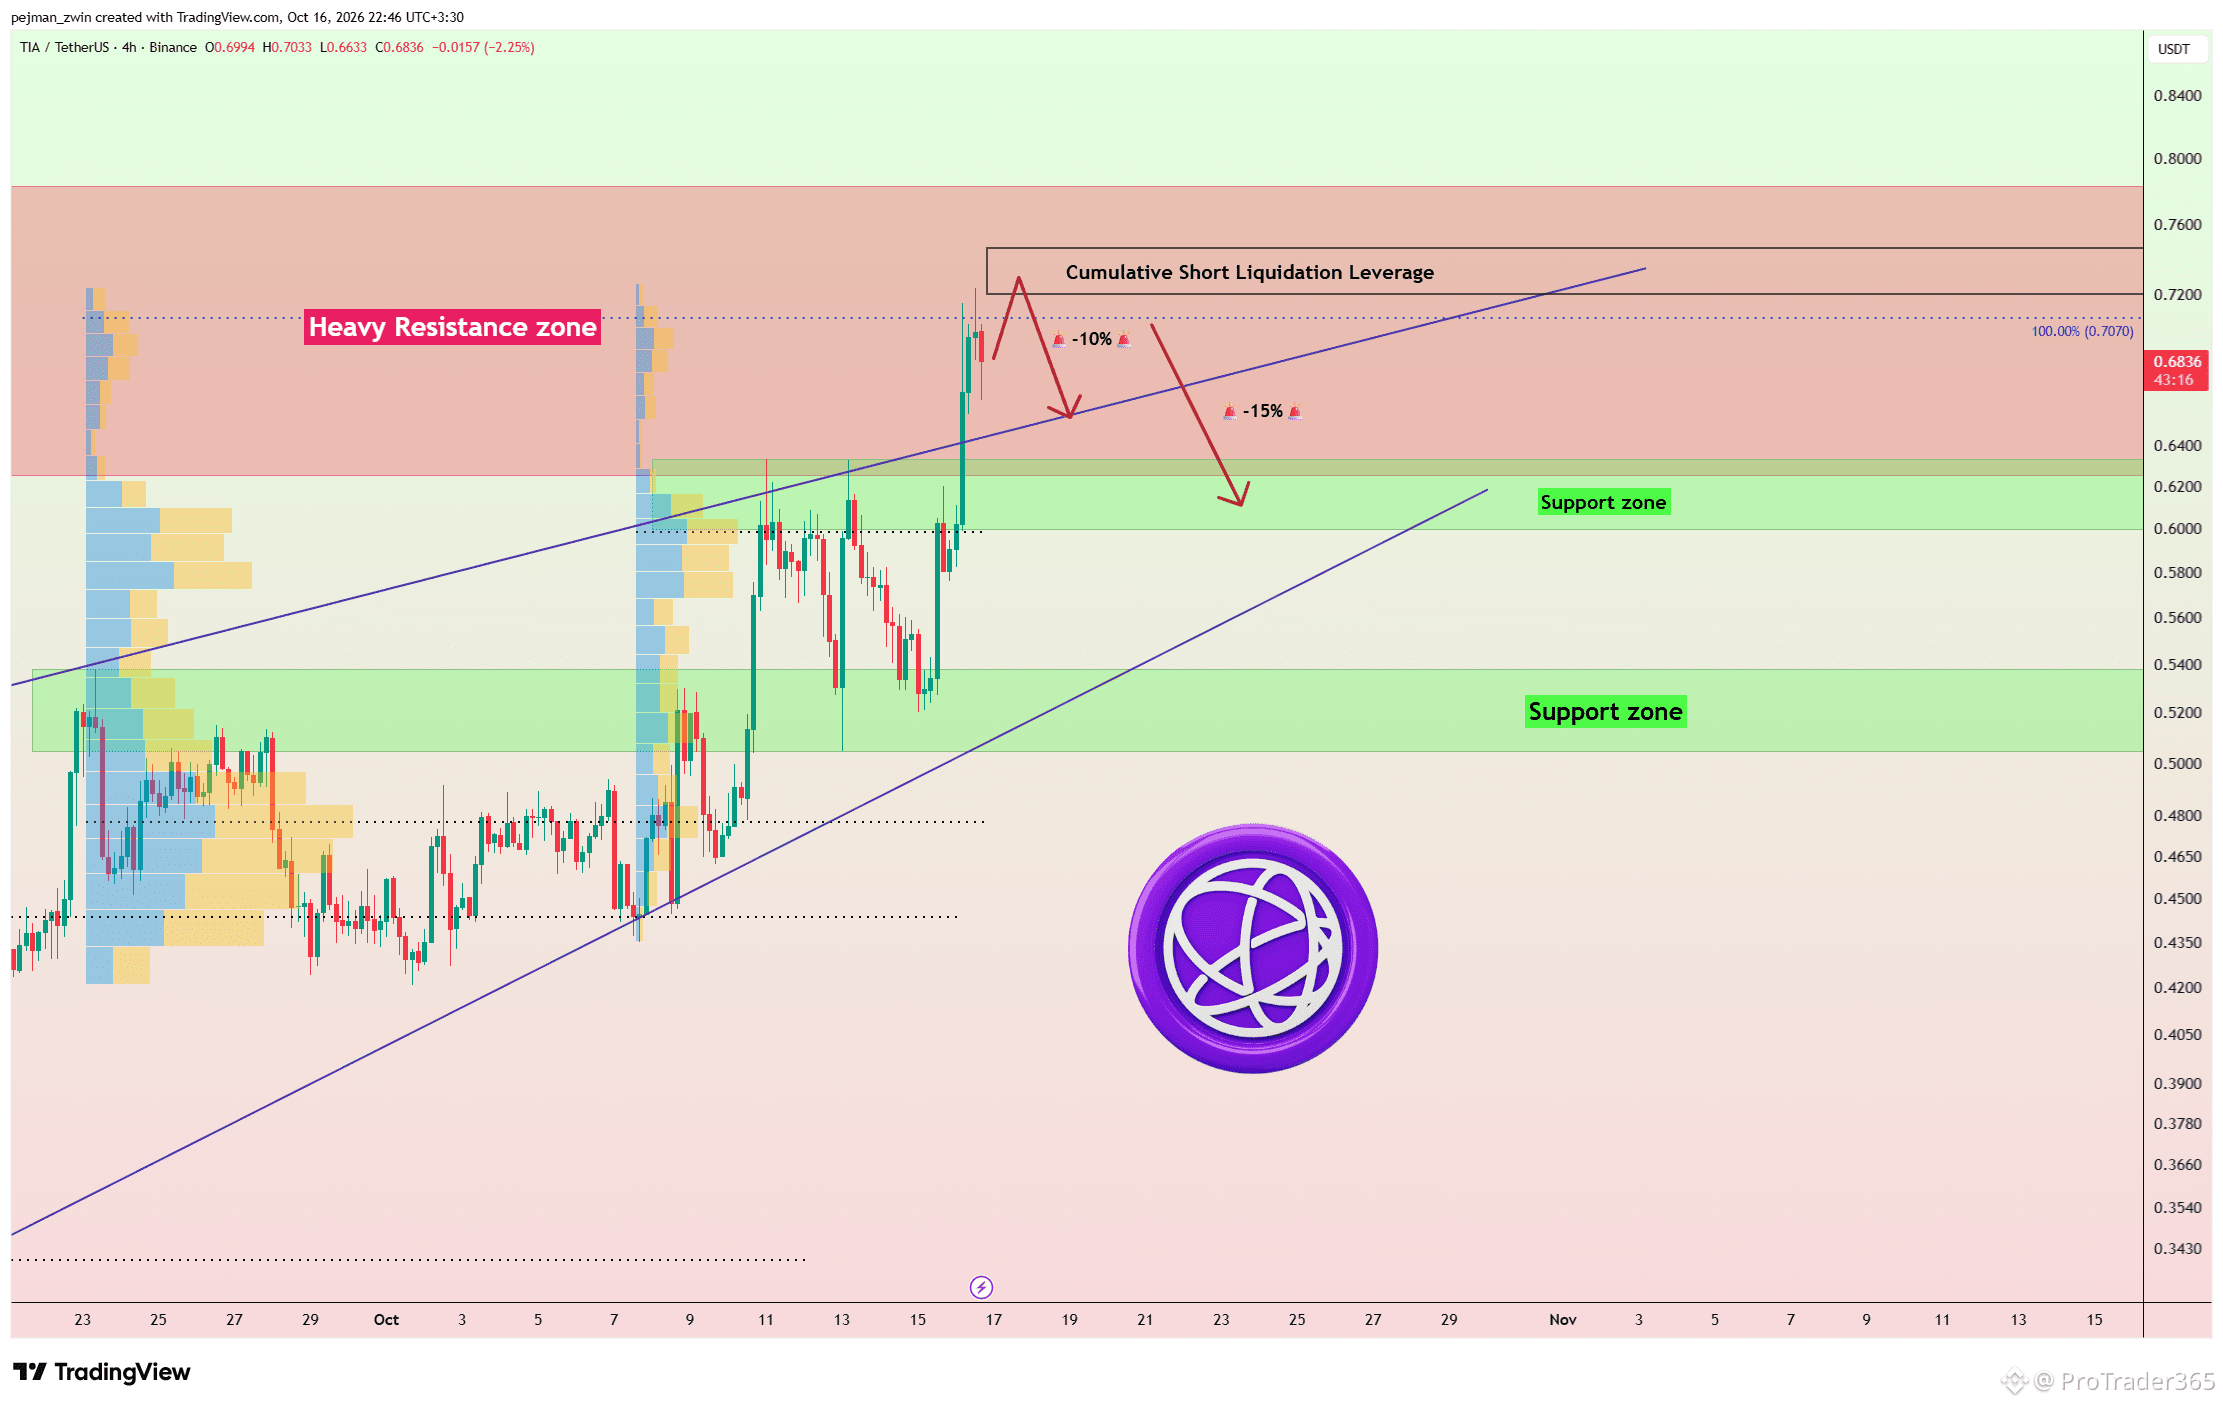
$TIA Surges 30% — Is a 10% Correction Coming Next? Celestia has gained more than 30% over the past 24 hours, but price is now entering an important resistance structure. Technical Analysis On the 4-hour timeframe, TIA has entered the Heavy Resistance Zone($0.625-$0.783) and is approaching the Cumulative Short Liquidation Leverage($0.720-$0.746). From this area, I expect a correction of at least 10% toward the key $0.65 trading level. If selling pressure strengthens, the decline could extend toward the Support Zone($0.600-$0.634), with $0.600 becoming the next critical trading level. For now, the reaction from the current Heavy Resistance Zone and short-liquidation area will determine whether the rally can continue or a deeper correction begins. Can TIA break through this resistance, or will sellers push it toward $0.65 and $0.60? If you found this analysis useful, follow for more.
$TIA Surges 30% — Is a 10% Correction Coming Next? Celestia has gained more than 30% over the past 24 hours, but price is now entering an important resistance structure. Technical Analysis On the 4-hour timeframe, TIA has entered the Heavy Resistance Zone($0.625-$0.783) and is approaching the Cumulative Short Liquidation Leverage($0.720-$0.746). From this area, I expect a correction of at least 10% toward the key $0.65 trading level. If selling pressure strengthens, the decline could extend toward the Support Zone($0.600-$0.634), with $0.600 becoming the next critical trading level. For now, the reaction from the current Heavy Resistance Zone and short-liquidation area will determine whether the rally can continue or a deeper correction begins. Can TIA break through this resistance, or will sellers push it toward $0.65 and $0.60? If you found this analysis useful, follow for more.
43
·
--
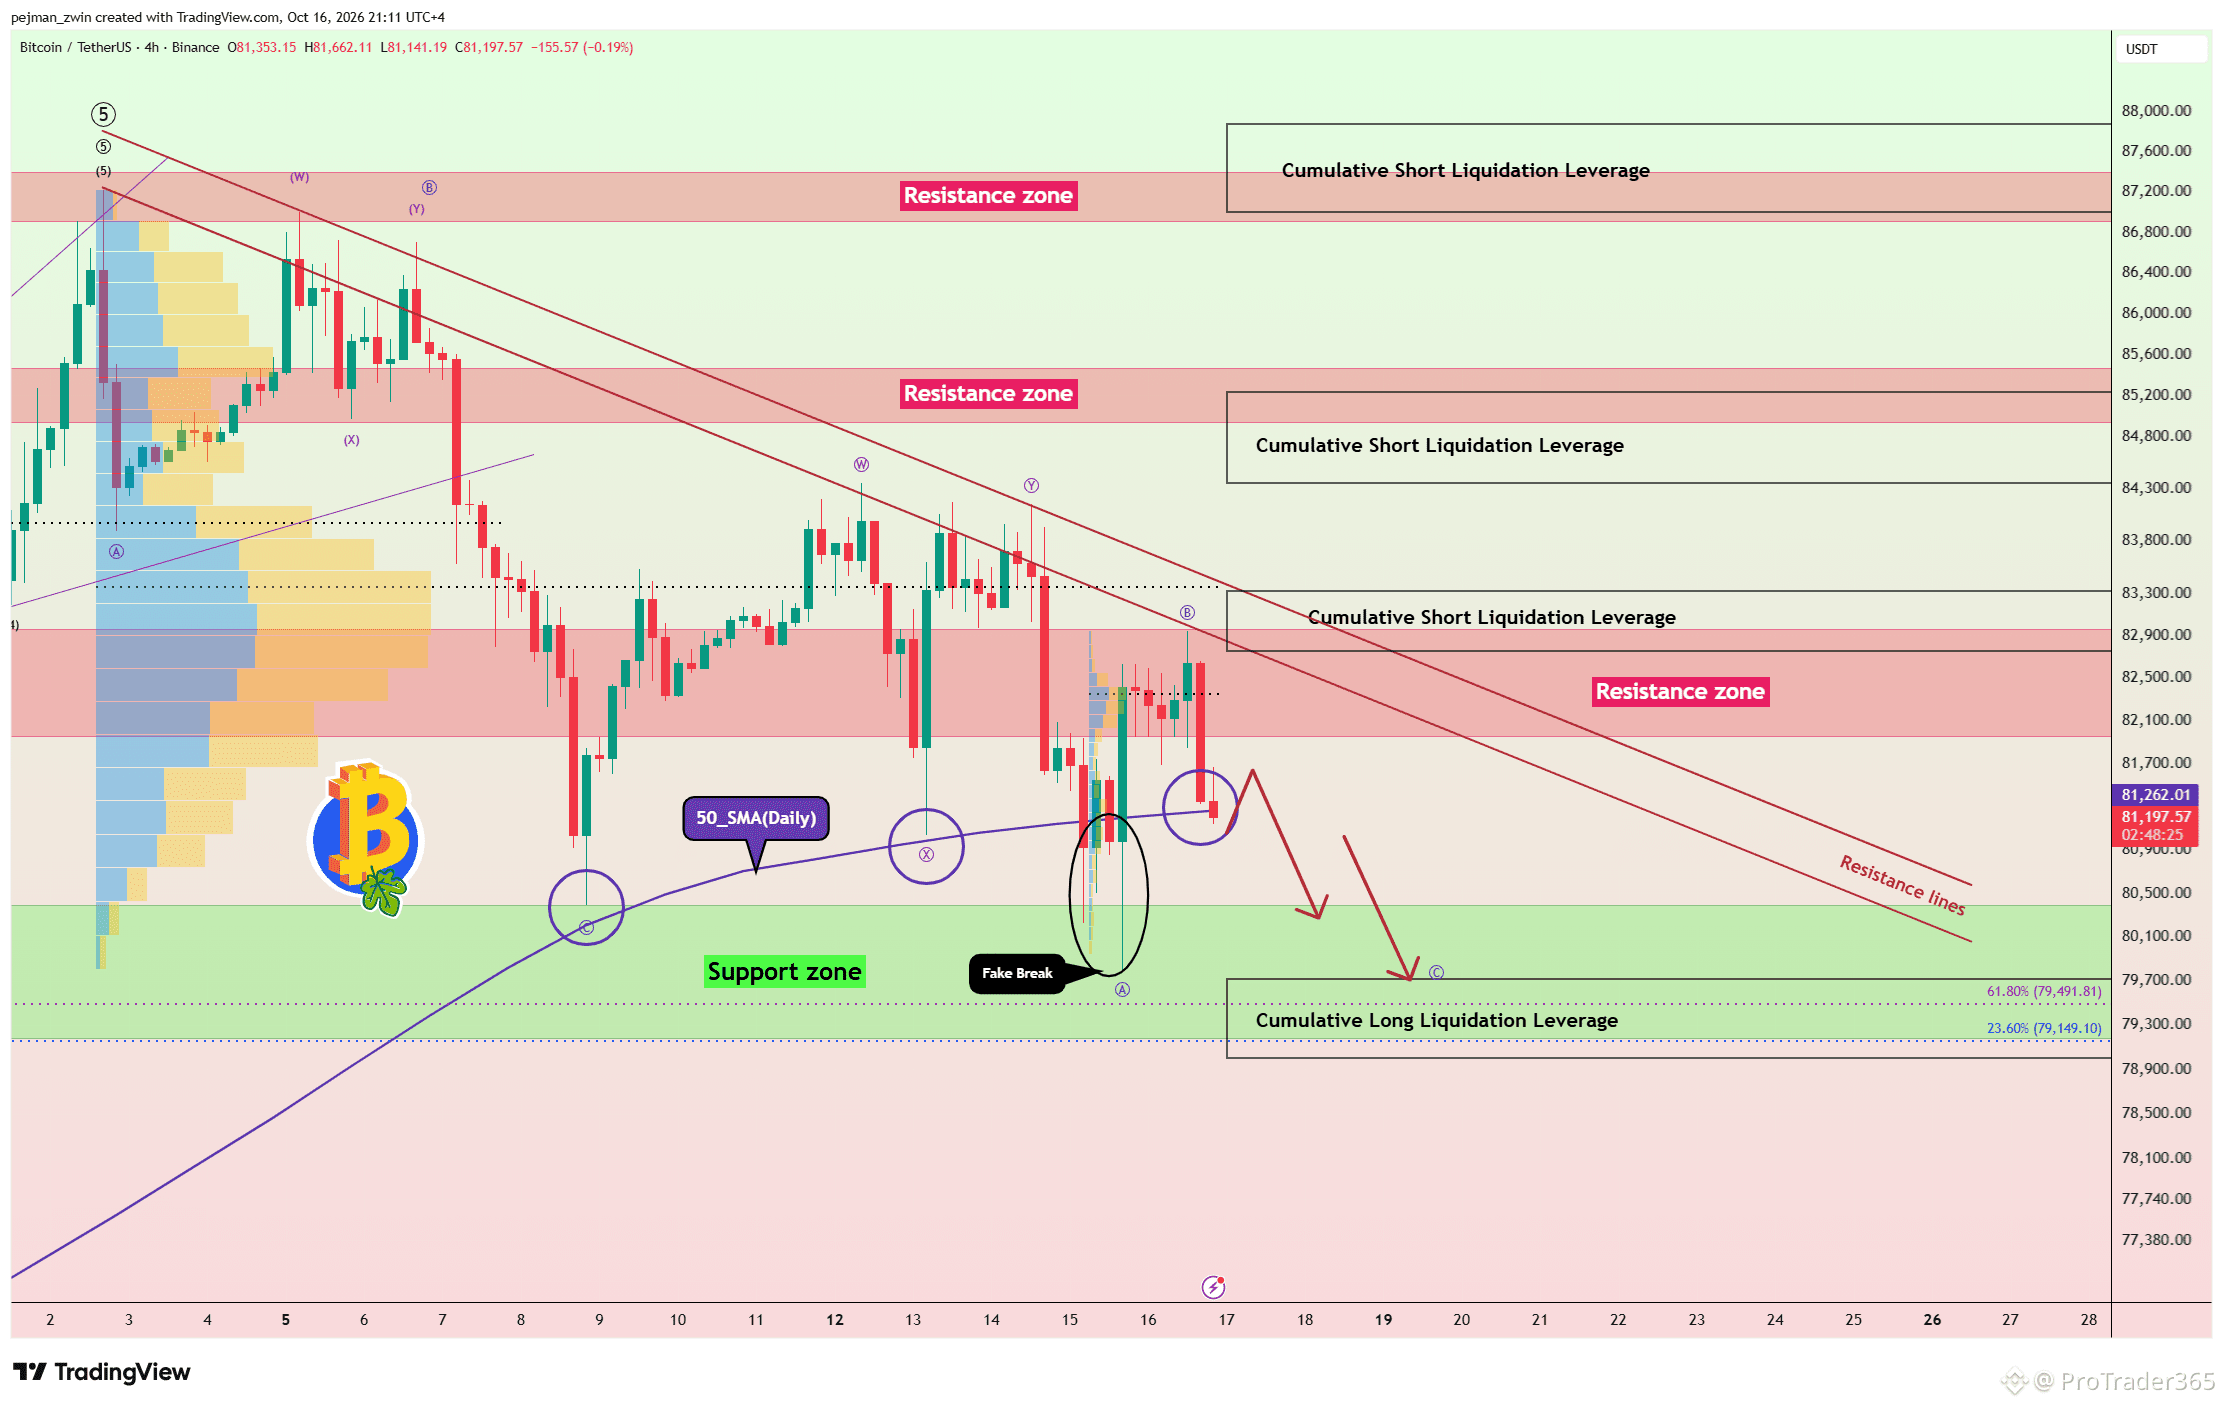
$BTC Tests the 50_SMA(Daily) Again — Is a Break Below $80,000 Next? Bitcoin’s bullish move yesterday failed to break the Resistance Zone($81,950-$82,960), while renewed weakness in the S&P 500 added selling pressure across the crypto market. Technical Analysis Bitcoin is now testing the 50_SMA(Daily) for the fourth time. Although yesterday’s move below it resulted in a False Breakout, another breakdown attempt is underway. From an Elliott Wave perspective, Bitcoin appears to be preparing for another Bearish Wave. I expect a break below the 50_SMA(Daily) and another move toward the Support Zone($79,180-$80,400). Stronger bearish momentum could extend the decline toward the Cumulative Long Liquidation Leverage($79,000-$79,720). Targets: $80,320 / ($79,000-$79,720) Stop Loss(SL): $82,700(Worst) Can Bitcoin defend the 50_SMA(Daily), or will sellers push it below $80,000? If you found this analysis useful, follow for more.
$BTC Tests the 50_SMA(Daily) Again — Is a Break Below $80,000 Next? Bitcoin’s bullish move yesterday failed to break the Resistance Zone($81,950-$82,960), while renewed weakness in the S&P 500 added selling pressure across the crypto market. Technical Analysis Bitcoin is now testing the 50_SMA(Daily) for the fourth time. Although yesterday’s move below it resulted in a False Breakout, another breakdown attempt is underway. From an Elliott Wave perspective, Bitcoin appears to be preparing for another Bearish Wave. I expect a break below the 50_SMA(Daily) and another move toward the Support Zone($79,180-$80,400). Stronger bearish momentum could extend the decline toward the Cumulative Long Liquidation Leverage($79,000-$79,720). Targets: $80,320 / ($79,000-$79,720) Stop Loss(SL): $82,700(Worst) Can Bitcoin defend the 50_SMA(Daily), or will sellers push it below $80,000? If you found this analysis useful, follow for more.
59
·
--
$BTC Fake Breakout — Can Bitcoin Rebound Toward $83,300? Bitcoin has been trading inside a Range over the past 24 hours on the 15-minute timeframe and even created a Fake Breakout above the resistance area. However, on the higher timeframe, Bitcoin is still trading inside the Heavy Resistance Zone($81,950-$82,950). I expect Bitcoin to potentially start another upward move from the confluence of the Fibonacci level, the Support Zone($81,580-$82,000), the Cumulative Long Liquidation Leverage($81,230-$81,620), and the key $81,780 trading level. The first important upside level is $82,340. A confirmed breakout above it could increase the probability of breaking the Resistance Zone($82,430-$82,630) and extending toward the Cumulative Short Liquidation Leverage($83,000-$83,300). Can Bitcoin defend this support structure and reach $83,300? If you found this analysis useful, follow for more. #BTC Price Analysis#
$BTC Fake Breakout — Can Bitcoin Rebound Toward $83,300? Bitcoin has been trading inside a Range over the past 24 hours on the 15-minute timeframe and even created a Fake Breakout above the resistance area. However, on the higher timeframe, Bitcoin is still trading inside the Heavy Resistance Zone($81,950-$82,950). I expect Bitcoin to potentially start another upward move from the confluence of the Fibonacci level, the Support Zone($81,580-$82,000), the Cumulative Long Liquidation Leverage($81,230-$81,620), and the key $81,780 trading level. The first important upside level is $82,340. A confirmed breakout above it could increase the probability of breaking the Resistance Zone($82,430-$82,630) and extending toward the Cumulative Short Liquidation Leverage($83,000-$83,300). Can Bitcoin defend this support structure and reach $83,300? If you found this analysis useful, follow for more. #BTC Price Analysis#
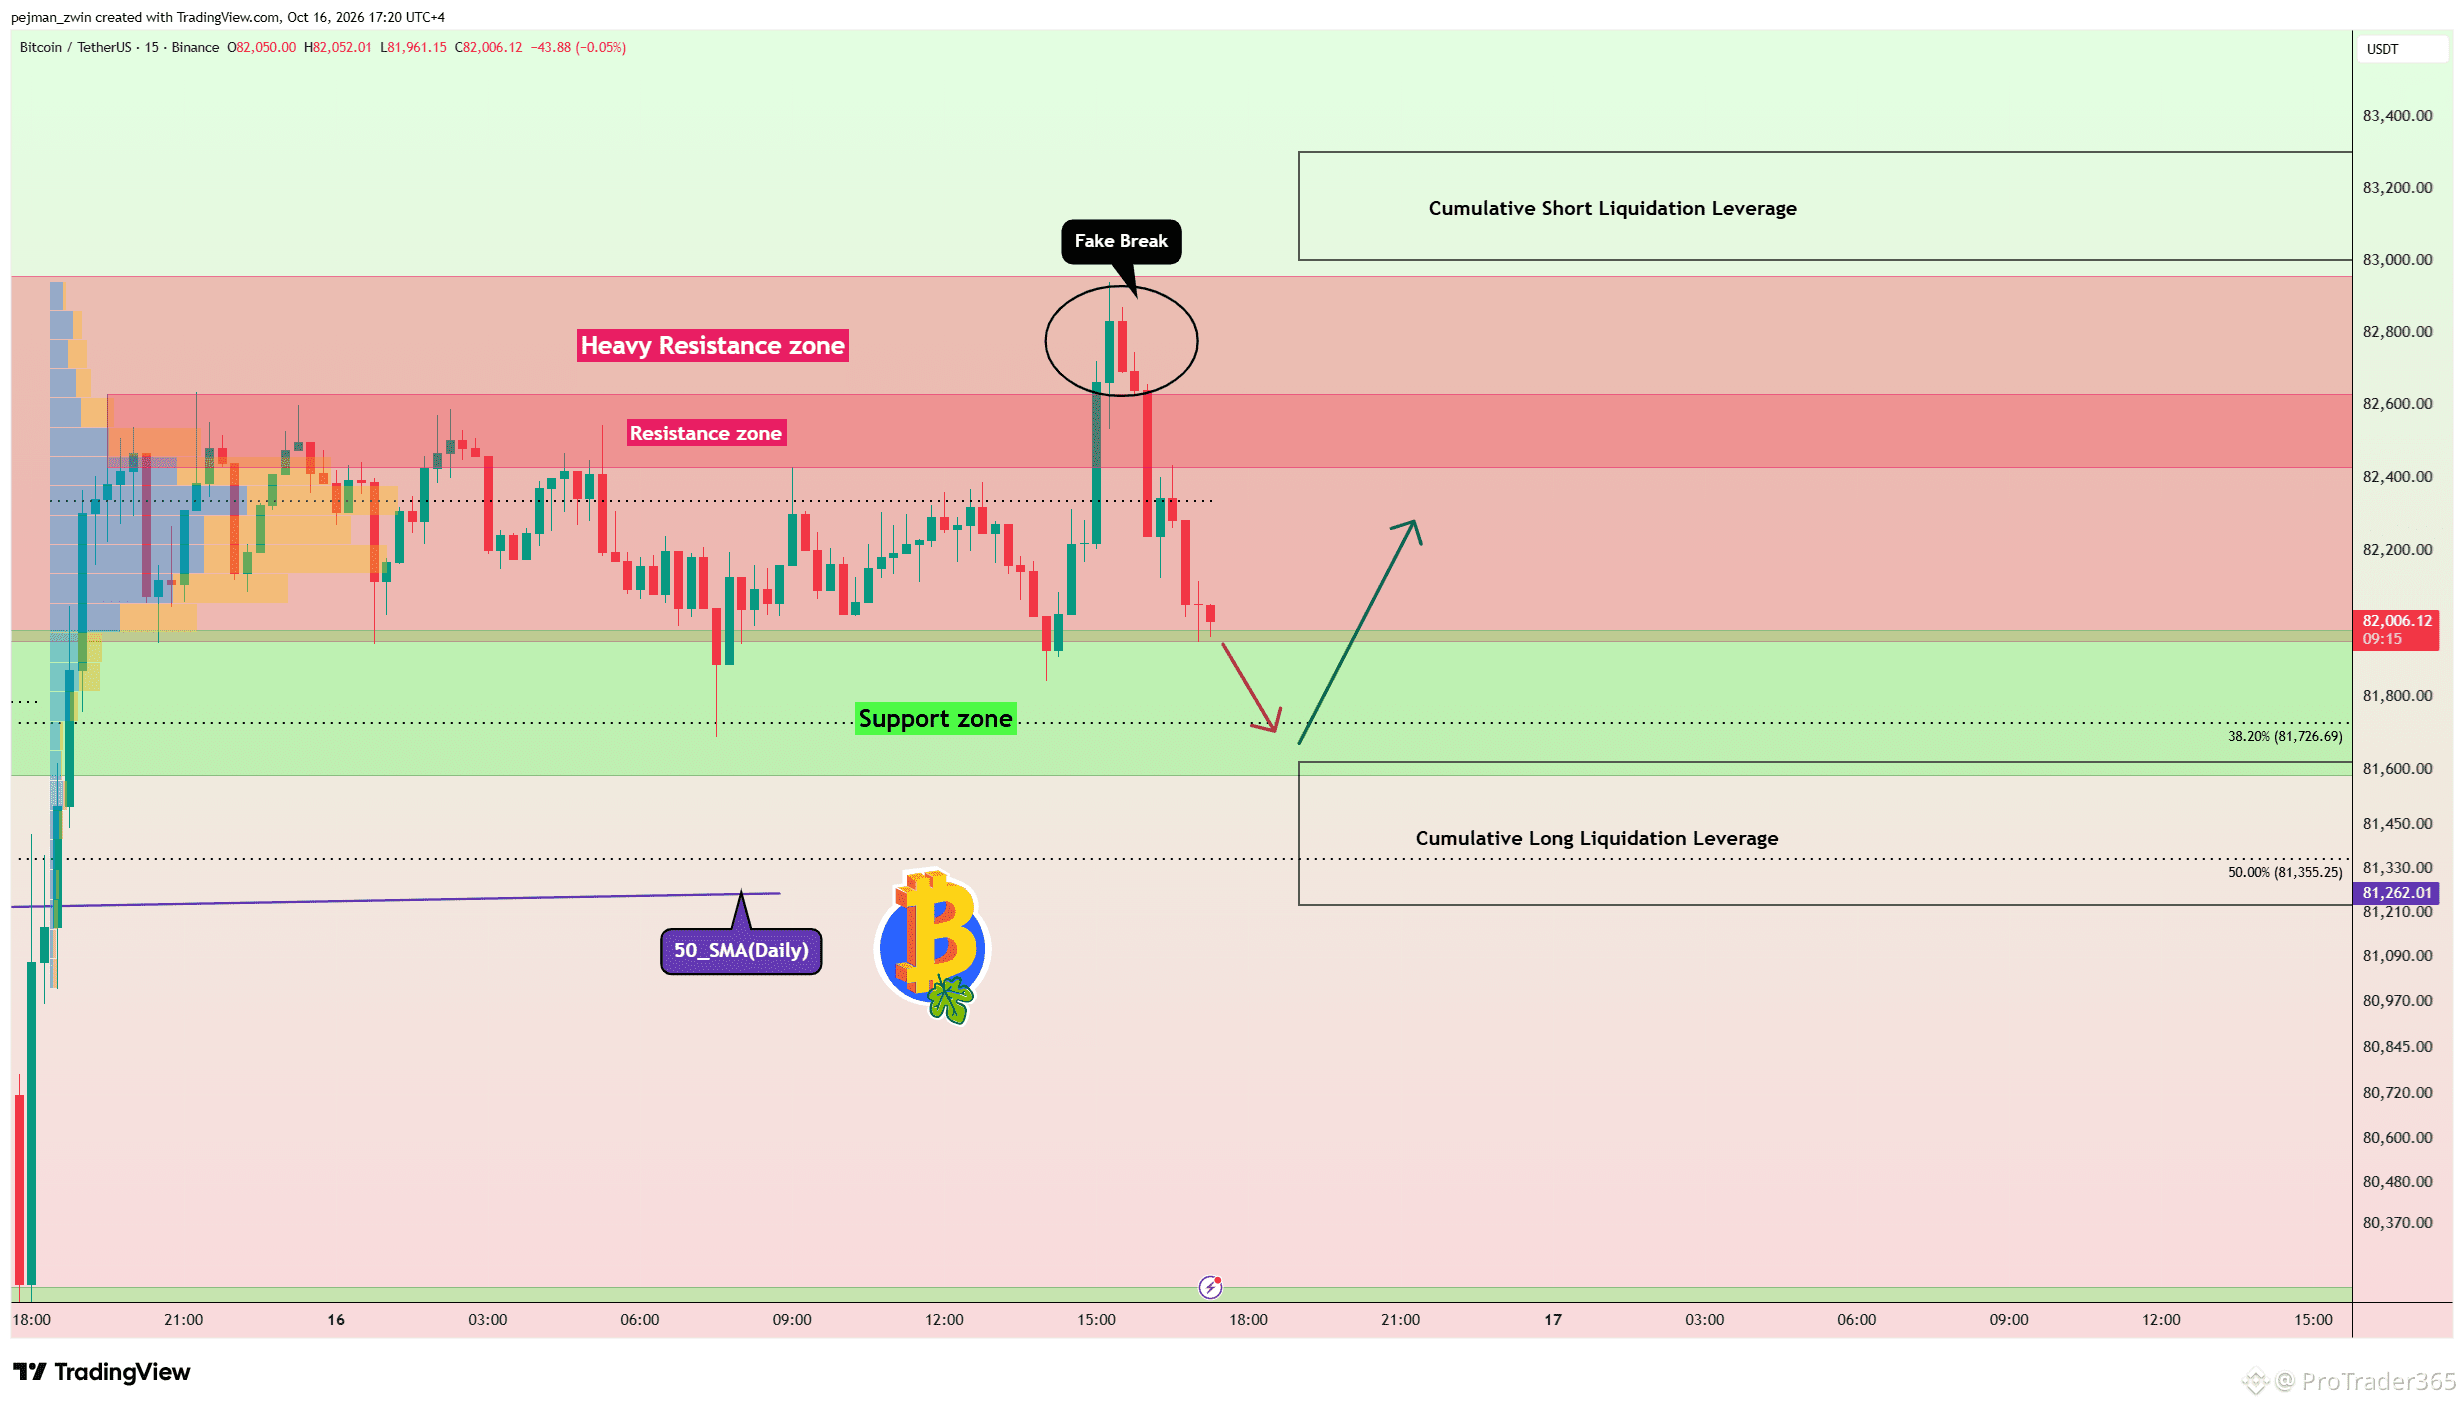
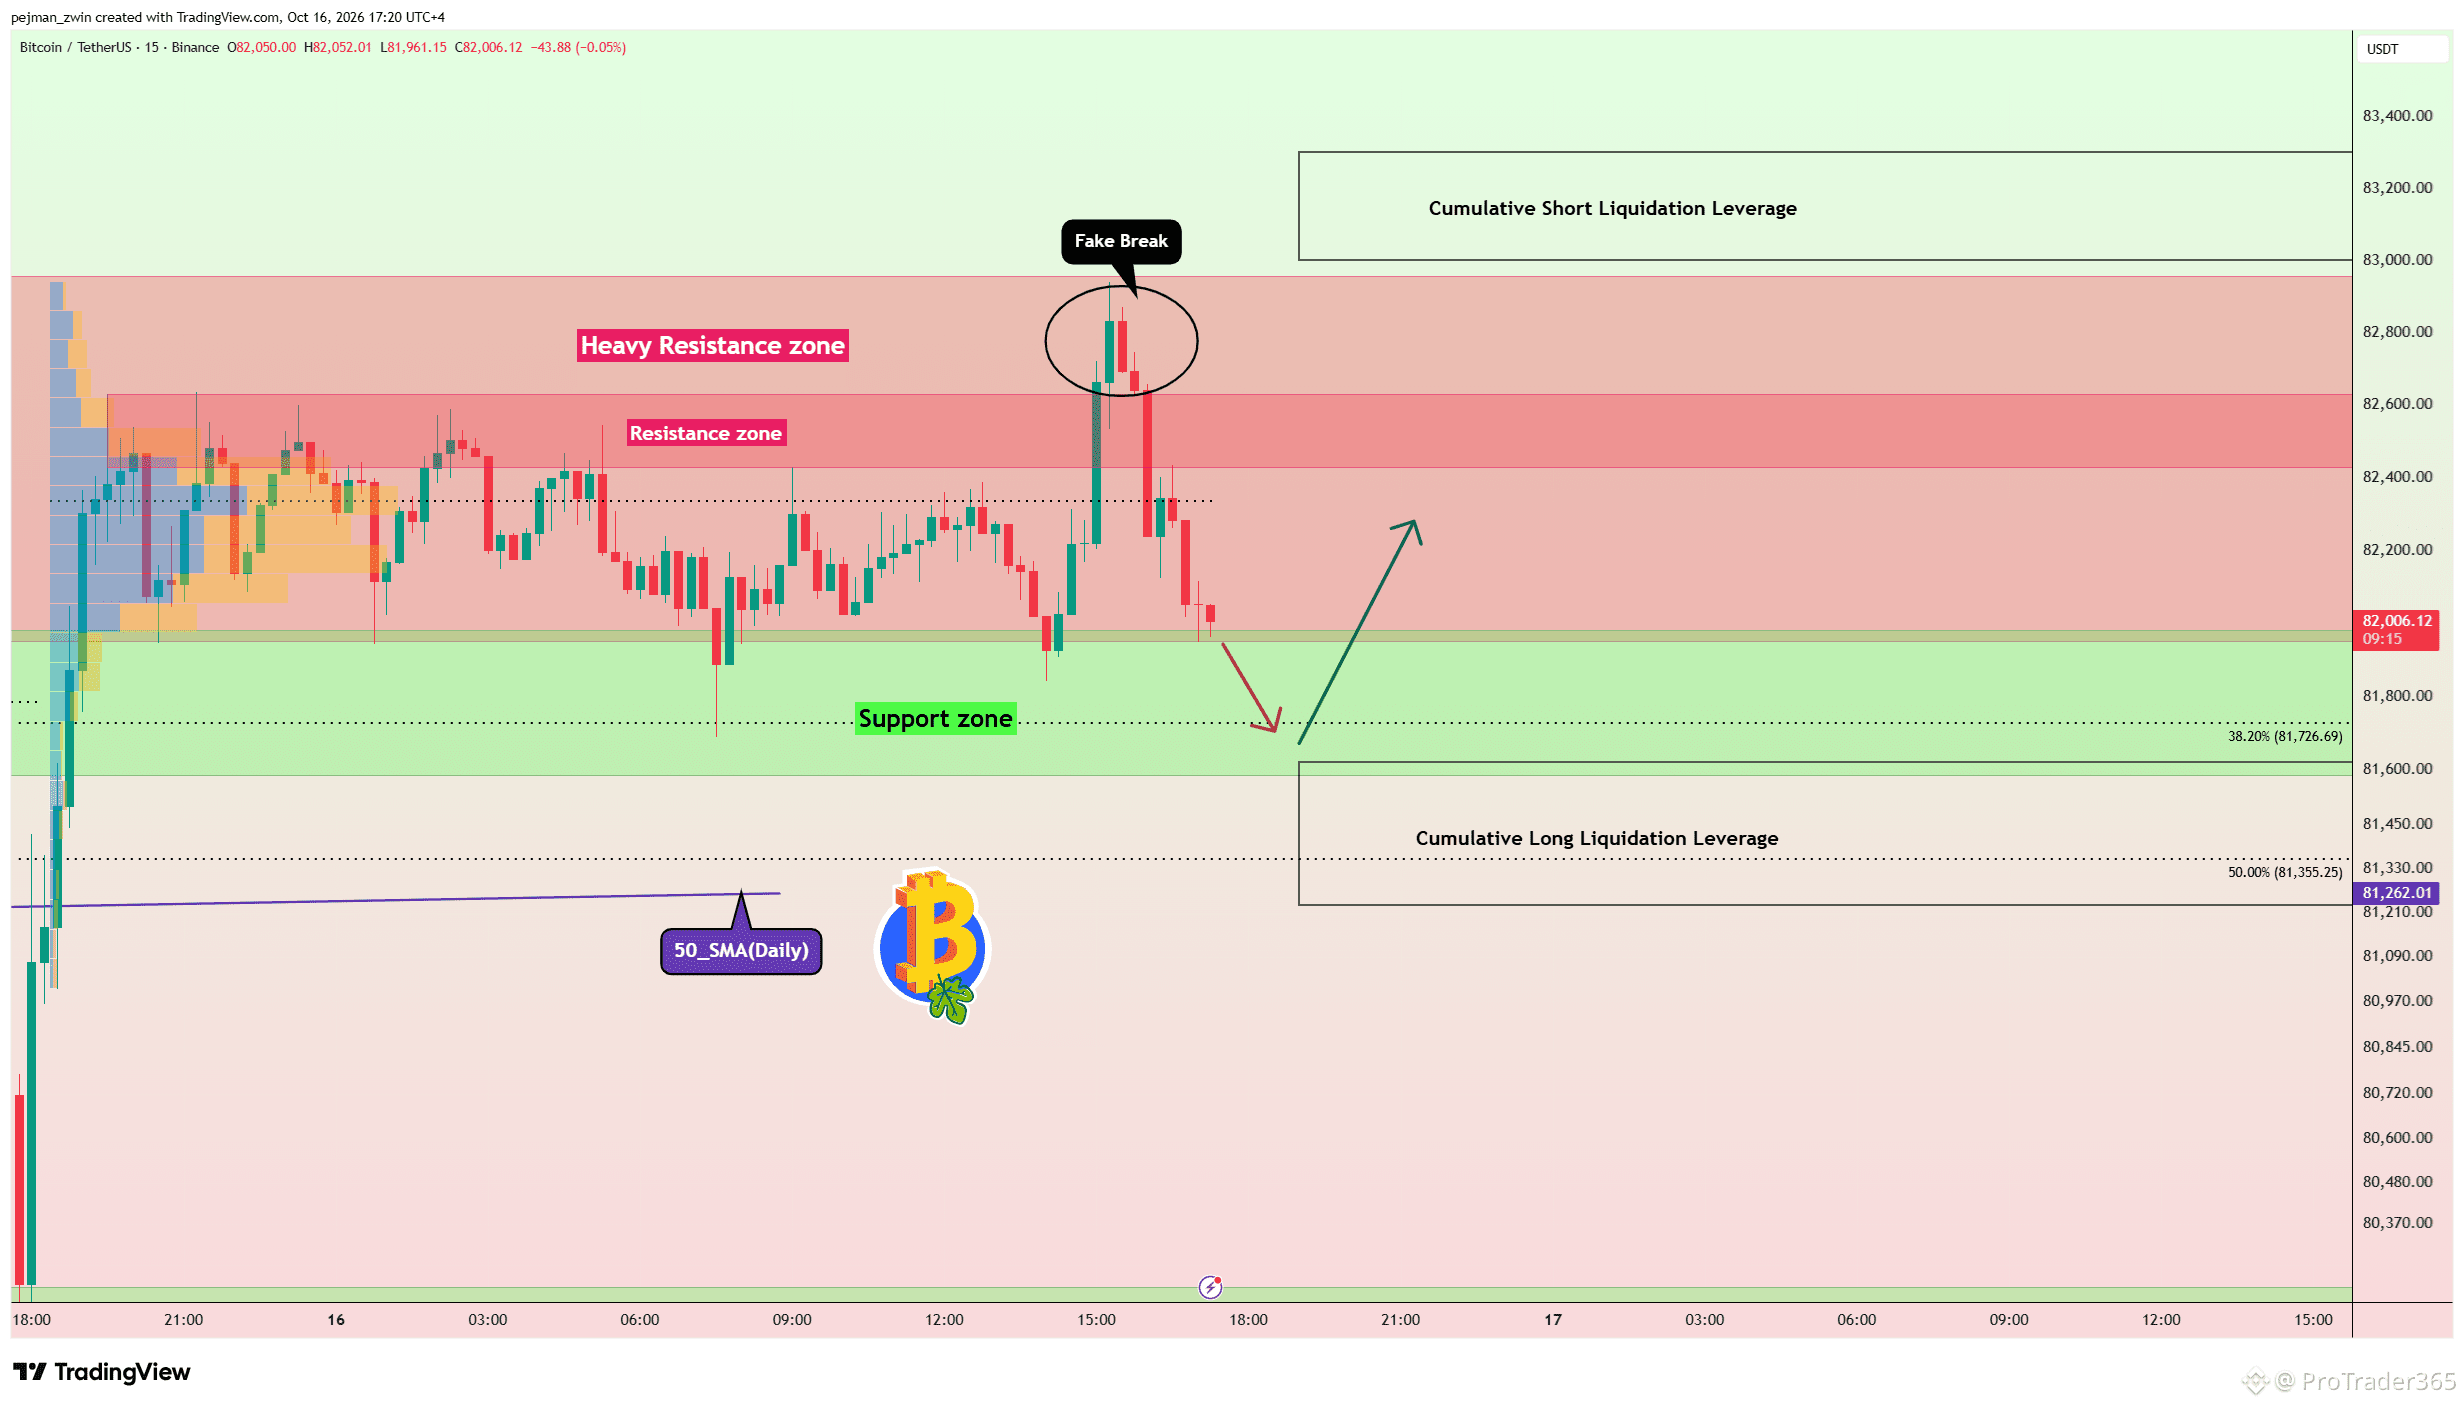
64
·
--
$ZEREBRO Surges 50% — Is a Deeper Correction Starting Now? Zerebro gained more than 50% over the past 24 hours, benefiting from renewed attention around the AI Agents narrative. However, I have not identified a fresh project-specific fundamental catalyst behind the latest move, suggesting the rally has been driven mainly by momentum and market attention. Technical Analysis After reaching the Resistance Zone($0.052-$0.073), bullish momentum started to weaken and price began moving lower. I expect the correction to continue toward at least the key $0.040 trading level and the 50% Fibonacci retracement level. Any corrective move higher could potentially provide a better opportunity to look for a Short Position, but only after a proper entry trigger and with strict risk management. Can Zerebro recover from here, or will the correction extend toward $0.040? If you found this analysis useful, follow for more.
$ZEREBRO Surges 50% — Is a Deeper Correction Starting Now? Zerebro gained more than 50% over the past 24 hours, benefiting from renewed attention around the AI Agents narrative. However, I have not identified a fresh project-specific fundamental catalyst behind the latest move, suggesting the rally has been driven mainly by momentum and market attention. Technical Analysis After reaching the Resistance Zone($0.052-$0.073), bullish momentum started to weaken and price began moving lower. I expect the correction to continue toward at least the key $0.040 trading level and the 50% Fibonacci retracement level. Any corrective move higher could potentially provide a better opportunity to look for a Short Position, but only after a proper entry trigger and with strict risk management. Can Zerebro recover from here, or will the correction extend toward $0.040? If you found this analysis useful, follow for more.
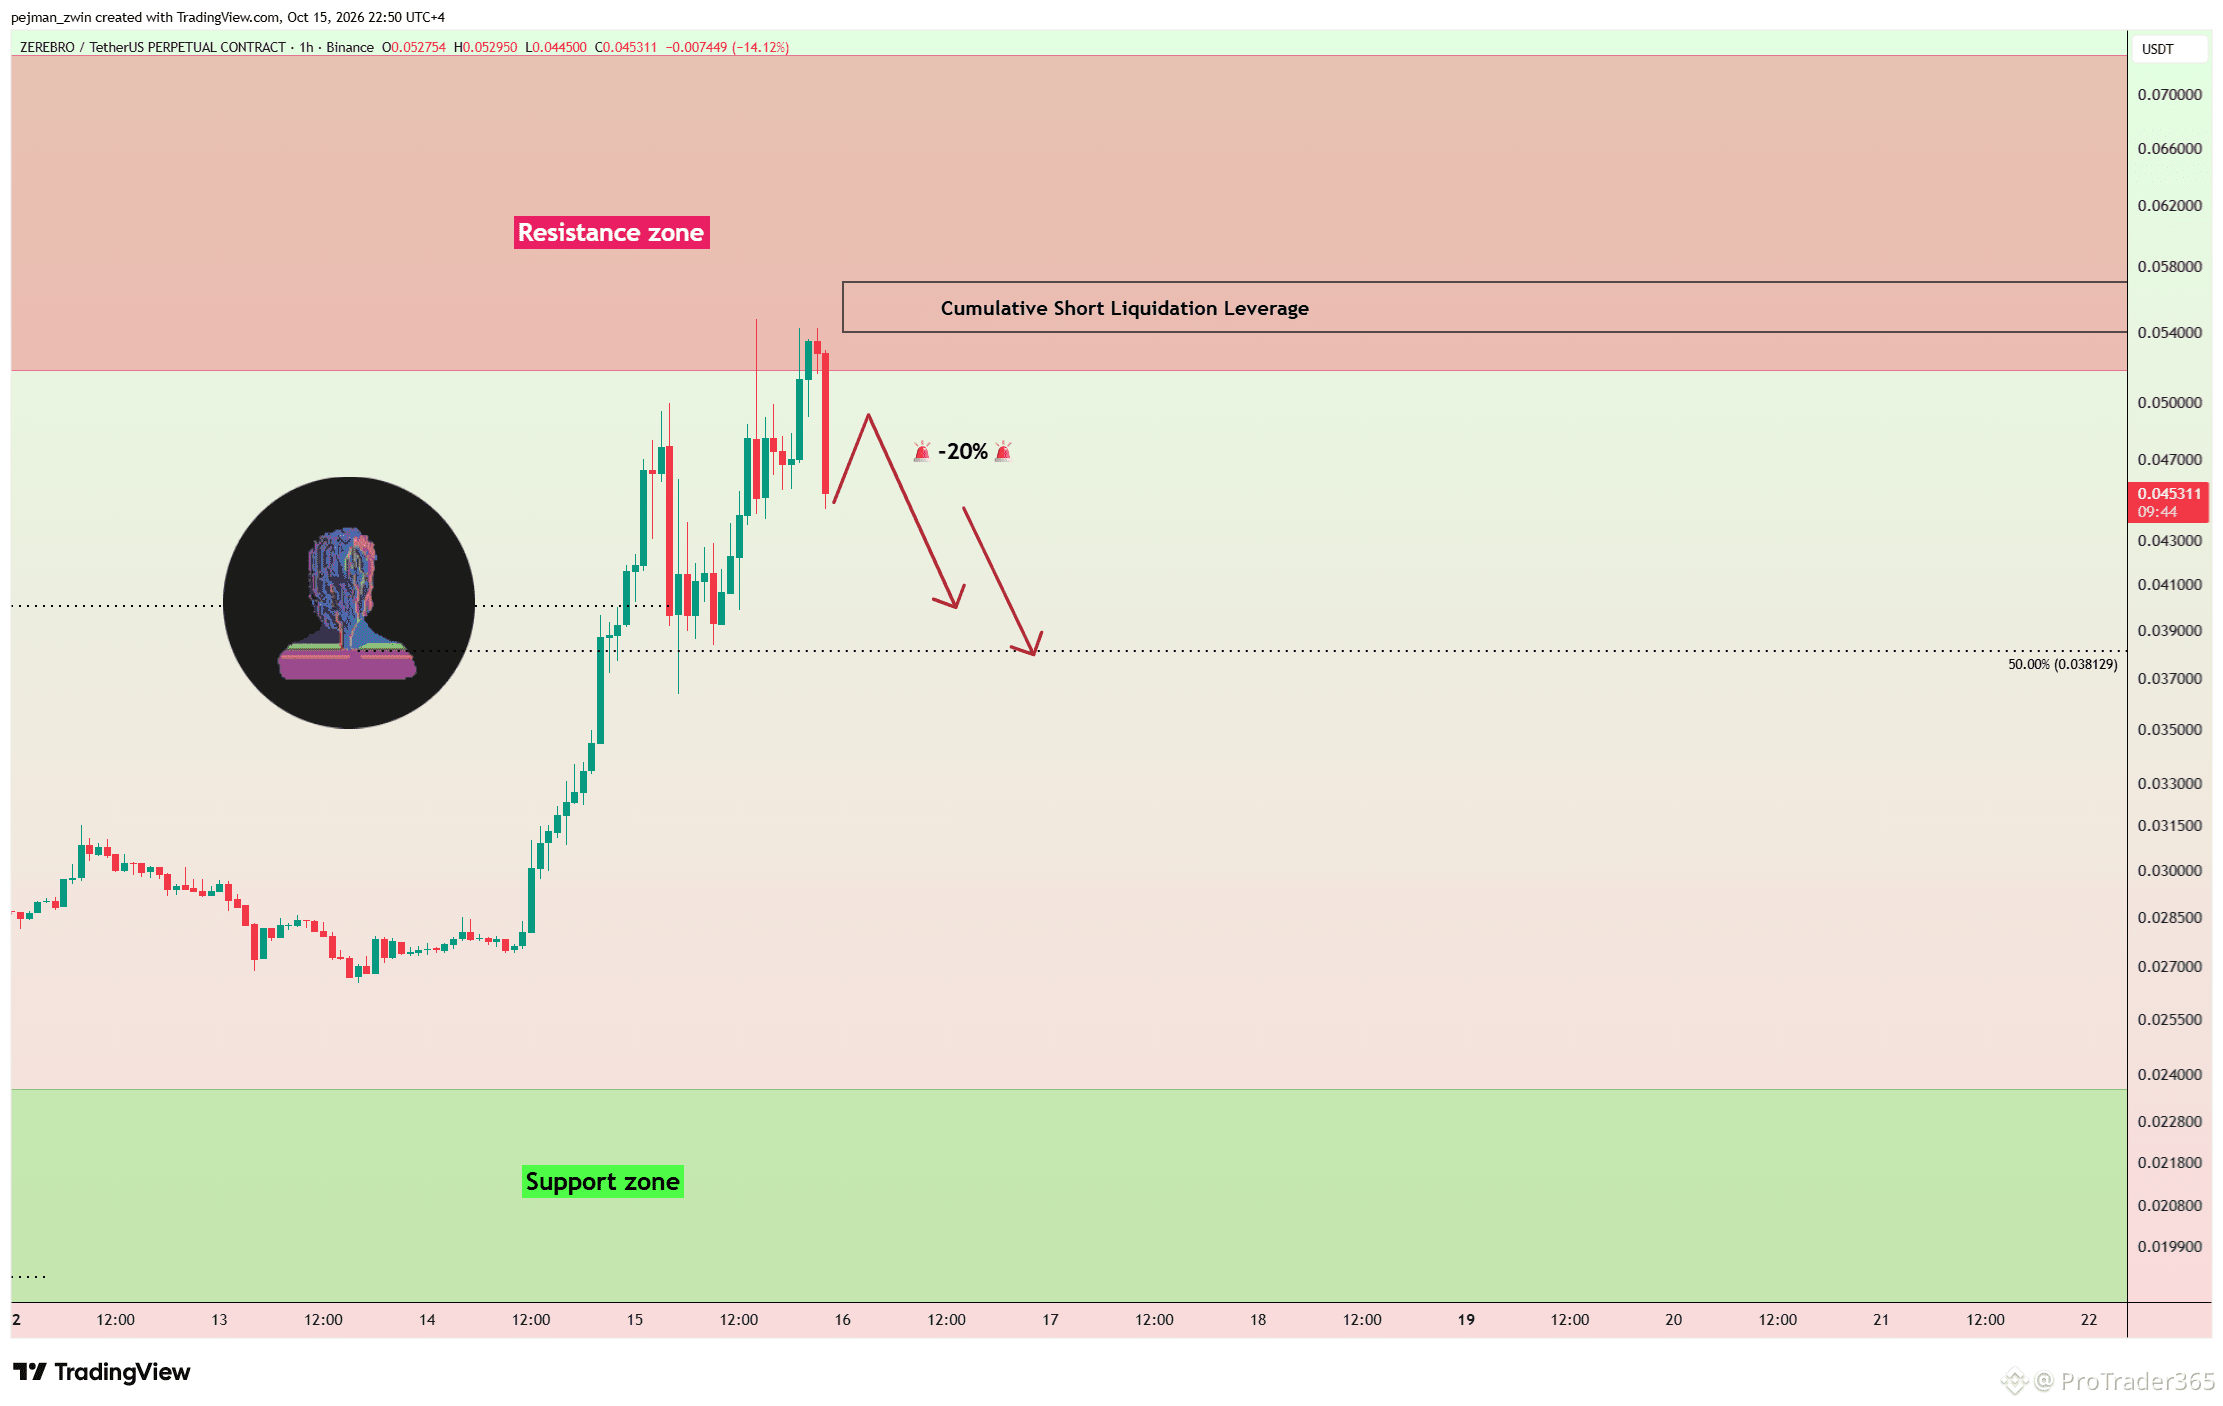
36
·
--
$WAL Rejects Major Resistance — Is a Deeper Correction Coming First? As mentioned in the previous update, Walrus gained more than 30%, although I had expected a deeper correction before the bullish move. After reaching the Resistance Zone($0.061-$0.068), WAL reacted strongly and started to move lower. Technical Analysis WAL is now trading below the key $0.054 trading level, keeping the corrective scenario active. I expect the decline to continue toward the Cumulative Long Liquidation Leverage($0.047–$0.045 ) and the 50% Fibonacci retracement level, where buyers could potentially start reacting again. After this correction, a confirmed breakout above the Descending Channel could signal the beginning of another bullish move. For now, the lower liquidity and Fibonacci area will be the key zone to watch. Can WAL complete this correction and break above the Descending Channel afterward? If you found this analysis useful, follow for more.
$WAL Rejects Major Resistance — Is a Deeper Correction Coming First? As mentioned in the previous update, Walrus gained more than 30%, although I had expected a deeper correction before the bullish move. After reaching the Resistance Zone($0.061-$0.068), WAL reacted strongly and started to move lower. Technical Analysis WAL is now trading below the key $0.054 trading level, keeping the corrective scenario active. I expect the decline to continue toward the Cumulative Long Liquidation Leverage($0.047–$0.045 ) and the 50% Fibonacci retracement level, where buyers could potentially start reacting again. After this correction, a confirmed breakout above the Descending Channel could signal the beginning of another bullish move. For now, the lower liquidity and Fibonacci area will be the key zone to watch. Can WAL complete this correction and break above the Descending Channel afterward? If you found this analysis useful, follow for more.
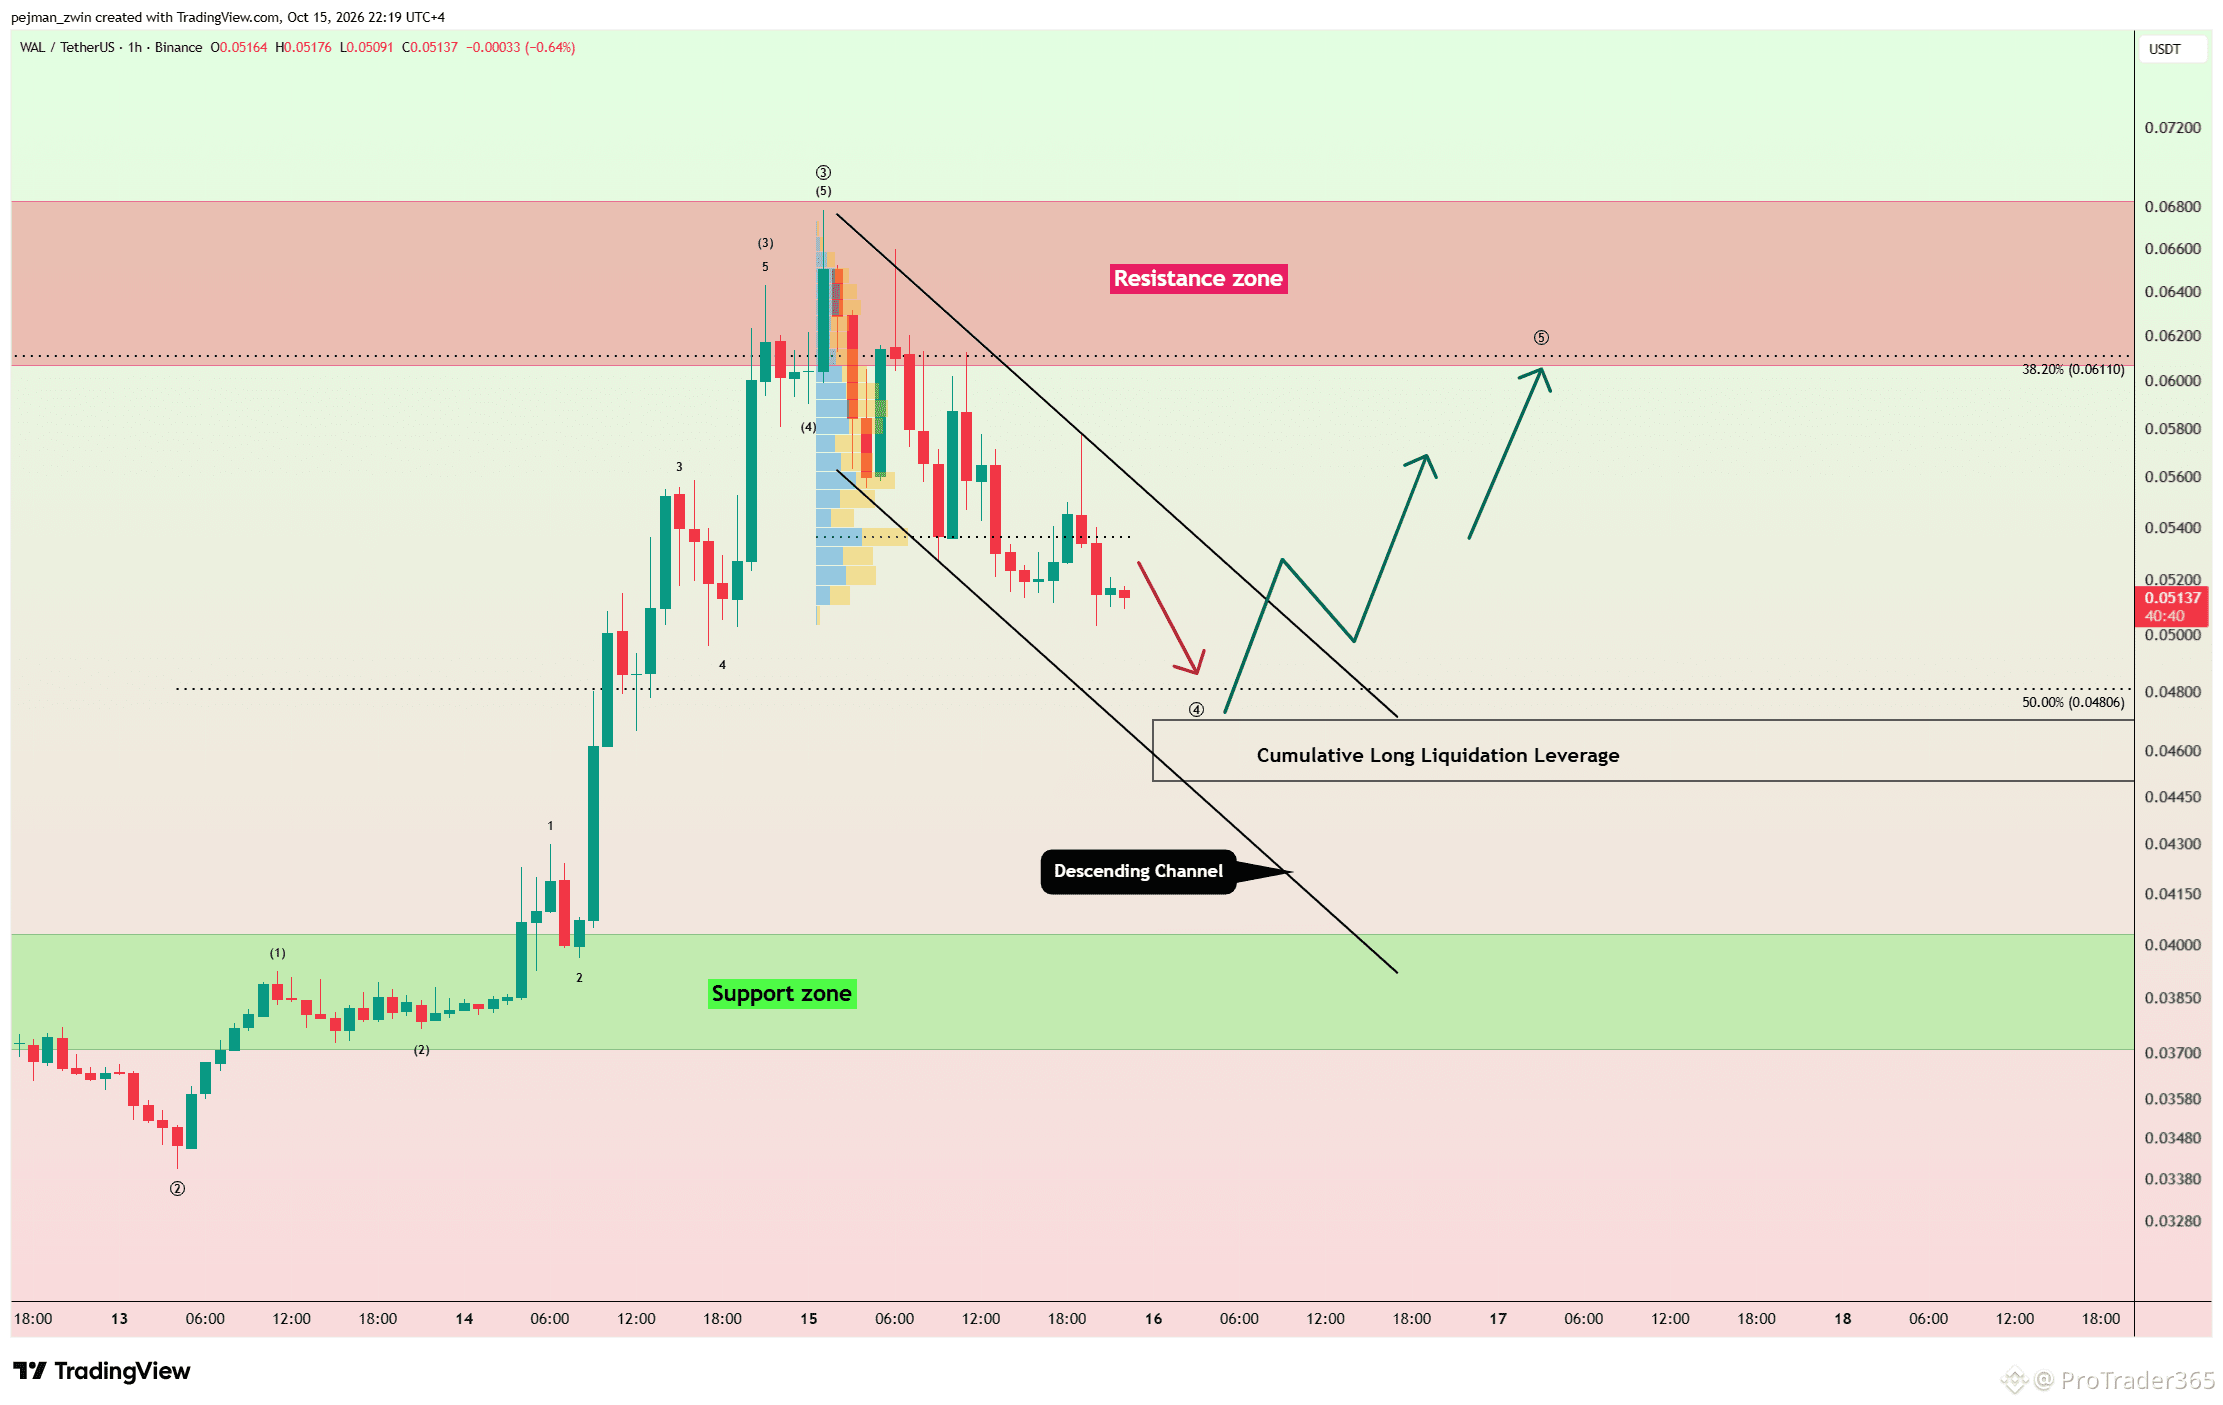
47
·
--
$BTC FOMO Returns — Can Bitcoin Break Back Above $84,000? Bitcoin has experienced significant volatility after the latest U.S. CPI release, but today’s unfavorable U.S. data triggered only limited bearish pressure. After briefly moving below the 50_SMA(Daily), Bitcoin has recovered with strong momentum. Technical Analysis Bitcoin is now attempting to reclaim the Resistance Zone($82,950-$81,950) and break above the key $81,700 trading level. FOMO is clearly visible, but chasing strong momentum candles can significantly increase risk. I would prefer to wait for a correction and a proper Long trigger. From an Elliott Wave perspective, the latest 1-hour momentum could signal the beginning of new Impulsive Bullish Waves. A confirmed breakout could target the Cumulative Short Liquidation Leverage($83,680-$83,150), followed by $83,860 and potentially $84,000. Stop Loss(SL): $79,980(Worst) Which level will Bitcoin reach first: $83,860 or $79,980? If you found this analysis useful, follow for more.
$BTC FOMO Returns — Can Bitcoin Break Back Above $84,000? Bitcoin has experienced significant volatility after the latest U.S. CPI release, but today’s unfavorable U.S. data triggered only limited bearish pressure. After briefly moving below the 50_SMA(Daily), Bitcoin has recovered with strong momentum. Technical Analysis Bitcoin is now attempting to reclaim the Resistance Zone($82,950-$81,950) and break above the key $81,700 trading level. FOMO is clearly visible, but chasing strong momentum candles can significantly increase risk. I would prefer to wait for a correction and a proper Long trigger. From an Elliott Wave perspective, the latest 1-hour momentum could signal the beginning of new Impulsive Bullish Waves. A confirmed breakout could target the Cumulative Short Liquidation Leverage($83,680-$83,150), followed by $83,860 and potentially $84,000. Stop Loss(SL): $79,980(Worst) Which level will Bitcoin reach first: $83,860 or $79,980? If you found this analysis useful, follow for more.
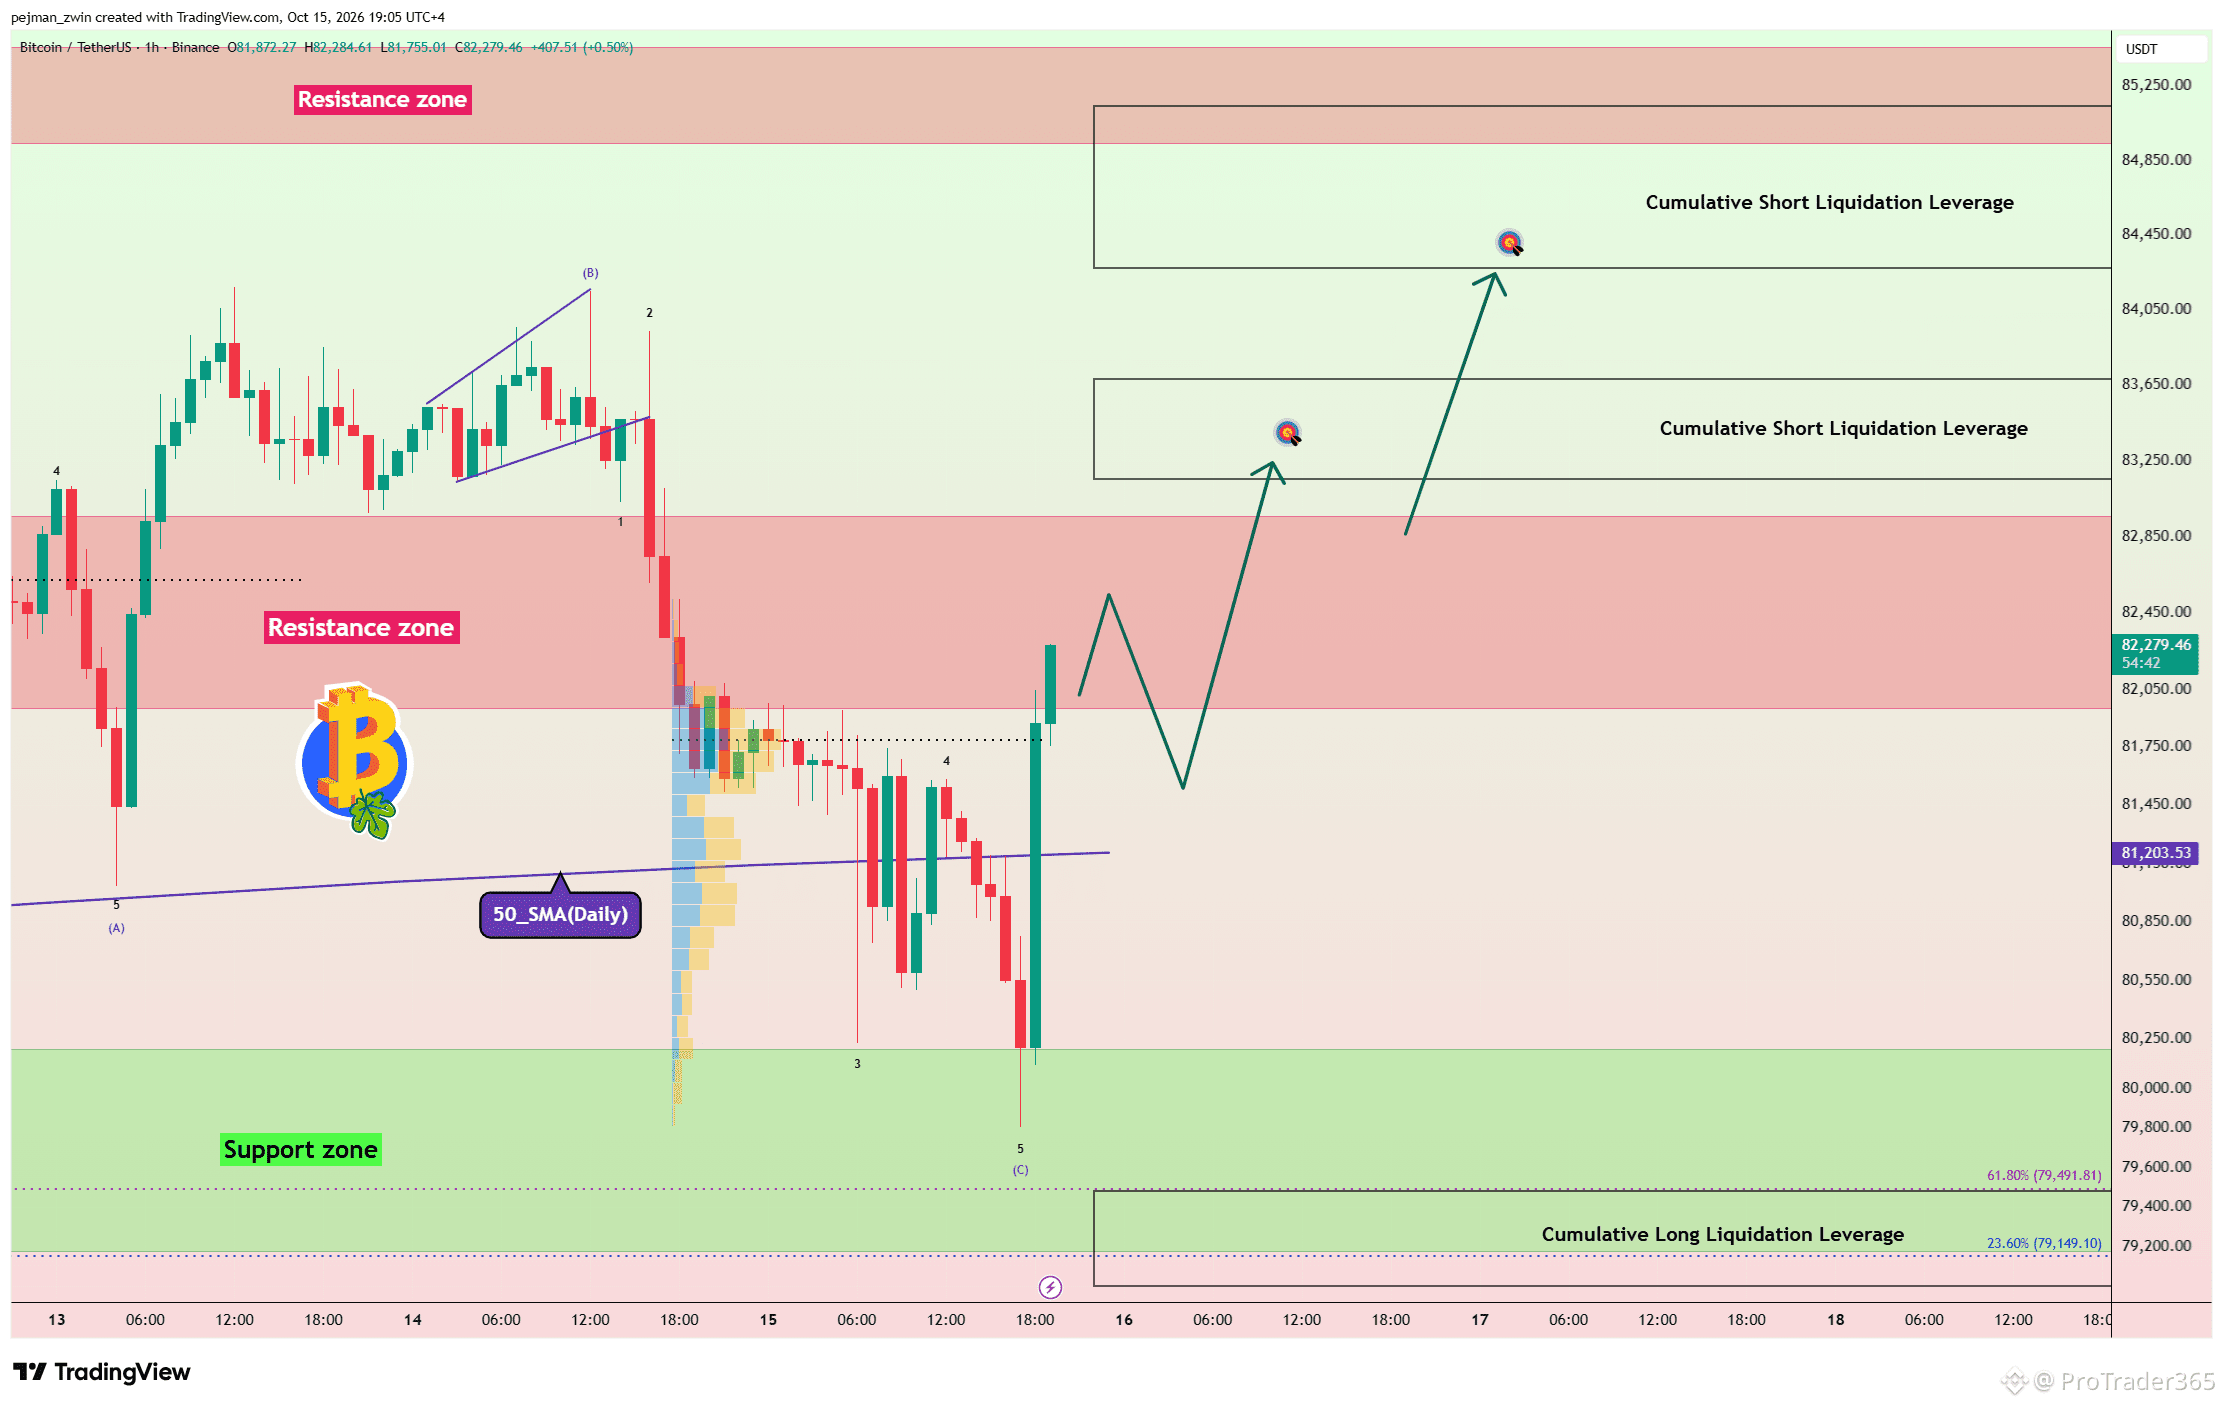
54
·
--
$XAUt Holds Major Support — Can Gold Reclaim $4,200 Next? Gold moved lower after the latest CPI release, but sellers failed to break the Support Zone($4,122-$4,067). Price reacted strongly from this area and has started to recover. Even today’s U.S. economic data, which was generally unfavorable for gold, failed to trigger meaningful selling pressure. Technical Analysis Gold is now testing the Resistance Lines and the key $4,157-$4,167 trading area. A confirmed breakout could strengthen the bullish structure and increase the probability of a move above the Descending Channel. I expect a short-term correction first, followed by another attempt higher toward $4,187 and potentially $4,210. Stop Loss(SL): $4,105(Worst) Which level will gold reach first: $4,210 or $4,105? If you found this analysis useful, follow for more.
$XAUt Holds Major Support — Can Gold Reclaim $4,200 Next? Gold moved lower after the latest CPI release, but sellers failed to break the Support Zone($4,122-$4,067). Price reacted strongly from this area and has started to recover. Even today’s U.S. economic data, which was generally unfavorable for gold, failed to trigger meaningful selling pressure. Technical Analysis Gold is now testing the Resistance Lines and the key $4,157-$4,167 trading area. A confirmed breakout could strengthen the bullish structure and increase the probability of a move above the Descending Channel. I expect a short-term correction first, followed by another attempt higher toward $4,187 and potentially $4,210. Stop Loss(SL): $4,105(Worst) Which level will gold reach first: $4,210 or $4,105? If you found this analysis useful, follow for more.
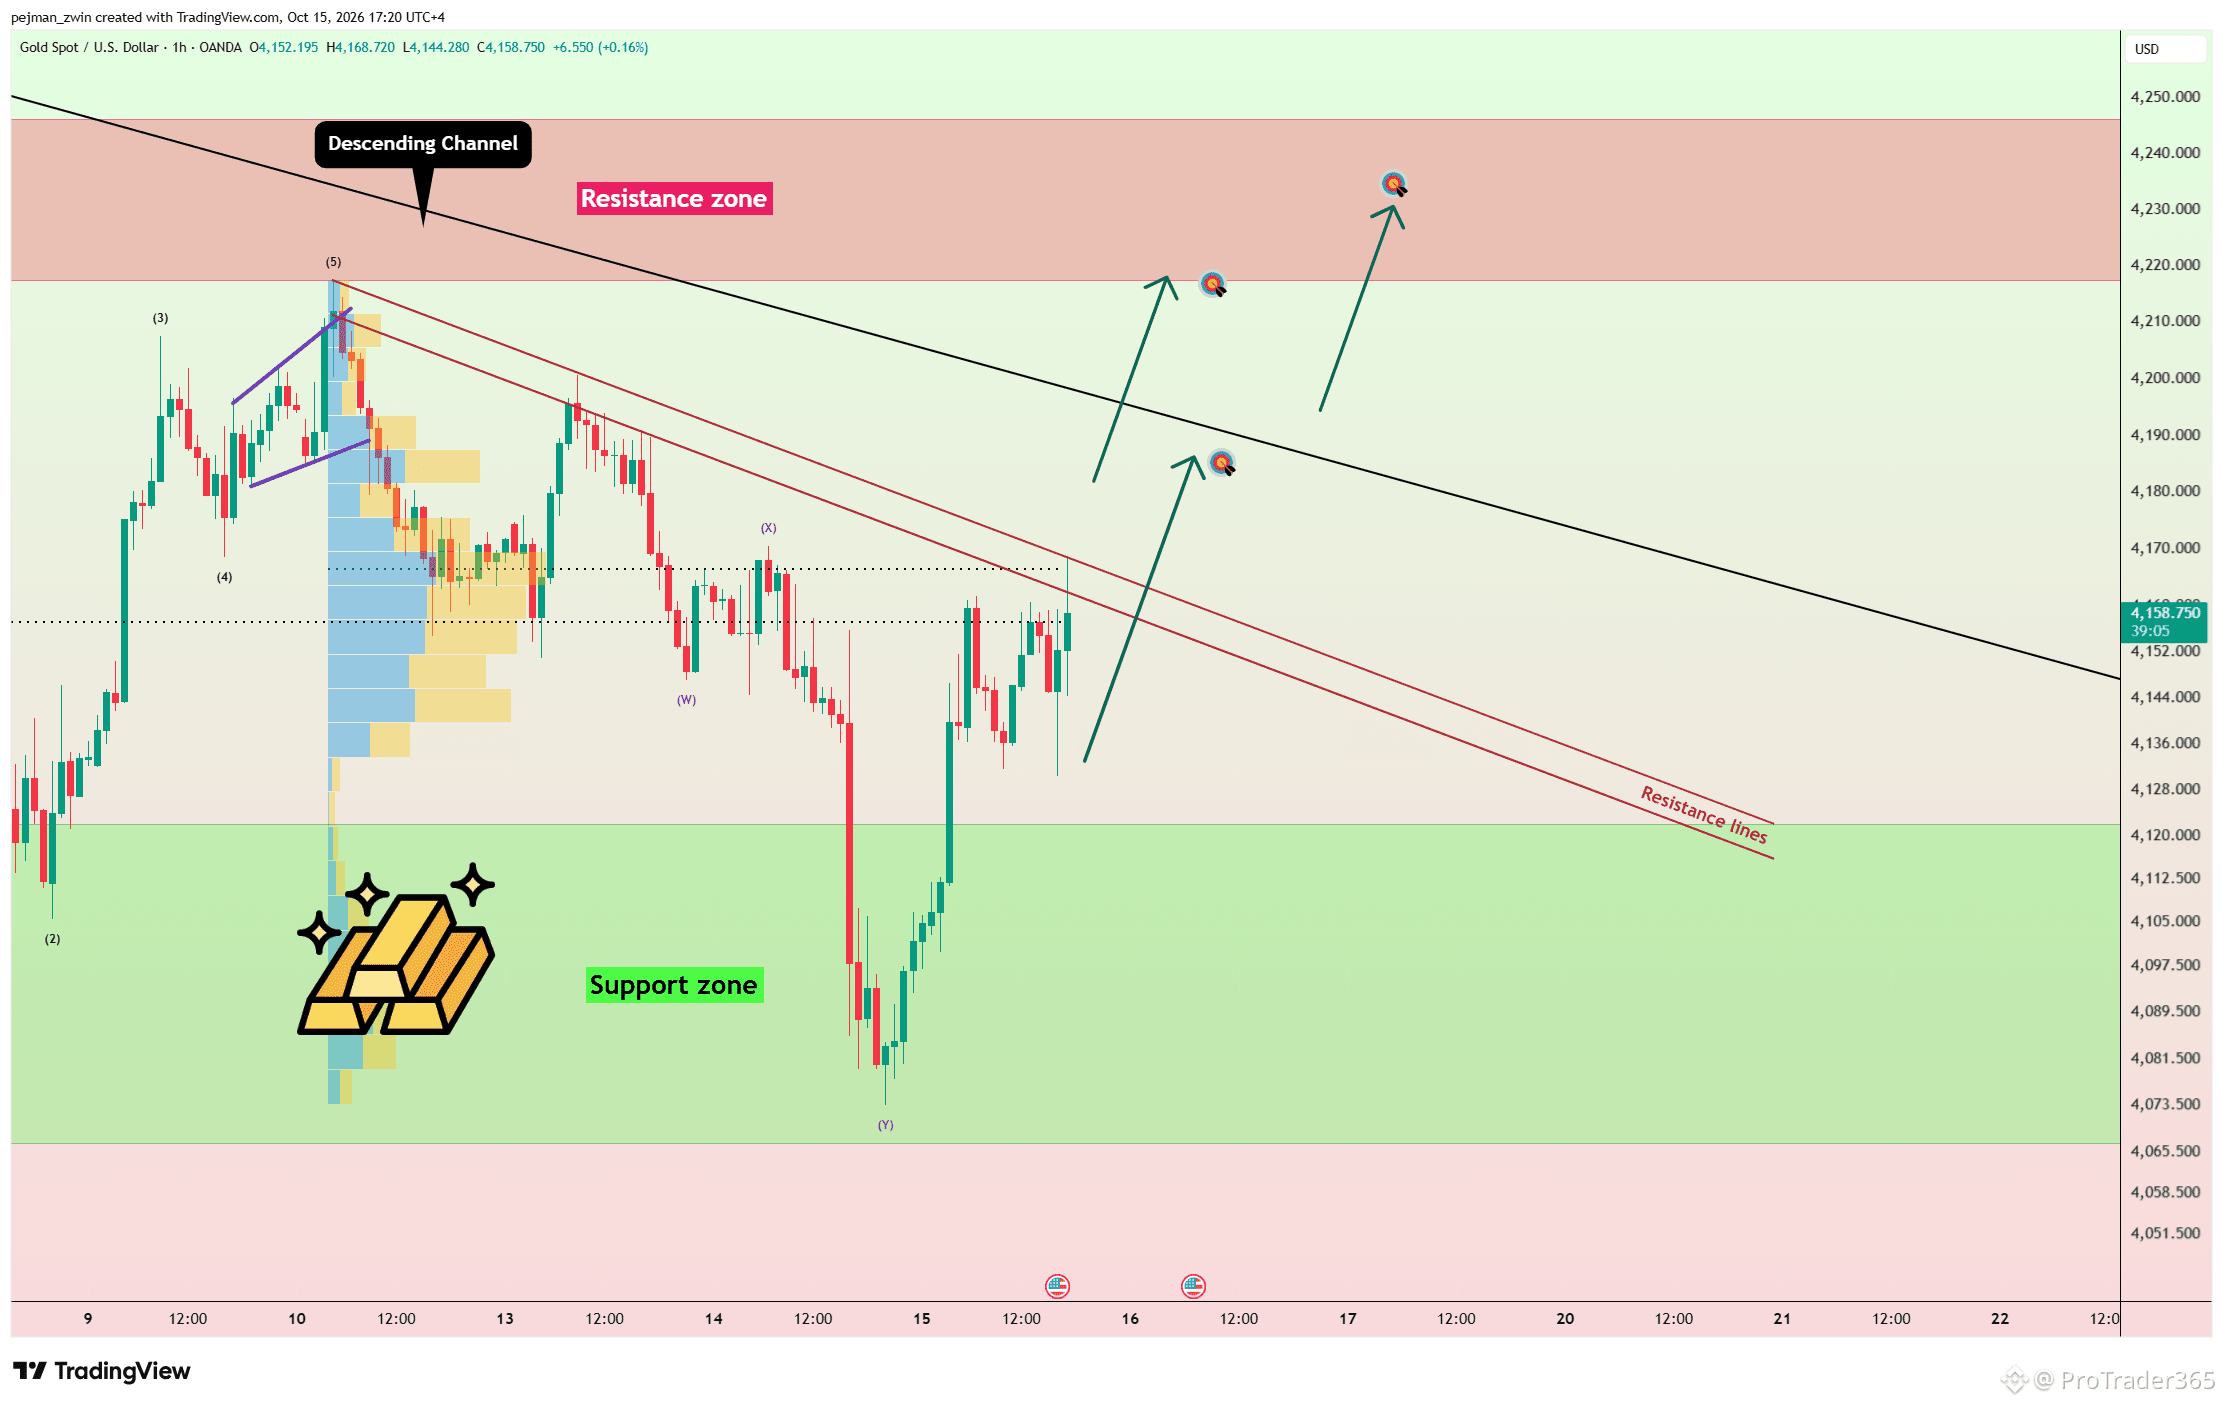
105
·
--
$WAL Surges 50% — Could the Next Pullback Trigger Another 30% Rally? Walrus has gained more than 50% over the past 24 hours, supported by renewed fundamental interest, rising trading volume, and stronger attention around its AI + Decentralized Storage narrative following the reported $30M Sui ecosystem agreement with DATA Network. Technical Analysis On the 1-hour timeframe, WAL is approaching the Resistance Zone($0.061-$0.068). After such a strong rally, I expect a corrective move before another serious breakout attempt. From an Elliott Wave perspective, the broader Impulsive Structure may still have room to continue after the correction. I expect the key Fibonacci Levels and Cumulative Long Liquidation Leverage($0.045-$0.047) to become an important demand area. If buyers defend this zone and a bullish trigger appears, another move of at least 30% could develop. Can WAL defend $0.045-$0.047 and continue higher, or will the correction deepen first? #Macro Insights#
$WAL Surges 50% — Could the Next Pullback Trigger Another 30% Rally? Walrus has gained more than 50% over the past 24 hours, supported by renewed fundamental interest, rising trading volume, and stronger attention around its AI + Decentralized Storage narrative following the reported $30M Sui ecosystem agreement with DATA Network. Technical Analysis On the 1-hour timeframe, WAL is approaching the Resistance Zone($0.061-$0.068). After such a strong rally, I expect a corrective move before another serious breakout attempt. From an Elliott Wave perspective, the broader Impulsive Structure may still have room to continue after the correction. I expect the key Fibonacci Levels and Cumulative Long Liquidation Leverage($0.045-$0.047) to become an important demand area. If buyers defend this zone and a bullish trigger appears, another move of at least 30% could develop. Can WAL defend $0.045-$0.047 and continue higher, or will the correction deepen first? #Macro Insights#
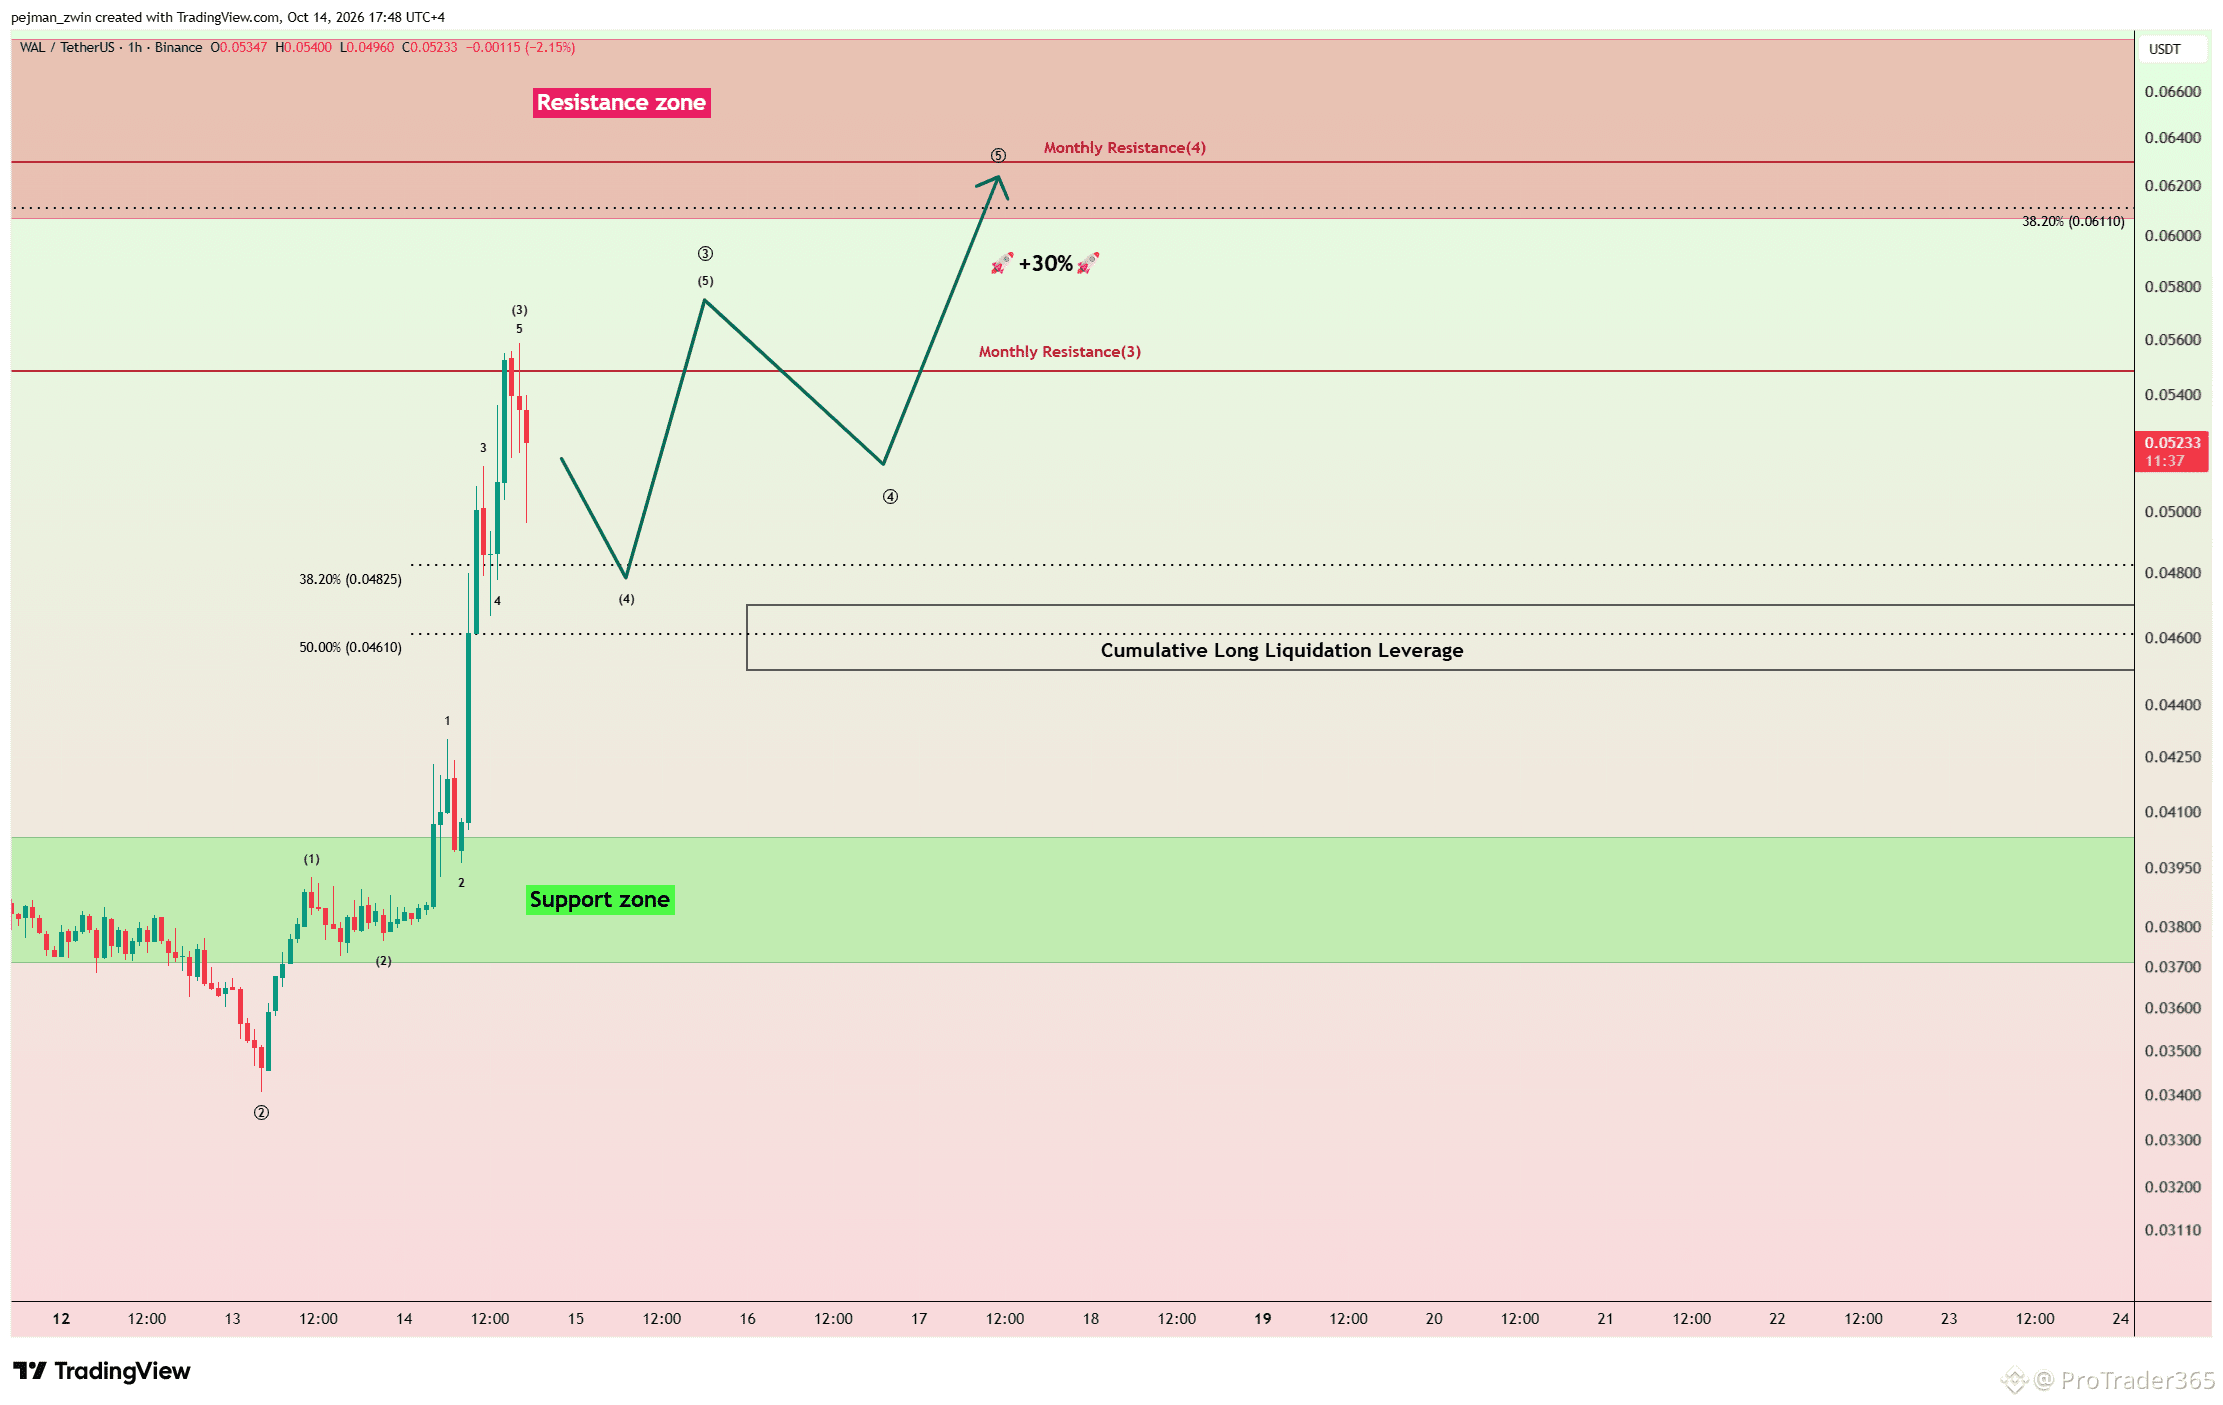
58
·
--
$BTW Surges 70% — Is a 20% Correction Coming Near $3? Bitway has gained more than 70% over the past two days, but the move appears to be driven mainly by FOMO and speculative trading rather than a clear fundamental catalyst. Reports of concentrated token supply among a limited number of wallets also increase volatility risk. Technical Analysis On the 4-hour timeframe, BTW is approaching the psychological $3.00 level, the Potential Reversal Zone(PRZ)[$2.79-$3.00], the Cumulative Short Liquidation Leverage($2.72-$2.80), and nearby Resistance Lines. Given the limited price history and aggressive rally, I expect increased selling pressure around this confluence area. A confirmed rejection could trigger a correction of at least 20%, potentially toward the important $2.00 area. Because volatility remains extremely high, I would wait for a clear reversal trigger before considering a bearish setup. Can BTW break and hold above $3.00, or will the correction begin first?
$BTW Surges 70% — Is a 20% Correction Coming Near $3? Bitway has gained more than 70% over the past two days, but the move appears to be driven mainly by FOMO and speculative trading rather than a clear fundamental catalyst. Reports of concentrated token supply among a limited number of wallets also increase volatility risk. Technical Analysis On the 4-hour timeframe, BTW is approaching the psychological $3.00 level, the Potential Reversal Zone(PRZ)[$2.79-$3.00], the Cumulative Short Liquidation Leverage($2.72-$2.80), and nearby Resistance Lines. Given the limited price history and aggressive rally, I expect increased selling pressure around this confluence area. A confirmed rejection could trigger a correction of at least 20%, potentially toward the important $2.00 area. Because volatility remains extremely high, I would wait for a clear reversal trigger before considering a bearish setup. Can BTW break and hold above $3.00, or will the correction begin first?
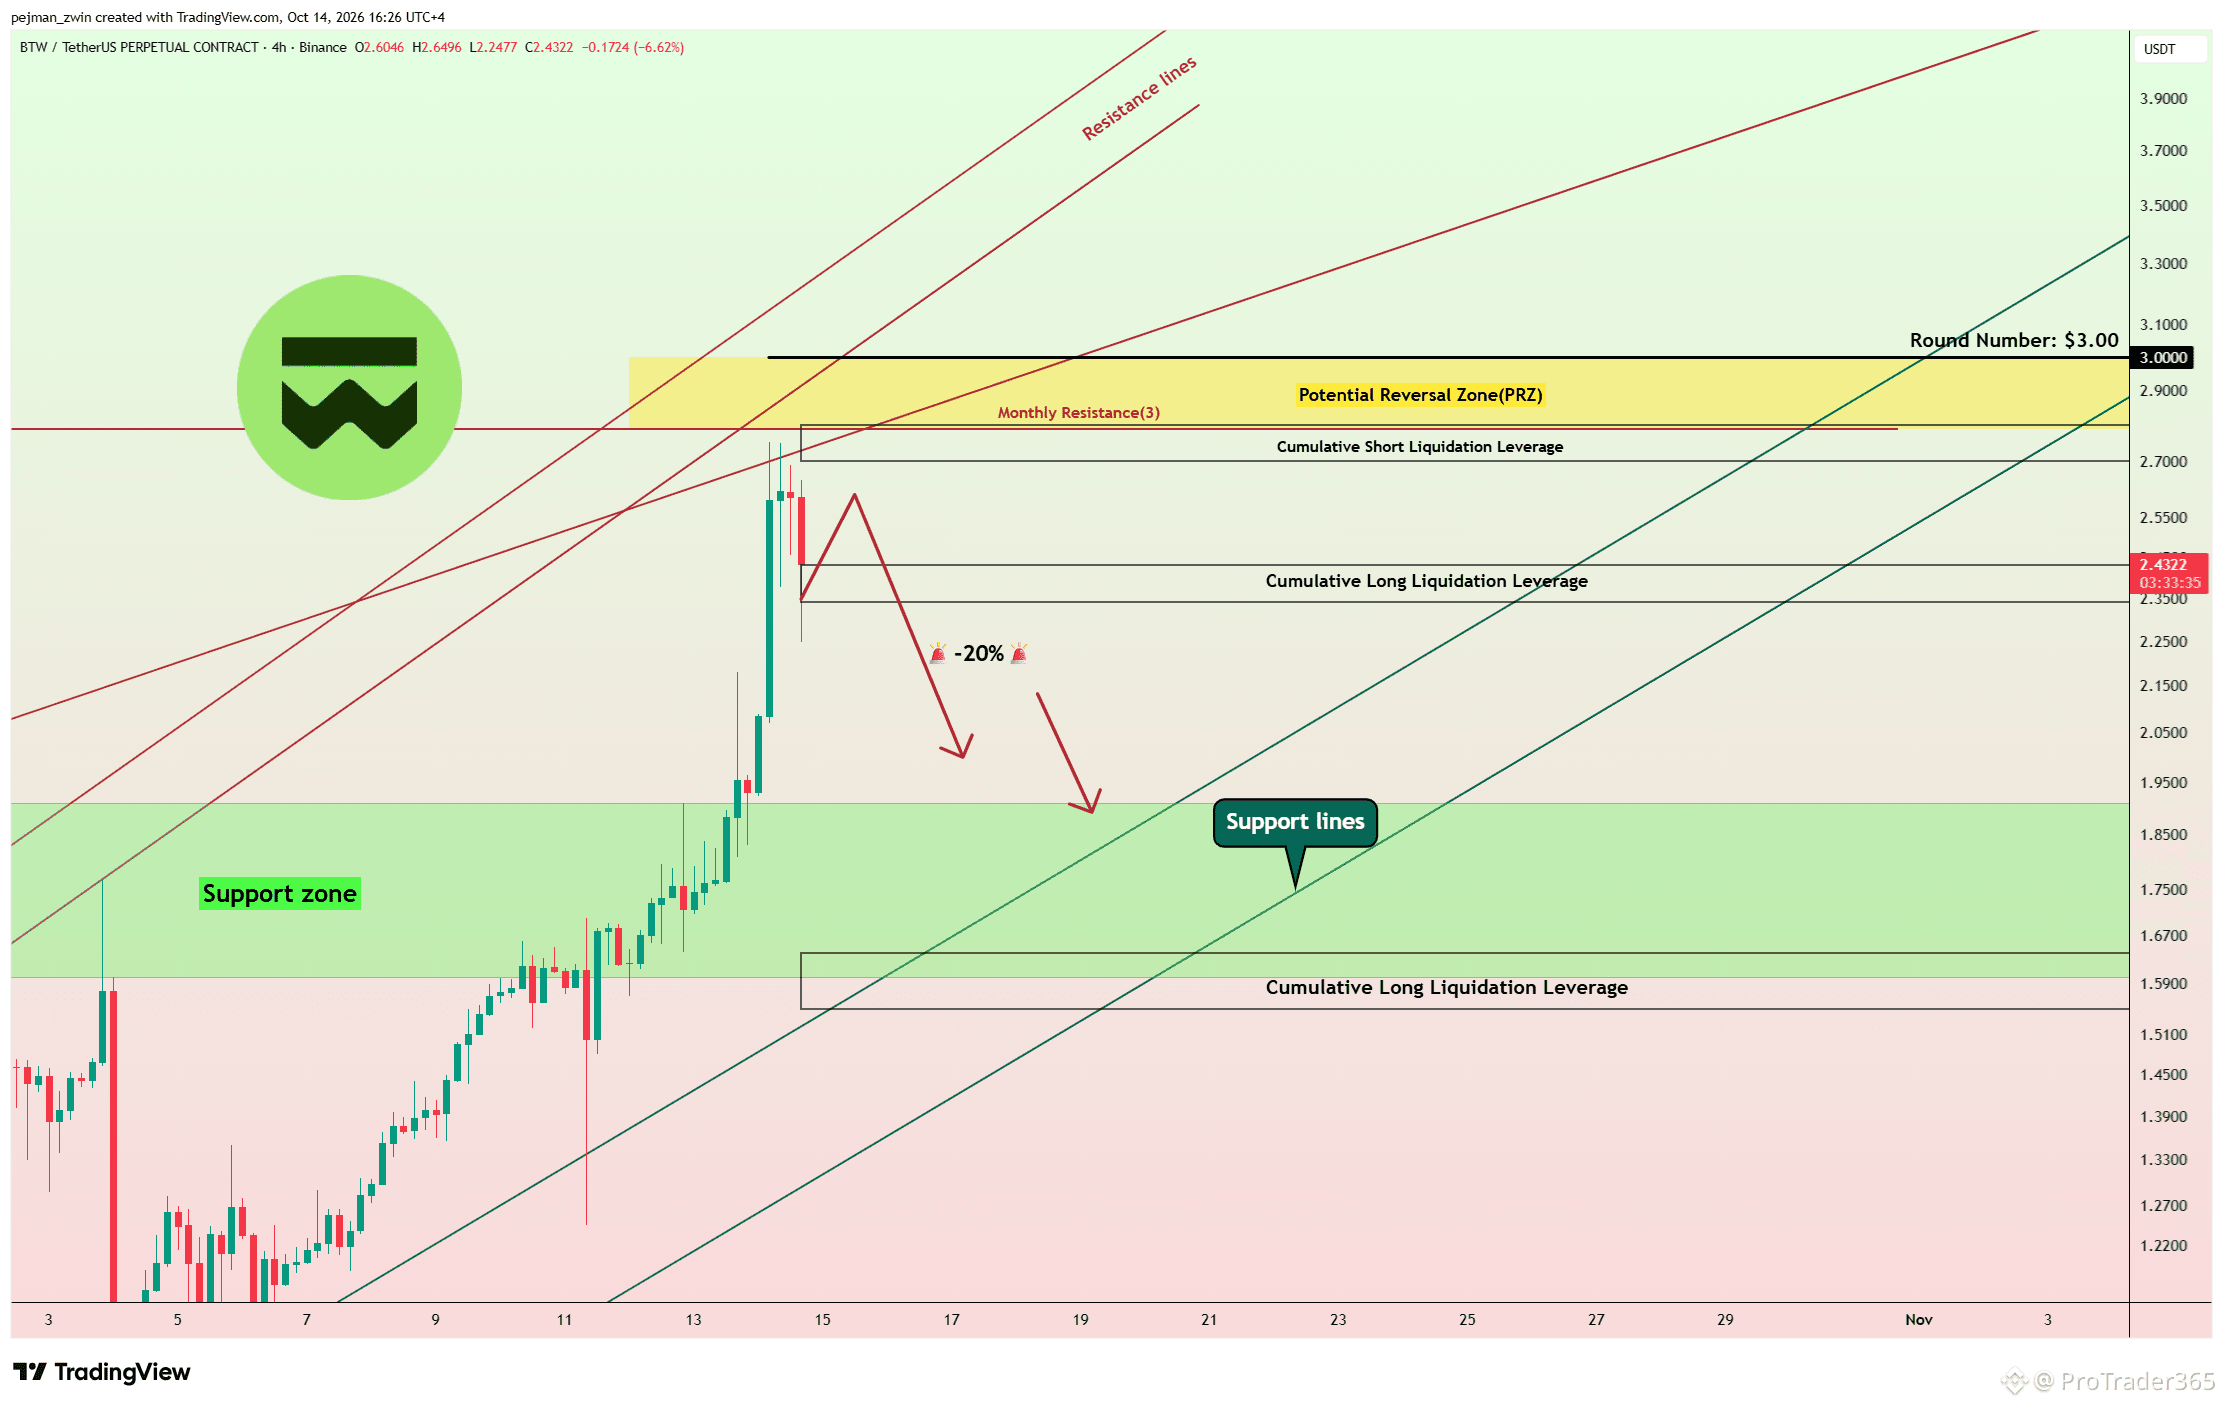
86
·
--
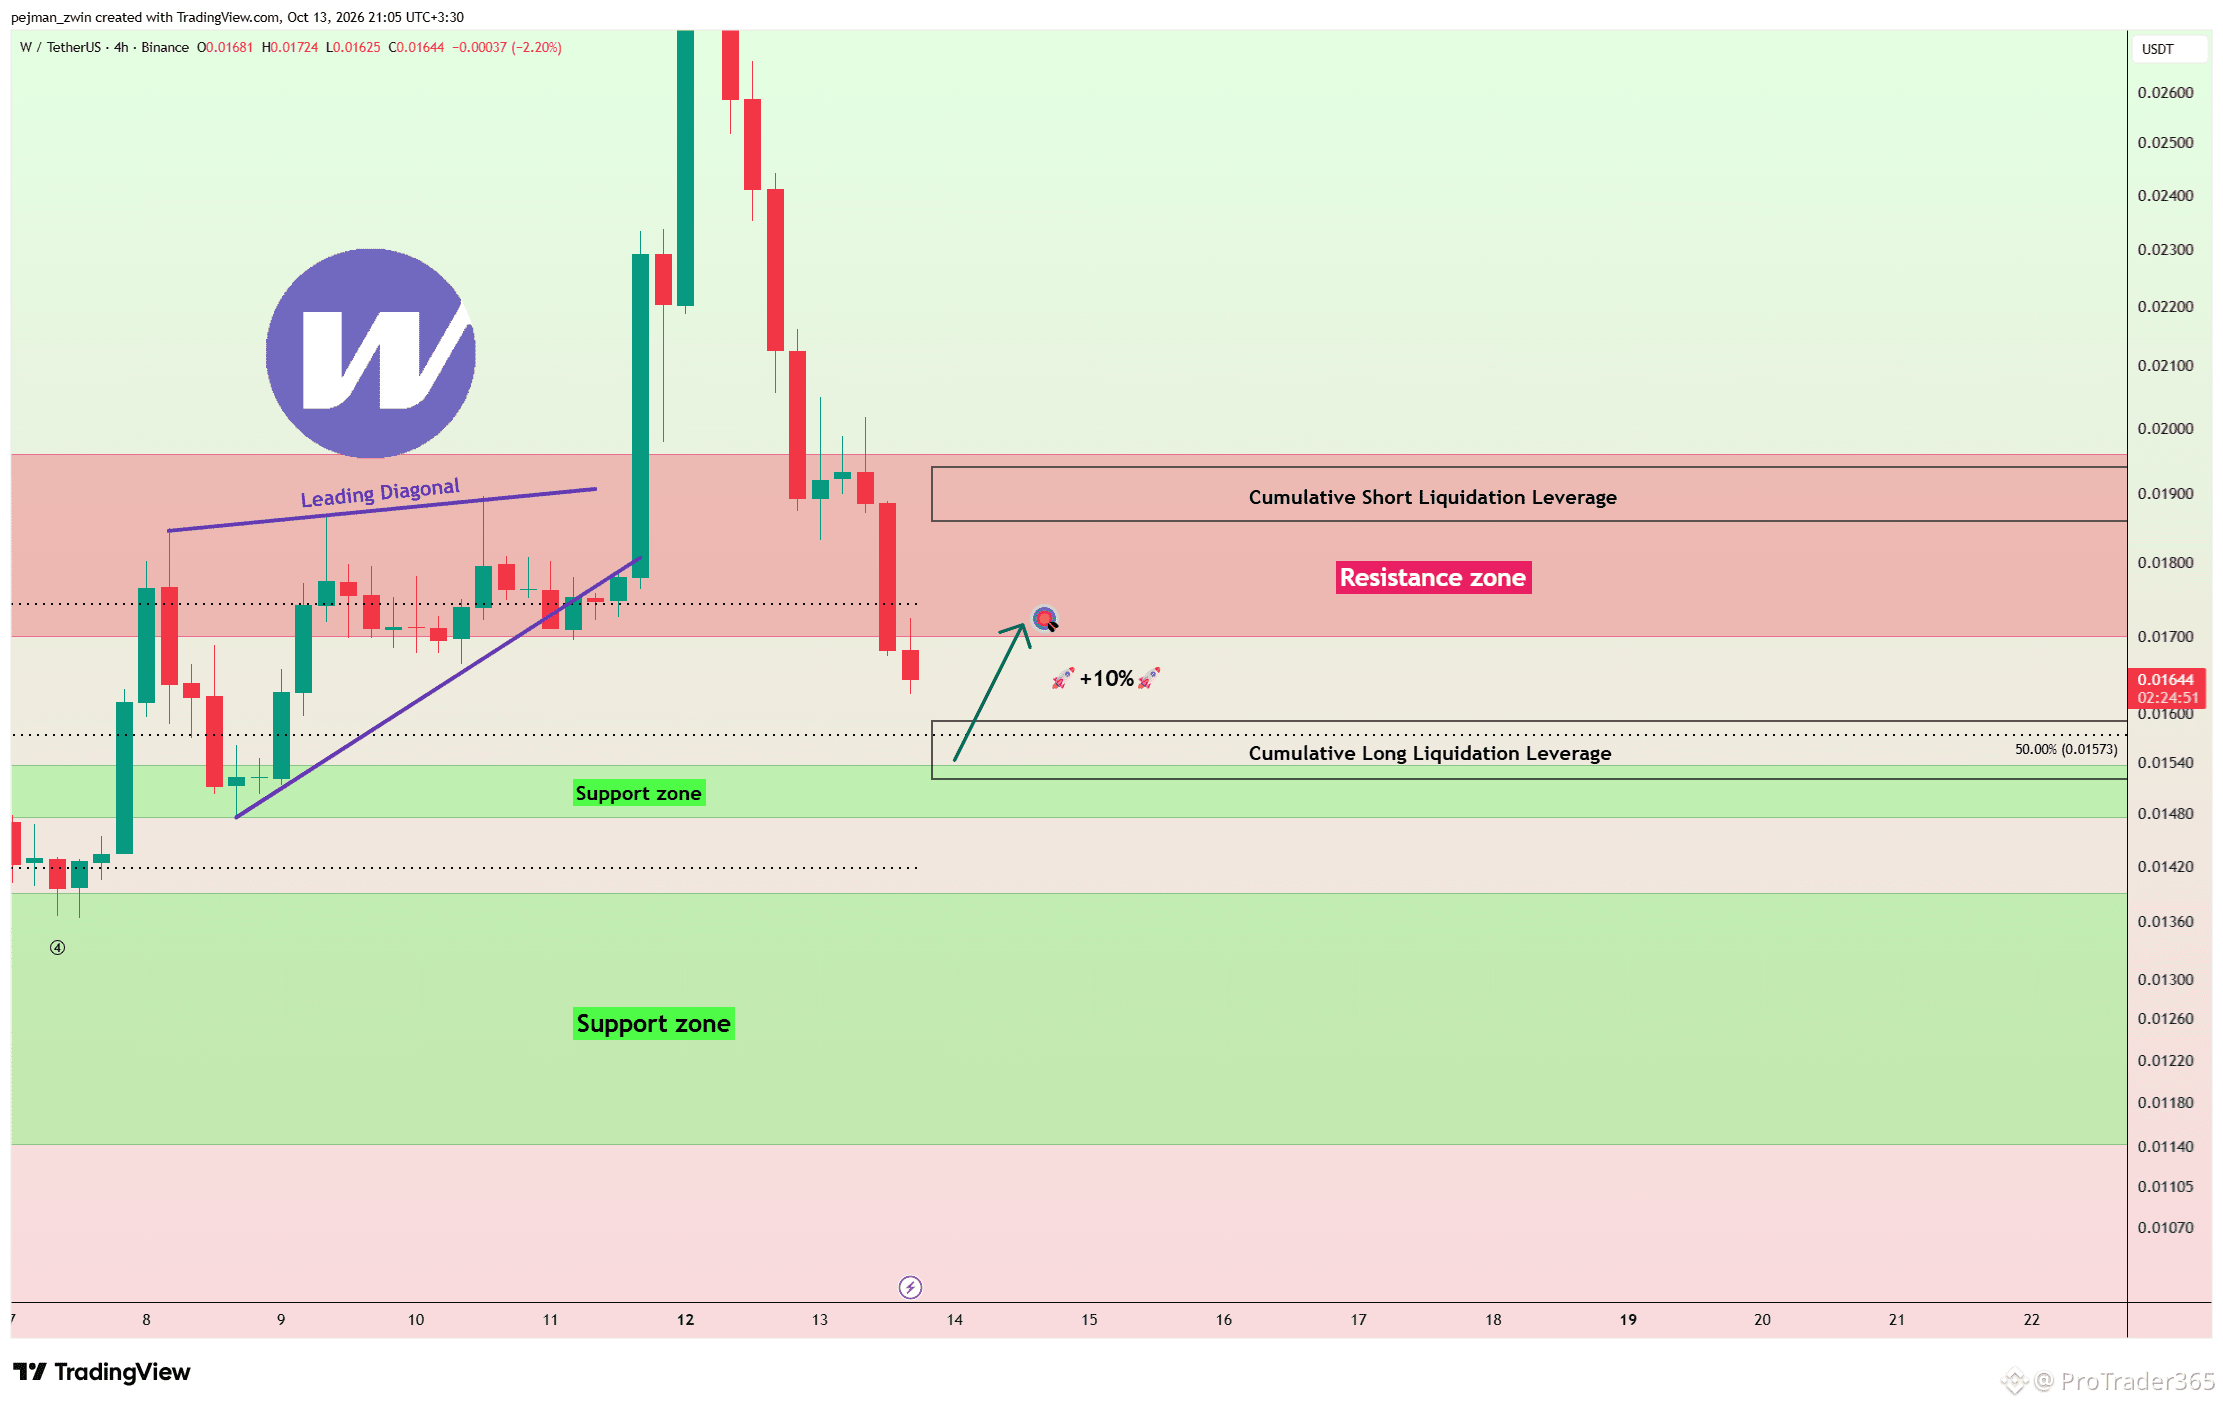
$W Drops Nearly 50% — Can This Support Zone Trigger a 10% Rebound? Wormhole had a strong move higher last week, but since the start of the new week, the token has declined by nearly 50%. Technical Analysis On the 4-hour timeframe, W has moved back below the Resistance Zone($0.0170-$0.0196) and is now approaching an important confluence between the Cumulative Long Liquidation Leverage($0.0152-$0.0159) and the Support Zone($0.0147-$0.0154). I expect W to potentially react from this demand area and deliver at least a 10% rebound. However, given the strong downside momentum and recent volatility, I would prefer to wait for a proper trigger or confirmation inside the Support Zone before considering a Long setup. Key Trading Levels: $0.0142 / $0.0175 Can buyers defend this demand area, or will W continue its correction lower?
$W Drops Nearly 50% — Can This Support Zone Trigger a 10% Rebound? Wormhole had a strong move higher last week, but since the start of the new week, the token has declined by nearly 50%. Technical Analysis On the 4-hour timeframe, W has moved back below the Resistance Zone($0.0170-$0.0196) and is now approaching an important confluence between the Cumulative Long Liquidation Leverage($0.0152-$0.0159) and the Support Zone($0.0147-$0.0154). I expect W to potentially react from this demand area and deliver at least a 10% rebound. However, given the strong downside momentum and recent volatility, I would prefer to wait for a proper trigger or confirmation inside the Support Zone before considering a Long setup. Key Trading Levels: $0.0142 / $0.0175 Can buyers defend this demand area, or will W continue its correction lower?
24
Войдите, чтобы посмотреть больше материала
Присоединяйтесь к пользователям криптовалют по всему миру на Binance Square
⚡️ Получайте новейшую и полезную информацию о криптоактивах.
💬 Нам доверяет крупнейшая в мире криптобиржа.
👍 Получите достоверные аналитические данные от верифицированных создателей контента.
Эл. почта/номер телефона
В тренде
UniswapA16zSeekDeFiExemptionFromIllinoisCryptoTax
Просмотров: 11,653
506 обсуждают
The debate over crypto taxation is heating up as Uniswap and Andreessen Horowitz ( a16z ) push for a DeFi exemption from Illinois proposed crypto tax rules. Their concern is that decentralized finance protocols and non custodial platforms could face unfair tax burdens potentially slowing innovation and making crypto development more difficult. DeFi platforms allow users to trade and manage digital assets without traditional intermediaries so applying conventional financial tax rules may create serious challenges. This could become an important moment for the US crypto industry as regulators must find a balance between fair taxation, investor protection, and innovation. 🚀
The main concern is that the proposed 0.2% tax is calculated on transaction value, not simply trading profits. Uniswap a16z and the DeFi Education Fund want wallet withdrawals and cross chain bridging excluded, while also opposing requirements to maintain private key records. Illinois has agreed to postpone implementation until July 1, 2027 subject to court approval. The outcome could influence how other US states approach DeFi taxation. The Defiant +2
What do you think 🤔 ? Should DeFi transactions be tax free to protect decentralization or should crypto platforms follow traditional tax rules ? 🤔
#UniswapA16zSeekDeFiExemptionFromIllinoisCryptoTax
Volatile
·Лайков: 3
·Просмотров: 84
HKDollarStablecoinHKDAPToLaunchOnSolana
Просмотров: 7,197
293 обсуждают
$1.5BInLeveragedCryptoBetsLiquidated
Просмотров: 23,176
211 обсуждают