

CaptainAltcoin
27.3k Публикации

CaptainAltcoin
Отправить жалобу
Заблокировать пользователя
Ahoy, crypto sailors! Navigate the stormy seas of the digital world with CaptainAltcoin, your trusty compass for crypto guides, reviews, and news.
7 подписок(и/а)
101.4K+ подписчиков(а)
94.7K+ понравилось
1 Значки
Посты
Статья
Bitcoin (BTC) and XRP Price Predictions for November: the Best and Worst Case ScenariosBitcoin and XRP are heading into November after October’s repeated recoveries failed to end their downward trends. Each rebound has faced renewed selling, and both assets are now close to support levels that could determine how the next month unfolds.
The November outlook brings competing possibilities. Economic reports, ETF demand and regulatory developments could help buyers regain control, but the technical picture still leaves room for further declines. The crucial question is whether either asset can break its descending pattern before support gives way.
Bitcoin’s October Decline Leaves Its November Recovery Dependent On A Breakout
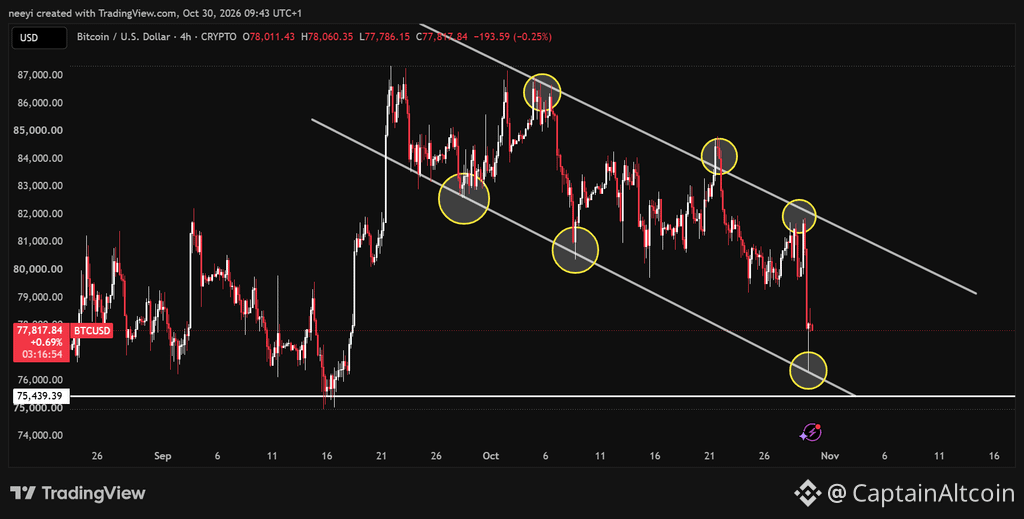
Bitcoin’s recent price movements show a clear sequence of lower highs and lower lows. BTC rebounded from approximately $82,700 to $86,900 before declining toward $80,400. The recovery that followed stopped around $84,800, below the previous peak.
Selling then pushed Bitcoin toward $79,400 before another rebound reached approximately $81,900. The latest decline extended toward $76,550, which continued the downward pattern that developed toward the end of September.
BTC Price Chart / TradingView.com
This structure matters because a recovery toward $79,000 or $80,000 would still fit within the descending channel. Bitcoin could reach those levels and face another decline without changing its broader direction.
The $75,000 to $75,500 support zone is particularly important for November. A successful defence would preserve the possibility of a recovery, although repeated tests could weaken that defence.
Bitcoin needs a sustained breakout above the channel and $81,000 to improve its outlook. That would create a route toward $85,000, followed by $87,000 if buying pressure continues.
Inflation Reports And ETF Flows Could Drive Bitcoin Price In November
The Federal Reserve held its benchmark rate at 3.75% to 4% on October 28 and maintained that inflation remained elevated. That decision leaves November’s economic reports important for expectations about the next policy move.
Persistent inflation could keep borrowing costs elevated and support the dollar, which could weigh on Bitcoin. Softer inflation alongside stable economic activity would provide a more favourable backdrop for a recovery.
ETF demand also remains relevant after uneven October flows. US spot Bitcoin ETFs recorded approximately $635.6 million in net outflows on October 22, followed by $137.3 million in net inflows on October 28. Sustained inflows would offer stronger support than occasional positive sessions.
The $81,500 area also deserves attention as a potential recovery barrier. Bitcoin would need to reclaim nearby resistance before institutional demand could support a move toward $85,000 to $87,000.
Political developments could influence expectations about crypto legislation during November. However, improved sentiment would need to translate into actual demand before it could help Bitcoin escape its downward channel.
Bitcoin’s Daily Indicators Show Sellers Retain The Advantage
Bitcoin’s RSI(14) reads 36.871, below the neutral midpoint of 50. Momentum remains weak, although the indicator has not reached the conventional oversold threshold of 30.
The MACD(12,26) reading of −852.202 reinforces the bearish trend. A negative value shows that the shorter moving average remains below the longer moving average. The signal line and histogram would help establish whether that weakness is easing.
The Ultimate Oscillator reads 47.245, which also places momentum below its midpoint. This offers limited confirmation that the recent rebound can develop into a sustained recovery.
Bull/Bear Power(13) reads −5,857.9943, consistent with continued selling pressure. Collectively, these indicators support caution until Bitcoin confirms a breakout through resistance.
Read Also: SUI Launches Asset Transfers on Mercado Bitcoin in Brazil
Bitcoin Price Predictions For November Include Recovery And Breakdown Scenarios
Bullish scenario: Bitcoin breaks above the descending channel and $81,000 before reclaiming $85,000. A further move through $87,000 would open the route toward $90,000 and potentially $94,000.
Neutral scenario: Buyers defend $75,000, but recoveries repeatedly fail near resistance. Bitcoin could spend much of November between $75,000 and $84,000.
Bearish scenario: Bitcoin loses $75,000 and fails to recover that level. The next downside targets become $70,000 and $67,000.
XRP’s October Decline Brings $1.14 Support Into Focus
XRP has followed a similar downward pattern through lower highs and lower lows. Its latest decline reached approximately $1.19, which leaves buyers under pressure as November draws closer.
A recovery from this area could take XRP toward $1.30 to $1.32. However, that move would remain part of the descending channel unless the price breaks above its upper boundary.
XRP Price Chart / TradingView.com
Another rejection could bring $1.17 into focus before a deeper test of $1.14. The latter represents the stronger support level in the November outlook.
A sustained break below $1.14 would weaken the recovery case and expose $1.00. Conversely, a successful channel breakout would open a route toward $1.42, followed by $1.69 to $1.70 if demand strengthens.
Ripple Escrow And Institutional Demand Could Influence XRP Price In November
Ripple’s monthly escrow releases remain relevant to XRP’s supply outlook. However, unlocked XRP does not automatically enter the market because unused amounts can return to escrow. The important measure is how much becomes available for distribution relative to demand.
November also marks the first anniversary of Canary’s spot XRP ETF, which began trading on November 13, 2025. A longer performance record could support institutional evaluation, although the anniversary itself does not guarantee fresh allocations.
WisdomTree’s earlier XRP fund filing should not be treated as an upcoming approval catalyst. The company requested withdrawal of that registration statement in January 2026 after deciding against proceeding with the offering at that time.
Ripple’s October announcement of final OCC approval for its national trust bank provides another development to monitor. Its approved activities include RLUSD reserve management and fiduciary custody. XRP’s price response will depend on actual demand rather than the approval alone.
XRP’s Daily Indicators Keep the November Outlook Cautious
XRP’s RSI(14) reads 35.588, which indicates weak momentum without confirming an oversold reversal. Buyers need stronger price follow through before the indicator supports a more constructive outlook.
The negative MACD reading supports the bearish direction, although its numerical scale requires confirmation against the original indicator display.
The Ultimate Oscillator reads 43.864, below the neutral midpoint. Negative Bull/Bear Power also supports the view that sellers retain control.
Read Also: Silver Price Today: Silver Crashes 3% as Post-Fed Selling Returns
XRP Price Predictions For November Depend On Support And Resistance
Bullish scenario: XRP breaks above its descending channel and clears $1.30 to $1.32. The next target becomes $1.42, followed by $1.69 to $1.70.
Neutral scenario: XRP holds $1.14 but struggles to clear resistance. Price could remain broadly between $1.14 and $1.32.
Bearish scenario: XRP loses $1.17 before breaking its stronger $1.14 support. That would expose a possible decline toward $1.00.
Subscribe to our YouTube channel for daily crypto updates, market insights, and expert analysis.
The post Bitcoin (BTC) And XRP Price Predictions For November: The Best And Worst Case Scenarios appeared first on CaptainAltcoin.
Bitcoin (BTC) and XRP Price Predictions for November: the Best and Worst Case Scenarios
Bitcoin and XRP are heading into November after October’s repeated recoveries failed to end their downward trends. Each rebound has faced renewed selling, and both assets are now close to support levels that could determine how the next month unfolds.
The November outlook brings competing possibilities. Economic reports, ETF demand and regulatory developments could help buyers regain control, but the technical picture still leaves room for further declines. The crucial question is whether either asset can break its descending pattern before support gives way.
Bitcoin’s October Decline Leaves Its November Recovery Dependent On A Breakout
Bitcoin’s recent price movements show a clear sequence of lower highs and lower lows. BTC rebounded from approximately $82,700 to $86,900 before declining toward $80,400. The recovery that followed stopped around $84,800, below the previous peak.
Selling then pushed Bitcoin toward $79,400 before another rebound reached approximately $81,900. The latest decline extended toward $76,550, which continued the downward pattern that developed toward the end of September.
BTC Price Chart / TradingView.com
This structure matters because a recovery toward $79,000 or $80,000 would still fit within the descending channel. Bitcoin could reach those levels and face another decline without changing its broader direction.
The $75,000 to $75,500 support zone is particularly important for November. A successful defence would preserve the possibility of a recovery, although repeated tests could weaken that defence.
Bitcoin needs a sustained breakout above the channel and $81,000 to improve its outlook. That would create a route toward $85,000, followed by $87,000 if buying pressure continues.
Inflation Reports And ETF Flows Could Drive Bitcoin Price In November
The Federal Reserve held its benchmark rate at 3.75% to 4% on October 28 and maintained that inflation remained elevated. That decision leaves November’s economic reports important for expectations about the next policy move.
Persistent inflation could keep borrowing costs elevated and support the dollar, which could weigh on Bitcoin. Softer inflation alongside stable economic activity would provide a more favourable backdrop for a recovery.
ETF demand also remains relevant after uneven October flows. US spot Bitcoin ETFs recorded approximately $635.6 million in net outflows on October 22, followed by $137.3 million in net inflows on October 28. Sustained inflows would offer stronger support than occasional positive sessions.
The $81,500 area also deserves attention as a potential recovery barrier. Bitcoin would need to reclaim nearby resistance before institutional demand could support a move toward $85,000 to $87,000.
Political developments could influence expectations about crypto legislation during November. However, improved sentiment would need to translate into actual demand before it could help Bitcoin escape its downward channel.
Bitcoin’s Daily Indicators Show Sellers Retain The Advantage
Bitcoin’s RSI(14) reads 36.871, below the neutral midpoint of 50. Momentum remains weak, although the indicator has not reached the conventional oversold threshold of 30.
The MACD(12,26) reading of −852.202 reinforces the bearish trend. A negative value shows that the shorter moving average remains below the longer moving average. The signal line and histogram would help establish whether that weakness is easing.
The Ultimate Oscillator reads 47.245, which also places momentum below its midpoint. This offers limited confirmation that the recent rebound can develop into a sustained recovery.
Bull/Bear Power(13) reads −5,857.9943, consistent with continued selling pressure. Collectively, these indicators support caution until Bitcoin confirms a breakout through resistance.
Read Also: SUI Launches Asset Transfers on Mercado Bitcoin in Brazil
Bitcoin Price Predictions For November Include Recovery And Breakdown Scenarios
Bullish scenario: Bitcoin breaks above the descending channel and $81,000 before reclaiming $85,000. A further move through $87,000 would open the route toward $90,000 and potentially $94,000.
Neutral scenario: Buyers defend $75,000, but recoveries repeatedly fail near resistance. Bitcoin could spend much of November between $75,000 and $84,000.
Bearish scenario: Bitcoin loses $75,000 and fails to recover that level. The next downside targets become $70,000 and $67,000.
XRP’s October Decline Brings $1.14 Support Into Focus
XRP has followed a similar downward pattern through lower highs and lower lows. Its latest decline reached approximately $1.19, which leaves buyers under pressure as November draws closer.
A recovery from this area could take XRP toward $1.30 to $1.32. However, that move would remain part of the descending channel unless the price breaks above its upper boundary.
XRP Price Chart / TradingView.com
Another rejection could bring $1.17 into focus before a deeper test of $1.14. The latter represents the stronger support level in the November outlook.
A sustained break below $1.14 would weaken the recovery case and expose $1.00. Conversely, a successful channel breakout would open a route toward $1.42, followed by $1.69 to $1.70 if demand strengthens.
Ripple Escrow And Institutional Demand Could Influence XRP Price In November
Ripple’s monthly escrow releases remain relevant to XRP’s supply outlook. However, unlocked XRP does not automatically enter the market because unused amounts can return to escrow. The important measure is how much becomes available for distribution relative to demand.
November also marks the first anniversary of Canary’s spot XRP ETF, which began trading on November 13, 2025. A longer performance record could support institutional evaluation, although the anniversary itself does not guarantee fresh allocations.
WisdomTree’s earlier XRP fund filing should not be treated as an upcoming approval catalyst. The company requested withdrawal of that registration statement in January 2026 after deciding against proceeding with the offering at that time.
Ripple’s October announcement of final OCC approval for its national trust bank provides another development to monitor. Its approved activities include RLUSD reserve management and fiduciary custody. XRP’s price response will depend on actual demand rather than the approval alone.
XRP’s Daily Indicators Keep the November Outlook Cautious
XRP’s RSI(14) reads 35.588, which indicates weak momentum without confirming an oversold reversal. Buyers need stronger price follow through before the indicator supports a more constructive outlook.
The negative MACD reading supports the bearish direction, although its numerical scale requires confirmation against the original indicator display.
The Ultimate Oscillator reads 43.864, below the neutral midpoint. Negative Bull/Bear Power also supports the view that sellers retain control.
Read Also: Silver Price Today: Silver Crashes 3% as Post-Fed Selling Returns
XRP Price Predictions For November Depend On Support And Resistance
Bullish scenario: XRP breaks above its descending channel and clears $1.30 to $1.32. The next target becomes $1.42, followed by $1.69 to $1.70.
Neutral scenario: XRP holds $1.14 but struggles to clear resistance. Price could remain broadly between $1.14 and $1.32.
Bearish scenario: XRP loses $1.17 before breaking its stronger $1.14 support. That would expose a possible decline toward $1.00.
Subscribe to our YouTube channel for daily crypto updates, market insights, and expert analysis.
The post Bitcoin (BTC) And XRP Price Predictions For November: The Best And Worst Case Scenarios appeared first on CaptainAltcoin.
1
1.9k
Binance Hack Wasn’t a Private Key Leak. That May Be the Bigger ProblemThe biggest crypto hack on record may not have started with stolen wallet keys at all.
Binance says its preliminary investigation into the $6.3 billion security incident points to a compromised DevOps engineer’s laptop, which allegedly gave the attacker access to internal systems capable of submitting unauthorized withdrawals.
The exchange says it has found no evidence that any wallet private keys were leaked.
That detail changes the story.
This was potentially not a case of hackers breaking the cryptography protecting a wallet.
It was a case of gaining access to the machinery that was already authorized to move money.
The Real Weak Point May Have Been Internal Authorization
Initial reports circulated by The Kobeissi Letter describe attackers redirecting transactions and moving funds through attacker-controlled addresses across several blockchains.
Some reports also point to Ethereum’s EIP-7702 mechanism being involved in part of the Ethereum-side activity.
But Binance has not yet confirmed that specific technical sequence.
What Binance has confirmed is narrower and arguably more important: a compromised employee device may have allowed an attacker to access a service container and submit withdrawal transactions that the exchange’s systems treated as legitimate.
New details on how the $6.3 billion Binance hack likely occurred: According to initial reports, hackers compromised a Binance engineer’s laptop, gaining access to internal systems used to authorize withdrawals. The attackers then: 1. Hijacked a Binance hot wallet using Ethereum’s EIP-7702 mechanism 2. Redirected wallet transactions to a malicious smart contract 3. Transferred billions in crypto attacker-controlled wallets 4. Spread the stolen funds across multiple wallets and converted some assets into ETH to avoid freezes The attack unfolded across multiple blockchains, with most funds drained in ~20 minutes. ~$3 billion of these funds have now been frozen, and Binance says it will cover all unrecovered hacking losses. The full investigation remains ongoing.
— The Kobeissi Letter (@KobeissiLetter) October 30, 2026
That helps explain why the attack could become so large without a conventional private-key leak.
CoinDesk’s analysis of the stolen Bitcoin found that the transactions carried valid signatures from Binance-controlled addresses and resembled ordinary withdrawals.
In other words, the security problem may have existed one layer above the wallet itself.
The keys could still be secure.
The system telling those keys what to sign may not have been.
Why This Attack Was So Difficult to Stop
Blockchain intelligence firms say the attackers moved funds across roughly 10 blockchains, with much of the activity taking place in around 20 minutes.
TRM Labs has attributed the attack with high confidence to North Korea-linked TraderTraitor, the same group connected to other large crypto thefts.
Speed was critical.
Once the unauthorized withdrawals began, assets were distributed across multiple addresses and networks before exchanges and token issuers had time to react.
That is also why different parts of the stolen portfolio now face very different outcomes.
Stablecoin issuers such as Tether and Circle can blacklist specific addresses.
Bitcoin cannot.
Roughly 18,270 BTC worth around $1.4 billion was moved into 19 wallets after the attack. Those coins cannot simply be frozen at the protocol level and can generally only be intercepted if they later reach a cooperative exchange, OTC desk or other identifiable service.
This is one reason the recovery figure has already become so important.
Binance says approximately $3 billion of the affected assets have been frozen on-chain so far, leaving billions still unresolved.
One Laptop, Billions of Dollars
For me, this is the part of the Binance hack that deserves more attention.
Crypto security discussions often focus on private keys, multisig wallets and smart-contract exploits.
But centralized exchanges also depend on traditional corporate infrastructure.
Employees have laptops.
Internal services have permissions.
Withdrawal systems need automation.
Those operational layers can become just as important as the wallets themselves.
If Binance’s initial findings are confirmed, one compromised workstation did not need to reveal billions of dollars worth of private keys.
It only needed to give the attacker access to a trusted internal process with enough authority to instruct Binance’s systems to move funds.
That is a very different security failure.
And potentially a much harder one for exchanges to eliminate completely.
For more crypto news and price predictions, click here.
Subscribe to our YouTube channel for daily crypto updates, market insights, and expert analysis.
The post Binance Hack Wasn’t a Private Key Leak. That May Be the Bigger Problem appeared first on CaptainAltcoin.
Binance Hack Wasn’t a Private Key Leak. That May Be the Bigger Problem
The biggest crypto hack on record may not have started with stolen wallet keys at all.
Binance says its preliminary investigation into the $6.3 billion security incident points to a compromised DevOps engineer’s laptop, which allegedly gave the attacker access to internal systems capable of submitting unauthorized withdrawals.
The exchange says it has found no evidence that any wallet private keys were leaked.
That detail changes the story.
This was potentially not a case of hackers breaking the cryptography protecting a wallet.
It was a case of gaining access to the machinery that was already authorized to move money.
The Real Weak Point May Have Been Internal Authorization
Initial reports circulated by The Kobeissi Letter describe attackers redirecting transactions and moving funds through attacker-controlled addresses across several blockchains.
Some reports also point to Ethereum’s EIP-7702 mechanism being involved in part of the Ethereum-side activity.
But Binance has not yet confirmed that specific technical sequence.
What Binance has confirmed is narrower and arguably more important: a compromised employee device may have allowed an attacker to access a service container and submit withdrawal transactions that the exchange’s systems treated as legitimate.
New details on how the $6.3 billion Binance hack likely occurred: According to initial reports, hackers compromised a Binance engineer’s laptop, gaining access to internal systems used to authorize withdrawals. The attackers then: 1. Hijacked a Binance hot wallet using Ethereum’s EIP-7702 mechanism 2. Redirected wallet transactions to a malicious smart contract 3. Transferred billions in crypto attacker-controlled wallets 4. Spread the stolen funds across multiple wallets and converted some assets into ETH to avoid freezes The attack unfolded across multiple blockchains, with most funds drained in ~20 minutes. ~$3 billion of these funds have now been frozen, and Binance says it will cover all unrecovered hacking losses. The full investigation remains ongoing.
— The Kobeissi Letter (@KobeissiLetter) October 30, 2026
That helps explain why the attack could become so large without a conventional private-key leak.
CoinDesk’s analysis of the stolen Bitcoin found that the transactions carried valid signatures from Binance-controlled addresses and resembled ordinary withdrawals.
In other words, the security problem may have existed one layer above the wallet itself.
The keys could still be secure.
The system telling those keys what to sign may not have been.
Why This Attack Was So Difficult to Stop
Blockchain intelligence firms say the attackers moved funds across roughly 10 blockchains, with much of the activity taking place in around 20 minutes.
TRM Labs has attributed the attack with high confidence to North Korea-linked TraderTraitor, the same group connected to other large crypto thefts.
Speed was critical.
Once the unauthorized withdrawals began, assets were distributed across multiple addresses and networks before exchanges and token issuers had time to react.
That is also why different parts of the stolen portfolio now face very different outcomes.
Stablecoin issuers such as Tether and Circle can blacklist specific addresses.
Bitcoin cannot.
Roughly 18,270 BTC worth around $1.4 billion was moved into 19 wallets after the attack. Those coins cannot simply be frozen at the protocol level and can generally only be intercepted if they later reach a cooperative exchange, OTC desk or other identifiable service.
This is one reason the recovery figure has already become so important.
Binance says approximately $3 billion of the affected assets have been frozen on-chain so far, leaving billions still unresolved.
One Laptop, Billions of Dollars
For me, this is the part of the Binance hack that deserves more attention.
Crypto security discussions often focus on private keys, multisig wallets and smart-contract exploits.
But centralized exchanges also depend on traditional corporate infrastructure.
Employees have laptops.
Internal services have permissions.
Withdrawal systems need automation.
Those operational layers can become just as important as the wallets themselves.
If Binance’s initial findings are confirmed, one compromised workstation did not need to reveal billions of dollars worth of private keys.
It only needed to give the attacker access to a trusted internal process with enough authority to instruct Binance’s systems to move funds.
That is a very different security failure.
And potentially a much harder one for exchanges to eliminate completely.
For more crypto news and price predictions, click here.
Subscribe to our YouTube channel for daily crypto updates, market insights, and expert analysis.
The post Binance Hack Wasn’t a Private Key Leak. That May Be the Bigger Problem appeared first on CaptainAltcoin.
3
3
3.1k
Статья
Bitcoin (BTC) and Gold Price Predictions for Today, October 30Bitcoin’s recovery from an early decline faces a crucial test today, October 30, as gold moves closer to an important support area. Both assets remain under pressure, although their indicators offer different clues about the possibility of a rebound.
The Bitcoin price prediction depends on whether its recovery can clear resistance and hold above it. Gold’s outlook centres on whether support can absorb further selling before buyers attempt to recover lost ground.
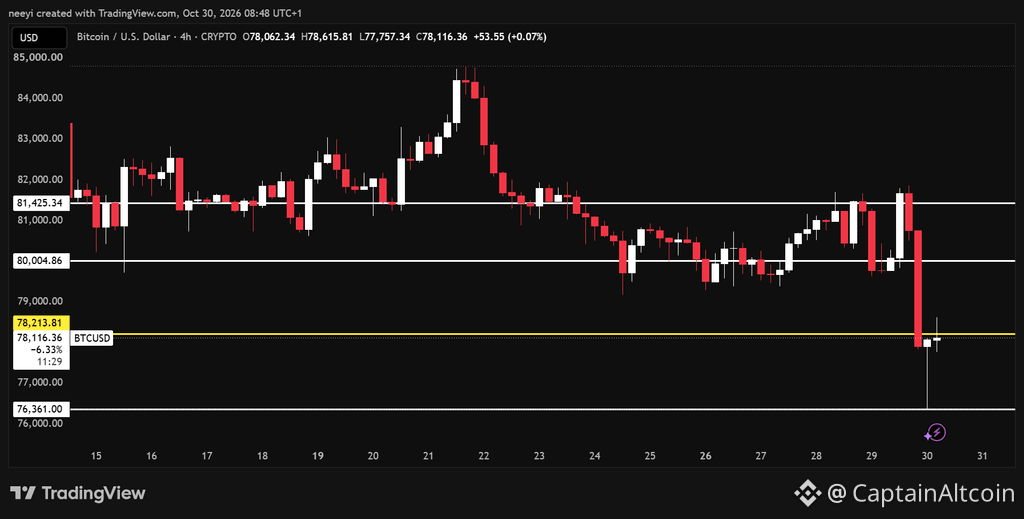
Bitcoin Price Recovery Faces A Crucial Test At $78,200
Bitcoin declined toward $76,000 earlier today before recovering to approximately $78,000. That rebound brought BTC close to $78,200, the level that could determine whether the recovery continues or fades.
The distinction between resistance and support matters here. Bitcoin must first break above $78,200 before that level can become support. A recovery toward this barrier alone does not confirm that buyers have regained control.
A sustained move above $78,200 would open the route toward $79,000 and $80,000. Stronger buying could extend the recovery toward $81,000, with $81,400 representing the upper target in the supplied outlook.
Failure to clear $78,200 would leave Bitcoin vulnerable to another test of $76,000. A break below that earlier low would bring $75,000 into focus.
The early decline therefore remains relevant despite the rebound. Bitcoin needs to hold its recovery through a resistance test before the broader intraday picture becomes more constructive.
Bitcoin Indicators Show A Rebound Against Continued Bearish Pressure
RSI(14) reads 42.784, below the midpoint of 50. This indicates that bearish momentum still has the advantage despite Bitcoin’s recovery. A move toward 50 would strengthen the case for a successful test of $78,200.
Stochastic(9,6) reads 73.372, which supports the presence of a short term rebound. However, this reading measures price relative to its recent range and does not independently confirm a lasting recovery. Its contrast with RSI helps explain why BTC can rise without removing the broader bearish pressure.
MACD(12,26) reads −619.527, which places the indicator below zero. The negative reading supports a cautious interpretation of the rebound, although the signal line and histogram would be needed to assess whether momentum is improving.
Highs/Lows(14) reads −205.7950, consistent with continued weakness relative to its recent price reference. This adds another reason to watch how Bitcoin behaves near resistance before treating the bounce as a stronger recovery.
Bull/Bear Power(13) reads −219.1404, which supports the view that sellers retain an advantage. Buyers would need sustained progress above $78,200 to challenge that condition.
Indicator Value Action Interpretation RSI(14) 42.784 Momentum remains below the neutral midpoint. STOCH(9,6) 73.372 The rebound has short term momentum. MACD(12,26) −619.527 Negative momentum remains a recovery obstacle. Highs/Lows(14) −205.7950 Recent price pressure remains broadly negative. Bull/Bear Power(13) −219.1404 Sellers retain the stronger overall position.
Bitcoin Price Prediction For Today: Bullish, Neutral And Bearish Scenarios
Bullish scenario: Bitcoin breaks above $78,200 and holds that level during a retest. The next targets become $79,000 and $80,000, followed by $81,000 to $81,400 if buying strengthens.
Neutral scenario: Bitcoin remains between $76,000 and $78,200, with repeated resistance tests but no sustained breakout.
Bearish scenario: Rejection around $78,200 sends BTC back toward $76,000. Failure to defend that support opens the possibility of $75,000.
Gold Price Nears $3,970 Support After Another Decline
Gold also retains a bearish intraday structure after extending its decline from yesterday. The chart places the opening near $4,020, the session high around $4,027, and the low close to $3,980.
That puts gold within reach of the $3,970 support identified in the supplied analysis. The same account describes previous defences around this area on October 23 and October 26, alongside earlier tests during June and July.
Those previous reactions make the area relevant, although repeated tests cannot guarantee another successful defence. Continued pressure could eventually exhaust the demand that previously supported the price.
The immediate downside area therefore extends from $3,970 to $3,960. A rebound from this zone would face its first meaningful test around $3,990.
Recovery above $3,990 would improve the prospect of a move toward $4,000 and then $4,020. An extension toward $4,030 remains possible under stronger buying conditions, although it represents the more optimistic outcome.
Gold Indicators Leave Room For A Bounce Without Confirming Recovery
RSI(14) reads 30.761, close to the conventional oversold threshold of 30. Gold is under substantial downward pressure, but this reading alone cannot establish that a bottom has formed.
Stochastic(9,6) reads 6.706, deep within oversold territory. This creates room for a technical rebound near $3,970 to $3,960, although the indicator can remain depressed during a persistent decline.
MACD(12,26) reads −12.251, consistent with negative momentum. Gold would need more convincing price strength before a bounce could support a broader recovery argument.
Highs/Lows(14) reads −23.6200, which reinforces the weakness visible in the price action. A recovery through $3,990 would provide a useful initial sign that this pressure is easing.
Bull/Bear Power(13) reads −33.1559, another indication that sellers retain control. This makes the support response especially important for today’s gold price prediction.
Indicator Value Action Interpretation RSI(14) 30.761 Momentum is weak and near oversold territory. STOCH(9,6) 6.706 Deep oversold conditions allow rebound potential. MACD(12,26) −12.251 Negative momentum continues to restrict recovery. Highs/Lows(14) −23.6200 Recent price weakness remains evident. Bull/Bear Power(13) −33.1559 Sellers maintain the stronger overall position.
Gold Price Prediction For Today: Bullish, Neutral And Bearish Scenarios
Bullish scenario: Gold defends $3,970 to $3,960 and recovers above $3,990. The next levels become $4,000 and $4,020, with $4,030 requiring stronger demand.
Neutral scenario: Gold trades between $3,970 and $4,020, with $3,990 acting as the central recovery test.
Bearish scenario: Gold breaks below $3,970 and tests $3,960. Continued weakness below that area would invalidate the proposed support bounce.
Subscribe to our YouTube channel for daily crypto updates, market insights, and expert analysis.
The post Bitcoin (BTC) and Gold Price Predictions for Today, October 30 appeared first on CaptainAltcoin.
Bitcoin (BTC) and Gold Price Predictions for Today, October 30
Bitcoin’s recovery from an early decline faces a crucial test today, October 30, as gold moves closer to an important support area. Both assets remain under pressure, although their indicators offer different clues about the possibility of a rebound.
The Bitcoin price prediction depends on whether its recovery can clear resistance and hold above it. Gold’s outlook centres on whether support can absorb further selling before buyers attempt to recover lost ground.
Bitcoin Price Recovery Faces A Crucial Test At $78,200
Bitcoin declined toward $76,000 earlier today before recovering to approximately $78,000. That rebound brought BTC close to $78,200, the level that could determine whether the recovery continues or fades.
The distinction between resistance and support matters here. Bitcoin must first break above $78,200 before that level can become support. A recovery toward this barrier alone does not confirm that buyers have regained control.
A sustained move above $78,200 would open the route toward $79,000 and $80,000. Stronger buying could extend the recovery toward $81,000, with $81,400 representing the upper target in the supplied outlook.
Failure to clear $78,200 would leave Bitcoin vulnerable to another test of $76,000. A break below that earlier low would bring $75,000 into focus.
The early decline therefore remains relevant despite the rebound. Bitcoin needs to hold its recovery through a resistance test before the broader intraday picture becomes more constructive.
Bitcoin Indicators Show A Rebound Against Continued Bearish Pressure
RSI(14) reads 42.784, below the midpoint of 50. This indicates that bearish momentum still has the advantage despite Bitcoin’s recovery. A move toward 50 would strengthen the case for a successful test of $78,200.
Stochastic(9,6) reads 73.372, which supports the presence of a short term rebound. However, this reading measures price relative to its recent range and does not independently confirm a lasting recovery. Its contrast with RSI helps explain why BTC can rise without removing the broader bearish pressure.
MACD(12,26) reads −619.527, which places the indicator below zero. The negative reading supports a cautious interpretation of the rebound, although the signal line and histogram would be needed to assess whether momentum is improving.
Highs/Lows(14) reads −205.7950, consistent with continued weakness relative to its recent price reference. This adds another reason to watch how Bitcoin behaves near resistance before treating the bounce as a stronger recovery.
Bull/Bear Power(13) reads −219.1404, which supports the view that sellers retain an advantage. Buyers would need sustained progress above $78,200 to challenge that condition.
Indicator Value Action Interpretation RSI(14) 42.784 Momentum remains below the neutral midpoint. STOCH(9,6) 73.372 The rebound has short term momentum. MACD(12,26) −619.527 Negative momentum remains a recovery obstacle. Highs/Lows(14) −205.7950 Recent price pressure remains broadly negative. Bull/Bear Power(13) −219.1404 Sellers retain the stronger overall position.
Bitcoin Price Prediction For Today: Bullish, Neutral And Bearish Scenarios
Bullish scenario: Bitcoin breaks above $78,200 and holds that level during a retest. The next targets become $79,000 and $80,000, followed by $81,000 to $81,400 if buying strengthens.
Neutral scenario: Bitcoin remains between $76,000 and $78,200, with repeated resistance tests but no sustained breakout.
Bearish scenario: Rejection around $78,200 sends BTC back toward $76,000. Failure to defend that support opens the possibility of $75,000.
Gold Price Nears $3,970 Support After Another Decline
Gold also retains a bearish intraday structure after extending its decline from yesterday. The chart places the opening near $4,020, the session high around $4,027, and the low close to $3,980.
That puts gold within reach of the $3,970 support identified in the supplied analysis. The same account describes previous defences around this area on October 23 and October 26, alongside earlier tests during June and July.
Those previous reactions make the area relevant, although repeated tests cannot guarantee another successful defence. Continued pressure could eventually exhaust the demand that previously supported the price.
The immediate downside area therefore extends from $3,970 to $3,960. A rebound from this zone would face its first meaningful test around $3,990.
Recovery above $3,990 would improve the prospect of a move toward $4,000 and then $4,020. An extension toward $4,030 remains possible under stronger buying conditions, although it represents the more optimistic outcome.
Gold Indicators Leave Room For A Bounce Without Confirming Recovery
RSI(14) reads 30.761, close to the conventional oversold threshold of 30. Gold is under substantial downward pressure, but this reading alone cannot establish that a bottom has formed.
Stochastic(9,6) reads 6.706, deep within oversold territory. This creates room for a technical rebound near $3,970 to $3,960, although the indicator can remain depressed during a persistent decline.
MACD(12,26) reads −12.251, consistent with negative momentum. Gold would need more convincing price strength before a bounce could support a broader recovery argument.
Highs/Lows(14) reads −23.6200, which reinforces the weakness visible in the price action. A recovery through $3,990 would provide a useful initial sign that this pressure is easing.
Bull/Bear Power(13) reads −33.1559, another indication that sellers retain control. This makes the support response especially important for today’s gold price prediction.
Indicator Value Action Interpretation RSI(14) 30.761 Momentum is weak and near oversold territory. STOCH(9,6) 6.706 Deep oversold conditions allow rebound potential. MACD(12,26) −12.251 Negative momentum continues to restrict recovery. Highs/Lows(14) −23.6200 Recent price weakness remains evident. Bull/Bear Power(13) −33.1559 Sellers maintain the stronger overall position.
Gold Price Prediction For Today: Bullish, Neutral And Bearish Scenarios
Bullish scenario: Gold defends $3,970 to $3,960 and recovers above $3,990. The next levels become $4,000 and $4,020, with $4,030 requiring stronger demand.
Neutral scenario: Gold trades between $3,970 and $4,020, with $3,990 acting as the central recovery test.
Bearish scenario: Gold breaks below $3,970 and tests $3,960. Continued weakness below that area would invalidate the proposed support bounce.
Subscribe to our YouTube channel for daily crypto updates, market insights, and expert analysis.
The post Bitcoin (BTC) and Gold Price Predictions for Today, October 30 appeared first on CaptainAltcoin.
1
2
1.4k
Статья
XRP Price Correction Could Get Worse Before the Next Rally!XRP price has broken another support level, and one of the analysts we regularly follow believes the correction could still have more room to run before the next larger rally begins.
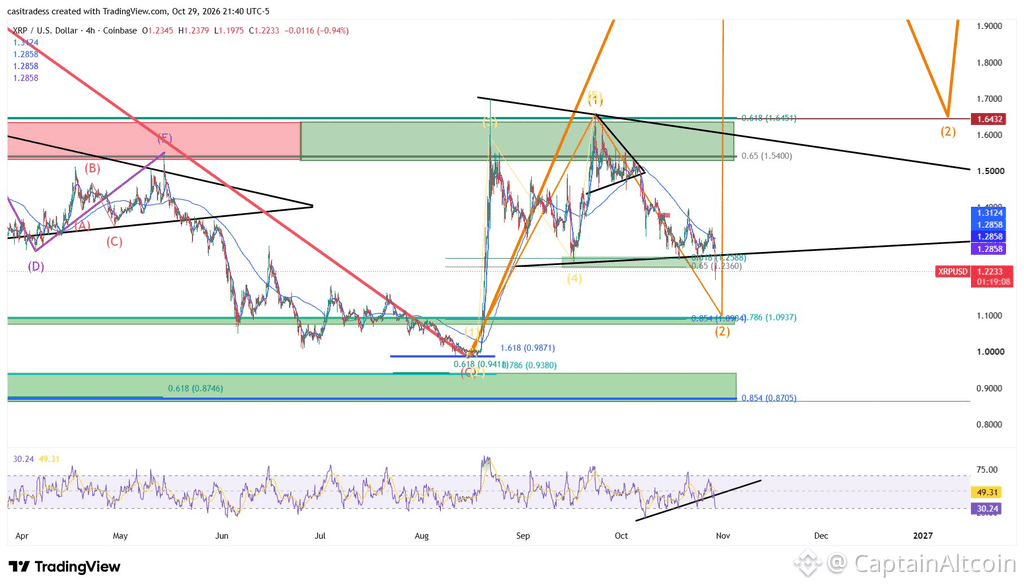
CasiTrades says XRP has fallen below the local 0.618 Fibonacci support around $1.27 and is now finding temporary support around $1.20.
Her next important level is $1.10.
Below that, she still has the much-discussed $0.87 region on the chart.
That sounds bearish at first, but CasiTrades has not abandoned her larger bullish XRP thesis.
She believes the current decline still fits a Wave 2 correction, which could eventually set up a much stronger Wave 3 advance.
Why We Keep Following CasiTrades
We cover CasiTrades fairly often at CaptainAltcoin because her analysis tends to be grounded in clearly defined levels rather than sensational price calls.
She usually lays out both sides of a setup, shows where her interpretation would fail, and updates the wave count when price changes.
That is particularly useful with XRP, where exaggerated targets are common.
What Her XRP Chart Is Showing
The four-hour Coinbase chart places XRP around $1.22 after price fell below the $1.27 region.
CasiTrades had been watching that area because it lined up with the local 0.618 Fibonacci retracement.
Source: X/@CasiTrades
Once that support failed, XRP moved rapidly toward $1.20.
That level is interesting because it previously acted as resistance.
Old resistance can sometimes become support when price returns to it, but the chart does not show a confirmed reversal there yet.
The next zone CasiTrades identifies is approximately $1.10, with a Fibonacci level near $1.0937.
That is now the main downside area to watch.
If $1.10 holds, she believes the larger new-trend Elliott Wave count remains valid.
If selling continues, her chart also leaves room for the XRP price to revisit the $0.94-$0.87 region.
CasiTrades says she personally has a spot order around $0.94 after previously buying near the $1.10 macro Fibonacci area.
That is her personal positioning, not a guarantee that XRP reaches either price.
Why $0.98 Is Important
There is another level on the XRP chart that may be even more important than $0.87.
CasiTrades says a new low below roughly $0.98 would reset the current wave count.
In other words, XRP can continue falling from current levels without immediately destroying her bullish interpretation.
But once price starts moving beneath the previous structural low near $0.98, the existing setup would need to be reconsidered and the expected larger Wave 3 could be delayed.
That creates a clear hierarchy.
Around $1.20, XRP is trying to stabilize.
Around $1.10, the larger bullish structure faces another important test.
Around $0.98, the current wave interpretation begins to lose validity.
And $0.94-$0.87 represents the deeper support region if the correction becomes more aggressive.
XRP Price Outlook: The Bullish Part Comes After the Pain
The main idea behind CasiTrades’ analysis is that a severe Wave 2 correction does not automatically cancel the larger uptrend.
Wave 2 declines can retrace a large portion of the initial Wave 1 advance.
They can also remove leveraged traders who entered late and make the market look especially weak shortly before the next impulsive leg develops.
That is what she believes could be happening with XRP.
Her chart still maps a later recovery back toward the $1.54-$1.64 area before a much larger advance develops.
But there is an important difference between a possible future Wave 3 and what XRP is doing today.
The bullish move has not started yet.
XRP is still correcting.
For me, that is what makes this analysis useful.
CasiTrades is not trying to turn every red candle into a bullish headline. She accepts that XRP could fall further and gives specific levels where her thesis would need to change.
Right now, $1.10 is the next key test.
If that area holds and buyers begin rebuilding structure, the Wave 3 scenario remains interesting.
If XRP falls below $0.98, however, the timeline for the larger recovery becomes much less straightforward.
So yes, the XRP price correction could get worse before the next rally.
For more crypto news and price predictions, click here.
Subscribe to our YouTube channel for daily crypto updates, market insights, and expert analysis.
The post XRP Price Correction Could Get Worse Before the Next Rally! appeared first on CaptainAltcoin.
XRP Price Correction Could Get Worse Before the Next Rally!
XRP price has broken another support level, and one of the analysts we regularly follow believes the correction could still have more room to run before the next larger rally begins.
CasiTrades says XRP has fallen below the local 0.618 Fibonacci support around $1.27 and is now finding temporary support around $1.20.
Her next important level is $1.10.
Below that, she still has the much-discussed $0.87 region on the chart.
That sounds bearish at first, but CasiTrades has not abandoned her larger bullish XRP thesis.
She believes the current decline still fits a Wave 2 correction, which could eventually set up a much stronger Wave 3 advance.
Why We Keep Following CasiTrades
We cover CasiTrades fairly often at CaptainAltcoin because her analysis tends to be grounded in clearly defined levels rather than sensational price calls.
She usually lays out both sides of a setup, shows where her interpretation would fail, and updates the wave count when price changes.
That is particularly useful with XRP, where exaggerated targets are common.
What Her XRP Chart Is Showing
The four-hour Coinbase chart places XRP around $1.22 after price fell below the $1.27 region.
CasiTrades had been watching that area because it lined up with the local 0.618 Fibonacci retracement.
Source: X/@CasiTrades
Once that support failed, XRP moved rapidly toward $1.20.
That level is interesting because it previously acted as resistance.
Old resistance can sometimes become support when price returns to it, but the chart does not show a confirmed reversal there yet.
The next zone CasiTrades identifies is approximately $1.10, with a Fibonacci level near $1.0937.
That is now the main downside area to watch.
If $1.10 holds, she believes the larger new-trend Elliott Wave count remains valid.
If selling continues, her chart also leaves room for the XRP price to revisit the $0.94-$0.87 region.
CasiTrades says she personally has a spot order around $0.94 after previously buying near the $1.10 macro Fibonacci area.
That is her personal positioning, not a guarantee that XRP reaches either price.
Why $0.98 Is Important
There is another level on the XRP chart that may be even more important than $0.87.
CasiTrades says a new low below roughly $0.98 would reset the current wave count.
In other words, XRP can continue falling from current levels without immediately destroying her bullish interpretation.
But once price starts moving beneath the previous structural low near $0.98, the existing setup would need to be reconsidered and the expected larger Wave 3 could be delayed.
That creates a clear hierarchy.
Around $1.20, XRP is trying to stabilize.
Around $1.10, the larger bullish structure faces another important test.
Around $0.98, the current wave interpretation begins to lose validity.
And $0.94-$0.87 represents the deeper support region if the correction becomes more aggressive.
XRP Price Outlook: The Bullish Part Comes After the Pain
The main idea behind CasiTrades’ analysis is that a severe Wave 2 correction does not automatically cancel the larger uptrend.
Wave 2 declines can retrace a large portion of the initial Wave 1 advance.
They can also remove leveraged traders who entered late and make the market look especially weak shortly before the next impulsive leg develops.
That is what she believes could be happening with XRP.
Her chart still maps a later recovery back toward the $1.54-$1.64 area before a much larger advance develops.
But there is an important difference between a possible future Wave 3 and what XRP is doing today.
The bullish move has not started yet.
XRP is still correcting.
For me, that is what makes this analysis useful.
CasiTrades is not trying to turn every red candle into a bullish headline. She accepts that XRP could fall further and gives specific levels where her thesis would need to change.
Right now, $1.10 is the next key test.
If that area holds and buyers begin rebuilding structure, the Wave 3 scenario remains interesting.
If XRP falls below $0.98, however, the timeline for the larger recovery becomes much less straightforward.
So yes, the XRP price correction could get worse before the next rally.
For more crypto news and price predictions, click here.
Subscribe to our YouTube channel for daily crypto updates, market insights, and expert analysis.
The post XRP Price Correction Could Get Worse Before the Next Rally! appeared first on CaptainAltcoin.
1
2.7k
Ethereum Flashes an RSI Signal Below 40 As Its Chart Echoes the May 2025 Pectra SetupThe crypto market feels jittery this week, and traders are trimming risk after the latest Fed decision. Ethereum (ETH) trades near $2,311 after a short-term momentum gauge slipped below 40, a reading many chartists treat as a sell signal.
That matters because one analyst sees the chart repeating the setup that came before the Pectra rally. Any Ethereum price prediction now hinges on whether ETH holds its floor, with the coin down about 14% this month.
Traders who position for that swing also watch early-stage projects. One of them is MEMASA ($MEMASA), an upcoming AI trading app that lets users research and trade crypto through a chat.
Ethereum Price Prediction: Analyst Eyes a Pectra-Style Dip Before the Next Rally
ETH bounced off its long-term trend line ahead of the Fed’s rate decision, but the move came on thin trading volume.
That weak bounce caught the eye of analyst Alejandro Arrieche, who mapped out a deeper pullback in a recent FX Empire analysis.
His view leans on history, since the Pectra upgrade sparked a strong ETH rally in May 2025.
Back then, ETH cleared $2,000, left a price gap, then dipped back into it before climbing higher.
He sees a similar path now, with a likely drop toward $1,970 before any lasting rally can begin.
Still, a break above $2,800 would confirm the uptrend, while pending Glamsterdam dates and Middle East tensions keep risks in play.
Support at $2,171 Stands Between ETH and a Deeper Slide
ETH now trades near $2,311, down about 7% over the past week. For any near-term Ethereum price prediction, the nearest strong support sits at $2,171, with resistance at $2,429.
Technical indicators lean bearish, and losing $2,171 could open a path toward $1,725.
Reclaiming $2,429 would ease the pressure and bring the analyst’s bullish case back into view. While ETH struggles to reverse its downtrend, MEMASA ($MEMASA) is preparing to enter the market with an AI crypto trading app, and its token currently sells for $0.0155 in an on-chain early sale.
MEMASA Launches an AI Trading App with Less Chart Staring and More Smart Decisions
MEMASA is an upcoming AI-powered crypto trading app that lets people research, buy, and sell cryptocurrencies by chatting with an AI assistant.
Instead of studying complicated charts, tracking hundreds of tokens, or switching between trading platforms, users will be able to ask MEMASA questions in plain language.
For example: “Can ETH hold its support after the Fed decision?” MEMASA will analyze market indicators, trading activity, and sentiment to explain what the available data suggests.
MEMASA tackles problems almost every on-chain trader knows: too many charts, too much noise, scam tokens, and endless switching between apps. It brings market analysis, risk checks, and trading into one AI-powered chat.
That gives MEMASA a real shot at attracting a wide audience, from crypto newcomers to seasoned traders. MEMASA is preparing for launch, so anyone wishing to can join a waitlist for early access to the app.
How to Join MEMASA Waitlist
Ethereum Price Prediction: ETH’s Bearish Outlook vs. $MEMASA’s Pre-Listing Upside
ETH and $MEMASA are of different leagues: Ethereum is a smart-contract network whose price depends on upgrades and macro sentiment while $MEMASA is a utility token powering the MEMASA trading ecosystem. Its proposed role is directly connected to how people use the app.
$MEMASA will support several functions:
Premium AI intelligence: Access to advanced market analysis and trading insights.
Trading fee discounts: Reduced fees for eligible platform activity.
Analyst and agent staking: Analysts and AI agents stake $MEMASA to list their strategies and signals.
Marketplace payments: Transactions involving intelligence services and trading strategies.
Curation and contributor rewards: Incentives for participants who contribute useful signals and help curate the ecosystem.
Fixed Supply and Early Access to $MEMASA
Unlike ETH, which has no maximum supply, $MEMASA has a fixed token supply. The token structure also includes long-term team vesting and transparent unlock schedules.
MEMASA is offering an on-chain early sale, giving participants early access to $MEMASA before broader market availability. The earlier stages offer lower token prices, while later stages provide faster unlocks.
ETH has already seen its biggest rallies and may struggle to repeat them. MEMASA is preparing for launch, with its on-chain early sale offering tokens below the anticipated market price.
However, future returns will depend on successful app development, user adoption, and demand for $MEMASA. Higher potential also comes with higher risk.
Access Early Stage of $MEMASA On-chain Sale
The Road Ahead for ETH and MEMASA
ETH’s next move depends on whether buyers defend $2,171 or push the price back above $2,429. A firm Glamsterdam date could shift the mood quickly.
The analyst’s Pectra comparison suggests a dip may come before any recovery, but chart patterns do not always repeat.
MEMASA faces a different test, as it must turn an AI trading concept into an app people use every day. Both outcomes remain uncertain, and higher potential comes with higher risk.
DISCLAIMER: CAPTAINALTCOIN DOES NOT ENDORSE INVESTING IN ANY PROJECT (CRYPTO OR CASINO) MENTIONED IN SPONSORED ARTICLES. EXERCISE CAUTION AND DO THOROUGH RESEARCH BEFORE INVESTING YOUR MONEY. CaptainAltcoin takes no responsibility for its accuracy or quality. This content was not written by CaptainAltcoin’s team. We strongly advise readers to do their own thorough research before interacting with any featured companies. The information provided is not financial or legal advice. Neither CaptainAltcoin nor any third party recommends buying or selling any financial products. Investing in crypto assets is high-risk; consider the potential for loss. Any investment decisions made based on this content are at the sole risk of the readCaptainAltcoin is not liable for any damages or losses from using or relying on this content.
The post Ethereum Flashes an RSI Signal Below 40 as Its Chart Echoes the May 2025 Pectra Setup appeared first on CaptainAltcoin.
Ethereum Flashes an RSI Signal Below 40 As Its Chart Echoes the May 2025 Pectra Setup
The crypto market feels jittery this week, and traders are trimming risk after the latest Fed decision. Ethereum (ETH) trades near $2,311 after a short-term momentum gauge slipped below 40, a reading many chartists treat as a sell signal.
That matters because one analyst sees the chart repeating the setup that came before the Pectra rally. Any Ethereum price prediction now hinges on whether ETH holds its floor, with the coin down about 14% this month.
Traders who position for that swing also watch early-stage projects. One of them is MEMASA ($MEMASA), an upcoming AI trading app that lets users research and trade crypto through a chat.
Ethereum Price Prediction: Analyst Eyes a Pectra-Style Dip Before the Next Rally
ETH bounced off its long-term trend line ahead of the Fed’s rate decision, but the move came on thin trading volume.
That weak bounce caught the eye of analyst Alejandro Arrieche, who mapped out a deeper pullback in a recent FX Empire analysis.
His view leans on history, since the Pectra upgrade sparked a strong ETH rally in May 2025.
Back then, ETH cleared $2,000, left a price gap, then dipped back into it before climbing higher.
He sees a similar path now, with a likely drop toward $1,970 before any lasting rally can begin.
Still, a break above $2,800 would confirm the uptrend, while pending Glamsterdam dates and Middle East tensions keep risks in play.
Support at $2,171 Stands Between ETH and a Deeper Slide
ETH now trades near $2,311, down about 7% over the past week. For any near-term Ethereum price prediction, the nearest strong support sits at $2,171, with resistance at $2,429.
Technical indicators lean bearish, and losing $2,171 could open a path toward $1,725.
Reclaiming $2,429 would ease the pressure and bring the analyst’s bullish case back into view. While ETH struggles to reverse its downtrend, MEMASA ($MEMASA) is preparing to enter the market with an AI crypto trading app, and its token currently sells for $0.0155 in an on-chain early sale.
MEMASA Launches an AI Trading App with Less Chart Staring and More Smart Decisions
MEMASA is an upcoming AI-powered crypto trading app that lets people research, buy, and sell cryptocurrencies by chatting with an AI assistant.
Instead of studying complicated charts, tracking hundreds of tokens, or switching between trading platforms, users will be able to ask MEMASA questions in plain language.
For example: “Can ETH hold its support after the Fed decision?” MEMASA will analyze market indicators, trading activity, and sentiment to explain what the available data suggests.
MEMASA tackles problems almost every on-chain trader knows: too many charts, too much noise, scam tokens, and endless switching between apps. It brings market analysis, risk checks, and trading into one AI-powered chat.
That gives MEMASA a real shot at attracting a wide audience, from crypto newcomers to seasoned traders. MEMASA is preparing for launch, so anyone wishing to can join a waitlist for early access to the app.
How to Join MEMASA Waitlist
Ethereum Price Prediction: ETH’s Bearish Outlook vs. $MEMASA’s Pre-Listing Upside
ETH and $MEMASA are of different leagues: Ethereum is a smart-contract network whose price depends on upgrades and macro sentiment while $MEMASA is a utility token powering the MEMASA trading ecosystem. Its proposed role is directly connected to how people use the app.
$MEMASA will support several functions:
Premium AI intelligence: Access to advanced market analysis and trading insights.
Trading fee discounts: Reduced fees for eligible platform activity.
Analyst and agent staking: Analysts and AI agents stake $MEMASA to list their strategies and signals.
Marketplace payments: Transactions involving intelligence services and trading strategies.
Curation and contributor rewards: Incentives for participants who contribute useful signals and help curate the ecosystem.
Fixed Supply and Early Access to $MEMASA
Unlike ETH, which has no maximum supply, $MEMASA has a fixed token supply. The token structure also includes long-term team vesting and transparent unlock schedules.
MEMASA is offering an on-chain early sale, giving participants early access to $MEMASA before broader market availability. The earlier stages offer lower token prices, while later stages provide faster unlocks.
ETH has already seen its biggest rallies and may struggle to repeat them. MEMASA is preparing for launch, with its on-chain early sale offering tokens below the anticipated market price.
However, future returns will depend on successful app development, user adoption, and demand for $MEMASA. Higher potential also comes with higher risk.
Access Early Stage of $MEMASA On-chain Sale
The Road Ahead for ETH and MEMASA
ETH’s next move depends on whether buyers defend $2,171 or push the price back above $2,429. A firm Glamsterdam date could shift the mood quickly.
The analyst’s Pectra comparison suggests a dip may come before any recovery, but chart patterns do not always repeat.
MEMASA faces a different test, as it must turn an AI trading concept into an app people use every day. Both outcomes remain uncertain, and higher potential comes with higher risk.
DISCLAIMER: CAPTAINALTCOIN DOES NOT ENDORSE INVESTING IN ANY PROJECT (CRYPTO OR CASINO) MENTIONED IN SPONSORED ARTICLES. EXERCISE CAUTION AND DO THOROUGH RESEARCH BEFORE INVESTING YOUR MONEY. CaptainAltcoin takes no responsibility for its accuracy or quality. This content was not written by CaptainAltcoin’s team. We strongly advise readers to do their own thorough research before interacting with any featured companies. The information provided is not financial or legal advice. Neither CaptainAltcoin nor any third party recommends buying or selling any financial products. Investing in crypto assets is high-risk; consider the potential for loss. Any investment decisions made based on this content are at the sole risk of the readCaptainAltcoin is not liable for any damages or losses from using or relying on this content.
The post Ethereum Flashes an RSI Signal Below 40 as Its Chart Echoes the May 2025 Pectra Setup appeared first on CaptainAltcoin.
1
602
Статья
November Could Be Brutal for Bitcoin Price!Bitcoin is fighting to remain above $80,000, but analyst CryptoCon believes November could bring another difficult phase for BTC.
His concern comes from a recurring feature of previous Bitcoin cycles.
In past bear-market years, November has often arrived close to the final leg of the decline.
CryptoCon does not expect history to repeat perfectly, but his Magic Bands model currently places Bitcoin at a level where a deeper move would fit that broader cycle pattern.
His first downside area is around $71,000.
In a more bearish scenario, the model leaves room for Bitcoin to eventually return toward $52,000.
Why November Has CryptoCon Worried
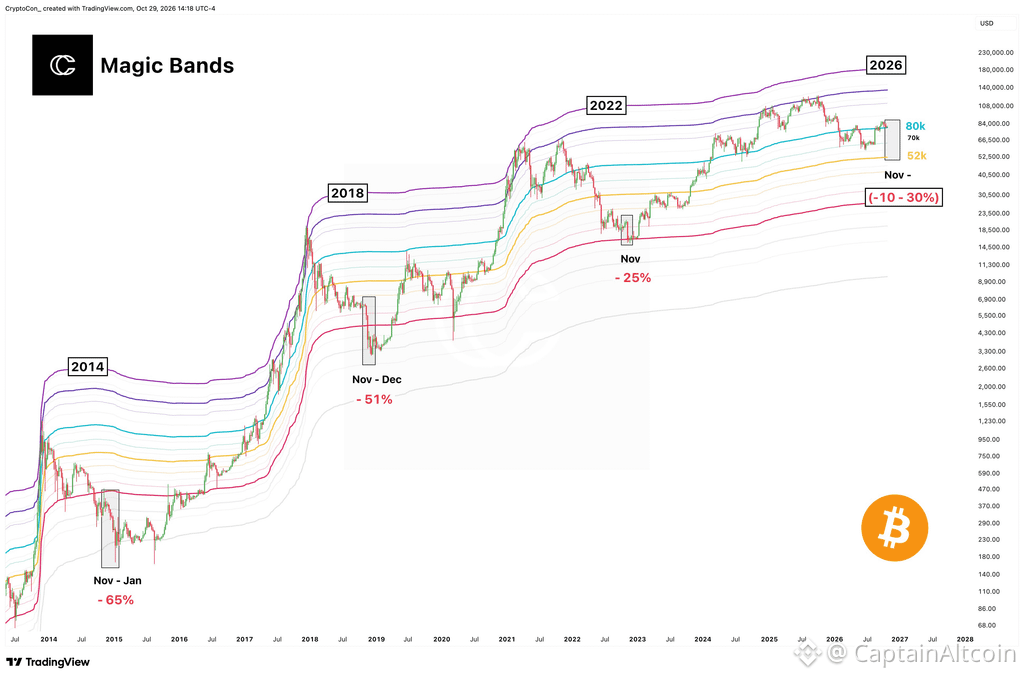
CryptoCon’s chart goes back through several Bitcoin cycles and marks previous November declines.
During the 2014 bear market, BTC eventually suffered a roughly 65% decline between November and January.
The 2018 cycle included another brutal November-to-December move of about 51%.
In 2022, the November decline was closer to 25%.
The obvious takeaway is that the size of these moves has varied enormously.
Source: X/@CryptoCon_
Still, CryptoCon argues that November has repeatedly appeared around the final capitulation phase of a Bitcoin bear-market year.
For 2026, his chart projects a possible November decline in the region of roughly 10% to 30%.
That does not make a November crash inevitable. It is a historical cycle observation being applied to the current setup, not a guaranteed seasonal rule.
Bitcoin Is Balancing Around $80K
The more immediate part of CryptoCon’s argument comes from his Magic Bands indicator.
Bitcoin is currently sitting around what he calls Level 2, near $80,000.
That area has become especially important this week.
BTC briefly dropped below $80,000 during the latest risk-off move before recovering toward the low-$80,000 region. The decline came after the Fed kept rates unchanged but retained a cautious tone on inflation, while weakness in technology stocks spilled into crypto.
CryptoCon believes a move toward roughly $71,000 would still allow Bitcoin to form a higher low within the larger structure.
From $80,000, that would mean another decline of roughly 11%.
That is substantially less dramatic than the second scenario on his chart.
The yellow Level 1 band currently runs close to $52,000.
A return there would represent approximately 35% downside from $80,000.
CryptoCon describes that as the outcome if Bitcoin remains fully aligned with the historical cycle model.
Why $52K Should Be Treated Differently From $71K
I think these two targets need to be separated.
The $71,000 scenario is not difficult to imagine if the current support fails. Bitcoin has already fallen below $80,000 this week, derivatives positioning has been flushed, and risk appetite remains fragile.
Crypto futures liquidations recently reached more than $350 million over 24 hours, with long positions accounting for the majority.
A further loss of support could therefore push BTC toward another lower liquidity area relatively quickly.
The $52,000 target is different.
That is a full-cycle bearish scenario generated by CryptoCon’s Magic Bands framework. Bitcoin would need to lose several layers of support before it became the primary price level to watch.
So I would not interpret this chart as saying “$52K is next.”
The sequence is more important.
Bitcoin first has to lose $80,000 decisively.
Then the $71,000 region becomes more relevant.
Only if that area fails and the broader bear-market structure continues would the yellow band near $52,000 become a serious part of the discussion.
Subscribe to our YouTube channel for daily crypto updates, market insights, and expert analysis.
The post November Could Be Brutal for Bitcoin Price! appeared first on CaptainAltcoin.
November Could Be Brutal for Bitcoin Price!
Bitcoin is fighting to remain above $80,000, but analyst CryptoCon believes November could bring another difficult phase for BTC.
His concern comes from a recurring feature of previous Bitcoin cycles.
In past bear-market years, November has often arrived close to the final leg of the decline.
CryptoCon does not expect history to repeat perfectly, but his Magic Bands model currently places Bitcoin at a level where a deeper move would fit that broader cycle pattern.
His first downside area is around $71,000.
In a more bearish scenario, the model leaves room for Bitcoin to eventually return toward $52,000.
Why November Has CryptoCon Worried
CryptoCon’s chart goes back through several Bitcoin cycles and marks previous November declines.
During the 2014 bear market, BTC eventually suffered a roughly 65% decline between November and January.
The 2018 cycle included another brutal November-to-December move of about 51%.
In 2022, the November decline was closer to 25%.
The obvious takeaway is that the size of these moves has varied enormously.
Source: X/@CryptoCon_
Still, CryptoCon argues that November has repeatedly appeared around the final capitulation phase of a Bitcoin bear-market year.
For 2026, his chart projects a possible November decline in the region of roughly 10% to 30%.
That does not make a November crash inevitable. It is a historical cycle observation being applied to the current setup, not a guaranteed seasonal rule.
Bitcoin Is Balancing Around $80K
The more immediate part of CryptoCon’s argument comes from his Magic Bands indicator.
Bitcoin is currently sitting around what he calls Level 2, near $80,000.
That area has become especially important this week.
BTC briefly dropped below $80,000 during the latest risk-off move before recovering toward the low-$80,000 region. The decline came after the Fed kept rates unchanged but retained a cautious tone on inflation, while weakness in technology stocks spilled into crypto.
CryptoCon believes a move toward roughly $71,000 would still allow Bitcoin to form a higher low within the larger structure.
From $80,000, that would mean another decline of roughly 11%.
That is substantially less dramatic than the second scenario on his chart.
The yellow Level 1 band currently runs close to $52,000.
A return there would represent approximately 35% downside from $80,000.
CryptoCon describes that as the outcome if Bitcoin remains fully aligned with the historical cycle model.
Why $52K Should Be Treated Differently From $71K
I think these two targets need to be separated.
The $71,000 scenario is not difficult to imagine if the current support fails. Bitcoin has already fallen below $80,000 this week, derivatives positioning has been flushed, and risk appetite remains fragile.
Crypto futures liquidations recently reached more than $350 million over 24 hours, with long positions accounting for the majority.
A further loss of support could therefore push BTC toward another lower liquidity area relatively quickly.
The $52,000 target is different.
That is a full-cycle bearish scenario generated by CryptoCon’s Magic Bands framework. Bitcoin would need to lose several layers of support before it became the primary price level to watch.
So I would not interpret this chart as saying “$52K is next.”
The sequence is more important.
Bitcoin first has to lose $80,000 decisively.
Then the $71,000 region becomes more relevant.
Only if that area fails and the broader bear-market structure continues would the yellow band near $52,000 become a serious part of the discussion.
Subscribe to our YouTube channel for daily crypto updates, market insights, and expert analysis.
The post November Could Be Brutal for Bitcoin Price! appeared first on CaptainAltcoin.
2
1.5k
Частичная правда
Статья
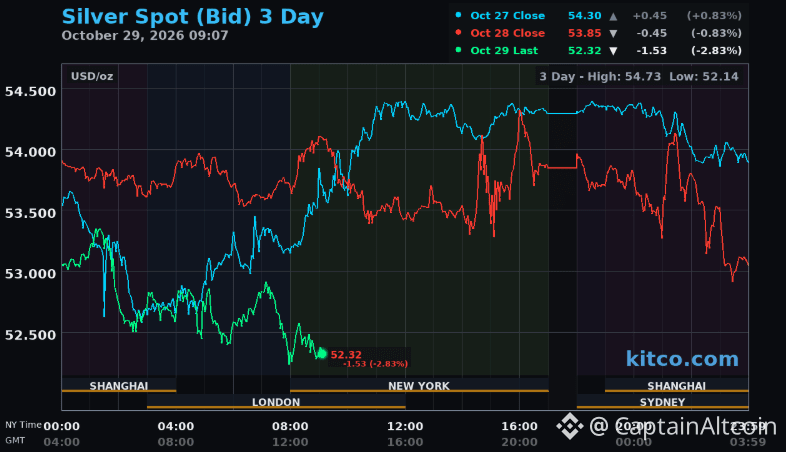
Silver Price Today: Silver Crashes 3% As Post-Fed Selling ReturnsSilver is selling off again on October 29, falling almost 3% toward the low-$52 area and erasing much of the stability it showed around the Federal Reserve meeting.
The latest Kitco three-day chart shows silver near $52.32, down roughly $1.53, or 2.8%, during Thursday’s session.
That puts XAG/USD close to the lowest point of the three-day window, around $52.14, after trading as high as roughly $54.73.
The failure to hold above $54 is important because silver had several chances to stabilize there.
Instead, sellers returned almost immediately.
The Chart Shows Momentum Breaking Down Again
The three-day chart tells me something interesting…
Silver closed October 27 near $54.30.
It slipped slightly to around $53.85 on October 28.
Then the selling accelerated on October 29, pushing price toward $52.30.
The key feature is not only the size of Thursday’s decline.
Source: X/@silvertrade
It is where the decline began.
Silver repeatedly struggled around the $54.20-$54.50 area during the previous sessions. Every attempt to build momentum above that region faded.
Once price moved below approximately $53.50, the decline accelerated.
For me, $52 is now the immediate level to watch, but the larger psychological level is still $50.
A move below $50 would change the tone considerably because that region has been viewed as one of the strongest potential support areas after silver’s earlier rally.
Below that, $45 becomes the next larger zone.
Why Silver Is Falling After the Fed Pause
The Federal Reserve kept interest rates unchanged on Wednesday, but that did not produce the relief rally some precious-metals traders expected.
The reason is that the Fed pause did not mean the tightening story was finished.
September PCE inflation rose 0.5% month over month, stronger than the previous 0.3% reading, and markets are still pricing a high probability of another Fed hike in December. Reuters reported that the probability was around 83% after the latest inflation data.
That is difficult for silver.
Higher expected rates raise the opportunity cost of holding a non-yielding asset, and elevated real yields can keep speculative demand weak.
Silver is also more exposed than gold to industrial conditions.
Reuters noted this week that silver continues to face pressure from high interest rates, softer solar-panel demand, substitution in manufacturing, ETF outflows and cautious investor sentiment.
That helps explain why silver has failed to benefit meaningfully even when gold finds some defensive demand.
$50 Is Becoming the Bigger Test
The current decline does not necessarily mean silver is heading directly toward $45.
But the room for bulls is shrinking.
If $52 holds, silver could still attempt another recovery toward $53.50 and then $54-$55.
If $52 gives way, $50 becomes the obvious next psychological target.
A break below $50 would be more serious because it would show that buyers are no longer defending a level that has attracted attention throughout the correction.
The broader macro environment also remains uncomfortable. U.S. inflation is still elevated, Treasury yields remain high, and the Fed has left the door open to more tightening.
So I would not treat Thursday’s move as an isolated bad session.
Silver is again showing that it cannot sustain rebounds when macro pressure returns.
The immediate battle is around $52.
The larger one is still $50.
If buyers fail there as well, the correction could become considerably deeper.
Subscribe to our YouTube channel for daily crypto updates, market insights, and expert analysis.
The post Silver Price Today: Silver Crashes 3% as Post-Fed Selling Returns appeared first on CaptainAltcoin.
Silver Price Today: Silver Crashes 3% As Post-Fed Selling Returns
Silver is selling off again on October 29, falling almost 3% toward the low-$52 area and erasing much of the stability it showed around the Federal Reserve meeting.
The latest Kitco three-day chart shows silver near $52.32, down roughly $1.53, or 2.8%, during Thursday’s session.
That puts XAG/USD close to the lowest point of the three-day window, around $52.14, after trading as high as roughly $54.73.
The failure to hold above $54 is important because silver had several chances to stabilize there.
Instead, sellers returned almost immediately.
The Chart Shows Momentum Breaking Down Again
The three-day chart tells me something interesting…
Silver closed October 27 near $54.30.
It slipped slightly to around $53.85 on October 28.
Then the selling accelerated on October 29, pushing price toward $52.30.
The key feature is not only the size of Thursday’s decline.
Source: X/@silvertrade
It is where the decline began.
Silver repeatedly struggled around the $54.20-$54.50 area during the previous sessions. Every attempt to build momentum above that region faded.
Once price moved below approximately $53.50, the decline accelerated.
For me, $52 is now the immediate level to watch, but the larger psychological level is still $50.
A move below $50 would change the tone considerably because that region has been viewed as one of the strongest potential support areas after silver’s earlier rally.
Below that, $45 becomes the next larger zone.
Why Silver Is Falling After the Fed Pause
The Federal Reserve kept interest rates unchanged on Wednesday, but that did not produce the relief rally some precious-metals traders expected.
The reason is that the Fed pause did not mean the tightening story was finished.
September PCE inflation rose 0.5% month over month, stronger than the previous 0.3% reading, and markets are still pricing a high probability of another Fed hike in December. Reuters reported that the probability was around 83% after the latest inflation data.
That is difficult for silver.
Higher expected rates raise the opportunity cost of holding a non-yielding asset, and elevated real yields can keep speculative demand weak.
Silver is also more exposed than gold to industrial conditions.
Reuters noted this week that silver continues to face pressure from high interest rates, softer solar-panel demand, substitution in manufacturing, ETF outflows and cautious investor sentiment.
That helps explain why silver has failed to benefit meaningfully even when gold finds some defensive demand.
$50 Is Becoming the Bigger Test
The current decline does not necessarily mean silver is heading directly toward $45.
But the room for bulls is shrinking.
If $52 holds, silver could still attempt another recovery toward $53.50 and then $54-$55.
If $52 gives way, $50 becomes the obvious next psychological target.
A break below $50 would be more serious because it would show that buyers are no longer defending a level that has attracted attention throughout the correction.
The broader macro environment also remains uncomfortable. U.S. inflation is still elevated, Treasury yields remain high, and the Fed has left the door open to more tightening.
So I would not treat Thursday’s move as an isolated bad session.
Silver is again showing that it cannot sustain rebounds when macro pressure returns.
The immediate battle is around $52.
The larger one is still $50.
If buyers fail there as well, the correction could become considerably deeper.
Subscribe to our YouTube channel for daily crypto updates, market insights, and expert analysis.
The post Silver Price Today: Silver Crashes 3% as Post-Fed Selling Returns appeared first on CaptainAltcoin.
913
Статья
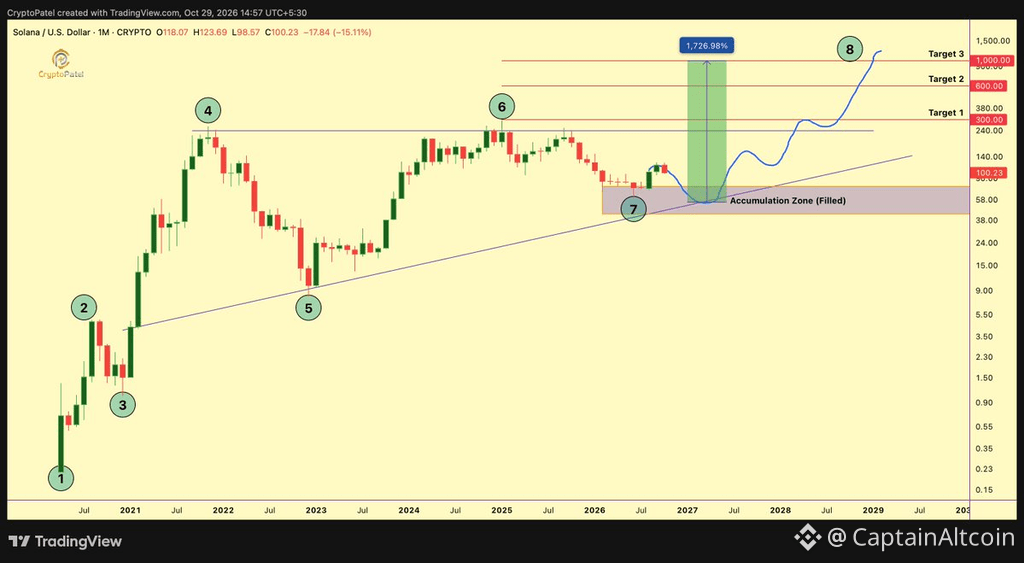
This Trader Makes an Unrealistic Solana Price PredictionSolana price has just fallen back toward the psychologically important $100 level, but trader Crypto Patel believes the current weakness could eventually lead to one of the biggest SOL rallies yet.
His long-term target?
$1,000.
The prediction is certainly aggressive. the SOL price currently trades around $100, meaning it would need to rise roughly 900% from here to reach that level.
Patel’s chart, however, presents $1,000 as the final target in a much longer bullish structure rather than something he expects immediately.
Why the Trader Thinks SOL Could Reach $1,000
Patel is looking at Solana on the monthly timeframe.
His chart marks the recent decline as part of a much larger cycle and identifies roughly $50-$70 as an accumulation region following an approximately 80% correction.
From there, he maps three long-term targets:
$300
$600
$1,000
The first one is already ambitious. SOL would need to nearly triple from current levels just to reach $300.
Source: X/@CryptoPatel
The $600 target would represent roughly 500% upside, and $1,000 would mean a gain of around 900%.
Patel’s projected path does not show a straight-line rally. It includes several corrections along the way, with the broader thesis depending on the long-term rising support structure surviving.
He also makes an important qualification: the targets remain conditional on support holding and bullish price confirmation.
That caveat is necessary because SOL is currently doing the opposite of what a $1,000 prediction might imply.
Read also: Solana Validators Urged to Prepare Ahead of Alpenglow Activation
Solana Is Struggling Around $100 Today
SOL briefly dropped below $100 on October 29 after extending a difficult month for the token.
U.S. spot Solana ETFs recorded approximately $24.8 million in net withdrawals across October 27 and 28, including $19.16 million on October 27 alone. October ETF outflows have now exceeded $100 million.
There has also been selling from large holders. One whale reportedly sold around 1.02 million SOL, worth roughly $104 million, over five days.
That makes $100 particularly important in the short term.
A sustained break below this region could expose the $80-$90 area before Patel’s much deeper $50-$70 accumulation zone ever becomes relevant.
At the same time, the network itself continues to develop. Solana’s Alpenglow upgrade went live on October 21, and recent ecosystem developments include an institutional staking initiative involving Jupiter and BitGo.
So there is still a considerable gap between Solana’s network progress and what investors are currently willing to pay for SOL.
Solana Price Forecast: Is $1,000 SOL Realistic?
I think $300 is the more useful part of Patel’s chart.
SOL has already traded close to that region during previous bullish periods, so returning there would not demand an entirely new valuation regime.
$600 is a considerably harder target.
And $1,000 would place Solana at a valuation several times larger than anything the token has previously achieved. For that scenario to become credible, I would want to see much stronger institutional demand, continued ecosystem growth and a complete reversal of the current price trend.
So I would treat $1,000 as a very long-term bull-case scenario, not a conventional Solana price prediction.
Right now, SOL first needs to solve a much simpler problem.
It needs to hold $100.
If buyers cannot do that, debating whether Solana eventually reaches $600 or $1,000 is getting several steps ahead of the chart.
For more crypto news and price predictions, click here.
Subscribe to our YouTube channel for daily crypto updates, market insights, and expert analysis.
The post This Trader Makes an Unrealistic Solana Price Prediction appeared first on CaptainAltcoin.
This Trader Makes an Unrealistic Solana Price Prediction
Solana price has just fallen back toward the psychologically important $100 level, but trader Crypto Patel believes the current weakness could eventually lead to one of the biggest SOL rallies yet.
His long-term target?
$1,000.
The prediction is certainly aggressive. the SOL price currently trades around $100, meaning it would need to rise roughly 900% from here to reach that level.
Patel’s chart, however, presents $1,000 as the final target in a much longer bullish structure rather than something he expects immediately.
Why the Trader Thinks SOL Could Reach $1,000
Patel is looking at Solana on the monthly timeframe.
His chart marks the recent decline as part of a much larger cycle and identifies roughly $50-$70 as an accumulation region following an approximately 80% correction.
From there, he maps three long-term targets:
$300
$600
$1,000
The first one is already ambitious. SOL would need to nearly triple from current levels just to reach $300.
Source: X/@CryptoPatel
The $600 target would represent roughly 500% upside, and $1,000 would mean a gain of around 900%.
Patel’s projected path does not show a straight-line rally. It includes several corrections along the way, with the broader thesis depending on the long-term rising support structure surviving.
He also makes an important qualification: the targets remain conditional on support holding and bullish price confirmation.
That caveat is necessary because SOL is currently doing the opposite of what a $1,000 prediction might imply.
Read also: Solana Validators Urged to Prepare Ahead of Alpenglow Activation
Solana Is Struggling Around $100 Today
SOL briefly dropped below $100 on October 29 after extending a difficult month for the token.
U.S. spot Solana ETFs recorded approximately $24.8 million in net withdrawals across October 27 and 28, including $19.16 million on October 27 alone. October ETF outflows have now exceeded $100 million.
There has also been selling from large holders. One whale reportedly sold around 1.02 million SOL, worth roughly $104 million, over five days.
That makes $100 particularly important in the short term.
A sustained break below this region could expose the $80-$90 area before Patel’s much deeper $50-$70 accumulation zone ever becomes relevant.
At the same time, the network itself continues to develop. Solana’s Alpenglow upgrade went live on October 21, and recent ecosystem developments include an institutional staking initiative involving Jupiter and BitGo.
So there is still a considerable gap between Solana’s network progress and what investors are currently willing to pay for SOL.
Solana Price Forecast: Is $1,000 SOL Realistic?
I think $300 is the more useful part of Patel’s chart.
SOL has already traded close to that region during previous bullish periods, so returning there would not demand an entirely new valuation regime.
$600 is a considerably harder target.
And $1,000 would place Solana at a valuation several times larger than anything the token has previously achieved. For that scenario to become credible, I would want to see much stronger institutional demand, continued ecosystem growth and a complete reversal of the current price trend.
So I would treat $1,000 as a very long-term bull-case scenario, not a conventional Solana price prediction.
Right now, SOL first needs to solve a much simpler problem.
It needs to hold $100.
If buyers cannot do that, debating whether Solana eventually reaches $600 or $1,000 is getting several steps ahead of the chart.
For more crypto news and price predictions, click here.
Subscribe to our YouTube channel for daily crypto updates, market insights, and expert analysis.
The post This Trader Makes an Unrealistic Solana Price Prediction appeared first on CaptainAltcoin.
1
1
1.4k

Статья
Ondo Intelligent Portfolios Lineup Expands to SolanaFollowing more than $40 million in TVL in the first four weeks, all seven Ondo Intelligent Portfolios are now available to eligible investors through Solana wallets and apps.
GREENWICH, Conn., Oct. 29, 2026 /PRNewswire/ — Ondo Intelligent Portfolios, professionally curated investment portfolios delivered as single onchain tokens, are now live on Solana. All seven portfolios are now available to eligible investors (outside the U.S.) through leading Solana wallets and apps.
Ondo Intelligent Portfolios democratize access to professionally curated investment strategies, delivering them onchain to nearly any eligible investor with an internet connection and a wallet. Since launch, the portfolios have surpassed $40M in total value locked (TVL) on Ethereum and BNB Chain combined, making them among the largest tokenized portfolio products onchain. With this expansion to Solana, Ondo Intelligent Portfolios now arrive on a network where Ondo already has more than $500M in TVL across tokenized assets.
Seven portfolios are live today, spanning income, growth, and thematic exposure, with more planned:
BLKHIon: Ondo High Income Powered by BlackRock
BLKGRWon: Ondo High Growth Powered by BlackRock
BLKDIGon: Ondo Diversified Growth Powered by BlackRock
MAG7Xon: Ondo Magnificent 7 and Crypto Portfolio
BRAINon: Ondo AI Leaders Portfolio
YLD5on: Ondo 5 Targeted Income TR Portfolio
YLD8on: Ondo 8 Targeted Income TR Portfolio
Three of the seven are based on portfolio strategies developed by BlackRock, the world’s largest asset manager, for use by Ondo. The remaining four are Ondo-designed onchain portfolios built around some of the market’s most closely watched themes, from big tech and artificial intelligence to targeted income.
Tokenized stocks are taking off on Solana
Solana has become one of the most important venues for tokenized equities, with 1.6M+ addresses holding tokenized stocks. Investors are trading tokenized stocks and ETFs around the clock on Solana, at low cost, and inside the same wallets and apps they already use for the rest of their onchain activity.
Ondo is among the largest issuers of tokenized real-world assets on the network, with more than $500 million in TVL on Solana, and Ondo Stocks already give investors on Solana access to hundreds of tokenized U.S. stocks and ETFs.
How it works: one token, one portfolio
Each Ondo Intelligent Portfolio combines multiple assets into a single onchain token. Every holding is visible, and the portfolio is rebalanced programmatically so investors don’t have to manage a basket of underlying positions manually. The result is diversified exposure in one token that investors can hold in their wallets and transfer like any other tokenized asset.
Why it matters: institutional-grade investing, open to more investors
Diversified portfolios built by professional allocators have long been offered mainly to institutions and investors with private wealth managers. Everyone else has had to assemble a portfolio piece by piece across separate accounts and assets.
Ondo Intelligent Portfolios change that. On Solana, any eligible investor with a wallet can now hold the same kind of professionally designed allocation through the apps they already use. They get diversified exposure, full visibility into every holding, and rebalancing they never have to manage.
“Ondo Intelligent Portfolios were built to put professionally curated investment strategies within reach of any eligible investor with a wallet, and seven live portfolios with more than $40 million in TVL in four weeks tell us that’s exactly what investors want,” said John Hoffman, Managing Director and Head of Portfolios at Ondo Finance. “Expanding to Solana puts that access in front of one of the most active onchain user bases, inside the apps they already trade on every day, and makes every portfolio composable across the Solana ecosystem. This is a foundation we’ll keep building on, with more portfolios to come.”
“Tokenized assets are one of the fastest-growing categories on Solana, and the demand we’re seeing for tokenized stocks shows investors want real-world exposure onchain,” said Nick Ducoff, GM, Institutional, Solana Foundation. “With Ondo Intelligent Portfolios, investors can move beyond single assets and hold a complete portfolio in one token. That’s the next chapter of tokenization, and it’s happening on Solana.”
Ondo intends to continue expanding the lineup with additional onchain portfolios over time. To explore the seven live portfolios and learn more, visit app.ondo.finance.
About Ondo Finance
Ondo Finance is a blockchain-based platform focused on tokenizing real-world assets and bringing institutional-quality financial products onchain. By bridging traditional finance and decentralized infrastructure, Ondo aims to make capital markets more accessible, transparent, and efficient.
About Ondo Stocks
Ondo Stocks (previously known as Global Markets) is an issuance and redemption platform for tokenized publicly traded U.S. stocks and ETFs. It enables eligible investors outside the United States to gain economic exposure to these assets by minting, transferring, and redeeming securities-backed tokens. Each token is fully backed by the corresponding stock or ETF (together with cash in transit).
About BlackRock
BlackRock’s purpose is to help more people experience financial well-being. As a fiduciary to investors and a leading provider of financial technology, we help millions of people build savings that serve them throughout their lives by making investing easier and more affordable. For additional information on BlackRock, please visit www.blackrock.com/corporate | Twitter: @blackrock | LinkedIn: www.linkedin.com/company/blackrock
Disclaimers
[*] The tokenized assets referenced herein (i.e. (i) the tokenized stocks, tokenized ETFs and tokenized ADRs now known as Ondo Stocks, and formerly known as Ondo tokenized stocks and ETFs, or as Ondo Global Markets tokens, (collectively, the “Ondo Stocks”) and (ii) USDY tokens (collectively, the “Tokens”) have not been registered under the US Securities Act of 1933, as amended (the “Act”) or the securities or financial instrument laws of any other jurisdiction. The Tokens may not be offered or sold in the United States or to US persons unless registered under the Act or an exemption from the registration requirements thereof is available. In certain jurisdictions, including the United Kingdom, Switzerland and Singapore, the Ondo Stocks and USDY tokens are offered and sold only to qualified investors or professional clients, as the case may be (or that jurisdiction’s analogue thereof). Other jurisdiction-based prohibitions and restrictions apply. The issuer of the Tokens is not registered as an investment company under the US Investment Company Act of 1940, as amended, or as an Alternative Investment Fund or Undertaking for Collective Investment in Transferable Securities in the EEA, or under the securities or financial instrument laws of any other jurisdiction.
Ondo Stocks provide their holders with economic exposure to the value of their underlying assets, including the value of dividends (less applicable tax withholdings). However, Ondo Stocks are not themselves stocks, ETFs or ADRs and the Ondo Stocks do not provide their holders with rights to hold or receive their respective underlying assets. Similarly, USDY tokens provide their holders with economic exposure to short-term US treasuries, but USDY tokens are not themselves US treasuries and do not provide their holders with rights to hold or receive any US treasuries.
In the EEA/EU, a base prospectus relating to the Tokens has been approved by the Financial Market Authority Liechtenstein (FMA) and notified, at the issuer’s request, to certain EEA Member States (the “Relevant EEA States”), making many Ondo Stocks available to both professional and retail investors, though certain Ondo Stocks are only available to professional investors in the EEA/EU. The prospectus is published at app.ondo.finance at each applicable Token’s webpage. The approval of the prospectus should not be understood as an endorsement of the Tokens. Investors residing in the EU/EEA should read the prospectus, and the relevant final terms and KID for each applicable Token, before investing in order to fully understand the potential risks and rewards associated with the decision to invest. This notice is a marketing communication and does not constitute a prospectus.
Certain Ondo Stocks (referred to in the UAE as “Digital Securities”) have been admitted to trading on Nest Exchange Limited, a Multilateral Trading Facility for Digital Assets operated by Binance in the Abu Dhabi Global Market (“ADGM”), authorised by the Financial Services Regulatory Authority (the “FSRA”). Such Digital Securities are available for trading by those investors eligible for a Binance account. The ADGM FSRA has no responsibility for reviewing or verifying any documents in connection with the admission to trading of such Digital Securities in the ADGM. The FSRA has not approved the documents in connection with the admission to trading nor taken steps to verify the information set out in it and has no responsibility for it. No offer of securities is being made in ADGM. Prospective purchasers of such Digital Securities admitted to trading should conduct their own due diligence on such Digital Securities.
In the United Kingdom, the communications herein may be deemed a financial promotion pursuant to Section 21 of the Financial Services and Markets Act 2000. To the extent that any such finding is made, the communications herein are only intended for, and directed at, investment professionals as defined in article 19 of the Financial Services and Markets Act 2000 (Financial Promotions) Order 2005 (the “FPO”) who have experience of interacting with the Ondo Stocks and USDY tokens; high net worth companies as defined in article 49 of the FPO, and/or any other persons to whom lawful communication is permitted. Any person not falling within these categories is not permitted to act upon anything within the communications herein, and shall not be entitled to rely upon their contents. Ondo Global Markets (BVI) Limited will not enter into arrangements with such persons concerning Ondo Stocks and USDY tokens as a result of this or any other communication.
The Tokens are issued by Ondo Global Markets (BVI) Limited, a British Virgin Islands business company. OUSG tokens are issued by Ondo I LP, a Delaware (USA) limited partnership (the “Fund”). Ondo Finance Inc., a Delaware (USA) corporation, provides tokenization services to, and is an equity holder of, Ondo Global Markets (BVI) Limited.
The communications herein are only intended for eligible purchasers of, or for actual or potential business relationships or technical integrations with respect to the Tokens. Nothing herein constitutes any offer to sell, or any solicitation of an offer to buy, any Tokens. Nothing herein constitutes investment, legal, tax or financial advice. Acquiring the Tokens involves risks. A holder of the Tokens may incur losses, including total loss of their purchase price. Past performance is not an indication of future results. Investors are responsible for conducting their own research, investigation, verification, checks or consultation for professional or investment advice.
The communications herein may contain forward-looking statements, including, but not limited to, statements regarding future financial performance, business strategies, or expectations for the growth or development of Ondo Finance, Ondo Global Markets (BVI) Limited, or any of their respective affiliates (each, an “Applicable Entity”). These statements are based on management’s current expectations, estimates, projections, and beliefs, and are subject to a number of risks, uncertainties, and assumptions that could cause actual results to differ materially from those anticipated. Forward-looking statements can be identified by the use of terminology such as “may,” “will,” “should,” “expect,” “intend,” “plan,” “anticipate,” “believe,” “estimate,” “predict,” “potential,” “continue,” or the negative of these terms or other similar expressions. Factors that could cause actual results to differ materially from those contemplated by the forward-looking statements include, but are not limited to, the following: economic, competitive, legal, governmental, and technological factors affecting the operations, markets, products, services, or prices of any Applicable Entity. No Applicable Entity undertakes any obligation to update or revise any forward-looking statements, whether as a result of new information, future events, or otherwise, except as required by law.
The Token issuers, their affiliates, their respective shareholders and members, and their respective directors, officers, employees, consultants, agents and representatives (the “Ondo Persons”) do not endorse, the Ondo Persons do not make any representation or warranty whatsoever (express or implied, including but not limited to any warranty of merchantability, fitness for a particular purpose, or non-infringement) regarding, and THE ONDO PERSONS SHALL NOT HAVE ANY LIABILITY WHATSOEVER WITH RESPECT TO ANYONE’S USE OF, any third-party products, services or technologies referenced herein.
Additional terms and restrictions apply. See docs.ondo.finance/legal/terms-of-service, docs.ondo.finance/ondo-stocks, ondo.finance/stocks, app.ondo.finance and (as applicable) the Token offering documents for details.
BlackRock Fund Advisors (“BlackRock”) is not the investment adviser, sub-adviser, portfolio manager, manager, sponsor, promoter, underwriter, marketer or distributor of the Onchain Portfolios or the Tokens, and does not manage, and exercises no discretion over, the Onchain Portfolios. BlackRock’s role is limited solely to providing one or more nondiscretionary model portfolio strategies (“Portfolio Strategies”) to Ondo Global Markets (BVI) Limited (“Ondo”) based on specifications provided by Ondo to BlackRock. BlackRock does not select, endorse, recommend, or make any investment decision with respect to any Onchain Portfolio or any assets held by any Onchain Portfolio, and any Onchain Portfolio may differ from the corresponding Portfolio Strategy for a variety of reasons. BlackRock shall have no obligation to provide updates to each Portfolio Strategy after the initial delivery of the Portfolio Strategy to Ondo except in certain limited circumstances. It is at Ondo’s arrangement whether any related Onchain Portfolio is similarly updated. Therefore, the Onchain Portfolios may not incorporate changes in the market or other events nor update in line with the Portfolio Strategies. BlackRock has no investment advisory, investment management, fiduciary, client or other relationship with, and owes no responsibilities or duties to, any investor or prospective investor in the Tokens or the Onchain Portfolios. The Portfolio Strategies are not designed to be suitable for any specific investor and do not take into account the individual needs, objectives or risk tolerance of any investor or prospective investor. BlackRock has not prepared or approved this document or any other offering or marketing material, and is not responsible for the tokenization, issuance, distribution, custody, or operation of the Tokens or the Onchain Portfolios. BlackRock is not making any offer to sell nor soliciting any offer to buy any securities. An investment in the Tokens involves risk, including the possible loss of principal, and past performance is not indicative of future results.
Investors have no right, title, interest, or claim in or to any of the funds or securities underlying any Onchain Portfolio (the “Underlying Funds”) or any recourse to any manager of the Underlying Funds, and such Underlying Funds are not being offered, marketed, or distributed to Investors by BlackRock or Ondo, whether directly or indirectly through the Tokens or the Onchain Portfolios. The Tokens constitute separate and distinct securities issued by Ondo and do not represent any interest in the Underlying Funds.
The Portfolio Strategies will include funds sponsored and managed by BlackRock and its affiliates, which will pay fees to BlackRock and its affiliates for providing management, administrative, or other services. Accordingly, BlackRock has a potential conflict of interest in connection with providing the Portfolio Strategies, as an investment in such funds by the Onchain Portfolio will increase compensation to BlackRock and its affiliates. BlackRock has an incentive to provide a Portfolio Strategy that contains funds that would result in increased levels of compensation being paid to BlackRock and its affiliates by such funds.
Additional information about BlackRock, including its Form ADV, is available from the U.S. Securities and Exchange Commission’s Investment Adviser Public Disclosure website at https://adviserinfo.sec.gov.
The post Ondo Intelligent Portfolios Lineup Expands to Solana appeared first on CaptainAltcoin.
Ondo Intelligent Portfolios Lineup Expands to Solana
Following more than $40 million in TVL in the first four weeks, all seven Ondo Intelligent Portfolios are now available to eligible investors through Solana wallets and apps.
GREENWICH, Conn., Oct. 29, 2026 /PRNewswire/ — Ondo Intelligent Portfolios, professionally curated investment portfolios delivered as single onchain tokens, are now live on Solana. All seven portfolios are now available to eligible investors (outside the U.S.) through leading Solana wallets and apps.
Ondo Intelligent Portfolios democratize access to professionally curated investment strategies, delivering them onchain to nearly any eligible investor with an internet connection and a wallet. Since launch, the portfolios have surpassed $40M in total value locked (TVL) on Ethereum and BNB Chain combined, making them among the largest tokenized portfolio products onchain. With this expansion to Solana, Ondo Intelligent Portfolios now arrive on a network where Ondo already has more than $500M in TVL across tokenized assets.
Seven portfolios are live today, spanning income, growth, and thematic exposure, with more planned:
BLKHIon: Ondo High Income Powered by BlackRock
BLKGRWon: Ondo High Growth Powered by BlackRock
BLKDIGon: Ondo Diversified Growth Powered by BlackRock
MAG7Xon: Ondo Magnificent 7 and Crypto Portfolio
BRAINon: Ondo AI Leaders Portfolio
YLD5on: Ondo 5 Targeted Income TR Portfolio
YLD8on: Ondo 8 Targeted Income TR Portfolio
Three of the seven are based on portfolio strategies developed by BlackRock, the world’s largest asset manager, for use by Ondo. The remaining four are Ondo-designed onchain portfolios built around some of the market’s most closely watched themes, from big tech and artificial intelligence to targeted income.
Tokenized stocks are taking off on Solana
Solana has become one of the most important venues for tokenized equities, with 1.6M+ addresses holding tokenized stocks. Investors are trading tokenized stocks and ETFs around the clock on Solana, at low cost, and inside the same wallets and apps they already use for the rest of their onchain activity.
Ondo is among the largest issuers of tokenized real-world assets on the network, with more than $500 million in TVL on Solana, and Ondo Stocks already give investors on Solana access to hundreds of tokenized U.S. stocks and ETFs.
How it works: one token, one portfolio
Each Ondo Intelligent Portfolio combines multiple assets into a single onchain token. Every holding is visible, and the portfolio is rebalanced programmatically so investors don’t have to manage a basket of underlying positions manually. The result is diversified exposure in one token that investors can hold in their wallets and transfer like any other tokenized asset.
Why it matters: institutional-grade investing, open to more investors
Diversified portfolios built by professional allocators have long been offered mainly to institutions and investors with private wealth managers. Everyone else has had to assemble a portfolio piece by piece across separate accounts and assets.
Ondo Intelligent Portfolios change that. On Solana, any eligible investor with a wallet can now hold the same kind of professionally designed allocation through the apps they already use. They get diversified exposure, full visibility into every holding, and rebalancing they never have to manage.
“Ondo Intelligent Portfolios were built to put professionally curated investment strategies within reach of any eligible investor with a wallet, and seven live portfolios with more than $40 million in TVL in four weeks tell us that’s exactly what investors want,” said John Hoffman, Managing Director and Head of Portfolios at Ondo Finance. “Expanding to Solana puts that access in front of one of the most active onchain user bases, inside the apps they already trade on every day, and makes every portfolio composable across the Solana ecosystem. This is a foundation we’ll keep building on, with more portfolios to come.”
“Tokenized assets are one of the fastest-growing categories on Solana, and the demand we’re seeing for tokenized stocks shows investors want real-world exposure onchain,” said Nick Ducoff, GM, Institutional, Solana Foundation. “With Ondo Intelligent Portfolios, investors can move beyond single assets and hold a complete portfolio in one token. That’s the next chapter of tokenization, and it’s happening on Solana.”
Ondo intends to continue expanding the lineup with additional onchain portfolios over time. To explore the seven live portfolios and learn more, visit app.ondo.finance.
About Ondo Finance
Ondo Finance is a blockchain-based platform focused on tokenizing real-world assets and bringing institutional-quality financial products onchain. By bridging traditional finance and decentralized infrastructure, Ondo aims to make capital markets more accessible, transparent, and efficient.
About Ondo Stocks
Ondo Stocks (previously known as Global Markets) is an issuance and redemption platform for tokenized publicly traded U.S. stocks and ETFs. It enables eligible investors outside the United States to gain economic exposure to these assets by minting, transferring, and redeeming securities-backed tokens. Each token is fully backed by the corresponding stock or ETF (together with cash in transit).
About BlackRock
BlackRock’s purpose is to help more people experience financial well-being. As a fiduciary to investors and a leading provider of financial technology, we help millions of people build savings that serve them throughout their lives by making investing easier and more affordable. For additional information on BlackRock, please visit www.blackrock.com/corporate | Twitter: @blackrock | LinkedIn: www.linkedin.com/company/blackrock
Disclaimers
[*] The tokenized assets referenced herein (i.e. (i) the tokenized stocks, tokenized ETFs and tokenized ADRs now known as Ondo Stocks, and formerly known as Ondo tokenized stocks and ETFs, or as Ondo Global Markets tokens, (collectively, the “Ondo Stocks”) and (ii) USDY tokens (collectively, the “Tokens”) have not been registered under the US Securities Act of 1933, as amended (the “Act”) or the securities or financial instrument laws of any other jurisdiction. The Tokens may not be offered or sold in the United States or to US persons unless registered under the Act or an exemption from the registration requirements thereof is available. In certain jurisdictions, including the United Kingdom, Switzerland and Singapore, the Ondo Stocks and USDY tokens are offered and sold only to qualified investors or professional clients, as the case may be (or that jurisdiction’s analogue thereof). Other jurisdiction-based prohibitions and restrictions apply. The issuer of the Tokens is not registered as an investment company under the US Investment Company Act of 1940, as amended, or as an Alternative Investment Fund or Undertaking for Collective Investment in Transferable Securities in the EEA, or under the securities or financial instrument laws of any other jurisdiction.
Ondo Stocks provide their holders with economic exposure to the value of their underlying assets, including the value of dividends (less applicable tax withholdings). However, Ondo Stocks are not themselves stocks, ETFs or ADRs and the Ondo Stocks do not provide their holders with rights to hold or receive their respective underlying assets. Similarly, USDY tokens provide their holders with economic exposure to short-term US treasuries, but USDY tokens are not themselves US treasuries and do not provide their holders with rights to hold or receive any US treasuries.
In the EEA/EU, a base prospectus relating to the Tokens has been approved by the Financial Market Authority Liechtenstein (FMA) and notified, at the issuer’s request, to certain EEA Member States (the “Relevant EEA States”), making many Ondo Stocks available to both professional and retail investors, though certain Ondo Stocks are only available to professional investors in the EEA/EU. The prospectus is published at app.ondo.finance at each applicable Token’s webpage. The approval of the prospectus should not be understood as an endorsement of the Tokens. Investors residing in the EU/EEA should read the prospectus, and the relevant final terms and KID for each applicable Token, before investing in order to fully understand the potential risks and rewards associated with the decision to invest. This notice is a marketing communication and does not constitute a prospectus.
Certain Ondo Stocks (referred to in the UAE as “Digital Securities”) have been admitted to trading on Nest Exchange Limited, a Multilateral Trading Facility for Digital Assets operated by Binance in the Abu Dhabi Global Market (“ADGM”), authorised by the Financial Services Regulatory Authority (the “FSRA”). Such Digital Securities are available for trading by those investors eligible for a Binance account. The ADGM FSRA has no responsibility for reviewing or verifying any documents in connection with the admission to trading of such Digital Securities in the ADGM. The FSRA has not approved the documents in connection with the admission to trading nor taken steps to verify the information set out in it and has no responsibility for it. No offer of securities is being made in ADGM. Prospective purchasers of such Digital Securities admitted to trading should conduct their own due diligence on such Digital Securities.
In the United Kingdom, the communications herein may be deemed a financial promotion pursuant to Section 21 of the Financial Services and Markets Act 2000. To the extent that any such finding is made, the communications herein are only intended for, and directed at, investment professionals as defined in article 19 of the Financial Services and Markets Act 2000 (Financial Promotions) Order 2005 (the “FPO”) who have experience of interacting with the Ondo Stocks and USDY tokens; high net worth companies as defined in article 49 of the FPO, and/or any other persons to whom lawful communication is permitted. Any person not falling within these categories is not permitted to act upon anything within the communications herein, and shall not be entitled to rely upon their contents. Ondo Global Markets (BVI) Limited will not enter into arrangements with such persons concerning Ondo Stocks and USDY tokens as a result of this or any other communication.
The Tokens are issued by Ondo Global Markets (BVI) Limited, a British Virgin Islands business company. OUSG tokens are issued by Ondo I LP, a Delaware (USA) limited partnership (the “Fund”). Ondo Finance Inc., a Delaware (USA) corporation, provides tokenization services to, and is an equity holder of, Ondo Global Markets (BVI) Limited.
The communications herein are only intended for eligible purchasers of, or for actual or potential business relationships or technical integrations with respect to the Tokens. Nothing herein constitutes any offer to sell, or any solicitation of an offer to buy, any Tokens. Nothing herein constitutes investment, legal, tax or financial advice. Acquiring the Tokens involves risks. A holder of the Tokens may incur losses, including total loss of their purchase price. Past performance is not an indication of future results. Investors are responsible for conducting their own research, investigation, verification, checks or consultation for professional or investment advice.
The communications herein may contain forward-looking statements, including, but not limited to, statements regarding future financial performance, business strategies, or expectations for the growth or development of Ondo Finance, Ondo Global Markets (BVI) Limited, or any of their respective affiliates (each, an “Applicable Entity”). These statements are based on management’s current expectations, estimates, projections, and beliefs, and are subject to a number of risks, uncertainties, and assumptions that could cause actual results to differ materially from those anticipated. Forward-looking statements can be identified by the use of terminology such as “may,” “will,” “should,” “expect,” “intend,” “plan,” “anticipate,” “believe,” “estimate,” “predict,” “potential,” “continue,” or the negative of these terms or other similar expressions. Factors that could cause actual results to differ materially from those contemplated by the forward-looking statements include, but are not limited to, the following: economic, competitive, legal, governmental, and technological factors affecting the operations, markets, products, services, or prices of any Applicable Entity. No Applicable Entity undertakes any obligation to update or revise any forward-looking statements, whether as a result of new information, future events, or otherwise, except as required by law.
The Token issuers, their affiliates, their respective shareholders and members, and their respective directors, officers, employees, consultants, agents and representatives (the “Ondo Persons”) do not endorse, the Ondo Persons do not make any representation or warranty whatsoever (express or implied, including but not limited to any warranty of merchantability, fitness for a particular purpose, or non-infringement) regarding, and THE ONDO PERSONS SHALL NOT HAVE ANY LIABILITY WHATSOEVER WITH RESPECT TO ANYONE’S USE OF, any third-party products, services or technologies referenced herein.
Additional terms and restrictions apply. See docs.ondo.finance/legal/terms-of-service, docs.ondo.finance/ondo-stocks, ondo.finance/stocks, app.ondo.finance and (as applicable) the Token offering documents for details.
BlackRock Fund Advisors (“BlackRock”) is not the investment adviser, sub-adviser, portfolio manager, manager, sponsor, promoter, underwriter, marketer or distributor of the Onchain Portfolios or the Tokens, and does not manage, and exercises no discretion over, the Onchain Portfolios. BlackRock’s role is limited solely to providing one or more nondiscretionary model portfolio strategies (“Portfolio Strategies”) to Ondo Global Markets (BVI) Limited (“Ondo”) based on specifications provided by Ondo to BlackRock. BlackRock does not select, endorse, recommend, or make any investment decision with respect to any Onchain Portfolio or any assets held by any Onchain Portfolio, and any Onchain Portfolio may differ from the corresponding Portfolio Strategy for a variety of reasons. BlackRock shall have no obligation to provide updates to each Portfolio Strategy after the initial delivery of the Portfolio Strategy to Ondo except in certain limited circumstances. It is at Ondo’s arrangement whether any related Onchain Portfolio is similarly updated. Therefore, the Onchain Portfolios may not incorporate changes in the market or other events nor update in line with the Portfolio Strategies. BlackRock has no investment advisory, investment management, fiduciary, client or other relationship with, and owes no responsibilities or duties to, any investor or prospective investor in the Tokens or the Onchain Portfolios. The Portfolio Strategies are not designed to be suitable for any specific investor and do not take into account the individual needs, objectives or risk tolerance of any investor or prospective investor. BlackRock has not prepared or approved this document or any other offering or marketing material, and is not responsible for the tokenization, issuance, distribution, custody, or operation of the Tokens or the Onchain Portfolios. BlackRock is not making any offer to sell nor soliciting any offer to buy any securities. An investment in the Tokens involves risk, including the possible loss of principal, and past performance is not indicative of future results.
Investors have no right, title, interest, or claim in or to any of the funds or securities underlying any Onchain Portfolio (the “Underlying Funds”) or any recourse to any manager of the Underlying Funds, and such Underlying Funds are not being offered, marketed, or distributed to Investors by BlackRock or Ondo, whether directly or indirectly through the Tokens or the Onchain Portfolios. The Tokens constitute separate and distinct securities issued by Ondo and do not represent any interest in the Underlying Funds.
The Portfolio Strategies will include funds sponsored and managed by BlackRock and its affiliates, which will pay fees to BlackRock and its affiliates for providing management, administrative, or other services. Accordingly, BlackRock has a potential conflict of interest in connection with providing the Portfolio Strategies, as an investment in such funds by the Onchain Portfolio will increase compensation to BlackRock and its affiliates. BlackRock has an incentive to provide a Portfolio Strategy that contains funds that would result in increased levels of compensation being paid to BlackRock and its affiliates by such funds.
Additional information about BlackRock, including its Form ADV, is available from the U.S. Securities and Exchange Commission’s Investment Adviser Public Disclosure website at https://adviserinfo.sec.gov.
The post Ondo Intelligent Portfolios Lineup Expands to Solana appeared first on CaptainAltcoin.
1
1
431
Проверено
Analyst Admits His Silver Price Prediction Was Wrong, Revises OutlookSilver’s continued weakness has forced analyst Fthegurus to abandon a forecast he had recently defended. His latest update explains why the recovery he expected never arrived and why his outlook has become much more cautious.
The change goes beyond a missed price target. Fthegurus has reconsidered what silver’s failure to recover could mean for the coming weeks and months. His revised silver price prediction now places greater importance on support levels, realistic expectations and evidence that buyers can regain control.
Fthegurus Initially Expected Silver Price To Reach $70
Fthegurus originally predicted that silver would reach $70 per ounce by November 15. Silver traded around $58 when he made that call, so the target required a gain of approximately 20.7%.
The metal moved in the opposite direction. Silver later traded just below $54, which left a larger gap between the market price and his target.
His first response remained optimistic because he believed the conditions for a relief rally were present. He described silver’s RSI as being at its most oversold level of the year and expected a rebound the following week.
His initial argument rested on several observations:
Oversold Momentum: He believed silver’s unusually low RSI reading increased the possibility of a relief rally.
Interest Rate Expectations: He argued that an expected rate increase was already priced into the market.
Support Around $54: He viewed that level as a potential foundation for the recovery toward his target.
Those conditions gave him reasons to retain the forecast, although none guaranteed that silver would recover before the deadline. An oversold market can remain weak if buyers fail to return with enough demand.
Silver’s Failure To Rally Changed The Analyst’s Assessment
Fthegurus has now cancelled his $70 silver price prediction and accepted that the original call was wrong.
His latest explanation focuses on the recovery that never materialized. He described the Federal Reserve as having paused rate increases and adopted a more cautious stance. He expected that development to help silver produce at least a relief rally.
Silver’s failure to respond weakened his confidence in the bullish case.
Silver. My call for silver to hit $70/oz by mid-November is officially cancelled. I was wrong. No excuses, no talk of manipulation, no victimhood—just a bad prediction. The weakness in Silver has been striking. After the Fed paused rate hikes and shifted to a more cautious “wait and see” stance, I expected at least a relief rally. It didn’t materialize. That tells you something about the current underlying demand and sentiment. Does this mean silver is a bad investment? Absolutely not. It remains a core holding in a well-diversified portfolio for the long term. But if you’re looking for a quick trade or meaningful upside in the coming weeks or months, I don’t see it. Claiming $70 is right around the corner would be irresponsible. The key levels to watch are the supports at $50 and $45. Holding those would be constructive. A break below them would be psychologically damaging and open the door to a deeper correction. Low volatility is ahead. Patience is the only honest take right now.
— Fthegurus (@fthegurus) October 28, 2026
That distinction matters because a forecast depends on more than whether a supportive event occurs. The asset’s response helps determine whether the original reasoning still holds.
A more cautious interest rate outlook can help precious metals because they do not pay interest. However, silver also responds to industrial demand, currency movements and other market pressures. Rate expectations alone cannot guarantee higher prices.
Fthegurus interpreted the absent recovery as evidence of weak underlying demand and sentiment. That is his reading of the price action. The supplied commentary does not include separate demand figures or investor flow data to confirm the explanation.
Even so, the failed rally gave him a clear reason to reconsider his target. The market had not delivered the response his forecast required.
Revised Silver Price Prediction Rules Out A Quick Return To $70
The revised view is much more cautious about silver’s immediate prospects.
Fthegurus no longer expects a quick trade or substantial upside over the coming weeks or months. He also rejects the idea that $70 is immediately ahead.
His revised position contains several important changes:
The Deadline Has Been Removed: The mid November target is cancelled, without a replacement date for silver to reach $70.
Near Term Expectations Have Fallen: He does not currently see a convincing case for substantial upside over the coming weeks or months.
Support Now Takes Priority: His attention has moved toward whether silver can defend $50 and $45.
Patience Replaces An Immediate Rally Call: He expects lower volatility and wants stronger evidence before anticipating a recovery.
This is a broader reassessment than simply extending the original deadline. Fthegurus has reduced his expectations because the price behavior no longer supports his previous confidence.
His lower volatility forecast also remains uncertain. A break through major support could produce larger price moves than he currently anticipates.
Read Also: Altcoin Price Prediction: Analyst Expects 100-200% Run After FOMC
Silver Support At $50 And $45 Becomes Central To The Outlook
Fthegurus identifies $50 and $45 as the key support levels in his revised silver price outlook.
A successful defense of those areas would be constructive in his assessment. It would show that buyers can absorb some of the pressure after the recent weakness.
A break below those supports would carry a different message. He believes it could damage confidence and expose silver to a deeper correction.
These are conditional scenarios, so neither level guarantees a rebound. The strength and duration of any recovery would matter alongside the initial support reaction.
Fthegurus remains positive about silver’s role as a longer term portfolio asset. However, that personal assessment does not change his weaker near term forecast.
The distinction is useful: confidence in an asset over several years does not automatically justify an ambitious price target over several weeks.
Today’s Silver Price Outlook Also Points To Weak Momentum
Our separate silver price prediction for today, October 29, examines the immediate technical picture in more detail. The analysis identifies pressure near $52.70, with $51 as the next downside target if the breakdown holds.
Silver’s RSI of 33.828 remains above the usual oversold threshold of 30. Negative MACD and Bull/Bear Power readings also support the weaker momentum picture.
Read Also: Altcoin Price Prediction: Analyst Expects 100-200% Run After FOMC
The immediate scenarios remain straightforward:
Bearish Scenario: Continued weakness below $52.70 could expose the next support around $51.
Neutral Scenario: Recovery above $52.90 could restore the range up to $54.60.
Bullish Scenario: A sustained break above $54.60 could open a recovery toward $56.60.
Those nearby levels provide context for Fthegurus’ broader reassessment. His revised view now depends on silver proving that it can stabilize before a stronger recovery becomes credible.
Subscribe to our YouTube channel for daily crypto updates, market insights, and expert analysis.
The post Analyst Admits His Silver Price Prediction Was Wrong, Revises Outlook appeared first on CaptainAltcoin.
Analyst Admits His Silver Price Prediction Was Wrong, Revises Outlook
Silver’s continued weakness has forced analyst Fthegurus to abandon a forecast he had recently defended. His latest update explains why the recovery he expected never arrived and why his outlook has become much more cautious.
The change goes beyond a missed price target. Fthegurus has reconsidered what silver’s failure to recover could mean for the coming weeks and months. His revised silver price prediction now places greater importance on support levels, realistic expectations and evidence that buyers can regain control.
Fthegurus Initially Expected Silver Price To Reach $70
Fthegurus originally predicted that silver would reach $70 per ounce by November 15. Silver traded around $58 when he made that call, so the target required a gain of approximately 20.7%.
The metal moved in the opposite direction. Silver later traded just below $54, which left a larger gap between the market price and his target.
His first response remained optimistic because he believed the conditions for a relief rally were present. He described silver’s RSI as being at its most oversold level of the year and expected a rebound the following week.
His initial argument rested on several observations:
Oversold Momentum: He believed silver’s unusually low RSI reading increased the possibility of a relief rally.
Interest Rate Expectations: He argued that an expected rate increase was already priced into the market.
Support Around $54: He viewed that level as a potential foundation for the recovery toward his target.
Those conditions gave him reasons to retain the forecast, although none guaranteed that silver would recover before the deadline. An oversold market can remain weak if buyers fail to return with enough demand.
Silver’s Failure To Rally Changed The Analyst’s Assessment
Fthegurus has now cancelled his $70 silver price prediction and accepted that the original call was wrong.
His latest explanation focuses on the recovery that never materialized. He described the Federal Reserve as having paused rate increases and adopted a more cautious stance. He expected that development to help silver produce at least a relief rally.
Silver’s failure to respond weakened his confidence in the bullish case.
Silver. My call for silver to hit $70/oz by mid-November is officially cancelled. I was wrong. No excuses, no talk of manipulation, no victimhood—just a bad prediction. The weakness in Silver has been striking. After the Fed paused rate hikes and shifted to a more cautious “wait and see” stance, I expected at least a relief rally. It didn’t materialize. That tells you something about the current underlying demand and sentiment. Does this mean silver is a bad investment? Absolutely not. It remains a core holding in a well-diversified portfolio for the long term. But if you’re looking for a quick trade or meaningful upside in the coming weeks or months, I don’t see it. Claiming $70 is right around the corner would be irresponsible. The key levels to watch are the supports at $50 and $45. Holding those would be constructive. A break below them would be psychologically damaging and open the door to a deeper correction. Low volatility is ahead. Patience is the only honest take right now.
— Fthegurus (@fthegurus) October 28, 2026
That distinction matters because a forecast depends on more than whether a supportive event occurs. The asset’s response helps determine whether the original reasoning still holds.
A more cautious interest rate outlook can help precious metals because they do not pay interest. However, silver also responds to industrial demand, currency movements and other market pressures. Rate expectations alone cannot guarantee higher prices.
Fthegurus interpreted the absent recovery as evidence of weak underlying demand and sentiment. That is his reading of the price action. The supplied commentary does not include separate demand figures or investor flow data to confirm the explanation.
Even so, the failed rally gave him a clear reason to reconsider his target. The market had not delivered the response his forecast required.
Revised Silver Price Prediction Rules Out A Quick Return To $70
The revised view is much more cautious about silver’s immediate prospects.
Fthegurus no longer expects a quick trade or substantial upside over the coming weeks or months. He also rejects the idea that $70 is immediately ahead.
His revised position contains several important changes:
The Deadline Has Been Removed: The mid November target is cancelled, without a replacement date for silver to reach $70.
Near Term Expectations Have Fallen: He does not currently see a convincing case for substantial upside over the coming weeks or months.
Support Now Takes Priority: His attention has moved toward whether silver can defend $50 and $45.
Patience Replaces An Immediate Rally Call: He expects lower volatility and wants stronger evidence before anticipating a recovery.
This is a broader reassessment than simply extending the original deadline. Fthegurus has reduced his expectations because the price behavior no longer supports his previous confidence.
His lower volatility forecast also remains uncertain. A break through major support could produce larger price moves than he currently anticipates.
Read Also: Altcoin Price Prediction: Analyst Expects 100-200% Run After FOMC
Silver Support At $50 And $45 Becomes Central To The Outlook
Fthegurus identifies $50 and $45 as the key support levels in his revised silver price outlook.
A successful defense of those areas would be constructive in his assessment. It would show that buyers can absorb some of the pressure after the recent weakness.
A break below those supports would carry a different message. He believes it could damage confidence and expose silver to a deeper correction.
These are conditional scenarios, so neither level guarantees a rebound. The strength and duration of any recovery would matter alongside the initial support reaction.
Fthegurus remains positive about silver’s role as a longer term portfolio asset. However, that personal assessment does not change his weaker near term forecast.
The distinction is useful: confidence in an asset over several years does not automatically justify an ambitious price target over several weeks.
Today’s Silver Price Outlook Also Points To Weak Momentum
Our separate silver price prediction for today, October 29, examines the immediate technical picture in more detail. The analysis identifies pressure near $52.70, with $51 as the next downside target if the breakdown holds.
Silver’s RSI of 33.828 remains above the usual oversold threshold of 30. Negative MACD and Bull/Bear Power readings also support the weaker momentum picture.
Read Also: Altcoin Price Prediction: Analyst Expects 100-200% Run After FOMC
The immediate scenarios remain straightforward:
Bearish Scenario: Continued weakness below $52.70 could expose the next support around $51.
Neutral Scenario: Recovery above $52.90 could restore the range up to $54.60.
Bullish Scenario: A sustained break above $54.60 could open a recovery toward $56.60.
Those nearby levels provide context for Fthegurus’ broader reassessment. His revised view now depends on silver proving that it can stabilize before a stronger recovery becomes credible.
Subscribe to our YouTube channel for daily crypto updates, market insights, and expert analysis.
The post Analyst Admits His Silver Price Prediction Was Wrong, Revises Outlook appeared first on CaptainAltcoin.
670
SUI Launches Asset Transfers on Mercado Bitcoin in BrazilSui is expanding into Brazil through Mercado Bitcoin, giving millions of local users direct access to assets built on the network.
Mercado Bitcoin has become the first exchange in Brazil to support Sui asset transfers. Its 4.5 million clients can now buy, sell, send and receive SUI, USDC and USDsui.
The expansion goes beyond basic token trading.
USDsui is also becoming available as lending collateral for Mercado Bitcoin customers, opening another route into Sui-based financial products.
Mercado Bitcoin is additionally exploring an integration with Hashi, Sui’s native Bitcoin infrastructure, once it reaches mainnet. That could eventually allow Brazilian users to use native BTC for lending and borrowing through applications built on Sui.
Hashi is expected to launch with more than $500 million in committed capital and is designed to let Bitcoin serve as collateral in lending, borrowing, credit and other financial products without requiring users to sell their underlying BTC.
Sui is coming to Brazil @MercadoBitcoin, Latin America’s leading digital asset platform, is the first exchange in Brazil to support Sui asset transfers. Its 4.5M clients can now buy, sell, send, and receive $SUI, $USDC, and $USDsui.
— Sui (@SuiNetwork) October 29, 2026
Read also: SUI Positioned for Economic Singularity, Says Raoul Pal at Basecamp 2026
Mercado Bitcoin Brings Tokenized Assets to Sui
Another important part of the partnership involves real-world assets.
Mercado Bitcoin plans to bring its CVM- and BCB-regulated RWA platform to Sui. The exchange says it has issued more than 800 tokenized assets since 2019 across areas including credit, lending and real estate.
Those assets can connect directly with Brazil’s existing payment infrastructure, allowing investors to move between Brazilian reais and tokenized assets around the clock.
For Sui, the integration expands its reach into one of Latin America’s largest crypto markets while also adding another institutional use case around stablecoins, tokenization and Bitcoin-backed finance.
The timing also fits Sui’s broader push into digital payments. The network already supports gasless transfers for several stablecoins, including USDC and USDsui.
Mercado Bitcoin’s integration therefore gives Sui more than another exchange listing.
It provides a direct route to millions of Brazilian users and connects the network to lending, stablecoins, tokenized real-world assets and potentially native Bitcoin finance.
For more crypto news and price predictions, click here.
Subscribe to our YouTube channel for daily crypto updates, market insights, and expert analysis.
The post SUI Launches Asset Transfers on Mercado Bitcoin in Brazil appeared first on CaptainAltcoin.
SUI Launches Asset Transfers on Mercado Bitcoin in Brazil
Sui is expanding into Brazil through Mercado Bitcoin, giving millions of local users direct access to assets built on the network.
Mercado Bitcoin has become the first exchange in Brazil to support Sui asset transfers. Its 4.5 million clients can now buy, sell, send and receive SUI, USDC and USDsui.
The expansion goes beyond basic token trading.
USDsui is also becoming available as lending collateral for Mercado Bitcoin customers, opening another route into Sui-based financial products.
Mercado Bitcoin is additionally exploring an integration with Hashi, Sui’s native Bitcoin infrastructure, once it reaches mainnet. That could eventually allow Brazilian users to use native BTC for lending and borrowing through applications built on Sui.
Hashi is expected to launch with more than $500 million in committed capital and is designed to let Bitcoin serve as collateral in lending, borrowing, credit and other financial products without requiring users to sell their underlying BTC.
Sui is coming to Brazil @MercadoBitcoin, Latin America’s leading digital asset platform, is the first exchange in Brazil to support Sui asset transfers. Its 4.5M clients can now buy, sell, send, and receive $SUI, $USDC, and $USDsui.
— Sui (@SuiNetwork) October 29, 2026
Read also: SUI Positioned for Economic Singularity, Says Raoul Pal at Basecamp 2026
Mercado Bitcoin Brings Tokenized Assets to Sui
Another important part of the partnership involves real-world assets.
Mercado Bitcoin plans to bring its CVM- and BCB-regulated RWA platform to Sui. The exchange says it has issued more than 800 tokenized assets since 2019 across areas including credit, lending and real estate.
Those assets can connect directly with Brazil’s existing payment infrastructure, allowing investors to move between Brazilian reais and tokenized assets around the clock.
For Sui, the integration expands its reach into one of Latin America’s largest crypto markets while also adding another institutional use case around stablecoins, tokenization and Bitcoin-backed finance.
The timing also fits Sui’s broader push into digital payments. The network already supports gasless transfers for several stablecoins, including USDC and USDsui.
Mercado Bitcoin’s integration therefore gives Sui more than another exchange listing.
It provides a direct route to millions of Brazilian users and connects the network to lending, stablecoins, tokenized real-world assets and potentially native Bitcoin finance.
For more crypto news and price predictions, click here.
Subscribe to our YouTube channel for daily crypto updates, market insights, and expert analysis.
The post SUI Launches Asset Transfers on Mercado Bitcoin in Brazil appeared first on CaptainAltcoin.
188
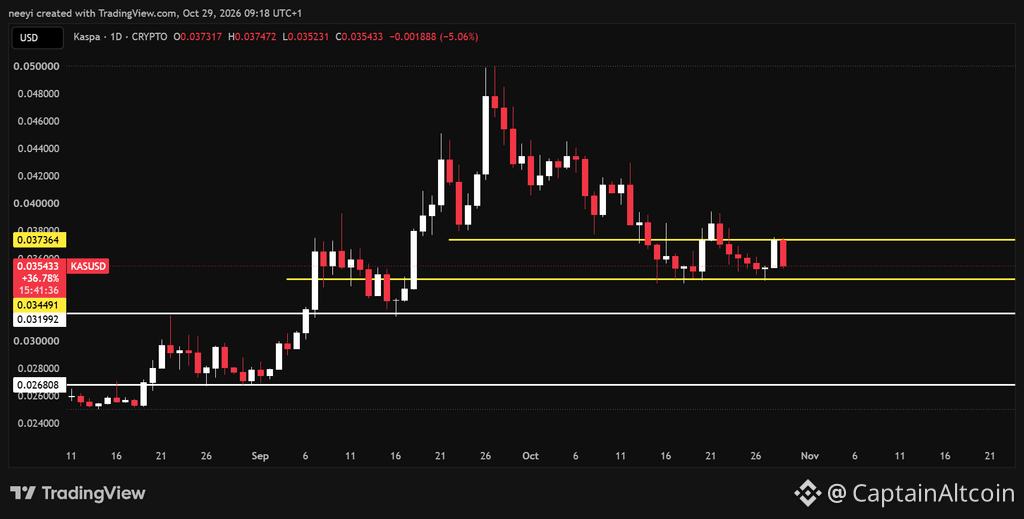
Статья
Is Kaspa Dead? KAS Price Bounces, but Its 83% Crash Leaves Hard QuestionsKaspa’s latest bounce has already lost its footing. KAS climbed toward $0.037 yesterday before sellers pushed the price back down, which leaves the token close to another important support test. The reversal brings a familiar question back into focus: has Kaspa’s prolonged decline become something more serious than a difficult market cycle?
The price action gives holders reasons for concern, although the network’s development record complicates the argument that the project is dead. Kaspa now faces separate tests across its chart, trading activity and ability to turn technical progress into demand.
Kaspa Price Gives Back Its Bounce As Support Comes Under Pressure
KAS trades around $0.0354 in the latest price update after surrendering yesterday’s recovery. Entitled Trader’s earlier snapshot captured the stronger part of that move, when Kaspa traded near $0.0368 after a 4.37% daily rise.
The account reported approximately $12.7 million in daily volume and a 4% decline in Binance futures open interest. Entitled Trader interpreted that combination as evidence that spot buyers were probably behind the bounce.
KASPA UPDATE kaspa:native Kaspa rose 4.37% over the past 24 hours and now trades near $0.0368. $12.7M traded in the last 24 hours. Why it’s moving: Spot buyers appear to be leading the rise, with futures positioning little changed and no project post or news pointing to a cause. • Futures positions barely changed on Binance (open interest −4%): spot buyers are leading • 66% of Binance futures traders are long: buyers are the crowded side Where it stands: 82% below its all-time high of $0.2074 (Jul 2024). Kaspa by the numbers: Price: $0.0368 (rank #61) 1H +0.62% · 24H +4.37% · 7D -5.26% · 30D -18.15% Market cap: $1.0B Not financial advice. #Kaspa #KAS
— Entitled Trader (@EntitledTrader) October 28, 2026
That interpretation remains tentative because lower open interest does not independently establish where buying demand originated. The account also reported that 66% of Binance futures traders were long, which describes a trader ratio rather than the share of capital committed to bullish positions.
The subsequent reversal matters more for the immediate outlook. Buyers lifted Kaspa price toward $0.037 but could not preserve the advance, so that area now represents an initial recovery hurdle.
KAS Price Risks A Deeper Decline Below $0.0343
The nearest support in the supplied technical outlook is approximately $0.0343. A decisive break below that level could expose $0.0319, the next major support area.
The $0.0319 level has reportedly held since September. Repeated defenses make it relevant, although previous success does not guarantee another rebound if selling pressure increases.
KAS Price Chart Showing Key Levels
The main levels are:
$0.037 remains the initial recovery hurdle after yesterday’s advance failed.
$0.0343 provides the nearest support test below the latest quoted price.
$0.0319 represents the next major floor if the nearer support breaks.
$0.029 and $0.026 become deeper downside possibilities if $0.0319 also fails.
A brief move below support would carry less weight than sustained trade beneath it. Buyers would need to reclaim a lost level promptly to reduce the risk of further declines.
Kaspa’s Development Record Challenges The Dead Project Argument
Our Crypto Talk presents a distinction between Kaspa’s weak market performance and continued network development. Its review places KAS approximately 83% below its July 2024 peak near $0.207.
The same review describes a network that continues producing approximately 10 blocks per second after the Crescendo upgrade in May 2025. It also reports that the June 30 Toccata upgrade introduced covenants and native zero knowledge proof verification.
Other developments cited include Rusty Kaspa v2.1.0 in September and the finalization of the KCC-20 token standard on October 21. Reported active covenant IDs increased from 1,078 on October 6 to 1,689 on October 27.
Those figures indicate activity within the new functionality, although covenant IDs should not be treated as a direct count of unique users. The larger question concerns whether these features can support applications that generate repeat usage and fees.
Thin Volume And Miner Economics Keep Kaspa Under Pressure
Our Crypto Talk’s concerns extend beyond the price chart. The account reports average daily volume near $14 million over the previous 30 days, compared with approximately $53 million a year earlier.
Its review also places hashrate around 348 PH/s, approximately 78% below its January 2025 peak. Fees reportedly contributed only 0.14% of miner revenue over the past month, which leaves miners heavily dependent on block rewards.
$KAS is down about 83% from its ATH > Trades on thin volume > No listing on Coinbase > No listing on Binance Almost every day, someone on X calls Kaspa a DEAD PROJECT Yet the chain still makes 10 blocks a second and activated a major upgrade this summer. So is Kaspa dead, or has the crowd just moved on? What the price is really telling us At around $0.036 today, KAS sits roughly 83% below its $0.207 peak from July 2024, according to CoinGecko. It is also down about 37% over the past year, with a market cap near $1 billion. Trading has thinned out a lot since then. Daily volume over the last 30 days averaged about $14 million, compared with roughly $53 million a year ago. Meanwhile the network kept on working Blocks have kept landing about 10 times a second since the Crescendo upgrade in May 2025. On June 30 this year, the Toccata hard fork added covenants and native zero knowledge proof checks to the base layer. The builders are still clearly showing up. Rusty Kaspa v2.1.0 shipped in September, and the KCC-20 token standard was marked final on October 21. Active covenant IDs grew from 1,078 on October 6 to 1,689 on October 27. Those numbers are small, but they show people actually using the new features. The worries are not made up Hashrate sits near 348 PH/s, about 78% below its January 2025 peak. Fees paid only 0.14% of miner revenue over the past month, and block rewards get cut again on November 4. Access is another weak spot, since Coinbase and Binance still do not list KAS for spot trading. Bybit EU dropped it in September, the same month an exploit hit a KRC-20 token indexer built on top of Kaspa. So where does that leave Kaspa A dead project stops shipping code, and Kaspa clearly has not. What it has lost is attention, liquidity and a big share of its miners. Our honest read is that Kaspa is alive as a network but still unproven as an economy. The next year comes down to whether covenant apps and tokens bring real users who pay real fees. What would convince you first, steady app usage or a major exchange listing?
— Our Crypto Talk (@ourcryptotalk) October 28, 2026
The account additionally cites limited spot exchange access and an exploit involving a KRC-20 token indexer. An incident affecting an indexer should be distinguished from a compromise of Kaspa’s base network, but infrastructure reliability still matters for users.
These concerns explain why software releases alone may struggle to restore confidence in KAS price.
Read Also: Hedera Has Real Utility, but That Doesn’t Make HBAR a Buy – Here’s Why
Calling Kaspa Dead May Be Premature Despite Its Price Collapse
Crypto assets have recovered from prolonged declines before, although many others never regained their former strength. Kaspa’s distance from its peak cannot settle which outcome comes next.
The long wait since its last major rally may contribute to holder frustration, but the supplied posts do not measure that sentiment across all holders.
A final verdict therefore looks premature. Kaspa continues to develop, but its economic activity must justify that progress.
Subscribe to our YouTube channel for daily crypto updates, market insights, and expert analysis.
The post Is Kaspa Dead? KAS Price Bounces, but Its 83% Crash Leaves Hard Questions appeared first on CaptainAltcoin.
Is Kaspa Dead? KAS Price Bounces, but Its 83% Crash Leaves Hard Questions
Kaspa’s latest bounce has already lost its footing. KAS climbed toward $0.037 yesterday before sellers pushed the price back down, which leaves the token close to another important support test. The reversal brings a familiar question back into focus: has Kaspa’s prolonged decline become something more serious than a difficult market cycle?
The price action gives holders reasons for concern, although the network’s development record complicates the argument that the project is dead. Kaspa now faces separate tests across its chart, trading activity and ability to turn technical progress into demand.
Kaspa Price Gives Back Its Bounce As Support Comes Under Pressure
KAS trades around $0.0354 in the latest price update after surrendering yesterday’s recovery. Entitled Trader’s earlier snapshot captured the stronger part of that move, when Kaspa traded near $0.0368 after a 4.37% daily rise.
The account reported approximately $12.7 million in daily volume and a 4% decline in Binance futures open interest. Entitled Trader interpreted that combination as evidence that spot buyers were probably behind the bounce.
KASPA UPDATE kaspa:native Kaspa rose 4.37% over the past 24 hours and now trades near $0.0368. $12.7M traded in the last 24 hours. Why it’s moving: Spot buyers appear to be leading the rise, with futures positioning little changed and no project post or news pointing to a cause. • Futures positions barely changed on Binance (open interest −4%): spot buyers are leading • 66% of Binance futures traders are long: buyers are the crowded side Where it stands: 82% below its all-time high of $0.2074 (Jul 2024). Kaspa by the numbers: Price: $0.0368 (rank #61) 1H +0.62% · 24H +4.37% · 7D -5.26% · 30D -18.15% Market cap: $1.0B Not financial advice. #Kaspa #KAS
— Entitled Trader (@EntitledTrader) October 28, 2026
That interpretation remains tentative because lower open interest does not independently establish where buying demand originated. The account also reported that 66% of Binance futures traders were long, which describes a trader ratio rather than the share of capital committed to bullish positions.
The subsequent reversal matters more for the immediate outlook. Buyers lifted Kaspa price toward $0.037 but could not preserve the advance, so that area now represents an initial recovery hurdle.
KAS Price Risks A Deeper Decline Below $0.0343
The nearest support in the supplied technical outlook is approximately $0.0343. A decisive break below that level could expose $0.0319, the next major support area.
The $0.0319 level has reportedly held since September. Repeated defenses make it relevant, although previous success does not guarantee another rebound if selling pressure increases.
KAS Price Chart Showing Key Levels
The main levels are:
$0.037 remains the initial recovery hurdle after yesterday’s advance failed.
$0.0343 provides the nearest support test below the latest quoted price.
$0.0319 represents the next major floor if the nearer support breaks.
$0.029 and $0.026 become deeper downside possibilities if $0.0319 also fails.
A brief move below support would carry less weight than sustained trade beneath it. Buyers would need to reclaim a lost level promptly to reduce the risk of further declines.
Kaspa’s Development Record Challenges The Dead Project Argument
Our Crypto Talk presents a distinction between Kaspa’s weak market performance and continued network development. Its review places KAS approximately 83% below its July 2024 peak near $0.207.
The same review describes a network that continues producing approximately 10 blocks per second after the Crescendo upgrade in May 2025. It also reports that the June 30 Toccata upgrade introduced covenants and native zero knowledge proof verification.
Other developments cited include Rusty Kaspa v2.1.0 in September and the finalization of the KCC-20 token standard on October 21. Reported active covenant IDs increased from 1,078 on October 6 to 1,689 on October 27.
Those figures indicate activity within the new functionality, although covenant IDs should not be treated as a direct count of unique users. The larger question concerns whether these features can support applications that generate repeat usage and fees.
Thin Volume And Miner Economics Keep Kaspa Under Pressure
Our Crypto Talk’s concerns extend beyond the price chart. The account reports average daily volume near $14 million over the previous 30 days, compared with approximately $53 million a year earlier.
Its review also places hashrate around 348 PH/s, approximately 78% below its January 2025 peak. Fees reportedly contributed only 0.14% of miner revenue over the past month, which leaves miners heavily dependent on block rewards.
$KAS is down about 83% from its ATH > Trades on thin volume > No listing on Coinbase > No listing on Binance Almost every day, someone on X calls Kaspa a DEAD PROJECT Yet the chain still makes 10 blocks a second and activated a major upgrade this summer. So is Kaspa dead, or has the crowd just moved on? What the price is really telling us At around $0.036 today, KAS sits roughly 83% below its $0.207 peak from July 2024, according to CoinGecko. It is also down about 37% over the past year, with a market cap near $1 billion. Trading has thinned out a lot since then. Daily volume over the last 30 days averaged about $14 million, compared with roughly $53 million a year ago. Meanwhile the network kept on working Blocks have kept landing about 10 times a second since the Crescendo upgrade in May 2025. On June 30 this year, the Toccata hard fork added covenants and native zero knowledge proof checks to the base layer. The builders are still clearly showing up. Rusty Kaspa v2.1.0 shipped in September, and the KCC-20 token standard was marked final on October 21. Active covenant IDs grew from 1,078 on October 6 to 1,689 on October 27. Those numbers are small, but they show people actually using the new features. The worries are not made up Hashrate sits near 348 PH/s, about 78% below its January 2025 peak. Fees paid only 0.14% of miner revenue over the past month, and block rewards get cut again on November 4. Access is another weak spot, since Coinbase and Binance still do not list KAS for spot trading. Bybit EU dropped it in September, the same month an exploit hit a KRC-20 token indexer built on top of Kaspa. So where does that leave Kaspa A dead project stops shipping code, and Kaspa clearly has not. What it has lost is attention, liquidity and a big share of its miners. Our honest read is that Kaspa is alive as a network but still unproven as an economy. The next year comes down to whether covenant apps and tokens bring real users who pay real fees. What would convince you first, steady app usage or a major exchange listing?
— Our Crypto Talk (@ourcryptotalk) October 28, 2026
The account additionally cites limited spot exchange access and an exploit involving a KRC-20 token indexer. An incident affecting an indexer should be distinguished from a compromise of Kaspa’s base network, but infrastructure reliability still matters for users.
These concerns explain why software releases alone may struggle to restore confidence in KAS price.
Read Also: Hedera Has Real Utility, but That Doesn’t Make HBAR a Buy – Here’s Why
Calling Kaspa Dead May Be Premature Despite Its Price Collapse
Crypto assets have recovered from prolonged declines before, although many others never regained their former strength. Kaspa’s distance from its peak cannot settle which outcome comes next.
The long wait since its last major rally may contribute to holder frustration, but the supplied posts do not measure that sentiment across all holders.
A final verdict therefore looks premature. Kaspa continues to develop, but its economic activity must justify that progress.
Subscribe to our YouTube channel for daily crypto updates, market insights, and expert analysis.
The post Is Kaspa Dead? KAS Price Bounces, but Its 83% Crash Leaves Hard Questions appeared first on CaptainAltcoin.
3
163
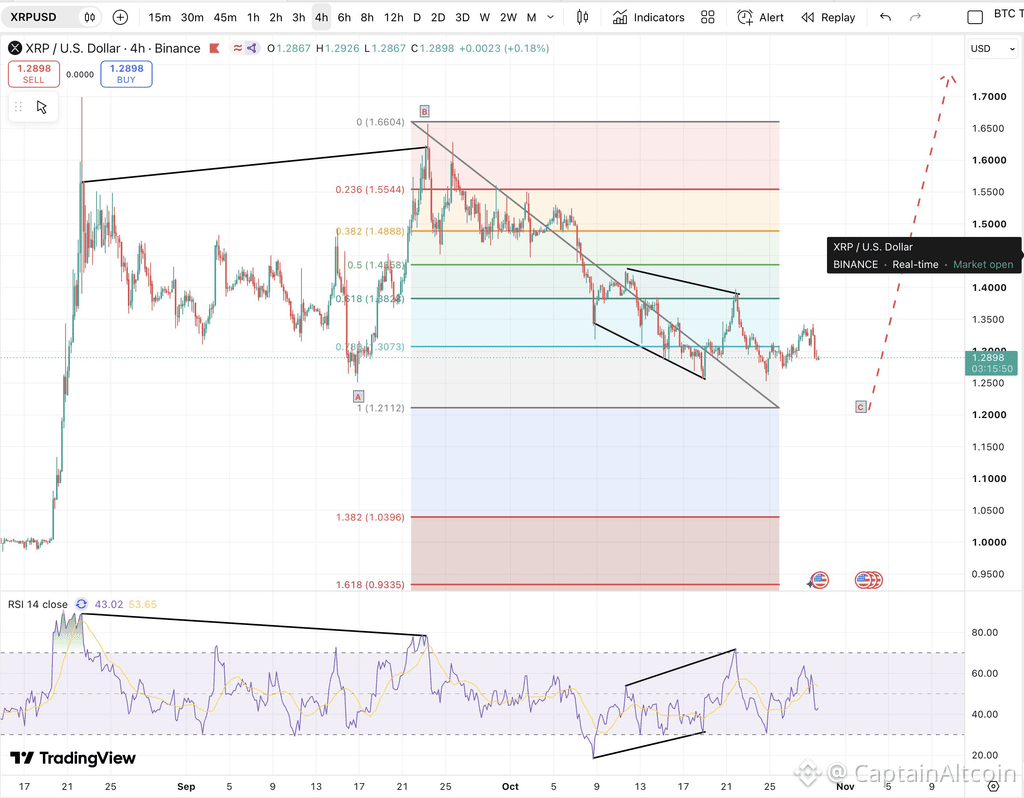
Статья
Analyst’s XRP Price Prediction Points to a Bullish Setup, But…XRP price is struggling around $1.29 today, but veteran financial trader Matthew Dixon believes the broader correction may be approaching its final stage.
His preferred interpretation is that XRP has been moving through an ABC corrective structure after the strong advance visible on the left side of his four-hour chart.
Under that scenario, XRP may still need one more drop toward roughly $1.21 before the correction is complete.
The setup is bullish in Dixon’s view, but price has not confirmed it yet.
Why Dixon Is Watching $1.21
The XRP chart begins with a strong move that took XRP to approximately $1.66.
Since then, price has been gradually working lower.
Dixon labels the move as an ABC correction, with XRP potentially approaching the end of wave C.
The most important downside reference is around $1.21, which also lines up with the previous major low marked on the chart.
That does not mean XRP has to touch $1.21 exactly.
Source: X/@mdtrade
His point is that another sweep toward that region could finish the corrective structure before buyers regain control.
The Fibonacci map also shows $1.307 around the 78.6% retracement, with price currently trading slightly below that region near $1.29.
Above current price, the next larger levels are around $1.38-$1.40, followed by $1.47-$1.49 and $1.55.
Three RSI Divergences Have Already Given Signals
One of the more interesting parts of Dixon’s chart is the RSI.
He marks three separate divergences where momentum moved differently from price before a reversal followed.
The latest divergence developed during XRP’s October decline.
Price formed lower lows, but RSI began forming higher lows.
That can indicate bearish momentum is weakening even though the price trend still looks poor.
However, Dixon is not treating the divergence as sufficient confirmation by itself.
That is why the $1.39-$1.40 region is so important.
A break above that zone would show that price structure is finally following the improvement already visible in momentum.
Until then, XRP remains inside the correction.
Read also: XRP Supply Data Sends a Bullish Signal as Whales Keep Buying
XRP Is Still Weak Today
That caution fits what the XRP price is doing right now.
XRP is trading around $1.29 and has fallen roughly 2%-3% over the past 24 hours, underperforming the broader crypto market after the Federal Reserve left interest rates unchanged.
Price recently attempted to recover toward the $1.33-$1.34 area but failed to hold the move.
That leaves the $1.25-$1.30 region exposed again.
The wider crypto environment is also not helping. The Fed remains cautious on inflation, and risk assets have remained under pressure following the latest FOMC meeting.
At the same time, XRP has several project-specific developments in the background.
Ripple’s Swell conference is running from October 27-29 in New York, with discussions around institutional crypto adoption, ETFs, payments, tokenization and XRP utility.
Ripple also announced this week that it is approaching a $900 million annualized product revenue run rate and now works with more than 1,700 institutions, corporates and enterprises across its products.
Those developments strengthen the broader Ripple ecosystem story, but so far they have not been enough to reverse XRP’s short-term price trend.
What Would Confirm Dixon’s Bullish XRP Scenario?
For me, Dixon’s setup has two clearly defined sides.
If XRP falls toward $1.21 and buyers respond quickly, that could fit his idea that the ABC correction is reaching completion.
But the real confirmation would come higher.
A break above $1.39-$1.40 would invalidate much of the immediate bearish structure and strengthen the case for a renewed impulsive move.
From there, the chart places the next notable Fibonacci levels near $1.47-$1.49 and $1.55.
So the bullish thesis is not based on XRP already being in a new uptrend.
It is based on the possibility that the current downtrend is close to finishing.
That is an important difference.
XRP may still have one uncomfortable move lower left before the setup becomes attractive.
For more crypto news and price predictions, click here.
Subscribe to our YouTube channel for daily crypto updates, market insights, and expert analysis.
The post Analyst’s XRP Price Prediction Points to a Bullish Setup, but… appeared first on CaptainAltcoin.
Analyst’s XRP Price Prediction Points to a Bullish Setup, But…
XRP price is struggling around $1.29 today, but veteran financial trader Matthew Dixon believes the broader correction may be approaching its final stage.
His preferred interpretation is that XRP has been moving through an ABC corrective structure after the strong advance visible on the left side of his four-hour chart.
Under that scenario, XRP may still need one more drop toward roughly $1.21 before the correction is complete.
The setup is bullish in Dixon’s view, but price has not confirmed it yet.
Why Dixon Is Watching $1.21
The XRP chart begins with a strong move that took XRP to approximately $1.66.
Since then, price has been gradually working lower.
Dixon labels the move as an ABC correction, with XRP potentially approaching the end of wave C.
The most important downside reference is around $1.21, which also lines up with the previous major low marked on the chart.
That does not mean XRP has to touch $1.21 exactly.
Source: X/@mdtrade
His point is that another sweep toward that region could finish the corrective structure before buyers regain control.
The Fibonacci map also shows $1.307 around the 78.6% retracement, with price currently trading slightly below that region near $1.29.
Above current price, the next larger levels are around $1.38-$1.40, followed by $1.47-$1.49 and $1.55.
Three RSI Divergences Have Already Given Signals
One of the more interesting parts of Dixon’s chart is the RSI.
He marks three separate divergences where momentum moved differently from price before a reversal followed.
The latest divergence developed during XRP’s October decline.
Price formed lower lows, but RSI began forming higher lows.
That can indicate bearish momentum is weakening even though the price trend still looks poor.
However, Dixon is not treating the divergence as sufficient confirmation by itself.
That is why the $1.39-$1.40 region is so important.
A break above that zone would show that price structure is finally following the improvement already visible in momentum.
Until then, XRP remains inside the correction.
Read also: XRP Supply Data Sends a Bullish Signal as Whales Keep Buying
XRP Is Still Weak Today
That caution fits what the XRP price is doing right now.
XRP is trading around $1.29 and has fallen roughly 2%-3% over the past 24 hours, underperforming the broader crypto market after the Federal Reserve left interest rates unchanged.
Price recently attempted to recover toward the $1.33-$1.34 area but failed to hold the move.
That leaves the $1.25-$1.30 region exposed again.
The wider crypto environment is also not helping. The Fed remains cautious on inflation, and risk assets have remained under pressure following the latest FOMC meeting.
At the same time, XRP has several project-specific developments in the background.
Ripple’s Swell conference is running from October 27-29 in New York, with discussions around institutional crypto adoption, ETFs, payments, tokenization and XRP utility.
Ripple also announced this week that it is approaching a $900 million annualized product revenue run rate and now works with more than 1,700 institutions, corporates and enterprises across its products.
Those developments strengthen the broader Ripple ecosystem story, but so far they have not been enough to reverse XRP’s short-term price trend.
What Would Confirm Dixon’s Bullish XRP Scenario?
For me, Dixon’s setup has two clearly defined sides.
If XRP falls toward $1.21 and buyers respond quickly, that could fit his idea that the ABC correction is reaching completion.
But the real confirmation would come higher.
A break above $1.39-$1.40 would invalidate much of the immediate bearish structure and strengthen the case for a renewed impulsive move.
From there, the chart places the next notable Fibonacci levels near $1.47-$1.49 and $1.55.
So the bullish thesis is not based on XRP already being in a new uptrend.
It is based on the possibility that the current downtrend is close to finishing.
That is an important difference.
XRP may still have one uncomfortable move lower left before the setup becomes attractive.
For more crypto news and price predictions, click here.
Subscribe to our YouTube channel for daily crypto updates, market insights, and expert analysis.
The post Analyst’s XRP Price Prediction Points to a Bullish Setup, but… appeared first on CaptainAltcoin.
5
1.2k
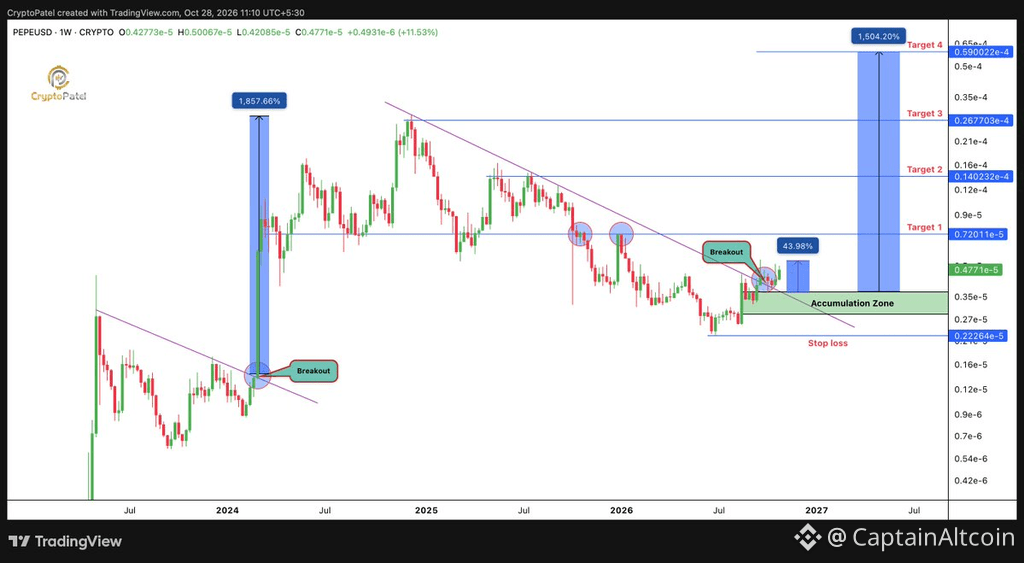
Статья
PEPE Price Pumps, Takes Aim At Shiba Inu and DOGE As Analyst Maps Huge RallyPEPE’s latest price rebound has brought its rivalry with Shiba Inu and Dogecoin back into focus. Fresh whale transfers and a bullish chart from Crypto Patel give the move several angles worth examining, although the strongest claims still need careful interpretation.
The central question goes beyond whether PEPE can produce another green candle. Its recovery must now prove that buyers can sustain demand after the initial breakout, especially as large wallets become active again.
Crypto Patel’s chart outlines an ambitious route higher. The important details concern the levels PEPE must reclaim and the support that would keep that outlook intact.
PEPE Price Challenges Shiba Inu and DOGE as Volume Claims Grow
PEPESI argues that PEPE has become more competitive against Shiba Inu and DOGE. The account claims PEPE trading volume has frequently reached 9 to 10 times SHIB’s volume and describes a narrower market capitalization gap.
Those claims need a clear distinction between trading activity and market size. Higher volume means more tokens changed hands during a particular period. It does not automatically mean PEPE has overtaken Shiba Inu in valuation or established a durable lead.
$PEPE is officially putting the other memes on notice. While $SHIB , $DOGE and the rest are lagging, the frog is exploding in volume (often 9-10x SHIB) and has closed the market cap gap to a historic low. The dog’s lead is evaporating. Momentum is one sided. $PEPE is rising. The rest are watching. Dont watch $PEPESI ON 11/9/26 — PEPESI (@PEPESI_ONX) October 28, 2026
The supplied post also does not provide matching timestamps or a comparative dataset for its volume figures. Its claim about a historically narrow valuation gap therefore remains an assertion from the account.
Shiba Inu is the direct volume comparison in that post. Dogecoin appears in the broader competitive argument, but the supplied material offers no equivalent DOGE volume comparison.
PEPE could outperform both assets over a particular period without surpassing either in total market capitalization. That distinction matters when assessing whether the latest rebound represents a stronger competitive position.
Dormant PEPE Whales Move $10.19 Million Without Confirmed Sales
BSCN reported that 2 dormant PEPE whale addresses transferred 2.27 trillion tokens worth approximately $10.19 million. The report credited data shared by Lookonchain that originated from Arkham.
Large transfers deserve examination because the destination can help explain their market relevance. Tokens sent to an exchange may become available for sale, although an exchange deposit alone does not prove execution.
Transfers between private wallets can involve custody changes or internal asset management. The report does not establish that these whales sold their holdings.
That leaves several details unresolved:
Exchange deposits would warrant closer examination for potential selling pressure.
Private wallet transfers could involve custody changes without market sales.
Subsequent wallet activity would provide more context than the initial transfers.
The whale movements therefore add uncertainty to the PEPE price recovery. They do not independently confirm either accumulation or distribution.
Jus7Degen Explains Why PEPE Needs Demand Beyond Its Meme Recognition
Jus7Degen places PEPE’s appeal around brand recognition, exchange access and speculative demand. The Ethereum token launched in April 2023 and draws its identity from the widely recognizable Pepe the Frog meme.
The analyst’s October 28 snapshot listed a market capitalization above $1.8 billion, recent daily volume above $300 million and more than 620,000 reported holders. These figures describe the account’s snapshot rather than continuously updated market data.
$PEPE — Pepe ㅤ Everyone is watching $DOGE, $SHIB, and $BONK compete for meme coin dominance. ㅤ But what about an Ethereum meme coin that turned an internet frog into a billion-dollar crypto asset? ㅤ $PEPE is betting that internet culture, community attention, and speculative liquidity can be more powerful than traditional token utility. ㅤ Pepe is an Ethereum-based meme coin launched in April 2023, inspired by the globally recognized Pepe the Frog meme. ㅤ Save this checklist: ㅤ -> Where the demand comes from ㅤ Meme coins run on attention. ㅤ Social media trends. Retail speculation. Community engagement. Exchange liquidity. Crypto market sentiment. ㅤ PEPE turns cultural recognition into a tradable digital asset. ㅤ -> Main narrative ㅤ Meme Coin Dominance. Ethereum Ecosystem. Internet Culture. Community Speculation. Retail Trading. ㅤ -> The real advantage ㅤ Most crypto projects compete through technology. ㅤ PEPE competes through attention and liquidity. ㅤ Ethereum — Established blockchain infrastructure. Major Exchanges — Broad market accessibility. Pepe Meme — Global cultural recognition. Fixed Supply — No scheduled token inflation. Community — Social-driven momentum. ㅤ No complicated technology. No institutional revenue model. No traditional product roadmap. ㅤ Its biggest asset is its brand. ㅤ -> The market adoption angle ㅤ This is where things get interesting. ㅤ As of October 28, 2026: ㅤ $1.8B+ — Market capitalization. $300M+ — Recent daily trading volume. 620K+ — Reported token holders. ㅤ PEPE remains one of the most recognizable Ethereum meme coins. ㅤ Unlike small-cap memes, it already has significant exchange liquidity. ㅤ But high trading volume doesn’t mean sustainable investment demand. ㅤ -> The PEPE tokenomics angle ㅤ Original supply: 420.69 trillion PEPE. ㅤ Reported circulating supply: 413.77T–420.69T, depending on the data provider. ㅤ Initial allocation: ㅤ 93.1% — Liquidity pools. 6.9% — Exchange listings and liquidity reserves. ㅤ No staking emissions. No scheduled VC unlocks. No native protocol revenue. No tokenholder fee sharing. ㅤ And here’s the important distinction. ㅤ PEPE liquidity provider tokens were burned at launch. ㅤ That does not mean 93.1% of the PEPE token supply was burned. ㅤ -> The valuation question ㅤ This is critical. ㅤ At approximately $1.9B in market capitalization: ㅤ 2x — Requires roughly $3.8B market cap. 5x — Requires roughly $9.5B market cap. 10x — Requires roughly $19B market cap. ㅤ These are valuation scenarios, not price predictions. ㅤ PEPE doesn’t need a new technology breakthrough to appreciate. ㅤ It needs stronger demand and sustained market attention. ㅤ -> Bull case ㅤ If meme coin speculation returns, PEPE could benefit. ㅤ More retail participation. More speculative liquidity. More social engagement. More demand for established meme coins. ㅤ Its recognizable brand could remain a competitive advantage. ㅤ -> Bear case ㅤ No fundamental value capture. ㅤ PEPE does not generate protocol revenue. ㅤ Its valuation depends heavily on speculation. ㅤ Large holders can create selling pressure. ㅤ And new meme coins constantly compete for attention. ㅤ -> What to watch ㅤ Spot trading volume. Exchange liquidity. Whale wallet movements. Social media activity. Perpetual futures funding. Meme coin market dominance. ㅤ My view: ㅤ Narrative: 9/10 Utility: 2/10 Adoption: 8/10 Risk: Very High Upside: Speculative High ㅤ Meme culture. Retail liquidity. Market psychology. ㅤ $PEPE is not a bet on revolutionary technology. ㅤ It’s a bet on whether internet culture can continue attracting billions of dollars in speculative capital. ㅤ The brand is already established. ㅤ But without fundamental cash flow, attention and liquidity remain everything. ㅤ Save this for your Meme Coin watchlist. ㅤ Which has more upside: $PEPE, $DOGE, or $BONK? ㅤ Drop your pick below. ㅤ Full research & setups on Telegram ↓ https://t.co/VUDDk1N8SJ
— Jus7Degen (@Jus7Degen) October 28, 2026
Its broader argument is straightforward: PEPE’s valuation depends heavily on whether buyers continue committing capital to its brand.
Jus7Degen also makes a useful distinction about token supply. Burning liquidity provider tokens does not mean 93.1% of PEPE’s token supply disappeared. Those represent different assets and different effects on supply.
The analyst’s valuation examples illustrate the scale of demand required. Starting from a $1.9 billion market capitalization, a 5x valuation would reach approximately $9.5 billion. A 10x valuation would reach about $19 billion, assuming comparable circulating supply.
Read Also: XRP Price Recovery Could Happen Much Faster Than Most Expect!
Market capitalization growth does not equal the exact amount of cash entering an asset. Nevertheless, larger valuations require buyers to sustain higher prices across available liquidity.
Crypto Patel’s PEPE Chart Shows A Breakout Above The Weekly Downtrend
A look at the PEPE chart shows a descending purple trendline across the prolonged decline that followed the late 2024 peak. Recent candles have moved above that line near the green accumulation area.
Crypto Patel interprets this as a confirmed weekly breakout and a successful retest on the higher timeframe. Technically, the argument is that a line which previously restricted rallies may now provide support.
PEPE Price Chart from Crypto Patel
The marked accumulation zone extends from approximately $0.0000028 to $0.0000037. PEPE’s displayed price is around $0.00000477 in the October 28 chart snapshot, above that zone.
The chart also compares the current setup with an earlier trendline breakout before PEPE’s major 2024 advance. That historical move helps explain Patel’s bullish interpretation, but a similar pattern does not guarantee a similar result.
The earlier rally carries an annotation of approximately 1,858%. The projected move on the right shows roughly 1,504% from its selected starting point near the accumulation zone. That percentage is not the expected return from the displayed price.
Read Also: Hedera Has Real Utility, but That Doesn’t Make HBAR a Buy – Here’s Why
PEPE Price Targets Begin At A Repeated Resistance Level
Crypto Patel’s initial target is $0.00000720. The chart marks previous encounters with this area through circled candles, which makes it an important resistance test rather than an arbitrary target.
A sustained recovery above that barrier would strengthen the case for the subsequent levels.
Chart Level PEPE Price Why It Matters Accumulation Zone $0.0000028 To $0.0000037 The Support Area Behind Patel’s Bullish Setup Target 1 $0.00000720 A Repeated Historical Resistance Area Target 2 $0.00001402 The Next Marked Recovery Objective Target 3 $0.00002677 An Objective Near The Previous Major Peak Target 4 $0.00005900 The Most Ambitious Extension On The Chart Invalidation $0.00000223 The Level Patel Uses To Reject His Setup
The final target would require approximately a 12.4x price multiple from the displayed $0.00000477, equivalent to an increase near 1,137%. It remains a conditional macro objective without a guaranteed completion date.
PEPE Price Must Hold Support Before The Bigger Rally Becomes Credible
The bullish case needs PEPE to preserve the breakout and establish stronger support above the former descending trendline. A successful test of $0.00000720 would then provide a clearer measure of buyer strength.
A return into the accumulation zone would weaken the immediate recovery. A decline below Patel’s $0.00000223 invalidation level would undermine the specific setup.
Subscribe to our YouTube channel for daily crypto updates, market insights, and expert analysis.
The post PEPE Price Pumps, Takes Aim at Shiba Inu and DOGE as Analyst Maps Huge Rally appeared first on CaptainAltcoin.
PEPE Price Pumps, Takes Aim At Shiba Inu and DOGE As Analyst Maps Huge Rally
PEPE’s latest price rebound has brought its rivalry with Shiba Inu and Dogecoin back into focus. Fresh whale transfers and a bullish chart from Crypto Patel give the move several angles worth examining, although the strongest claims still need careful interpretation.
The central question goes beyond whether PEPE can produce another green candle. Its recovery must now prove that buyers can sustain demand after the initial breakout, especially as large wallets become active again.
Crypto Patel’s chart outlines an ambitious route higher. The important details concern the levels PEPE must reclaim and the support that would keep that outlook intact.
PEPE Price Challenges Shiba Inu and DOGE as Volume Claims Grow
PEPESI argues that PEPE has become more competitive against Shiba Inu and DOGE. The account claims PEPE trading volume has frequently reached 9 to 10 times SHIB’s volume and describes a narrower market capitalization gap.
Those claims need a clear distinction between trading activity and market size. Higher volume means more tokens changed hands during a particular period. It does not automatically mean PEPE has overtaken Shiba Inu in valuation or established a durable lead.
$PEPE is officially putting the other memes on notice. While $SHIB , $DOGE and the rest are lagging, the frog is exploding in volume (often 9-10x SHIB) and has closed the market cap gap to a historic low. The dog’s lead is evaporating. Momentum is one sided. $PEPE is rising. The rest are watching. Dont watch $PEPESI ON 11/9/26 — PEPESI (@PEPESI_ONX) October 28, 2026
The supplied post also does not provide matching timestamps or a comparative dataset for its volume figures. Its claim about a historically narrow valuation gap therefore remains an assertion from the account.
Shiba Inu is the direct volume comparison in that post. Dogecoin appears in the broader competitive argument, but the supplied material offers no equivalent DOGE volume comparison.
PEPE could outperform both assets over a particular period without surpassing either in total market capitalization. That distinction matters when assessing whether the latest rebound represents a stronger competitive position.
Dormant PEPE Whales Move $10.19 Million Without Confirmed Sales
BSCN reported that 2 dormant PEPE whale addresses transferred 2.27 trillion tokens worth approximately $10.19 million. The report credited data shared by Lookonchain that originated from Arkham.
Large transfers deserve examination because the destination can help explain their market relevance. Tokens sent to an exchange may become available for sale, although an exchange deposit alone does not prove execution.
Transfers between private wallets can involve custody changes or internal asset management. The report does not establish that these whales sold their holdings.
That leaves several details unresolved:
Exchange deposits would warrant closer examination for potential selling pressure.
Private wallet transfers could involve custody changes without market sales.
Subsequent wallet activity would provide more context than the initial transfers.
The whale movements therefore add uncertainty to the PEPE price recovery. They do not independently confirm either accumulation or distribution.
Jus7Degen Explains Why PEPE Needs Demand Beyond Its Meme Recognition
Jus7Degen places PEPE’s appeal around brand recognition, exchange access and speculative demand. The Ethereum token launched in April 2023 and draws its identity from the widely recognizable Pepe the Frog meme.
The analyst’s October 28 snapshot listed a market capitalization above $1.8 billion, recent daily volume above $300 million and more than 620,000 reported holders. These figures describe the account’s snapshot rather than continuously updated market data.
$PEPE — Pepe ㅤ Everyone is watching $DOGE, $SHIB, and $BONK compete for meme coin dominance. ㅤ But what about an Ethereum meme coin that turned an internet frog into a billion-dollar crypto asset? ㅤ $PEPE is betting that internet culture, community attention, and speculative liquidity can be more powerful than traditional token utility. ㅤ Pepe is an Ethereum-based meme coin launched in April 2023, inspired by the globally recognized Pepe the Frog meme. ㅤ Save this checklist: ㅤ -> Where the demand comes from ㅤ Meme coins run on attention. ㅤ Social media trends. Retail speculation. Community engagement. Exchange liquidity. Crypto market sentiment. ㅤ PEPE turns cultural recognition into a tradable digital asset. ㅤ -> Main narrative ㅤ Meme Coin Dominance. Ethereum Ecosystem. Internet Culture. Community Speculation. Retail Trading. ㅤ -> The real advantage ㅤ Most crypto projects compete through technology. ㅤ PEPE competes through attention and liquidity. ㅤ Ethereum — Established blockchain infrastructure. Major Exchanges — Broad market accessibility. Pepe Meme — Global cultural recognition. Fixed Supply — No scheduled token inflation. Community — Social-driven momentum. ㅤ No complicated technology. No institutional revenue model. No traditional product roadmap. ㅤ Its biggest asset is its brand. ㅤ -> The market adoption angle ㅤ This is where things get interesting. ㅤ As of October 28, 2026: ㅤ $1.8B+ — Market capitalization. $300M+ — Recent daily trading volume. 620K+ — Reported token holders. ㅤ PEPE remains one of the most recognizable Ethereum meme coins. ㅤ Unlike small-cap memes, it already has significant exchange liquidity. ㅤ But high trading volume doesn’t mean sustainable investment demand. ㅤ -> The PEPE tokenomics angle ㅤ Original supply: 420.69 trillion PEPE. ㅤ Reported circulating supply: 413.77T–420.69T, depending on the data provider. ㅤ Initial allocation: ㅤ 93.1% — Liquidity pools. 6.9% — Exchange listings and liquidity reserves. ㅤ No staking emissions. No scheduled VC unlocks. No native protocol revenue. No tokenholder fee sharing. ㅤ And here’s the important distinction. ㅤ PEPE liquidity provider tokens were burned at launch. ㅤ That does not mean 93.1% of the PEPE token supply was burned. ㅤ -> The valuation question ㅤ This is critical. ㅤ At approximately $1.9B in market capitalization: ㅤ 2x — Requires roughly $3.8B market cap. 5x — Requires roughly $9.5B market cap. 10x — Requires roughly $19B market cap. ㅤ These are valuation scenarios, not price predictions. ㅤ PEPE doesn’t need a new technology breakthrough to appreciate. ㅤ It needs stronger demand and sustained market attention. ㅤ -> Bull case ㅤ If meme coin speculation returns, PEPE could benefit. ㅤ More retail participation. More speculative liquidity. More social engagement. More demand for established meme coins. ㅤ Its recognizable brand could remain a competitive advantage. ㅤ -> Bear case ㅤ No fundamental value capture. ㅤ PEPE does not generate protocol revenue. ㅤ Its valuation depends heavily on speculation. ㅤ Large holders can create selling pressure. ㅤ And new meme coins constantly compete for attention. ㅤ -> What to watch ㅤ Spot trading volume. Exchange liquidity. Whale wallet movements. Social media activity. Perpetual futures funding. Meme coin market dominance. ㅤ My view: ㅤ Narrative: 9/10 Utility: 2/10 Adoption: 8/10 Risk: Very High Upside: Speculative High ㅤ Meme culture. Retail liquidity. Market psychology. ㅤ $PEPE is not a bet on revolutionary technology. ㅤ It’s a bet on whether internet culture can continue attracting billions of dollars in speculative capital. ㅤ The brand is already established. ㅤ But without fundamental cash flow, attention and liquidity remain everything. ㅤ Save this for your Meme Coin watchlist. ㅤ Which has more upside: $PEPE, $DOGE, or $BONK? ㅤ Drop your pick below. ㅤ Full research & setups on Telegram ↓ https://t.co/VUDDk1N8SJ
— Jus7Degen (@Jus7Degen) October 28, 2026
Its broader argument is straightforward: PEPE’s valuation depends heavily on whether buyers continue committing capital to its brand.
Jus7Degen also makes a useful distinction about token supply. Burning liquidity provider tokens does not mean 93.1% of PEPE’s token supply disappeared. Those represent different assets and different effects on supply.
The analyst’s valuation examples illustrate the scale of demand required. Starting from a $1.9 billion market capitalization, a 5x valuation would reach approximately $9.5 billion. A 10x valuation would reach about $19 billion, assuming comparable circulating supply.
Read Also: XRP Price Recovery Could Happen Much Faster Than Most Expect!
Market capitalization growth does not equal the exact amount of cash entering an asset. Nevertheless, larger valuations require buyers to sustain higher prices across available liquidity.
Crypto Patel’s PEPE Chart Shows A Breakout Above The Weekly Downtrend
A look at the PEPE chart shows a descending purple trendline across the prolonged decline that followed the late 2024 peak. Recent candles have moved above that line near the green accumulation area.
Crypto Patel interprets this as a confirmed weekly breakout and a successful retest on the higher timeframe. Technically, the argument is that a line which previously restricted rallies may now provide support.
PEPE Price Chart from Crypto Patel
The marked accumulation zone extends from approximately $0.0000028 to $0.0000037. PEPE’s displayed price is around $0.00000477 in the October 28 chart snapshot, above that zone.
The chart also compares the current setup with an earlier trendline breakout before PEPE’s major 2024 advance. That historical move helps explain Patel’s bullish interpretation, but a similar pattern does not guarantee a similar result.
The earlier rally carries an annotation of approximately 1,858%. The projected move on the right shows roughly 1,504% from its selected starting point near the accumulation zone. That percentage is not the expected return from the displayed price.
Read Also: Hedera Has Real Utility, but That Doesn’t Make HBAR a Buy – Here’s Why
PEPE Price Targets Begin At A Repeated Resistance Level
Crypto Patel’s initial target is $0.00000720. The chart marks previous encounters with this area through circled candles, which makes it an important resistance test rather than an arbitrary target.
A sustained recovery above that barrier would strengthen the case for the subsequent levels.
Chart Level PEPE Price Why It Matters Accumulation Zone $0.0000028 To $0.0000037 The Support Area Behind Patel’s Bullish Setup Target 1 $0.00000720 A Repeated Historical Resistance Area Target 2 $0.00001402 The Next Marked Recovery Objective Target 3 $0.00002677 An Objective Near The Previous Major Peak Target 4 $0.00005900 The Most Ambitious Extension On The Chart Invalidation $0.00000223 The Level Patel Uses To Reject His Setup
The final target would require approximately a 12.4x price multiple from the displayed $0.00000477, equivalent to an increase near 1,137%. It remains a conditional macro objective without a guaranteed completion date.
PEPE Price Must Hold Support Before The Bigger Rally Becomes Credible
The bullish case needs PEPE to preserve the breakout and establish stronger support above the former descending trendline. A successful test of $0.00000720 would then provide a clearer measure of buyer strength.
A return into the accumulation zone would weaken the immediate recovery. A decline below Patel’s $0.00000223 invalidation level would undermine the specific setup.
Subscribe to our YouTube channel for daily crypto updates, market insights, and expert analysis.
The post PEPE Price Pumps, Takes Aim at Shiba Inu and DOGE as Analyst Maps Huge Rally appeared first on CaptainAltcoin.
1
864
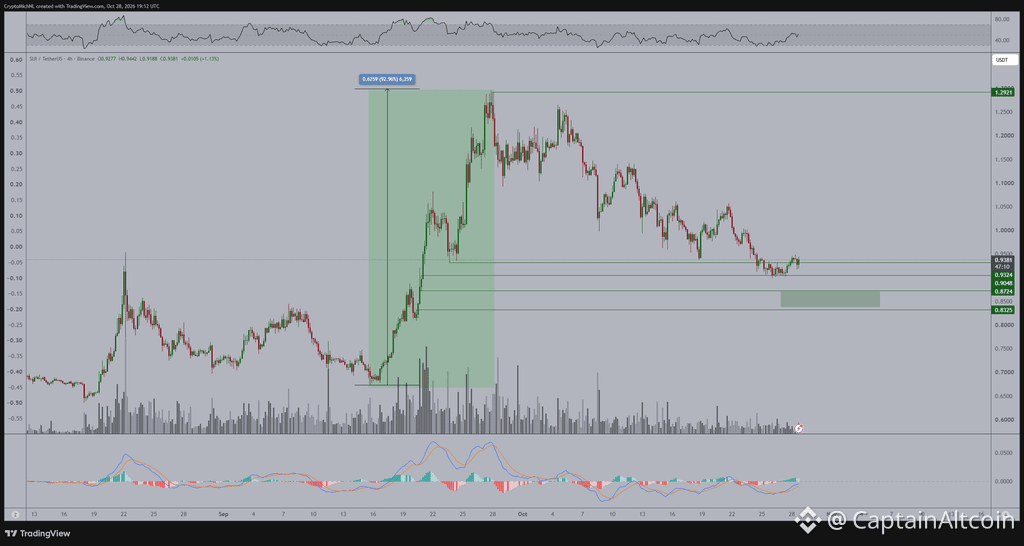
Статья
Altcoin Price Prediction: Analyst Expects 100-200% Run After FOMCMichaël van de Poppe believes the altcoin market could be preparing for another strong post-FOMC move.
His view is based on what happened after the previous Federal Reserve meeting, when several altcoins posted large gains within roughly two weeks.
Van de Poppe points to SUI pumping about 100%, NEAR around 142%, and ZEC roughly 60% during that period.
He believes a similar pattern could develop again.
The analyst argues that crypto moves in waves. After a strong two-week rally, a market-wide correction is normal, and he believes much of that correction may now be close to finishing.
SUI Is His Main Example
The chart he shared focuses on SUI.
SUI previously rallied from roughly $0.67 toward $1.29, a move of around 93%, before entering a prolonged correction.
Price has now returned to the $0.90-$0.94 region.
Van de Poppe marks several nearby support levels around $0.93, $0.90, $0.87 and $0.83, with the current price close to $0.94.
Source: X/@CryptoMichNL
That means SUI is trading close to an area where buyers could potentially step back in if the broader altcoin market improves.
The chart also shows MACD beginning to recover from negative territory, although price still needs to prove that the downtrend has ended.
Could Altcoins Really Rally 100-200%?
Van de Poppe is not saying every altcoin will automatically double after the FOMC meeting.
His point is that the previous post-Fed period produced very large moves, and he believes the current market could follow a similar cycle.
I think the key part of his take is the timing.
Altcoins have already gone through a correction after their previous run. If Bitcoin stabilizes and liquidity begins moving back into smaller assets, some of the strongest altcoins could outperform quickly.
But the setup still depends heavily on Bitcoin.
If BTC remains weak or breaks major support, altcoins are unlikely to deliver clean 100-200% moves.
If Bitcoin stabilizes and the market begins rotating back into risk, however, Van de Poppe’s scenario becomes much more realistic.
For SUI specifically, holding the $0.90 area would be an important first step.
A stronger recovery above $1.00-$1.05 would improve the setup, while a break below the lower support zone around $0.83 would weaken the bullish case.
Van de Poppe’s broader message is simple: the correction may be nearing its end, and the next two weeks could once again produce some of the strongest altcoin moves in the market.
For more crypto news and price predictions, click here.
Subscribe to our YouTube channel for daily crypto updates, market insights, and expert analysis.
The post Altcoin Price Prediction: Analyst Expects 100-200% Run After FOMC appeared first on CaptainAltcoin.
Altcoin Price Prediction: Analyst Expects 100-200% Run After FOMC
Michaël van de Poppe believes the altcoin market could be preparing for another strong post-FOMC move.
His view is based on what happened after the previous Federal Reserve meeting, when several altcoins posted large gains within roughly two weeks.
Van de Poppe points to SUI pumping about 100%, NEAR around 142%, and ZEC roughly 60% during that period.
He believes a similar pattern could develop again.
The analyst argues that crypto moves in waves. After a strong two-week rally, a market-wide correction is normal, and he believes much of that correction may now be close to finishing.
SUI Is His Main Example
The chart he shared focuses on SUI.
SUI previously rallied from roughly $0.67 toward $1.29, a move of around 93%, before entering a prolonged correction.
Price has now returned to the $0.90-$0.94 region.
Van de Poppe marks several nearby support levels around $0.93, $0.90, $0.87 and $0.83, with the current price close to $0.94.
Source: X/@CryptoMichNL
That means SUI is trading close to an area where buyers could potentially step back in if the broader altcoin market improves.
The chart also shows MACD beginning to recover from negative territory, although price still needs to prove that the downtrend has ended.
Could Altcoins Really Rally 100-200%?
Van de Poppe is not saying every altcoin will automatically double after the FOMC meeting.
His point is that the previous post-Fed period produced very large moves, and he believes the current market could follow a similar cycle.
I think the key part of his take is the timing.
Altcoins have already gone through a correction after their previous run. If Bitcoin stabilizes and liquidity begins moving back into smaller assets, some of the strongest altcoins could outperform quickly.
But the setup still depends heavily on Bitcoin.
If BTC remains weak or breaks major support, altcoins are unlikely to deliver clean 100-200% moves.
If Bitcoin stabilizes and the market begins rotating back into risk, however, Van de Poppe’s scenario becomes much more realistic.
For SUI specifically, holding the $0.90 area would be an important first step.
A stronger recovery above $1.00-$1.05 would improve the setup, while a break below the lower support zone around $0.83 would weaken the bullish case.
Van de Poppe’s broader message is simple: the correction may be nearing its end, and the next two weeks could once again produce some of the strongest altcoin moves in the market.
For more crypto news and price predictions, click here.
Subscribe to our YouTube channel for daily crypto updates, market insights, and expert analysis.
The post Altcoin Price Prediction: Analyst Expects 100-200% Run After FOMC appeared first on CaptainAltcoin.
1
793
Частичная правда
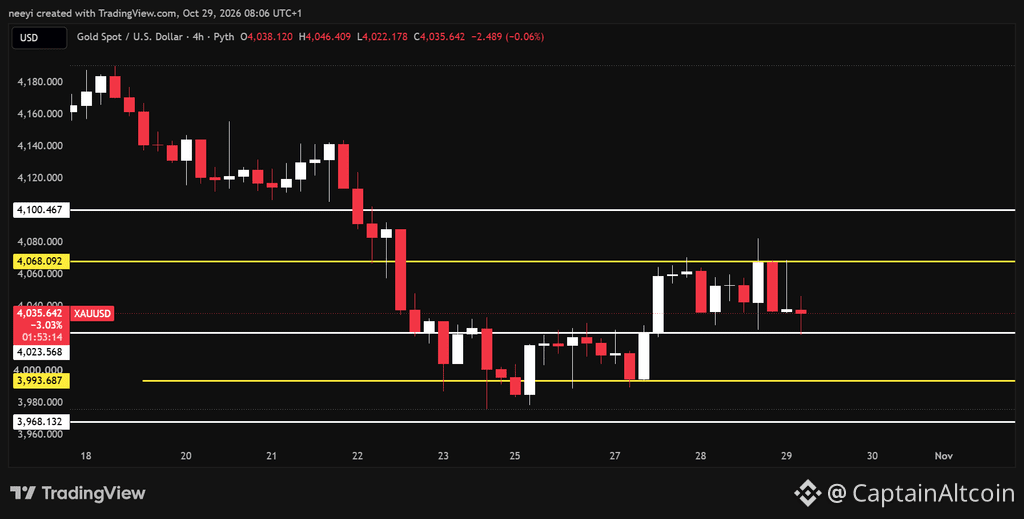
Статья
Gold and Silver Price Predictions for Today (October 29)Gold and silver face different tests today after several sessions of consolidation. Gold remains inside a defined range, but silver is testing whether its recent floor can hold. That difference matters for October 29 price predictions, as the next moves could depend on whether support survives or resistance finally gives way.
The chart levels and indicator readings provide a useful framework for both metals. Gold has a more balanced setup, although sellers retain some control. Silver’s weaker readings make its attempted support break particularly important.
Gold Price Consolidation Keeps $4,023 And $4,068 In Focus
A look at the gold chart shows that price has traded mainly between $4,023 and $4,068 since Tuesday afternoon. Moves toward the upper boundary have met resistance, and declines toward the lower boundary have found support.
Repeated reactions at these levels establish clear boundaries for today’s gold price prediction. Another move inside this range would extend the consolidation without confirming a fresh direction.
XAUUSD Price Chart / TradingView.com
A break below $4,023 could expose $3,990 as the next downside target. Continued selling below that level would bring $3,960 into consideration. A brief dip beneath support would carry less weight than sustained trading below it.
Gold would need to clear $4,068 to improve its immediate outlook. A sustained breakout could open the door toward $4,100 before the session ends, although that target remains conditional on buyers overcoming resistance.
Gold Indicators Show Balanced Momentum And Some Selling Pressure
Gold’s RSI reading of 45.871 is close to the midpoint, although its position below 50 gives sellers a modest advantage. The Stochastic reading of 48.559 also points to relatively balanced momentum, consistent with the recent consolidation.
The negative MACD reading of −9.043 adds a weaker element to that picture. Bull/Bear Power also remains negative at −10.1896, which indicates that sellers retain pressure despite the range holding.
Together, these readings support caution about assuming an upside breakout before price confirms it.
Indicator Value What The Reading Means RSI(14) 45.871 Momentum remains broadly neutral with a slight bearish lean. STOCH(9,6) 48.559 Momentum provides no clear directional advantage. MACD(12,26) −9.043 Negative momentum supports the downside risk. Bull/Bear Power(13) −10.1896 Sellers retain pressure inside the consolidation.
Today’s gold price scenarios follow those boundaries:
Bullish: A sustained break above $4,068 could put $4,100 within reach.
Neutral: Continued support at $4,023 could keep gold between $4,023 and $4,068.
Bearish: A confirmed break below $4,023 could expose $3,990, followed by $3,960.
Silver Price Tests Support As $51 Becomes A Downside Target
Silver price is attempting to break below support near $52.70. Continued trading beneath this level would weaken the recent consolidation and increase the possibility of a decline toward $51.
A further break below $51 could extend the decline. However, the supplied analysis does not establish another specific downside target beyond that point.
XAGUSD Price Chart / TradingView.com
The recovery case depends first on whether the breakdown fails. A return above $52.90 could place silver back inside the area where it has mainly traded since Friday. That would leave $54.60 as the upper boundary to monitor.
A sustained break above $54.60 would strengthen the recovery case and make $56.60 the next upside target.
Read Also: Bitcoin and XRP Price Predictions for Today (October 29)
Silver Indicators Give Sellers A Clearer Advantage
Silver’s RSI of 33.828 shows weaker momentum than gold’s reading. It remains above the commonly used oversold threshold of 30, so the indicator does not establish that selling has reached exhaustion.
The Stochastic reading of 33.699 also leans bearish. Negative MACD and Bull/Bear Power readings reinforce that weakness, which supports the downside scenario if the support break holds.
Indicator Value What The Reading Means RSI(14) 33.828 Momentum is weak but remains above the oversold threshold. STOCH(9,6) 33.699 Momentum continues to favor sellers. MACD(12,26) −0.643 Negative momentum supports the bearish outlook. Bull/Bear Power(13) −1.3555 Selling pressure remains stronger than buying pressure.
Today’s silver price scenarios depend on confirmation:
Bullish: A sustained break above $54.60 could open a recovery toward $56.60.
Neutral: A failed breakdown and recovery above $52.90 could restore the $52.90 to $54.60 range.
Bearish: Continued weakness below $52.70 could expose $51, with further downside possible beneath it.
Subscribe to our YouTube channel for daily crypto updates, market insights, and expert analysis.
The post Gold And Silver Price Predictions For Today (October 29) appeared first on CaptainAltcoin.
Gold and Silver Price Predictions for Today (October 29)
Gold and silver face different tests today after several sessions of consolidation. Gold remains inside a defined range, but silver is testing whether its recent floor can hold. That difference matters for October 29 price predictions, as the next moves could depend on whether support survives or resistance finally gives way.
The chart levels and indicator readings provide a useful framework for both metals. Gold has a more balanced setup, although sellers retain some control. Silver’s weaker readings make its attempted support break particularly important.
Gold Price Consolidation Keeps $4,023 And $4,068 In Focus
A look at the gold chart shows that price has traded mainly between $4,023 and $4,068 since Tuesday afternoon. Moves toward the upper boundary have met resistance, and declines toward the lower boundary have found support.
Repeated reactions at these levels establish clear boundaries for today’s gold price prediction. Another move inside this range would extend the consolidation without confirming a fresh direction.
XAUUSD Price Chart / TradingView.com
A break below $4,023 could expose $3,990 as the next downside target. Continued selling below that level would bring $3,960 into consideration. A brief dip beneath support would carry less weight than sustained trading below it.
Gold would need to clear $4,068 to improve its immediate outlook. A sustained breakout could open the door toward $4,100 before the session ends, although that target remains conditional on buyers overcoming resistance.
Gold Indicators Show Balanced Momentum And Some Selling Pressure
Gold’s RSI reading of 45.871 is close to the midpoint, although its position below 50 gives sellers a modest advantage. The Stochastic reading of 48.559 also points to relatively balanced momentum, consistent with the recent consolidation.
The negative MACD reading of −9.043 adds a weaker element to that picture. Bull/Bear Power also remains negative at −10.1896, which indicates that sellers retain pressure despite the range holding.
Together, these readings support caution about assuming an upside breakout before price confirms it.
Indicator Value What The Reading Means RSI(14) 45.871 Momentum remains broadly neutral with a slight bearish lean. STOCH(9,6) 48.559 Momentum provides no clear directional advantage. MACD(12,26) −9.043 Negative momentum supports the downside risk. Bull/Bear Power(13) −10.1896 Sellers retain pressure inside the consolidation.
Today’s gold price scenarios follow those boundaries:
Bullish: A sustained break above $4,068 could put $4,100 within reach.
Neutral: Continued support at $4,023 could keep gold between $4,023 and $4,068.
Bearish: A confirmed break below $4,023 could expose $3,990, followed by $3,960.
Silver Price Tests Support As $51 Becomes A Downside Target
Silver price is attempting to break below support near $52.70. Continued trading beneath this level would weaken the recent consolidation and increase the possibility of a decline toward $51.
A further break below $51 could extend the decline. However, the supplied analysis does not establish another specific downside target beyond that point.
XAGUSD Price Chart / TradingView.com
The recovery case depends first on whether the breakdown fails. A return above $52.90 could place silver back inside the area where it has mainly traded since Friday. That would leave $54.60 as the upper boundary to monitor.
A sustained break above $54.60 would strengthen the recovery case and make $56.60 the next upside target.
Read Also: Bitcoin and XRP Price Predictions for Today (October 29)
Silver Indicators Give Sellers A Clearer Advantage
Silver’s RSI of 33.828 shows weaker momentum than gold’s reading. It remains above the commonly used oversold threshold of 30, so the indicator does not establish that selling has reached exhaustion.
The Stochastic reading of 33.699 also leans bearish. Negative MACD and Bull/Bear Power readings reinforce that weakness, which supports the downside scenario if the support break holds.
Indicator Value What The Reading Means RSI(14) 33.828 Momentum is weak but remains above the oversold threshold. STOCH(9,6) 33.699 Momentum continues to favor sellers. MACD(12,26) −0.643 Negative momentum supports the bearish outlook. Bull/Bear Power(13) −1.3555 Selling pressure remains stronger than buying pressure.
Today’s silver price scenarios depend on confirmation:
Bullish: A sustained break above $54.60 could open a recovery toward $56.60.
Neutral: A failed breakdown and recovery above $52.90 could restore the $52.90 to $54.60 range.
Bearish: Continued weakness below $52.70 could expose $51, with further downside possible beneath it.
Subscribe to our YouTube channel for daily crypto updates, market insights, and expert analysis.
The post Gold And Silver Price Predictions For Today (October 29) appeared first on CaptainAltcoin.
705
Why Is the Crypto Market Down Today (October 29)?The crypto market is back in the red on October 29, with Bitcoin slipping below $80,000 after the Federal Reserve meeting failed to give risk assets the reassurance traders wanted.
Bitcoin is trading around $79,700-$80,000, down roughly 1% over the past 24 hours. Ethereum has fallen toward $2,300, Solana is back below $100, and XRP is trading near $1.29. ADA has been one of the weaker large-cap altcoins, losing more than 4% over the same period.
The decline is coming from several directions at once.
The Fed kept rates unchanged, but inflation concerns remain alive. Leveraged crypto positions were then flushed out as prices weakened, and another selloff across technology stocks has made investors even less willing to take risk.
The Fed Pause Wasn’t Enough for Crypto
The Federal Reserve left its target rate unchanged at 3.75%-4.00% on Wednesday.
That decision itself was expected.
The problem was everything around it.
The Fed said economic activity continues to expand at a strong pace and inflation remains elevated. Two FOMC members, Lisa Cook and Beth Hammack, actually voted for a 25-basis-point rate increase at this meeting.
Chair Kevin Warsh’s comments reinforced the idea that the Fed is now in wait-and-see mode.
SUMMARY OF FED CHAIR WARSH’S STATEMENT: 1. Fed to eliminate 1 interest rate-setting vote beginning in Fall 2027 2. Fed expects to hold just 6 policy-setting meetings in 2028, down from 8 currently 3. Overwhelming consensus is that the "monetary medicine is starting to work" 4. Warsh says he is "unwilling and unable" to call financial conditions tight 5. Warsh says that inflation remains elevated in the US 6. The Fed awaits more information in determining policy path The Fed is now in "wait and see" mode.
— The Kobeissi Letter (@KobeissiLetter) October 28, 2026
He said the Fed believes its monetary policy is beginning to work, but he also said he is unwilling to describe current financial conditions as tight. At the same time, policymakers still want more information before deciding their next move.
That leaves a December rate increase very much in play.
Reuters reported that markets were still pricing roughly an 80% probability of a December hike following the meeting. Treasury yields moved higher after the decision.
For crypto, this is not the outcome bulls wanted.
A Fed pause is useful, but the market was hoping for stronger evidence that the tightening cycle was close to ending.
Instead, traders got a central bank that still considers inflation too high and has two policymakers already voting to raise rates.
Read also: 3 Altcoins to Watch Before the FOMC Decision (XRP Makes the List!)
Leverage Made the Selloff Worse
The first move lower was then amplified by derivatives positioning.
Total crypto derivatives open interest fell around 7.35% to $318.6 billion as leveraged positions were closed.
Bitcoin long liquidations jumped to roughly $51.96 million, an increase of more than 1,000% from the previous measurement period.
That creates a familiar crypto feedback loop.
Price falls slightly.
Highly leveraged long positions hit their liquidation levels.
Those positions are automatically sold.
That additional selling pushes price lower and triggers another group of liquidations.
Funding rates also fell around 37% to approximately 0.00437%, which shows some of the excess bullish positioning is already being removed.
This is one reason Bitcoin’s move from above $81,000 toward $80,000 happened faster than the original macro catalyst alone would imply.
The Fed created the uncertainty.
Leverage accelerated the move.
Selling Is Spreading Across the Crypto Market
This is also not an isolated Bitcoin correction.
Ethereum is trading near $2,300 and is down around 2%. Solana has dropped to roughly $100, XRP has lost close to 3%, and Cardano has fallen toward $0.20.
Broader crypto categories are declining together.
Layer 1 assets have lost around 0.9%, and digital assets classified as commodities by U.S. regulators have posted a similar decline.
Sentiment is weakening too.
The Fear & Greed Index has slipped from 46 to 44, keeping the market in neutral territory but showing that traders are becoming more cautious.
The Altcoin Season Index has also fallen around 5%.
That fits what we are seeing on the charts.
When traders become defensive, money tends to leave smaller and more speculative tokens first. Bitcoin dominance can then remain elevated even when BTC itself is falling.
The Stock Market Is Adding Another Problem
Crypto is not dealing with the Fed in isolation.
Risk appetite has also taken another hit from the technology sector.
Alphabet shares fell about 10% in after-hours trading after its quarterly report, wiping nearly $400 billion from the company’s market value. Investors focused on weaker advertising results, negative free cash flow and enormous spending on AI infrastructure.
Nasdaq futures subsequently dropped around 1%.
Asian markets followed the weaker tone. South Korea’s KOSPI fell about 2.6%, and broader Asia-Pacific equities outside Japan also moved lower.
That is relevant to Bitcoin because BTC continues to trade like a high-risk macro asset during periods of market stress.
When investors cut exposure to expensive technology and speculative assets, crypto often gets included in the same trade.
The combination today is particularly uncomfortable:
high Treasury yields, uncertainty about another Fed hike, pressure on technology stocks and leveraged crypto traders being forced out.
What Comes Next?
Bitcoin is now testing the $79,000-$80,000 region again.
That area has repeatedly attracted buyers over the past week, so holding it would give BTC another chance to stabilize.
If $79,000 fails, the next larger zone I would watch is around $77,000.
For Ethereum, $2,280-$2,300 is the immediate area to defend, and XRP remains close to support around $1.25-$1.28.
The next important macro test is already approaching.
U.S. inflation data is due today, giving markets another reading on whether the Fed can afford to remain on hold in December.
If inflation comes in hotter than expected, rate-hike expectations could increase again and put more pressure on crypto.
A softer reading would give Bitcoin and altcoins a chance to recover some of the post-FOMC losses.
For now, the crypto market is down because several bearish forces have lined up at once.
The Fed did not provide a clear dovish signal, leverage was too high, sentiment is deteriorating and the technology-stock selloff is reducing appetite for risk.
Bitcoin holding $79,000-$80,000 would calm some of those concerns.
A clean break below it could bring another liquidation wave.
For more crypto news and price predictions, click here.
Subscribe to our YouTube channel for daily crypto updates, market insights, and expert analysis.
The post Why Is the Crypto Market Down Today (October 29)? appeared first on CaptainAltcoin.
Why Is the Crypto Market Down Today (October 29)?
The crypto market is back in the red on October 29, with Bitcoin slipping below $80,000 after the Federal Reserve meeting failed to give risk assets the reassurance traders wanted.
Bitcoin is trading around $79,700-$80,000, down roughly 1% over the past 24 hours. Ethereum has fallen toward $2,300, Solana is back below $100, and XRP is trading near $1.29. ADA has been one of the weaker large-cap altcoins, losing more than 4% over the same period.
The decline is coming from several directions at once.
The Fed kept rates unchanged, but inflation concerns remain alive. Leveraged crypto positions were then flushed out as prices weakened, and another selloff across technology stocks has made investors even less willing to take risk.
The Fed Pause Wasn’t Enough for Crypto
The Federal Reserve left its target rate unchanged at 3.75%-4.00% on Wednesday.
That decision itself was expected.
The problem was everything around it.
The Fed said economic activity continues to expand at a strong pace and inflation remains elevated. Two FOMC members, Lisa Cook and Beth Hammack, actually voted for a 25-basis-point rate increase at this meeting.
Chair Kevin Warsh’s comments reinforced the idea that the Fed is now in wait-and-see mode.
SUMMARY OF FED CHAIR WARSH’S STATEMENT: 1. Fed to eliminate 1 interest rate-setting vote beginning in Fall 2027 2. Fed expects to hold just 6 policy-setting meetings in 2028, down from 8 currently 3. Overwhelming consensus is that the "monetary medicine is starting to work" 4. Warsh says he is "unwilling and unable" to call financial conditions tight 5. Warsh says that inflation remains elevated in the US 6. The Fed awaits more information in determining policy path The Fed is now in "wait and see" mode.
— The Kobeissi Letter (@KobeissiLetter) October 28, 2026
He said the Fed believes its monetary policy is beginning to work, but he also said he is unwilling to describe current financial conditions as tight. At the same time, policymakers still want more information before deciding their next move.
That leaves a December rate increase very much in play.
Reuters reported that markets were still pricing roughly an 80% probability of a December hike following the meeting. Treasury yields moved higher after the decision.
For crypto, this is not the outcome bulls wanted.
A Fed pause is useful, but the market was hoping for stronger evidence that the tightening cycle was close to ending.
Instead, traders got a central bank that still considers inflation too high and has two policymakers already voting to raise rates.
Read also: 3 Altcoins to Watch Before the FOMC Decision (XRP Makes the List!)
Leverage Made the Selloff Worse
The first move lower was then amplified by derivatives positioning.
Total crypto derivatives open interest fell around 7.35% to $318.6 billion as leveraged positions were closed.
Bitcoin long liquidations jumped to roughly $51.96 million, an increase of more than 1,000% from the previous measurement period.
That creates a familiar crypto feedback loop.
Price falls slightly.
Highly leveraged long positions hit their liquidation levels.
Those positions are automatically sold.
That additional selling pushes price lower and triggers another group of liquidations.
Funding rates also fell around 37% to approximately 0.00437%, which shows some of the excess bullish positioning is already being removed.
This is one reason Bitcoin’s move from above $81,000 toward $80,000 happened faster than the original macro catalyst alone would imply.
The Fed created the uncertainty.
Leverage accelerated the move.
Selling Is Spreading Across the Crypto Market
This is also not an isolated Bitcoin correction.
Ethereum is trading near $2,300 and is down around 2%. Solana has dropped to roughly $100, XRP has lost close to 3%, and Cardano has fallen toward $0.20.
Broader crypto categories are declining together.
Layer 1 assets have lost around 0.9%, and digital assets classified as commodities by U.S. regulators have posted a similar decline.
Sentiment is weakening too.
The Fear & Greed Index has slipped from 46 to 44, keeping the market in neutral territory but showing that traders are becoming more cautious.
The Altcoin Season Index has also fallen around 5%.
That fits what we are seeing on the charts.
When traders become defensive, money tends to leave smaller and more speculative tokens first. Bitcoin dominance can then remain elevated even when BTC itself is falling.
The Stock Market Is Adding Another Problem
Crypto is not dealing with the Fed in isolation.
Risk appetite has also taken another hit from the technology sector.
Alphabet shares fell about 10% in after-hours trading after its quarterly report, wiping nearly $400 billion from the company’s market value. Investors focused on weaker advertising results, negative free cash flow and enormous spending on AI infrastructure.
Nasdaq futures subsequently dropped around 1%.
Asian markets followed the weaker tone. South Korea’s KOSPI fell about 2.6%, and broader Asia-Pacific equities outside Japan also moved lower.
That is relevant to Bitcoin because BTC continues to trade like a high-risk macro asset during periods of market stress.
When investors cut exposure to expensive technology and speculative assets, crypto often gets included in the same trade.
The combination today is particularly uncomfortable:
high Treasury yields, uncertainty about another Fed hike, pressure on technology stocks and leveraged crypto traders being forced out.
What Comes Next?
Bitcoin is now testing the $79,000-$80,000 region again.
That area has repeatedly attracted buyers over the past week, so holding it would give BTC another chance to stabilize.
If $79,000 fails, the next larger zone I would watch is around $77,000.
For Ethereum, $2,280-$2,300 is the immediate area to defend, and XRP remains close to support around $1.25-$1.28.
The next important macro test is already approaching.
U.S. inflation data is due today, giving markets another reading on whether the Fed can afford to remain on hold in December.
If inflation comes in hotter than expected, rate-hike expectations could increase again and put more pressure on crypto.
A softer reading would give Bitcoin and altcoins a chance to recover some of the post-FOMC losses.
For now, the crypto market is down because several bearish forces have lined up at once.
The Fed did not provide a clear dovish signal, leverage was too high, sentiment is deteriorating and the technology-stock selloff is reducing appetite for risk.
Bitcoin holding $79,000-$80,000 would calm some of those concerns.
A clean break below it could bring another liquidation wave.
For more crypto news and price predictions, click here.
Subscribe to our YouTube channel for daily crypto updates, market insights, and expert analysis.
The post Why Is the Crypto Market Down Today (October 29)? appeared first on CaptainAltcoin.
1
2
371
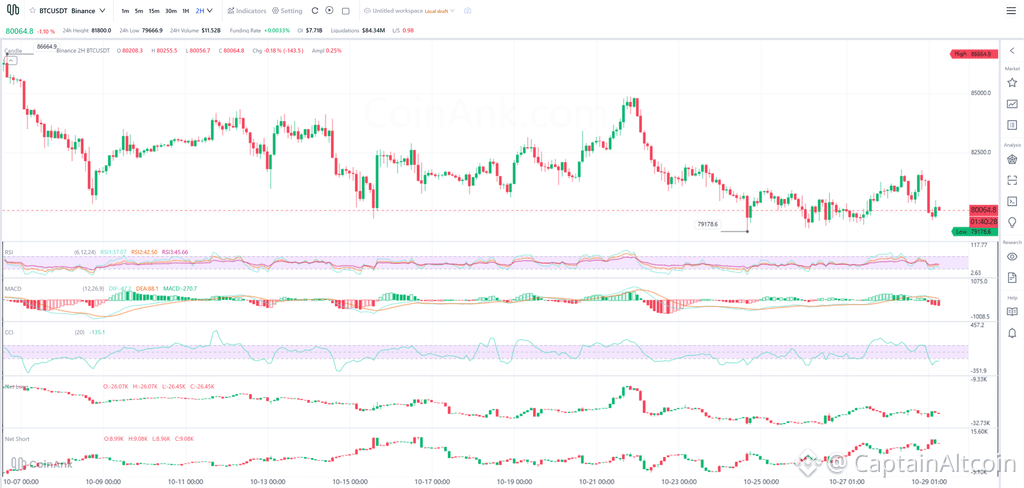
Статья
Bitcoin and XRP Price Predictions for Today (October 29)Bitcoin and XRP are both under pressure this morning after the Federal Reserve left interest rates unchanged on Wednesday.
BTC is trading around $80,000 after briefly pushing above $81,000 following the FOMC decision. XRP is near $1.29 after another rejection from the $1.33-$1.34 area.
The Fed kept its benchmark rate at 3.75%-4.00%, but the decision was not entirely comfortable for risk assets. Two policymakers voted for an immediate rate hike, inflation was still described as elevated, and markets continue to price a high probability of another increase in December.
Crypto also woke up to a weaker risk backdrop.
Alphabet shares dropped around 10% in after-hours trading after investors reacted negatively to heavy AI spending and negative cash flow, wiping roughly $400 billion from its market value. Nasdaq futures fell more than 1%, adding pressure to speculative assets.
That leaves Bitcoin and XRP sitting near support rather than celebrating the Fed pause.
Bitcoin Price Prediction for Today
Bitcoin is trading around $80,065 on the two-hour Binance chart, down roughly 1.1% over 24 hours.
The latest session range is approximately $79,667 to $81,800.
The chart itself is weak.
Bitcoin attempted to recover toward $81,500-$82,000 but was rejected again, and price has returned almost directly to the support area around $80,000.
Momentum indicators confirm that sellers still have control.
The short-term RSI has fallen to roughly 37, with the medium and longer readings around 42 and 46. That is weak without yet being deeply oversold.
MACD has also turned negative again, with the histogram expanding below zero.
Source: CoinAnk
CCI is around -135, showing that the latest move has pushed BTC into an oversold short-term zone.
That creates an interesting setup because momentum is weak, but price is once again testing the same region where buyers have stepped in several times.
The most important support is $79,500-$80,000.
Bitcoin already printed a recent low around $79,179, so I would treat the entire $79,000-$80,000 region as one larger support area rather than one exact price.
If BTC holds there, the first recovery target is around $81,500-$82,000.
A stronger move would then bring $82,500-$83,000 back into play.
The chart does not become convincingly bullish until Bitcoin starts reclaiming the $84,000-$85,000 region.
If $79,000 fails, however, I would expect traders to look toward $77,000-$78,000 next.
My base case for today is consolidation between roughly $79,000 and $82,000, with a slight bearish bias unless BTC can recover above $81,500.
Bitcoin Levels to Watch
Scenario BTC Price Immediate support $79,500-$80,000 Deeper support $77,000-$78,000 First resistance $81,500-$82,000 Stronger resistance $82,500-$83,000 Bullish confirmation $84,000-$85,000
XRP Price Prediction for Today
XRP price looks even weaker than Bitcoin on the two-hour chart.
The token is trading near $1.295, down around 2.5% over 24 hours, with a daily low near $1.286.
The first thing I notice is that XRP failed to hold its latest recovery above $1.33.
The XRP price pushed toward $1.34 yesterday but was rejected quickly and has now returned almost entirely to the $1.29 area.
That leaves XRP dangerously close to the same support zone that produced the recent low around $1.2535.
Momentum indicators are also bearish.
Short-term RSI is around 34, the medium reading is close to 40, and the longer RSI is around 45.
MACD is negative again, and CCI has fallen toward -154.
That tells me XRP is reaching oversold territory on the shorter timeframe, but there is still no confirmed reversal.
Source: CoinAnk
The first support is around $1.28-$1.29.
Below there, $1.25 is far more important.
That $1.25 region has now appeared repeatedly in recent analyst setups as the area XRP needs to defend.
If it holds again, I would expect another attempt toward $1.31-$1.32, followed by $1.34.
A break above $1.34 would improve the short-term structure and expose $1.38-$1.40.
If $1.25 fails, however, XRP loses its recent range support and could move toward $1.20-$1.22.
For today, I would give XRP a slightly wider base range of $1.25-$1.34.
The chart is oversold enough for a bounce, but buyers still need to prove they can turn that bounce into something sustainable.
Read also: XRP Community Member Connects Ripple’s Bank Approval to a Much Bigger Strategy
XRP Levels to Watch
Scenario XRP Price Immediate support $1.28-$1.29 Main support $1.25 Bearish extension $1.20-$1.22 First resistance $1.31-$1.32 Stronger resistance $1.34 Bullish extension $1.38-$1.40
One More Big Test for Crypto Today
The FOMC decision may be behind us, but October 29 is hardly a quiet macro day.
The biggest event I would watch is U.S. inflation and growth data.
September PCE inflation, the Fed’s preferred inflation gauge, is due today alongside third-quarter GDP. Economists expect core PCE to rise around 0.3% month over month, while U.S. GDP is forecast to have expanded at roughly a 3.2% annualized pace.
Those numbers could immediately change expectations for the December Fed meeting.
Hotter inflation combined with strong GDP would make another rate hike easier to justify, which would probably be negative for Bitcoin and XRP.
Softer inflation would give crypto some room to recover, especially after the Fed decided not to raise rates yesterday.
There is also another risk coming from stocks.
Amazon and Intel report earnings later today, after Alphabet’s results already hit Nasdaq futures. If the technology selloff deepens, crypto could again trade as part of the broader risk-off move.
So my view for October 29 is fairly simple.
Bitcoin needs to keep $79,000-$80,000 intact.
XRP needs to defend $1.25-$1.28.
If both supports survive today’s U.S. data and the weak tech backdrop, there is room for a relief move.
If they fail, the post-FOMC decline probably has another leg left.
For more crypto news and price predictions, click here.
Subscribe to our YouTube channel for daily crypto updates, market insights, and expert analysis.
The post Bitcoin and XRP Price Predictions for Today (October 29) appeared first on CaptainAltcoin.
Bitcoin and XRP Price Predictions for Today (October 29)
Bitcoin and XRP are both under pressure this morning after the Federal Reserve left interest rates unchanged on Wednesday.
BTC is trading around $80,000 after briefly pushing above $81,000 following the FOMC decision. XRP is near $1.29 after another rejection from the $1.33-$1.34 area.
The Fed kept its benchmark rate at 3.75%-4.00%, but the decision was not entirely comfortable for risk assets. Two policymakers voted for an immediate rate hike, inflation was still described as elevated, and markets continue to price a high probability of another increase in December.
Crypto also woke up to a weaker risk backdrop.
Alphabet shares dropped around 10% in after-hours trading after investors reacted negatively to heavy AI spending and negative cash flow, wiping roughly $400 billion from its market value. Nasdaq futures fell more than 1%, adding pressure to speculative assets.
That leaves Bitcoin and XRP sitting near support rather than celebrating the Fed pause.
Bitcoin Price Prediction for Today
Bitcoin is trading around $80,065 on the two-hour Binance chart, down roughly 1.1% over 24 hours.
The latest session range is approximately $79,667 to $81,800.
The chart itself is weak.
Bitcoin attempted to recover toward $81,500-$82,000 but was rejected again, and price has returned almost directly to the support area around $80,000.
Momentum indicators confirm that sellers still have control.
The short-term RSI has fallen to roughly 37, with the medium and longer readings around 42 and 46. That is weak without yet being deeply oversold.
MACD has also turned negative again, with the histogram expanding below zero.
Source: CoinAnk
CCI is around -135, showing that the latest move has pushed BTC into an oversold short-term zone.
That creates an interesting setup because momentum is weak, but price is once again testing the same region where buyers have stepped in several times.
The most important support is $79,500-$80,000.
Bitcoin already printed a recent low around $79,179, so I would treat the entire $79,000-$80,000 region as one larger support area rather than one exact price.
If BTC holds there, the first recovery target is around $81,500-$82,000.
A stronger move would then bring $82,500-$83,000 back into play.
The chart does not become convincingly bullish until Bitcoin starts reclaiming the $84,000-$85,000 region.
If $79,000 fails, however, I would expect traders to look toward $77,000-$78,000 next.
My base case for today is consolidation between roughly $79,000 and $82,000, with a slight bearish bias unless BTC can recover above $81,500.
Bitcoin Levels to Watch
Scenario BTC Price Immediate support $79,500-$80,000 Deeper support $77,000-$78,000 First resistance $81,500-$82,000 Stronger resistance $82,500-$83,000 Bullish confirmation $84,000-$85,000
XRP Price Prediction for Today
XRP price looks even weaker than Bitcoin on the two-hour chart.
The token is trading near $1.295, down around 2.5% over 24 hours, with a daily low near $1.286.
The first thing I notice is that XRP failed to hold its latest recovery above $1.33.
The XRP price pushed toward $1.34 yesterday but was rejected quickly and has now returned almost entirely to the $1.29 area.
That leaves XRP dangerously close to the same support zone that produced the recent low around $1.2535.
Momentum indicators are also bearish.
Short-term RSI is around 34, the medium reading is close to 40, and the longer RSI is around 45.
MACD is negative again, and CCI has fallen toward -154.
That tells me XRP is reaching oversold territory on the shorter timeframe, but there is still no confirmed reversal.
Source: CoinAnk
The first support is around $1.28-$1.29.
Below there, $1.25 is far more important.
That $1.25 region has now appeared repeatedly in recent analyst setups as the area XRP needs to defend.
If it holds again, I would expect another attempt toward $1.31-$1.32, followed by $1.34.
A break above $1.34 would improve the short-term structure and expose $1.38-$1.40.
If $1.25 fails, however, XRP loses its recent range support and could move toward $1.20-$1.22.
For today, I would give XRP a slightly wider base range of $1.25-$1.34.
The chart is oversold enough for a bounce, but buyers still need to prove they can turn that bounce into something sustainable.
Read also: XRP Community Member Connects Ripple’s Bank Approval to a Much Bigger Strategy
XRP Levels to Watch
Scenario XRP Price Immediate support $1.28-$1.29 Main support $1.25 Bearish extension $1.20-$1.22 First resistance $1.31-$1.32 Stronger resistance $1.34 Bullish extension $1.38-$1.40
One More Big Test for Crypto Today
The FOMC decision may be behind us, but October 29 is hardly a quiet macro day.
The biggest event I would watch is U.S. inflation and growth data.
September PCE inflation, the Fed’s preferred inflation gauge, is due today alongside third-quarter GDP. Economists expect core PCE to rise around 0.3% month over month, while U.S. GDP is forecast to have expanded at roughly a 3.2% annualized pace.
Those numbers could immediately change expectations for the December Fed meeting.
Hotter inflation combined with strong GDP would make another rate hike easier to justify, which would probably be negative for Bitcoin and XRP.
Softer inflation would give crypto some room to recover, especially after the Fed decided not to raise rates yesterday.
There is also another risk coming from stocks.
Amazon and Intel report earnings later today, after Alphabet’s results already hit Nasdaq futures. If the technology selloff deepens, crypto could again trade as part of the broader risk-off move.
So my view for October 29 is fairly simple.
Bitcoin needs to keep $79,000-$80,000 intact.
XRP needs to defend $1.25-$1.28.
If both supports survive today’s U.S. data and the weak tech backdrop, there is room for a relief move.
If they fail, the post-FOMC decline probably has another leg left.
For more crypto news and price predictions, click here.
Subscribe to our YouTube channel for daily crypto updates, market insights, and expert analysis.
The post Bitcoin and XRP Price Predictions for Today (October 29) appeared first on CaptainAltcoin.
1
896
Pepe Price Prediction: $48.76M Poloniex Transfers Put PEPE Whales in Focus As MEMASA Draws AttentionPEPE holders now have a reason to watch the wallets as closely as the chart. Two transfers out of Poloniex, reportedly worth about $48.76 million, have landed in wallets linked to Justin Sun this month.
The open question is whether those tokens get sold or held, and the answer could shape any Pepe price prediction into year-end. Meanwhile, the frog-themed meme coin trades just below the $0.000005 ceiling it has repeatedly failed to clear.
Traders who track whale moves like this also keep an eye on early-stage projects. One of them is MEMASA ($MEMASA), an upcoming AI crypto trading app that lets users research and trade through a simple chat.
Sun-Linked Wallets Put a New Twist on the Pepe Price Prediction
Blockchain trackers have flagged a cluster of large PEPE movements tied to wallets linked to Justin Sun.
Arkham data, reported by Wu Blockchain, shows these wallets now hold roughly $51 million in PEPE.
That stake equals nearly 3% of the token’s total supply, a share big enough to sway the market.
Much of it arrived recently, as two Poloniex transfers reportedly brought in close to $49 million.
Before that, Sun-labeled wallets had sent about $77 million in stablecoins to the same exchange, a CoinPedia analysis notes.
Nobody knows yet whether those tokens will be sold or stacked further, so traders now read every wallet move as a signal.
Resistance at $0.000005 Remains the Line to Beat
PEPE trades near $0.0000048, up about 4% over the past day as buyers keep pressing higher.
The token has climbed along a rising trendline since its summer low, with nearest strong support near $0.0000032 and resistance around $0.0000054.
For any near-term Pepe price prediction, a clean break above $0.000005 matters most, and technical indicators lean strongly bullish.
A sustained move higher could open room toward the yearly high, while a break of support would point back toward the summer low.
Plain Questions and Faster Answers Shape MEMASA’s Trading App
MEMASA is an upcoming AI-powered crypto app that lets people research, buy, and sell cryptocurrencies through a conversation with an AI assistant. It aims to replace guesswork with clear, data-based explanations.
Users won’t need to study complicated charts, follow hundreds of tokens, or jump between trading platforms. They can simply type their questions in everyday language.
Ask “Will the Sun-linked PEPE wallets push the price past $0.000005?” and MEMASA will review market indicators, trading activity, and sentiment to explain what the available data suggests.
The app addresses common on-chain pain points such as chart overload, constant noise, scam tokens, and endless app switching. It brings market analysis, risk checks, and execution into one AI-powered chat, giving it a real shot at reaching a wide audience of newcomers and seasoned traders alike.
MEMASA is preparing for launch, and anyone interested can sign up for a waitlist for early access to the app.
Reserve Your Spot on the MEMASA Waitlist
Pepe Price Prediction vs. $MEMASA’s Utility-Driven Model
PEPE is a meme coin whose moves often hinge on community buzz and large holders. $MEMASA is a utility token designed to power the MEMASA trading ecosystem, so its role links directly to how people use the app. Planned functions include:
Premium AI intelligence: Access to deeper market analysis and trading insights.
Trading fee discounts: Lower fees on eligible platform activity.
Analyst and agent staking: Analysts and AI agents stake $MEMASA to list their strategies and signals.
Marketplace payments: Settlement for intelligence services and trading strategies.
Curation and contributor rewards: Incentives for users who share useful signals and help curate the ecosystem.
A Capped Supply and a Tiered Early Sale
$MEMASA comes with a fixed token supply, backed by long-term team vesting and transparent unlock schedules.
The project runs an on-chain early sale that gives participants access to $MEMASA before wider market availability, with tokens priced below the anticipated market price. Earlier stages carry lower prices, while later stages offer faster unlocks.
Claim $MEMASA in the Early On-Chain Sale
The Road Ahead for PEPE and MEMASA
PEPE’s next chapter depends on two things: whether it can finally clear the $0.000005 ceiling, and what Sun-linked wallets do with their fresh holdings.
A decisive breakout could bring higher resistance zones into view, while a slip below support would put the summer low back on the radar.
MEMASA faces its own test, as it must turn an AI trading idea into an app people rely on every day. If adoption grows, demand for a token now priced at $0.0155 could grow with it. Both outcomes remain uncertain, and higher potential comes with higher risk.
DISCLAIMER: CAPTAINALTCOIN DOES NOT ENDORSE INVESTING IN ANY PROJECT (CRYPTO OR CASINO) MENTIONED IN SPONSORED ARTICLES. EXERCISE CAUTION AND DO THOROUGH RESEARCH BEFORE INVESTING YOUR MONEY. CaptainAltcoin takes no responsibility for its accuracy or quality. This content was not written by CaptainAltcoin’s team. We strongly advise readers to do their own thorough research before interacting with any featured companies. The information provided is not financial or legal advice. Neither CaptainAltcoin nor any third party recommends buying or selling any financial products. Investing in crypto assets is high-risk; consider the potential for loss. Any investment decisions made based on this content are at the sole risk of the readCaptainAltcoin is not liable for any damages or losses from using or relying on this content.
The post Pepe Price Prediction: $48.76M Poloniex Transfers Put PEPE Whales in Focus as MEMASA Draws Attention appeared first on CaptainAltcoin.
Pepe Price Prediction: $48.76M Poloniex Transfers Put PEPE Whales in Focus As MEMASA Draws Attention
PEPE holders now have a reason to watch the wallets as closely as the chart. Two transfers out of Poloniex, reportedly worth about $48.76 million, have landed in wallets linked to Justin Sun this month.
The open question is whether those tokens get sold or held, and the answer could shape any Pepe price prediction into year-end. Meanwhile, the frog-themed meme coin trades just below the $0.000005 ceiling it has repeatedly failed to clear.
Traders who track whale moves like this also keep an eye on early-stage projects. One of them is MEMASA ($MEMASA), an upcoming AI crypto trading app that lets users research and trade through a simple chat.
Sun-Linked Wallets Put a New Twist on the Pepe Price Prediction
Blockchain trackers have flagged a cluster of large PEPE movements tied to wallets linked to Justin Sun.
Arkham data, reported by Wu Blockchain, shows these wallets now hold roughly $51 million in PEPE.
That stake equals nearly 3% of the token’s total supply, a share big enough to sway the market.
Much of it arrived recently, as two Poloniex transfers reportedly brought in close to $49 million.
Before that, Sun-labeled wallets had sent about $77 million in stablecoins to the same exchange, a CoinPedia analysis notes.
Nobody knows yet whether those tokens will be sold or stacked further, so traders now read every wallet move as a signal.
Resistance at $0.000005 Remains the Line to Beat
PEPE trades near $0.0000048, up about 4% over the past day as buyers keep pressing higher.
The token has climbed along a rising trendline since its summer low, with nearest strong support near $0.0000032 and resistance around $0.0000054.
For any near-term Pepe price prediction, a clean break above $0.000005 matters most, and technical indicators lean strongly bullish.
A sustained move higher could open room toward the yearly high, while a break of support would point back toward the summer low.
Plain Questions and Faster Answers Shape MEMASA’s Trading App
MEMASA is an upcoming AI-powered crypto app that lets people research, buy, and sell cryptocurrencies through a conversation with an AI assistant. It aims to replace guesswork with clear, data-based explanations.
Users won’t need to study complicated charts, follow hundreds of tokens, or jump between trading platforms. They can simply type their questions in everyday language.
Ask “Will the Sun-linked PEPE wallets push the price past $0.000005?” and MEMASA will review market indicators, trading activity, and sentiment to explain what the available data suggests.
The app addresses common on-chain pain points such as chart overload, constant noise, scam tokens, and endless app switching. It brings market analysis, risk checks, and execution into one AI-powered chat, giving it a real shot at reaching a wide audience of newcomers and seasoned traders alike.
MEMASA is preparing for launch, and anyone interested can sign up for a waitlist for early access to the app.
Reserve Your Spot on the MEMASA Waitlist
Pepe Price Prediction vs. $MEMASA’s Utility-Driven Model
PEPE is a meme coin whose moves often hinge on community buzz and large holders. $MEMASA is a utility token designed to power the MEMASA trading ecosystem, so its role links directly to how people use the app. Planned functions include:
Premium AI intelligence: Access to deeper market analysis and trading insights.
Trading fee discounts: Lower fees on eligible platform activity.
Analyst and agent staking: Analysts and AI agents stake $MEMASA to list their strategies and signals.
Marketplace payments: Settlement for intelligence services and trading strategies.
Curation and contributor rewards: Incentives for users who share useful signals and help curate the ecosystem.
A Capped Supply and a Tiered Early Sale
$MEMASA comes with a fixed token supply, backed by long-term team vesting and transparent unlock schedules.
The project runs an on-chain early sale that gives participants access to $MEMASA before wider market availability, with tokens priced below the anticipated market price. Earlier stages carry lower prices, while later stages offer faster unlocks.
Claim $MEMASA in the Early On-Chain Sale
The Road Ahead for PEPE and MEMASA
PEPE’s next chapter depends on two things: whether it can finally clear the $0.000005 ceiling, and what Sun-linked wallets do with their fresh holdings.
A decisive breakout could bring higher resistance zones into view, while a slip below support would put the summer low back on the radar.
MEMASA faces its own test, as it must turn an AI trading idea into an app people rely on every day. If adoption grows, demand for a token now priced at $0.0155 could grow with it. Both outcomes remain uncertain, and higher potential comes with higher risk.
DISCLAIMER: CAPTAINALTCOIN DOES NOT ENDORSE INVESTING IN ANY PROJECT (CRYPTO OR CASINO) MENTIONED IN SPONSORED ARTICLES. EXERCISE CAUTION AND DO THOROUGH RESEARCH BEFORE INVESTING YOUR MONEY. CaptainAltcoin takes no responsibility for its accuracy or quality. This content was not written by CaptainAltcoin’s team. We strongly advise readers to do their own thorough research before interacting with any featured companies. The information provided is not financial or legal advice. Neither CaptainAltcoin nor any third party recommends buying or selling any financial products. Investing in crypto assets is high-risk; consider the potential for loss. Any investment decisions made based on this content are at the sole risk of the readCaptainAltcoin is not liable for any damages or losses from using or relying on this content.
The post Pepe Price Prediction: $48.76M Poloniex Transfers Put PEPE Whales in Focus as MEMASA Draws Attention appeared first on CaptainAltcoin.
1
398
The Anatomy of a Crypto Press Release That Earns TrustCrypto moves fast, and so does crypto news. Every day, hundreds of projects announce launches, listings, partnerships and funding rounds. Most readers give each one a few seconds before deciding whether to keep reading or move on.
In those few seconds, a crypto press release has one real job: to be believed. Getting published is the easy part. Earning the reader’s trust is what turns an announcement into attention, community growth and, eventually, users.
After working with many crypto projects on their announcements, I’ve noticed that the releases that perform well share the same anatomy. Here’s what it looks like, part by part.
1. A headline that states the news
The strongest headlines read like news, not like a slogan. Compare these two:
“The Future of DeFi Is Here”
“Acme Protocol Launches Lending Pools on Arbitrum With $2M in Initial Liquidity”
The first one could describe any project. The second tells the reader who did what, where, and how much, all before they click. Editors prefer it too, because it is easy to file, index and share.
A simple test: if your headline still makes sense after you swap in a competitor’s name, it isn’t specific enough.
2. A first paragraph that answers the basics
Journalists have used the inverted pyramid for more than a century: the most important facts come first, and the details follow. It works just as well for crypto announcements.
By the end of the first paragraph, a reader should know:
Who is making the announcement
What is happening
When it happens or happened
Where (which chain, exchange or market)
Why it matters to the reader
The backstory, the vision and the team’s journey can come later. A reader who gets the facts up front is far more likely to stay for the rest.
3. Facts readers can check for themselves
In crypto, trust comes from verification. The best releases give readers everything they need to check the claims on their own.
That usually means:
The contract address, ideally with verified source code on a block explorer, so anyone can read what the contract actually does
A link to the audit report itself, not just the word “audited”
Concrete numbers: total supply, how tokens are allocated, sale dates and prices
Links to documentation, a whitepaper or a GitHub repository
Even verified, audited code can have bugs. But a project that makes its facts easy to check is signaling that it has nothing to hide, and readers notice.
4. Real names and measured language
“A major partnership with a leading exchange” tells the reader nothing. “A partnership with Kraken, starting with a USDT trading pair on March 3” tells them everything. Name the partners, the investors and the people behind the project. Add a quote from a real person with a real title.
Tone matters just as much. Words like “guaranteed,” “risk-free” and “the next 100x” are red flags for experienced readers, and many outlets won’t publish them at all. Regulators are paying attention too. The UK’s Financial Conduct Authority, for example, requires crypto promotions to be clear, fair and not misleading, with proper risk warnings.
Confident is good. Calm and specific is better. Let the facts do the selling.
5. The right audience, and a way to reach you
Even a perfect release loses impact on the wrong website. An exchange listing belongs where traders read. A funding round lands better on finance and business outlets, where investors and partners look. Projects that choose their press release outlets individually for each announcement give their news the best chance of reaching the people it is meant for.
Finally, close with a short “About” section and a real contact: a website, official social channels and a press email. It sounds minor, but a release with no way to reach the team quietly raises doubts.
The takeaway
A trustworthy crypto press release isn’t complicated. It states the news plainly, puts the key facts first, makes every claim checkable, names real people, and reaches the right audience.
None of this requires a bigger budget. It requires clarity. In a market full of noise, the clearest announcement is often the one people remember.
The post The Anatomy of a Crypto Press Release That Earns Trust appeared first on CaptainAltcoin.
The Anatomy of a Crypto Press Release That Earns Trust
Crypto moves fast, and so does crypto news. Every day, hundreds of projects announce launches, listings, partnerships and funding rounds. Most readers give each one a few seconds before deciding whether to keep reading or move on.
In those few seconds, a crypto press release has one real job: to be believed. Getting published is the easy part. Earning the reader’s trust is what turns an announcement into attention, community growth and, eventually, users.
After working with many crypto projects on their announcements, I’ve noticed that the releases that perform well share the same anatomy. Here’s what it looks like, part by part.
1. A headline that states the news
The strongest headlines read like news, not like a slogan. Compare these two:
“The Future of DeFi Is Here”
“Acme Protocol Launches Lending Pools on Arbitrum With $2M in Initial Liquidity”
The first one could describe any project. The second tells the reader who did what, where, and how much, all before they click. Editors prefer it too, because it is easy to file, index and share.
A simple test: if your headline still makes sense after you swap in a competitor’s name, it isn’t specific enough.
2. A first paragraph that answers the basics
Journalists have used the inverted pyramid for more than a century: the most important facts come first, and the details follow. It works just as well for crypto announcements.
By the end of the first paragraph, a reader should know:
Who is making the announcement
What is happening
When it happens or happened
Where (which chain, exchange or market)
Why it matters to the reader
The backstory, the vision and the team’s journey can come later. A reader who gets the facts up front is far more likely to stay for the rest.
3. Facts readers can check for themselves
In crypto, trust comes from verification. The best releases give readers everything they need to check the claims on their own.
That usually means:
The contract address, ideally with verified source code on a block explorer, so anyone can read what the contract actually does
A link to the audit report itself, not just the word “audited”
Concrete numbers: total supply, how tokens are allocated, sale dates and prices
Links to documentation, a whitepaper or a GitHub repository
Even verified, audited code can have bugs. But a project that makes its facts easy to check is signaling that it has nothing to hide, and readers notice.
4. Real names and measured language
“A major partnership with a leading exchange” tells the reader nothing. “A partnership with Kraken, starting with a USDT trading pair on March 3” tells them everything. Name the partners, the investors and the people behind the project. Add a quote from a real person with a real title.
Tone matters just as much. Words like “guaranteed,” “risk-free” and “the next 100x” are red flags for experienced readers, and many outlets won’t publish them at all. Regulators are paying attention too. The UK’s Financial Conduct Authority, for example, requires crypto promotions to be clear, fair and not misleading, with proper risk warnings.
Confident is good. Calm and specific is better. Let the facts do the selling.
5. The right audience, and a way to reach you
Even a perfect release loses impact on the wrong website. An exchange listing belongs where traders read. A funding round lands better on finance and business outlets, where investors and partners look. Projects that choose their press release outlets individually for each announcement give their news the best chance of reaching the people it is meant for.
Finally, close with a short “About” section and a real contact: a website, official social channels and a press email. It sounds minor, but a release with no way to reach the team quietly raises doubts.
The takeaway
A trustworthy crypto press release isn’t complicated. It states the news plainly, puts the key facts first, makes every claim checkable, names real people, and reaches the right audience.
None of this requires a bigger budget. It requires clarity. In a market full of noise, the clearest announcement is often the one people remember.
The post The Anatomy of a Crypto Press Release That Earns Trust appeared first on CaptainAltcoin.
135
Войдите, чтобы посмотреть больше материала
Присоединяйтесь к пользователям криптовалют по всему миру на Binance Square
⚡️ Получайте новейшую и полезную информацию о криптоактивах.
💬 Нам доверяет крупнейшая в мире криптобиржа.
👍 Получите достоверные аналитические данные от верифицированных создателей контента.
Эл. почта/номер телефона