

阿尔法灰
8.2k Публикации

阿尔法灰
Отправить жалобу
Заблокировать пользователя
先人一步,做 Alpha 🔥 Join me on X @Alpha_Grey8
Открытая сделка
Случайный трейдер
4.2 г
775 подписок(и/а)
10.3K+ подписчиков(а)
3.7K+ понравилось
Посты
Портфель
Все
Цитирования
Активно
·
--
Bitcoin Is Quiet. The Calendar Isn't.
As of Wednesday, October 28, 2026.
Bitcoin has sat between roughly $79,000 and $82,000 this week. K33 says its 30-day price swings are among the quietest 2% of this decade.
I keep staring at that, because the next three days are packed:
- Today:the Fed held rates.
- Thursday: September PCE inflation (analysts expect about 3.6%), plus Strategy and Coinbase earnings.
- Friday, 08:00 UTC (4 a.m. ET): about $11 billion in Bitcoin options expire on Deribit.
That expiry is the part I'd watch. It's roughly 135,000 BTC, about a third of all Bitcoin options open interest on Deribit. There are about two calls for every put, and "max pain" sits at $78,000, a few percent below the price. Max pain is a bookkeeping number, not a forecast.
One more detail: the busiest contract in the past day was a $65,000 put, about 20% below the price. That can be a hedge, a bet, or something else. It doesn't mean traders expect a crash. It does mean someone wanted that protection.
K33 says quiet stretches like this rarely last, so bigger moves look likely soon. They didn't say which way, and I won't guess.
Here's what would change my mind. If Bitcoin is still inside $79,000 to $82,000 after Friday's expiry, I'd stop calling this calm before a storm. It would just be quiet. If it breaks out before then, the storm arrived early.
$BTC

244
·
--
Проверено
The Fed Held Rates. The Tone Didn't Soften.
The Fed kept rates at 3.75% to 4.00% on Wednesday. Inflation was 3.7% in September, and traders had priced almost no chance of a hike today.
Three things changed in the statement:
- Growth went from "solid" to "strong."
- The line saying September's hike would help bring inflation back to 2% faster was dropped.
- In its place, the Fed says more information will help decide the next step.
The vote was 10–2. Both dissenters wanted another hike. One was Governor Lisa Cook, her first dissent. The other was Beth Hammack, who also wanted a hike in July.
Over the last three meetings: three officials wanted a hike in July, all twelve voted for one in September, and now two want another.
Fed chair Kevin Warsh also announced a schedule change. From 2027, one meeting a year will be about strategy only, with no rate vote and no statement. Two in 2028. That means seven rate votes in 2027 and six in 2028.
In July he told markets to "play the ball, not the referee," so this looks like the same idea. That's my reading, not something he said.
Gold futures slipped about 0.7% after the decision. Bitcoin gave back most of its early gains near $80,000.
For balance, core inflation is 2.6%, and Jefferson and Williams say there's time to wait for data. Still, traders see about an 84% chance of a hike on December 9.
First check: PCE inflation and GDP on Thursday. Analysts expect PCE near 3.6%.
My read: the Fed held, but it's leaving the door open for December.
$BLUR $SNXXB

1
673
·
--
Проверено

Статья
Gold And Yields Both Fell. Not Since 2008Gold fell below $4,000 an ounce on Friday for the first time since July. It touched a low near $3,987, about 29% under its January peak of roughly $5,595.
I first read it the way most headlines tell it. Oil is up, Fed hike bets are up, gold is down.
Then I looked at Thursday, and that story stopped working.
On Thursday, the 10-year Treasury yield dropped 19 basis points in one day. Gold fell anyway. Berenberg says it's the first time since December 2008 that gold fell alongside such a steep drop in Treasury yields.
That's strange. Gold pays no interest, so falling yields normally help it. This time both fell together.
Oil and hike bets probably explain part of the week's slide. They don't explain a day when yields dropped and gold still sold off.
That same day, the Nasdaq fell 2.6% on worries about Meta's AI spending. Justin Lin, a strategist at Global X, called the move in gold a liquidity-driven sell-off. When stocks fall hard, some investors face margin calls and sell gold to raise cash.
That's the part I keep thinking about. Money was running toward Treasuries, and gold didn't act like a safe place to hide. It acted like the thing you sell when you need cash. Those are two different jobs, and gold usually gets credit for the first one.There's some history behind why gold was exposed. Berenberg says speculative money piled in when gold pushed past $5,400 in January, and the metal fell more than 20% as that money exited.
A forecast also broke. About three weeks earlier, Morgan Stanley's Amy Gower called $4,000 a floor, pointing to central bank buying and lower bond yields. Yields did fall. The floor broke anyway.
To be fair, nobody agrees on what's next. Berenberg warns that a close below $4,000 could bring more ETF outflows and selling in gold miners. Others say gold already corrected and could bounce fast. One analyst sees $3,900 as the next test.
I'm not calling a bottom. If this was mostly forced selling, gold should steady once stocks calm down. If it keeps sliding while stocks are quiet, the forced-selling story gets a lot weaker.
$XAUT
{spot}(XAUTUSDT)
Gold And Yields Both Fell. Not Since 2008
Gold fell below $4,000 an ounce on Friday for the first time since July. It touched a low near $3,987, about 29% under its January peak of roughly $5,595.
I first read it the way most headlines tell it. Oil is up, Fed hike bets are up, gold is down.
Then I looked at Thursday, and that story stopped working.
On Thursday, the 10-year Treasury yield dropped 19 basis points in one day. Gold fell anyway. Berenberg says it's the first time since December 2008 that gold fell alongside such a steep drop in Treasury yields.
That's strange. Gold pays no interest, so falling yields normally help it. This time both fell together.
Oil and hike bets probably explain part of the week's slide. They don't explain a day when yields dropped and gold still sold off.
That same day, the Nasdaq fell 2.6% on worries about Meta's AI spending. Justin Lin, a strategist at Global X, called the move in gold a liquidity-driven sell-off. When stocks fall hard, some investors face margin calls and sell gold to raise cash.
That's the part I keep thinking about. Money was running toward Treasuries, and gold didn't act like a safe place to hide. It acted like the thing you sell when you need cash. Those are two different jobs, and gold usually gets credit for the first one.There's some history behind why gold was exposed. Berenberg says speculative money piled in when gold pushed past $5,400 in January, and the metal fell more than 20% as that money exited.
A forecast also broke. About three weeks earlier, Morgan Stanley's Amy Gower called $4,000 a floor, pointing to central bank buying and lower bond yields. Yields did fall. The floor broke anyway.
To be fair, nobody agrees on what's next. Berenberg warns that a close below $4,000 could bring more ETF outflows and selling in gold miners. Others say gold already corrected and could bounce fast. One analyst sees $3,900 as the next test.
I'm not calling a bottom. If this was mostly forced selling, gold should steady once stocks calm down. If it keeps sliding while stocks are quiet, the forced-selling story gets a lot weaker.
$XAUT
2
666
·
--
Рост
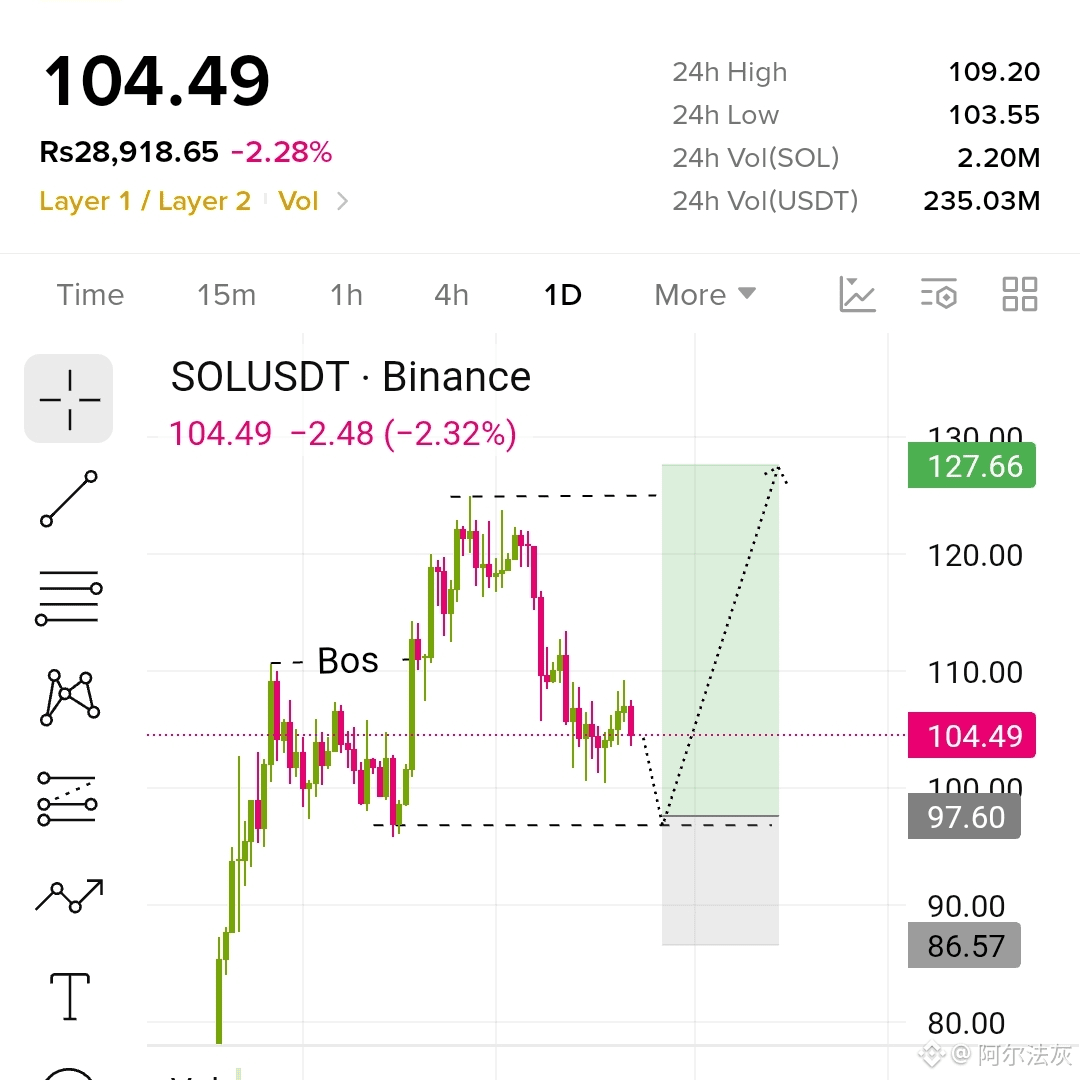
Let's Breakdown the price of SOL what will happen next...👀🧑💻
SOL is in its uptrend it is making higher high and higher lows continuously and now after making a new high it is in its pullback phase which is considered healthy for a next upward movement if it is making lower lows and lower high internally it doesn't mean it will drop hard because pullback is compulsory
market price never move in a single direction it always moves in a wave or following a zig zag pattern to balance the prices.
$SOL
{spot}(SOLUSDT)
now SOL can test its low area which is also it's strong support level once it reach to its low area you can buy it and can target the $110 $120 $130 price level.💰💰
put your stoploss just below its higher low area.
Must DYOR its not a financial advice 👍
Let's Breakdown the price of SOL what will happen next...👀🧑💻
SOL is in its uptrend it is making higher high and higher lows continuously and now after making a new high it is in its pullback phase which is considered healthy for a next upward movement if it is making lower lows and lower high internally it doesn't mean it will drop hard because pullback is compulsory
market price never move in a single direction it always moves in a wave or following a zig zag pattern to balance the prices.
$SOL
now SOL can test its low area which is also it's strong support level once it reach to its low area you can buy it and can target the $110 $120 $130 price level.💰💰
put your stoploss just below its higher low area.
Must DYOR its not a financial advice 👍
2
1.3k
·
--
Рост
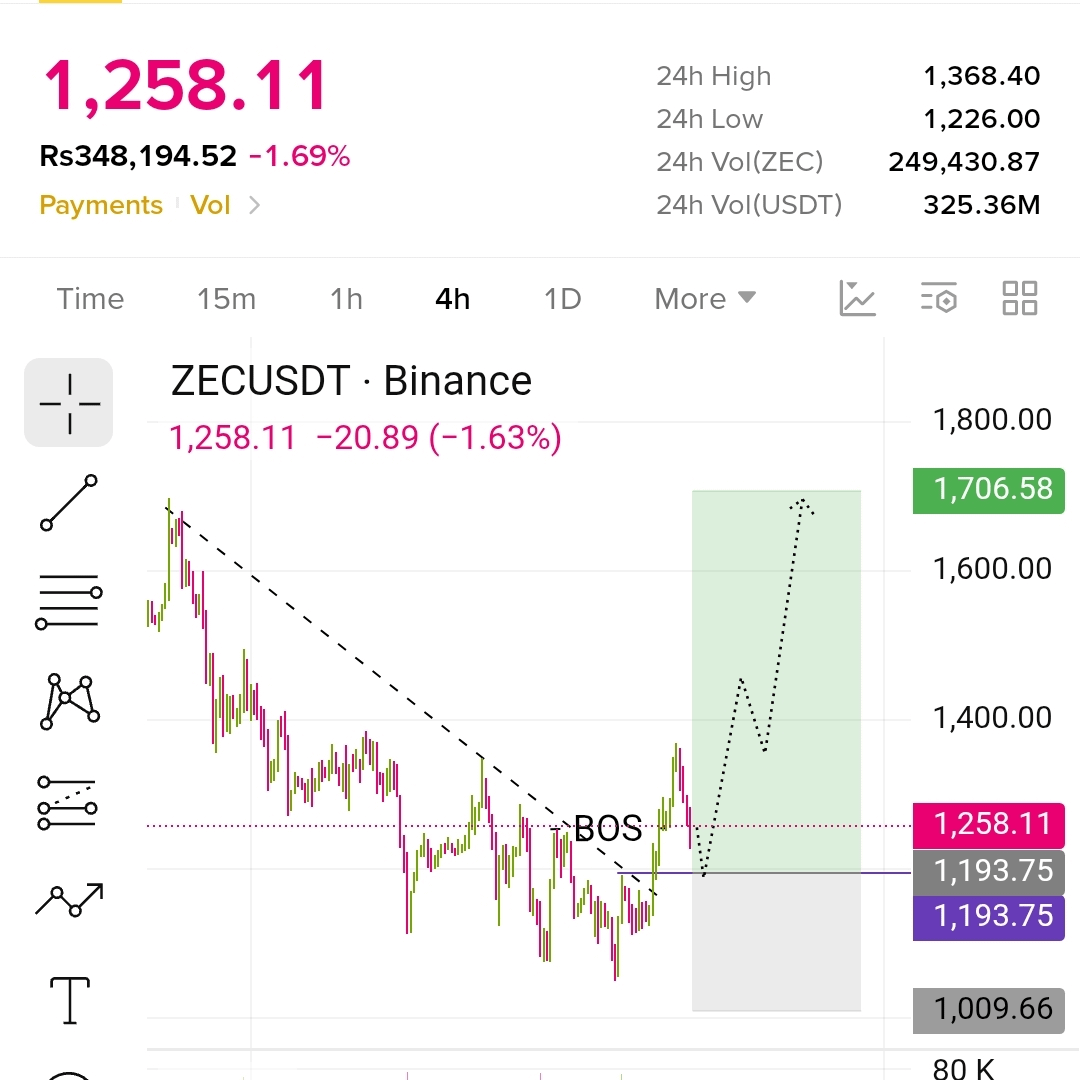
ZEC once again giving you a buy opportunity if you area ZEC lover then this update related to ZEC is very beneficial to you beforetaking any decision.👀🔥
ZEC looks good to buy right now or you can wait a little until it reach on this support level which is mark with the purple horizontal line.
After making a ATH near to $1700 it was in a correction phase now it has broken its structure on 4H time frame and giving a signal of 💪 strength...
click here to buy ZEC👇
{spot}(ZECUSDT)
buy ZEC right now and place the Stoploss below its Strong low area and the target should be $1300 $1400 $1600 $1700 and never put a all of your portfolio in one order place your oder in parts and hold your asset until you got handsome profit💰🎉
before taking any decision must do your own analysis👍
#TeslaSlides5%PreMarket
#KOSPISinks3.52%ToLowestCloseSinceApril
#EarningsSeason
#ZcashDevelopersConfirmNovemberDateForNU7Upgrade
ZEC once again giving you a buy opportunity if you area ZEC lover then this update related to ZEC is very beneficial to you beforetaking any decision.👀🔥
ZEC looks good to buy right now or you can wait a little until it reach on this support level which is mark with the purple horizontal line.
After making a ATH near to $1700 it was in a correction phase now it has broken its structure on 4H time frame and giving a signal of 💪 strength...
click here to buy ZEC👇
buy ZEC right now and place the Stoploss below its Strong low area and the target should be $1300 $1400 $1600 $1700 and never put a all of your portfolio in one order place your oder in parts and hold your asset until you got handsome profit💰🎉
before taking any decision must do your own analysis👍
#TeslaSlides5%PreMarket
#KOSPISinks3.52%ToLowestCloseSinceApril
#EarningsSeason
#ZcashDevelopersConfirmNovemberDateForNU7Upgrade
1
607
·
--
Рост
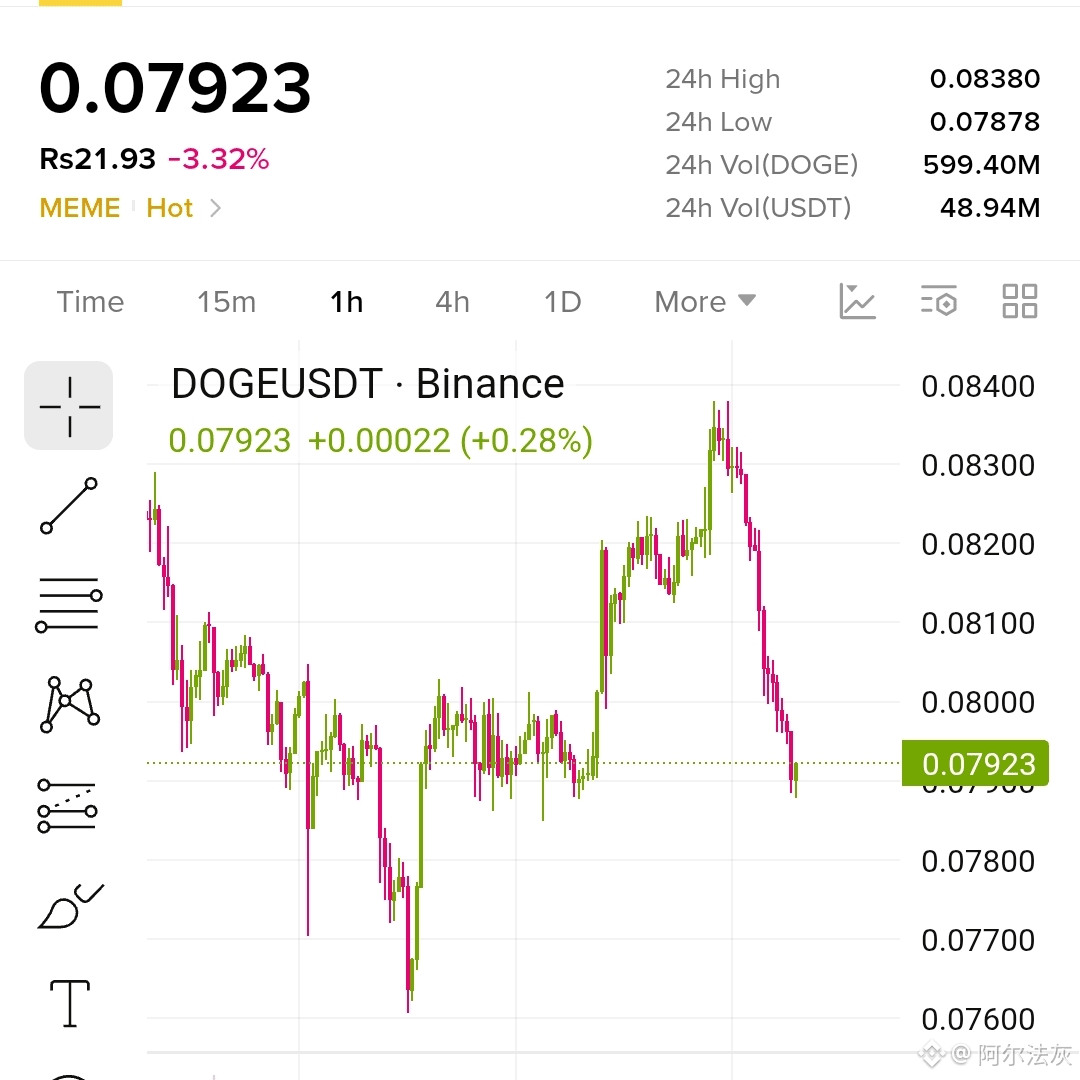
DOGE gave back its whole breakout in under a day, and I'm watching to see if it can hold the spot where the move started.
On the 1h, I watched price chop sideways for days, then run hard to 0.0838. All of that is gone now. We're at 0.0792 with the 24h low at 0.07878. I'm not calling a bounce yet. The sell-off candles were big and volume picked up on the way down, so sellers still have momentum.
What caught my eye is the zone itself. The old range floor has a cluster of lows around 0.0785 to 0.0788, so I think there's sell-side liquidity sitting just below. Price has already tapped into it and bounced a little. I could see it sweep those lows and snap back, but I could also see it slice right through.
So I'm waiting for confirmation. I want price to hold above 0.07878, print a higher low, then close back above 0.0800 on the 1h. That's the top of the old range and a round number, so I expect sellers there. Until it clears, I'm treating this as a bounce attempt, not a reversal.
$DOGE
{spot}(DOGEUSDT)
DOGE/USDT · 1h · Long (conditional)
- Entry: 0.0788 – 0.0793
- TP1: 0.0800
- TP2: 0.0820 (where price spent time on the way up)
- TP3: 0.0838 (24h high)
- SL: 0.0784
If it works, I expect 0.0800 first, and a clean close above it opens 0.0820. If price closes below 0.0784, I'm out. The idea is dead, and the next support I can see is around 0.0761. I won't average down into that.
I'm keeping my size small, placing the stop before I enter, and planning to take partials at TP1. This is a reaction trade at a level, not a sure thing.
#ChinaSeeksToSeize61800BTC
#EarningsSeason
#ZcashDevelopersConfirmNovemberDateForNU7Upgrade
#OCCIssuesFirstFinalRuleUnderGENIUSAct
DOGE gave back its whole breakout in under a day, and I'm watching to see if it can hold the spot where the move started.
On the 1h, I watched price chop sideways for days, then run hard to 0.0838. All of that is gone now. We're at 0.0792 with the 24h low at 0.07878. I'm not calling a bounce yet. The sell-off candles were big and volume picked up on the way down, so sellers still have momentum.
What caught my eye is the zone itself. The old range floor has a cluster of lows around 0.0785 to 0.0788, so I think there's sell-side liquidity sitting just below. Price has already tapped into it and bounced a little. I could see it sweep those lows and snap back, but I could also see it slice right through.
So I'm waiting for confirmation. I want price to hold above 0.07878, print a higher low, then close back above 0.0800 on the 1h. That's the top of the old range and a round number, so I expect sellers there. Until it clears, I'm treating this as a bounce attempt, not a reversal.
$DOGE
DOGE/USDT · 1h · Long (conditional)
- Entry: 0.0788 – 0.0793
- TP1: 0.0800
- TP2: 0.0820 (where price spent time on the way up)
- TP3: 0.0838 (24h high)
- SL: 0.0784
If it works, I expect 0.0800 first, and a clean close above it opens 0.0820. If price closes below 0.0784, I'm out. The idea is dead, and the next support I can see is around 0.0761. I won't average down into that.
I'm keeping my size small, placing the stop before I enter, and planning to take partials at TP1. This is a reaction trade at a level, not a sure thing.
#ChinaSeeksToSeize61800BTC
#EarningsSeason
#ZcashDevelopersConfirmNovemberDateForNU7Upgrade
#OCCIssuesFirstFinalRuleUnderGENIUSAct
1
284

·
--
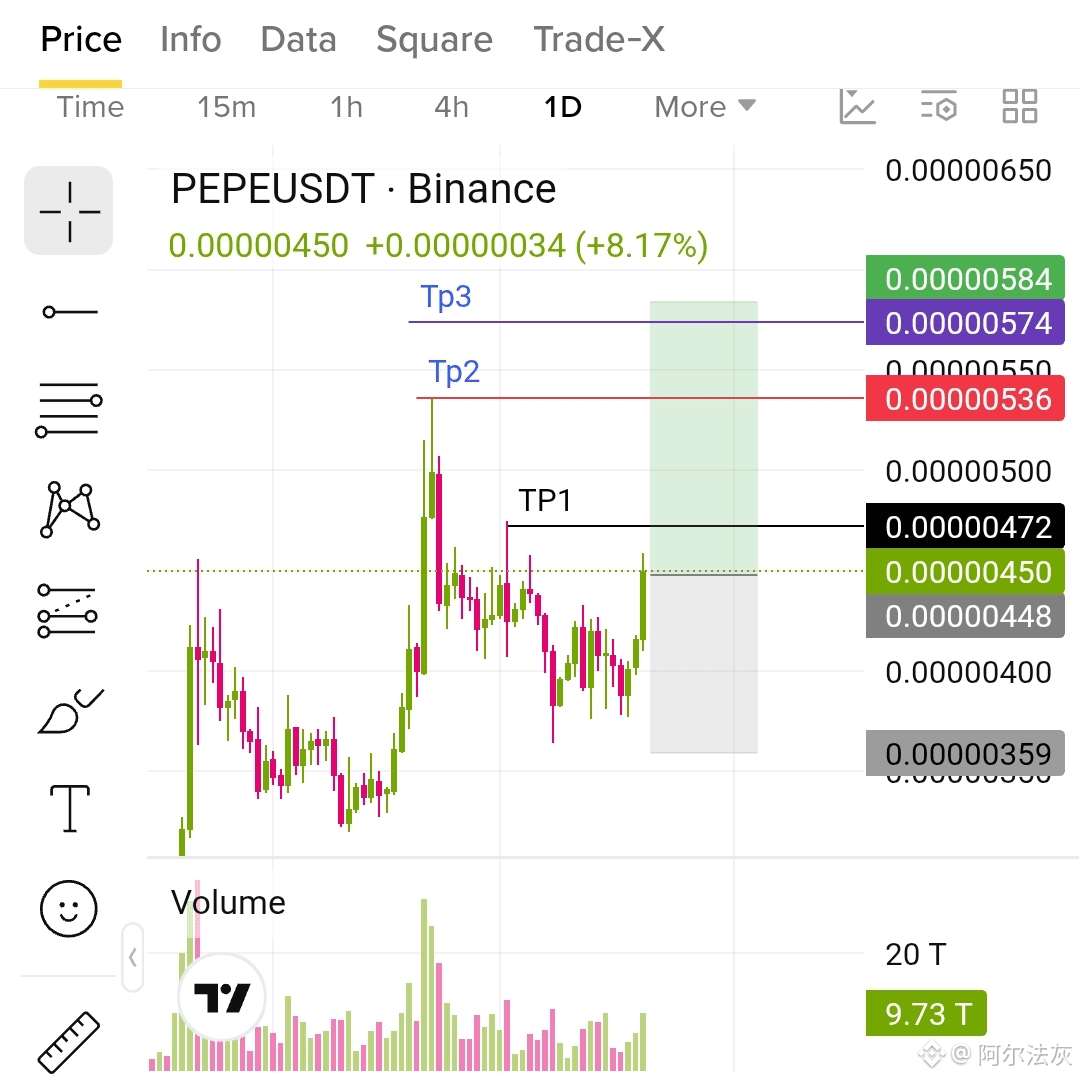
Listen Guys have a look on the below PEPE chart it looks bullish it is making higher highs and higher lows soon it will make a new higher high never miss this opportunity 🚀
$PEPE
{spot}(PEPEUSDT)
everything is mention In the below chart what are aje profit level stoploss and entry...👀
Best of luck everyone ✨✨
$IOST
$BMT
Listen Guys have a look on the below PEPE chart it looks bullish it is making higher highs and higher lows soon it will make a new higher high never miss this opportunity 🚀
$PEPE
everything is mention In the below chart what are aje profit level stoploss and entry...👀
Best of luck everyone ✨✨
$IOST
$BMT
$PEPE
everything is mention In the below chart what are aje profit level stoploss and entry...👀
Best of luck everyone ✨✨
$IOST
$BMT
1
587
·
--
Падение
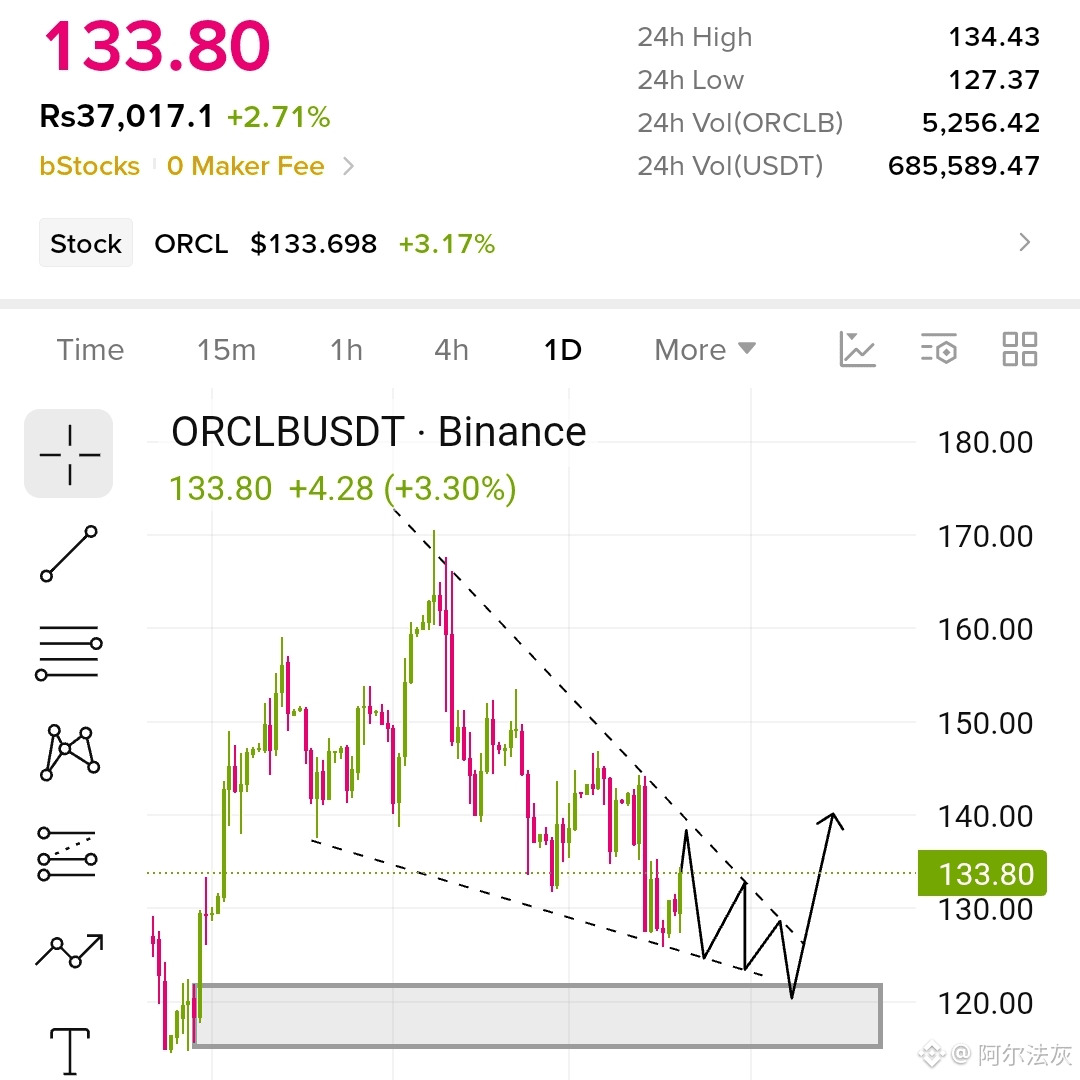
ORCLB looks bearish it is in its downtrend and going toward its demand zone it is moving in the falling wedge pattern which is near to breakout...🚀🚀🚀
$ORCLB
{spot}(ORCLBUSDT)
now you can take a short entry after approaching on its upper trendline and ou can target its lower trendline but if you want a long entry on ORCL just wait for its Break of structure from bearish to bullish and also for breakout then you can go with long .
DYOR after making any decision this is not a financial advice👀
best of luck everyone👍
ORCLB looks bearish it is in its downtrend and going toward its demand zone it is moving in the falling wedge pattern which is near to breakout...🚀🚀🚀
$ORCLB
now you can take a short entry after approaching on its upper trendline and ou can target its lower trendline but if you want a long entry on ORCL just wait for its Break of structure from bearish to bullish and also for breakout then you can go with long .
DYOR after making any decision this is not a financial advice👀
best of luck everyone👍
1
168
·
--
Рост
NEAR to the moon🚀🚀🚀
$NEAR
{spot}(NEARUSDT)
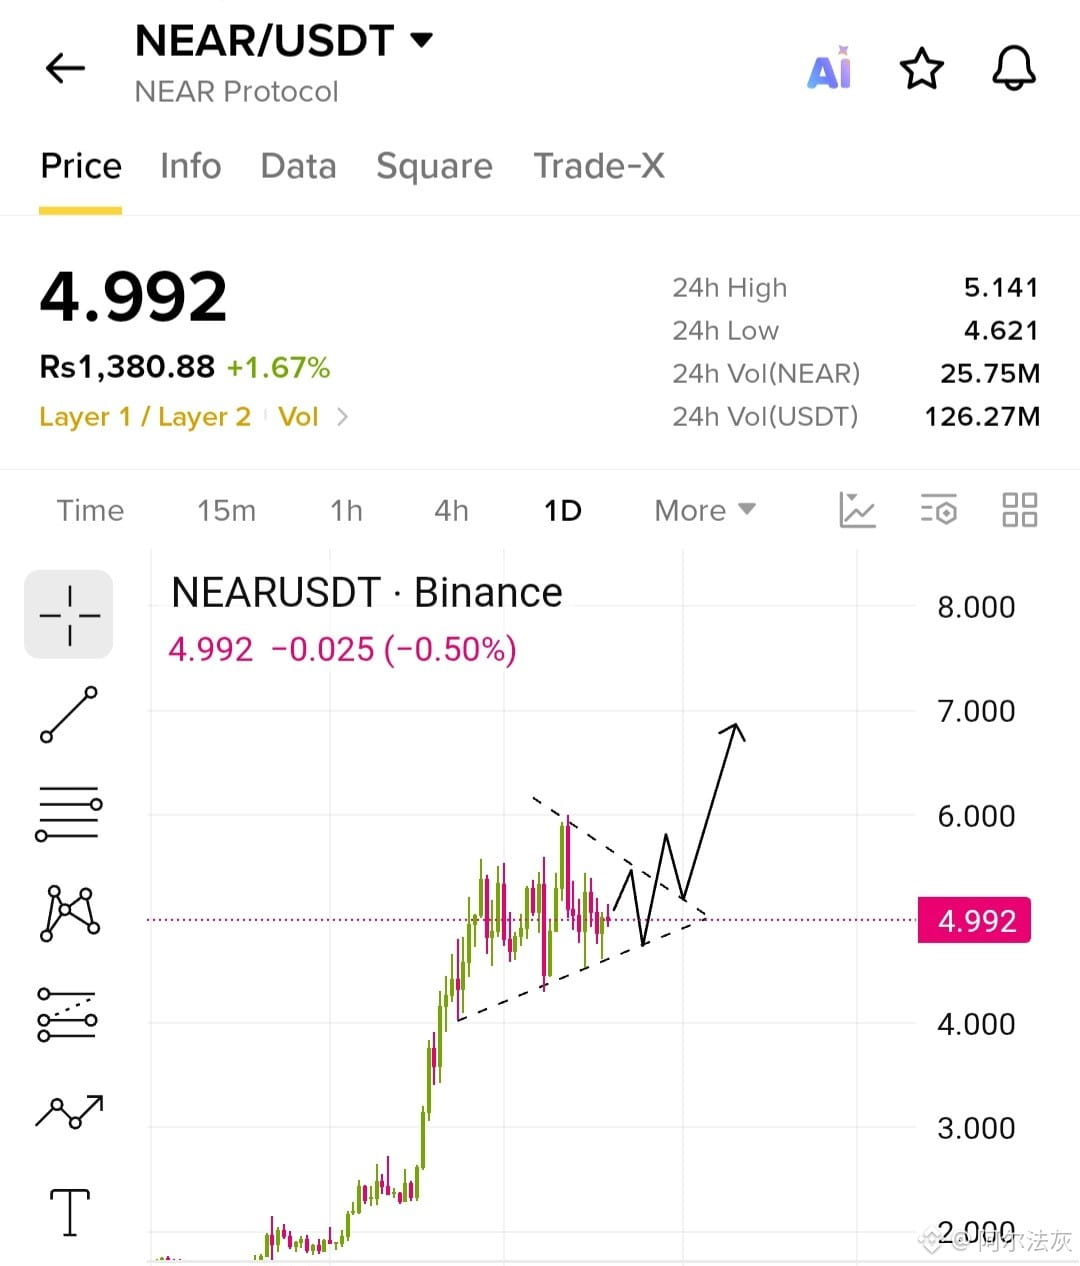
is forming a classic bullish penut pattern it looks near to breakout once it happen it will fly and will touch the price of $7
NEAR to the moon🚀🚀🚀
$NEAR
is forming a classic bullish penut pattern it looks near to breakout once it happen it will fly and will touch the price of $7
$NEAR
is forming a classic bullish penut pattern it looks near to breakout once it happen it will fly and will touch the price of $7
2
1
1.3k
·
--
China's GDP Beat Hides A Widening Gap
China's economy grew 4.5% this quarter compared to last year. That beat the forecast of 4.4%, and it's higher than last quarter's 4.3%, which was the weakest number in over three years.
On the surface, that looks like good news.
But here's what's hiding underneath that number.
Investment in things like factories and buildings fell 7.2% over the past nine months. Investment in real estate specifically dropped 20.6% in that same time. Almost all of the growth came from one place, exports. China sold $938 billion more to other countries than it bought, and that number could pass $1 trillion once next month's data comes in.
I think that's the real story here.
One report today said it clearly, strong exports are covering up weak spending at home. Two very different pictures living inside the same headline number.
It's worth giving credit where it's due too, though.
Spending by regular people actually came in much higher than expected, up 1.1% compared to a forecast of just 0.6%. That's almost double what people thought would happen. So it's not fair to say the whole domestic economy is struggling.
It's also worth looking at the bigger picture.
Full-year growth is still expected to land around 4.5% for this year, down from 5% last year, and it's expected to slow further to 4.4% next year. Today's good number is one strong quarter inside a slower, longer trend. It doesn't reverse that trend.
I'm not saying today's number is fake or bad, honestly. Beating a forecast is still beating a forecast, and it takes some pressure off the government to roll out big stimulus right now.
Just worth remembering, "China beat its GDP forecast" and "China's economy at home is healthy" are two different statements. Today's numbers only really back up the first one.
#ChinaGDP #Write2Earrn #JapanFSAPublishesOnChainFinanceForumMinutes #BankOfRussiaSaysSelfCustodyBanStartsJuly2027

1
143
·
--
Рост
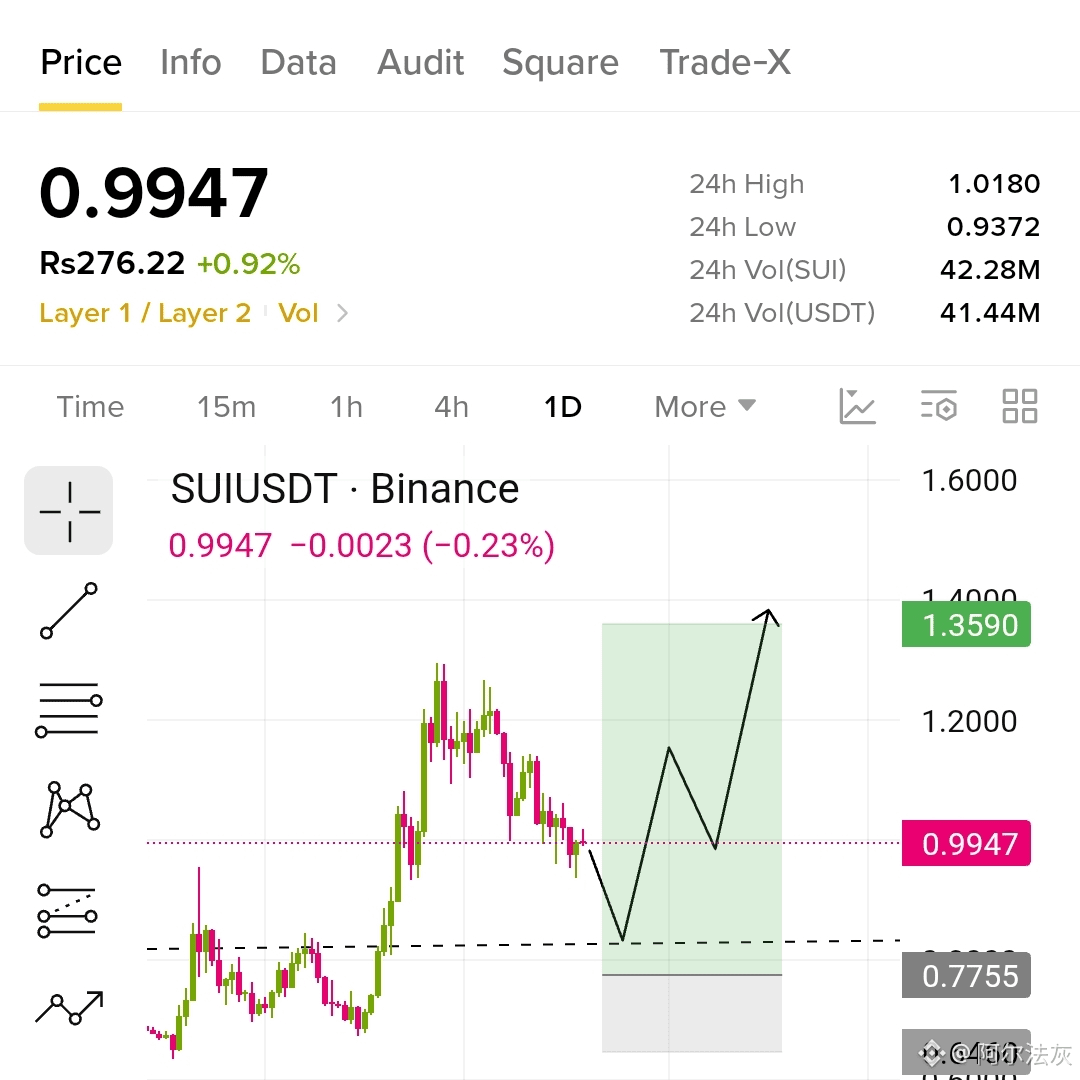
Soon SUI will surpass the $1.30 price🤑🤑🤑 level but after it's pull back it will fly again just wait for entry...👀
{future}(SUIUSDT)
everything is mention in the below chart just have a look and wait for entry level to get handsome profit...💰💰
must manage you risk and DYOR before taking anay decision 🤷♂️
#JapanFSAPublishesOnChainFinanceForumMinutes
#BankOfRussiaSaysSelfCustodyBanStartsJuly2027
#CFTCAdvancesVoluntaryRegCAMFramework
#ZcashNU7ProposalWouldFreezeSproutSpending
Soon SUI will surpass the $1.30 price🤑🤑🤑 level but after it's pull back it will fly again just wait for entry...👀
everything is mention in the below chart just have a look and wait for entry level to get handsome profit...💰💰
must manage you risk and DYOR before taking anay decision 🤷♂️
#JapanFSAPublishesOnChainFinanceForumMinutes
#BankOfRussiaSaysSelfCustodyBanStartsJuly2027
#CFTCAdvancesVoluntaryRegCAMFramework
#ZcashNU7ProposalWouldFreezeSproutSpending
5
1.4k
·
--
Рост
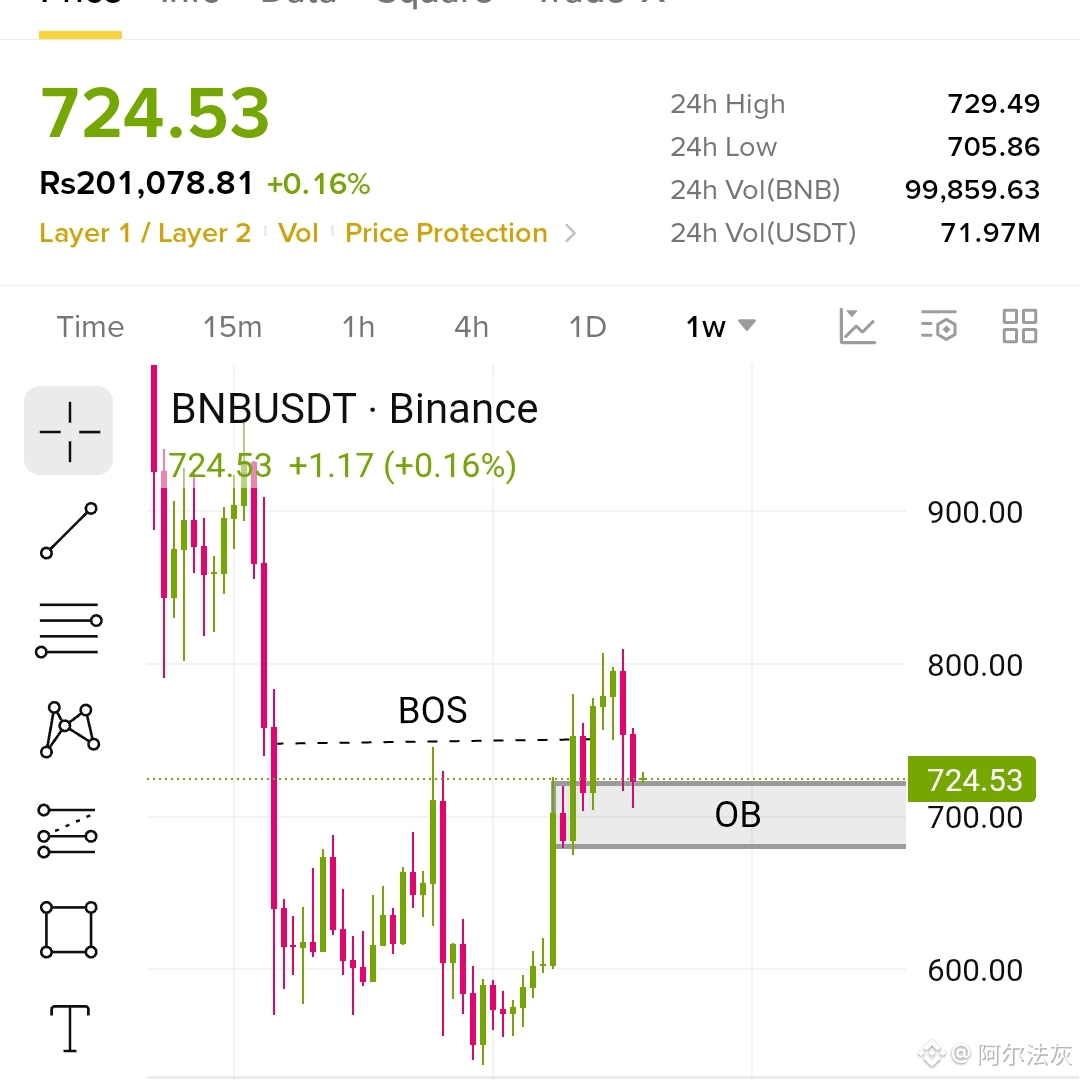
Listen Guys I am bullish🚀 on BNB at this price. I just need a few minute to explain why I think it can go higher...🔥
$BNB
{spot}(BNBUSDT)
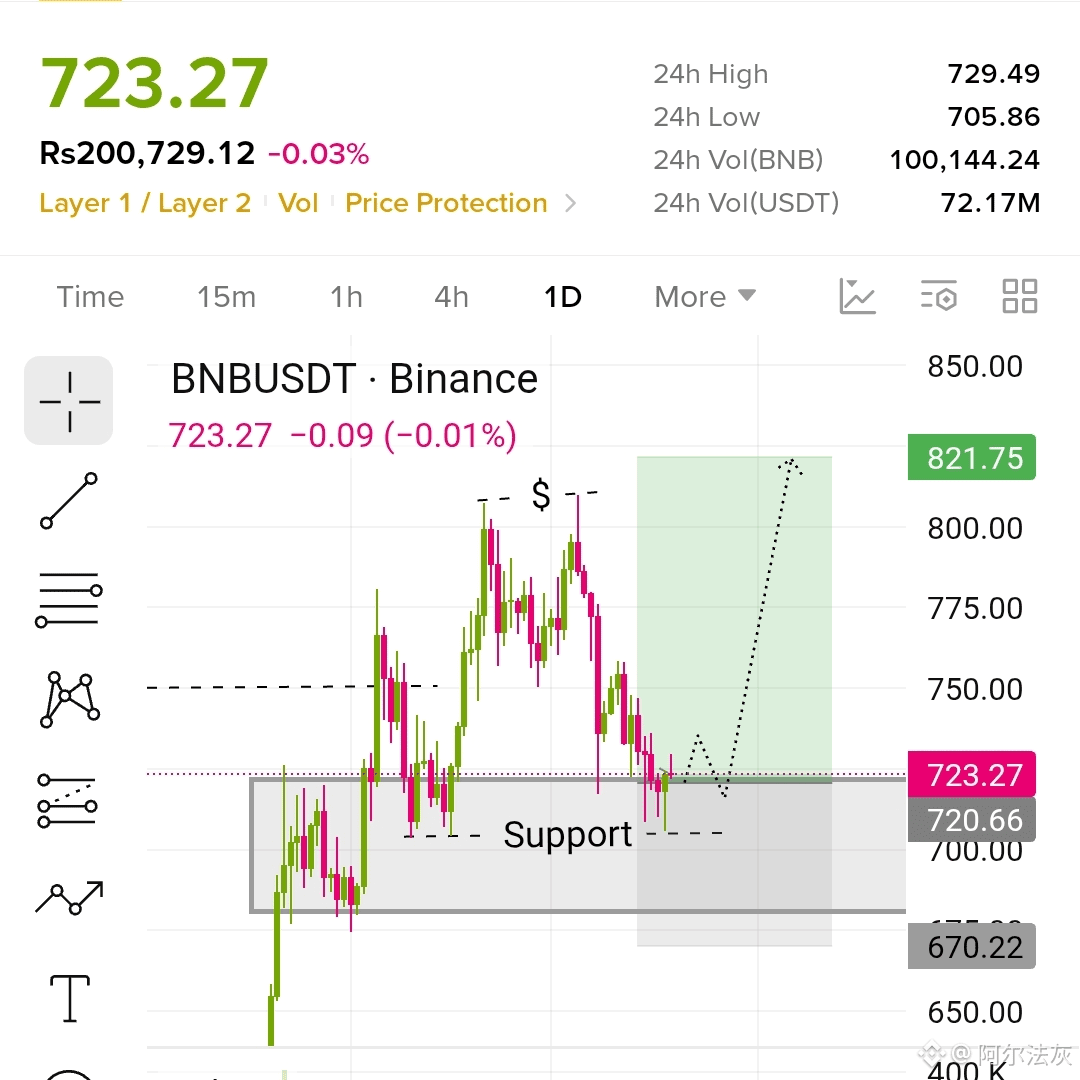
have a look at the below weekly chart it has broken its structure from bearish to bullish and make a new high after creating a new high now it is going for correction ion 1 day time frame it is making higher highs and higher lows at current price it is resting in its support level also it's support level is a strong low area.
if this area is protected it will make a new high
if you want a long trade now you can enter and target the new high everything is mention in the chart enter at the current price and target the $750 $770 and $820 price level.✨️
set you stoploss just below its support and it's strong low area...
let's go best of luck everyone 👍
Listen Guys I am bullish🚀 on BNB at this price. I just need a few minute to explain why I think it can go higher...🔥
$BNB
have a look at the below weekly chart it has broken its structure from bearish to bullish and make a new high after creating a new high now it is going for correction ion 1 day time frame it is making higher highs and higher lows at current price it is resting in its support level also it's support level is a strong low area.
if this area is protected it will make a new high
if you want a long trade now you can enter and target the new high everything is mention in the chart enter at the current price and target the $750 $770 and $820 price level.✨️
set you stoploss just below its support and it's strong low area...
let's go best of luck everyone 👍
1
155
·
--
Проверено
covenants drop the keeper,but conditions set the ceiling
the line that stopped me on nillion's roadmap page was about keepers. a keeper is whoever presses execute on a conditional order.dusk needs none nodes decrypt only when a live data feed shows the condition is met.
so nobody gets to decide 🔐. public chains let anyone watch pending orders, which always felt backwards to me.
dusk is nillion's first phase, not the other dusk. nillion said first week of october, and the l1 node page is up now, though i couldn't find an official "it's live" post.
what i keep circling back to is nightside, the custom conditions phase. the testnet coverage i read listed price-based conditions on a short list of assets, thirty days max, no cancelling after posting. limited no, early is fairer, it's phase one of seven. a sealed envelope is only as useful as what you can write on it.
i could be wrong about the ceiling. mainnet terms may differ, and nightside is already on the roadmap. if mainnet docs show conditions beyond price, my worry is gone. until then i'm watching that list, not the headlines. not financial advice.
#nil $NIL @nillionnetwork
covenants drop the keeper,but conditions set the ceiling
the line that stopped me on nillion's roadmap page was about keepers. a keeper is whoever presses execute on a conditional order.dusk needs none nodes decrypt only when a live data feed shows the condition is met.
so nobody gets to decide 🔐. public chains let anyone watch pending orders, which always felt backwards to me.
dusk is nillion's first phase, not the other dusk. nillion said first week of october, and the l1 node page is up now, though i couldn't find an official "it's live" post.
what i keep circling back to is nightside, the custom conditions phase. the testnet coverage i read listed price-based conditions on a short list of assets, thirty days max, no cancelling after posting. limited no, early is fairer, it's phase one of seven. a sealed envelope is only as useful as what you can write on it.
i could be wrong about the ceiling. mainnet terms may differ, and nightside is already on the roadmap. if mainnet docs show conditions beyond price, my worry is gone. until then i'm watching that list, not the headlines. not financial advice.
#nil $NIL @Nillion

1
4
516
·
--
Рост
Near is heating again for next pump...🔥🔥🔥
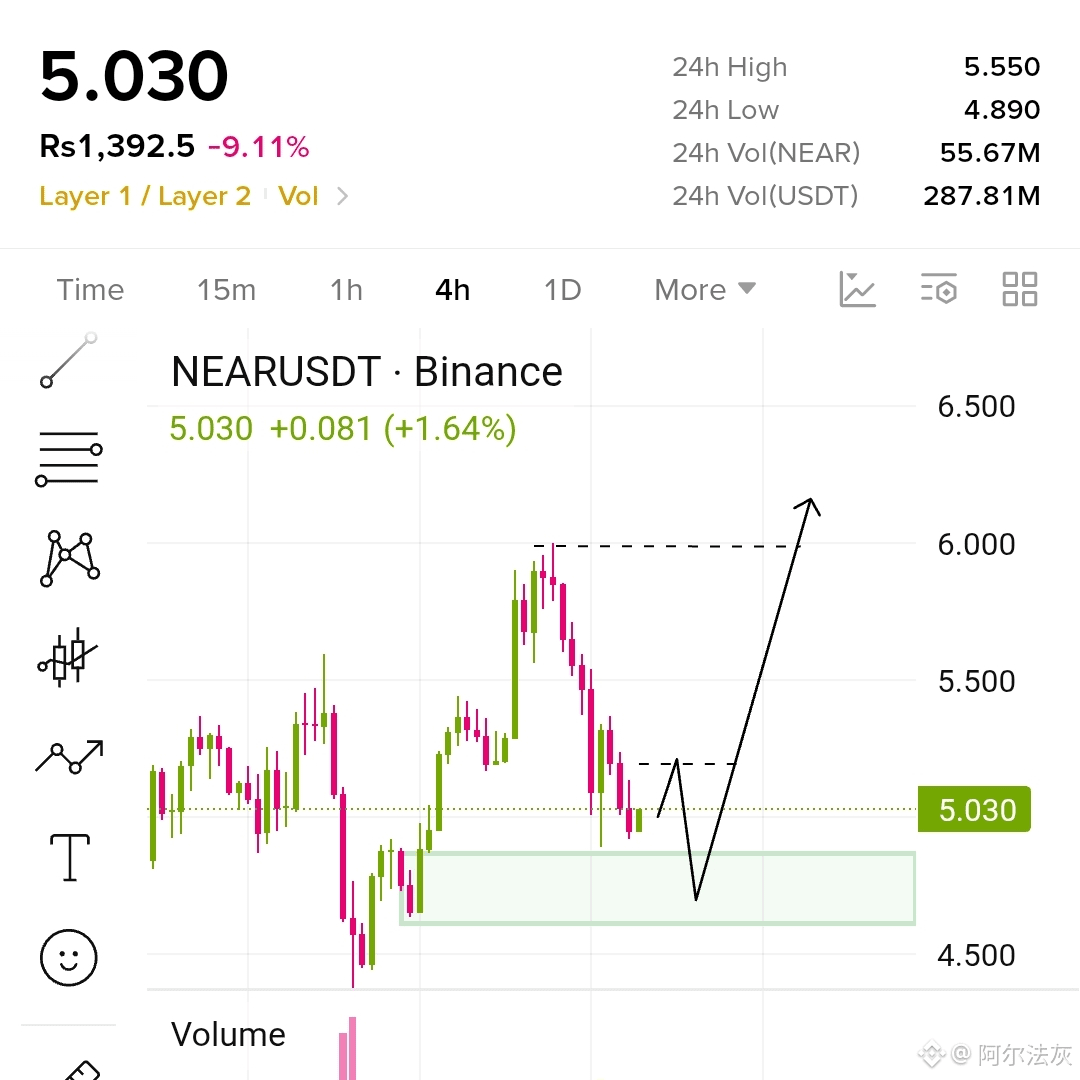
Let's breakdown the price of Near look at the chart below after making new high it dropped 10% it is a pullback for a next healthy upward movement because it is in uptrend as it ismaking higher highs and higher lows continuously.
it is now entering in its demand zone as you can see the bottom black line that I have marked it is it's strong low area which must be hold no matter what...👀
after reaching in demand zone or near its Strong low area you can buy Near after it's changeof character and can target the next high the targets are $5.500 , $5.800 , $6.500🚀🚀🚀
$NEAR
{spot}(NEARUSDT)
Before making any decision must do your own analysis👍
Near is heating again for next pump...🔥🔥🔥
Let's breakdown the price of Near look at the chart below after making new high it dropped 10% it is a pullback for a next healthy upward movement because it is in uptrend as it ismaking higher highs and higher lows continuously.
it is now entering in its demand zone as you can see the bottom black line that I have marked it is it's strong low area which must be hold no matter what...👀
after reaching in demand zone or near its Strong low area you can buy Near after it's changeof character and can target the next high the targets are $5.500 , $5.800 , $6.500🚀🚀🚀
$NEAR
Before making any decision must do your own analysis👍
3
2.7k
·
--
Статья
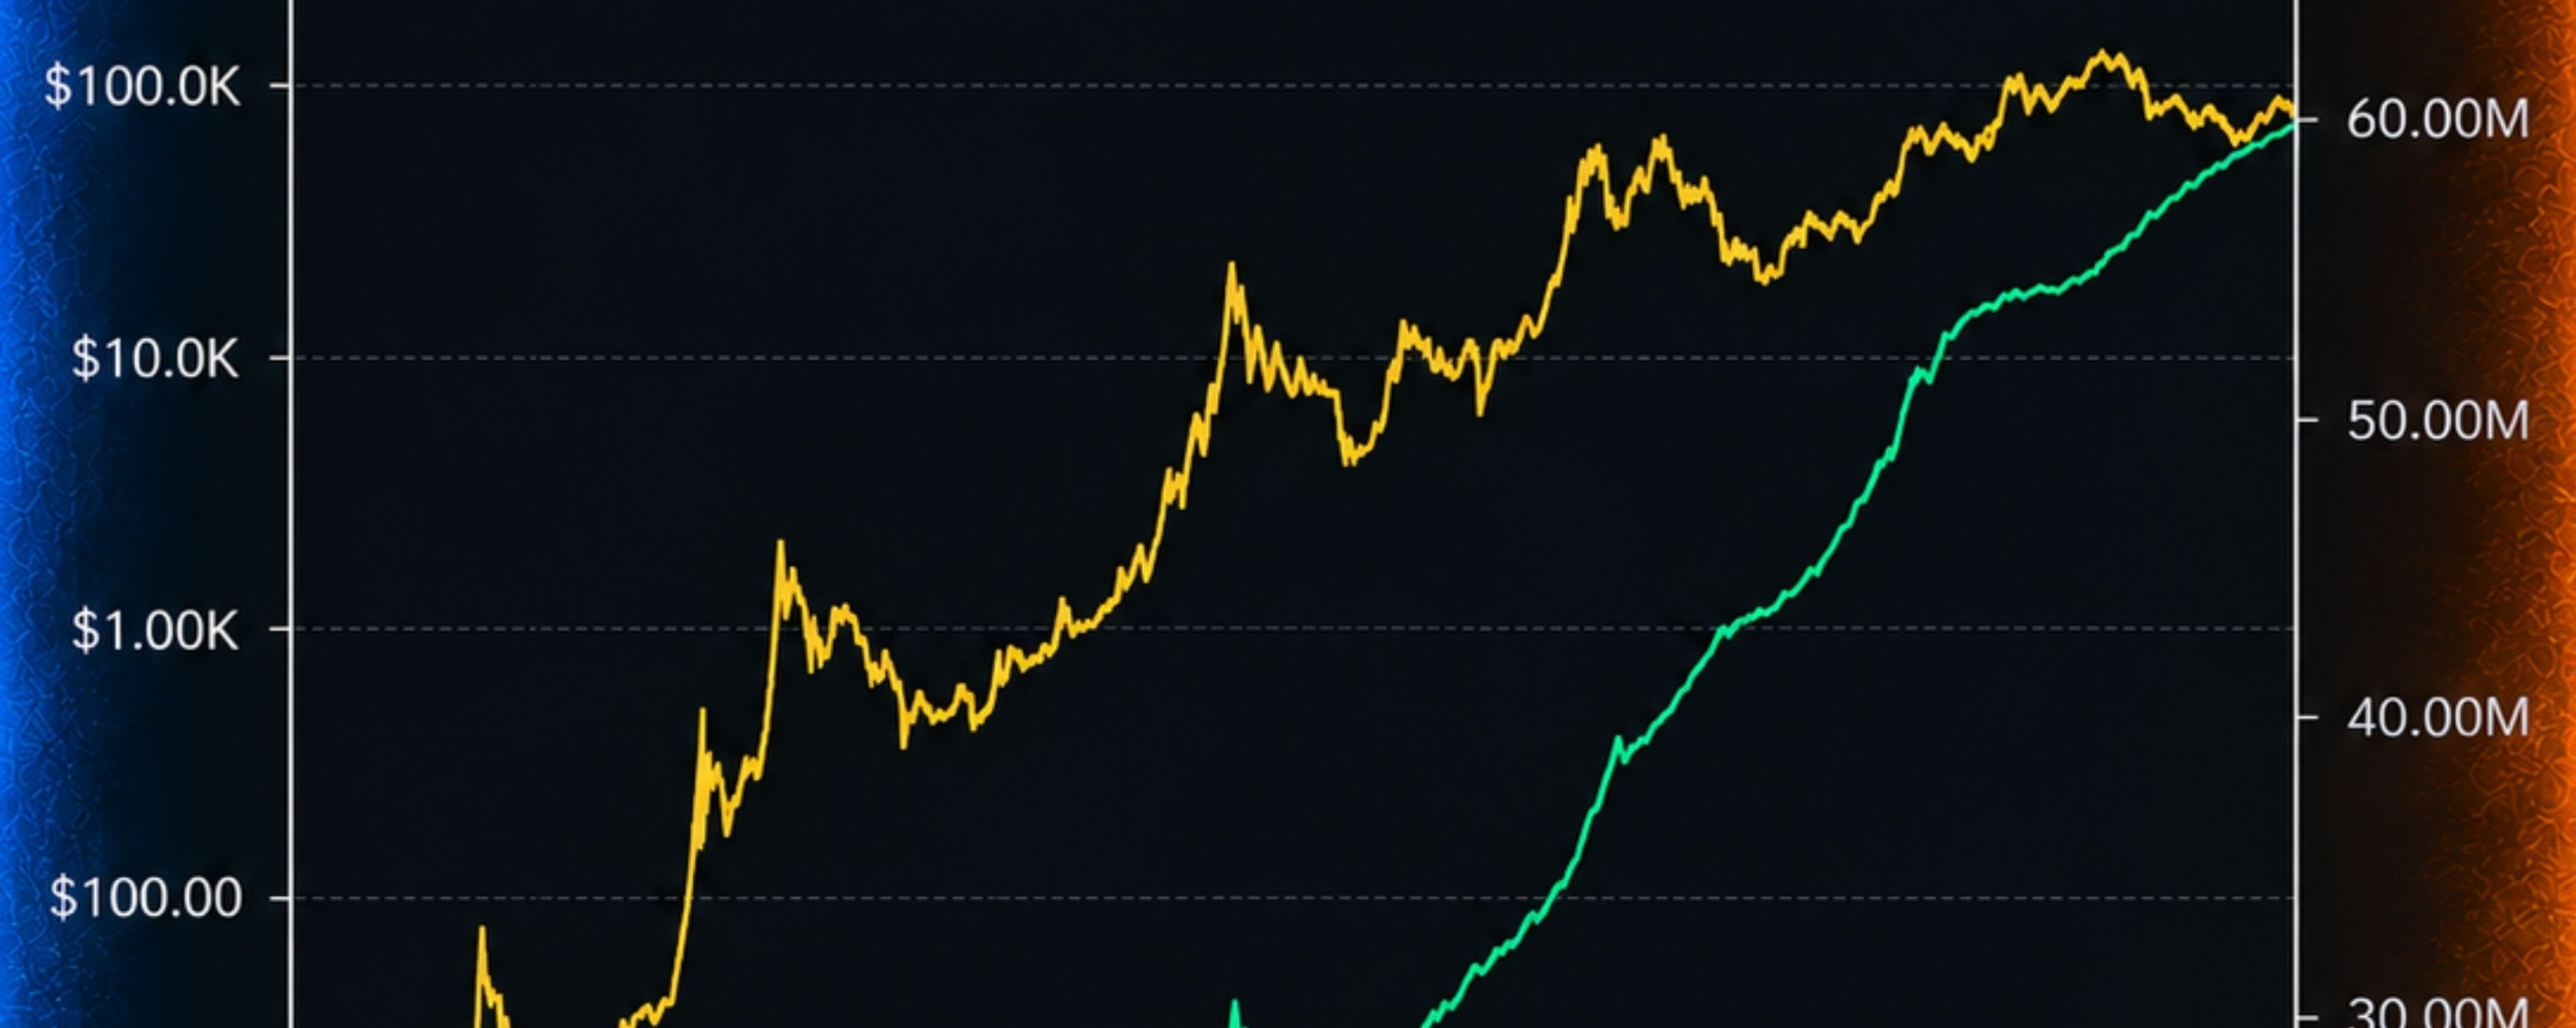
Crypto's Most Recycled Headline Strikes AgainBitcoin wallets with a non-zero balance crossing 60 million today sounds like fresh, exciting adoption news.
Here's the thing though.
This exact headline has run, with a new number each time, almost every single year since 2022. 40.3 million in early 2022. 42.6 million by July 2022. 43.8 million in January 2023. 47.8 million later that year. 56.9 million by July 2026. 58.45 million by March 2026. Now allegedly past 60 million.
I think that pattern is worth sitting with more than today's specific number.
"Non-zero wallets hit ATH" isn't really breaking news. It's a headline that's almost guaranteed to be true on a long enough timeline, since this particular metric mathematically struggles to go down.
Worth understanding why.
A single person can generate unlimited Bitcoin addresses. No cap, no identity check, no limit. Dust transactions, leftover change addresses, custodial exchange wallets, and lost coins that never actually clear from the chain all inflate this number too, without representing a single new human being who just discovered Bitcoin.
Out of roughly 1.5 billion total addresses ever created, less than 60 million holding anything at all tells you more about how addresses accumulate over 15+ years than it tells you about this week's adoption specifically.
Worth being fair here too.
The long-term trend from under 10 million addresses in 2017 to 60 million now is real and directionally meaningful. Genuine, slow, sustained growth is happening underneath this. It's just not "breaking" anything. It's the same gradual curve it's been for years, re-announced every time it crosses a round-ish number.
I'm not dismissing Bitcoin adoption. Just noting a metric that goes up almost by mathematical default isn't the kind of evidence that should get a rocket emoji every time someone notices it again.
$BTC
{spot}(BTCUSDT)
Crypto's Most Recycled Headline Strikes Again
Bitcoin wallets with a non-zero balance crossing 60 million today sounds like fresh, exciting adoption news.
Here's the thing though.
This exact headline has run, with a new number each time, almost every single year since 2022. 40.3 million in early 2022. 42.6 million by July 2022. 43.8 million in January 2023. 47.8 million later that year. 56.9 million by July 2026. 58.45 million by March 2026. Now allegedly past 60 million.
I think that pattern is worth sitting with more than today's specific number.
"Non-zero wallets hit ATH" isn't really breaking news. It's a headline that's almost guaranteed to be true on a long enough timeline, since this particular metric mathematically struggles to go down.
Worth understanding why.
A single person can generate unlimited Bitcoin addresses. No cap, no identity check, no limit. Dust transactions, leftover change addresses, custodial exchange wallets, and lost coins that never actually clear from the chain all inflate this number too, without representing a single new human being who just discovered Bitcoin.
Out of roughly 1.5 billion total addresses ever created, less than 60 million holding anything at all tells you more about how addresses accumulate over 15+ years than it tells you about this week's adoption specifically.
Worth being fair here too.
The long-term trend from under 10 million addresses in 2017 to 60 million now is real and directionally meaningful. Genuine, slow, sustained growth is happening underneath this. It's just not "breaking" anything. It's the same gradual curve it's been for years, re-announced every time it crosses a round-ish number.
I'm not dismissing Bitcoin adoption. Just noting a metric that goes up almost by mathematical default isn't the kind of evidence that should get a rocket emoji every time someone notices it again.
$BTC
2
246
·
--
Рост
Listen Guys Just give me few minutes you must know what will happen next in the market before making any decision, take a moment to think it through...👀
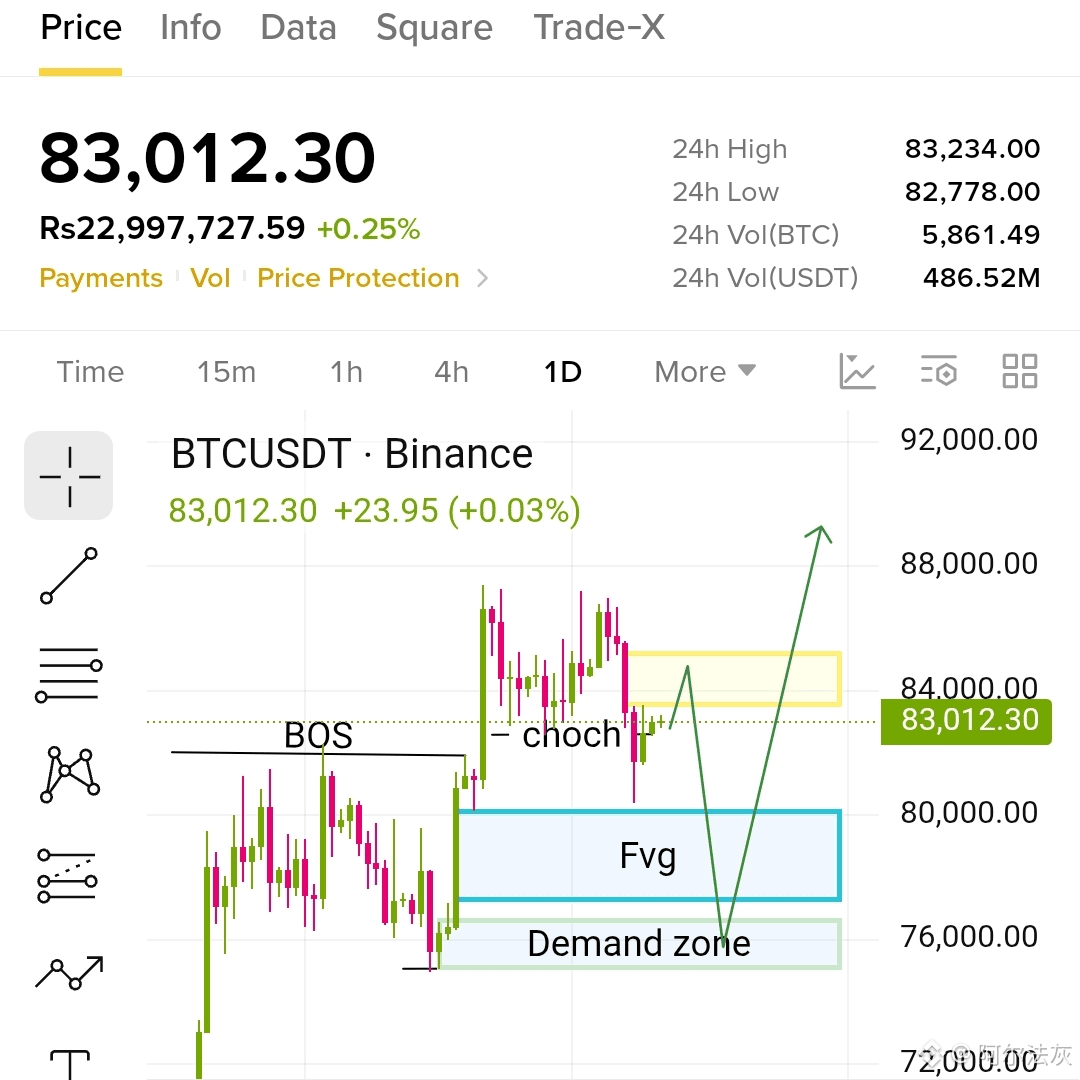
Let's breakdown the Bitcoin price it's current price is $83k it looks bullish at 1 day time frame it's external trend is bullish but internally it has broken its structure it has done it's change of character and now it is making lower lows and lower high and now it can touch the 80k 75k and 70k levels.📉
if it happens it is buying opportunity and if you are in a loss just hold your assets.
If you want to go with long trade just wait for its proper pullback and wait to tap in demand zone and take long trade after confirmation and target the 75k 80k 85k and 90k levels.🚀🚀
just wait and watch and keep your risk management tight.
4
1.4k
·
--
Рост
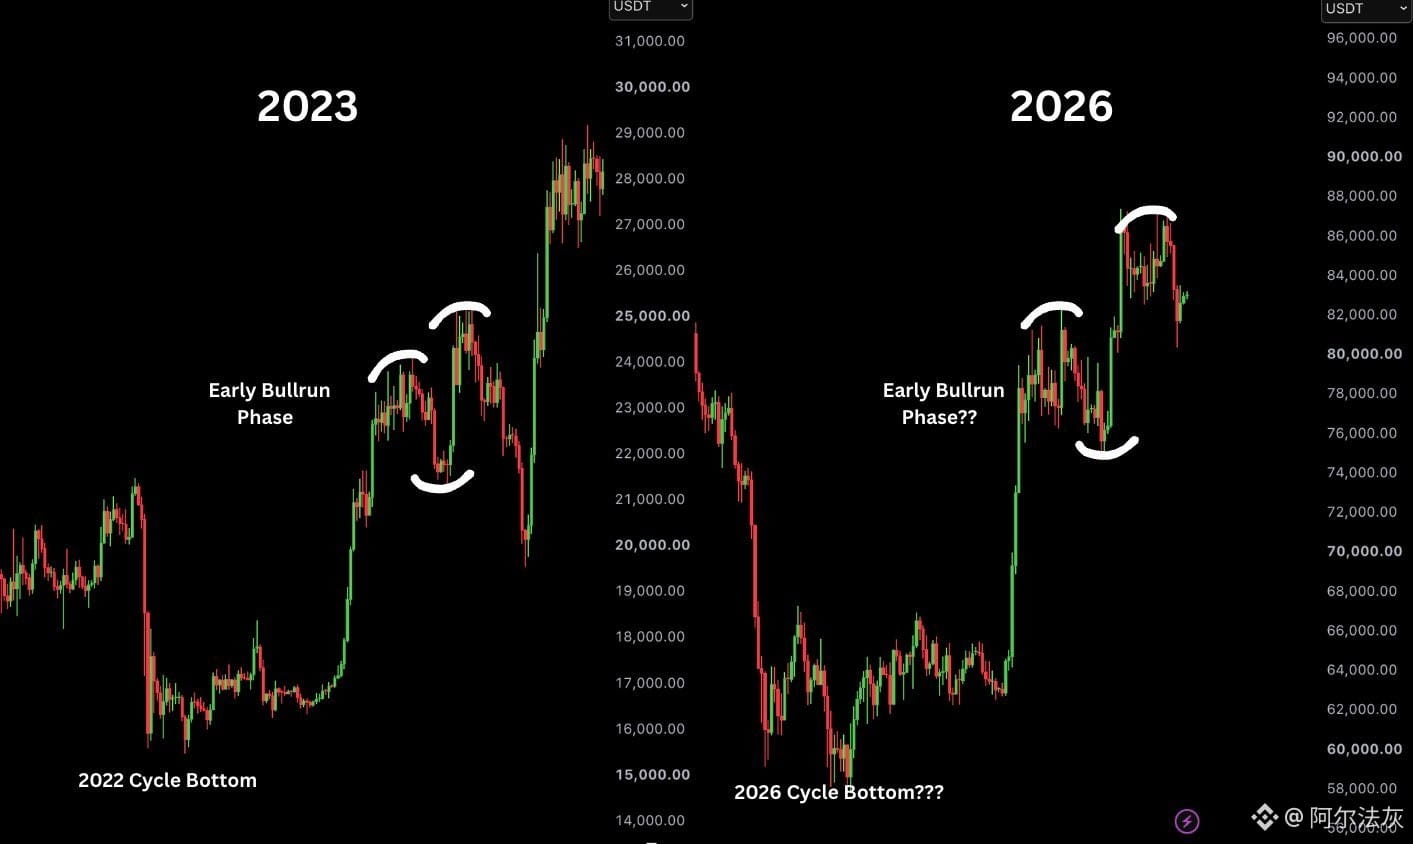
Listen Guys have a look at the below chart the Bitcoin current price action look like early phase of 2023 bull run🔥🚀
Could history be setting up for a repeat?
What do you thing about this mirror phase of bitcoin?
Listen Guys have a look at the below chart the Bitcoin current price action look like early phase of 2023 bull run🔥🚀
Could history be setting up for a repeat?
What do you thing about this mirror phase of bitcoin?
Could history be setting up for a repeat?
What do you thing about this mirror phase of bitcoin?
2
299
·
--
Anyone can copy a someone else trade signal but not everyone can handle pressure when it starts going against to a signal that you follow.
That is where the real difference shows if you don’t understand why you entered every move against you doubt yourself.
Don’t just follow someone else’s trade. Understand the reasoning behind it, because an edge you can’t explain is just someone else’s opinion.
#EthereumSurpasses2500USDT
#StateCouncilCallsForNationalBlockchainNetwork
#XRPLedgerPatchesXRPCreationBug
#TetherFreezesUSDTLinkedToLedgerTheft
#STRKRisesAbout20%In24Hours
1
252
·
--
Рост
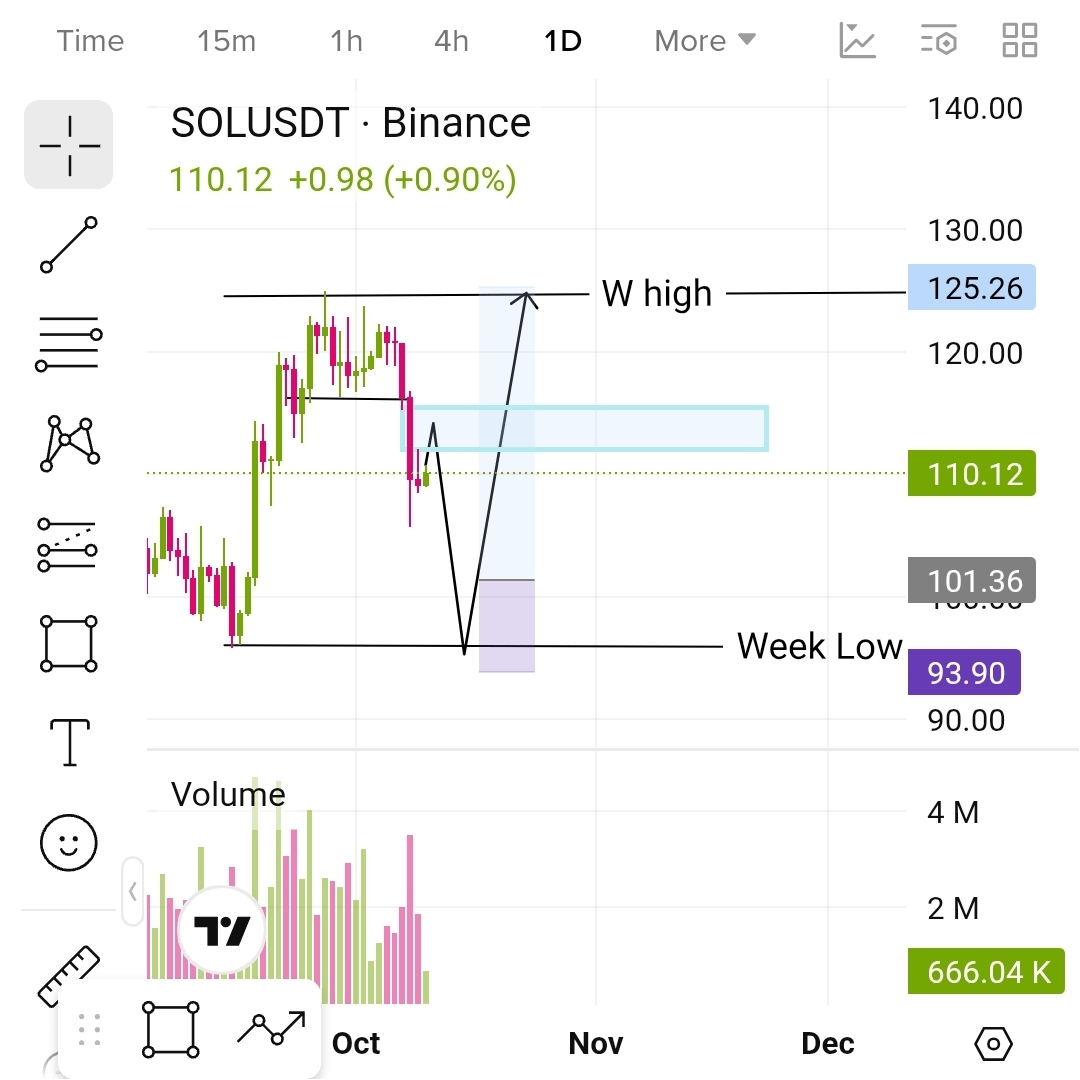
SOL looks bullish at weekly timeframe and bearish at 1 day timeframe📈
$SOL
{spot}(SOLUSDT)
At one day timeframe it has changed its character from bullish to bearish and now it is in correction phase...
it can test its week low which is mark on the chart if you want to go Long then wait for its proper pullback to test its week low.
now you can take a short trade📉 last target will be $100 $95 and $90 here you can again go with long trade after it's change of character and then again target the week high target will be $110 $120 $125🚀🚀
SOL looks bullish at weekly timeframe and bearish at 1 day timeframe📈
$SOL
At one day timeframe it has changed its character from bullish to bearish and now it is in correction phase...
it can test its week low which is mark on the chart if you want to go Long then wait for its proper pullback to test its week low.
now you can take a short trade📉 last target will be $100 $95 and $90 here you can again go with long trade after it's change of character and then again target the week high target will be $110 $120 $125🚀🚀
2
1.4k
Войдите, чтобы посмотреть больше материала
Присоединяйтесь к пользователям криптовалют по всему миру на Binance Square
⚡️ Получайте новейшую и полезную информацию о криптоактивах.
💬 Нам доверяет крупнейшая в мире криптобиржа.
👍 Получите достоверные аналитические данные от верифицированных создателей контента.
Эл. почта/номер телефона
В тренде
EarningsSeason
Просмотров: 6.6M
32,909 обсуждают
Earnings Season Session 3: Will Google & Microsoft Beat Earnings Expectations?
Binance Square Official
·Лайков: 184
·Просмотров: 109.5k
USMidtermElections
Просмотров: 79,440
1,030 обсуждают
StrategySTRCReaches$99.95ForFirstTimeIn165Days
Просмотров: 313
20 обсуждают