

MBE 1
48 Публикации

MBE 1
Отправить жалобу
Заблокировать пользователя
Analyzing narratives and professional trader since 2017
x => https://x.com/0xBatu_
0 подписок(и/а)
0 подписчиков(а)
0 понравилось
Посты
·
--
$ETH | DAILY UPDATE ETH is around $2,357, trying to stabilise after the October decline. The recent low near $2,282 has held so far, but price is still below the support it lost earlier this month. That keeps this in the recovery-attempt stage for me. My first condition is a daily close above $2,406 and a successful hold or retest. The recent $2,392 high sits just below that area, so I want to see buyers work through the whole zone. After that, $2,527 is the next resistance, with $2,580 only coming into focus if that also clears. On the downside, $2,282 is the main support I’m watching. A daily close below it with no recovery would put the $2,200 round-number area on the map. I would treat that as a reference to reassess, not an automatic bounce level. The previous three weekly candles closed lower, and this week’s candle is still open. Holding support helps, but reclaiming lost resistance would give me stronger evidence that the pressure is easing. Hope this helps you with your own charts. 🫶 Give me a follow if you’d like to see more, I’ll keep sharing what I’m watching.
$ETH | DAILY UPDATE ETH is around $2,357, trying to stabilise after the October decline. The recent low near $2,282 has held so far, but price is still below the support it lost earlier this month. That keeps this in the recovery-attempt stage for me. My first condition is a daily close above $2,406 and a successful hold or retest. The recent $2,392 high sits just below that area, so I want to see buyers work through the whole zone. After that, $2,527 is the next resistance, with $2,580 only coming into focus if that also clears. On the downside, $2,282 is the main support I’m watching. A daily close below it with no recovery would put the $2,200 round-number area on the map. I would treat that as a reference to reassess, not an automatic bounce level. The previous three weekly candles closed lower, and this week’s candle is still open. Holding support helps, but reclaiming lost resistance would give me stronger evidence that the pressure is easing. Hope this helps you with your own charts. 🫶 Give me a follow if you’d like to see more, I’ll keep sharing what I’m watching.

·
--
$ARB | DAILY UPDATE ARB is around $0.173 after another test of the $0.162 area. Buyers have defended that region several times this month, but price is still below the levels lost during October’s decline. A bounce alone does not repair that structure. The first improvement I want is a daily close above $0.1786, followed by a hold or retest. That would bring the earlier $0.1884 level into focus. Clearing that as well would make $0.2041 the next larger resistance to watch. The key support is $0.1621, close to the recent lows. If ARB closes below it and cannot reclaim the area, I’d watch the $0.1500 round-number region next. That is a reference area, not a guaranteed floor. The weekly chart still shows a pullback from September’s peak, with successive recovery attempts failing lower. This week’s candle is unfinished. I want buyers to take back resistance before treating the current support defence as a confirmed reversal. Hope this helps you with your own charts. 🫶 Give me a follow if you’d like to see more, I’ll keep sharing what I’m watching.
$ARB | DAILY UPDATE ARB is around $0.173 after another test of the $0.162 area. Buyers have defended that region several times this month, but price is still below the levels lost during October’s decline. A bounce alone does not repair that structure. The first improvement I want is a daily close above $0.1786, followed by a hold or retest. That would bring the earlier $0.1884 level into focus. Clearing that as well would make $0.2041 the next larger resistance to watch. The key support is $0.1621, close to the recent lows. If ARB closes below it and cannot reclaim the area, I’d watch the $0.1500 round-number region next. That is a reference area, not a guaranteed floor. The weekly chart still shows a pullback from September’s peak, with successive recovery attempts failing lower. This week’s candle is unfinished. I want buyers to take back resistance before treating the current support defence as a confirmed reversal. Hope this helps you with your own charts. 🫶 Give me a follow if you’d like to see more, I’ll keep sharing what I’m watching.

·
--
$SOMI | DAILY UPDATE SOMI is around $0.192 after bouncing from $0.1683. Yesterday closed at $0.1954, above the previous $0.1933 hurdle, but today has slipped back below it. That makes the hold more important than the initial breakout. I want to see a daily close back above $0.1933, followed by a successful retest. The recent $0.1978 high is the next test, then $0.2053. Clearing those would bring $0.2210 into focus, where the earlier recovery ran into selling. On a pullback, I am watching the $0.1790 to $0.1810 area. A close below $0.1790 with no recovery would put $0.1683 back on the map. Losing that low would weaken the current rebound considerably. The bounce is encouraging, but the broader sequence of lower highs still needs repairing. Today’s candle and the weekly candle are both open, so I’m keeping the confirmation separate from the possibility. Hope this helps you with your own charts. 🫶 Give me a follow if you’d like to see more, I’ll keep sharing what I’m watching.
$SOMI | DAILY UPDATE SOMI is around $0.192 after bouncing from $0.1683. Yesterday closed at $0.1954, above the previous $0.1933 hurdle, but today has slipped back below it. That makes the hold more important than the initial breakout. I want to see a daily close back above $0.1933, followed by a successful retest. The recent $0.1978 high is the next test, then $0.2053. Clearing those would bring $0.2210 into focus, where the earlier recovery ran into selling. On a pullback, I am watching the $0.1790 to $0.1810 area. A close below $0.1790 with no recovery would put $0.1683 back on the map. Losing that low would weaken the current rebound considerably. The bounce is encouraging, but the broader sequence of lower highs still needs repairing. Today’s candle and the weekly candle are both open, so I’m keeping the confirmation separate from the possibility. Hope this helps you with your own charts. 🫶 Give me a follow if you’d like to see more, I’ll keep sharing what I’m watching.

·
--
$SOL | DAILY UPDATE SOL is around $101.80 and still trying to build support near $100 after the pullback from September’s rally. Buyers have defended the October low so far, but the daily recovery highs are still getting lower. My first condition is a daily close above $103.85 and a successful hold or retest. That would put the earlier $105.71 level back in focus. Clearing that as well would make $109.20 the next meaningful resistance. The main support I’m watching is $98.62. If SOL closes below it and cannot recover, the September base near $95.82 comes back into view. Holding $100 during the day would not cancel that risk on its own. This week’s candle is still open and remains inside last week’s range so far. I want to see buyers take back a recovery high before treating the current base as a confirmed reversal. Hope this helps you with your own charts. 🫶 Give me a follow if you’d like to see more, I’ll keep sharing what I’m watching.
$SOL | DAILY UPDATE SOL is around $101.80 and still trying to build support near $100 after the pullback from September’s rally. Buyers have defended the October low so far, but the daily recovery highs are still getting lower. My first condition is a daily close above $103.85 and a successful hold or retest. That would put the earlier $105.71 level back in focus. Clearing that as well would make $109.20 the next meaningful resistance. The main support I’m watching is $98.62. If SOL closes below it and cannot recover, the September base near $95.82 comes back into view. Holding $100 during the day would not cancel that risk on its own. This week’s candle is still open and remains inside last week’s range so far. I want to see buyers take back a recovery high before treating the current base as a confirmed reversal. Hope this helps you with your own charts. 🫶 Give me a follow if you’d like to see more, I’ll keep sharing what I’m watching.

·
--
TOTAL3 | DAILY UPDATE TOTAL3 is around $772B after retreating from the September area near $855B. This index excludes Bitcoin and Ethereum, so I use it to follow the market beyond those two largest assets. The $750B area is the first support I’m watching. Holding it would give the market room to rebuild, but I want a daily close above $795B and a successful retest before calling the recovery more convincing. Above $795B, $825B is the next resistance. If that also clears and holds, the larger $855B region becomes relevant again. A brief move above one level would not confirm the whole recovery. If $750B breaks and the index cannot recover it, I’d watch the broader $720B base. The weekly chart is still dealing with the pullback from its September recovery high, and this week’s candle is unfinished. I want stronger closes before assuming broad altcoin strength has returned. Hope this helps you with your own charts. 🫶 Give me a follow if you’d like to see more, I’ll keep sharing what I’m watching.
TOTAL3 | DAILY UPDATE TOTAL3 is around $772B after retreating from the September area near $855B. This index excludes Bitcoin and Ethereum, so I use it to follow the market beyond those two largest assets. The $750B area is the first support I’m watching. Holding it would give the market room to rebuild, but I want a daily close above $795B and a successful retest before calling the recovery more convincing. Above $795B, $825B is the next resistance. If that also clears and holds, the larger $855B region becomes relevant again. A brief move above one level would not confirm the whole recovery. If $750B breaks and the index cannot recover it, I’d watch the broader $720B base. The weekly chart is still dealing with the pullback from its September recovery high, and this week’s candle is unfinished. I want stronger closes before assuming broad altcoin strength has returned. Hope this helps you with your own charts. 🫶 Give me a follow if you’d like to see more, I’ll keep sharing what I’m watching.

·
--
TOTAL2 | DAILY UPDATE TOTAL2 is around $1.06T, holding above the $1.03T support area after pulling back from roughly $1.20T. This is TradingView’s crypto market-cap index excluding Bitcoin, not the price of a tradable coin. The first improvement I want is a daily close above $1.08T, followed by a successful hold or retest. After that, $1.11T is the next resistance. Clearing that area would put the larger $1.20T zone back on the map. If $1.03T breaks and the index cannot recover it, I’d watch the $1.00T base. That would weaken the current support test and leave the broader recovery looking less secure. The weekly pullback has not yet turned into a confirmed reversal. I’m watching whether the market can rebuild above these lost levels before calling for a broader altcoin recovery. A rise in TOTAL2 alone would not prove that every altcoin is outperforming Bitcoin. Hope this helps you with your own charts. 🫶 Give me a follow if you’d like to see more, I’ll keep sharing what I’m watching.
TOTAL2 | DAILY UPDATE TOTAL2 is around $1.06T, holding above the $1.03T support area after pulling back from roughly $1.20T. This is TradingView’s crypto market-cap index excluding Bitcoin, not the price of a tradable coin. The first improvement I want is a daily close above $1.08T, followed by a successful hold or retest. After that, $1.11T is the next resistance. Clearing that area would put the larger $1.20T zone back on the map. If $1.03T breaks and the index cannot recover it, I’d watch the $1.00T base. That would weaken the current support test and leave the broader recovery looking less secure. The weekly pullback has not yet turned into a confirmed reversal. I’m watching whether the market can rebuild above these lost levels before calling for a broader altcoin recovery. A rise in TOTAL2 alone would not prove that every altcoin is outperforming Bitcoin. Hope this helps you with your own charts. 🫶 Give me a follow if you’d like to see more, I’ll keep sharing what I’m watching.

27
·
--
$ZEC | DAILY UPDATE ZEC is back around $1,300 after recovering from the October low near $1,049. The rebound is holding above last week’s close, but buyers are still trading below the recent recovery highs. The first level I want to see cleared is $1,331 on a daily close, followed by a successful hold or retest. After that, the $1,368–$1,385 resistance area matters. Clearing that cluster would make the late-September region around $1,495 more relevant again. On the downside, $1,178 is this week’s support reference. If it breaks and ZEC cannot reclaim it, I’d watch the earlier $1,110–$1,119 area. Losing support would weaken the current rebound rather than confirm that the low is safely behind us. The weekly candle is still open. It has a higher low so far, but its high remains below last week’s high. I’m watching whether buyers can turn that recovery into a stronger close. Hope this helps you with your own charts. 🫶 Give me a follow if you’d like to see more, I’ll keep sharing what I’m watching.
$ZEC | DAILY UPDATE ZEC is back around $1,300 after recovering from the October low near $1,049. The rebound is holding above last week’s close, but buyers are still trading below the recent recovery highs. The first level I want to see cleared is $1,331 on a daily close, followed by a successful hold or retest. After that, the $1,368–$1,385 resistance area matters. Clearing that cluster would make the late-September region around $1,495 more relevant again. On the downside, $1,178 is this week’s support reference. If it breaks and ZEC cannot reclaim it, I’d watch the earlier $1,110–$1,119 area. Losing support would weaken the current rebound rather than confirm that the low is safely behind us. The weekly candle is still open. It has a higher low so far, but its high remains below last week’s high. I’m watching whether buyers can turn that recovery into a stronger close. Hope this helps you with your own charts. 🫶 Give me a follow if you’d like to see more, I’ll keep sharing what I’m watching.

27
·
--
$TRX | DAILY UPDATE TRX is around $0.3314 and still moving inside a fairly tight October range. The $0.3270 support area has held several tests, while buyers have struggled to build a recovery above $0.3334. A daily close above $0.3334, followed by a successful hold or retest, would be the first improvement I’m watching. The next resistance is $0.3372. Clearing that would put the late-September $0.3409 high back in focus. If $0.3270 breaks and TRX cannot recover it, I’d watch the September base near $0.3217. Until support actually fails, I would treat that as an alternative scenario rather than assume the range is already breaking down. The weekly candles are overlapping rather than showing a decisive new trend. This week’s candle is also unfinished, so I’m waiting for price to leave the range and defend the move before taking a stronger view. Hope this helps you with your own charts. 🫶 Give me a follow if you’d like to see more, I’ll keep sharing what I’m watching.
$TRX | DAILY UPDATE TRX is around $0.3314 and still moving inside a fairly tight October range. The $0.3270 support area has held several tests, while buyers have struggled to build a recovery above $0.3334. A daily close above $0.3334, followed by a successful hold or retest, would be the first improvement I’m watching. The next resistance is $0.3372. Clearing that would put the late-September $0.3409 high back in focus. If $0.3270 breaks and TRX cannot recover it, I’d watch the September base near $0.3217. Until support actually fails, I would treat that as an alternative scenario rather than assume the range is already breaking down. The weekly candles are overlapping rather than showing a decisive new trend. This week’s candle is also unfinished, so I’m waiting for price to leave the range and defend the move before taking a stronger view. Hope this helps you with your own charts. 🫶 Give me a follow if you’d like to see more, I’ll keep sharing what I’m watching.

46
·
--
$DOGE | DAILY UPDATE DOGE is back around $0.080 after bouncing from the October low near $0.07478. The recovery is making progress, but it is still approaching resistance rather than breaking into a clear uptrend. I want to see a daily close above $0.08090 and a successful hold or retest. That would bring $0.08380 back into focus. If buyers clear that recovery high too, $0.08814 is the next larger level I’m watching. The first support area is around $0.07600, where the early-week pullback found buyers. If that level fails and DOGE cannot get back above it, the $0.07480 October low becomes the next test. This week is recovering from last week’s weakness, but the weekly candle is still open. For me, a stronger close and defended support would say more than a quick move above resistance during the day. Hope this helps you with your own charts. 🫶 Give me a follow if you’d like to see more, I’ll keep sharing what I’m watching.
$DOGE | DAILY UPDATE DOGE is back around $0.080 after bouncing from the October low near $0.07478. The recovery is making progress, but it is still approaching resistance rather than breaking into a clear uptrend. I want to see a daily close above $0.08090 and a successful hold or retest. That would bring $0.08380 back into focus. If buyers clear that recovery high too, $0.08814 is the next larger level I’m watching. The first support area is around $0.07600, where the early-week pullback found buyers. If that level fails and DOGE cannot get back above it, the $0.07480 October low becomes the next test. This week is recovering from last week’s weakness, but the weekly candle is still open. For me, a stronger close and defended support would say more than a quick move above resistance during the day. Hope this helps you with your own charts. 🫶 Give me a follow if you’d like to see more, I’ll keep sharing what I’m watching.

51
·
--
$HYPE | DAILY UPDATE HYPE has pushed back above $90 after recovering sharply from the October low near $74.45. The move has taken back several lost levels, but today’s daily candle is still open. The first area I want buyers to defend is $88.12. Holding it on a daily close and a later retest would make this recovery more convincing. Today’s high near $92.15 is the immediate hurdle, with $95.25 the next larger resistance if that level clears. If HYPE falls back below $88.12 and cannot recover it, I’d watch $82.54. Losing that area as well would bring the recent $79.55 region back into focus. A strong green candle still needs support underneath it. This week’s rebound is substantial, but the weekly candle is unfinished. Binance’s spot history for this pair is also short, so I’m keeping the analysis tied to the levels we can actually observe. Hope this helps you with your own charts. 🫶 Give me a follow if you’d like to see more, I’ll keep sharing what I’m watching.
$HYPE | DAILY UPDATE HYPE has pushed back above $90 after recovering sharply from the October low near $74.45. The move has taken back several lost levels, but today’s daily candle is still open. The first area I want buyers to defend is $88.12. Holding it on a daily close and a later retest would make this recovery more convincing. Today’s high near $92.15 is the immediate hurdle, with $95.25 the next larger resistance if that level clears. If HYPE falls back below $88.12 and cannot recover it, I’d watch $82.54. Losing that area as well would bring the recent $79.55 region back into focus. A strong green candle still needs support underneath it. This week’s rebound is substantial, but the weekly candle is unfinished. Binance’s spot history for this pair is also short, so I’m keeping the analysis tied to the levels we can actually observe. Hope this helps you with your own charts. 🫶 Give me a follow if you’d like to see more, I’ll keep sharing what I’m watching.

75
·
--
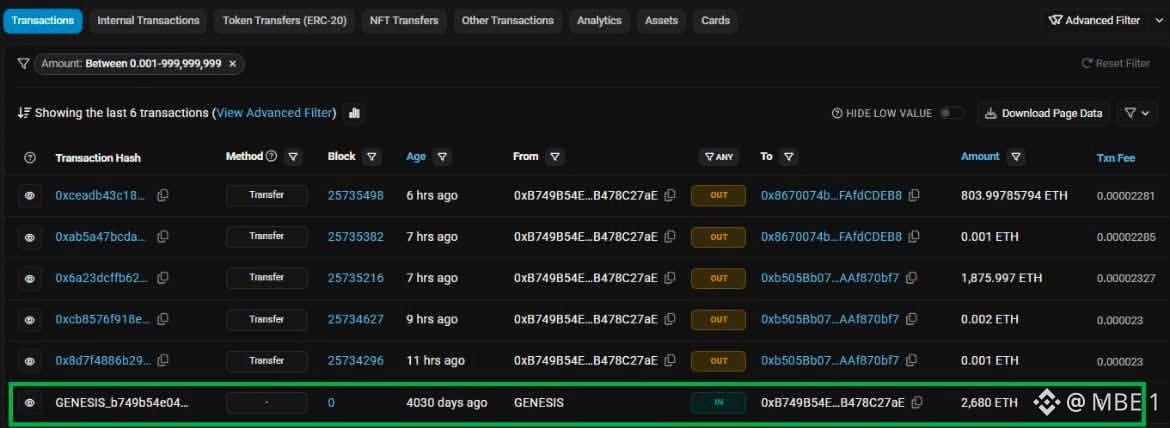
Someone bought 2,680 $ETH for just $831 in 2015.
Held it for 11 years and didn't sell despite several big crashes.
Today, he moved his holdings, which are now worth $5,000,000.
Someone bought 2,680 $ETH for just $831 in 2015.
Held it for 11 years and didn't sell despite several big crashes.
Today, he moved his holdings, which are now worth $5,000,000.
Held it for 11 years and didn't sell despite several big crashes.
Today, he moved his holdings, which are now worth $5,000,000.
61
·
--
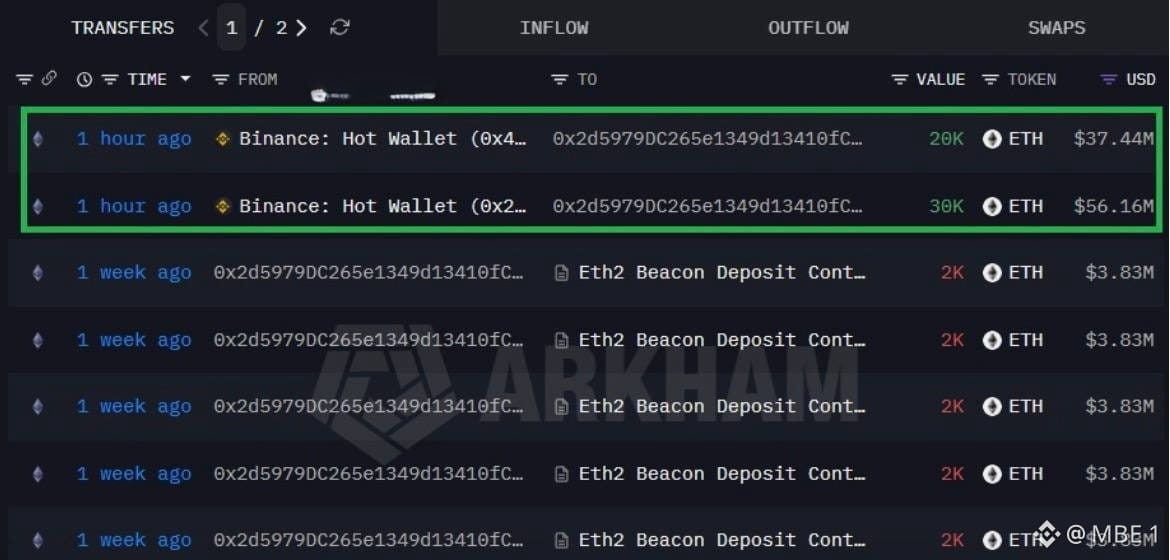
JUST IN: Someone just bought $93,600,000 in $ETH on Binance
JUST IN: Someone just bought $93,600,000 in $ETH on Binance
76
·
--
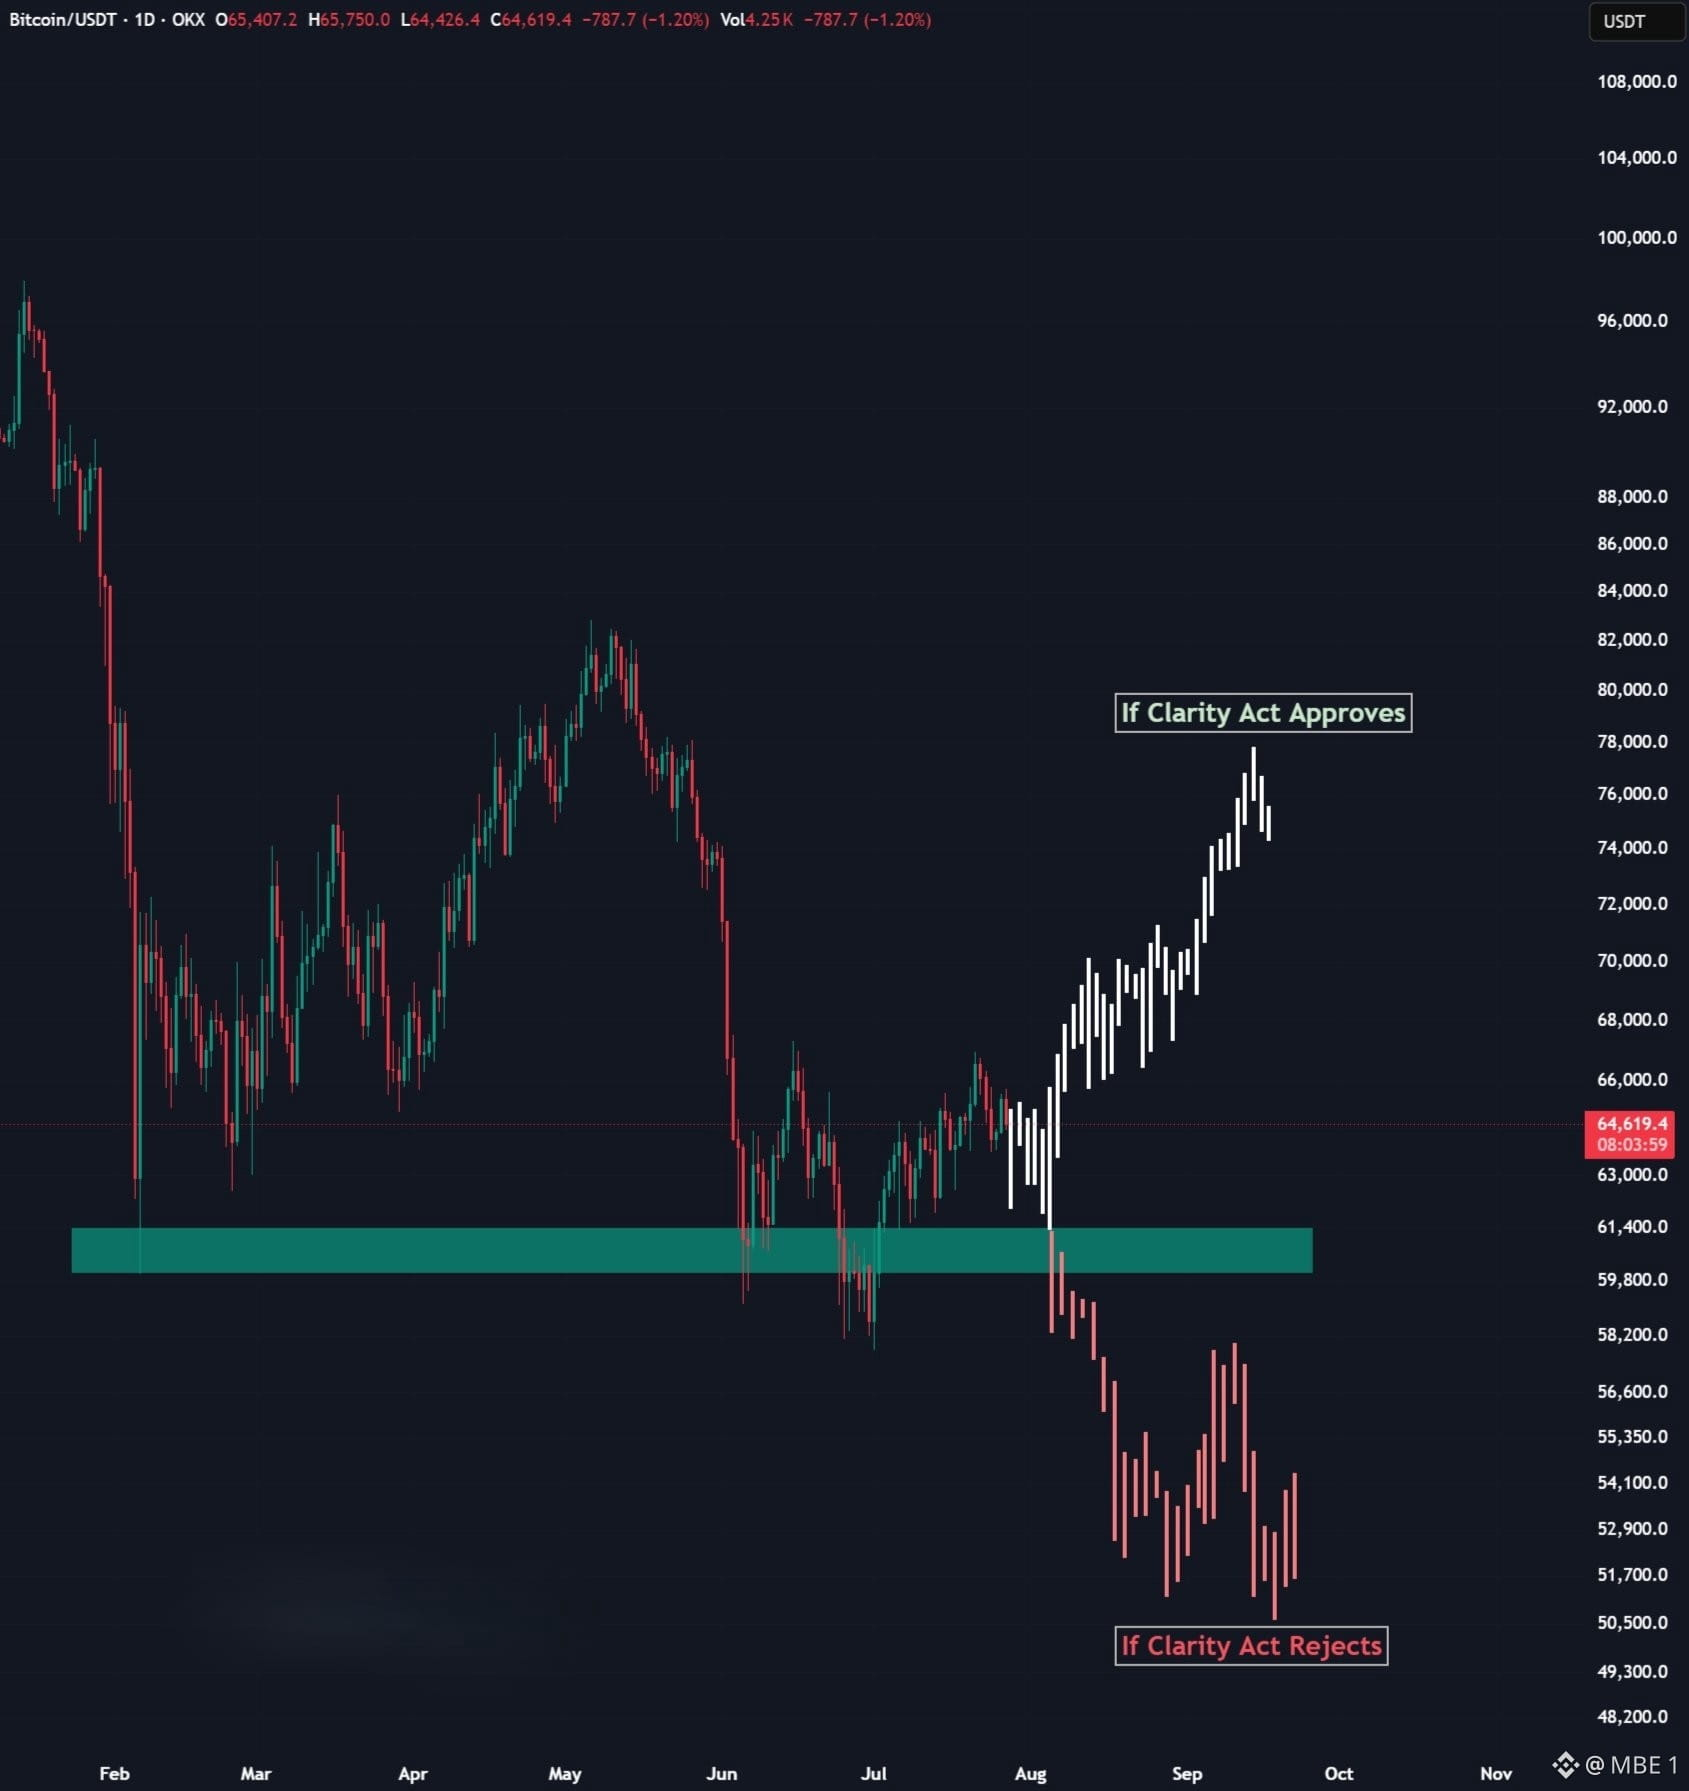
$BTC
next move is mostly dependent on the Clarity Act.
If approved, Bitcoin could rally to $75,000 or higher.
If rejected, BTC could head towards $50,000.
$BTC
next move is mostly dependent on the Clarity Act.
If approved, Bitcoin could rally to $75,000 or higher.
If rejected, BTC could head towards $50,000.
next move is mostly dependent on the Clarity Act.
If approved, Bitcoin could rally to $75,000 or higher.
If rejected, BTC could head towards $50,000.
83
·
--
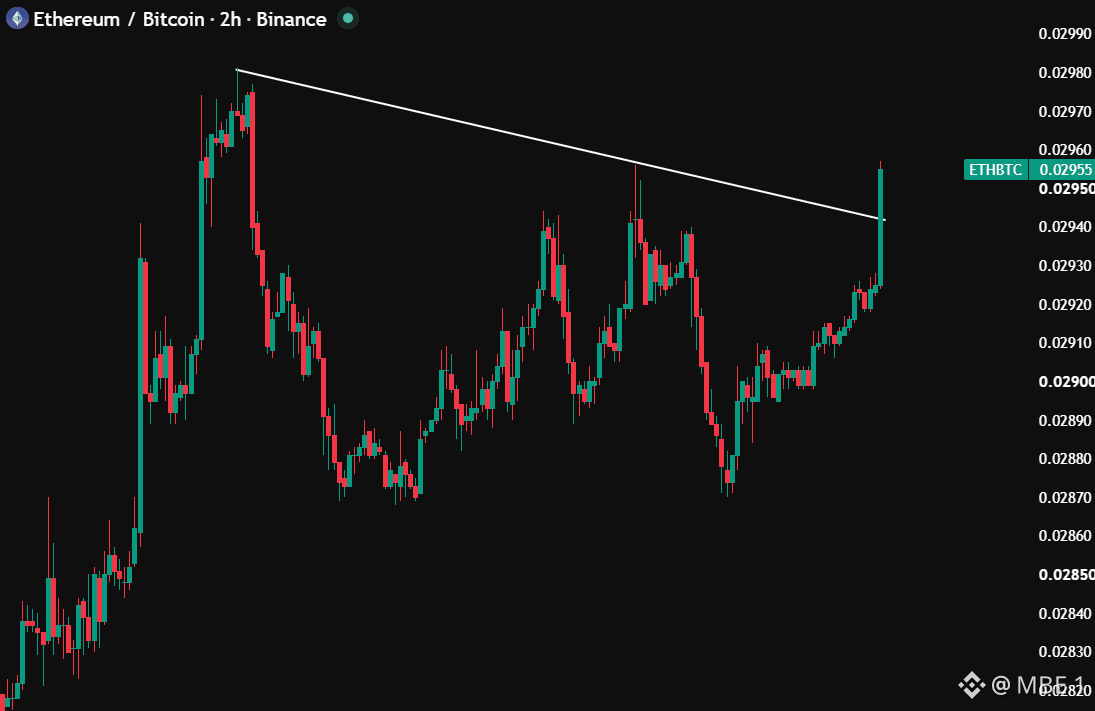
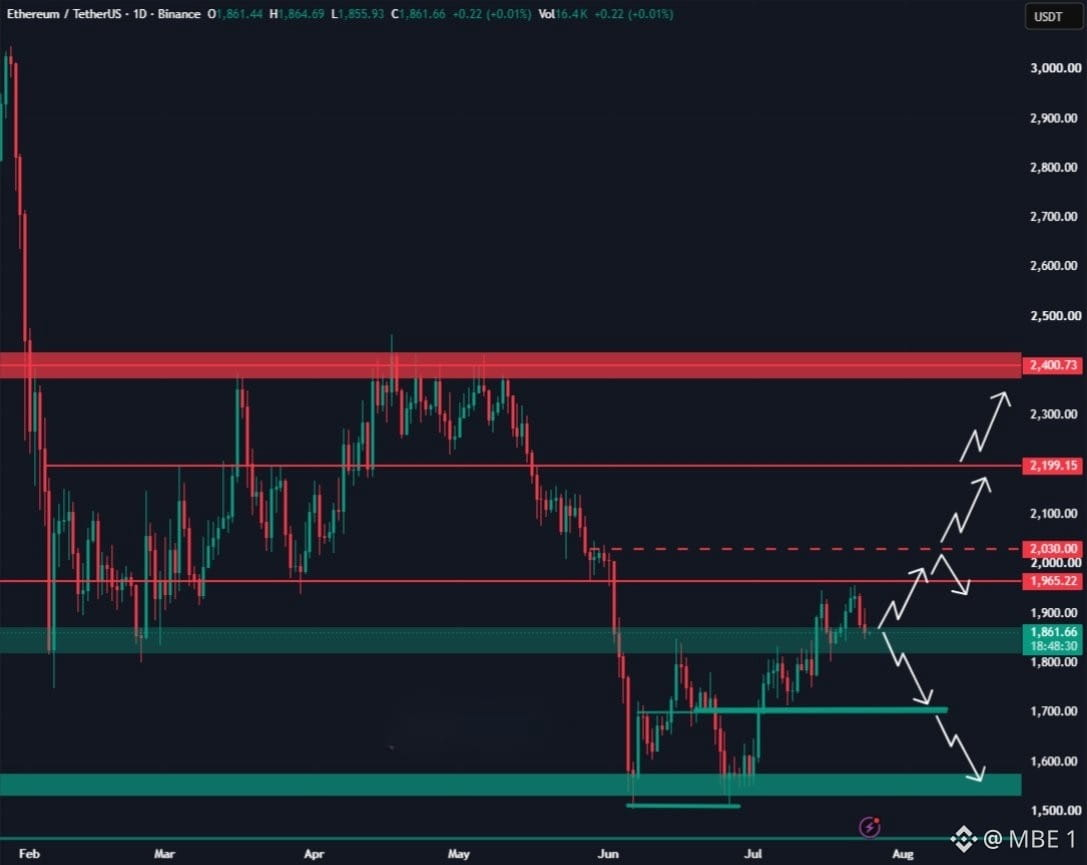
$ETH continues to hold above its key support area.
Ethereum is showing stronger momentum than Bitcoin, and the current rally may still have more room to run.
$ETH continues to hold above its key support area.
Ethereum is showing stronger momentum than Bitcoin, and the current rally may still have more room to run.
Ethereum is showing stronger momentum than Bitcoin, and the current rally may still have more room to run.
63
·
--
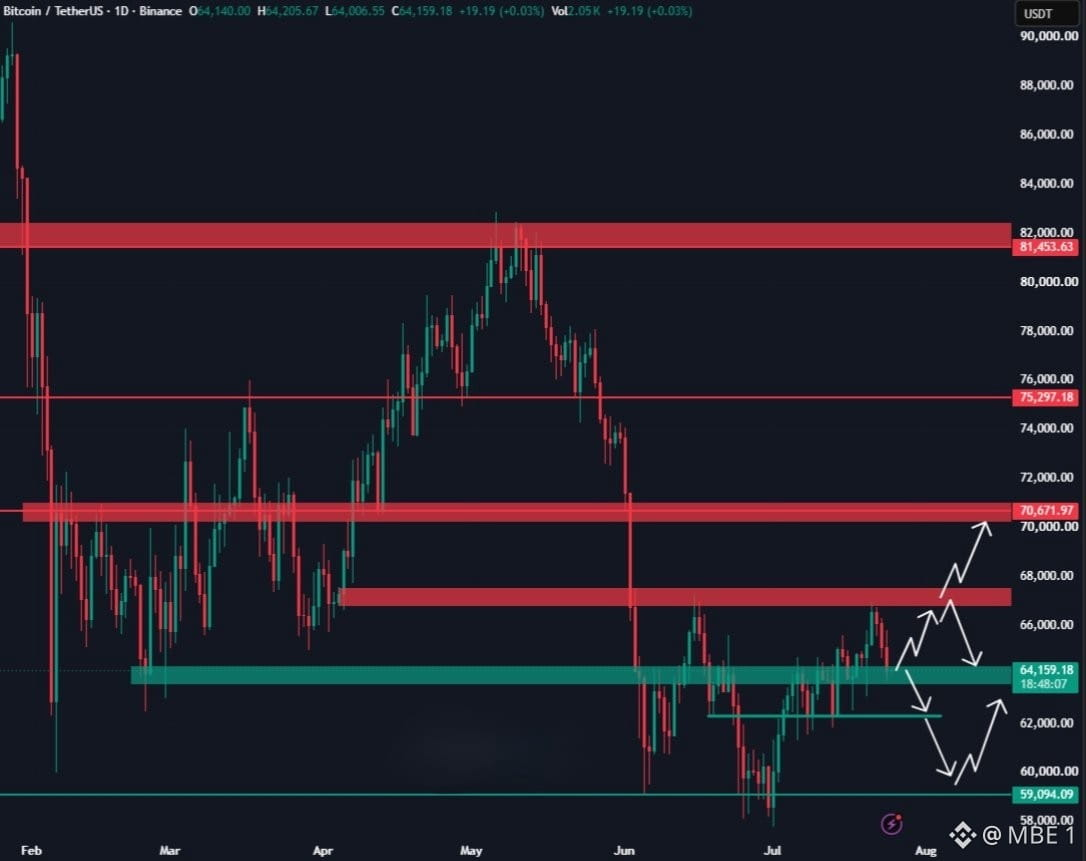
$BTC has broken below the $65,000 support level.
The next important area is $62,500–$63,000. Holding this zone could set the stage for Bitcoin’s next move higher.
$BTC has broken below the $65,000 support level.
The next important area is $62,500–$63,000. Holding this zone could set the stage for Bitcoin’s next move higher.
The next important area is $62,500–$63,000. Holding this zone could set the stage for Bitcoin’s next move higher.
91
·
--
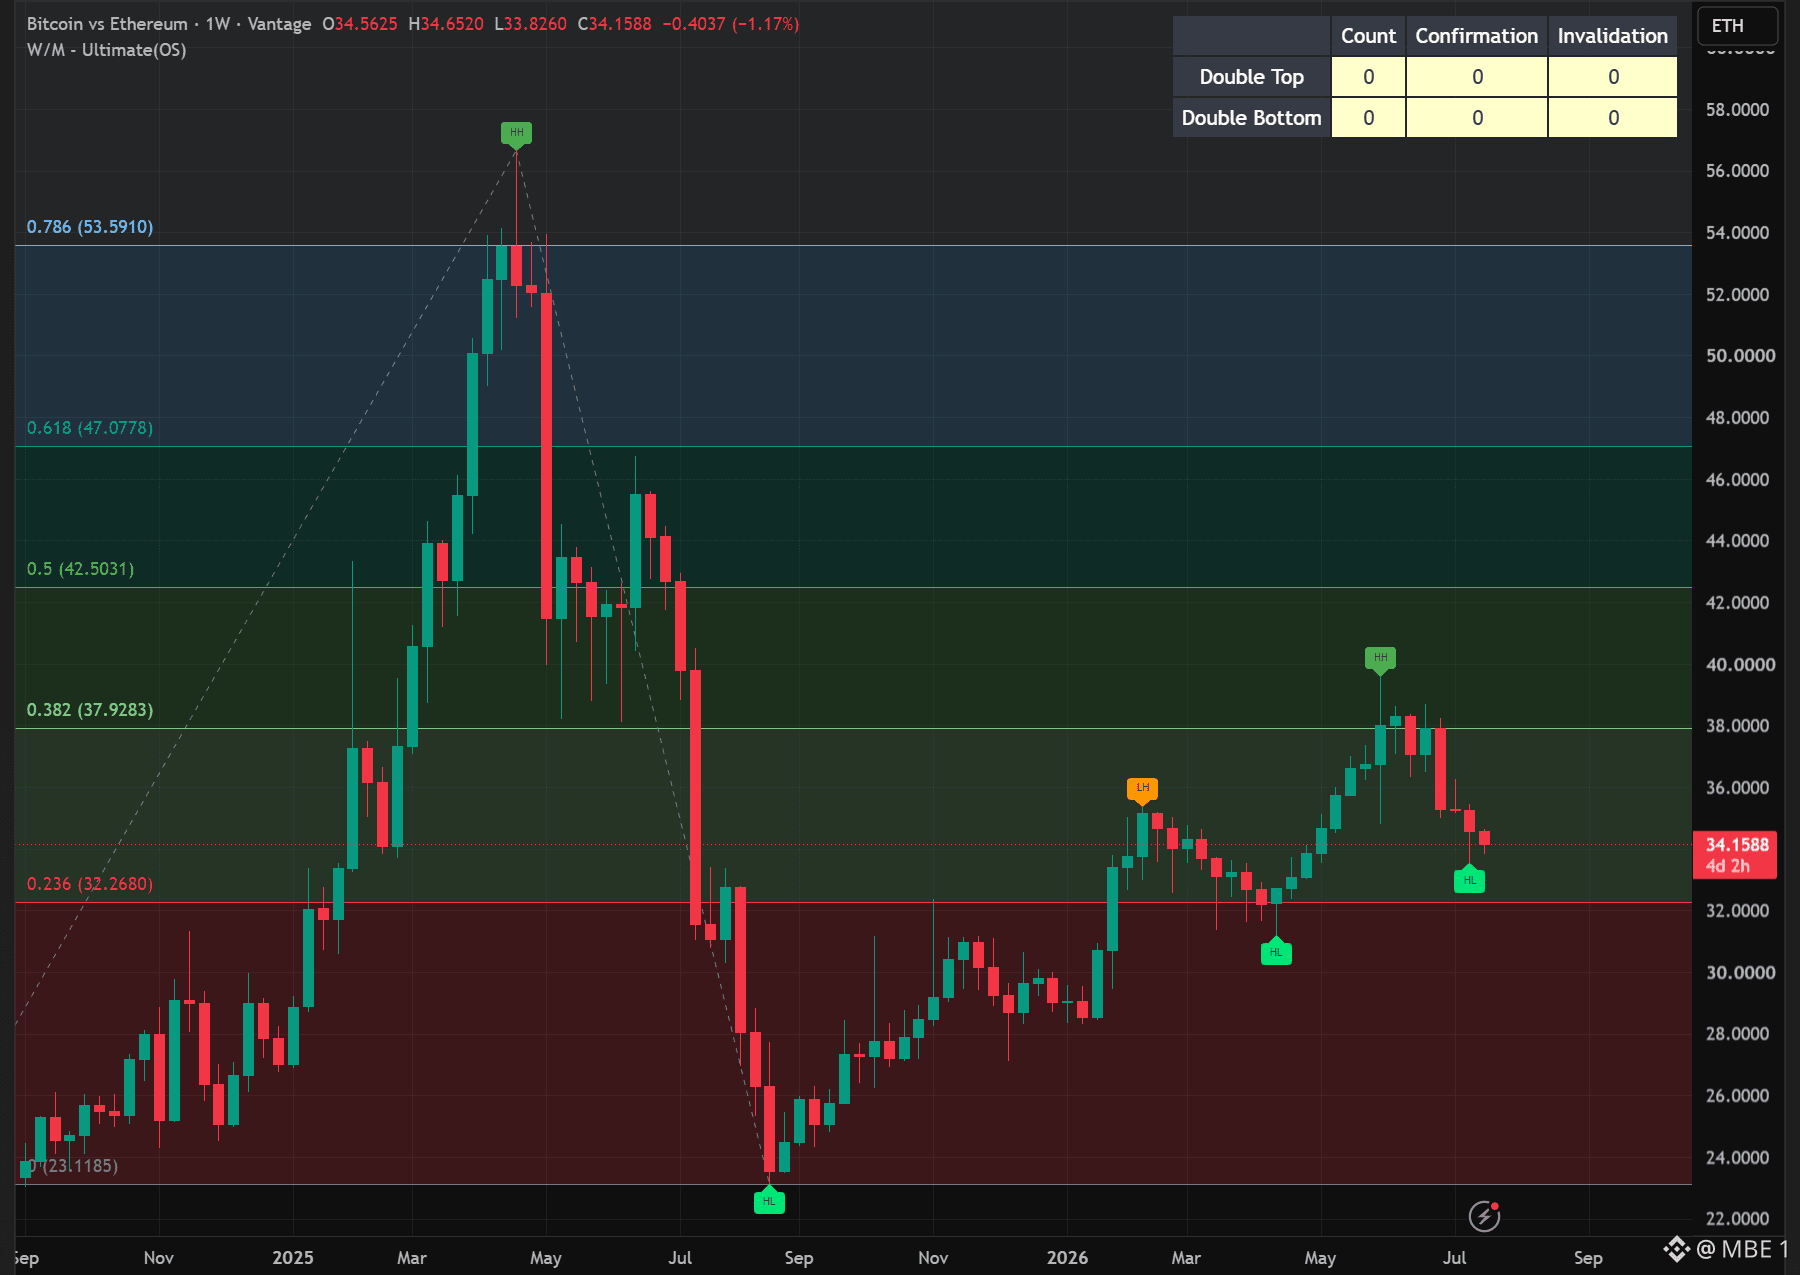
Ethereum ETFs recorded approximately $196 million in net inflows between July 14 and July 21, suggesting that institutional interest in ETH is beginning to return. However, Bitcoin ETFs attracted roughly $727 million within a week, meaning Bitcoin remains the primary destination for institutional capital. ETH ETF flows · BTC ETF flows There are three possible scenarios: If $BTC consolidates between $68K and $70K: This would create the ideal environment for ETH to catch up, potentially allowing ETH/BTC to break above 0.030. If BTC moves above $70K too quickly: Capital may remain concentrated in Bitcoin. $ETH could still rise in dollar terms while continuing to struggle against BTC. If the market returns to risk-off conditions: Ethereum may underperform Bitcoin because it is generally treated as the higher-risk asset. My view: ETH/BTC has started recovering from the bottom, but I want to see a weekly close above 0.030 before confirming Ethereum’s relative strength. If that happens, a move toward 0.032–0.035 would become more likely, along with a broader recovery across the altcoin market. For now, the outlook is early positive, but not yet confirmed. #Macro Insights# #BTC Price Analysis#
Ethereum ETFs recorded approximately $196 million in net inflows between July 14 and July 21, suggesting that institutional interest in ETH is beginning to return. However, Bitcoin ETFs attracted roughly $727 million within a week, meaning Bitcoin remains the primary destination for institutional capital. ETH ETF flows · BTC ETF flows There are three possible scenarios: If $BTC consolidates between $68K and $70K: This would create the ideal environment for ETH to catch up, potentially allowing ETH/BTC to break above 0.030. If BTC moves above $70K too quickly: Capital may remain concentrated in Bitcoin. $ETH could still rise in dollar terms while continuing to struggle against BTC. If the market returns to risk-off conditions: Ethereum may underperform Bitcoin because it is generally treated as the higher-risk asset. My view: ETH/BTC has started recovering from the bottom, but I want to see a weekly close above 0.030 before confirming Ethereum’s relative strength. If that happens, a move toward 0.032–0.035 would become more likely, along with a broader recovery across the altcoin market. For now, the outlook is early positive, but not yet confirmed. #Macro Insights# #BTC Price Analysis#
65
·
--
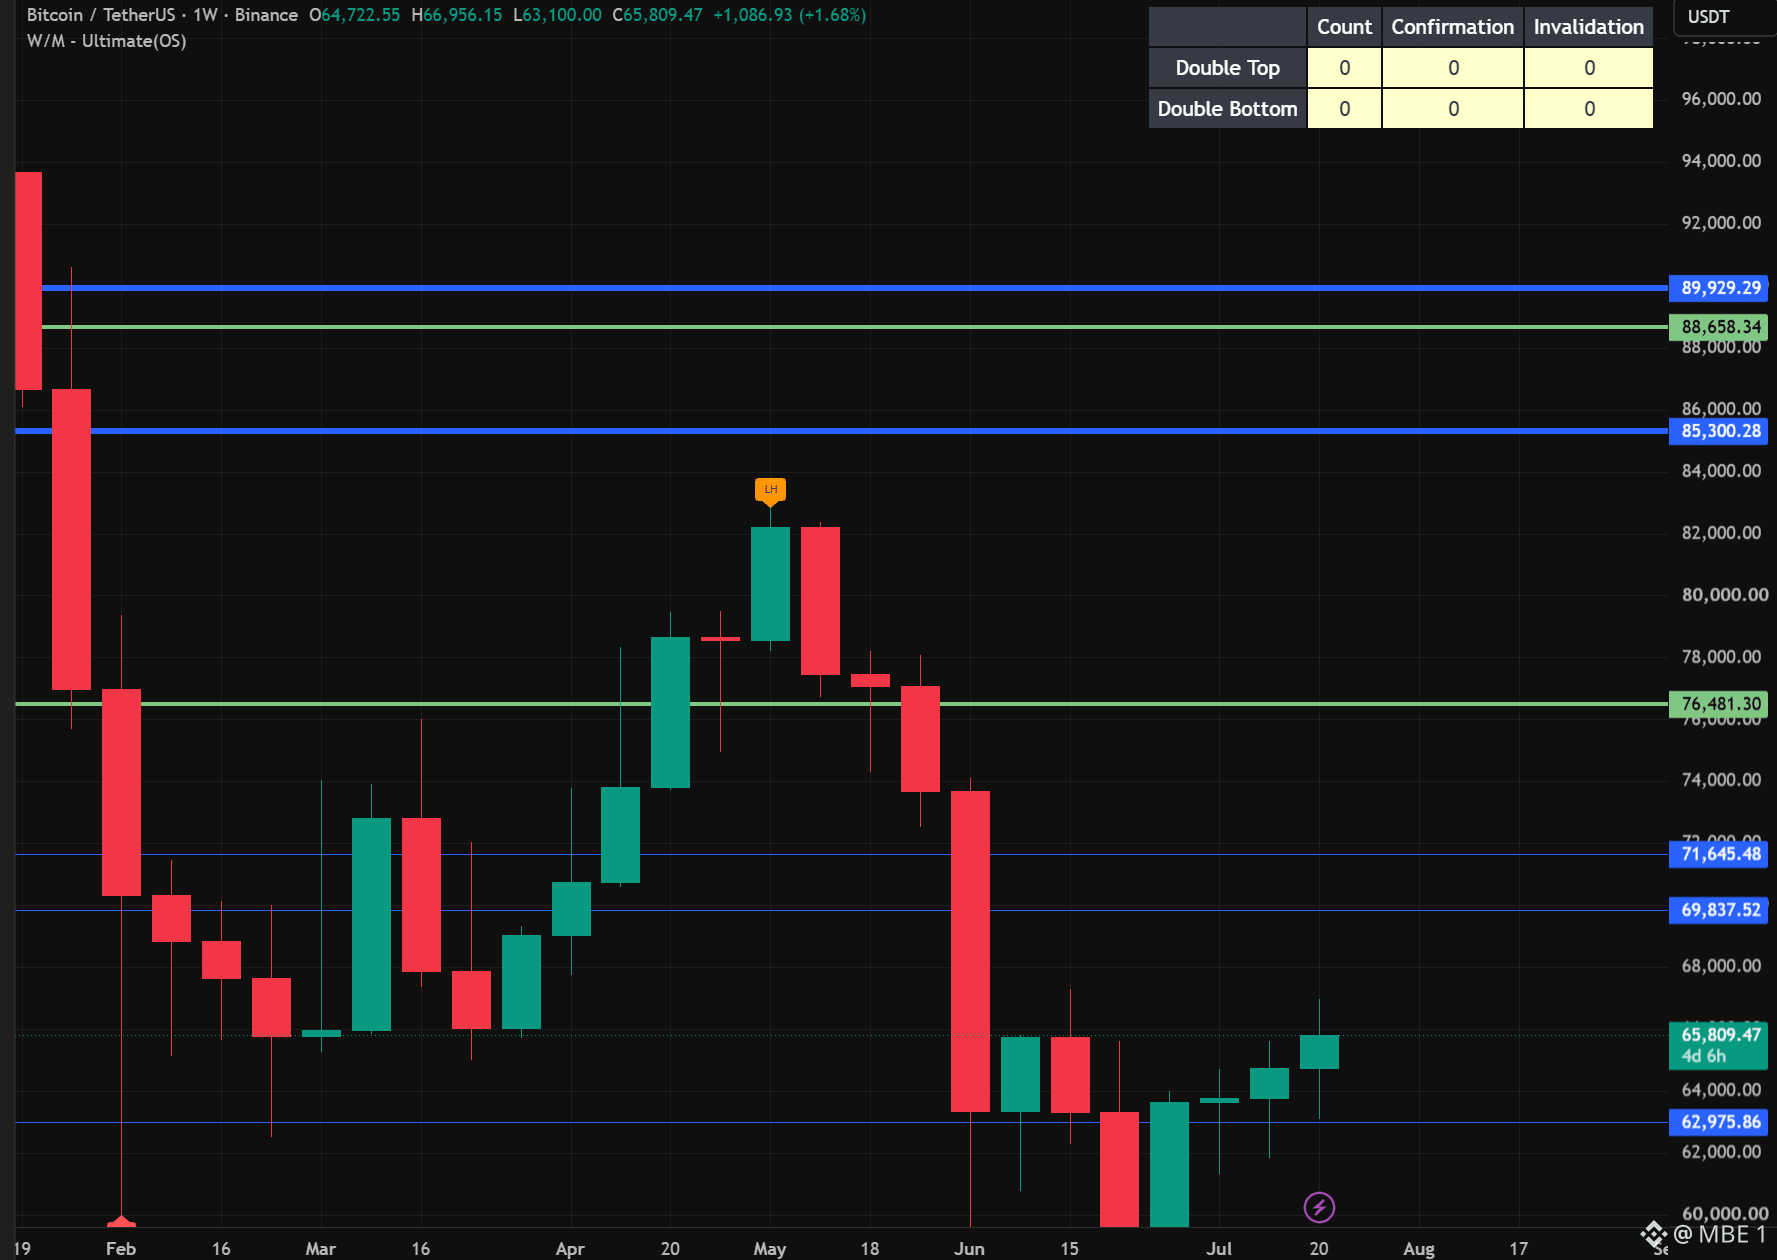
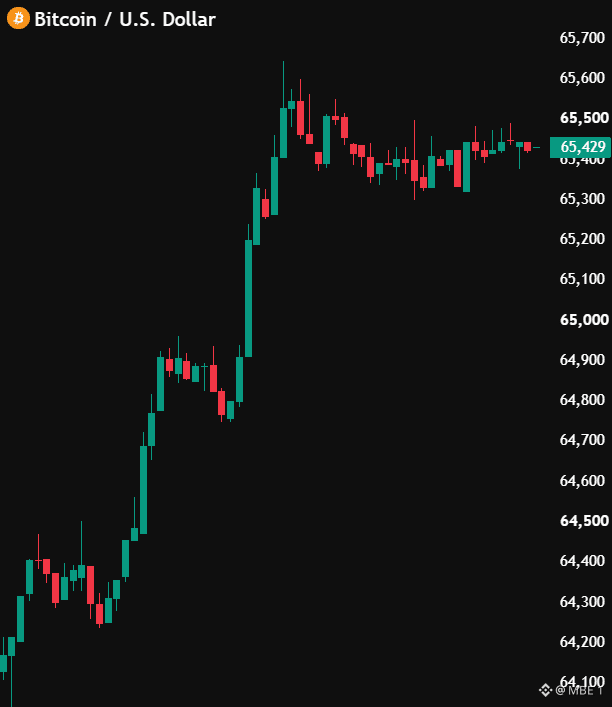
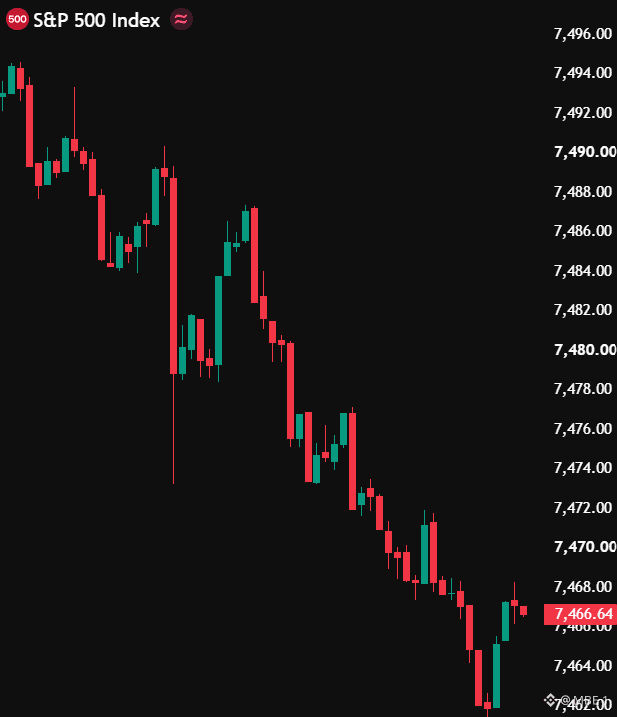
$BTC is showing real strength, supported by renewed spot ETF inflows. However, these inflows have not yet recovered the heavy outflows recorded during May and June. As long as BTC holds $64,500–$65,000, the short-term direction remains positive. A clean break above $68,000 would open the way toward $70,000–$70,700. That is the real confirmation zone. A daily or weekly close above it could extend the recovery toward $74,000–$75,000. The main risk is macro. Rising oil prices, geopolitical tension and the upcoming Fed meeting could create volatility. If BTC breaks resistance while ETF inflows continue, I would trust the move. If inflows weaken while oil and yields rise, the breakout could fail. My view: Bitcoin is building a bullish reversal, but the full trend change is not confirmed yet. Above $70,700, the picture becomes much stronger.
$BTC is showing real strength, supported by renewed spot ETF inflows. However, these inflows have not yet recovered the heavy outflows recorded during May and June. As long as BTC holds $64,500–$65,000, the short-term direction remains positive. A clean break above $68,000 would open the way toward $70,000–$70,700. That is the real confirmation zone. A daily or weekly close above it could extend the recovery toward $74,000–$75,000. The main risk is macro. Rising oil prices, geopolitical tension and the upcoming Fed meeting could create volatility. If BTC breaks resistance while ETF inflows continue, I would trust the move. If inflows weaken while oil and yields rise, the breakout could fail. My view: Bitcoin is building a bullish reversal, but the full trend change is not confirmed yet. Above $70,700, the picture becomes much stronger.
80
·
--
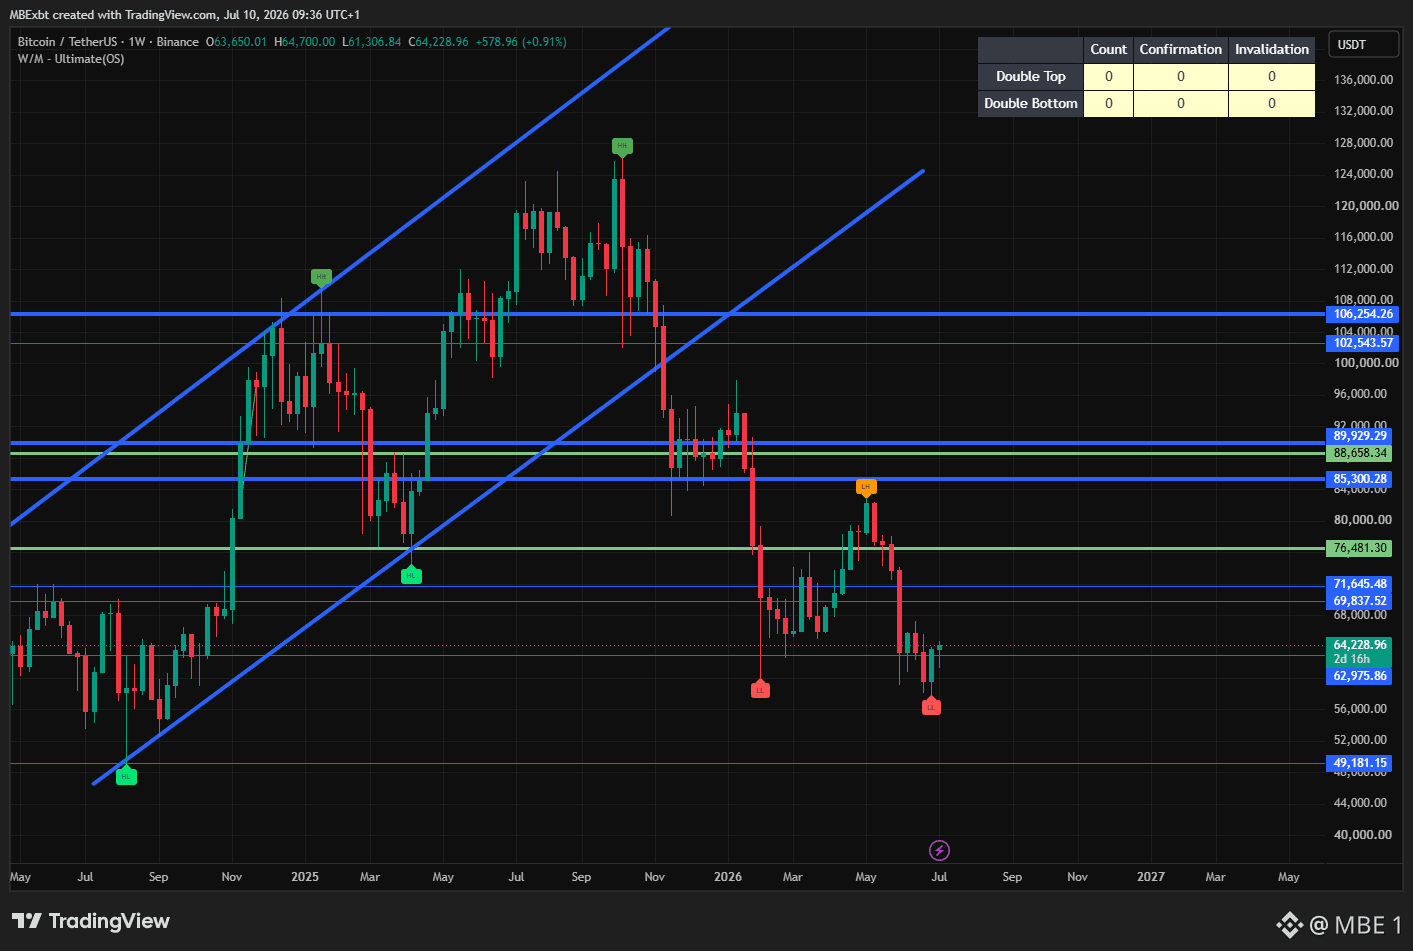
$BTC Do you see that massive "W" forming on the weekly chart? The setup looks great, but global tensions and macro fears are holding the market back. If the world calms down a bit and we get some good news, this pattern could play out perfectly. The real momentum starts above the $70K - $72K zone. If we break that, the price could shoot up fast. For now, avoid FOMO and just keep watching the chart and the headlines. #BTC Price Analysis# #Macro Insights#
$BTC Do you see that massive "W" forming on the weekly chart? The setup looks great, but global tensions and macro fears are holding the market back. If the world calms down a bit and we get some good news, this pattern could play out perfectly. The real momentum starts above the $70K - $72K zone. If we break that, the price could shoot up fast. For now, avoid FOMO and just keep watching the chart and the headlines. #BTC Price Analysis# #Macro Insights#
75
Войдите, чтобы посмотреть больше материала
Присоединяйтесь к пользователям криптовалют по всему миру на Binance Square
⚡️ Получайте новейшую и полезную информацию о криптоактивах.
💬 Нам доверяет крупнейшая в мире криптобиржа.
👍 Получите достоверные аналитические данные от верифицированных создателей контента.
Эл. почта/номер телефона
В тренде
UniswapA16zSeekDeFiExemptionFromIllinoisCryptoTax
Просмотров: 12,510
559 обсуждают
The debate over crypto taxation is heating up as Uniswap and Andreessen Horowitz ( a16z ) push for a DeFi exemption from Illinois proposed crypto tax rules. Their concern is that decentralized finance protocols and non custodial platforms could face unfair tax burdens potentially slowing innovation and making crypto development more difficult. DeFi platforms allow users to trade and manage digital assets without traditional intermediaries so applying conventional financial tax rules may create serious challenges. This could become an important moment for the US crypto industry as regulators must find a balance between fair taxation, investor protection, and innovation. 🚀
The main concern is that the proposed 0.2% tax is calculated on transaction value, not simply trading profits. Uniswap a16z and the DeFi Education Fund want wallet withdrawals and cross chain bridging excluded, while also opposing requirements to maintain private key records. Illinois has agreed to postpone implementation until July 1, 2027 subject to court approval. The outcome could influence how other US states approach DeFi taxation. The Defiant +2
What do you think 🤔 ? Should DeFi transactions be tax free to protect decentralization or should crypto platforms follow traditional tax rules ? 🤔
#UniswapA16zSeekDeFiExemptionFromIllinoisCryptoTax
Volatile
·Лайков: 3
·Просмотров: 107
HKDollarStablecoinHKDAPToLaunchOnSolana
Просмотров: 7,903
327 обсуждают
$1.5BInLeveragedCryptoBetsLiquidated
Просмотров: 24,128
218 обсуждают