

ASAD Freelance
3.8k Публикации

ASAD Freelance
Отправить жалобу
Заблокировать пользователя
🔶 Spot Trader 🔶 $BNB $BTC Holder 🔶 Free Crypto Updates & Signals at Binance Square Follow 👉 @ASAD FREELANCE
3 подписок(и/а)
213 подписчиков(а)
2.7K+ понравилось
Посты
Все
Цитирования
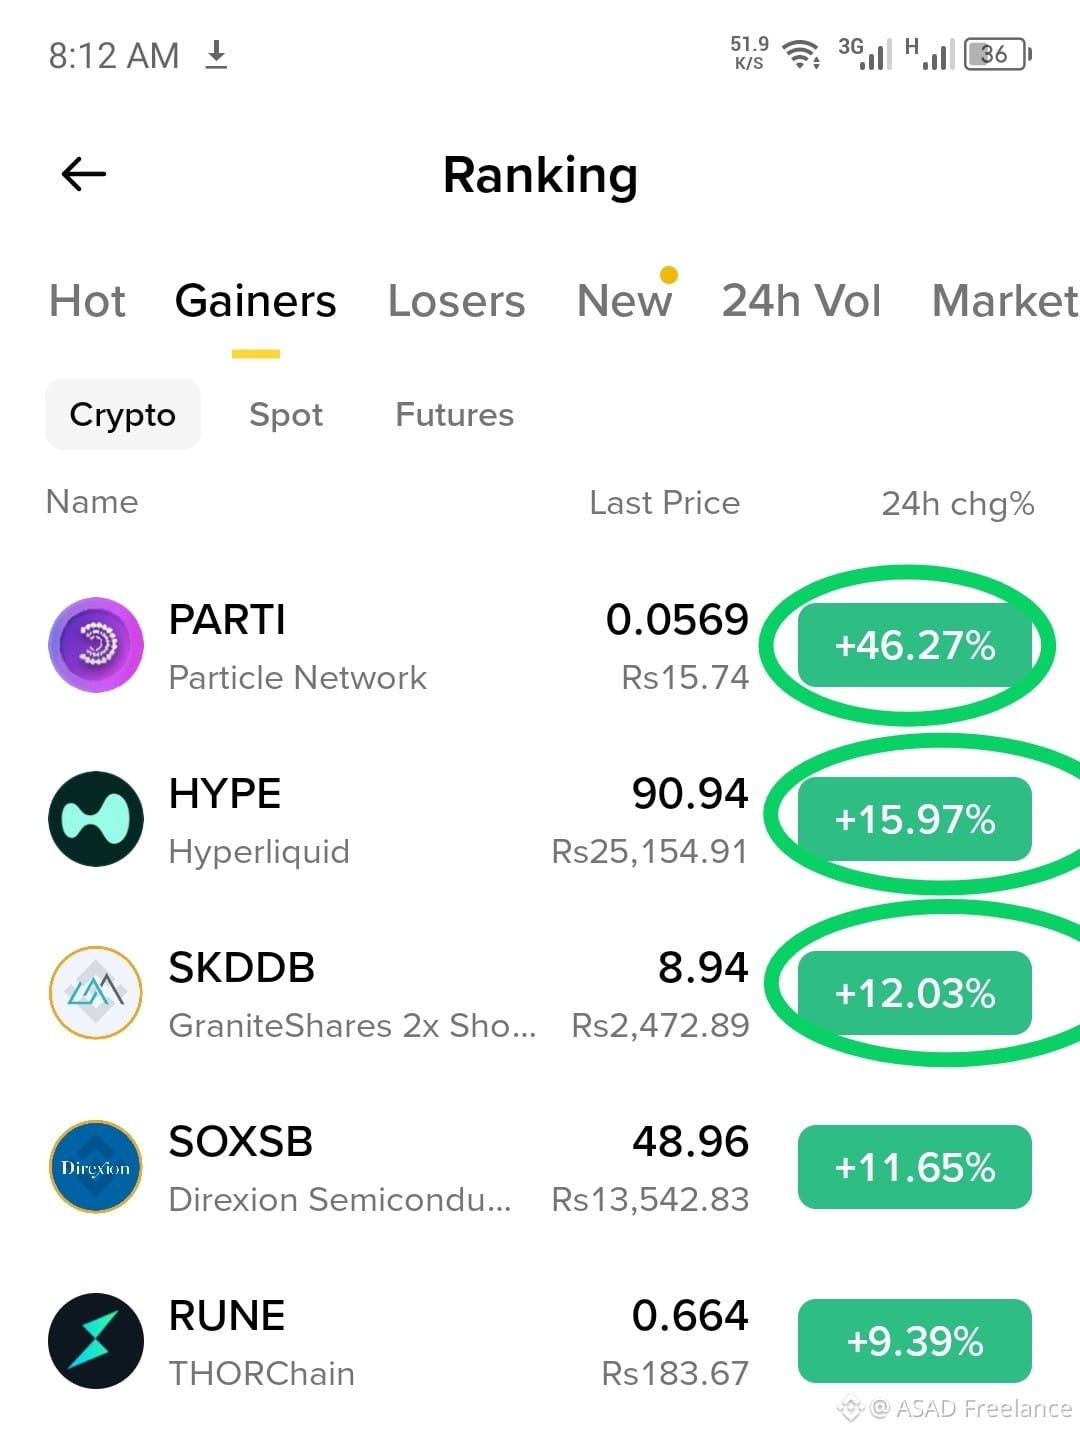
Today Top three Gainer coins list
1 $PARTI
2 $HYPE
3 $SKDDB
Today Top three Gainer coins list
1 $PARTI
2 $HYPE
3 $SKDDB
1 $PARTI
2 $HYPE
3 $SKDDB
49
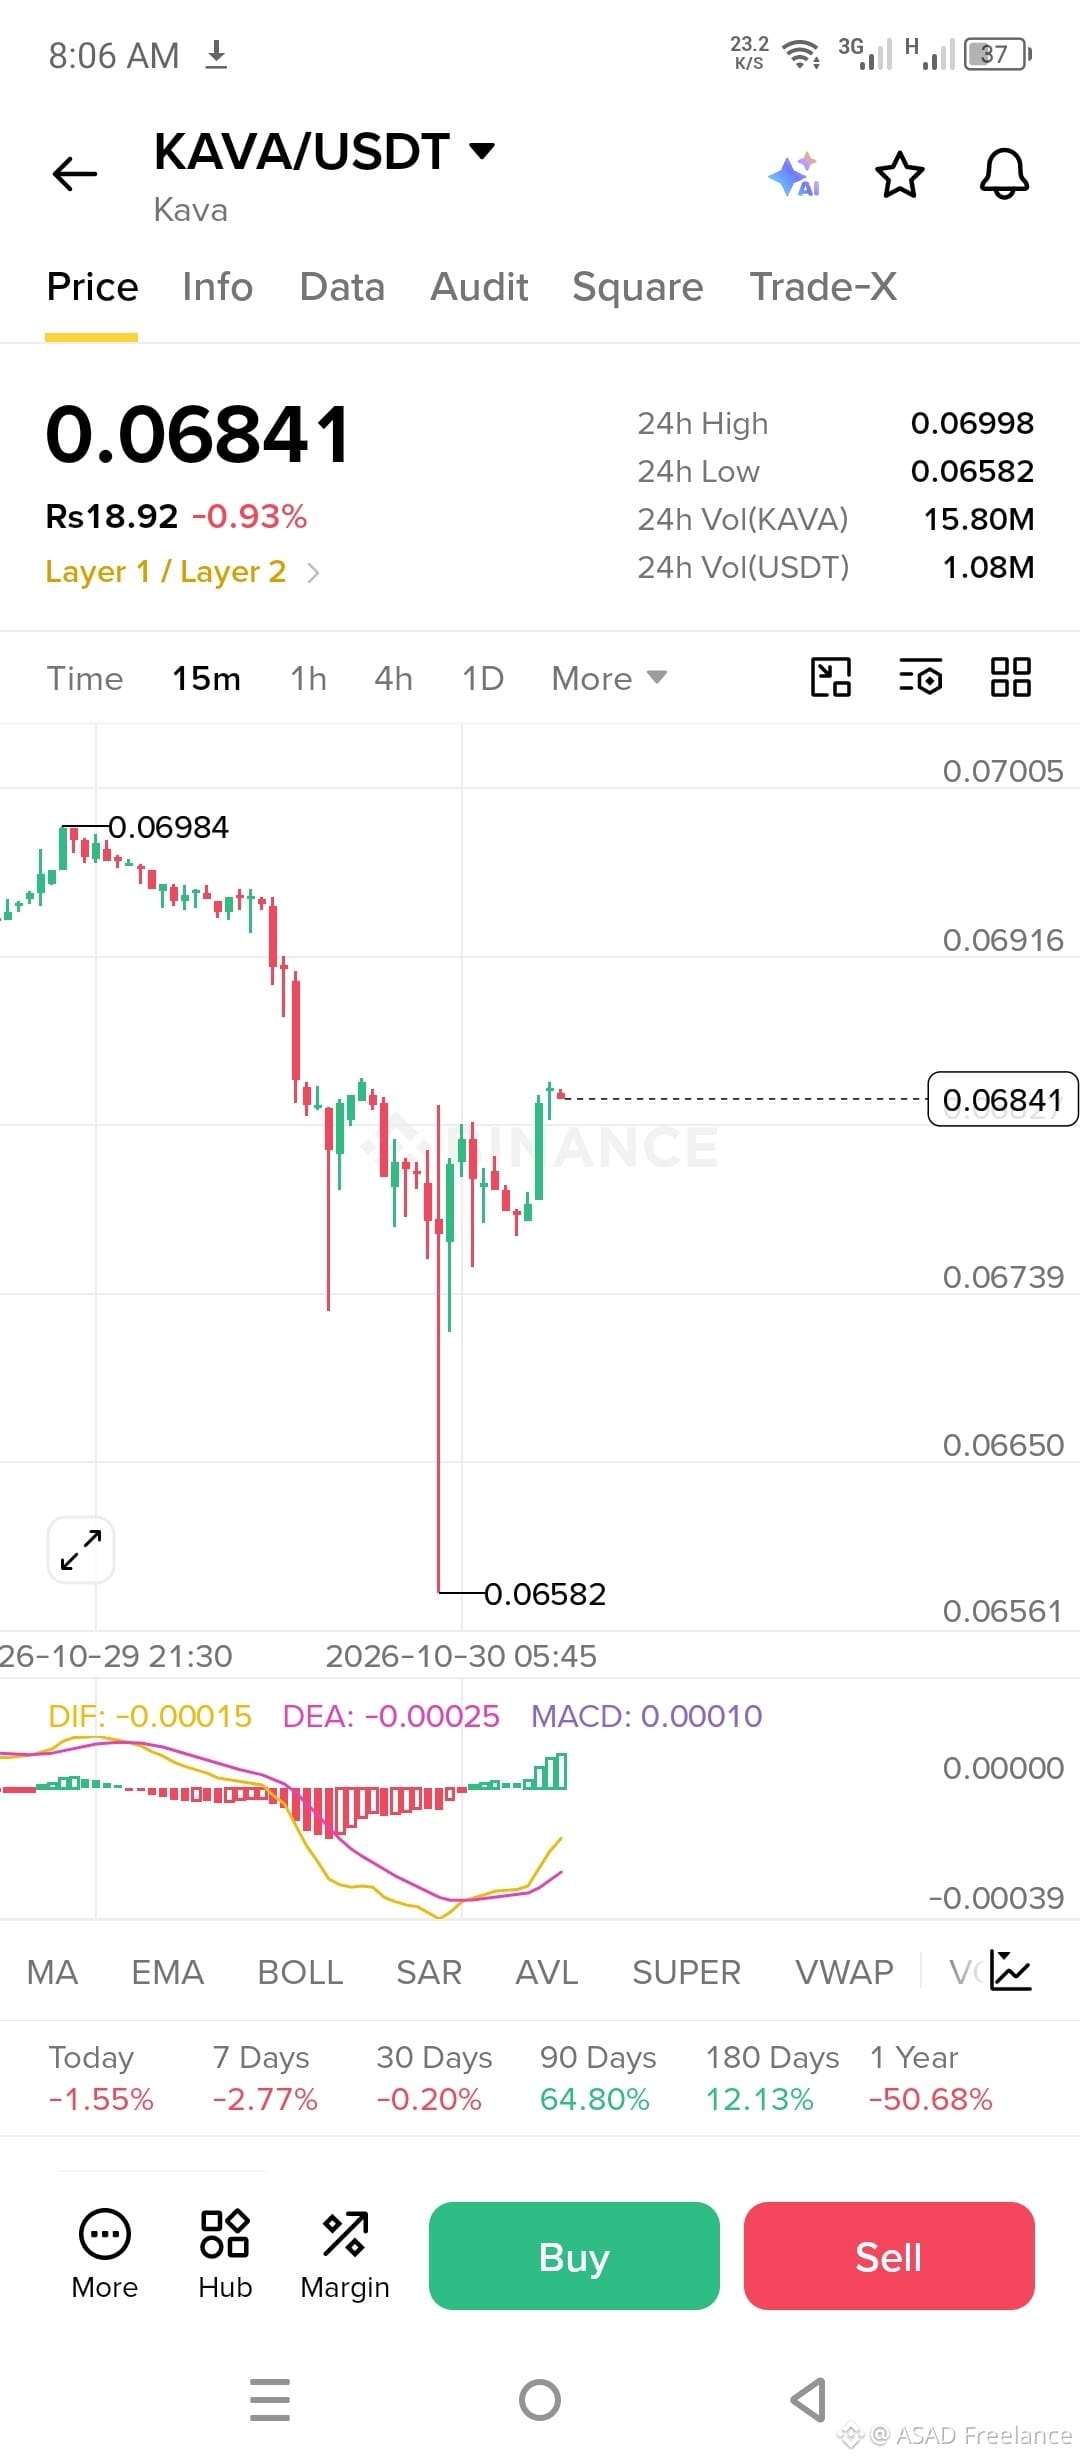
🚀 $KAVA – Bulls Are Showing Signs of Recovery! 🔥
$KAVA /USDT is currently trading at $0.06841, down just 0.93%.
After a sharp drop toward $0.06582, buyers are stepping in and pushing the price upward. The MACD histogram has turned green, indicating improving short-term momentum.
📊 Important Trading Levels:
🟢 Support: $0.06739 – $0.06582
🎯 TP1: $0.06916
🎯 TP2: $0.06984
🚀 TP3: $0.07005
🛑 Stop Loss: $0.06550
If KAVA breaks above $0.06916 with strong buying volume, a move toward $0.07000 could be possible.
🔥 KAVA may be preparing for its next move!
Are you bullish on KAVA, or expecting another dip?
#KAVA #KavaNetwork #CryptoTrading #BinanceSquare #Altcoins #BullishMomentum #CryptoMarket
108
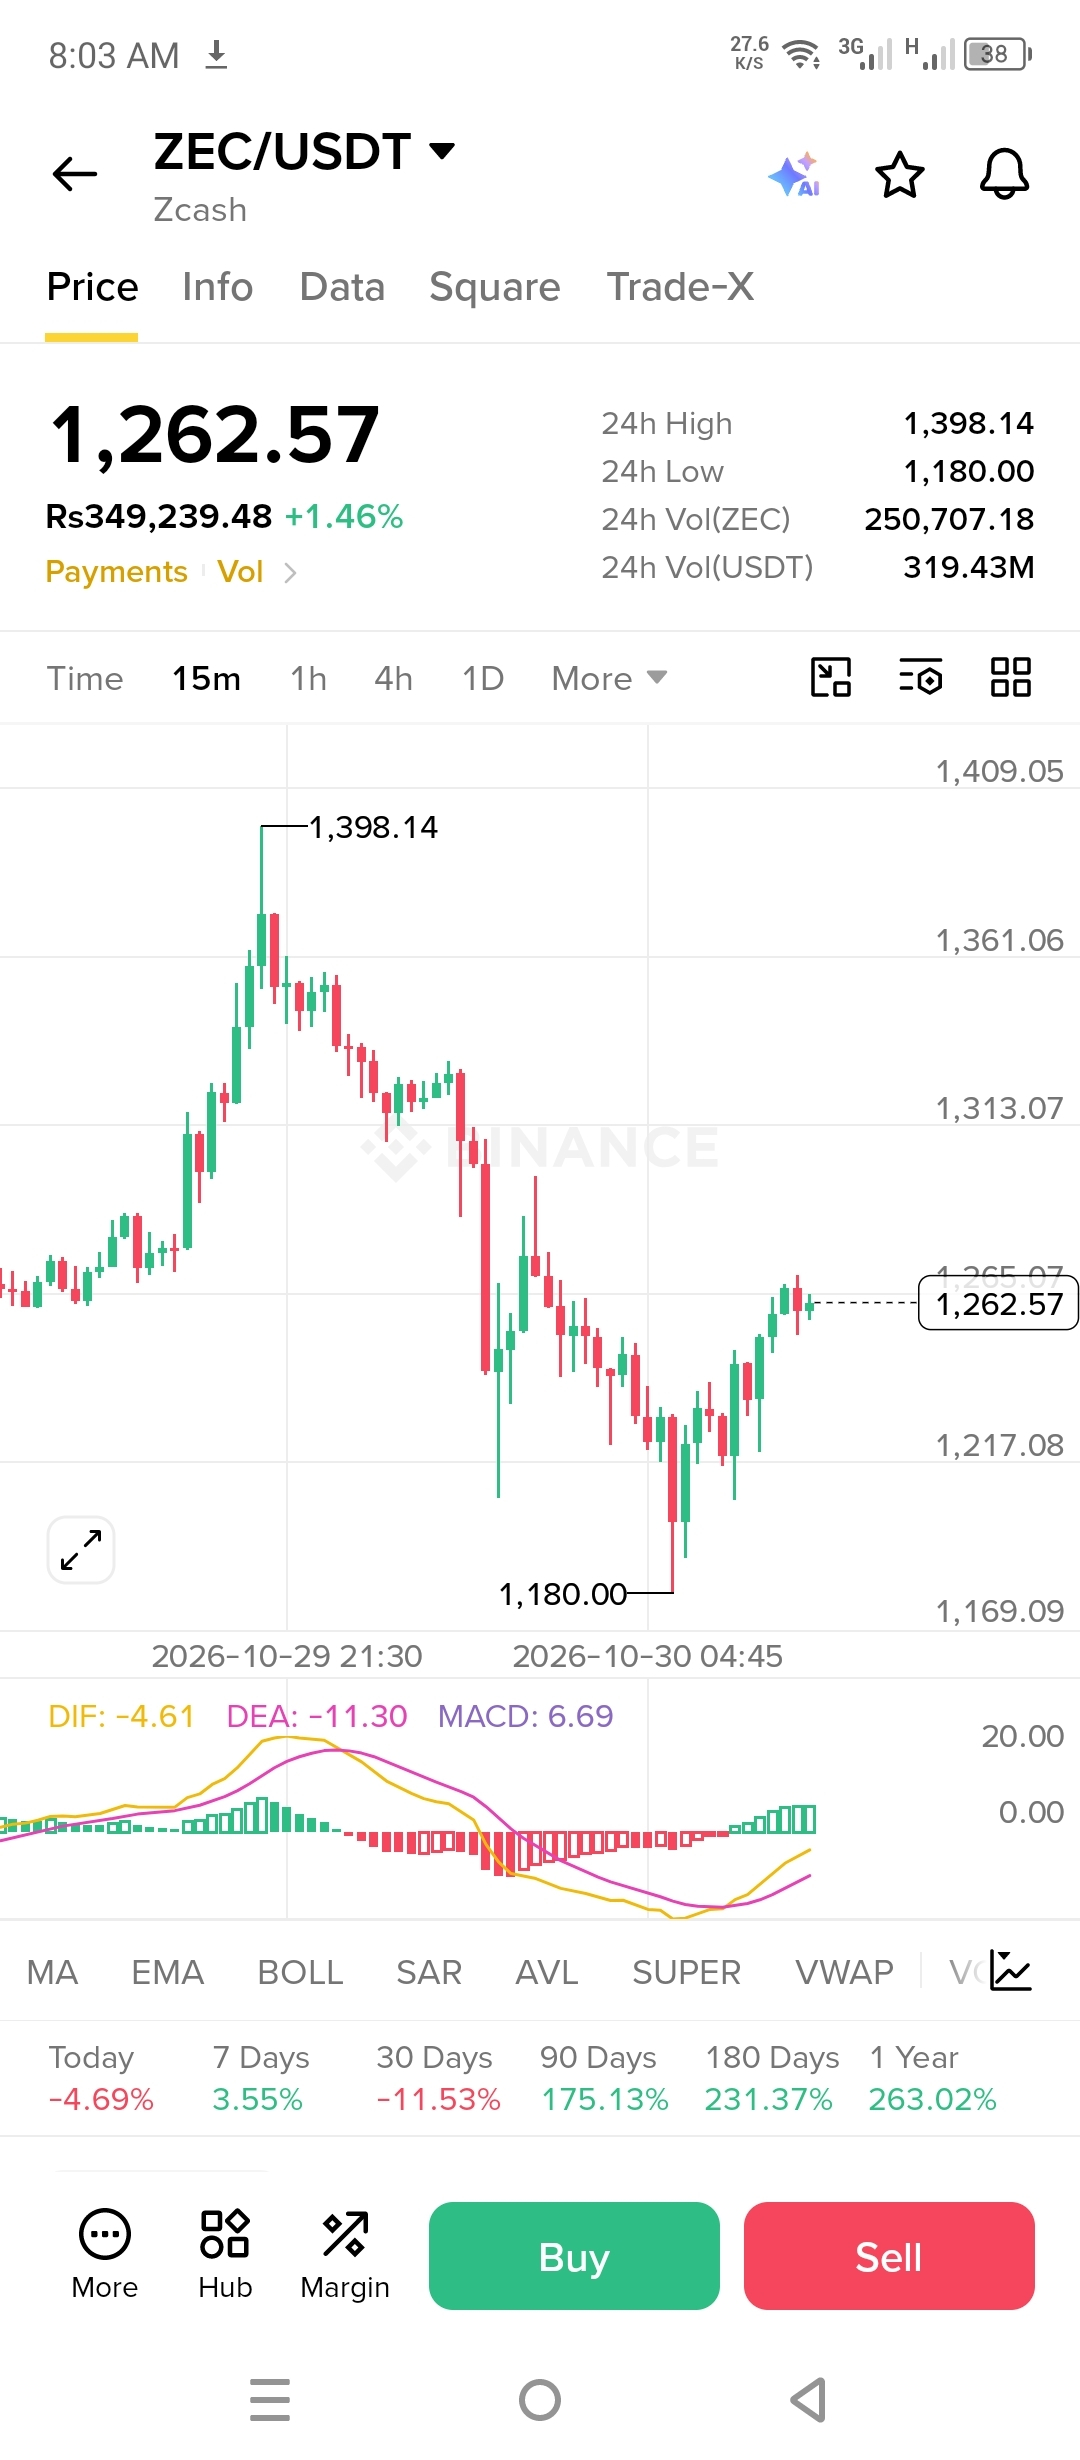
🚀 $ZEC – Bulls Are Fighting Back! 🔥
Zcash ($ZEC ) is showing signs of recovery! Currently trading at $1,262.57, up +1.46%.
After a sharp correction from $1,398.14, ZEC found strong support near $1,180.00. Buyers are stepping in, and the MACD histogram has turned positive, suggesting improving bullish momentum.
📊 Key Trading Levels:
🟢 Support: $1,217 – $1,180
🎯 TP1: $1,280
🎯 TP2: $1,313
🎯 TP3: $1,361
🚀 Major Target: $1,398
🛑 Stop Loss: $1,175
If buyers maintain momentum and break above $1,280, ZEC could attempt a stronger recovery toward higher resistance levels.
🔥 ZEC is waking up! Can bulls reclaim $1,300?
What's your prediction: $1,300 or another correction?
#ZEC #Zcash #CryptoTrading #BinanceSquare #Altcoins #BullishMomentum #CryptoMarket

1
132
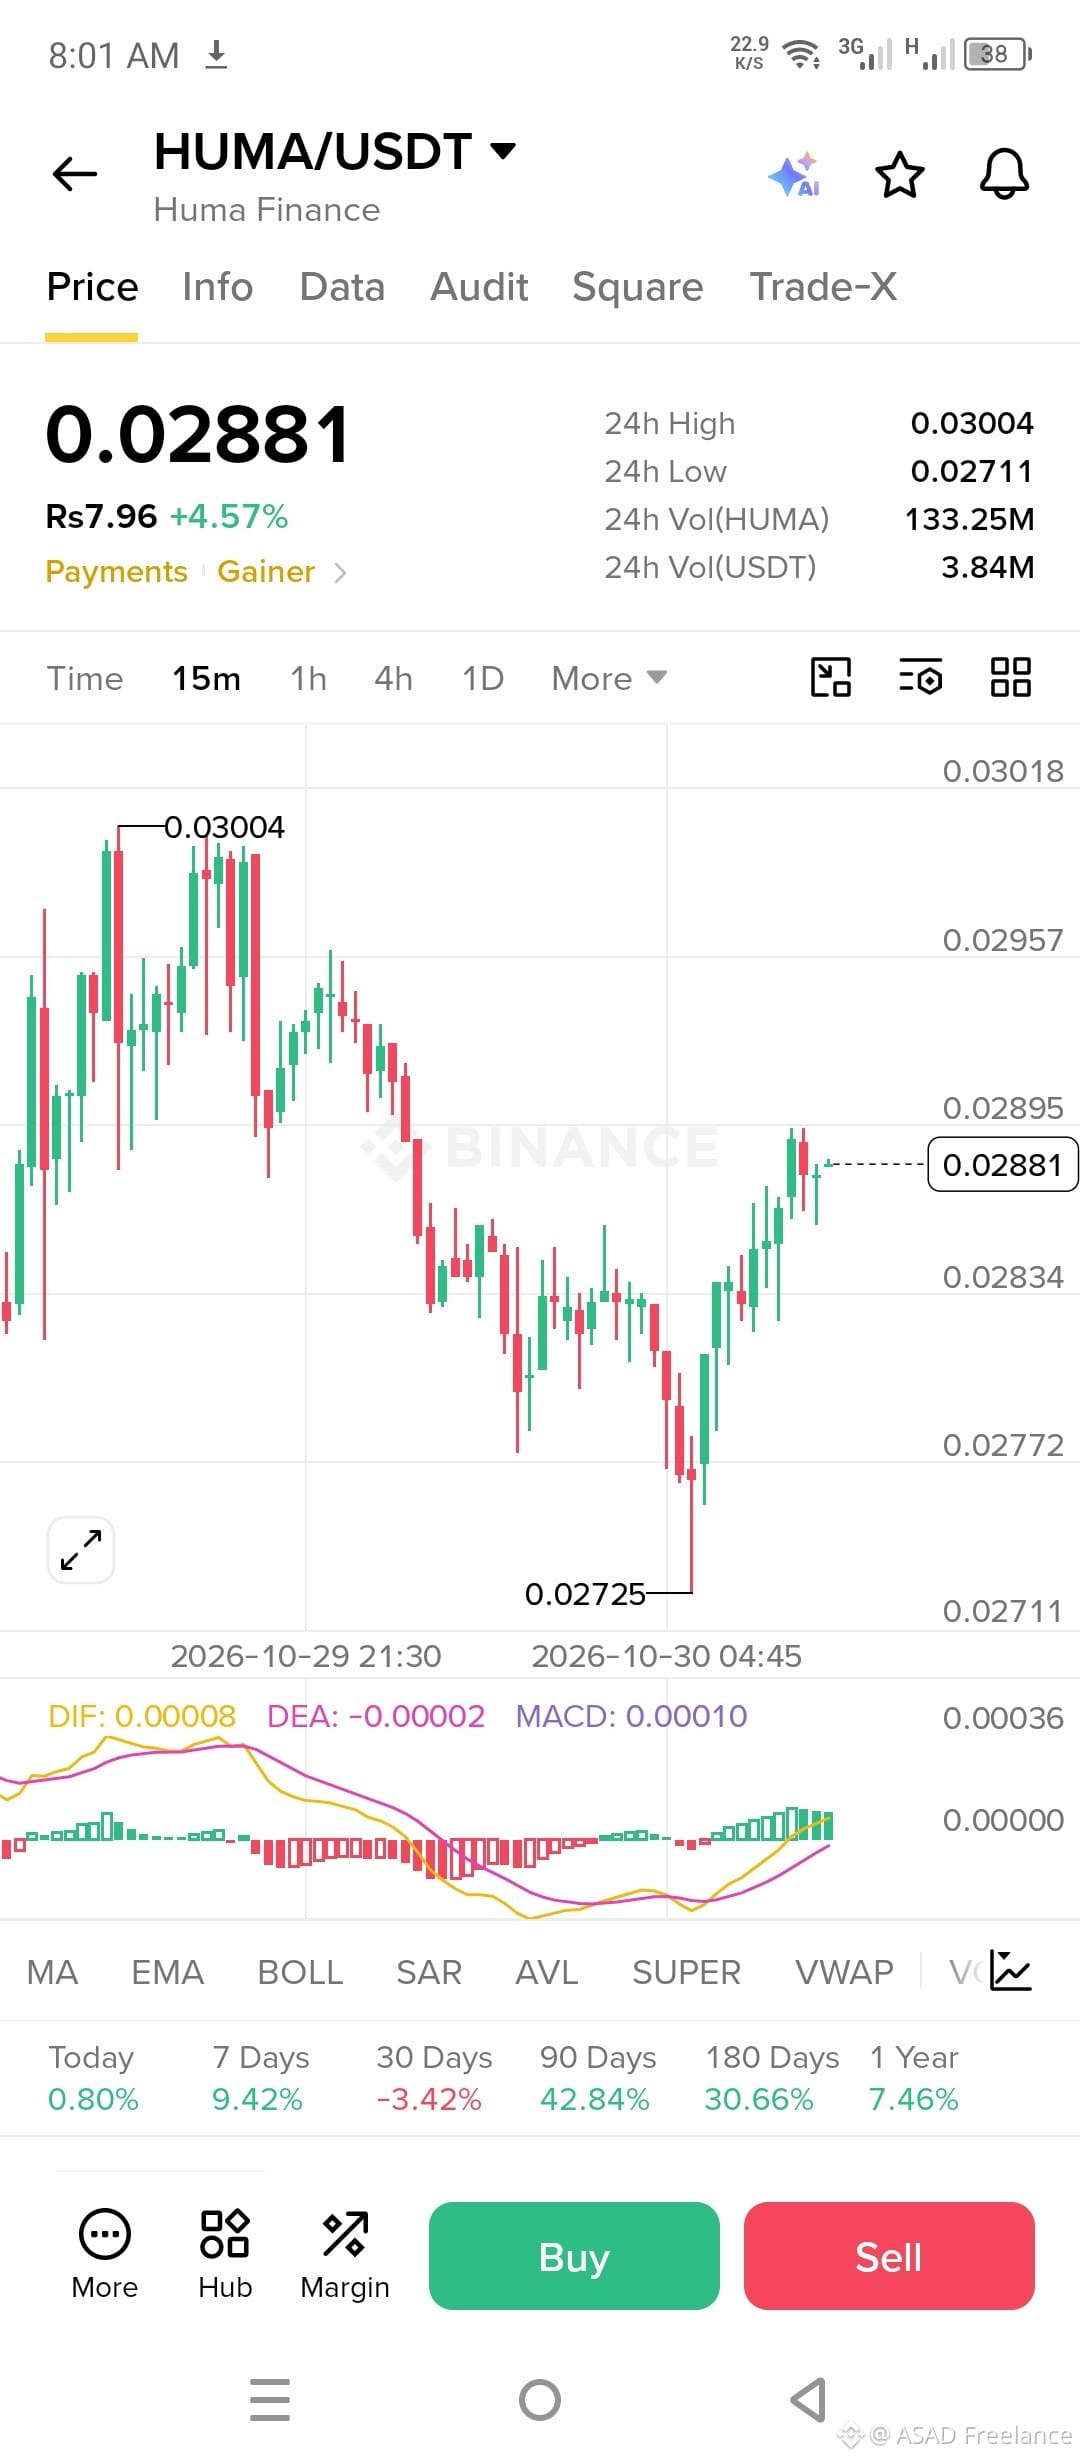
🚀 $HUMA – Bulls Are Taking Control! 🔥
$HUMA /USDT is showing positive momentum, currently trading at $0.02881, up +4.57%!
After bouncing strongly from the $0.02725 support zone, buyers are stepping back into the market. The MACD has turned positive, suggesting that bullish momentum may be building.
📊 Important Levels to Watch:
🟢 Support: $0.02834 – $0.02772
🎯 TP1: $0.02900
🎯 TP2: $0.02957
🚀 TP3: $0.03004
🛑 Stop Loss: $0.02710
If HUMA breaks above $0.02900 with strong volume, another upward move could follow. Keep an eye on resistance and manage your risk carefully.
🔥 HUMA is waking up! Can bulls push it above $0.03000?
#HUMA #HumaFinance #CryptoTrading #BinanceSquare #Altcoins #BullishMomentum #CryptoMarket

78
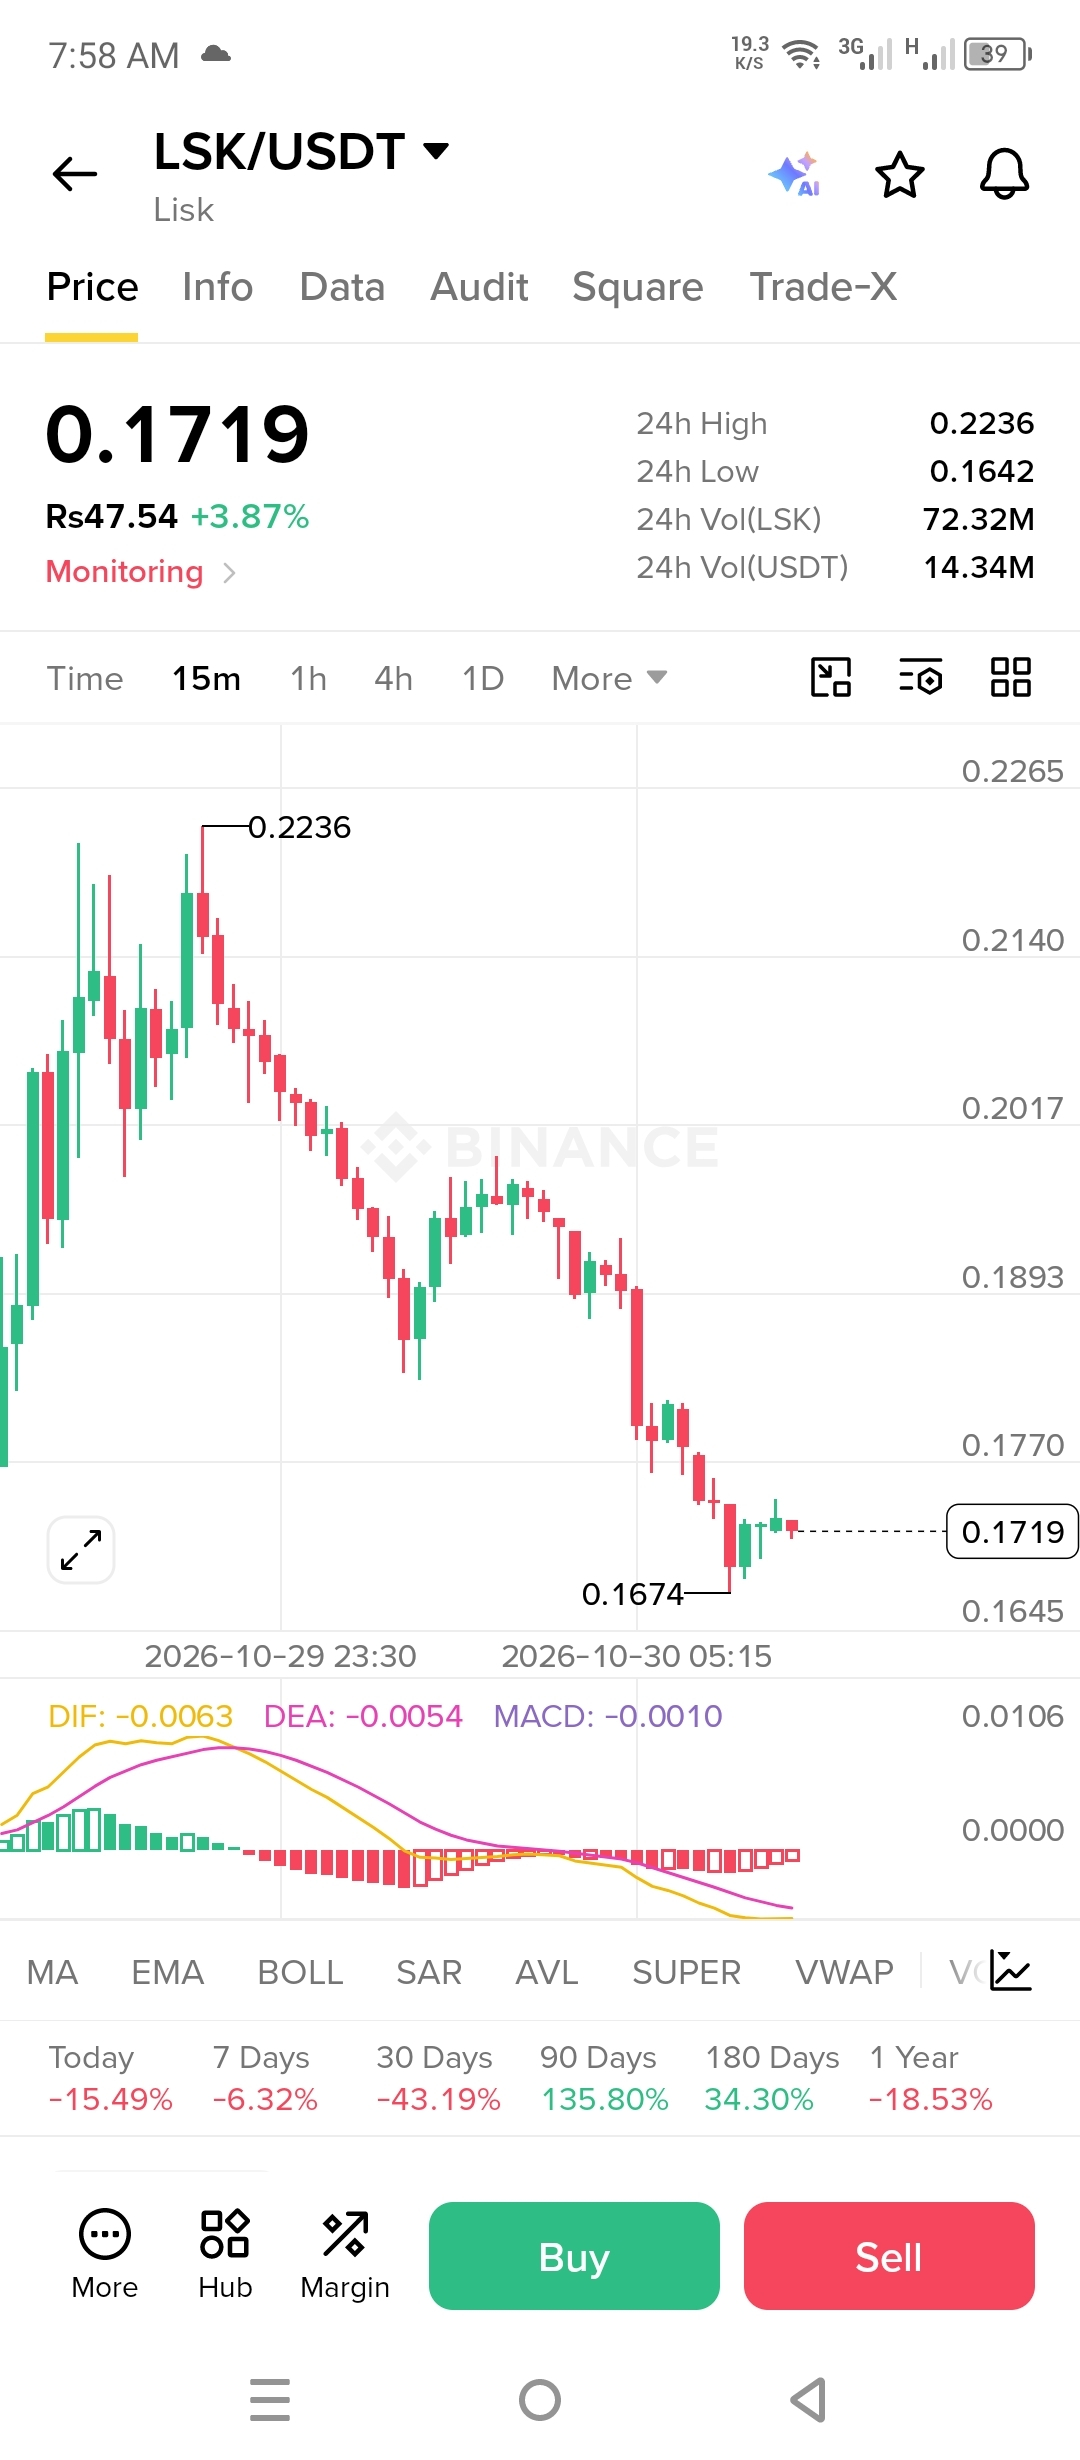
🚀 $LSK – Is a Bullish Reversal Coming?
🔥 LSK/USDT is trading at $0.1719, up +3.87%!
After facing strong selling pressure, $LSK has started showing signs of stabilization near the $0.1674 support zone. The MACD histogram is also showing a possible slowdown in bearish momentum.
📊 Key Levels to Watch:
🟢 Support: $0.1674 – $0.1642
🎯 Resistance 1: $0.1770
🎯 Resistance 2: $0.1893
🚀 Major Resistance: $0.2017
If buyers regain control and break above $0.1770, we could see a stronger recovery. However, losing support may bring further downside.
👀 Traders, keep LSK on your watchlist! Is this the beginning of a recovery or just a temporary bounce?
#LSK #Lisk #CryptoTrading #BinanceSquare #Altcoins #CryptoMarket #TechnicalAnalysis

1
571
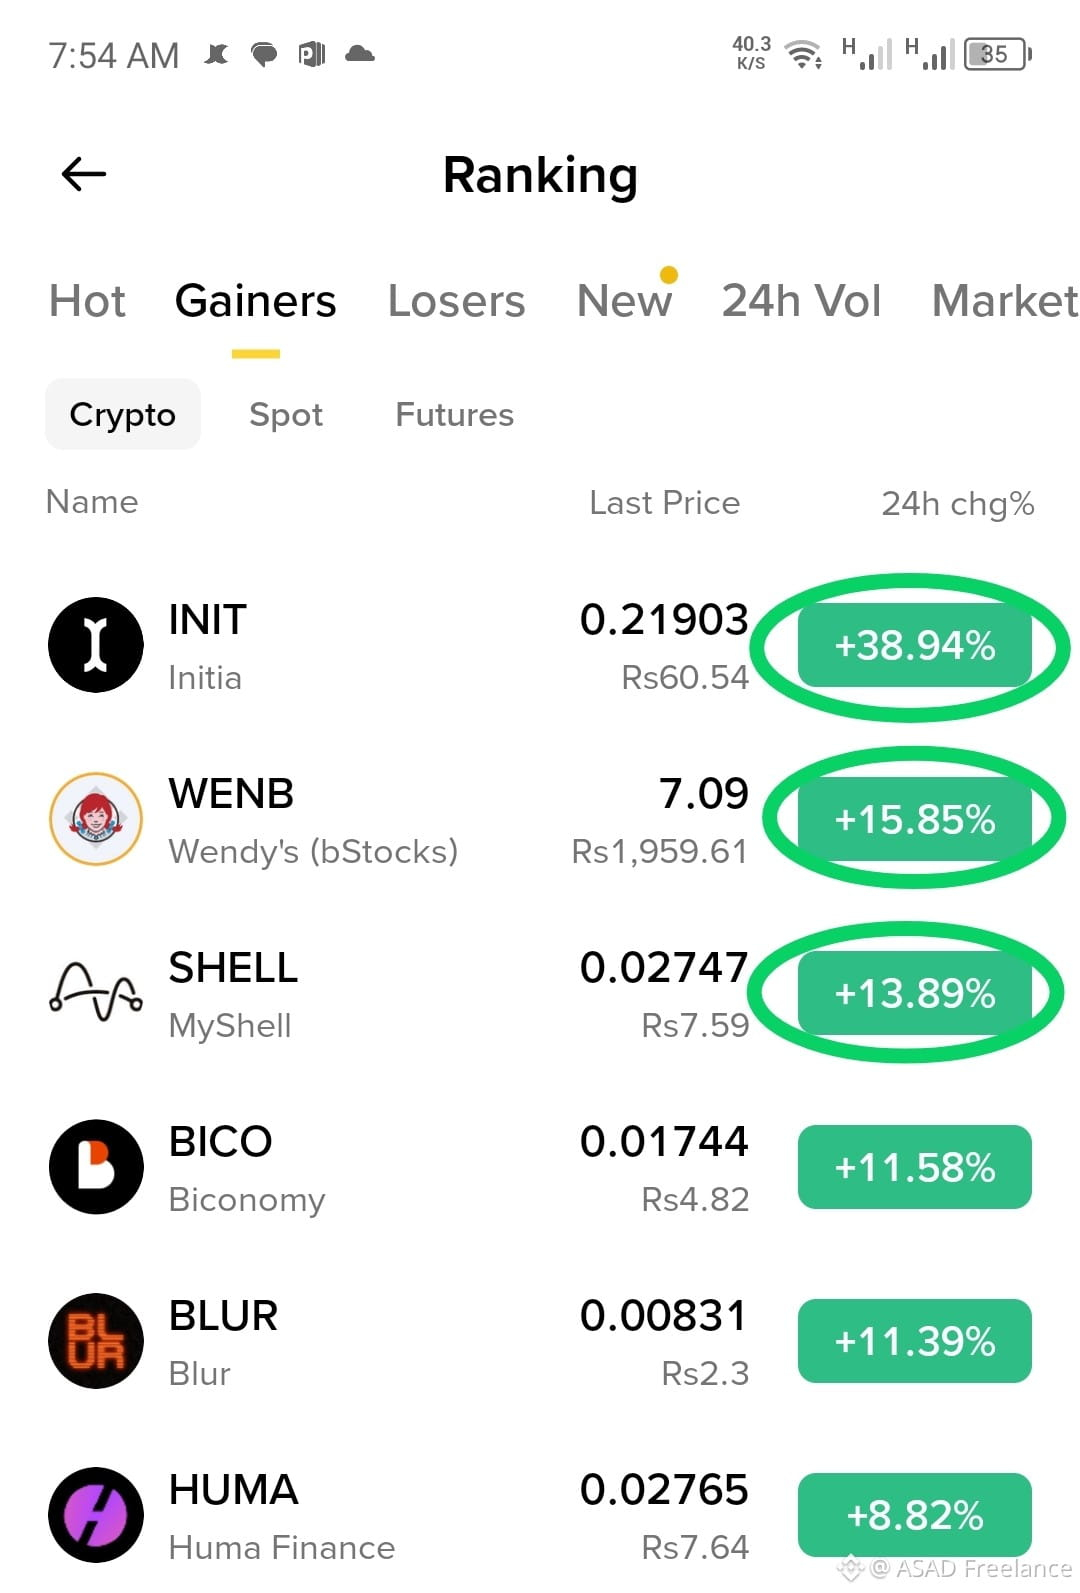
Today Top three Gainer coins list
1 $INIT
2 $WENB
3 $SHELL
Today Top three Gainer coins list
1 $INIT
2 $WENB
3 $SHELL
1 $INIT
2 $WENB
3 $SHELL
67
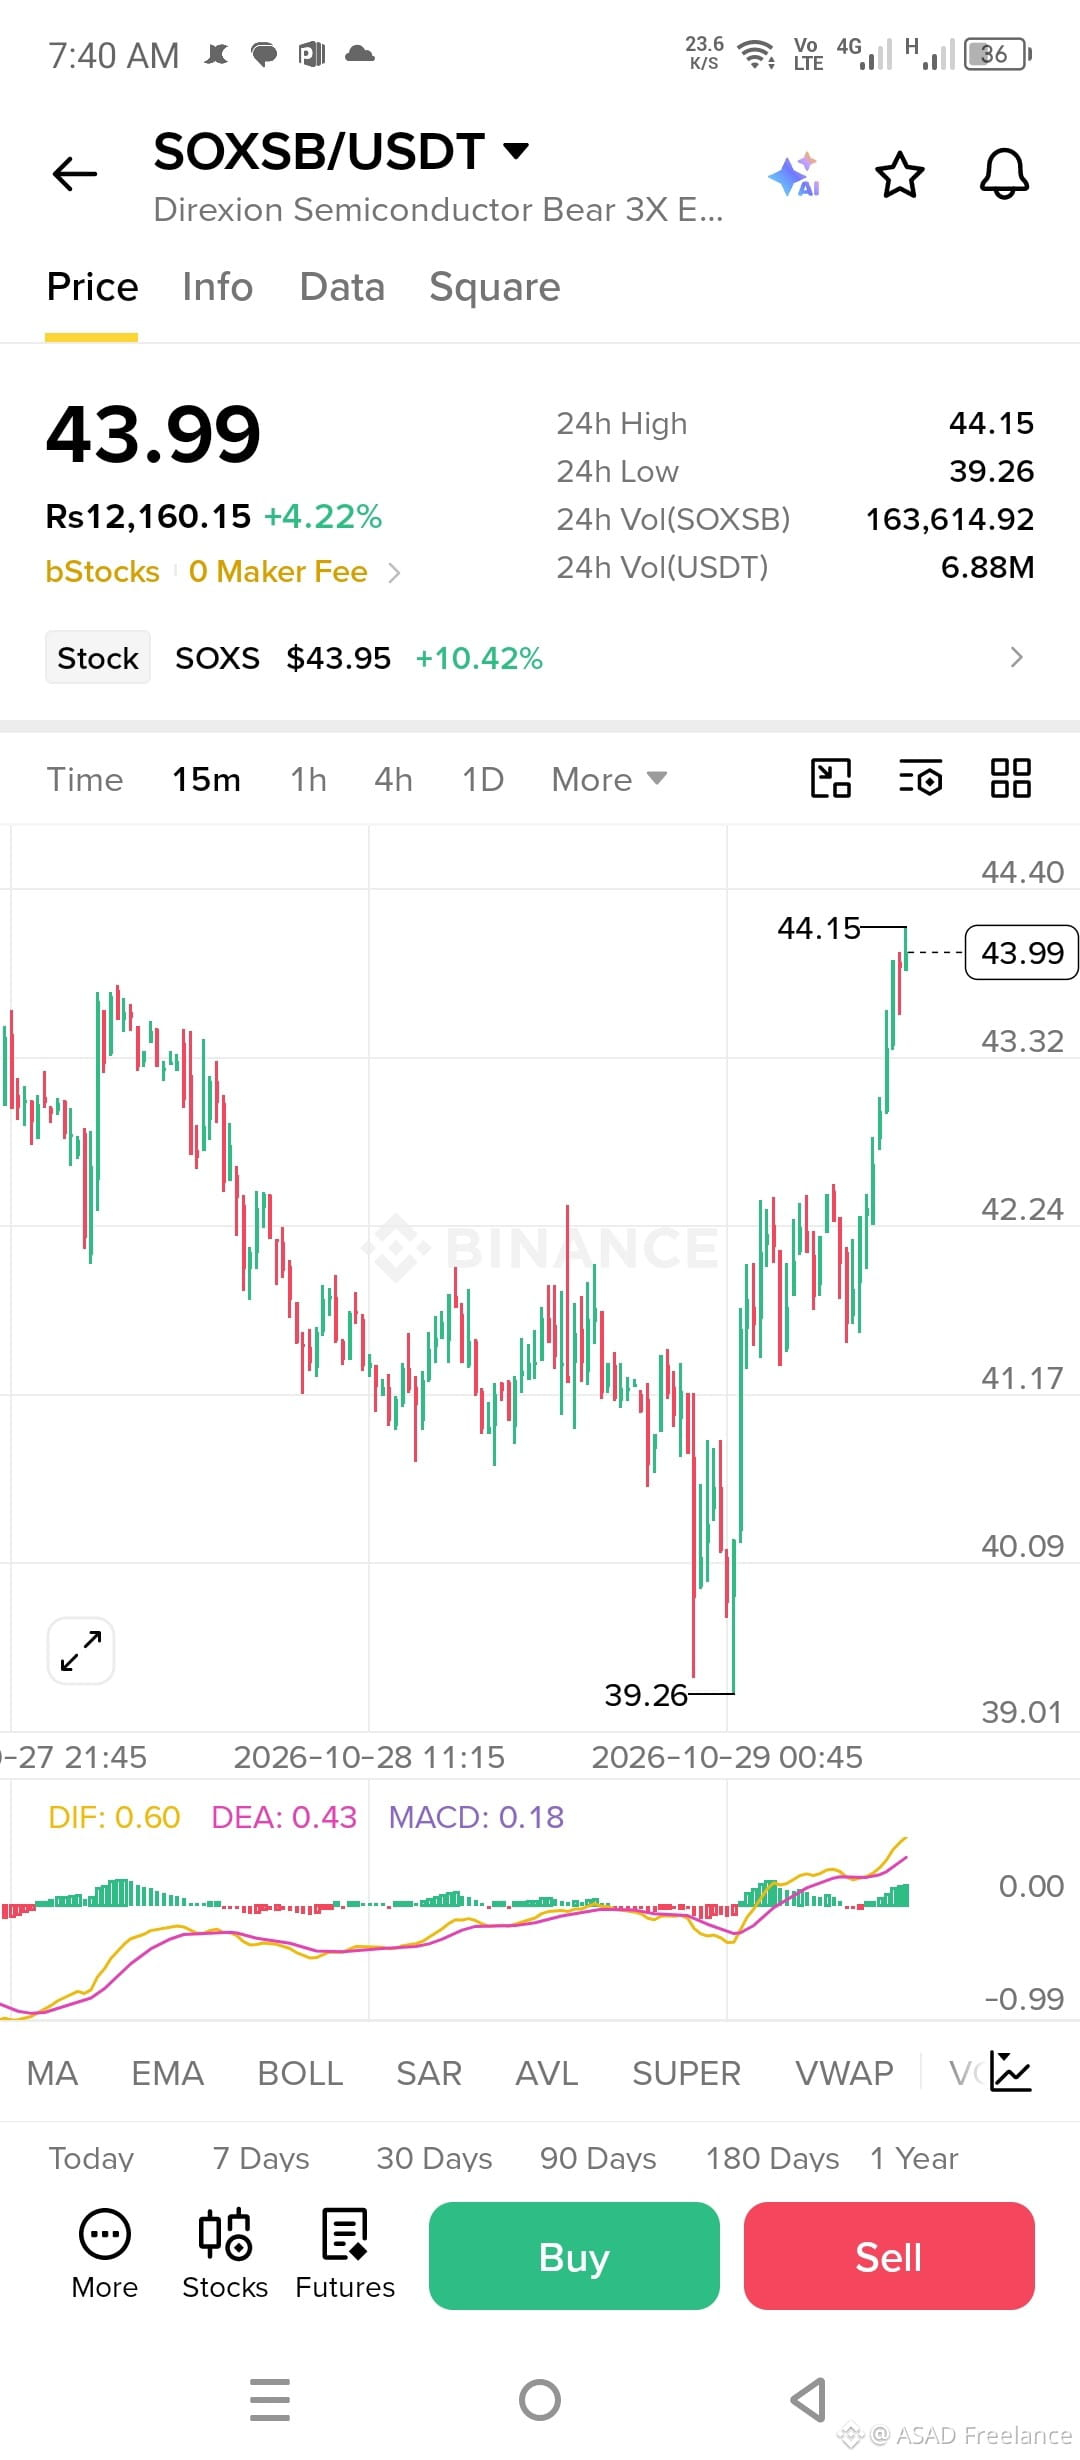
📉 $SOXSB /USDT – Massive V-Shaped Rebound! +4.22%
The 3X Bear Semiconductor ETF is staging a powerful recovery from the lows! 📈
💰 Price: $43.99 (+4.22%)
📈 **24h High/Low:** $44.15 / $39.26
📦 24h Vol: 163.6K SOXSB | 6.88M USDT
Technical Highlights:
✅ Huge bounce from the $39.26 low – buyers stepped in aggressively
✅ MACD surging (0.18) – strong bullish momentum building
✅ Price pushing right up against the 24H high
Key Levels to Watch:
🔴 Resistance: $44.15 / $44.40
🟢 Support: $42.24 / $41.17
Notice the underlying **$SOXS** stock is up +10.42%! Traders are clearly hedging or betting against the semiconductor sector today. A clean break above $44.15 could trigger more upside. 👀
Are you trading tokenized stocks on Binance? Drop your thoughts on the semis below! 👇
#SOXSB #SOXS #Stocks #BinanceSquare #Trading #Semiconductors

79
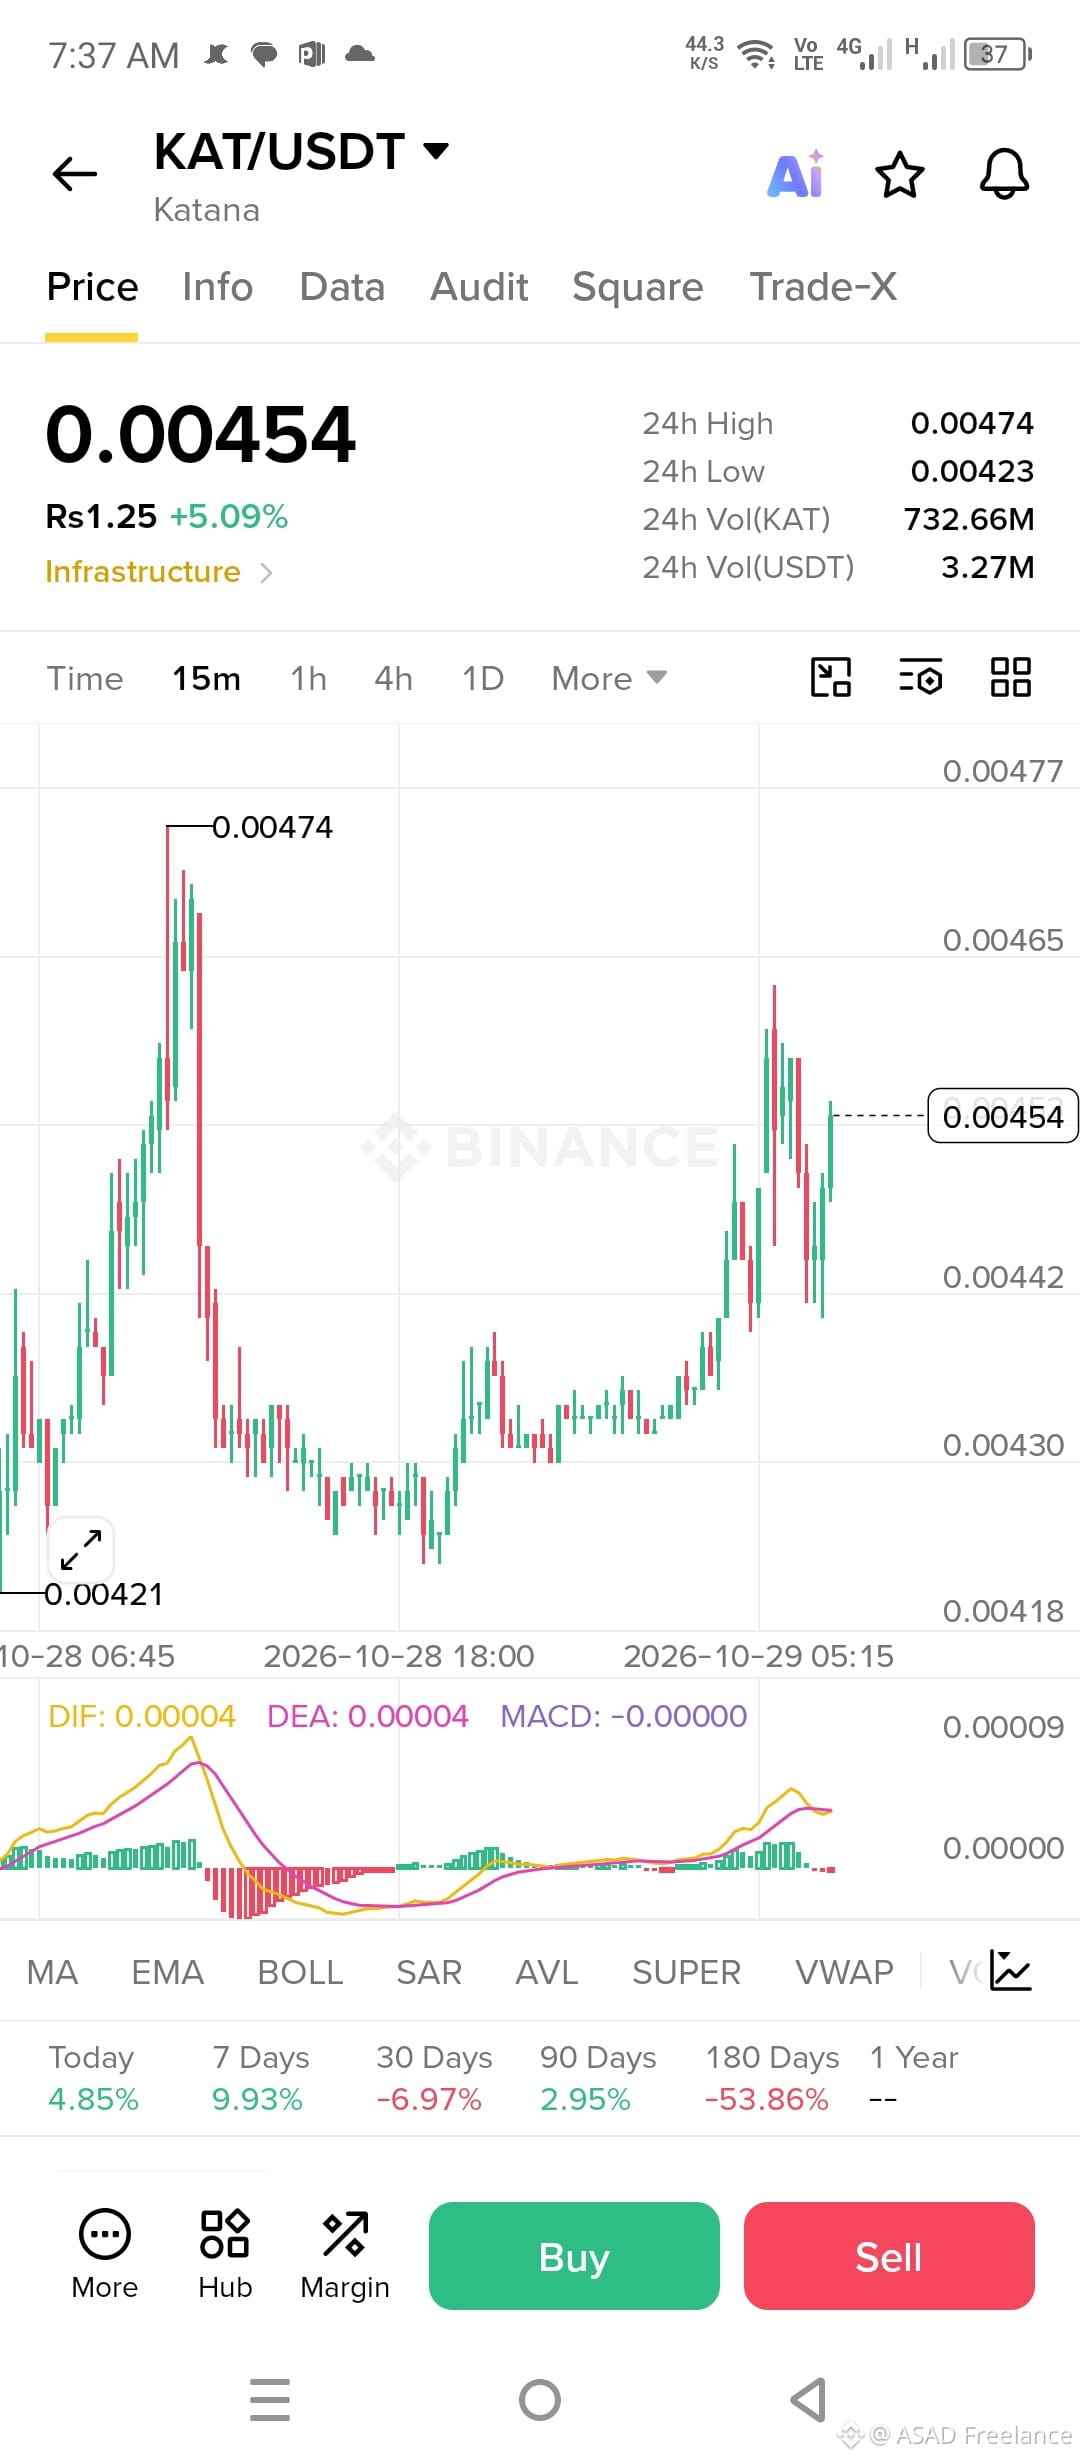
🗡️ $KAT /USDT – Infrastructure Gainer Bouncing Back! +5.09%
$Kat is staging a comeback after a dip, forming higher lows on the 15M chart! 📈
💰 Price: $0.00454 (+5.09%)
📈 **24h High/Low:** $0.00474 / $0.00423
📦 24h Vol: 732.66M KAT | 3.27M USDT
Technical Highlights:
✅ Strong recovery from the $0.00421 base
⚠️ MACD neutral (-0.00000) – momentum coiling, waiting for a trigger
✅ Price pushing back toward the recent highs
Key Levels to Watch:
🔴 Resistance: $0.00474 (24H high)
🟢 Support: $0.00442 / $0.00430
Massive volume with over 732M $KAT traded! A clean break above $0.00465 could open the path back to the highs. 👀
Today +4.85% | 7D +9.93% | 90D +2.95% 📊
Infrastructure token showing resilience – is $KAT on your radar? Drop your thoughts below! 👇
#KAT #Katana #Infrastructure #BinanceSquare #CryptoRecovery #AltcoinWatch

349
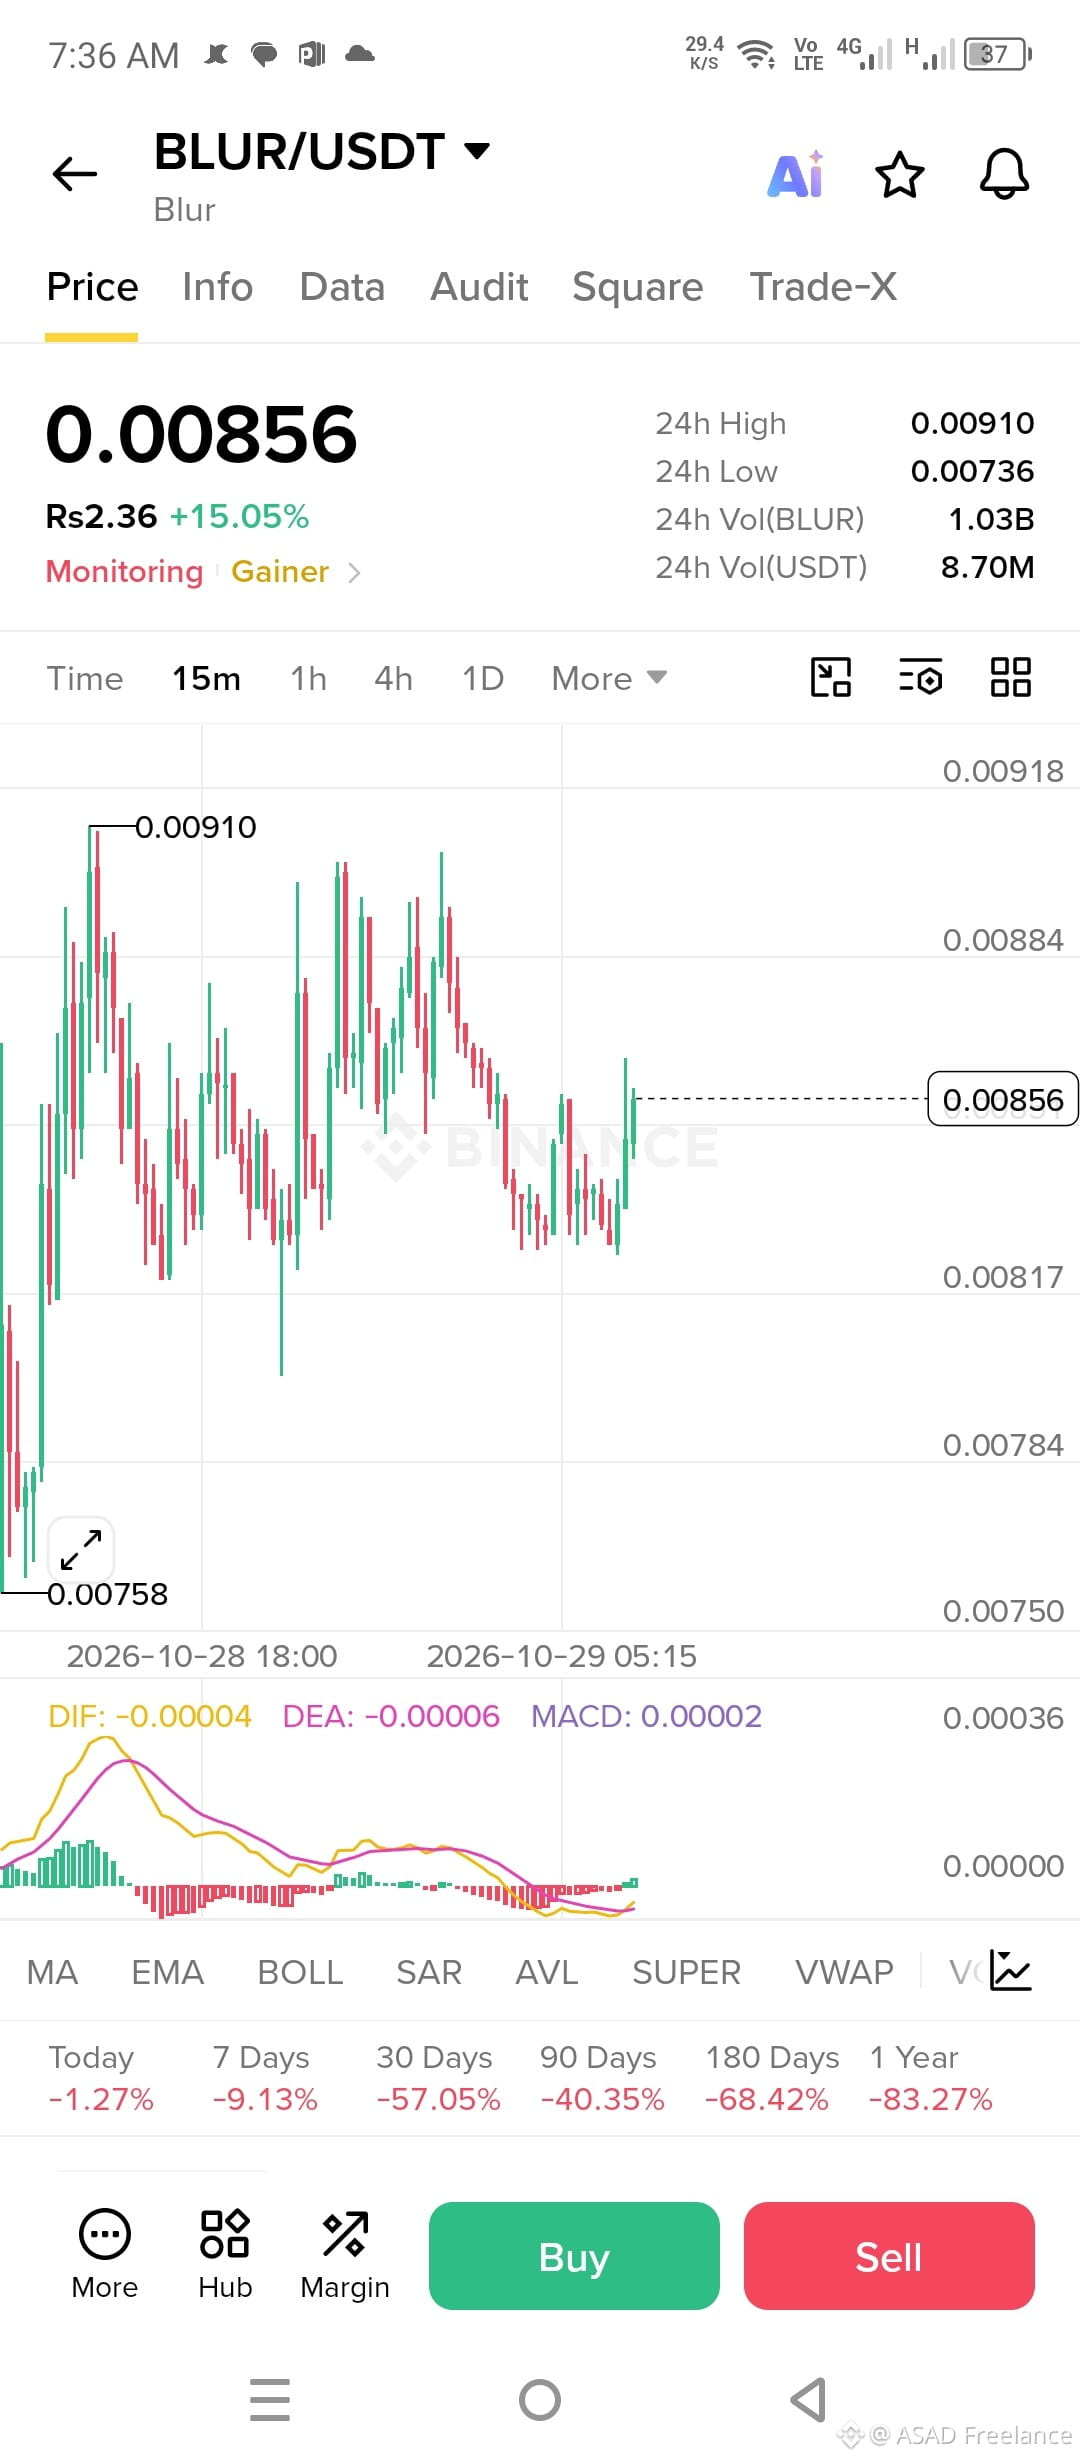
🚀 $BLUR /USDT — Bulls Are Making a Comeback! 🔥
💰 Current Price: $0.00856
📈 24H Gain: +15.05%
🎯 24H High: $0.00910
📊 24H Volume: 1.03B BLUR
$BLUR is showing fresh recovery momentum after bouncing from the $0.00736 support zone! 🟢 Buyers are stepping in, and the MACD is showing early signs of improving momentum.
🎯 Potential Targets:
- TP1: $0.00880
- TP2: $0.00910
- TP3: $0.00950
- 🛑 Stop Loss: $0.00820
📈 Key Levels to Watch: A breakout above $0.00910 with strong volume could open the door to further upside. If resistance holds, a short-term pullback is possible.
🔥 Can $BLUR continue its recovery and surprise the market? Keep watching the price action!
⚠️ These are technical levels, not guaranteed targets. Always manage your risk.
#BLUR #Crypto #Binance #Altcoins #CryptoTrading #BullishMomentum #TradingSignals
78
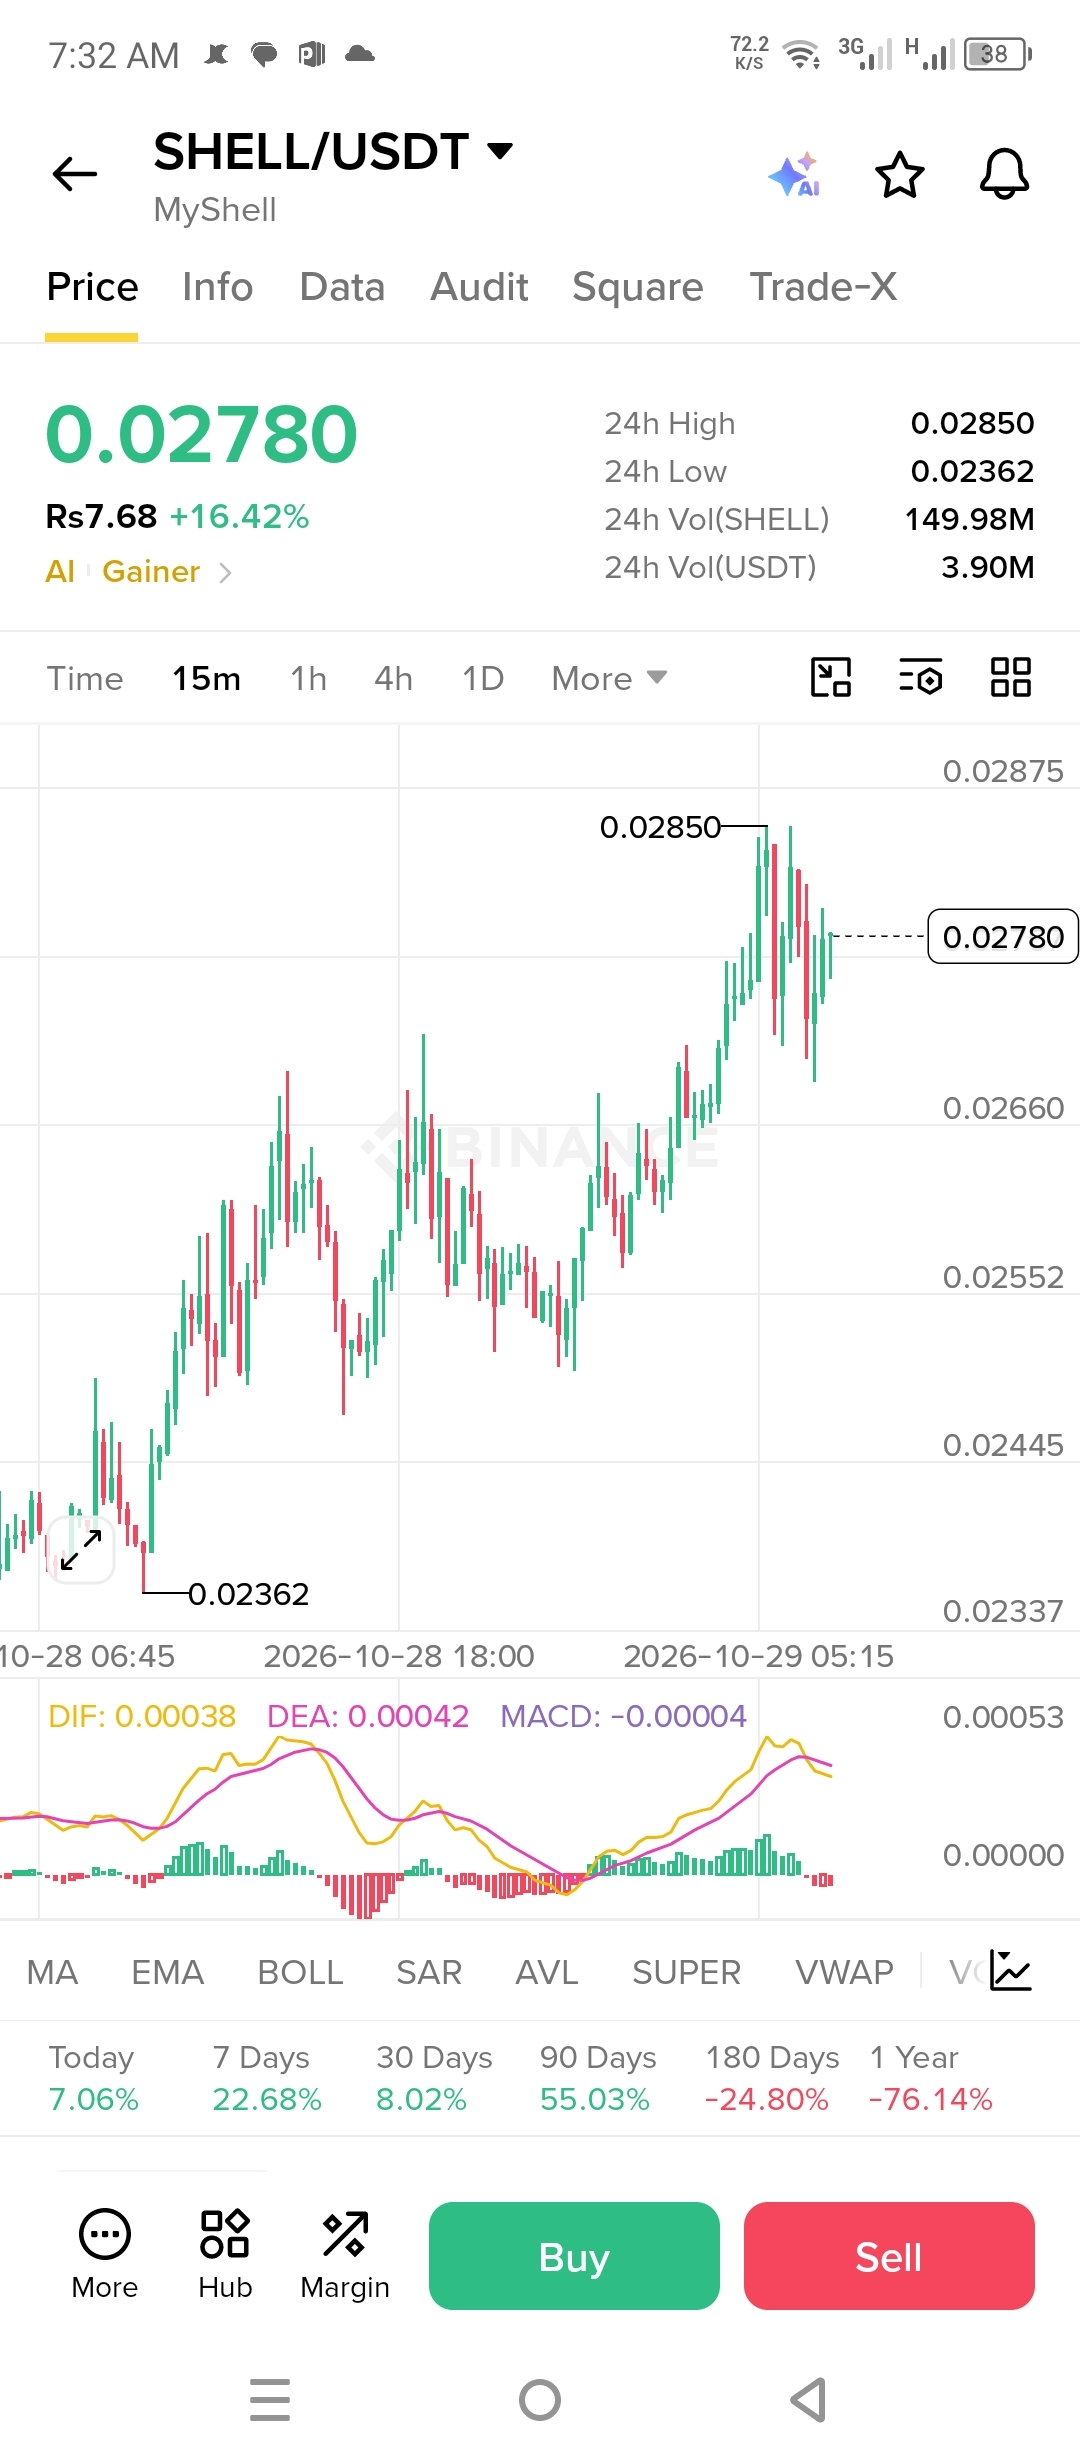
🚀 $SHELL /USDT — Bulls Are Taking Control! 🔥
💰 Current Price: $0.02780
📈 24H Gain: +16.42%
🎯 24H High: $0.02850
$SHELL is showing strong bullish momentum after climbing from the $0.02362 support zone! 🟢 Buyers are pushing the price higher, and the next challenge is breaking the $0.02850 resistance.
🎯 Potential Targets:
- TP1: $0.02850
- TP2: $0.02950
- TP3: $0.03050
- 🛑 Stop Loss: $0.02680
📊 Market Outlook: If SHELL breaks above $0.02850 with strong volume, another upward move could follow. However, short-term pullbacks are possible after this sharp rally. Watch for confirmation before entering a trade.
🔥 Keep watching $SHELL — will the bulls push toward $0.03000?
⚠️ Trade responsibly and manage your risk.
#SHELL #MyShell #Crypto #Binance #Altcoins #CryptoTrading #BullishMomentum

88
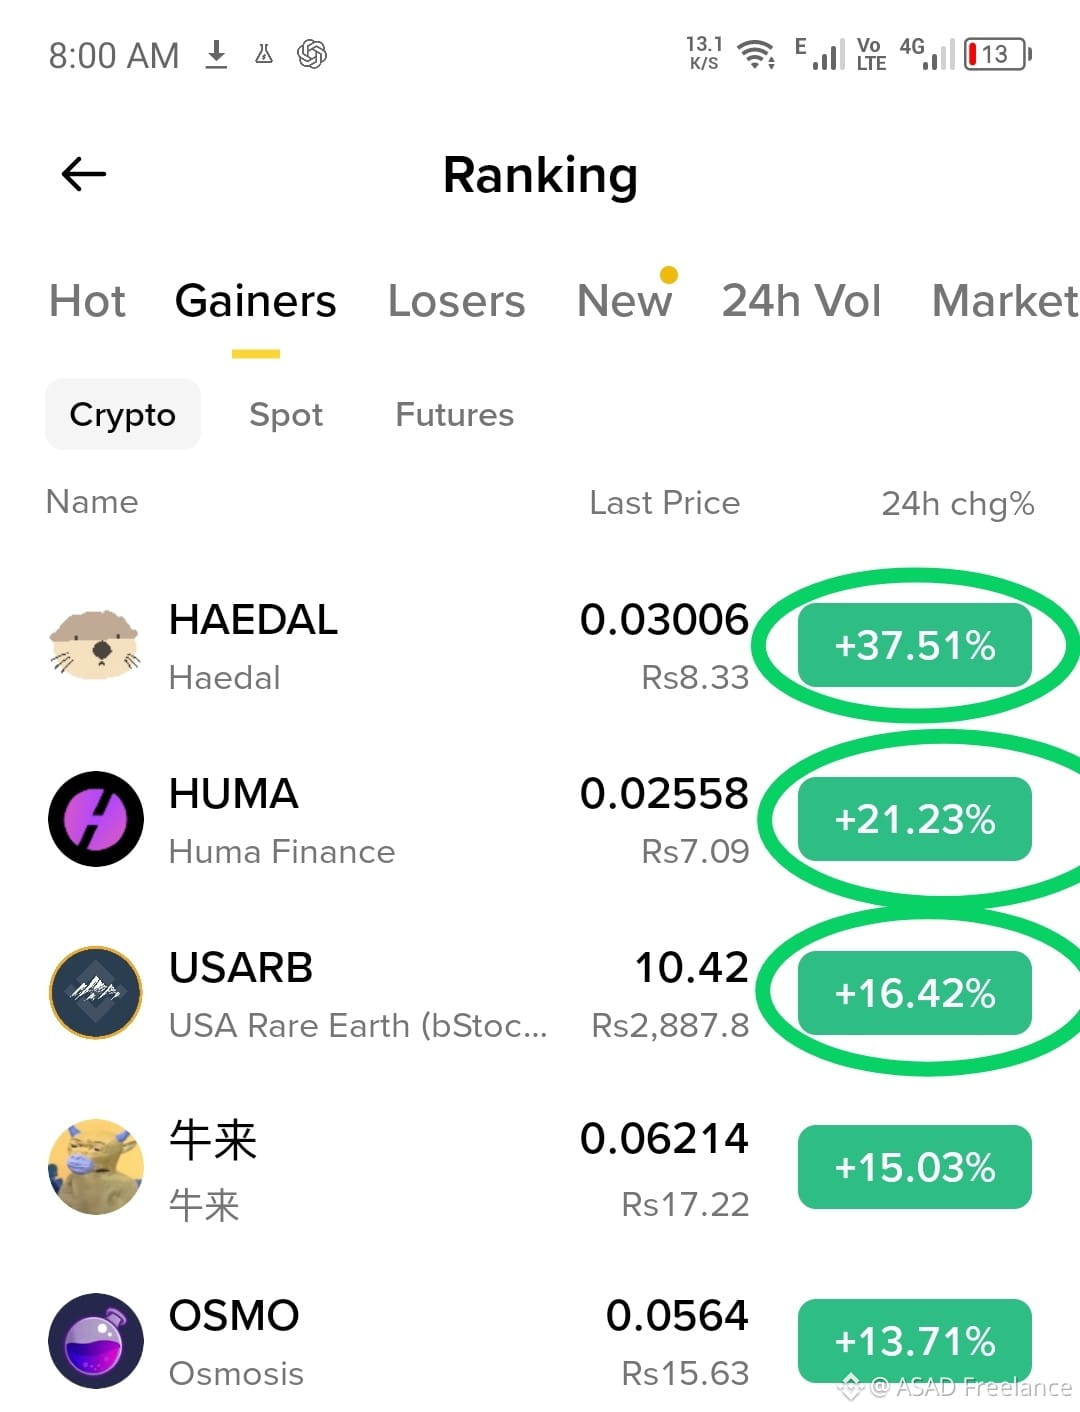
Today Top three Gainer coins list
1 $HAEDAL
2 $HUMA
3 $USARB
Today Top three Gainer coins list
1 $HAEDAL
2 $HUMA
3 $USARB
1 $HAEDAL
2 $HUMA
3 $USARB
204
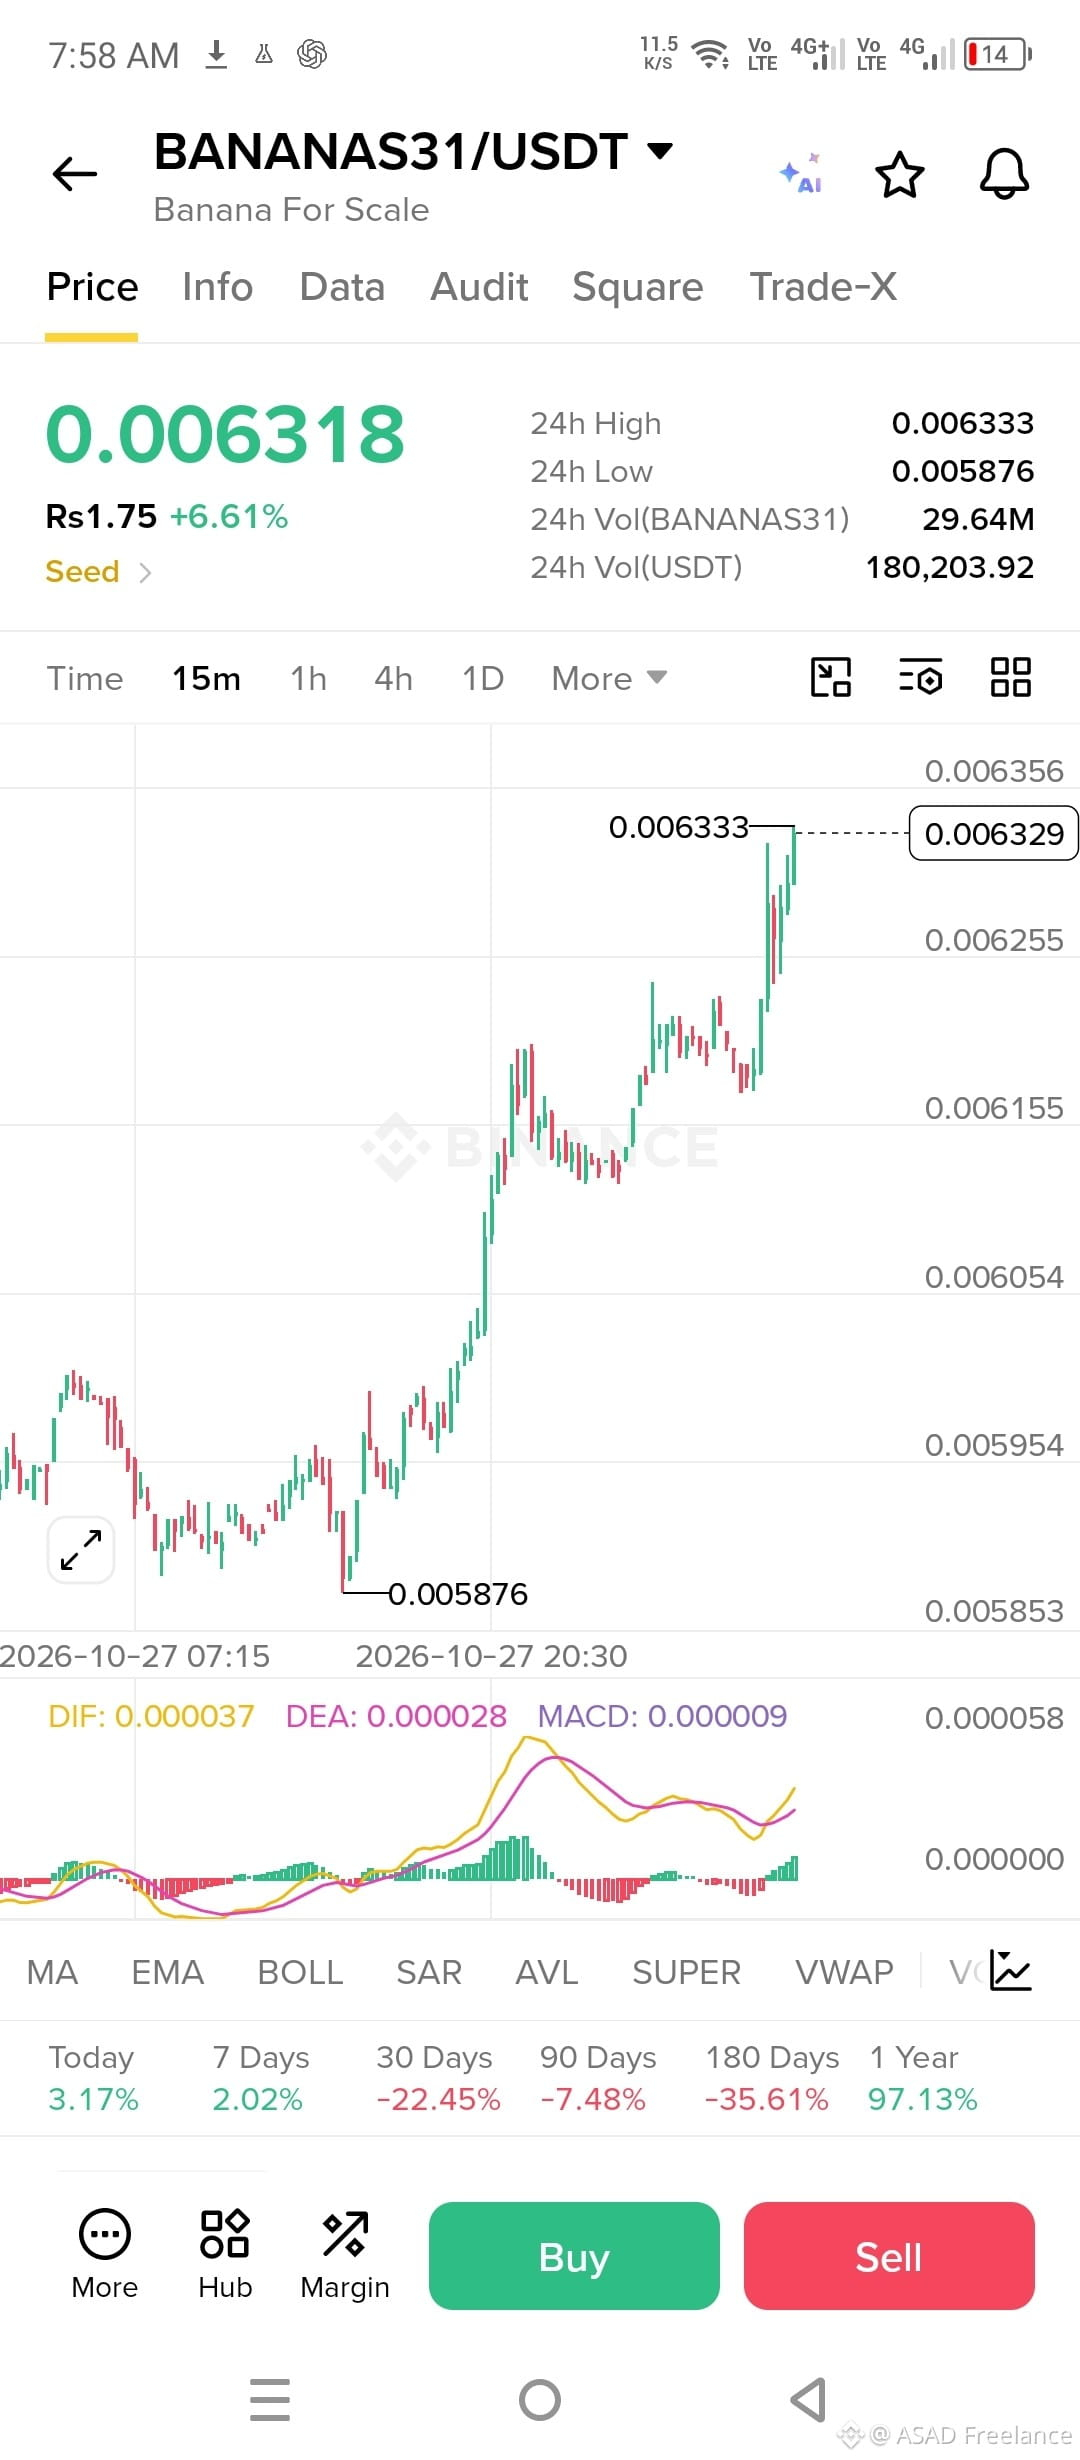
🚀 $BANANAS31 Is Going BANANAS! 🍌🔥 Bulls Are Taking Control!
💰 Current Price: $0.006318
📈 24H Change: +6.61%
🎯 24H High: $0.006333
📉 24H Low: $0.005876
🟢 Bullish Momentum Is Building!
$BANANAS31 is showing impressive upward momentum after bouncing from $0.005876. The chart shows a strong recovery, with buyers pushing the price close to its 24-hour high. The MACD is also turning upward, suggesting a possible continuation of the move.
🎯 Potential Targets:
- TP1: $0.00640
- TP2: $0.00650
- TP3: $0.00665
🛑 Stop Loss: $0.00620
📊 Key Resistance: $0.006333
A breakout above $0.006333 could open the door to further gains, while rejection may trigger a short-term pullback. Watch the price action and manage your risk carefully.
🔥 Can $BANANAS31 reach $0.00665 next? 🍌🚀
💬 Share your targets and trading ideas below!
#BANANAS31 #BananaForScale #Crypto #Altcoins #BinanceSquare #CryptoTrading #BullishMomentum
Targets and stop loss are illustrative technical levels, not guaranteed outcomes. Always do your own research.

202
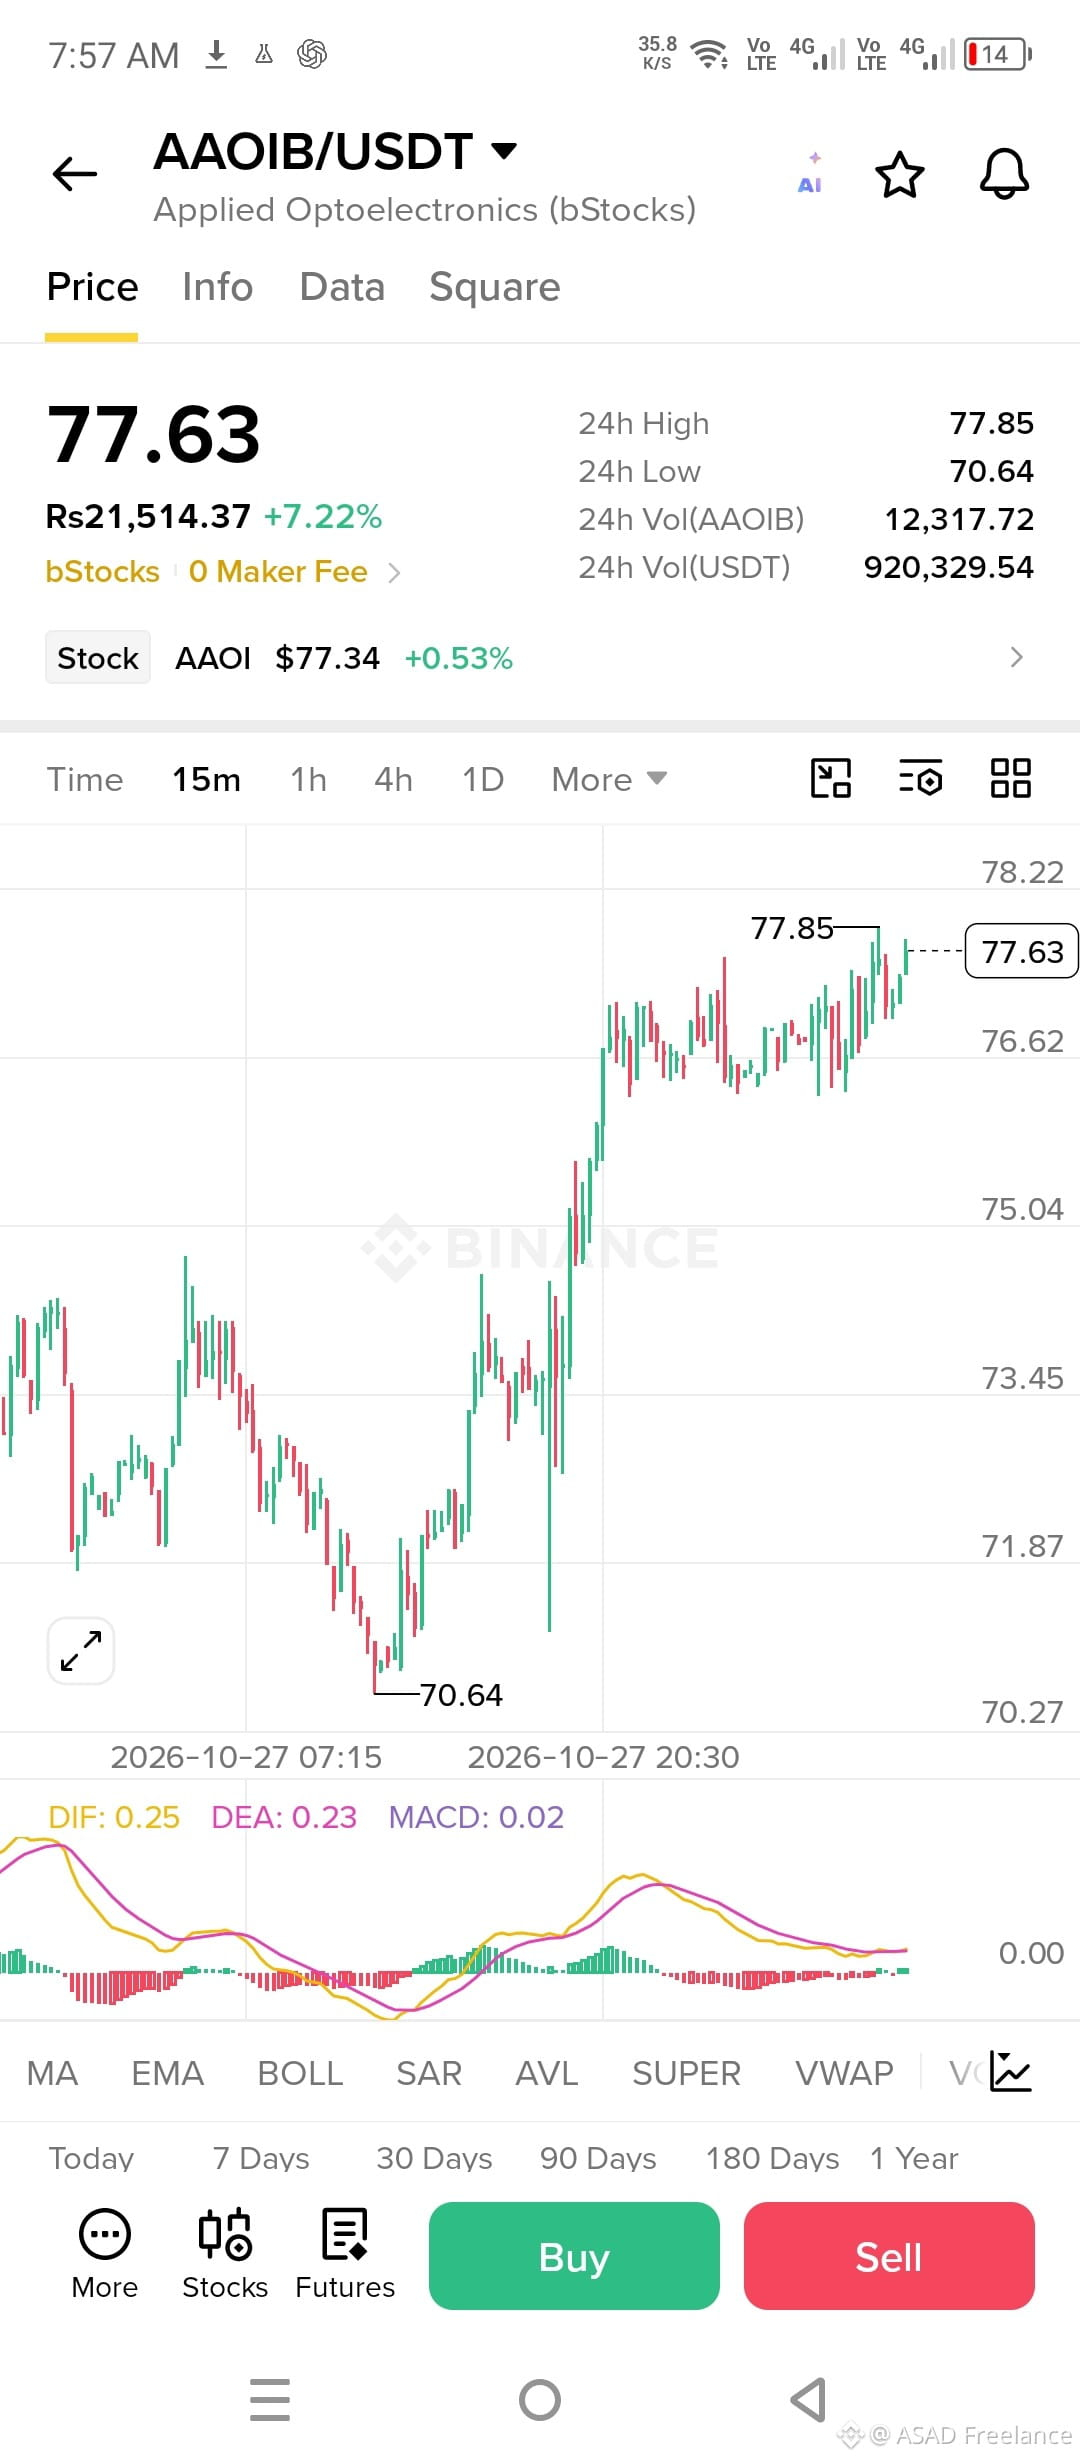
🚀 $AAOIB (Applied Optoelectronics) Is Moving Higher! 🔥
💰 Current Price: $77.63
📈 24H Change: +7.22%
🎯 24H High: $77.85
📉 24H Low: $70.64
🟢 Bulls Are Showing Strength!
$AAOIB is demonstrating strong upward momentum after rebounding from $70.64. The price is now trading near the 24-hour high, and traders are watching for a potential breakout above $77.85.
🎯 Potential Targets:
- TP1: $78.50
- TP2: $79.50
- TP3: $81.00
🛑 Stop Loss: $76.50
📊 Key Levels to Watch:
- Support: $76.50
- Resistance: $77.85
A confirmed breakout could create room for further upside, while rejection near resistance may lead to a pullback. Wait for confirmation and manage your risk carefully.
🔥 Can $AAOIB break above $78 and continue its rally? Share your thoughts below! 👇
#AAOIB #AppliedOptoelectronics #Binance #Stocks #Trading #MarketMomentum #BinanceSquare
Note: Targets and stop-loss levels are illustrative technical levels based on the screenshot, not guaranteed outcomes. AAOIB is a tokenized stock product, so check its trading terms and underlying-market risks.
137
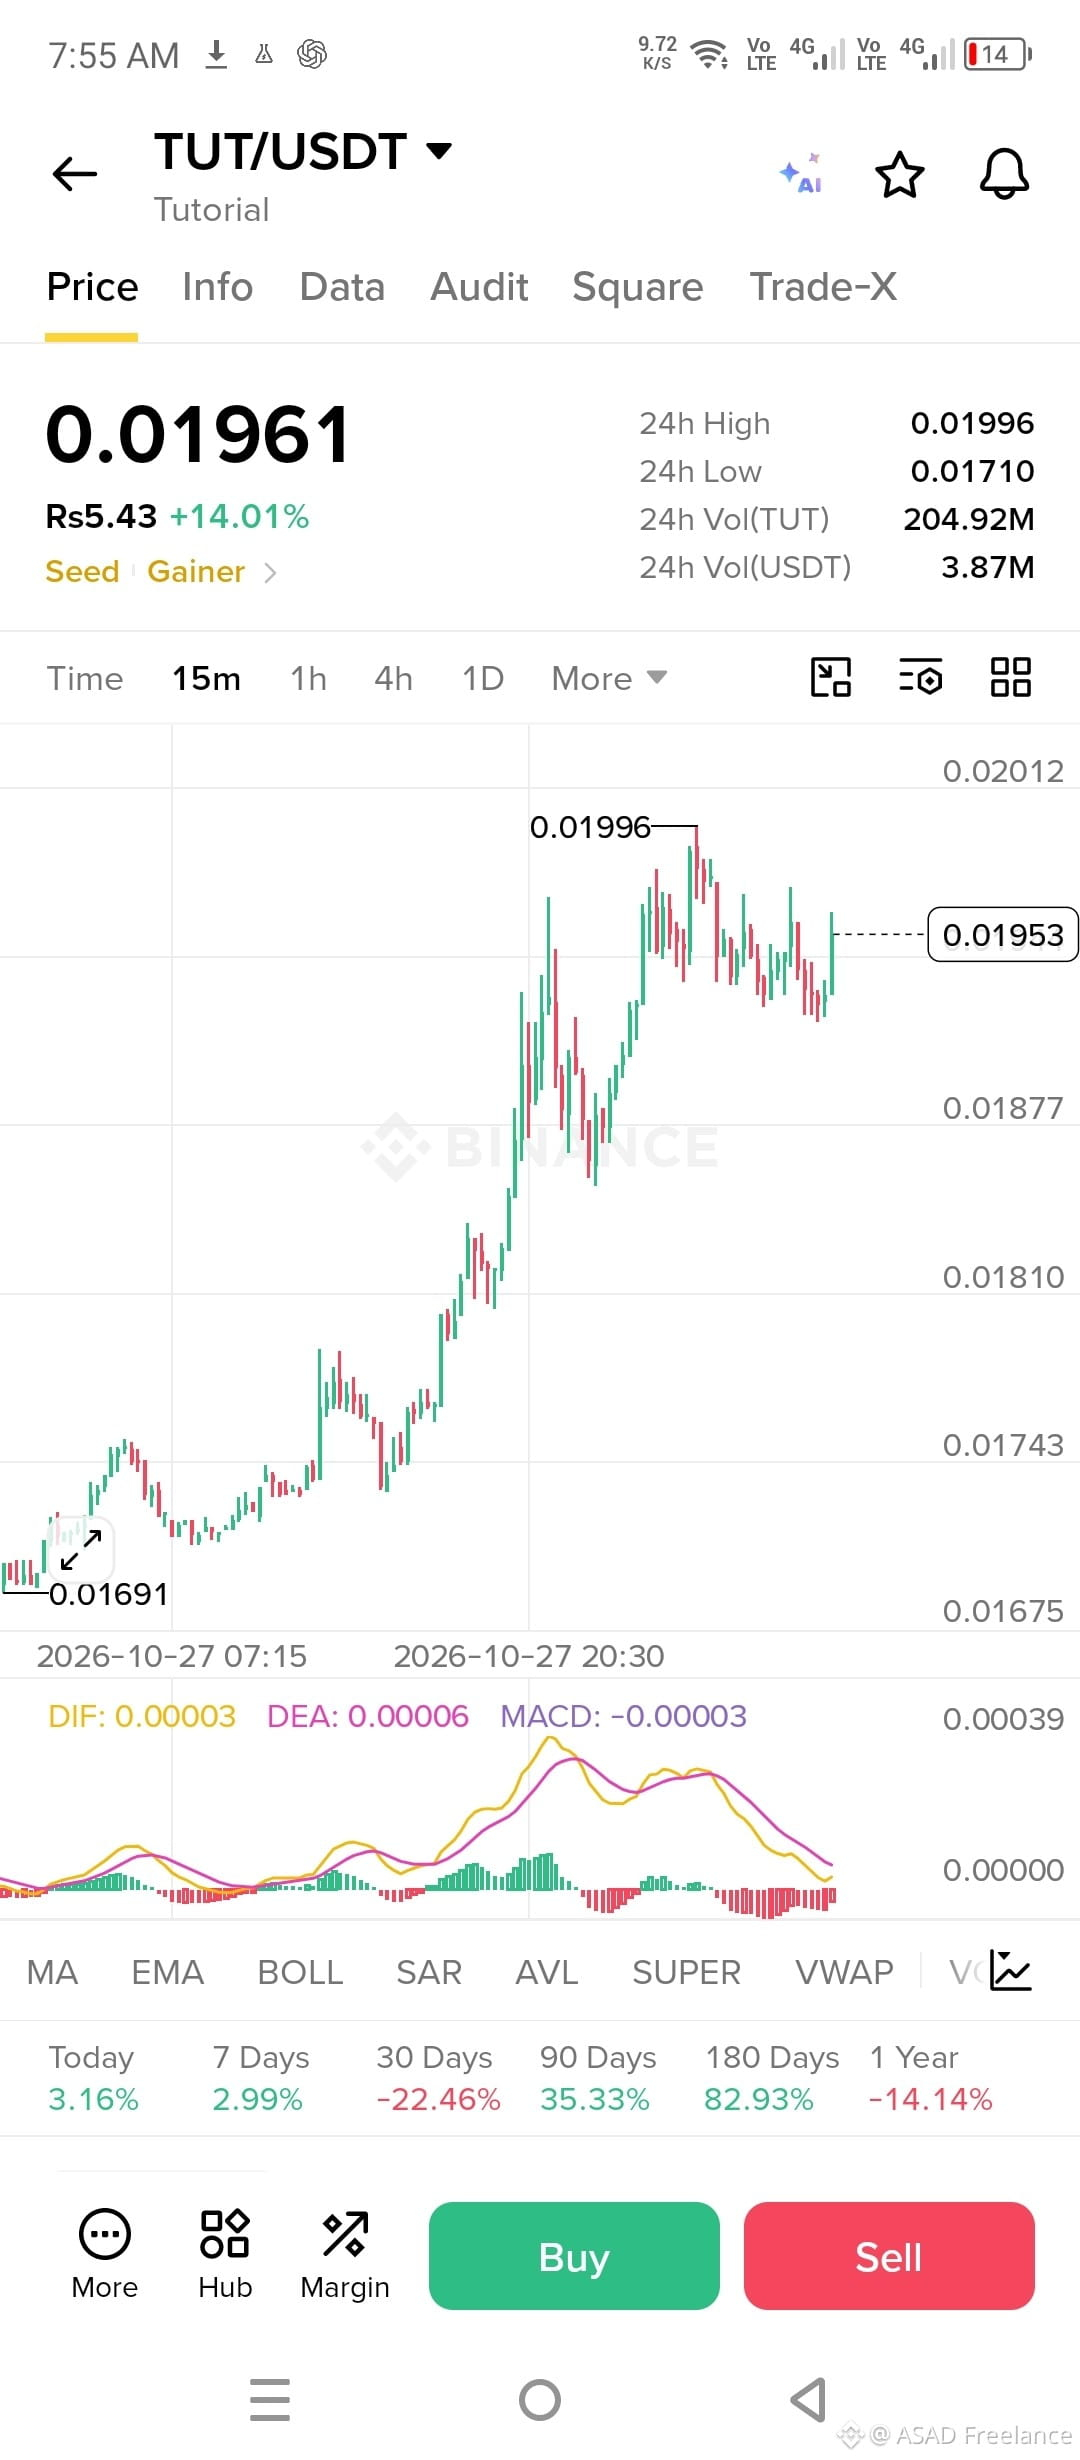
🚀 $TUT (Tutorial) Is Pumping! Bulls Are Taking Control! 🔥
💰 Current Price: $0.01961
📈 24H Change: +14.01%
🎯 24H High: $0.01996
📉 24H Low: $0.01710
$TUT is showing impressive bullish momentum after a strong upward move! 🟢 Buyers have pushed the price close to the $0.01996 resistance level, and traders are watching closely for a potential breakout.
🎯 Potential Targets:
- TP1: $0.02000
- TP2: $0.02050
- TP3: $0.02100
🛑 Stop Loss: $0.01900
📊 Key Levels to Watch:
- Support: $0.01900
- Resistance: $0.01996
A clean breakout above $0.01996 could open the door to further gains, while rejection may trigger a short-term pullback. Wait for confirmation and manage your risk carefully.
🔥 Can $TUT break above $0.02000 and continue its rally? What's your target? 👇
#TUT #Tutorial #Crypto #BinanceSquare #Altcoins #CryptoTrading #BullishMomentum
279
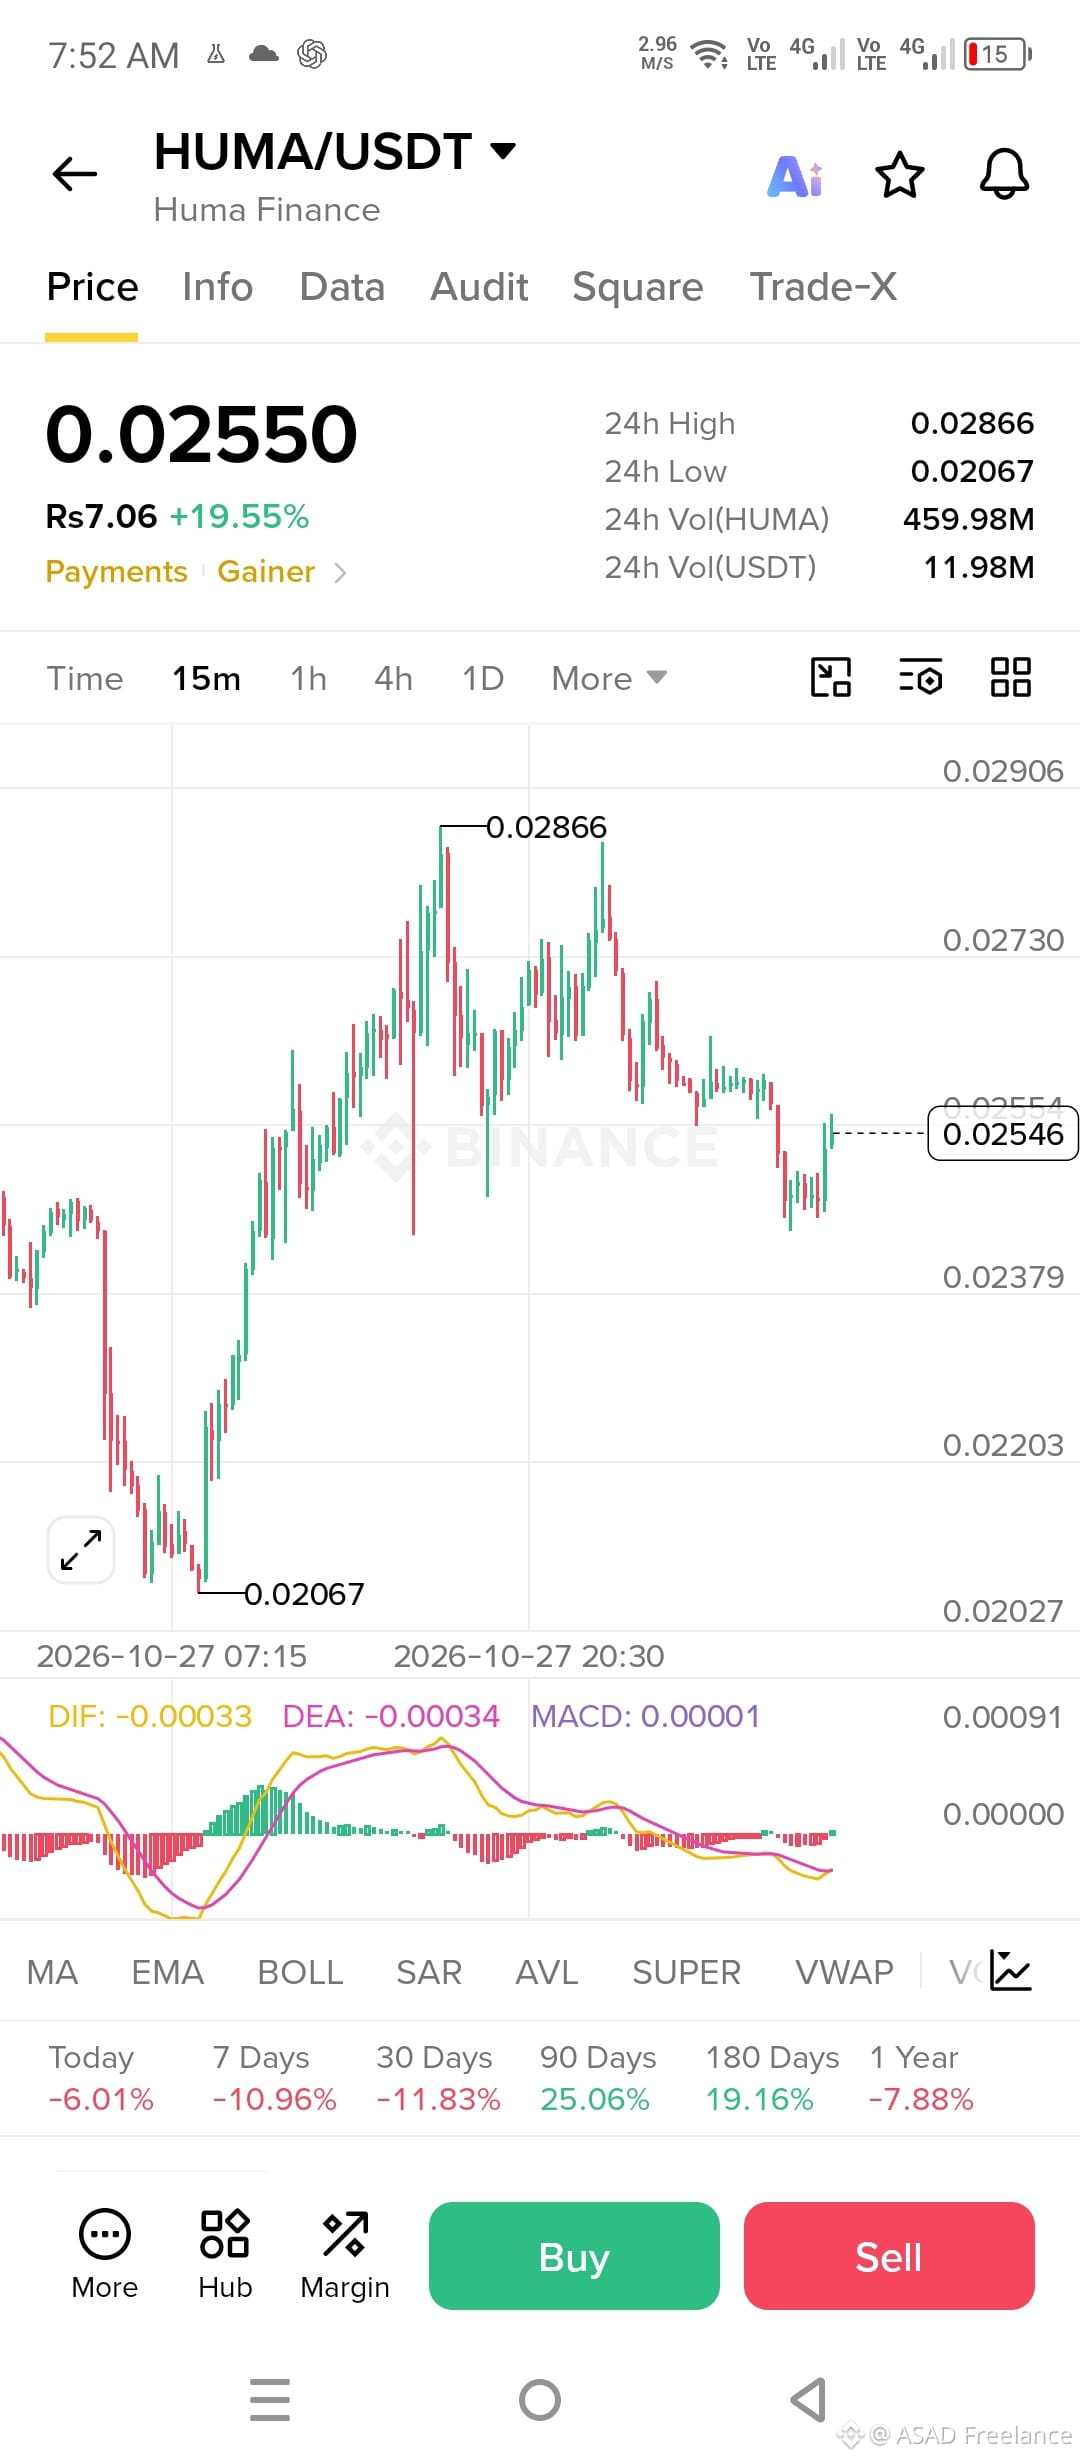
🚀 $HUMA (HUMA Finance) Is Showing Strong Momentum! 🔥
💰 Current Price: $0.02550
📈 24H Change: +19.55%
🎯 24H High: $0.02866
📉 24H Low: $0.02067
$HUMA is making a strong recovery after bouncing from the $0.02067 support zone! 🟢 Buyers are stepping in, and the price is attempting to regain bullish momentum.
🎯 Potential Targets:
- TP1: $0.02650
- TP2: $0.02730
- TP3: $0.02866
🛑 Stop Loss: $0.02450
👀 Watch the $0.02650 resistance closely. A strong breakout could open the door to another upward move, while rejection may bring a short-term pullback.
💎 Stay focused, manage your risk, and never chase a pump without confirmation!
🔥 Are you bullish on $HUMA? Can it break $0.02866? Share your thoughts below! 👇
#HUMA #HUMAFinance #Crypto #BinanceSquare #Altcoins #CryptoTrading #BullishMomentum
🚀 $HUMA (HUMA Finance) Is Showing Strong Momentum! 🔥
💰 Current Price: $0.02550
📈 24H Change: +19.55%
🎯 24H High: $0.02866
📉 24H Low: $0.02067
$HUMA is making a strong recovery after bouncing from the $0.02067 support zone! 🟢 Buyers are stepping in, and the price is attempting to regain bullish momentum.
🎯 Potential Targets:
- TP1: $0.02650
- TP2: $0.02730
- TP3: $0.02866
🛑 Stop Loss: $0.02450
👀 Watch the $0.02650 resistance closely. A strong breakout could open the door to another upward move, while rejection may bring a short-term pullback.
💎 Stay focused, manage your risk, and never chase a pump without confirmation!
🔥 Are you bullish on $HUMA ? Can it break $0.02866? Share your thoughts below! 👇
#HUMA #HUMAFinance #Crypto #BinanceSquare #Altcoins #CryptoTrading #BullishMomentum

111
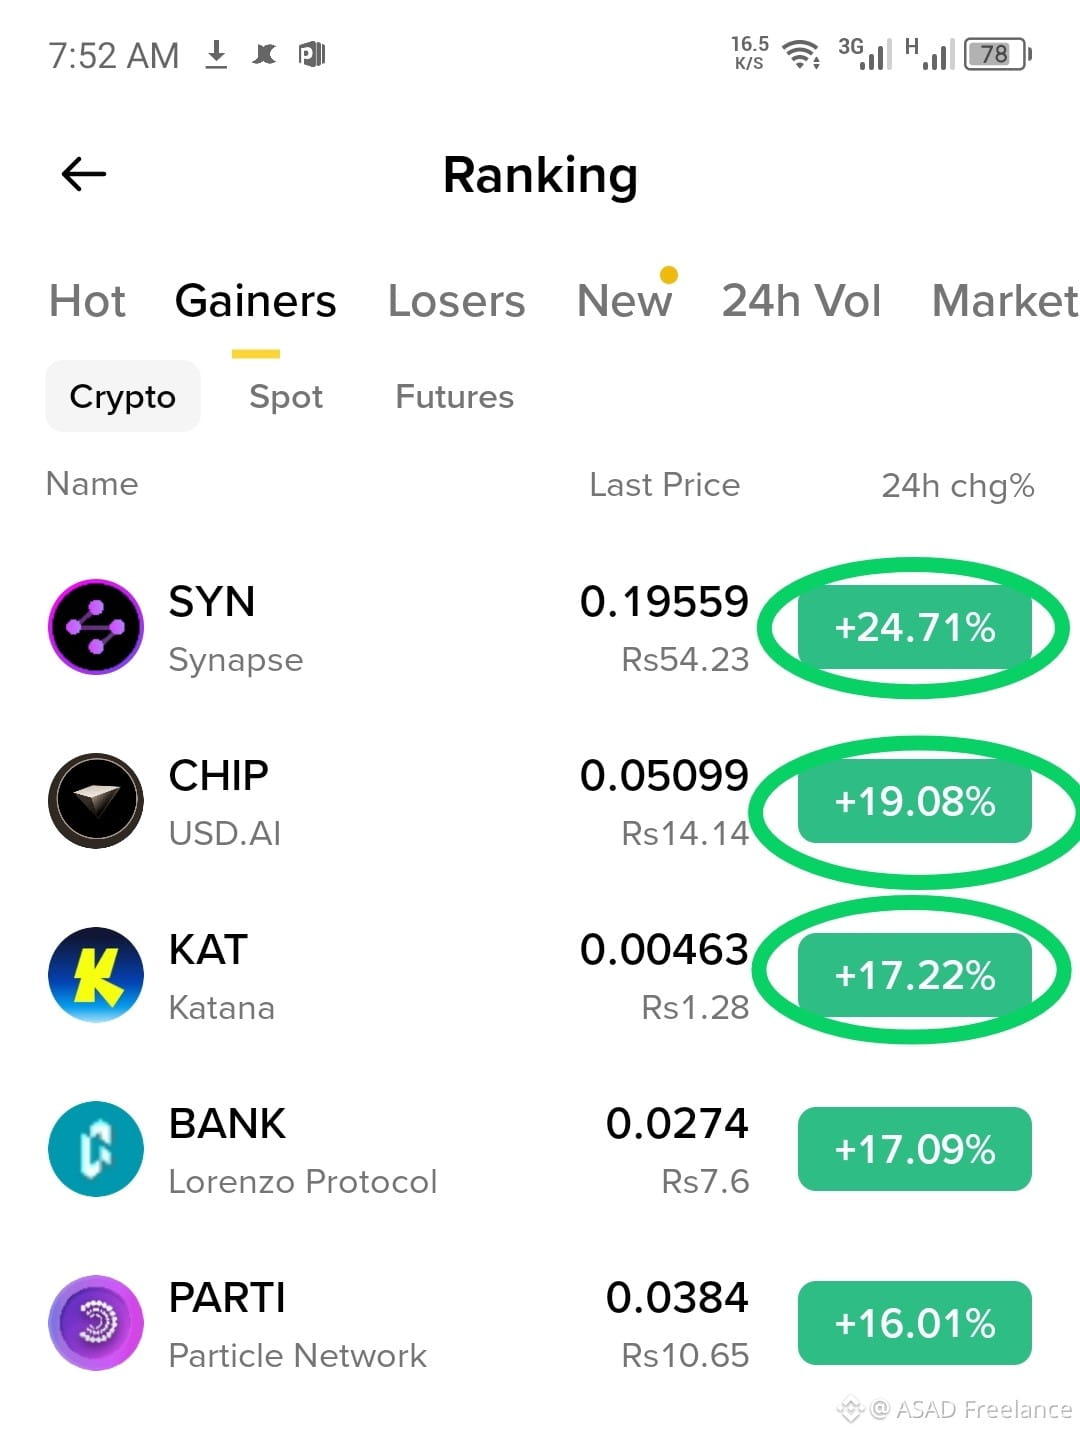
Today Top three Gainer coins list
1 $SYN
2 $CHIP
3 $BANK
Today Top three Gainer coins list
1 $SYN
2 $CHIP
3 $BANK
1 $SYN
2 $CHIP
3 $BANK
511
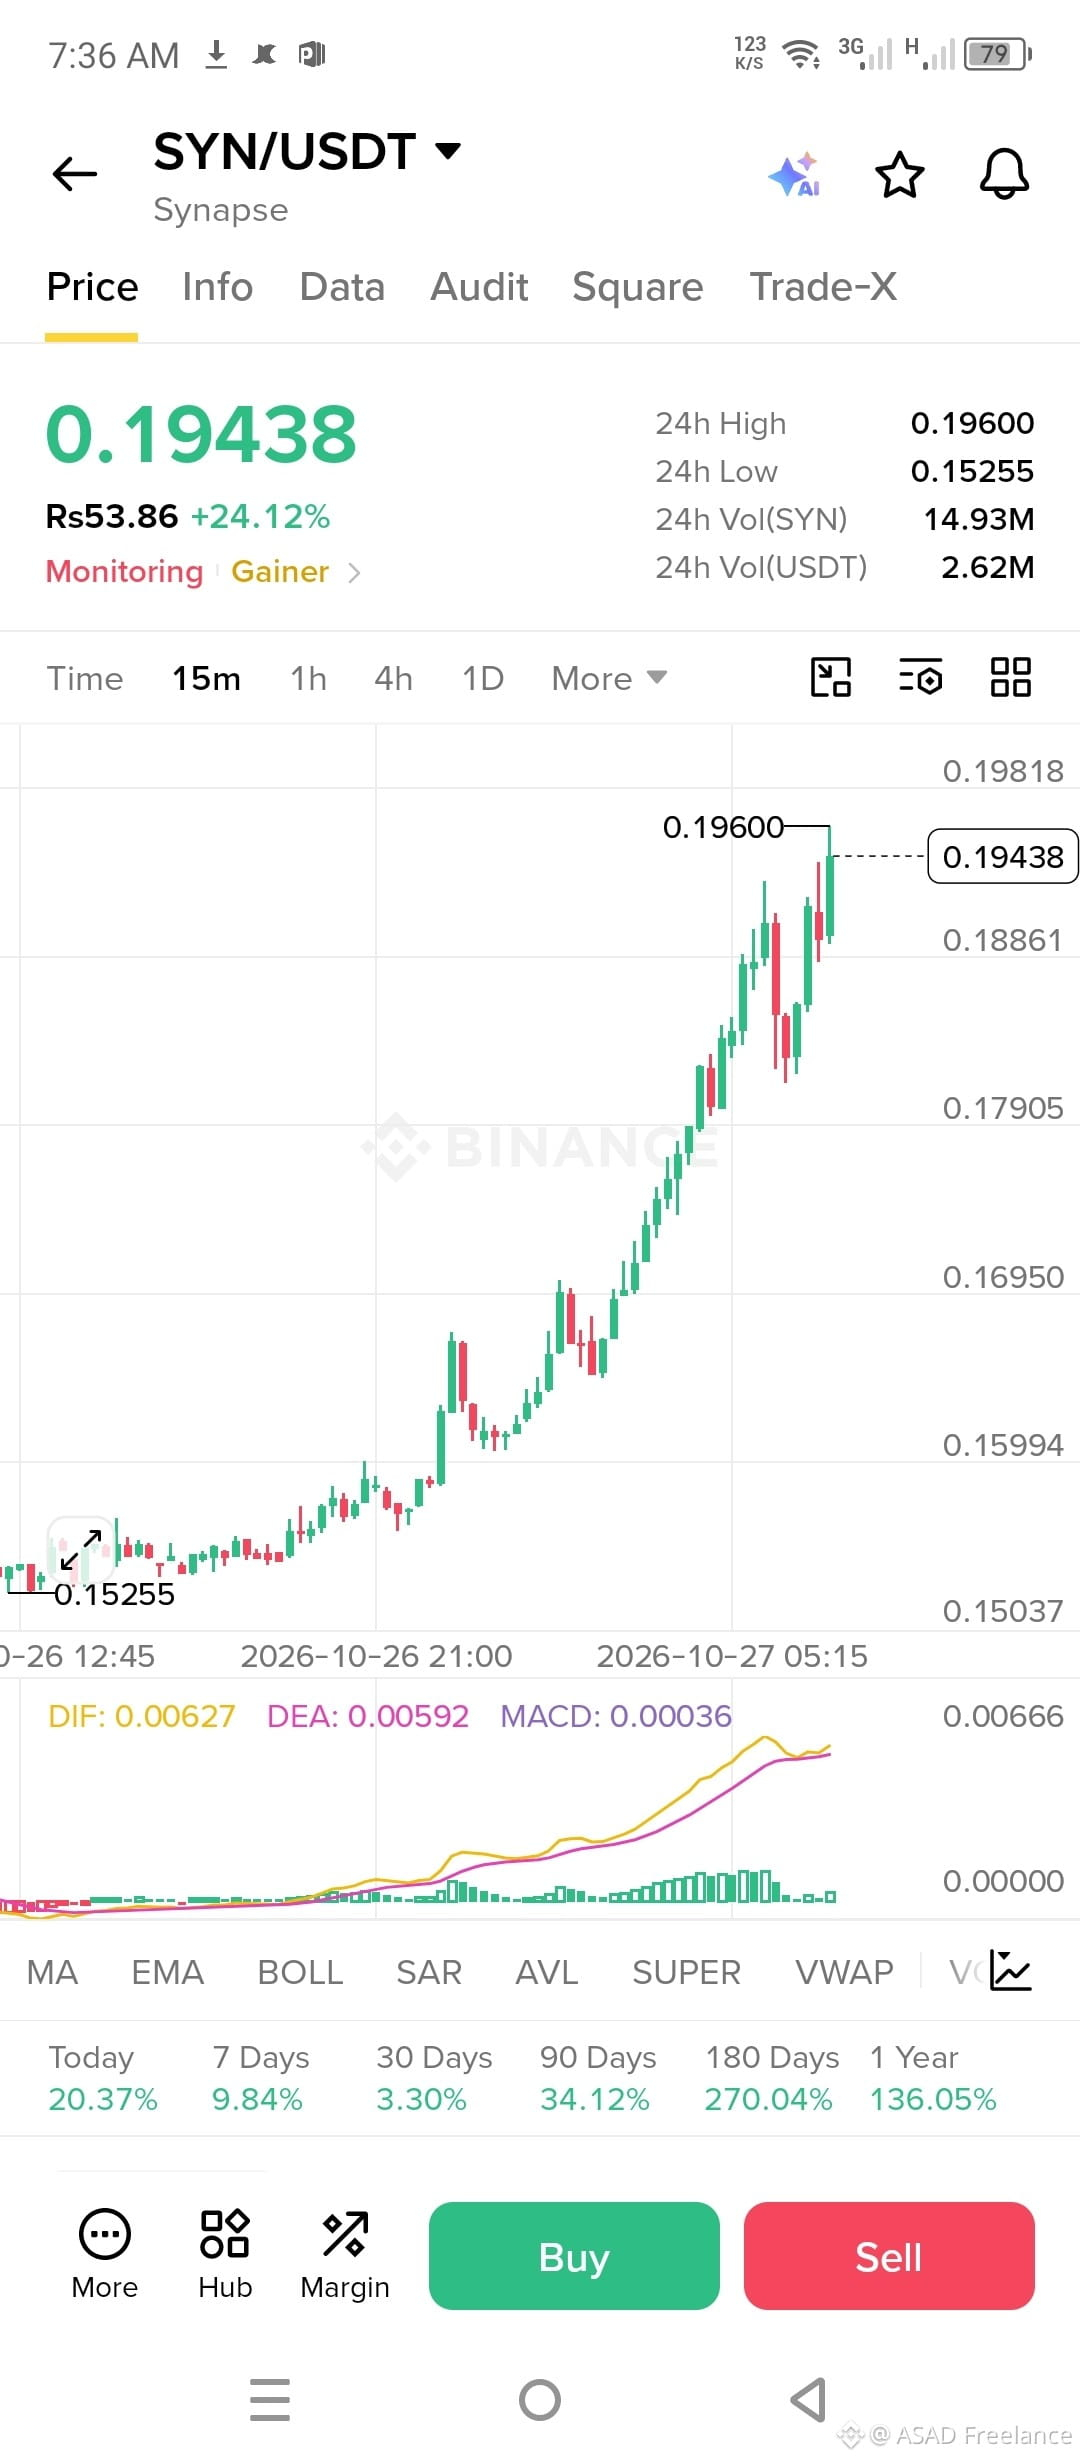
$SYN now on fire 🔥🔥🔥
with 23% growth rate last 24 hours
the green candles is rising up to the sky
$SYN now on fire 🔥🔥🔥
with 23% growth rate last 24 hours
the green candles is rising up to the sky
with 23% growth rate last 24 hours
the green candles is rising up to the sky
99
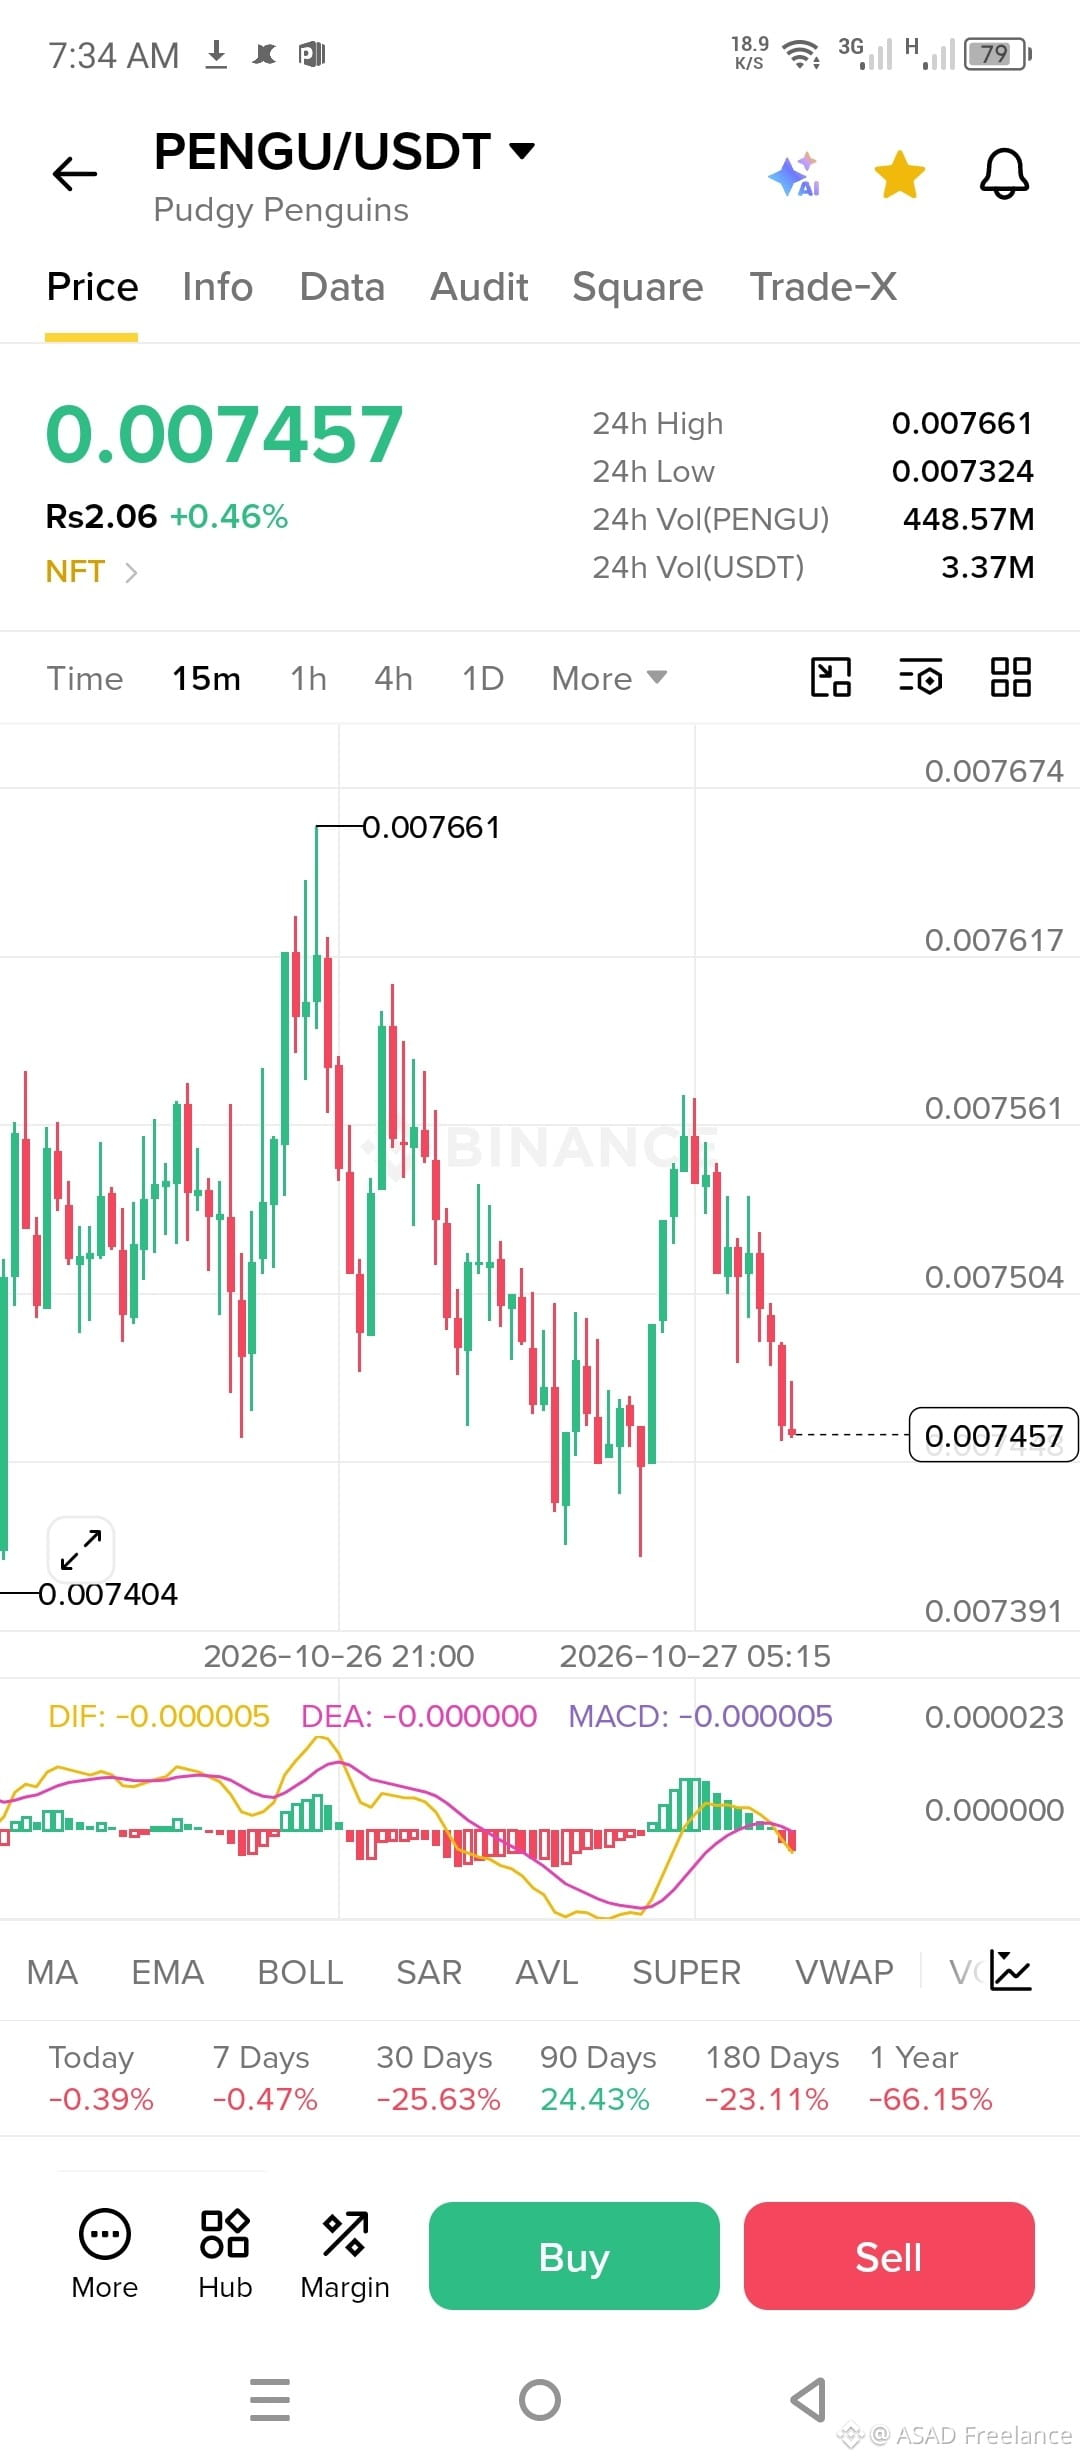
🐧🔥 $PENGU — Can Bulls Make a Comeback?
💰 Current Price: $0.007457
📈 24H Change: +0.46%
🎯 24H High: $0.007661
🛡️ Key Support: $0.007404
$PENGU is facing short-term selling pressure after failing to maintain its recent upward momentum. The 15-minute chart shows a pullback, while the MACD has turned negative, suggesting that sellers currently have the advantage.
🎯 Potential Targets:
- TP1: $0.007504
- TP2: $0.007561
- TP3: $0.007617
🛑 Stop Loss: $0.007390
🚀 Bullish Scenario: If PENGU holds support and reclaims $0.007504, buyers could push toward $0.007561 and potentially $0.007617.
⚠️ Bearish Scenario: A break below $0.007404 could lead to further downside.
🐧 Stay alert, trade with confirmation, and manage your risk wisely!
💬 PENGU Army, will we see a bullish reversal or another dip?
#PENGU #PudgyPenguins #CryptoTrading #BinanceSquare #Altcoins #CryptoMarket

1
1
265
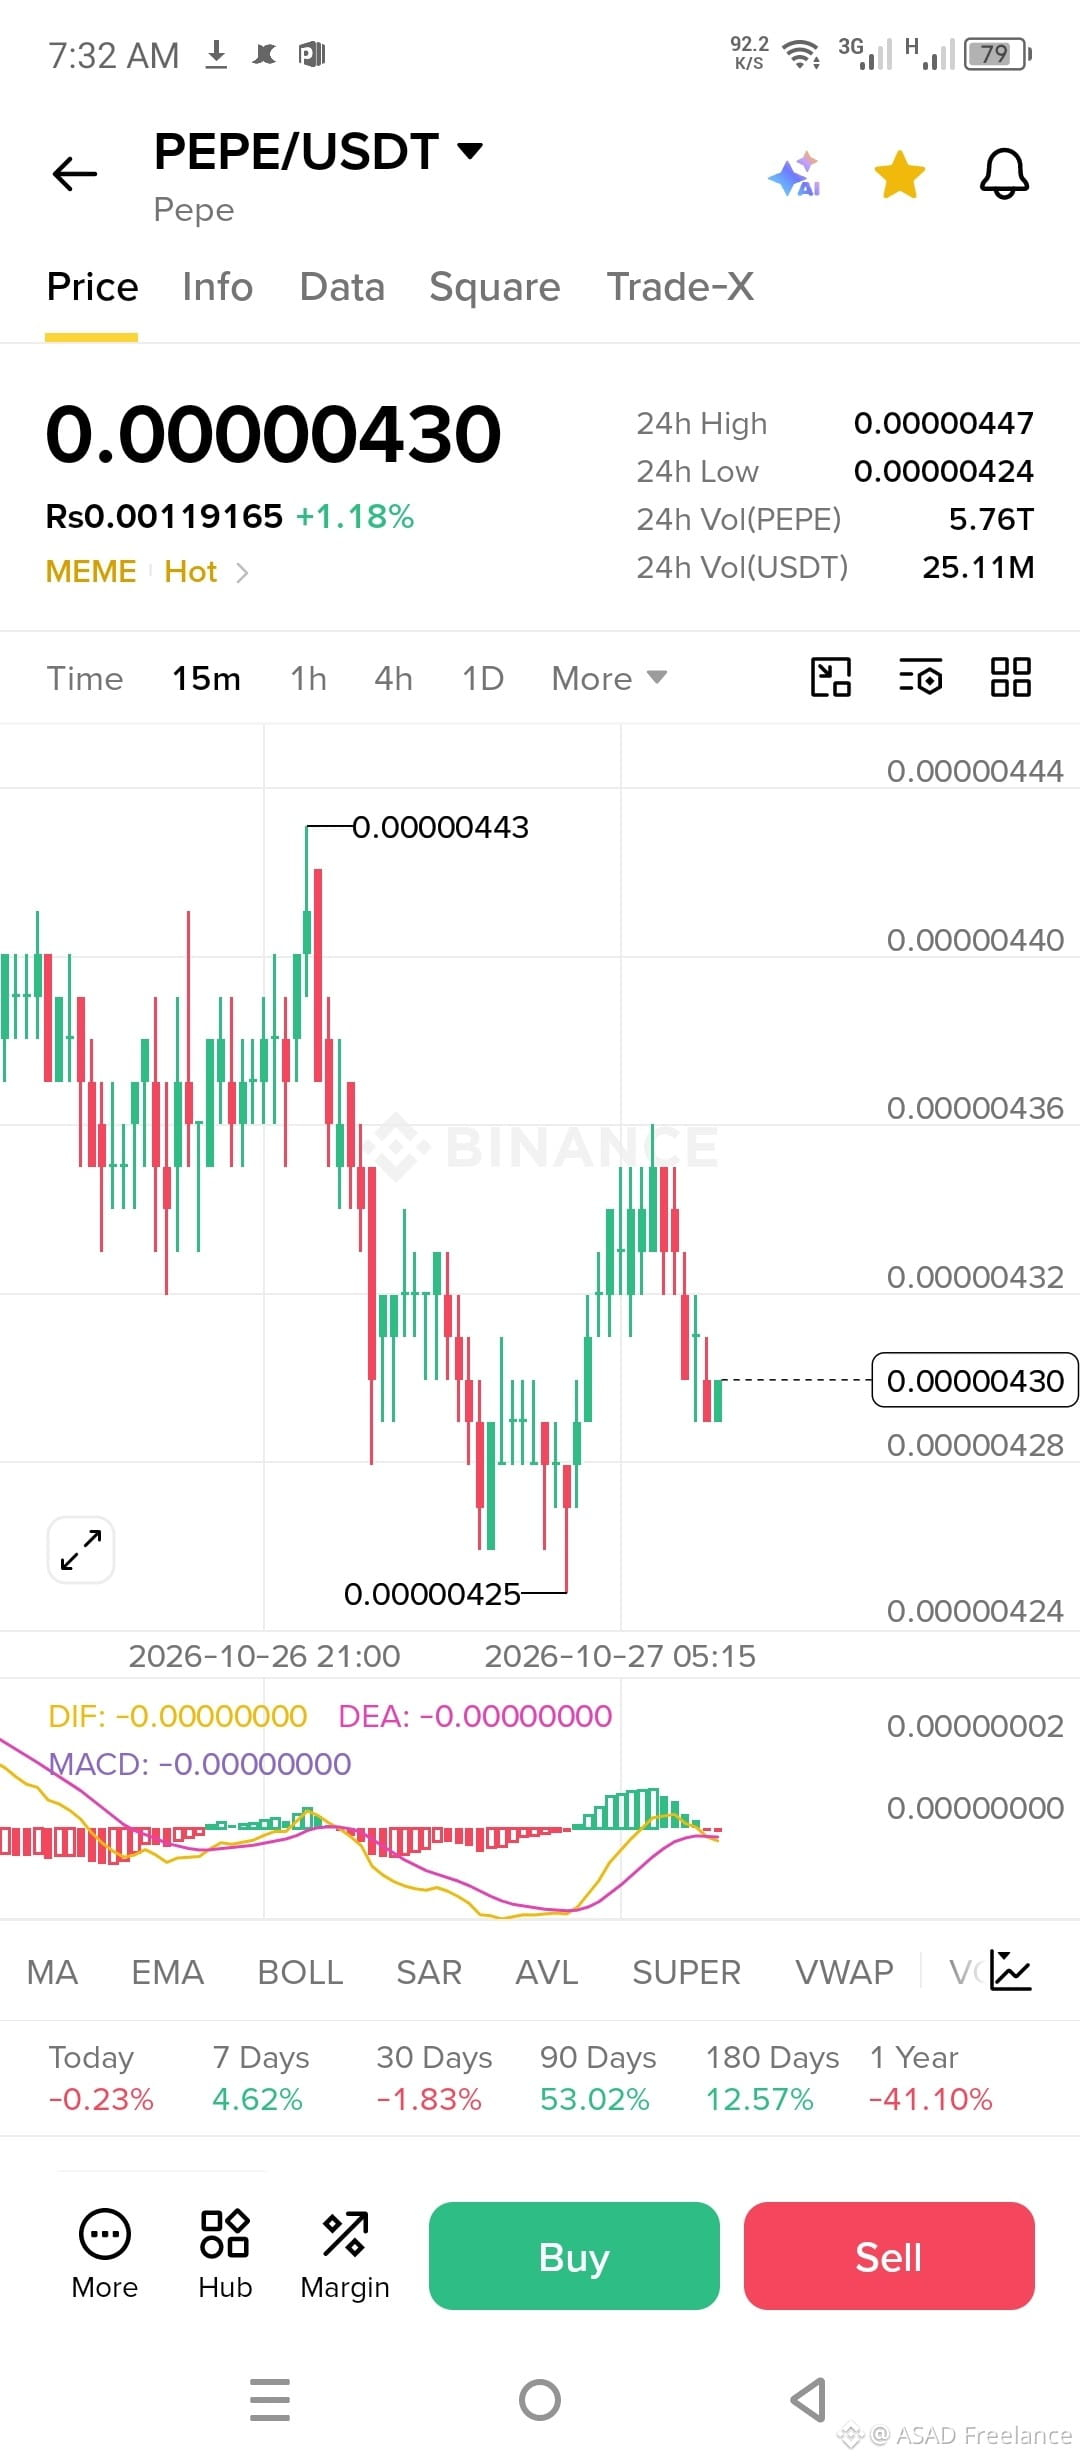
🐸🔥 $PEPE — Is the Next Move Coming?
💰 Current Price: $0.00000430
📈 24H Change: +1.18%
🎯 24H High: $0.00000447
🛡️ Key Support: $0.00000425
$PEPE is trying to recover after bouncing from the $0.00000425 support zone. The recent chart shows a short-term rebound, but buying pressure needs to strengthen for another bullish move. Traders should watch the $0.00000432–$0.00000436 resistance zone closely.
🎯 Potential Targets:
- TP1: $0.00000432
- TP2: $0.00000436
- TP3: $0.00000443
🛑 Stop Loss: $0.00000424
🚀 A breakout above resistance could bring fresh momentum toward $0.00000443. However, if support fails, further downside is possible. Wait for confirmation and manage risk carefully.
🐸 PEPE Army, are we ready for the next pump? 🔥💚
#PEPE #PEPECoin #CryptoTrading #BinanceSquare #Memecoins #CryptoMarket #Altcoins

1
206
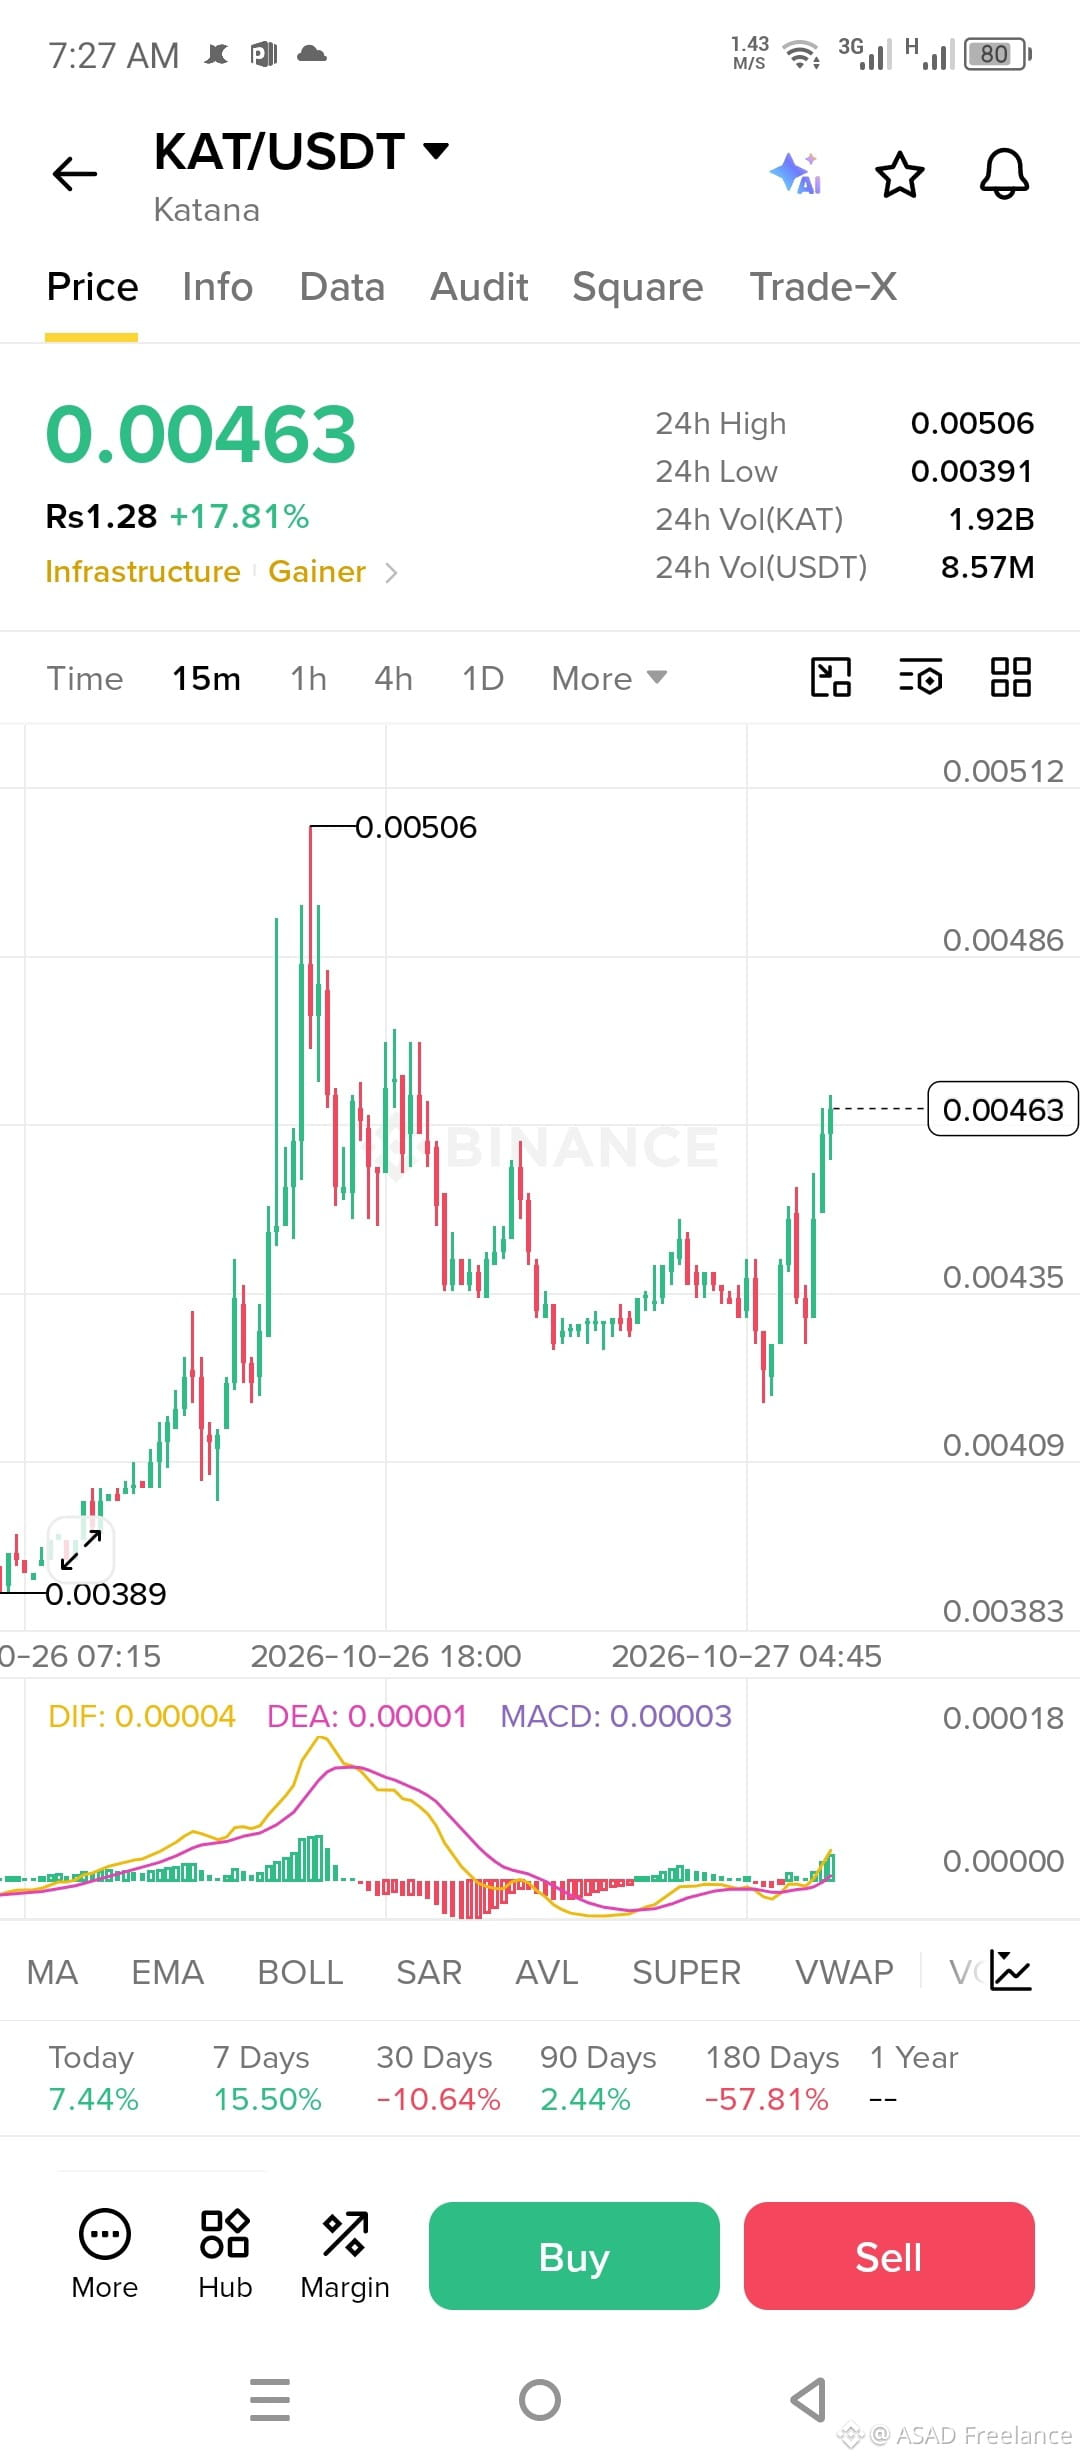
🚀 $KAT (Katana) Is Heating Up! 🔥 Bullish Momentum Building!
📈 Current Price: $0.00463
🟢 24H Gain: +17.81%
🎯 24H High: $0.00506
$KAT is showing strong bullish momentum after a powerful recovery from the $0.00389 support area. The latest 15-minute candles are moving upward, while the MACD indicator is turning positive, suggesting that buyers are gaining strength.
🎯 Potential Targets:
- TP1: $0.00475
- TP2: $0.00486
- TP3: $0.00506
🛑 Stop Loss: $0.00445
👀 Watch the $0.00486 resistance closely. A confirmed breakout could open the door toward the recent high of $0.00506. However, after a strong rally, a pullback is also possible.
💎 Stay patient, manage your risk, and trade with a clear strategy!
🔥 Are you bullish on $KAT? Can it break $0.00506? Share your thoughts below! 👇
#KAT #Katana #Crypto #BinanceSquare #Altcoins #TradingSignals #BullishMomentum
🚀 $KAT (Katana) Is Heating Up! 🔥 Bullish Momentum Building!
📈 Current Price: $0.00463
🟢 24H Gain: +17.81%
🎯 24H High: $0.00506
$KAT is showing strong bullish momentum after a powerful recovery from the $0.00389 support area. The latest 15-minute candles are moving upward, while the MACD indicator is turning positive, suggesting that buyers are gaining strength.
🎯 Potential Targets:
- TP1: $0.00475
- TP2: $0.00486
- TP3: $0.00506
🛑 Stop Loss: $0.00445
👀 Watch the $0.00486 resistance closely. A confirmed breakout could open the door toward the recent high of $0.00506. However, after a strong rally, a pullback is also possible.
💎 Stay patient, manage your risk, and trade with a clear strategy!
🔥 Are you bullish on $KAT ? Can it break $0.00506? Share your thoughts below! 👇
#KAT #Katana #Crypto #BinanceSquare #Altcoins #TradingSignals #BullishMomentum

170
Войдите, чтобы посмотреть больше материала
Присоединяйтесь к пользователям криптовалют по всему миру на Binance Square
⚡️ Получайте новейшую и полезную информацию о криптоактивах.
💬 Нам доверяет крупнейшая в мире криптобиржа.
👍 Получите достоверные аналитические данные от верифицированных создателей контента.
Эл. почта/номер телефона
В тренде
UniswapA16zSeekDeFiExemptionFromIllinoisCryptoTax
Просмотров: 20,160
684 обсуждают
The debate over crypto taxation is heating up as Uniswap and Andreessen Horowitz ( a16z ) push for a DeFi exemption from Illinois proposed crypto tax rules. Their concern is that decentralized finance protocols and non custodial platforms could face unfair tax burdens potentially slowing innovation and making crypto development more difficult. DeFi platforms allow users to trade and manage digital assets without traditional intermediaries so applying conventional financial tax rules may create serious challenges. This could become an important moment for the US crypto industry as regulators must find a balance between fair taxation, investor protection, and innovation. 🚀
The main concern is that the proposed 0.2% tax is calculated on transaction value, not simply trading profits. Uniswap a16z and the DeFi Education Fund want wallet withdrawals and cross chain bridging excluded, while also opposing requirements to maintain private key records. Illinois has agreed to postpone implementation until July 1, 2027 subject to court approval. The outcome could influence how other US states approach DeFi taxation. The Defiant +2
What do you think 🤔 ? Should DeFi transactions be tax free to protect decentralization or should crypto platforms follow traditional tax rules ? 🤔
#UniswapA16zSeekDeFiExemptionFromIllinoisCryptoTax
Volatile
·Лайков: 3
·Просмотров: 188
HKDollarStablecoinHKDAPToLaunchOnSolana
Просмотров: 14,271
422 обсуждают
$1.5BInLeveragedCryptoBetsLiquidated
Просмотров: 33,076
236 обсуждают