

Elon jamess 1
146 Публикации

Elon jamess 1
Отправить жалобу
Заблокировать пользователя
Dream big trust big move big and your outcomes will grow big too.
0 подписок(и/а)
5 подписчиков(а)
7 понравилось
Посты
$ADA Price Update: Key Support Under Pressure
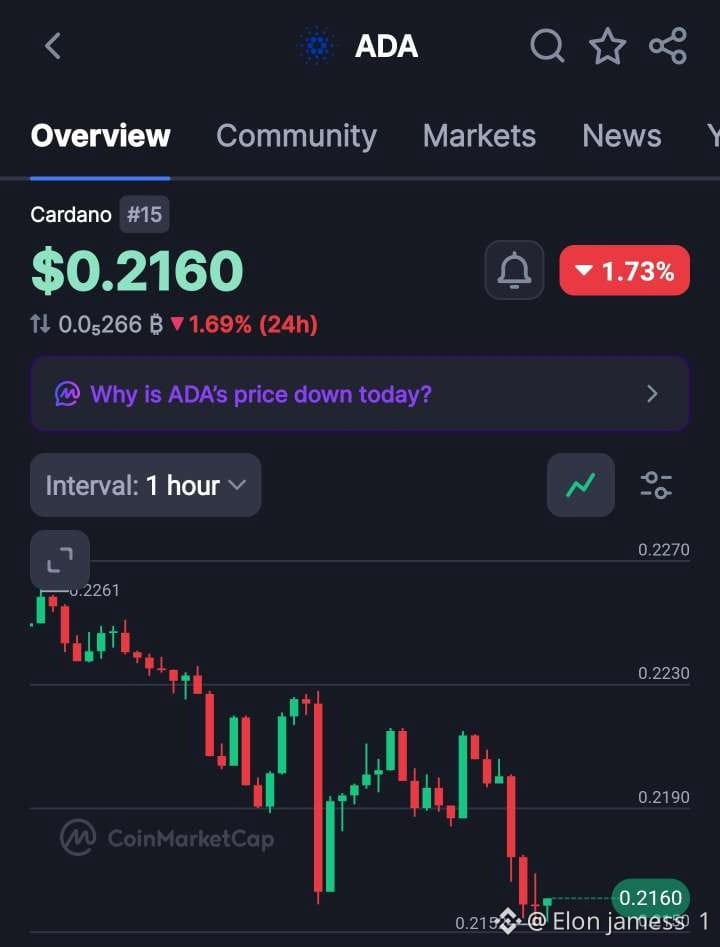
Cardano is trading around $0.2160, down approximately 1.73% in 24 hours.
The 1-hour chart shows continued selling pressure after ADA lost the $0.2190 support zone.
🔹 Key Support: $0.2150–$0.2152
🔹 Resistance: $0.2190, followed by $0.2230
🔹 Bullish Scenario: Reclaiming $0.2190 could open the door to a recovery.
🔹 Bearish Scenario: A confirmed break below $0.2150 may lead to further downside.
The key level to watch is $0.2150. A strong bounce could signal buyers are stepping in, but confirmation is essential.
Stay patient, manage risk, and avoid chasing uncertain moves.
#ADA #Cardano #CryptoAnalysis
72
$ZEC IS SHOWING STRONG BULLISH MOMENTUM
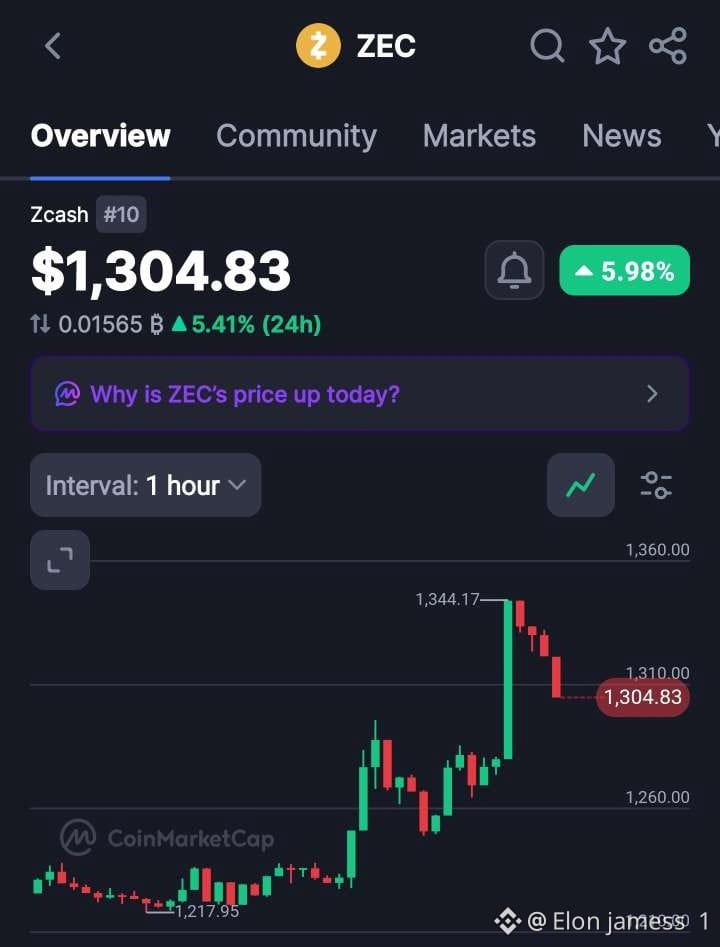
Zcash is trading around $1,304.83, up nearly 6% in 24 hours.
The 1H chart shows a strong breakout from the $1,260 zone, followed by a sharp move toward $1,344.17. Price is now pulling back as traders take profits.
Key levels to watch:
Support: $1,280–$1,260
Resistance: $1,310–$1,344
If buyers defend support and volume returns, another attempt toward $1,344 could be possible. However, losing support may lead to a deeper correction.
The key now is whether $ZEC can stabilize after the breakout. Wait for confirmation instead of chasing the move.
Always DYOR and manage your risk.
74
$ADA is sitting at an interesting spot on the 1H chart.
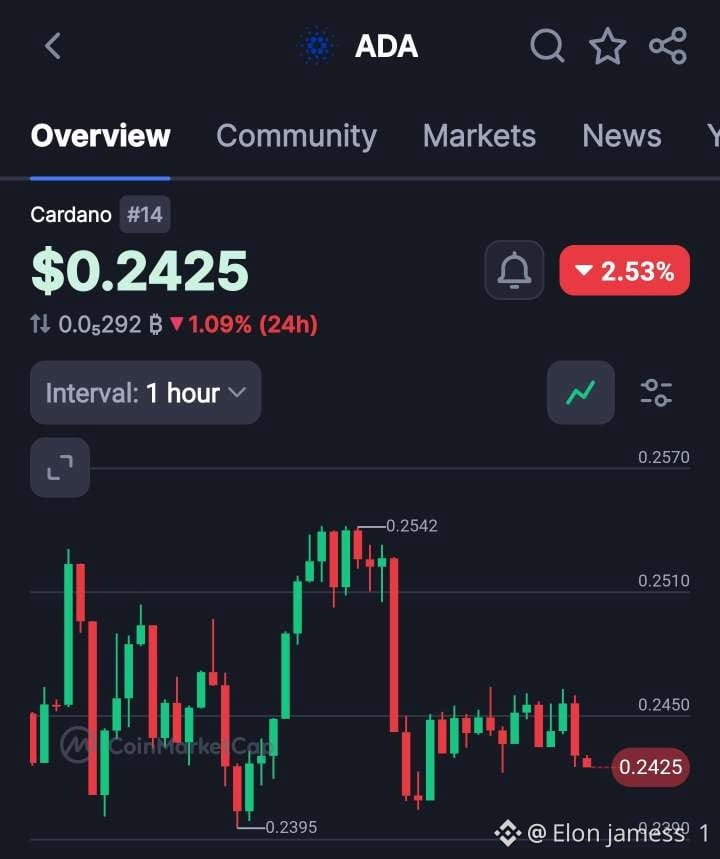
Price is around $0.2425 after getting rejected from the $0.2542 area.
Since that drop, ADA has been moving sideways, with buyers defending around $0.242–$0.243 while $0.245 is acting as nearby resistance.
Key levels I’m watching: • Support: $0.2395–$0.2420
• Resistance: $0.2450, then $0.2510
• Major reclaim: $0.2542
A break above $0.245 could give the chart some strength, while losing $0.2395 would weaken the current structure.
For now, I’d rather watch the levels than chase the move.
DYOR | NFA
74
$QNT — Key Levels to Watch 👀
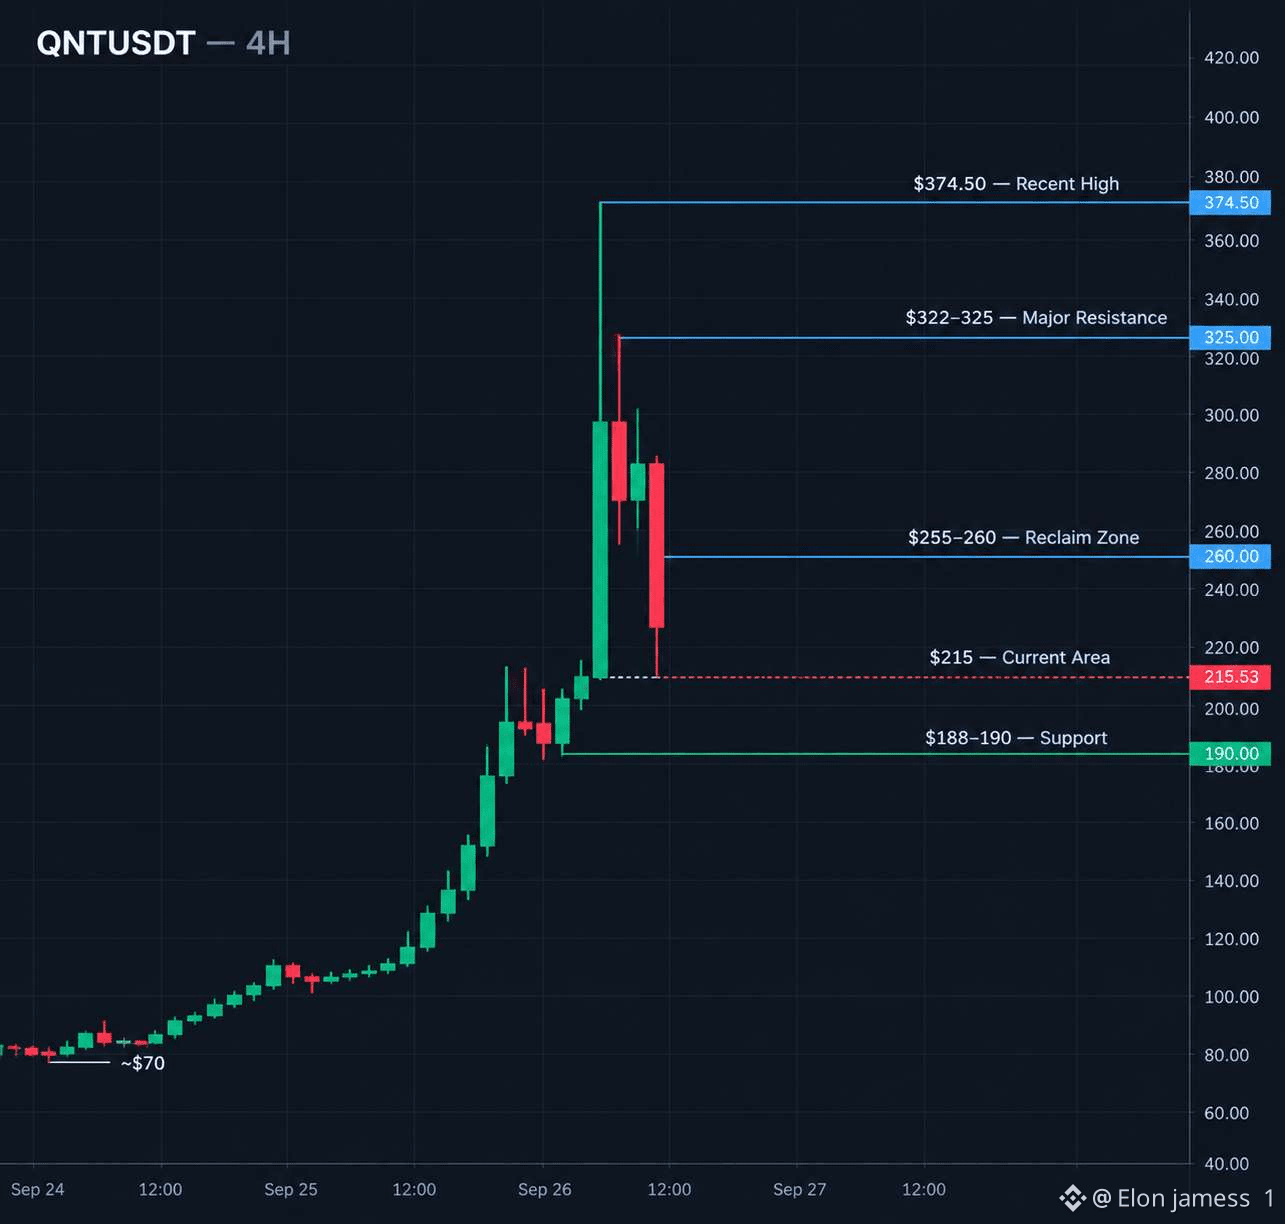
$QNT made a massive move from around $70 to $374.50, followed by a sharp pullback.
Price is now around $215, with volatility still high.
Key levels:
• $188–190 → Support
• $255–260 → Reclaim zone
• $322–325 → Major resistance
• $374.50 → Recent high
After such a strong rally, some consolidation is normal.
For now, I’m watching how price reacts around $188–190 and whether buyers can reclaim $255+.
No need to chase the move. Let the chart confirm the next direction.
#QNT #Crypto #Binance
71
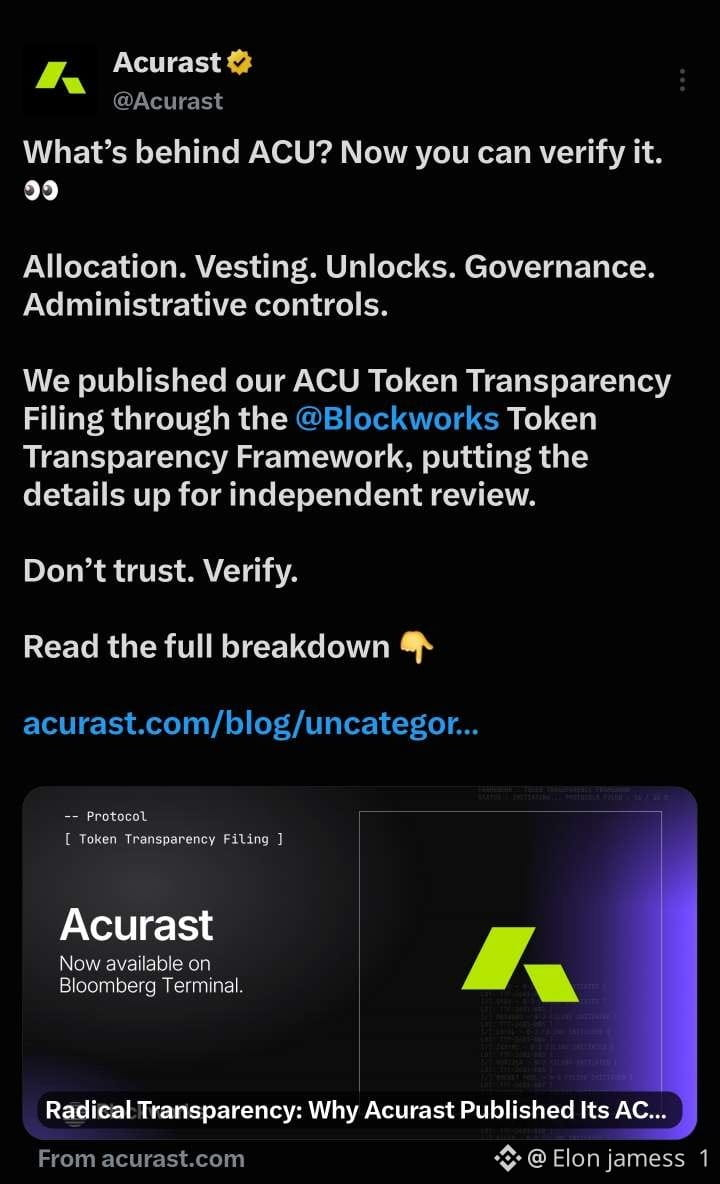
$ACU Transparency Is the Real Update 👀
Acurast has made its ACU Token Transparency Filing available through the Blockworks framework.
What caught my attention is the focus on verifiable token information rather than just marketing:
• Token allocation
• Vesting & unlocks
• Governance structure
• Tokenholder rights
• Treasury controls
For anyone researching $ACU having this information in a standardized filing makes it easier to dig into the token structure and do independent research.
Read the data. Check the details. Make your own view.
Source: Acurast / Blockworks.
62
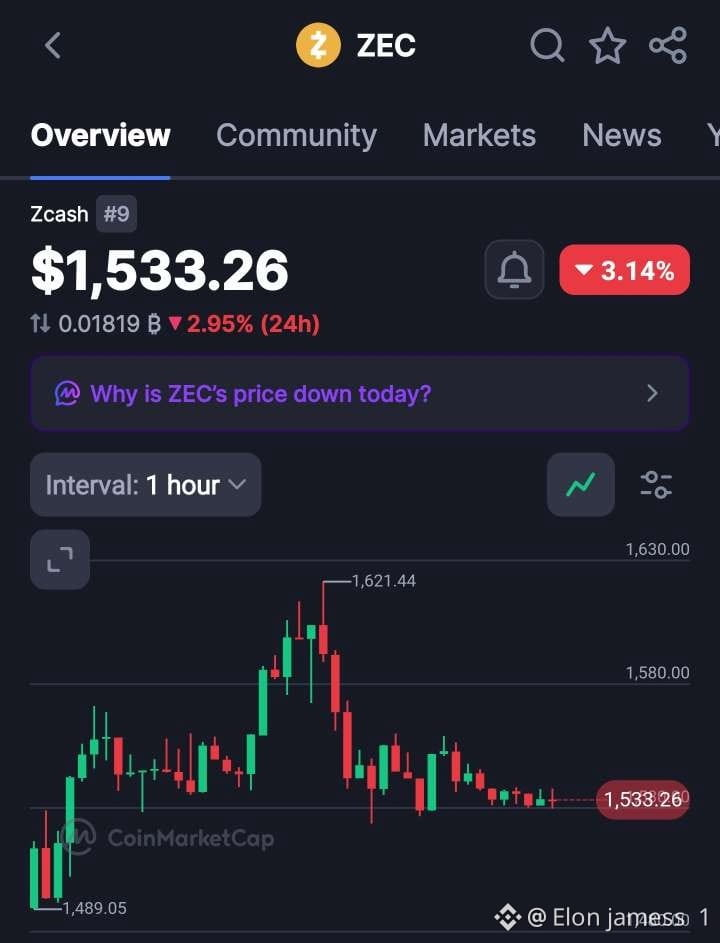
$ZEC is holding around $1,533 after rejecting from the $1,621 high.
Support: $1,530–$1,500
Resistance: $1,580–$1,620
If support holds buyers could step back in.
If it breaks more downside could follow.
Watching the levels, not chasing the move. 👀
DYOR. NFA.
$ZEC is holding around $1,533 after rejecting from the $1,621 high.
Support: $1,530–$1,500
Resistance: $1,580–$1,620
If support holds buyers could step back in.
If it breaks more downside could follow.
Watching the levels, not chasing the move. 👀
DYOR. NFA.
Support: $1,530–$1,500
Resistance: $1,580–$1,620
If support holds buyers could step back in.
If it breaks more downside could follow.
Watching the levels, not chasing the move. 👀
DYOR. NFA.
63
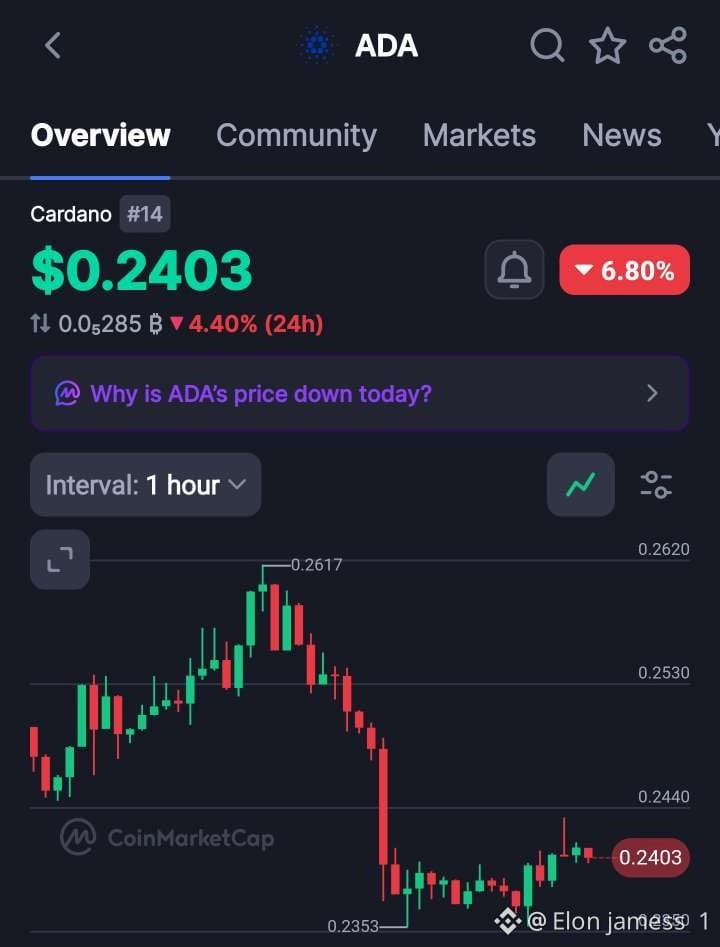
$ADA is showing weakness after getting rejected near $0.2617.
On the 1H chart, price dropped sharply and found temporary support around $0.2353. Since then, ADA has started moving sideways with a small recovery toward $0.2403.
Key levels I’m watching:
Support: $0.2350–$0.2355
Resistance: $0.2440 → $0.2530
Major resistance: $0.2617
If ADA can reclaim $0.2440 with stronger volume, the next levels could come into focus. But losing $0.2350 would weaken the current structure further.
For now, patience and confirmation matter more than chasing the bounce.
NFA. DYOR.
56
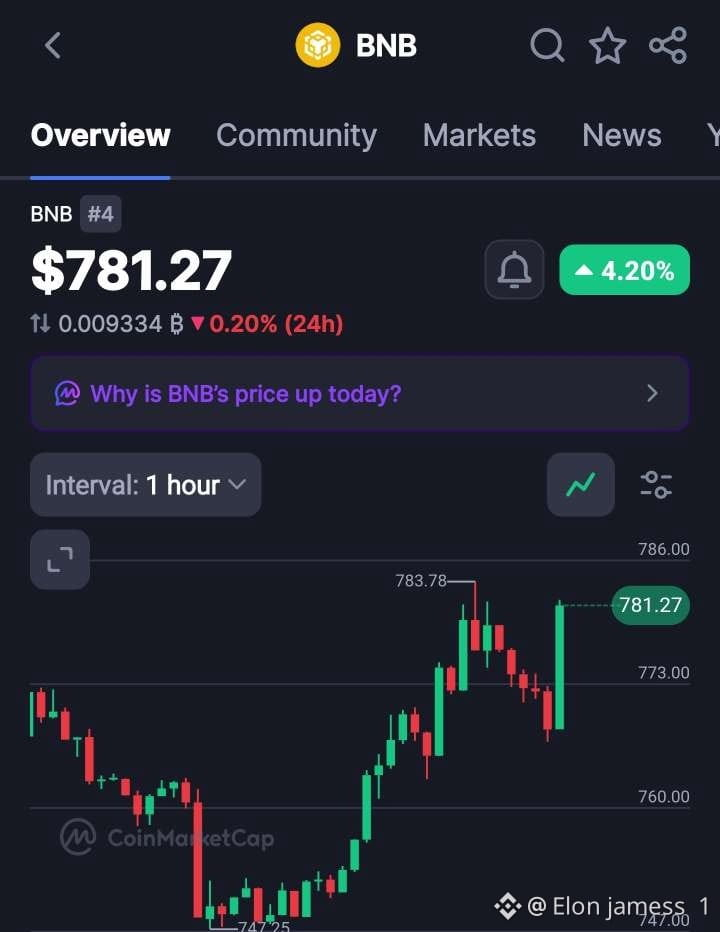
$BNB is back above $780 👀
BNB is trading around $781.27, up roughly 4.2%, after bouncing strongly from the $747 area.
On the 1H chart, price has recovered from the recent pullback and is now approaching the previous high around $783.78.
Key levels I’m watching:
🔹 Resistance: $783.78 → $786
🔹 Support: $773 → $760
🔹 Major support: $747
A clean move above $783.78 would put the recent high back in focus, while rejection could bring the nearby support zones into play.
BNB is definitely one to keep on the watchlist. 👀
DYOR — not financial advice.
67
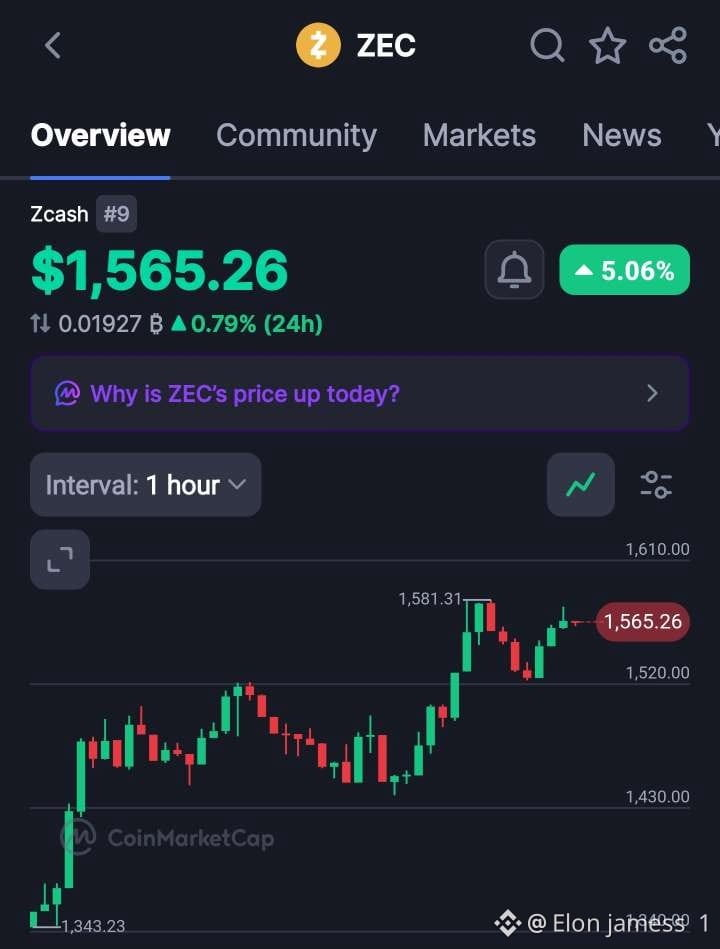
$ZEC is showing some serious momentum.
The chart shows Zcash moving from around $1,340 to above $1,580 before a small pullback.
But Zcash isn’t only about price action.
Its privacy-focused technology gives $ZEC a unique position in the crypto space.
Strong moves always get attention, but understanding the project behind the chart matters too.
Price can change quickly, so DYOR before making any decision.
For me, the combination of price momentum + privacy-focused technology makes $ZEC an interesting project to keep on the radar. 👀
#Zcash #ZEC #Crypto #Privacy
43
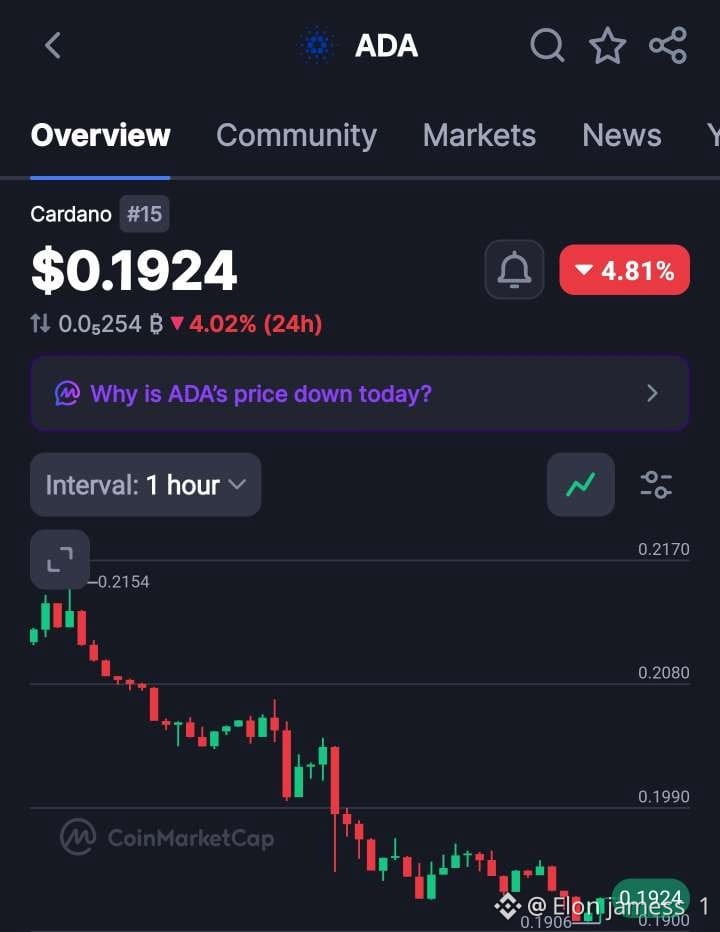
$ADA Update 📉
$ADA is trading around $0.1924, with strong selling pressure on the 1H chart.
Key levels: → Support: $0.190–$0.192
→ Resistance: $0.199–$0.208
Holding support could bring a bounce, while a break below $0.190 may signal more downside.
#ADA #Cardano #Crypto
$ADA Update 📉
$ADA is trading around $0.1924, with strong selling pressure on the 1H chart.
Key levels: → Support: $0.190–$0.192
→ Resistance: $0.199–$0.208
Holding support could bring a bounce, while a break below $0.190 may signal more downside.
#ADA #Cardano #Crypto
$ADA is trading around $0.1924, with strong selling pressure on the 1H chart.
Key levels: → Support: $0.190–$0.192
→ Resistance: $0.199–$0.208
Holding support could bring a bounce, while a break below $0.190 may signal more downside.
#ADA #Cardano #Crypto
59
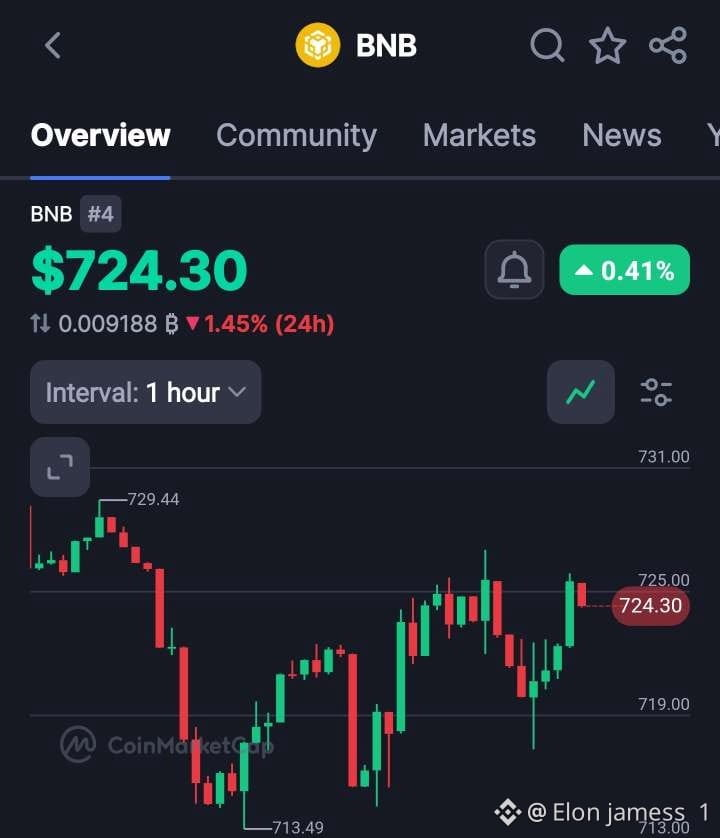
$BNB 1H Chart Update
$BNB is holding around $724.30 after bouncing from the $713.49 low.
Key levels to watch 👇
• Support: $719–$713.50
• Resistance: $725
• Next resistance: $729.44
A clean break above $725 could open the way toward $729+, while losing $719 may bring another retest of support.
For now, $BNB is showing a decent recovery, but confirmation is key.
Not financial advice.
68
$ZEC is showing an interesting recovery on the 15M chart.
After dropping to around $1,054, price started building higher lows and pushed back above $1,089, now trading near $1,109.
The key area I’m watching is $1,128–$1,143. A clean breakout above this zone could strengthen the short-term bullish structure.
But if price loses $1,089, the recovery could start losing momentum.
For now, patience matters more than chasing the move. Let the next breakout or rejection confirm the direction.
ZEC/USDT — 15M
DYOR. NFA.

55
$LINK is showing a clear shift in momentum on the 15M chart.
Price was trading near the $11.82–$11.89 area before a sharp sell-off pushed it down to around $11.48.
Since then, LINK has bounced, but the recovery is still struggling around $11.63–$11.70.
What I’m watching:
• Support: $11.55–$11.48
• Resistance: $11.70 → $11.82
• Key recovery area: $11.82+
If LINK can reclaim and hold above $11.70, the recovery could gain strength. But losing the $11.48 area would make the chart structure more bearish.
For now, I’d rather wait for confirmation than chase the move.
Levels matter more than emotions.
DYOR. NFA.

44
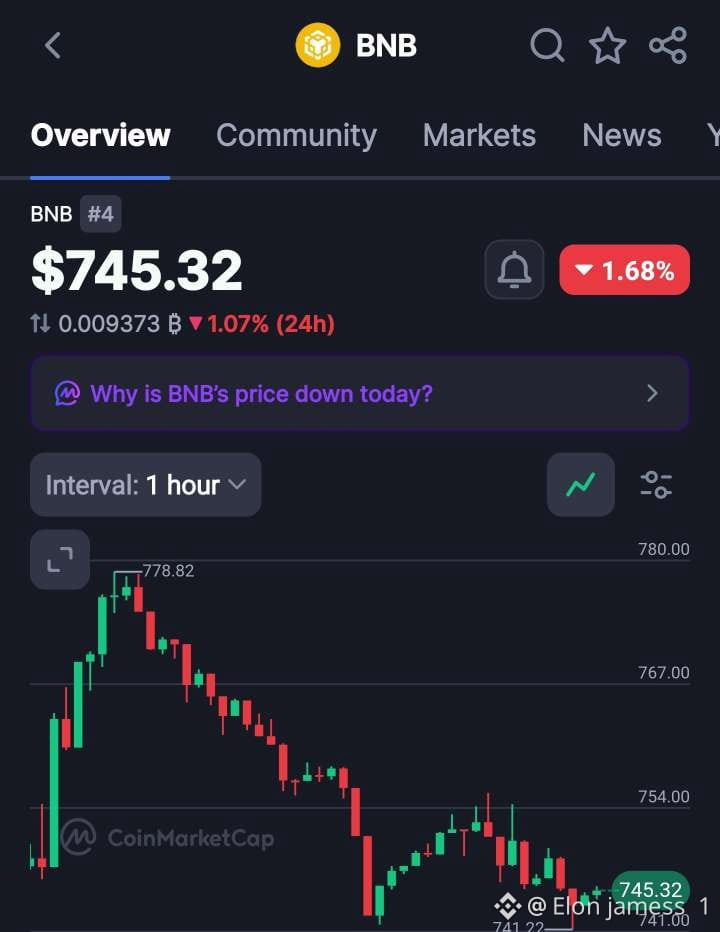
$BNB is currently trading around $745.42, down about 1.64% on the 15M chart.
Price recently dropped toward the $740.26 area and bounced back, showing buyers are still defending that zone.
Key levels I’m watching:
• $740–743 → support zone
• $746–750 → immediate resistance
• $753–756 → stronger resistance
For now, BNB looks like it’s trying to recover after the dip. I’d watch how price reacts around $746–750 before expecting a stronger move.
No need to chase the candle. Let the price confirm the direction first.
59
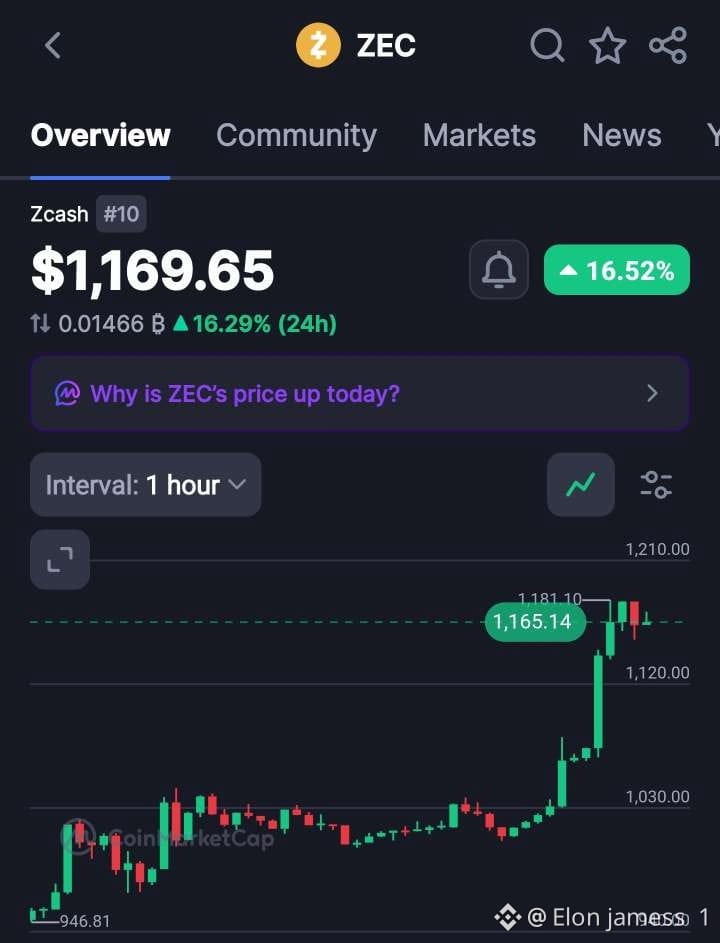
$ZEC is making a serious move 👀
Zcash is up around 16% in 24H, pushing from the ~$1,030 area toward $1,180. The breakout came with strong momentum, but price is now consolidating near the highs.
The key level to watch is $1,180. A clean break and hold above it could open the door toward $1,210+.
If buyers lose momentum, the $1,120–$1,030 zone becomes important support.
For now, momentum is strong but chasing a vertical move is where traders usually get trapped. DYOR.
70
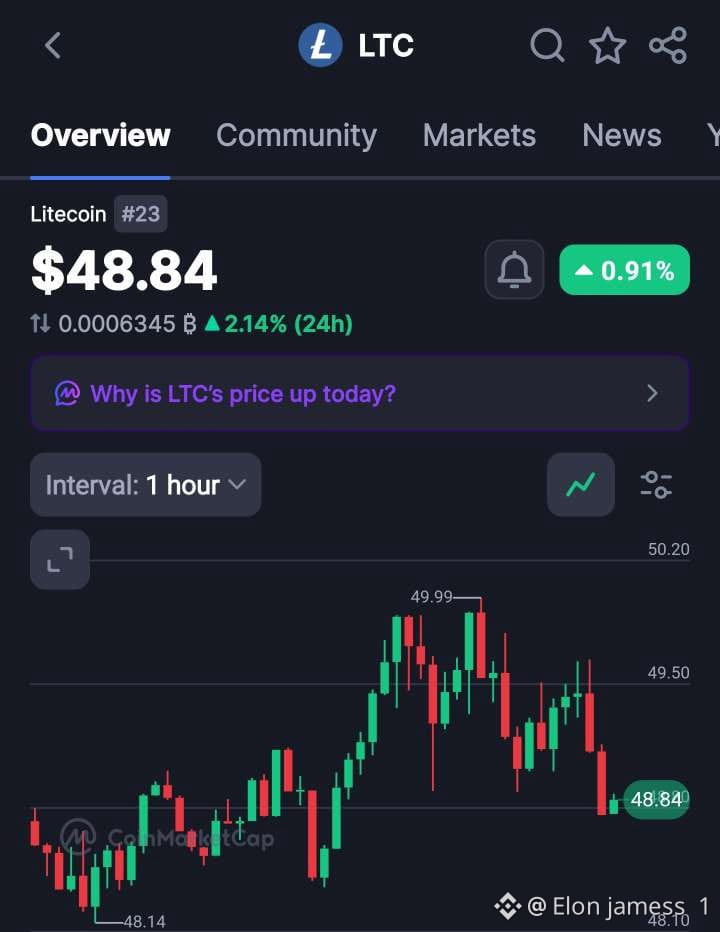
$LTC is holding around $48.84 after pulling back from the $49.99 local high. 👀
The key zone to watch is $49.50–$50.00.
A clean reclaim could bring bullish momentum back, while $48.14 remains an important downside level.
Let the price confirm the move. 📊 DYOR.
$LTC is holding around $48.84 after pulling back from the $49.99 local high. 👀
The key zone to watch is $49.50–$50.00.
A clean reclaim could bring bullish momentum back, while $48.14 remains an important downside level.
Let the price confirm the move. 📊 DYOR.
The key zone to watch is $49.50–$50.00.
A clean reclaim could bring bullish momentum back, while $48.14 remains an important downside level.
Let the price confirm the move. 📊 DYOR.
66
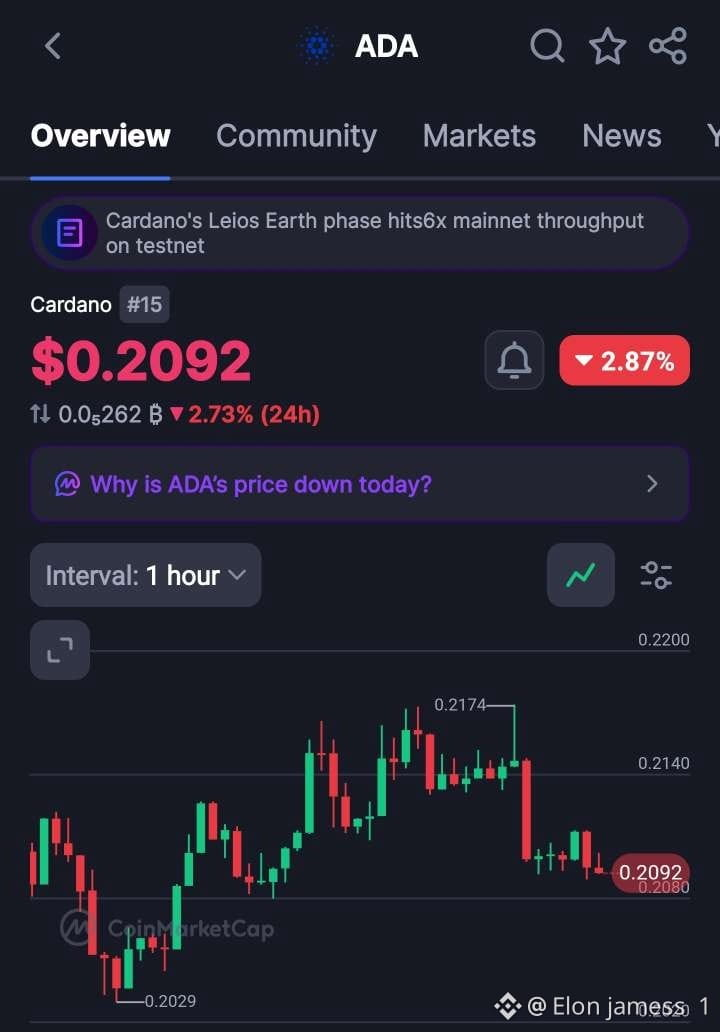
$ADA is cooling off after testing the $0.2174 area. 👀
ADA is currently around $0.2092, down about 2.87%, with the 1H chart showing some short-term selling pressure.
Key levels to watch:
→ Support: $0.2080 → $0.2029
→ Resistance: $0.2140 → $0.2174
If ADA can reclaim $0.214 and hold above it, momentum could improve. But losing the $0.208 zone may bring another test of lower support.
Also worth watching: Cardano’s Leios testnet is showing higher throughput, which could be an interesting fundamental development.
Short-term weakness, but the bigger picture still needs confirmation. DYOR.
65
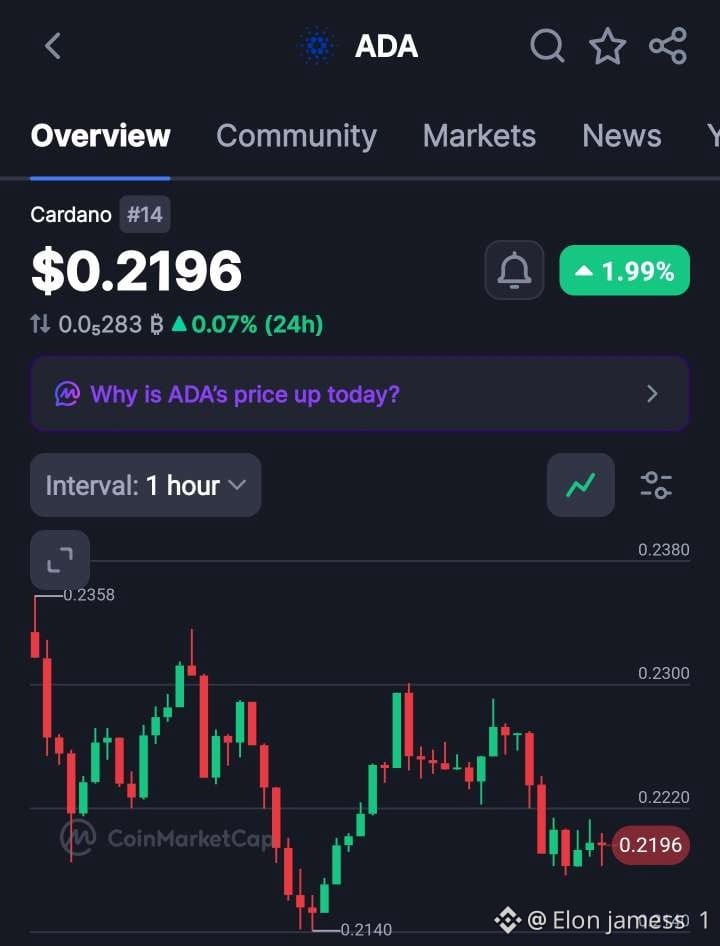
$ADA — Bounces to 0.2380 or breaks to 0.2000.
Spot Entry (No Leverage)
Entry Range: 0.2140–0.2196
Invalidation Floor: 0.2140
Target 1: 0.2220
Target 2: 0.2300
Target 3: 0.2380
Market Context & Reasoning
Price action on the 1-hour chart displays a solid recovery structure forming off the session floor. After pulling back from prior swing highs near 0.2358, sell-side pressure pushed price down to hit a key support bottom at 0.2140.
Currently trading at 0.2196 (up 1.99% on the session), price has carved out a sharp V-shaped rebound off the 0.2140 demand zone, lifting back above 0.2180. Buyers are actively absorbing supply on lower wicks. As long as the 0.2140 invalidation level remains intact, the setup favors a push back toward resistance at 0.2220 and 0.2300, opening path toward 0.2380.
To help refine these setups, what is your trading time horizon, and what maximum risk or stop-loss percentage do you typically manage per trade?
Trade $ADA here 👇
74
Войдите, чтобы посмотреть больше материала
Присоединяйтесь к пользователям криптовалют по всему миру на Binance Square
⚡️ Получайте новейшую и полезную информацию о криптоактивах.
💬 Нам доверяет крупнейшая в мире криптобиржа.
👍 Получите достоверные аналитические данные от верифицированных создателей контента.
Эл. почта/номер телефона
В тренде
UniswapA16zSeekDeFiExemptionFromIllinoisCryptoTax
Просмотров: 20,160
687 обсуждают
The debate over crypto taxation is heating up as Uniswap and Andreessen Horowitz ( a16z ) push for a DeFi exemption from Illinois proposed crypto tax rules. Their concern is that decentralized finance protocols and non custodial platforms could face unfair tax burdens potentially slowing innovation and making crypto development more difficult. DeFi platforms allow users to trade and manage digital assets without traditional intermediaries so applying conventional financial tax rules may create serious challenges. This could become an important moment for the US crypto industry as regulators must find a balance between fair taxation, investor protection, and innovation. 🚀
The main concern is that the proposed 0.2% tax is calculated on transaction value, not simply trading profits. Uniswap a16z and the DeFi Education Fund want wallet withdrawals and cross chain bridging excluded, while also opposing requirements to maintain private key records. Illinois has agreed to postpone implementation until July 1, 2027 subject to court approval. The outcome could influence how other US states approach DeFi taxation. The Defiant +2
What do you think 🤔 ? Should DeFi transactions be tax free to protect decentralization or should crypto platforms follow traditional tax rules ? 🤔
#UniswapA16zSeekDeFiExemptionFromIllinoisCryptoTax
Volatile
·Лайков: 3
·Просмотров: 193
HKDollarStablecoinHKDAPToLaunchOnSolana
Просмотров: 14,271
431 обсуждают
$1.5BInLeveragedCryptoBetsLiquidated
Просмотров: 33,076
236 обсуждают