

Amro 2026
8.8k Публикации

Amro 2026
Отправить жалобу
Заблокировать пользователя
Crypto trader & on-chain Analyst. Sharing Daily Market setups, risk-managed trades, and BTC/ETH insights. 📈
Трейдер с частыми сделками
4.9 г
1.2K+ подписок(и/а)
601 подписчиков(а)
1.8K+ понравилось
Посты
Все
Цитирования
·
--

Статья
Analyze BTC - USDT chart: Long or Short? 📉 Include TP & SL. 🚀Here's the BTC/USDT analysis (as of 2026-10-29 ~20:00 UTC, current price ≈ 79,200–79,300 USDT):
Market Structure: Bearish Trend + Support, No Clear Breakout Yet
Bigger picture (daily): BTC has been sliding from its early-October high around 86,900 down to ~79,300. Price is trading below the 4h EMA120 (81,678), EMA200 (81,818), and daily moving averages — a bearish MA alignment. Medium-term bias: bearish.
Short-term (4h): Price just broke below the Bollinger lower band (79,349) and tagged today's low near 78,280. RSI at 50.7 is neutral; MACD is at a golden-cross cusp; ADX is only 12.7, meaning the trend is very weak — we're in a range. Funding rate ~0.009%, long/short ratio ~0.995 (balanced), no crowd congestion.
Key levels:
| Level | Price | Note |
|---|---|---|
| Resistance 1 | 80,600 | 4h Bollinger mid / MA30 |
| Resistance 2 | 81,840–82,000 | Bollinger upper / recent range top |
| Support 1 | 79,350 | 4h Bollinger lower |
| Support 2 | 78,280–78,000 | Today's low / range bottom |
Trade Setups
Since price is at the bottom of the range with no confirmed trend, both chasing a short or a break are suboptimal. Two more robust paths:
① Bounce long (mean reversion) — only on confirmed support
• Entry: 78,500–79,000 (holding above today's low)
• Stop: 77,900 (invalidation below 78,280)
• Targets: 80,600 (T1) → 81,800 (T2)
② Breakout short (trend following) — after range failure
• Entry: below 78,000 on a confirmed daily close
• Stop: 79,500 (back inside the range = invalid)
• Targets: 76,500 → 75,500 (September platform zone)
• Do not chase shorts here unless 78,000 is broken.
Verdict
Overall bearish but sitting on support. If forced to pick a side: around 78,500–79,000 and while 78,280 holds, a defensive long for a bounce is preferable (risk/reward ≈ 1:3). If the daily close breaks 78,000, flip to shorting toward 76,000. This range thesis holds until a close above 82,000.
⚠️ Crypto is volatile — use hard stops and small size. This is technical analysis, not investment advice.
Analyze BTC - USDT chart: Long or Short? 📉 Include TP & SL. 🚀
Here's the BTC/USDT analysis (as of 2026-10-29 ~20:00 UTC, current price ≈ 79,200–79,300 USDT):
Market Structure: Bearish Trend + Support, No Clear Breakout Yet
Bigger picture (daily): BTC has been sliding from its early-October high around 86,900 down to ~79,300. Price is trading below the 4h EMA120 (81,678), EMA200 (81,818), and daily moving averages — a bearish MA alignment. Medium-term bias: bearish.
Short-term (4h): Price just broke below the Bollinger lower band (79,349) and tagged today's low near 78,280. RSI at 50.7 is neutral; MACD is at a golden-cross cusp; ADX is only 12.7, meaning the trend is very weak — we're in a range. Funding rate ~0.009%, long/short ratio ~0.995 (balanced), no crowd congestion.
Key levels:
| Level | Price | Note |
|---|---|---|
| Resistance 1 | 80,600 | 4h Bollinger mid / MA30 |
| Resistance 2 | 81,840–82,000 | Bollinger upper / recent range top |
| Support 1 | 79,350 | 4h Bollinger lower |
| Support 2 | 78,280–78,000 | Today's low / range bottom |
Trade Setups
Since price is at the bottom of the range with no confirmed trend, both chasing a short or a break are suboptimal. Two more robust paths:
① Bounce long (mean reversion) — only on confirmed support
• Entry: 78,500–79,000 (holding above today's low)
• Stop: 77,900 (invalidation below 78,280)
• Targets: 80,600 (T1) → 81,800 (T2)
② Breakout short (trend following) — after range failure
• Entry: below 78,000 on a confirmed daily close
• Stop: 79,500 (back inside the range = invalid)
• Targets: 76,500 → 75,500 (September platform zone)
• Do not chase shorts here unless 78,000 is broken.
Verdict
Overall bearish but sitting on support. If forced to pick a side: around 78,500–79,000 and while 78,280 holds, a defensive long for a bounce is preferable (risk/reward ≈ 1:3). If the daily close breaks 78,000, flip to shorting toward 76,000. This range thesis holds until a close above 82,000.
⚠️ Crypto is volatile — use hard stops and small size. This is technical analysis, not investment advice.
367

·
--
Analyze SOL - USDT chart: Long or Short? 📉 Include TP & SL. 🚀
English
SOL/USDT — $101.28 (Gate spot, 2026-10-28 00:39 UTC, +0.31% 24h)
Read of the chart
• Intermediate trend: DOWN. SOL topped near $122 on Oct 7 and has printed lower highs/lower lows into $101 (~ -17%). On the daily the ADX shows a strong downtrend, MAs are in bearish alignment, and price sits below MA20/MA30.
• But the move is stretched. Price is testing the multi-week support zone ~$99–101 with RSI ≈ 35 (near oversold), a daily MACD bullish divergence, and a Bollinger squeeze (width rank 28/30) — classic "about to choose direction" condition. The squeeze means a decisive move either way is likely soon.
So the trend still favors short, but you're sitting on support — chasing a short here is poor risk/reward. The clean setup is to wait for a bounce into resistance to short, unless price breaks down through support first.
Trade setups
| Setup | Direction | Entry | Stop loss | Take profit | R:R |
|---|---|---|---|---|---|
| Primary (trend) | Short | 102.8–103.5 (bounce into broken support) | 104.6 | TP1 99.0, TP2 98.5 | ~1:2.5–3 |
| Aggressive (counter-trend) | Long scalp | 99.0–100.0 (only if support holds) | 97.8 | TP 102.5, then 105 | ~1:2–2.5 |
Invalidation / triggers
• Short thesis dead: a daily close above ~103.2–104 flips the near-term structure bullish — stand aside or cover.
• Trend continuation: a daily close below ~98.6 (30-day low) extends the decline; next downside targets drop to ~96–96.5.
• Given the Bollinger squeeze, expect a volatility expansion soon — keep position size small and respect the stop.
Note: price data is live from Gate spot; indicator readings are from the snapshot as of 2026-10-26 07:30 UTC. This is technical analysis, not financial advice — manage your own risk.

1
376
·
--
XRP/USDT — 4H/1D technical read (data as of 2026-10-27 20:00 UTC, price ≈ $1.326)
Verdict: Long (on pullbacks), not a chase.
XRP bottomed around $1.254–1.272 (Oct 24–26 double-bottom zone) after a slide from ~$1.53. It's now building a higher low and has reclaimed $1.31 on rising 4H volume — funding is neutral (~0.01%), so the bounce isn't overheated. That's a healthy recovery structure, but price sits right at the $1.33 resistance, so buying here is poor risk/reward.
Levels
| Type | Price |
|---|---|
| Resistance | $1.330 → $1.345–1.353 → $1.365–1.370 |
| Support | $1.310 → $1.295–1.300 → $1.254–1.272 |
Long setup
• Entry: $1.300–1.315 (pullback), or confirmed reclaim/break of $1.330 with volume
• Stop-loss: $1.268 (below the double-bottom floor)
• TP: TP1 $1.330 (partial), TP2 $1.348
• Implied R:R: ~1R to TP1, ~2R to TP2 from a $1.31 entry
Invalidation: a daily close below $1.253 negates the higher-low thesis (next support $1.22–1.20). A clean break above $1.353–1.370 opens a move back toward $1.40.
Not financial advice — technical structure only; size accordingly and honor the stop.

180
·
--
Рост
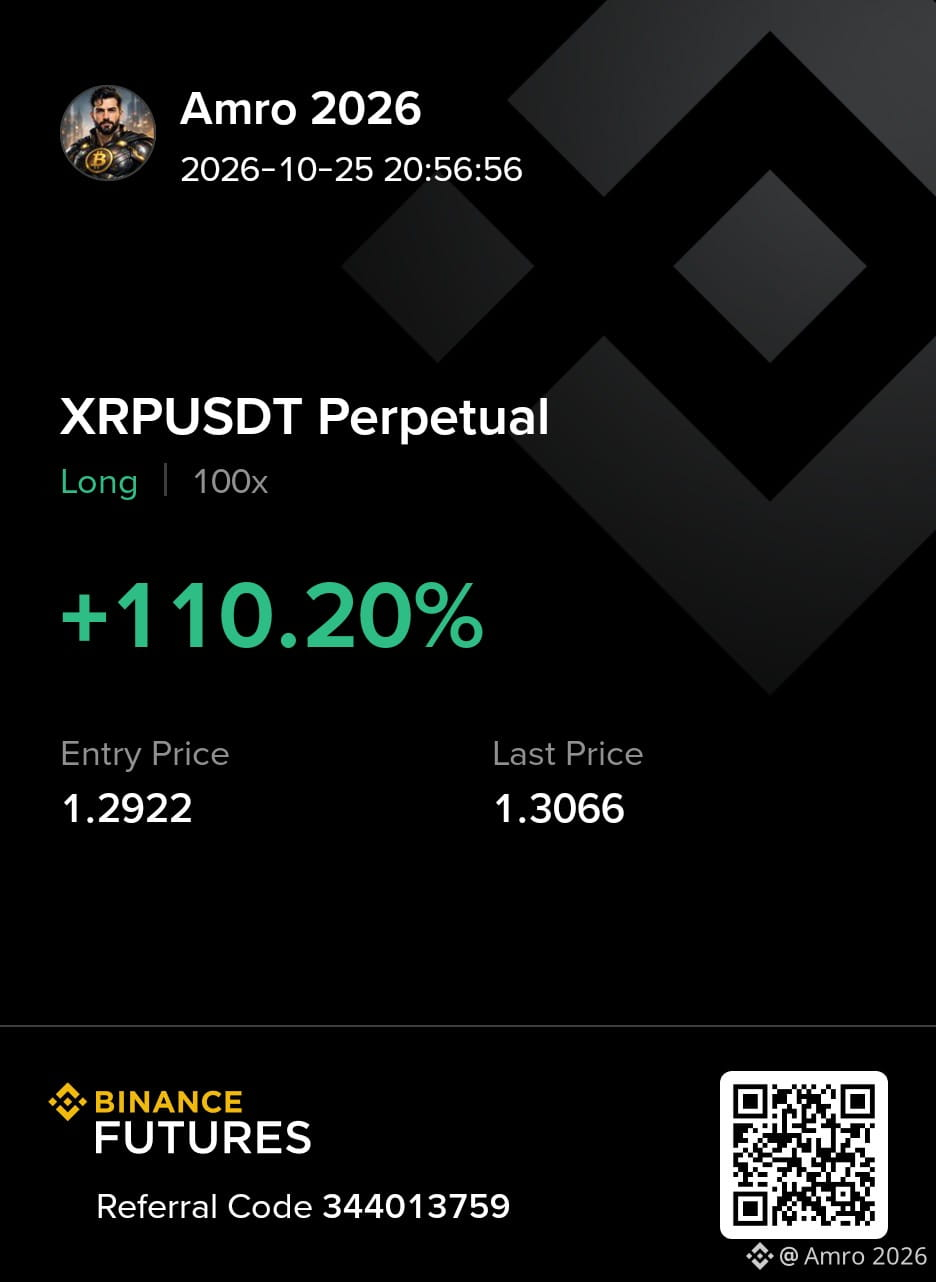
#BinancePick im very excited let's try your luck 🤞🏻
#BinancePick im very excited let's try your luck 🤞🏻

5
·
--
Рост
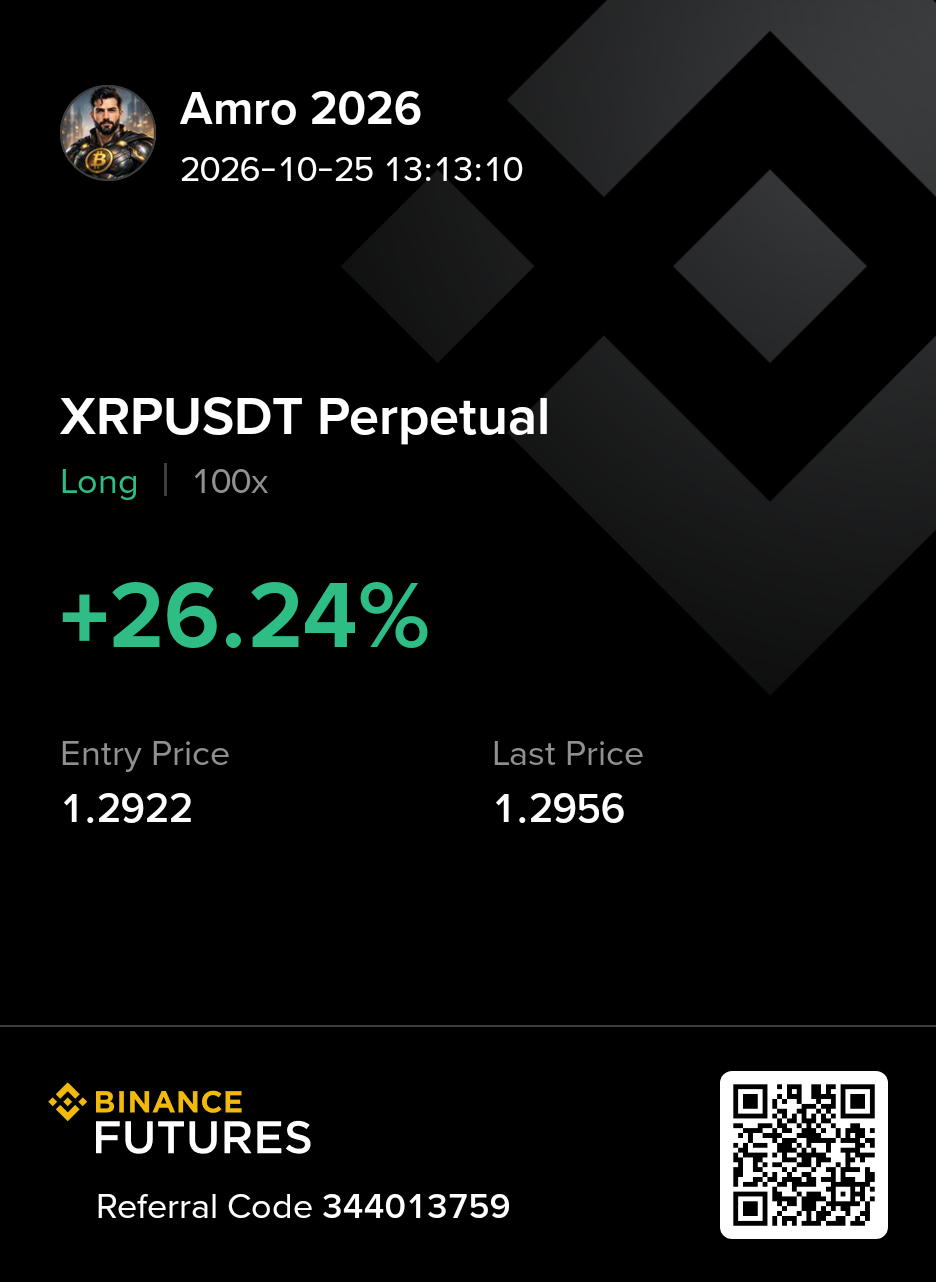
#BinancePick Im very excited 😆 I have now 2200 Points. 🚀
#BinancePick Im very excited 😆 I have now 2200 Points. 🚀

3
·
--

Статья
Analyze XRP - USDT chart: Long or Short? 📉 Include TP & SL. 🚀XRP/USDT — Trade View
Current price: $1.3109 (+1.44% over 24h, data as of 2026-10-25 ~03:00 UTC).
Structure
XRP topped near $1.63 in late September and has been in a corrective downtrend since. It found support at $1.2548 (the 7-day low) and is now bouncing, but the bounce is still below the daily moving averages (MA20 $1.351, MA30 $1.401) and is happening on shrinking volume (价升量缩) — a caution sign against betting on a strong breakout higher.
| Indicator (daily) | Reading |
|---|---|
| RSI(14) | 41.9 — below 50, neutral-bearish |
| MACD | Negative histogram, but narrowing (recovery attempt) |
| Price vs MA | Below MA7/MA20/MA30 → bearish alignment |
| 4h MA | Below MA30 ($1.320) / MA120 ($1.363) → still in downtrend |
| 15m RSI/CCI | Overbought (74.6 / 129) → immediate pullback risk |
Bias: Short on rallies (neutral-to-bearish)
The bigger picture is still a downtrend, and today's pop is a low-volume counter-trend bounce. The cleaner risk/reward is to short near resistance, not to chase the bounce at current levels (15m already overbought).
Preferred setup — Short
| | Level |
|---|---|
| Entry zone | $1.330 – $1.350 (4h MA30 / daily MA20 confluence) |
| Entry | $1.335 |
| Stop loss | $1.377 (above the 10-22 swing high ~$1.37) |
| TP1 | $1.285 (4h support / scale out) |
| TP2 | $1.255 (re-test of the swing low) |
Risk/reward ≈ 1:2.4 to TP2.
Alternative — Long (only on a deeper pullback)
If you want to trade the bounce up instead, do not enter here (overbought). Wait for a dip back to $1.295–$1.300 with momentum intact:
• Entry: $1.298 · SL: $1.279 · TP: $1.345–$1.350
• This is counter-trend and higher risk; only meaningful if price reclaims $1.35, which would flip the structure more bullish.
Watch-outs
• BTC correlation is high (0.87, beta ~1.35) — if BTC pushes up, shorts carry more risk.
• A daily close above $1.351 invalidates the bearish view and would shift the edge back to longs.
• A break below $1.2548 opens the door to $1.24 / $1.20.
———
Note: These are levels and a directional read from the chart, not a guarantee. Leveraged positions in a high-beta, BTC-correlated asset can move fast — size accordingly and respect the stops. The daily candle is still forming (not closed).
Analyze XRP - USDT chart: Long or Short? 📉 Include TP & SL. 🚀
XRP/USDT — Trade View
Current price: $1.3109 (+1.44% over 24h, data as of 2026-10-25 ~03:00 UTC).
Structure
XRP topped near $1.63 in late September and has been in a corrective downtrend since. It found support at $1.2548 (the 7-day low) and is now bouncing, but the bounce is still below the daily moving averages (MA20 $1.351, MA30 $1.401) and is happening on shrinking volume (价升量缩) — a caution sign against betting on a strong breakout higher.
| Indicator (daily) | Reading |
|---|---|
| RSI(14) | 41.9 — below 50, neutral-bearish |
| MACD | Negative histogram, but narrowing (recovery attempt) |
| Price vs MA | Below MA7/MA20/MA30 → bearish alignment |
| 4h MA | Below MA30 ($1.320) / MA120 ($1.363) → still in downtrend |
| 15m RSI/CCI | Overbought (74.6 / 129) → immediate pullback risk |
Bias: Short on rallies (neutral-to-bearish)
The bigger picture is still a downtrend, and today's pop is a low-volume counter-trend bounce. The cleaner risk/reward is to short near resistance, not to chase the bounce at current levels (15m already overbought).
Preferred setup — Short
| | Level |
|---|---|
| Entry zone | $1.330 – $1.350 (4h MA30 / daily MA20 confluence) |
| Entry | $1.335 |
| Stop loss | $1.377 (above the 10-22 swing high ~$1.37) |
| TP1 | $1.285 (4h support / scale out) |
| TP2 | $1.255 (re-test of the swing low) |
Risk/reward ≈ 1:2.4 to TP2.
Alternative — Long (only on a deeper pullback)
If you want to trade the bounce up instead, do not enter here (overbought). Wait for a dip back to $1.295–$1.300 with momentum intact:
• Entry: $1.298 · SL: $1.279 · TP: $1.345–$1.350
• This is counter-trend and higher risk; only meaningful if price reclaims $1.35, which would flip the structure more bullish.
Watch-outs
• BTC correlation is high (0.87, beta ~1.35) — if BTC pushes up, shorts carry more risk.
• A daily close above $1.351 invalidates the bearish view and would shift the edge back to longs.
• A break below $1.2548 opens the door to $1.24 / $1.20.
———
Note: These are levels and a directional read from the chart, not a guarantee. Leveraged positions in a high-beta, BTC-correlated asset can move fast — size accordingly and respect the stops. The daily candle is still forming (not closed).
92
·
--

Статья
Analyze BTC - USDT chart: Long or Short? 📉 Include TP & SL. 🚀BTC/USDT — Data as of 2026-10-24 16:55 (UTC+0), spot ~80,200 USDT (24h -1.85%, today's daily candle not yet closed)
Structure read: the medium-term uptrend (from the August low near 62–64k) is intact, but the near-term is in a clear downtrend — bias is short for now, but this is not a zone to blindly chase shorts or longs.
On the daily chart, BTC posted a peak around 87,000 on Oct 5–6 and has since been printing lower highs: 87k → 85.6k (Oct 7) → 84.9k (Oct 22) → 82.0k (Oct 23) → 81.2k (today). The bearish sequence is intact, and price is now testing the ~79,200 near-term support. Classic "descending continuation testing a key support" setup.
———
Short setup (preferred)
Entry: scale into shorts on a bounce into the 81,000 – 81,800 zone (today's high of 81,212 and the former breakdown area overlap as resistance)
Stop-loss: 82,400 (above the Oct 23 high of 82,054 + buffer, to avoid getting shaken out on a retest)
Take-profit:
• TP1 79,200 (today's low — first target, trim half the position)
• TP2 77,200 (the dense mid-September zone — secondary support)
▎Risk/reward: risk ≈ 1,200; TP1 delivers ≈ 1.8R, TP2 ≈ 3.5R.
Aggressive intraday variant: enter short right here at ~80,200, stop at 81,350 (above today's high), TP1 79,200 / TP2 77,200. Note TP1 is near 1:1 R:R here, so it relies heavily on discipline — the bounce-entry version is cleaner.
Long setup (only after confirmation)
Catching longs underneath here is high-risk. Only flip long once price reclaims and holds above 82,050 (clears the Oct 23 high and breaks the lower-high sequence):
• Entry: 82,100 after breakout confirmation
• Stop: 79,100 (below today's low)
• Targets: TP1 84,000, TP2 85,500
———
Key level on both sides: 79,200. A daily close below and sustained under it → downside extends toward 77,200 / 76,000; if instead price holds above it with a high-volume long lower wick or reversal, the short-term bearish logic weakens — then wait for the 82,000 reclaim before reassessing the long case.
Risk note: this is technical analysis based on price structure and support/resistance, not investment advice. Crypto is volatile; if trading contracts, always use stop-losses, manage position size, and avoid going all-in.
Analyze BTC - USDT chart: Long or Short? 📉 Include TP & SL. 🚀
BTC/USDT — Data as of 2026-10-24 16:55 (UTC+0), spot ~80,200 USDT (24h -1.85%, today's daily candle not yet closed)
Structure read: the medium-term uptrend (from the August low near 62–64k) is intact, but the near-term is in a clear downtrend — bias is short for now, but this is not a zone to blindly chase shorts or longs.
On the daily chart, BTC posted a peak around 87,000 on Oct 5–6 and has since been printing lower highs: 87k → 85.6k (Oct 7) → 84.9k (Oct 22) → 82.0k (Oct 23) → 81.2k (today). The bearish sequence is intact, and price is now testing the ~79,200 near-term support. Classic "descending continuation testing a key support" setup.
———
Short setup (preferred)
Entry: scale into shorts on a bounce into the 81,000 – 81,800 zone (today's high of 81,212 and the former breakdown area overlap as resistance)
Stop-loss: 82,400 (above the Oct 23 high of 82,054 + buffer, to avoid getting shaken out on a retest)
Take-profit:
• TP1 79,200 (today's low — first target, trim half the position)
• TP2 77,200 (the dense mid-September zone — secondary support)
▎Risk/reward: risk ≈ 1,200; TP1 delivers ≈ 1.8R, TP2 ≈ 3.5R.
Aggressive intraday variant: enter short right here at ~80,200, stop at 81,350 (above today's high), TP1 79,200 / TP2 77,200. Note TP1 is near 1:1 R:R here, so it relies heavily on discipline — the bounce-entry version is cleaner.
Long setup (only after confirmation)
Catching longs underneath here is high-risk. Only flip long once price reclaims and holds above 82,050 (clears the Oct 23 high and breaks the lower-high sequence):
• Entry: 82,100 after breakout confirmation
• Stop: 79,100 (below today's low)
• Targets: TP1 84,000, TP2 85,500
———
Key level on both sides: 79,200. A daily close below and sustained under it → downside extends toward 77,200 / 76,000; if instead price holds above it with a high-volume long lower wick or reversal, the short-term bearish logic weakens — then wait for the 82,000 reclaim before reassessing the long case.
Risk note: this is technical analysis based on price structure and support/resistance, not investment advice. Crypto is volatile; if trading contracts, always use stop-losses, manage position size, and avoid going all-in.
1
141
·
--
Рост
Long $BTC from here to 85k USD 🚀💥
Let's take it where it belongs to 1 Million USD 🚀💥🥳 One Day ❤️
{future}(BTCUSDT)
Long $BTC from here to 85k USD 🚀💥
Let's take it where it belongs to 1 Million USD 🚀💥🥳 One Day ❤️
Let's take it where it belongs to 1 Million USD 🚀💥🥳 One Day ❤️
19
·
--
#BinancePick Excited to participate in the campaign!
#BinancePick Excited to participate in the campaign!

1
·
--

Статья
Analyze ETH - USDT chart: Long or Short? 📉 Include TP & SL. 🚀ETH/USDT — Technical Read (data as of 2026-10-24 08:00 UTC, Gate spot, latest 4h candle still open)
Current price: ~$2,366
Trend structure — bearish bias
• Price trades below all major moving averages (MA7 2378 / MA30 2395 / MA200 2420; EMA200 2424).
• MACD is negative (−1.24, DEA −6.99), and ADX ~39.6 with DI− (25.8) well above DI+ (10.8) → a strong, intact downtrend.
• RSI 37.6, Stoch K/D 38/47, J 19.7 — momentum is weak, only mildly oversold (no confirmed reversal yet).
• Bollinger: mid 2390, upper 2419, lower 2361. Price is chopping near the lower band.
So the medium-term path of least resistance is down, with the caveat that a short-term bounce off the 2350–2360 support is possible.
Key levels
| Zone | Level | Meaning |
|---|---|---|
| Resistance 1 | 2382–2395 | MA30/EMA30 + Bollinger mid — first supply |
| Resistance 2 | 2415–2423 | Bollinger upper + EMA200 + 24h high — trend invalidation |
| Support 1 | 2350–2360 | Recent swing-low cluster (4h low 2352.3) |
| Support 2 | 2317 / 2300 | Oct 15 low / round psychological level |
Setup — lean Short (primary)
• Entry: 2380–2395 (scale into the rebound into resistance)
• Stop Loss: 2425 (above EMA200 / Bollinger upper → invalidates the bearish setup)
• Take Profit 1: 2340 · Take Profit 2: 2300
• Risk/reward ≈ 1:1.5–2.0, ~40–55 pts risk
Alternative (breakdown continuation)
• If the daily/4h close breaks below 2350, momentum shorts target 2300 → 2250, with SL back above 2385.
Scenarios — not a long (higher risk)
• Only a firm reclaim of 2385–2390 with a close above would justify a scalp-long: entry 2360–2370, SL below 2345, TP 2420. Given ADX downtrend strength, this is lower probability.
Bottom line: I lean Short on rallies into 2380–2395, invalidated only above ~2425. This reflects the current trend and is not financial advice — use position sizing and let the stop do the work.
Analyze ETH - USDT chart: Long or Short? 📉 Include TP & SL. 🚀
ETH/USDT — Technical Read (data as of 2026-10-24 08:00 UTC, Gate spot, latest 4h candle still open)
Current price: ~$2,366
Trend structure — bearish bias
• Price trades below all major moving averages (MA7 2378 / MA30 2395 / MA200 2420; EMA200 2424).
• MACD is negative (−1.24, DEA −6.99), and ADX ~39.6 with DI− (25.8) well above DI+ (10.8) → a strong, intact downtrend.
• RSI 37.6, Stoch K/D 38/47, J 19.7 — momentum is weak, only mildly oversold (no confirmed reversal yet).
• Bollinger: mid 2390, upper 2419, lower 2361. Price is chopping near the lower band.
So the medium-term path of least resistance is down, with the caveat that a short-term bounce off the 2350–2360 support is possible.
Key levels
| Zone | Level | Meaning |
|---|---|---|
| Resistance 1 | 2382–2395 | MA30/EMA30 + Bollinger mid — first supply |
| Resistance 2 | 2415–2423 | Bollinger upper + EMA200 + 24h high — trend invalidation |
| Support 1 | 2350–2360 | Recent swing-low cluster (4h low 2352.3) |
| Support 2 | 2317 / 2300 | Oct 15 low / round psychological level |
Setup — lean Short (primary)
• Entry: 2380–2395 (scale into the rebound into resistance)
• Stop Loss: 2425 (above EMA200 / Bollinger upper → invalidates the bearish setup)
• Take Profit 1: 2340 · Take Profit 2: 2300
• Risk/reward ≈ 1:1.5–2.0, ~40–55 pts risk
Alternative (breakdown continuation)
• If the daily/4h close breaks below 2350, momentum shorts target 2300 → 2250, with SL back above 2385.
Scenarios — not a long (higher risk)
• Only a firm reclaim of 2385–2390 with a close above would justify a scalp-long: entry 2360–2370, SL below 2345, TP 2420. Given ADX downtrend strength, this is lower probability.
Bottom line: I lean Short on rallies into 2380–2395, invalidated only above ~2425. This reflects the current trend and is not financial advice — use position sizing and let the stop do the work.
86
·
--

Статья
Analyze ETH - USDT chart: Long or Short? 📉 Include TP & SL. 🚀ETH/USDT — 2026-10-23 04:00 UTC · spot · price ≈ $2,406
Trend read
• Medium-term: bearish. ETH printed a swing high of ~$2,777 on Oct 2 and has since made lower highs (2,580 → 2,526 → 2,482). Price is trading below the EMA120 ($2,428) and EMA200 ($2,436), and MACD is negative on the daily.
• Short-term: corrective bounce. It hit a low near $2,360 on Oct 22 and is bouncing. The 1h just turned mildly up (DI+ > DI−, price above MA7), but this is a bounce inside a downtrend, not a trend change.
• Range: roughly $2,360–$2,526. Price sits in the lower third.
Bias: favor shorts on rallies into resistance, until a daily close above ~$2,485 invalidates the bearish structure.
Setup (primary: short on rally)
| | Level ($) |
|---|---|
| Entry zone | 2,415 – 2,445 (resistance / 24h high 2,448) |
| Stop-loss | above 2,485 (rejects swing high 2,526) |
| TP1 | 2,385 (lower Bollinger / recent support) |
| TP2 | 2,360 (Oct 22 low) |
| TP3 | 2,329 (Oct 18 swing low) |
Risk:reward at entry ~2,430 with SL 2,485 ≈ 1:1.3 to TP1 and ~1:2 to TP3.
Alternative (long) — only on confirmation
A long is only defensible on a clean reclaim above $2,475–2,485 — that would break the falling structure and target $2,526 then ~$2,580. Until then, long entries chasing the bounce carry poor risk because the medium-term trend points down. If you want to trade the bounce, keep it tight: entry ~2,395–2,400, SL under 2,360, TP at 2,445.
Notes
• The daily candle for Oct 23 is still open; data as of 2026-10-23 04:00 UTC.
• Funding rate is positive (~0.0058), long/short ratio mildly long-biased — these favor dilution of longs on further bounce.
• This is a price-structure view, not financial advice. Use stops and size so a failed setup costs ~1% of your risk budget.
Analyze ETH - USDT chart: Long or Short? 📉 Include TP & SL. 🚀
ETH/USDT — 2026-10-23 04:00 UTC · spot · price ≈ $2,406
Trend read
• Medium-term: bearish. ETH printed a swing high of ~$2,777 on Oct 2 and has since made lower highs (2,580 → 2,526 → 2,482). Price is trading below the EMA120 ($2,428) and EMA200 ($2,436), and MACD is negative on the daily.
• Short-term: corrective bounce. It hit a low near $2,360 on Oct 22 and is bouncing. The 1h just turned mildly up (DI+ > DI−, price above MA7), but this is a bounce inside a downtrend, not a trend change.
• Range: roughly $2,360–$2,526. Price sits in the lower third.
Bias: favor shorts on rallies into resistance, until a daily close above ~$2,485 invalidates the bearish structure.
Setup (primary: short on rally)
| | Level ($) |
|---|---|
| Entry zone | 2,415 – 2,445 (resistance / 24h high 2,448) |
| Stop-loss | above 2,485 (rejects swing high 2,526) |
| TP1 | 2,385 (lower Bollinger / recent support) |
| TP2 | 2,360 (Oct 22 low) |
| TP3 | 2,329 (Oct 18 swing low) |
Risk:reward at entry ~2,430 with SL 2,485 ≈ 1:1.3 to TP1 and ~1:2 to TP3.
Alternative (long) — only on confirmation
A long is only defensible on a clean reclaim above $2,475–2,485 — that would break the falling structure and target $2,526 then ~$2,580. Until then, long entries chasing the bounce carry poor risk because the medium-term trend points down. If you want to trade the bounce, keep it tight: entry ~2,395–2,400, SL under 2,360, TP at 2,445.
Notes
• The daily candle for Oct 23 is still open; data as of 2026-10-23 04:00 UTC.
• Funding rate is positive (~0.0058), long/short ratio mildly long-biased — these favor dilution of longs on further bounce.
• This is a price-structure view, not financial advice. Use stops and size so a failed setup costs ~1% of your risk budget.
81
·
--

Статья
Analyze BTC - USDT chart: Long or Short? 📉 Include TP & SL. 🚀BTC/USDT — Direction: Short-favored
Current price ~ $81,550 (spot, updated 10-22 15:34 UTC; today's daily candle not yet closed).
Chart overview
• Daily: Today (10-22) opened at $84,098 → low $81,334, printing a large red candle that broke below yesterday's low of $82,638. The pullback from the early-October high (~$87,000) remains intact.
• 4h indicators: RSI 42.7 (weakening), price $81,550 below MA7 ($83,360) and MA30 ($82,350) — short-term averages acting as resistance.
• 1h indicators: ADX 35.4 with DI− > DI+ (strong downside momentum), RSI 32.5, Williams %R −83 (short-term oversold), SAR $82,224 above price (bearish).
• Derivatives: Open interest −1.8% in 24h (mild deleveraging), taker buy/sell ratio 0.94 (sellers in control) — no reversal signal yet.
Key levels
| Type | Level |
|---|---|
| Resistance | $82,600 (prior support turned resistance) → $84,000–84,400 → $84,900 |
| Support | $81,300 (today's low / $81,000–81,300 band) → $79,800–80,000 |
Short-term trade idea (with trend, short)
• Entry: $81,400–82,000 (current zone, or add near a $82,500 retest)
• Stop-loss: above $84,000 (structure invalidation)
• Take-profit: first target $80,200, second target $78,900 (~1:1.2 risk-reward)
Long conditions (only flip on trigger)
• Need a reclaim and close back above $84,000 for a structure reversal; only then consider long, SL below $82,800, target $85,000+.
• Until $84,000 is reclaimed, bounces into resistance are better treated as short opportunities than long entries.
Risk notes
• 1h is oversold and today's candle hasn't closed, so a brief technical bounce is possible — avoid over-leveraging on a short.
• If the $81,000–81,300 support breaks on volume, the path opens toward $79,800; if it holds, expect a range.
Analyze BTC - USDT chart: Long or Short? 📉 Include TP & SL. 🚀
BTC/USDT — Direction: Short-favored
Current price ~ $81,550 (spot, updated 10-22 15:34 UTC; today's daily candle not yet closed).
Chart overview
• Daily: Today (10-22) opened at $84,098 → low $81,334, printing a large red candle that broke below yesterday's low of $82,638. The pullback from the early-October high (~$87,000) remains intact.
• 4h indicators: RSI 42.7 (weakening), price $81,550 below MA7 ($83,360) and MA30 ($82,350) — short-term averages acting as resistance.
• 1h indicators: ADX 35.4 with DI− > DI+ (strong downside momentum), RSI 32.5, Williams %R −83 (short-term oversold), SAR $82,224 above price (bearish).
• Derivatives: Open interest −1.8% in 24h (mild deleveraging), taker buy/sell ratio 0.94 (sellers in control) — no reversal signal yet.
Key levels
| Type | Level |
|---|---|
| Resistance | $82,600 (prior support turned resistance) → $84,000–84,400 → $84,900 |
| Support | $81,300 (today's low / $81,000–81,300 band) → $79,800–80,000 |
Short-term trade idea (with trend, short)
• Entry: $81,400–82,000 (current zone, or add near a $82,500 retest)
• Stop-loss: above $84,000 (structure invalidation)
• Take-profit: first target $80,200, second target $78,900 (~1:1.2 risk-reward)
Long conditions (only flip on trigger)
• Need a reclaim and close back above $84,000 for a structure reversal; only then consider long, SL below $82,800, target $85,000+.
• Until $84,000 is reclaimed, bounces into resistance are better treated as short opportunities than long entries.
Risk notes
• 1h is oversold and today's candle hasn't closed, so a brief technical bounce is possible — avoid over-leveraging on a short.
• If the $81,000–81,300 support breaks on volume, the path opens toward $79,800; if it holds, expect a range.
88
·
--

Статья
Analyze SOL - USDT chart: Long or Short? 📉 Include TP & SL. 🚀Short bias, but only on a rally into resistance. Wait for a rejection before entering.
Market snapshot (SOL/USDT spot, 4h candle, 2026-10-22 00:00 UTC)
• Last price: 104.18 USDT; 24h high/low 109.20 / 104.17
• Current 4h candle: open 107.00, close 105.54 (still forming)
Indicators
| Indicator | Reading | Read |
|---|---|---|
| MA7 / MA30 | 106.98 / 105.00 | Price is below MA7 and slightly above MA30 |
| MA120 / MA200 | 110.80 / 113.38 | Price is well below both, so the longer trend is bearish |
| Bollinger mid / upper | 105.71 / 108.30 | Price sits just under the midline, with the upper band as the next ceiling |
| MACD vs signal | 0.17 vs 0.42 | MACD is below its signal line, a mild bearish tilt |
| RSI(14) | 49.0 | Neutral |
| KDJ | K 50.8, D 62.7, J 27.1 | K is below D, a weak bearish cross |
| ADX / DI+ / DI- | 17.9 / 22.4 / 20.5 | Trend is weak, with a slight bullish edge |
| Parabolic SAR | 109.20 | Above price, so it is resistance for now |
Interpretation
• Bearish: price is below the 120/200 MAs and the midline, MACD is below signal, and KDJ is turning down.
• Neutral to bullish: price is holding near 104 (the 24h low and the MA30 area), and ADX is weak, so there is no strong downtrend.
• Overall, a range-bound market with a bearish lean. A short on a failed bounce is cleaner than chasing a breakdown.
Trade plan (short, preferred)
• Entry: short on a rejection in the 106–107.5 zone (MA7 and the midline), confirmed by a bearish 4h close
• Stop loss: 109.5 (above the SAR and the 24h high area, about +2.5% from entry)
• TP1: 102.5 (about −3.4% from 106, roughly 1.4R)
• TP2: 98.5 (about −7.1%, roughly 2.8R)
• Invalidation: a 4h close above 109.5 turns the bias neutral to bullish
Alternative (long, only on a breakout)
• Entry: a 4h close above 109.5 with rising volume
• Stop loss: 105.0 (below MA30)
• TP1: 110.8 (MA120); TP2: 113.4 (MA200)
Caveats
• The indicator history call failed, so this uses the latest snapshot only. The 4h candle is still forming, and SOL is testing support near 104 where a break would open the next leg lower.
• Keep risk to about 1–2% of your account per trade.
• This is technical analysis, not investment advice.
Analyze SOL - USDT chart: Long or Short? 📉 Include TP & SL. 🚀
Short bias, but only on a rally into resistance. Wait for a rejection before entering.
Market snapshot (SOL/USDT spot, 4h candle, 2026-10-22 00:00 UTC)
• Last price: 104.18 USDT; 24h high/low 109.20 / 104.17
• Current 4h candle: open 107.00, close 105.54 (still forming)
Indicators
| Indicator | Reading | Read |
|---|---|---|
| MA7 / MA30 | 106.98 / 105.00 | Price is below MA7 and slightly above MA30 |
| MA120 / MA200 | 110.80 / 113.38 | Price is well below both, so the longer trend is bearish |
| Bollinger mid / upper | 105.71 / 108.30 | Price sits just under the midline, with the upper band as the next ceiling |
| MACD vs signal | 0.17 vs 0.42 | MACD is below its signal line, a mild bearish tilt |
| RSI(14) | 49.0 | Neutral |
| KDJ | K 50.8, D 62.7, J 27.1 | K is below D, a weak bearish cross |
| ADX / DI+ / DI- | 17.9 / 22.4 / 20.5 | Trend is weak, with a slight bullish edge |
| Parabolic SAR | 109.20 | Above price, so it is resistance for now |
Interpretation
• Bearish: price is below the 120/200 MAs and the midline, MACD is below signal, and KDJ is turning down.
• Neutral to bullish: price is holding near 104 (the 24h low and the MA30 area), and ADX is weak, so there is no strong downtrend.
• Overall, a range-bound market with a bearish lean. A short on a failed bounce is cleaner than chasing a breakdown.
Trade plan (short, preferred)
• Entry: short on a rejection in the 106–107.5 zone (MA7 and the midline), confirmed by a bearish 4h close
• Stop loss: 109.5 (above the SAR and the 24h high area, about +2.5% from entry)
• TP1: 102.5 (about −3.4% from 106, roughly 1.4R)
• TP2: 98.5 (about −7.1%, roughly 2.8R)
• Invalidation: a 4h close above 109.5 turns the bias neutral to bullish
Alternative (long, only on a breakout)
• Entry: a 4h close above 109.5 with rising volume
• Stop loss: 105.0 (below MA30)
• TP1: 110.8 (MA120); TP2: 113.4 (MA200)
Caveats
• The indicator history call failed, so this uses the latest snapshot only. The 4h candle is still forming, and SOL is testing support near 104 where a break would open the next leg lower.
• Keep risk to about 1–2% of your account per trade.
• This is technical analysis, not investment advice.
318

·
--

Статья
Analyze BTC - USDT chart: Long or Short? 📉 Include TP & SL. 🚀Verdict: Leaning Long, but wait for a pullback confirmation rather than chasing.
Current data (Gate spot, 4h timeframe, as of ~2026-10-21 12:00 UTC)
• Last price is about 83,508 USDT, up roughly 2.46% over 24h. Intraday range: high 83,705, low 81,318.
• The last closed 4h candle (08:00 UTC) closed at 83,502, above MA7 (82,733) and MA30 (81,996).
• Price is above MA200 (83,399), but MA120 (83,312) sits almost on top of it, so the medium-term average is acting as resistance right here.
• RSI is about 62, not overbought. MACD is 174.4, above its signal line at 98.4, with a widening histogram, so momentum is bullish.
• ADX is about 15.6, which means trend strength is still weak and the move needs confirmation.
• Over the last 60 4h candles, the range runs roughly 79,795 to 84,352. Price sits near the top of that range, and there is untested supply around 84,000 to 84,350.
Key levels
• Resistance: 83,700 (today's high), 84,150 (the 14 Oct high area), 84,350 (range high)
• Support: 82,730 (MA7), 82,000 (MA30), 81,300 (the 18 Oct and 20 Oct lows zone)
Long setup
• Entry: a pullback into 83,000–83,300 that holds, or a 4h close above 83,750 for a breakout entry.
• Stop loss (SL): 82,400. Exit if price breaks below MA7 and cannot reclaim it. Risk is roughly 0.8%–1.0% from the entry zone.
• Take profit 1 (TP1): 84,150, about 1:1.2 risk-reward.
• Take profit 2 (TP2): 85,000, about 1:2.2 risk-reward. This target needs a clean break above 84,350 to have a reasonable chance of being reached.
Short scenario (for reference only)
If the 4h candle fails to hold above 83,500 and then breaks below 82,730, price could revert toward 82,000. In that case, a small short could be considered with a stop above 84,200 and a target at 82,000.
Risk notes
• Weak ADX means breakouts can fail, so keep position size small.
• This analysis is based only on 4h technical indicators and price structure. It is not investment advice. Set your own stop loss, size positions to your risk tolerance, and watch for macro news and volatility spikes.
Analyze BTC - USDT chart: Long or Short? 📉 Include TP & SL. 🚀
Verdict: Leaning Long, but wait for a pullback confirmation rather than chasing.
Current data (Gate spot, 4h timeframe, as of ~2026-10-21 12:00 UTC)
• Last price is about 83,508 USDT, up roughly 2.46% over 24h. Intraday range: high 83,705, low 81,318.
• The last closed 4h candle (08:00 UTC) closed at 83,502, above MA7 (82,733) and MA30 (81,996).
• Price is above MA200 (83,399), but MA120 (83,312) sits almost on top of it, so the medium-term average is acting as resistance right here.
• RSI is about 62, not overbought. MACD is 174.4, above its signal line at 98.4, with a widening histogram, so momentum is bullish.
• ADX is about 15.6, which means trend strength is still weak and the move needs confirmation.
• Over the last 60 4h candles, the range runs roughly 79,795 to 84,352. Price sits near the top of that range, and there is untested supply around 84,000 to 84,350.
Key levels
• Resistance: 83,700 (today's high), 84,150 (the 14 Oct high area), 84,350 (range high)
• Support: 82,730 (MA7), 82,000 (MA30), 81,300 (the 18 Oct and 20 Oct lows zone)
Long setup
• Entry: a pullback into 83,000–83,300 that holds, or a 4h close above 83,750 for a breakout entry.
• Stop loss (SL): 82,400. Exit if price breaks below MA7 and cannot reclaim it. Risk is roughly 0.8%–1.0% from the entry zone.
• Take profit 1 (TP1): 84,150, about 1:1.2 risk-reward.
• Take profit 2 (TP2): 85,000, about 1:2.2 risk-reward. This target needs a clean break above 84,350 to have a reasonable chance of being reached.
Short scenario (for reference only)
If the 4h candle fails to hold above 83,500 and then breaks below 82,730, price could revert toward 82,000. In that case, a small short could be considered with a stop above 84,200 and a target at 82,000.
Risk notes
• Weak ADX means breakouts can fail, so keep position size small.
• This analysis is based only on 4h technical indicators and price structure. It is not investment advice. Set your own stop loss, size positions to your risk tolerance, and watch for macro news and volatility spikes.
85
·
--
Рост
2
641
Войдите, чтобы посмотреть больше материала
Присоединяйтесь к пользователям криптовалют по всему миру на Binance Square
⚡️ Получайте новейшую и полезную информацию о криптоактивах.
💬 Нам доверяет крупнейшая в мире криптобиржа.
👍 Получите достоверные аналитические данные от верифицированных создателей контента.
Эл. почта/номер телефона