

classical zoro
1.5k Публикации

classical zoro
Отправить жалобу
Заблокировать пользователя
Crypto content creator focused on spot-only setups, long-term narratives, and disciplined risk management. I share what I study — not signals • DYOR
Случайный трейдер
1.3 г
1 подписок(и/а)
634 подписчиков(а)
4.4K+ понравилось
Посты
Все
Цитирования
·
--
Рост
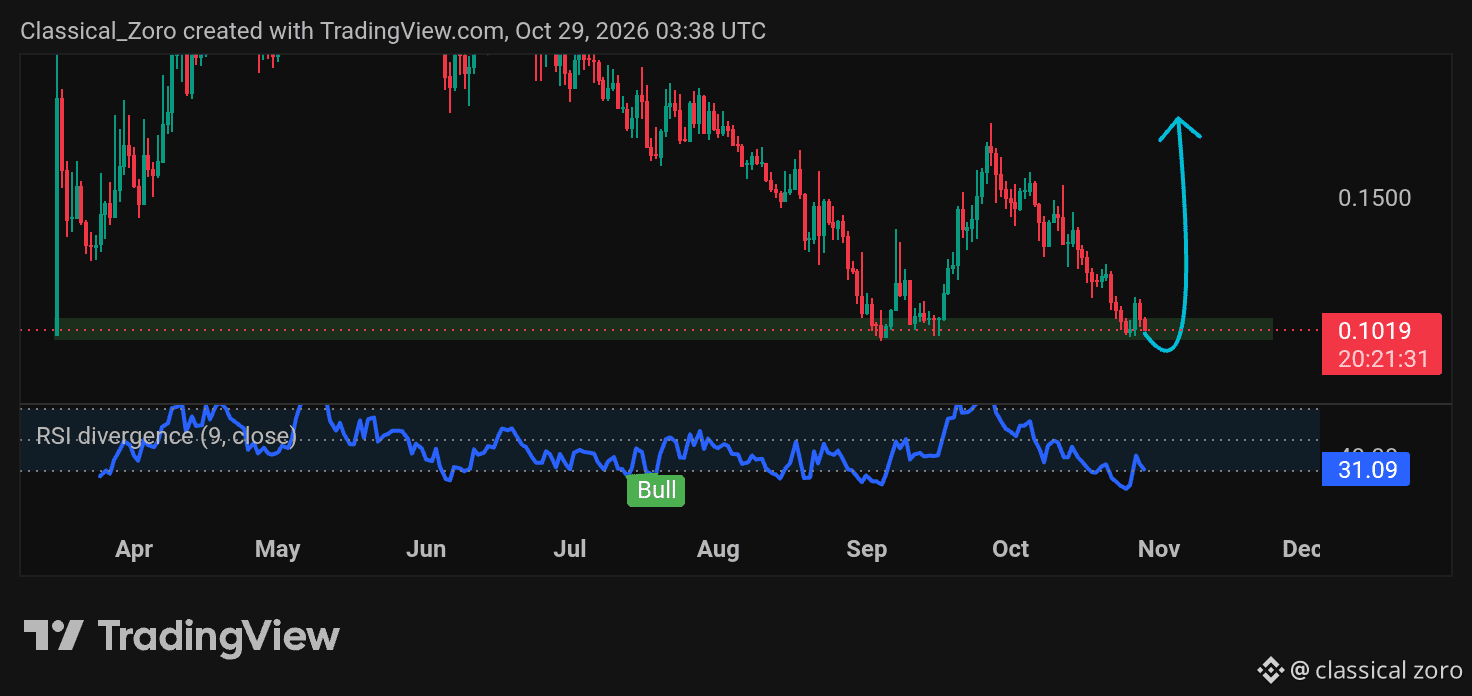
$CFG bulls are sitting on a critical daily demand zone that could dictate the next major trend.
The price has dropped right back into this major support block between 0.0977 and 0.1063.
We’ve already seen this zone prove its strength. Previously, the price printed two aggressive bullish candles with high volume after tapping here, but sellers managed to drag it back down.
Now, we are testing the floor again. This time, the RSI has bounced directly from oversold territory, signaling that the selling pressure is completely exhausted.
The setup is almost ready to fire. All we need is one more strong daily candle close above this zone to confirm the reversal.
If buyers deliver that close, expect a major move toward the 0.18 level and beyond.
Lose the 0.0977 support, though, and the setup is invalidated, opening the door for a deeper drop.
Bulls have the ammunition with the RSI reset, but they must prove it by reclaiming the zone.
{spot}(CFGUSDT)
#CFGUSDT
$CFG bulls are sitting on a critical daily demand zone that could dictate the next major trend.
The price has dropped right back into this major support block between 0.0977 and 0.1063.
We’ve already seen this zone prove its strength. Previously, the price printed two aggressive bullish candles with high volume after tapping here, but sellers managed to drag it back down.
Now, we are testing the floor again. This time, the RSI has bounced directly from oversold territory, signaling that the selling pressure is completely exhausted.
The setup is almost ready to fire. All we need is one more strong daily candle close above this zone to confirm the reversal.
If buyers deliver that close, expect a major move toward the 0.18 level and beyond.
Lose the 0.0977 support, though, and the setup is invalidated, opening the door for a deeper drop.
Bulls have the ammunition with the RSI reset, but they must prove it by reclaiming the zone.
#CFGUSDT

Best Wishes!
От classical zoro
1
2
161
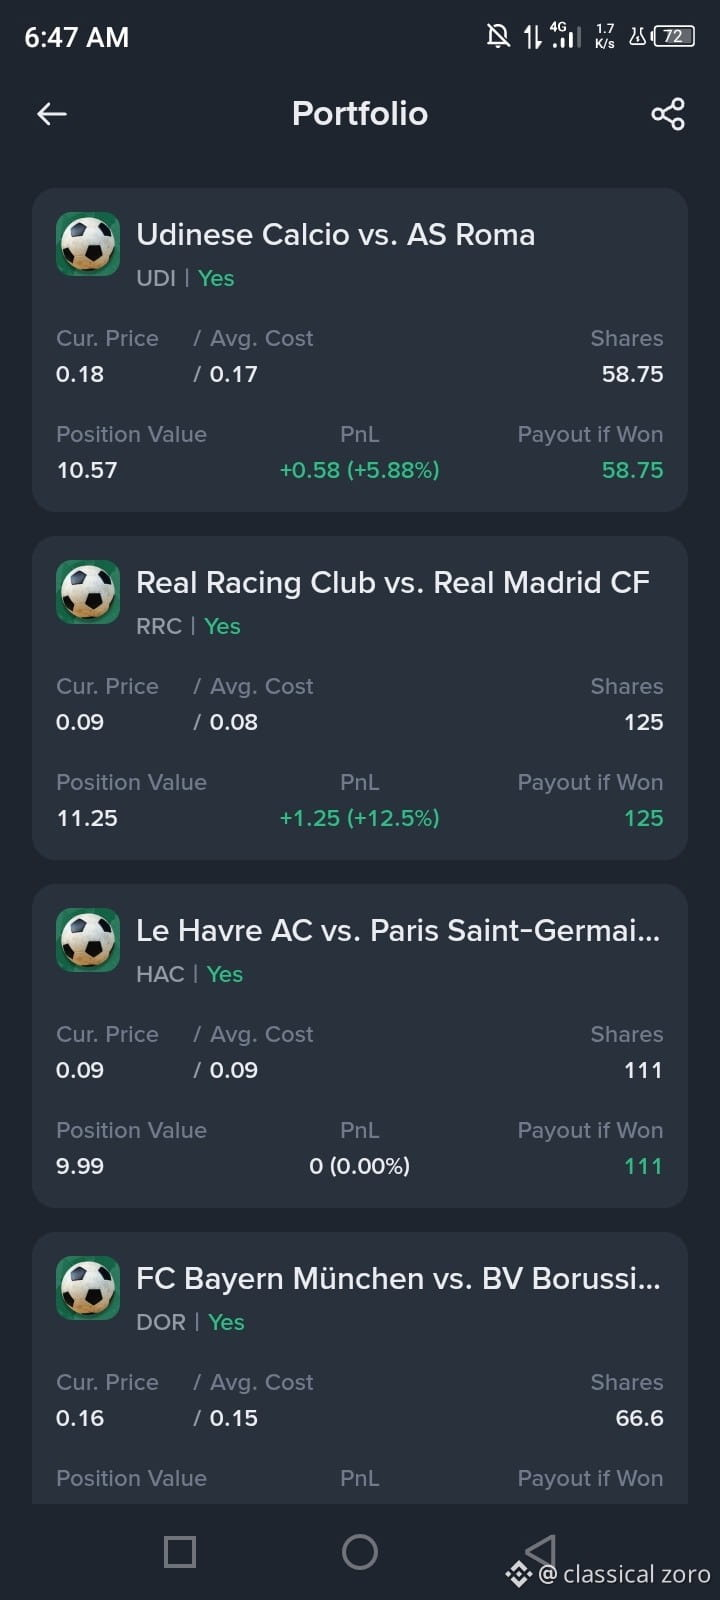
I’m locking in my daily picks for the Binance Pick campaign! Today, I’m focusing on the football prediction markets, and my portfolio is looking great so far. 📈
Here is a breakdown of my current active positions:
⚽ Real Racing Club vs. Real Madrid: Holding "Yes" shares here and currently sitting at a massive +12.5% profit! 📈
⚽ Udinese vs. AS Roma: Another green position! My "Yes" shares are up +5.88%. 💪
⚽ Le Havre vs. PSG: Holding steady at the moment. Waiting for the match to play out.
⚽ Bayern München vs. Dortmund: Bought in at 0.15, already ticking up to 0.16.
I’ve attached a screenshot of my portfolio to track my progress. Let’s see if I can climb the leaderboard and grab a share of the prize pool! 🏆
What matches are you predicting today? Drop your picks in the comments! 👇
#BinancePick #PostMyBinancePick #BinanceSquareFamily #BayernMunich #EarningsSeason
$MSFTB $AMZNB $GOOGLB
{spot}(GOOGLBUSDT)
{spot}(AMZNBUSDT)
{spot}(MSFTBUSDT)
I’m locking in my daily picks for the Binance Pick campaign! Today, I’m focusing on the football prediction markets, and my portfolio is looking great so far. 📈
Here is a breakdown of my current active positions:
⚽ Real Racing Club vs. Real Madrid: Holding "Yes" shares here and currently sitting at a massive +12.5% profit! 📈
⚽ Udinese vs. AS Roma: Another green position! My "Yes" shares are up +5.88%. 💪
⚽ Le Havre vs. PSG: Holding steady at the moment. Waiting for the match to play out.
⚽ Bayern München vs. Dortmund: Bought in at 0.15, already ticking up to 0.16.
I’ve attached a screenshot of my portfolio to track my progress. Let’s see if I can climb the leaderboard and grab a share of the prize pool! 🏆
What matches are you predicting today? Drop your picks in the comments! 👇
#BinancePick #PostMyBinancePick #BinanceSquareFamily #BayernMunich #EarningsSeason
$MSFTB $AMZNB $GOOGLB
1
140
·
--
Рост
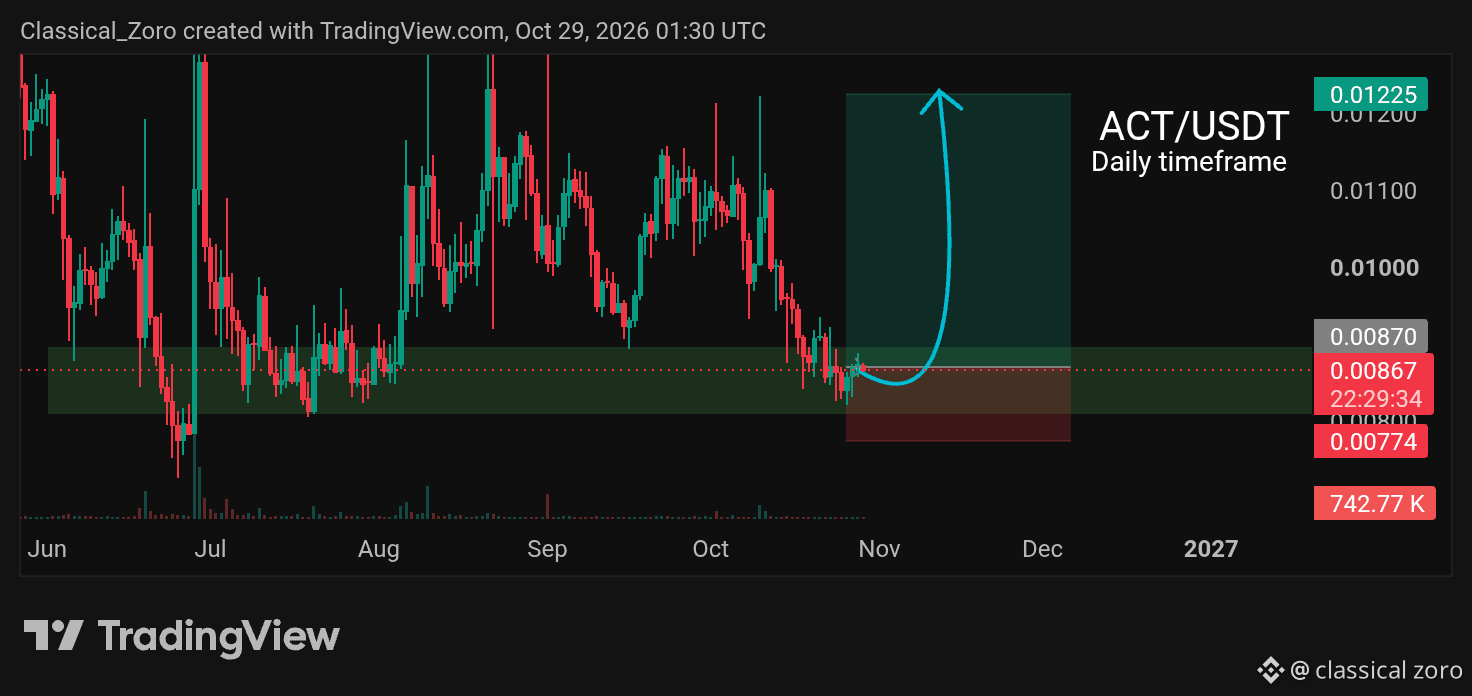
$ACT bulls are making a stand right at a critical daily demand zone.
After a heavy pullback from the recent highs, the price has dropped directly into a major support block between 0.008 and 0.009.
This isn't just minor support. History shows this exact green zone has consistently stopped sellers in their tracks and fueled previous rallies.
Currently holding right inside this floor at 0.00867, the downside momentum is clearly fading as buyers start to step in.
If this demand zone holds firm and buyers regain control, the next major move could easily push the price back up to test the 0.01225 resistance level.
Lose the 0.008 level, though, and the bullish thesis is invalidated, opening the door for a deeper drop.
Bulls have a textbook setup right in front of them, but they need to prove it with a strong daily close here.
{spot}(ACTUSDT)
#ACT #ACTUSDT
$ACT bulls are making a stand right at a critical daily demand zone.
After a heavy pullback from the recent highs, the price has dropped directly into a major support block between 0.008 and 0.009.
This isn't just minor support. History shows this exact green zone has consistently stopped sellers in their tracks and fueled previous rallies.
Currently holding right inside this floor at 0.00867, the downside momentum is clearly fading as buyers start to step in.
If this demand zone holds firm and buyers regain control, the next major move could easily push the price back up to test the 0.01225 resistance level.
Lose the 0.008 level, though, and the bullish thesis is invalidated, opening the door for a deeper drop.
Bulls have a textbook setup right in front of them, but they need to prove it with a strong daily close here.
#ACT #ACTUSDT
Follow For More
От classical zoro
1
2
134
·
--
Рост
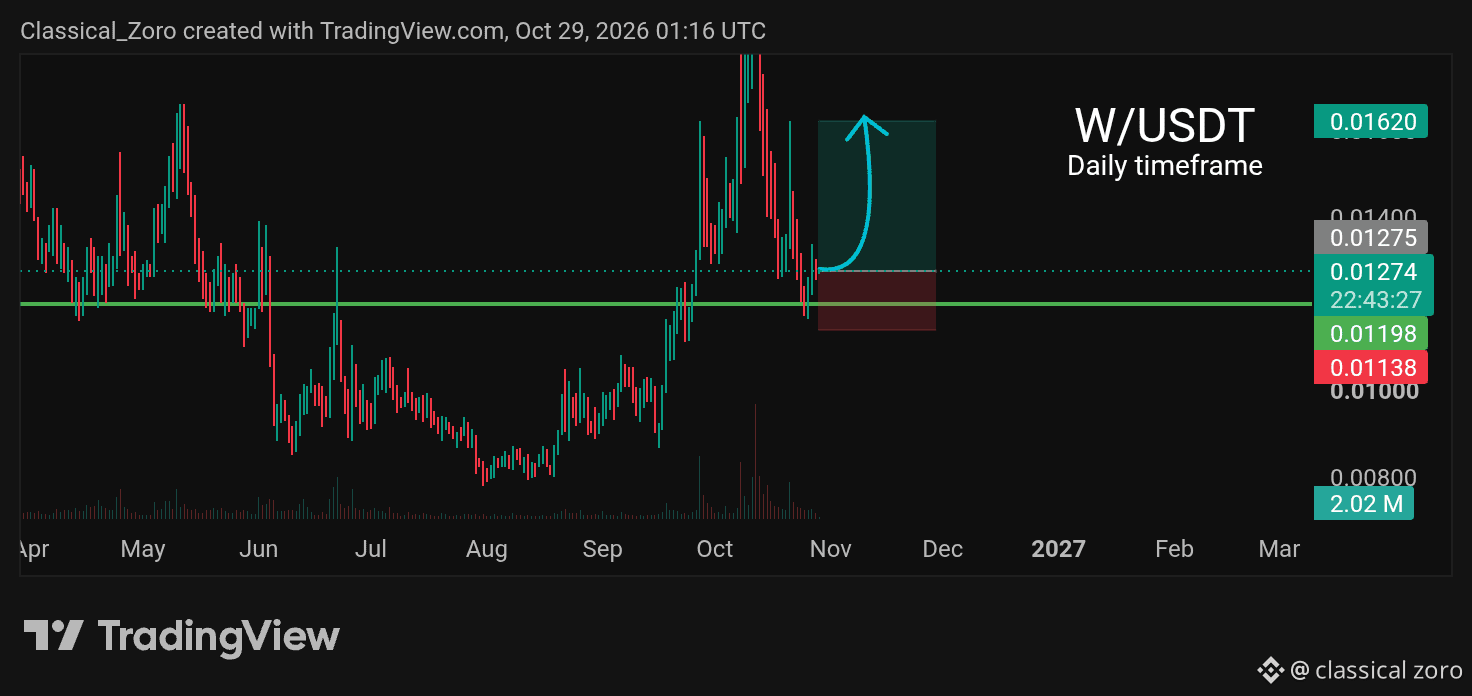
$W bulls have already stepped up and proved their point.
The daily chart is clearly showing that the bounce off the 0.012 support level is already confirmed. We have seen strong, aggressive daily closes rejecting this zone—not just once, but twice.
This isn't a setup that "might" happen; the buyers are actively defending this floor right now.
With the bounce locked in and support holding firm, the path of least resistance is clear. The next major move is a push right back up to test the 0.01620 resistance level.
Lose the 0.01198 support level, though, and the bullish thesis is completely invalidated.
The reaction is confirmed, the buyers are in control, and the next leg up is loading.
{spot}(WUSDT)
#w #RedPacketMission
$W bulls have already stepped up and proved their point.
The daily chart is clearly showing that the bounce off the 0.012 support level is already confirmed. We have seen strong, aggressive daily closes rejecting this zone—not just once, but twice.
This isn't a setup that "might" happen; the buyers are actively defending this floor right now.
With the bounce locked in and support holding firm, the path of least resistance is clear. The next major move is a push right back up to test the 0.01620 resistance level.
Lose the 0.01198 support level, though, and the bullish thesis is completely invalidated.
The reaction is confirmed, the buyers are in control, and the next leg up is loading.
#w #RedPacketMission
Follow For More
От classical zoro
1
2
287
·
--
Рост
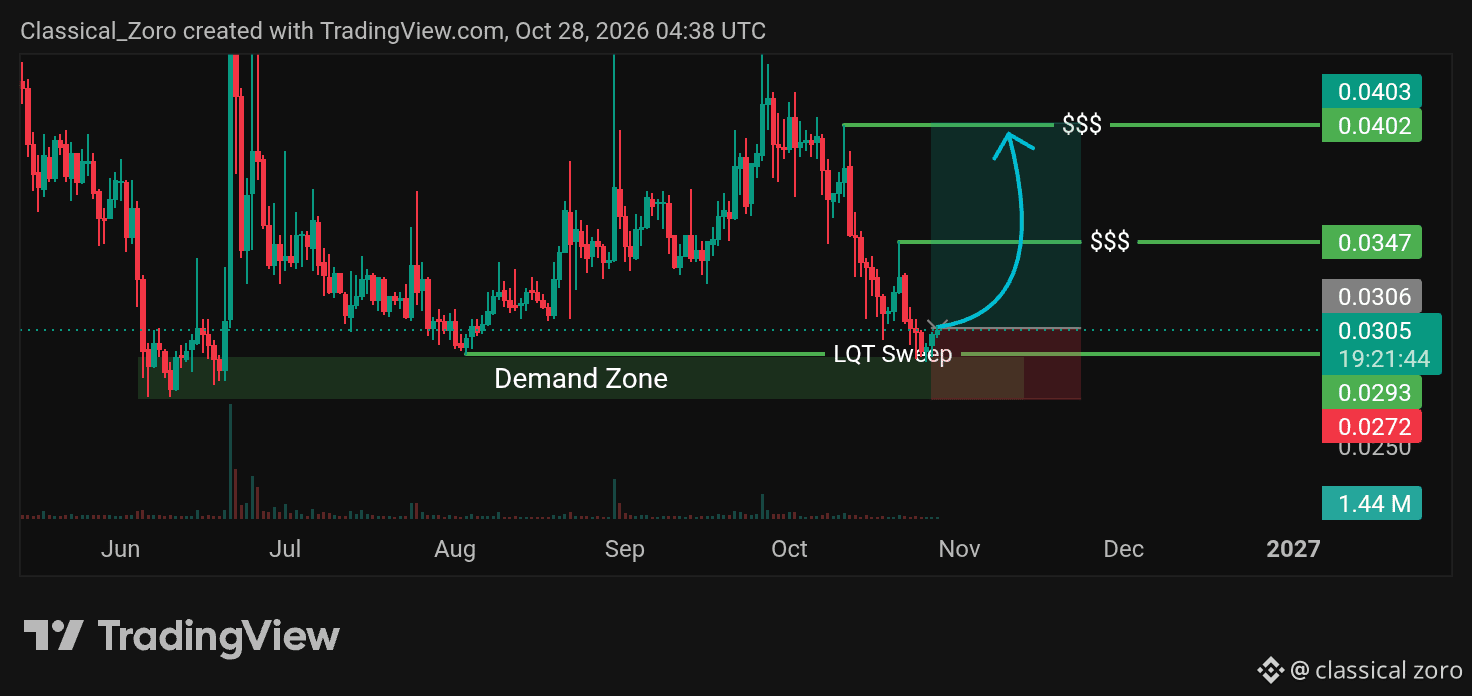
$TNSR bulls just pulled off a perfect liquidity sweep, and the bounce is officially confirmed.
The price dropped right into the major demand zone between 0.0272 and 0.0293. Instead of breaking down, it swept the lows right at 0.0293, trapping late sellers and grabbing the liquidity they needed.
The reaction is exactly what we wanted to see. Buyers stepped in immediately, proving that demand is real at this level.
With the trap set and the reaction confirmed, the path of least resistance is now up. The next major targets are the liquidity highs waiting at 0.0347 and 0.0402.
The shorts are officially trapped, and the stage is set for the next leg up.
{spot}(TNSRUSDT)
#tnsrusdt
#RedPacketMission
#RedpecketReward
$TNSR bulls just pulled off a perfect liquidity sweep, and the bounce is officially confirmed.
The price dropped right into the major demand zone between 0.0272 and 0.0293. Instead of breaking down, it swept the lows right at 0.0293, trapping late sellers and grabbing the liquidity they needed.
The reaction is exactly what we wanted to see. Buyers stepped in immediately, proving that demand is real at this level.
With the trap set and the reaction confirmed, the path of least resistance is now up. The next major targets are the liquidity highs waiting at 0.0347 and 0.0402.
The shorts are officially trapped, and the stage is set for the next leg up.
#tnsrusdt
#RedPacketMission
#RedpecketReward
Best wishes!
От classical zoro
1
5
501
·
--
Рост
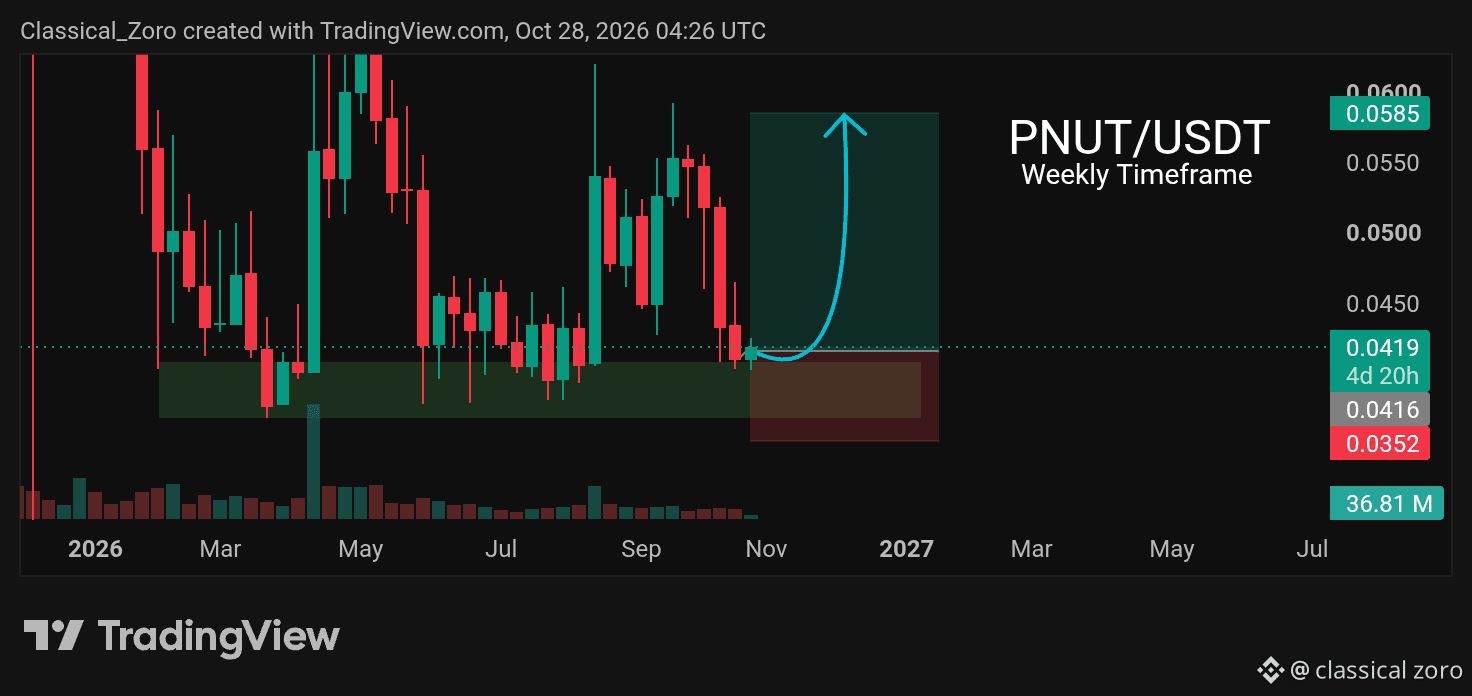
$PNUT bulls are making a major stand right on the weekly timeframe.
After a heavy pullback from the recent highs, the price has dropped directly into a massive demand zone between 0.0367 and 0.0409.
This isn't just minor support. On the weekly chart, this area is acting as a critical base, and price is currently holding right at the upper edge of it.
If buyers step up here and defend this floor, the next major move could easily push price back up to test the 0.0585 resistance level.
Lose the 0.0367 level, though, and the bullish thesis is invalidated, opening the door for a much deeper correction.
Bulls have the home-field advantage at this zone, but they need a strong weekly close here to confirm the next leg up.
{spot}(PNUTUSDT)
#PNUTUSDT
$PNUT bulls are making a major stand right on the weekly timeframe.
After a heavy pullback from the recent highs, the price has dropped directly into a massive demand zone between 0.0367 and 0.0409.
This isn't just minor support. On the weekly chart, this area is acting as a critical base, and price is currently holding right at the upper edge of it.
If buyers step up here and defend this floor, the next major move could easily push price back up to test the 0.0585 resistance level.
Lose the 0.0367 level, though, and the bullish thesis is invalidated, opening the door for a much deeper correction.
Bulls have the home-field advantage at this zone, but they need a strong weekly close here to confirm the next leg up.
#PNUTUSDT
2
247
·
--
Рост
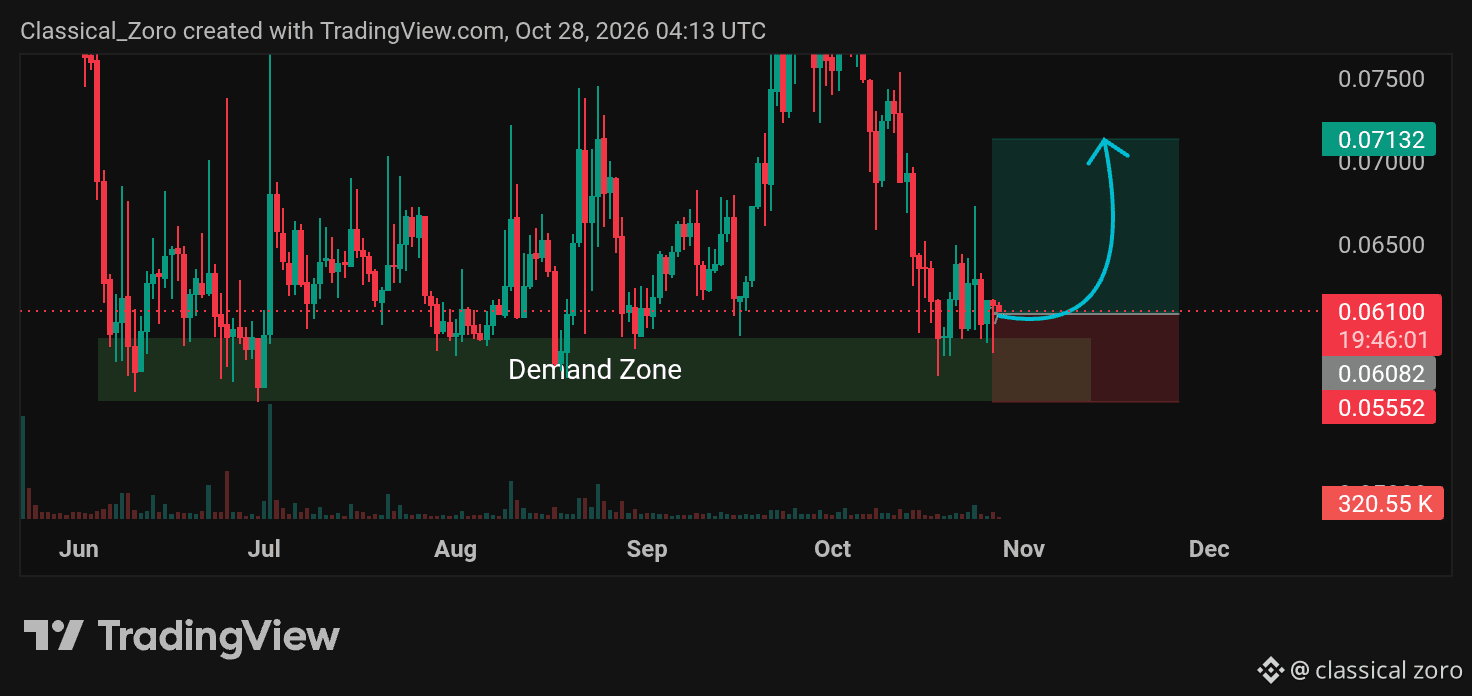
$ME bulls are showing exactly why this daily level is an absolute brick wall.
Look at the history. The price has aggressively bounced from this 0.0555–0.0594 demand zone multiple times.
Now, we are tapping it once again, and the setup is already playing out. A solid bullish reaction is printing right before our eyes—no need to wait for more confirmation.
If buyers step in here to defend this floor, the next logical move is a push straight up to fill the unfilled bearish Fair Value Gap (FVG) sitting at 0.07.
Lose this critical demand zone, though, and the structure breaks, opening the door for a much deeper drop.
History is clearly on the bulls' side, and the path of least resistance is pointing up.
{spot}(MEUSDT)
#MEUSDT
$ME bulls are showing exactly why this daily level is an absolute brick wall.
Look at the history. The price has aggressively bounced from this 0.0555–0.0594 demand zone multiple times.
Now, we are tapping it once again, and the setup is already playing out. A solid bullish reaction is printing right before our eyes—no need to wait for more confirmation.
If buyers step in here to defend this floor, the next logical move is a push straight up to fill the unfilled bearish Fair Value Gap (FVG) sitting at 0.07.
Lose this critical demand zone, though, and the structure breaks, opening the door for a much deeper drop.
History is clearly on the bulls' side, and the path of least resistance is pointing up.
#MEUSDT
2
193
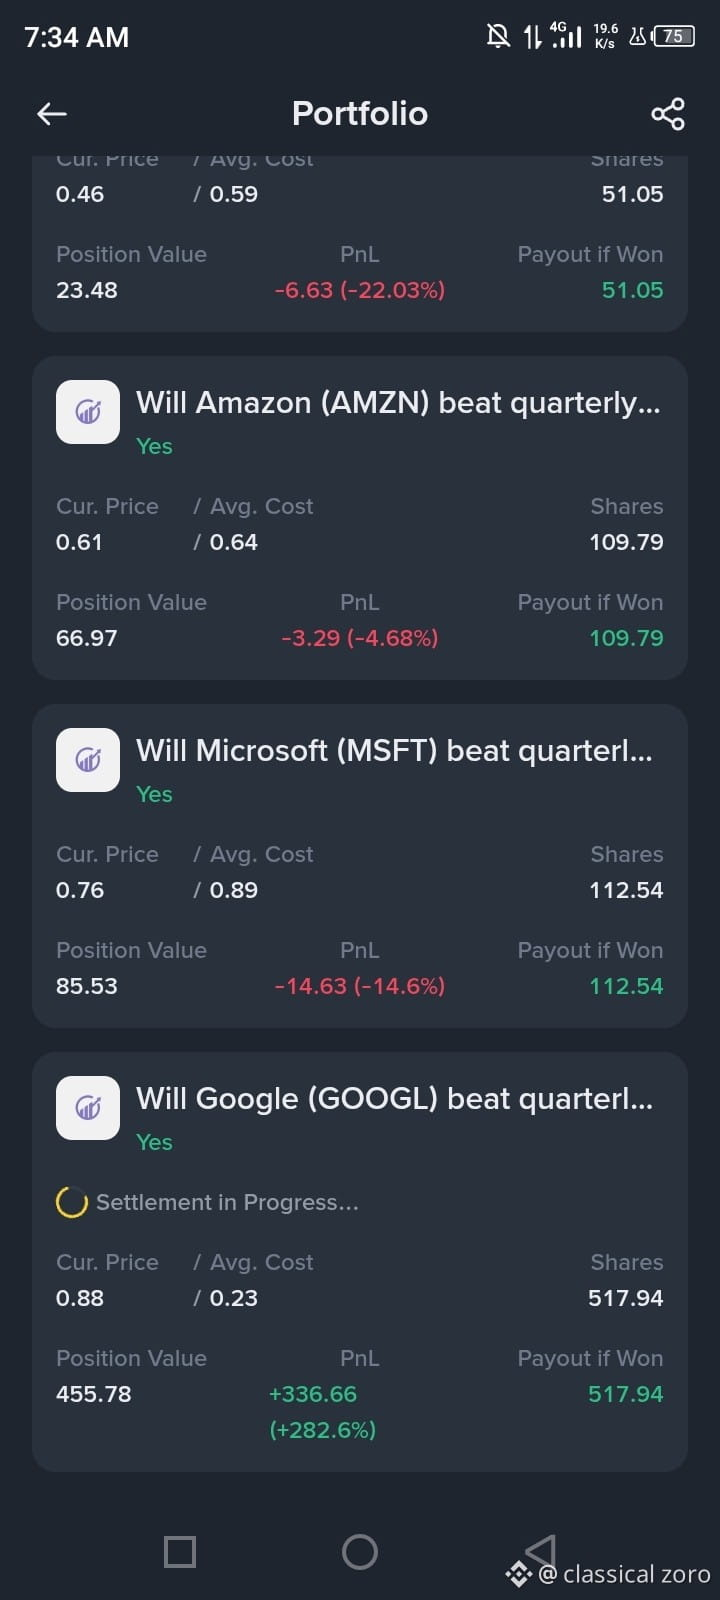
Up +282% on GOOGL Yes – Here's Why I'm Still Holding Until the Print 🚀
Look at this conviction. When the crowd was unsure, I locked in my "Yes" on Google beating quarterly earnings. Now, sitting on a +282% gain with 517 shares and settlement in progress, I'm not flinching.
Here is the data behind the position:
1. Cloud is the Growth Engine
Google Cloud is no longer a side project—it's a monster. Last quarter, Cloud revenue surged 82% YoY to $24.8B, crushing estimates. The backlog is now sitting at $514B, with roughly half expected to convert to revenue over the next 24 months. External TPU sales are just starting to ramp, opening a new multi-billion dollar revenue stream through 2028.
2. The Bar is Low Enough to Clear
Consensus sits around $3.00–$3.02 EPS on roughly $127.9B in revenue. The LSEG StarMine SmartEstimate implies a surprise of just 0.31%—essentially a coin toss. But with 18 analyst upgrades in the past month versus 11 downgrades, the momentum is on the bulls' side.
3. Gemini 4 Argon is a Differentiator
Google's latest model is outscoring leading models from OpenAI and Anthropic on several benchmarks, particularly in cybersecurity. Analysts at Truist note this is evidence Alphabet has "closed the frontier-model gap." Better adoption at competitive prices could pressure margins, but the volume story is intact.
4. Search Isn't Dead
Despite fears of AI eating search, third-party data supports durable Search trends. Search & Other revenue grew 17% last quarter to $63.3B. Google continues to dominate traffic even as AI adoption rises.
The Risk?
Capex. Management raised 2026 guidance to $195–$205B, and free cash flow turned negative for the first time since 2004. If the print shows spending outpacing revenue conversion, the stock could drop—even on a beat. Over the past four quarters, Google beat EPS every time, yet the stock closed higher only twice.
#BinancePick #EarningsSeason
2
260
·
--
Рост
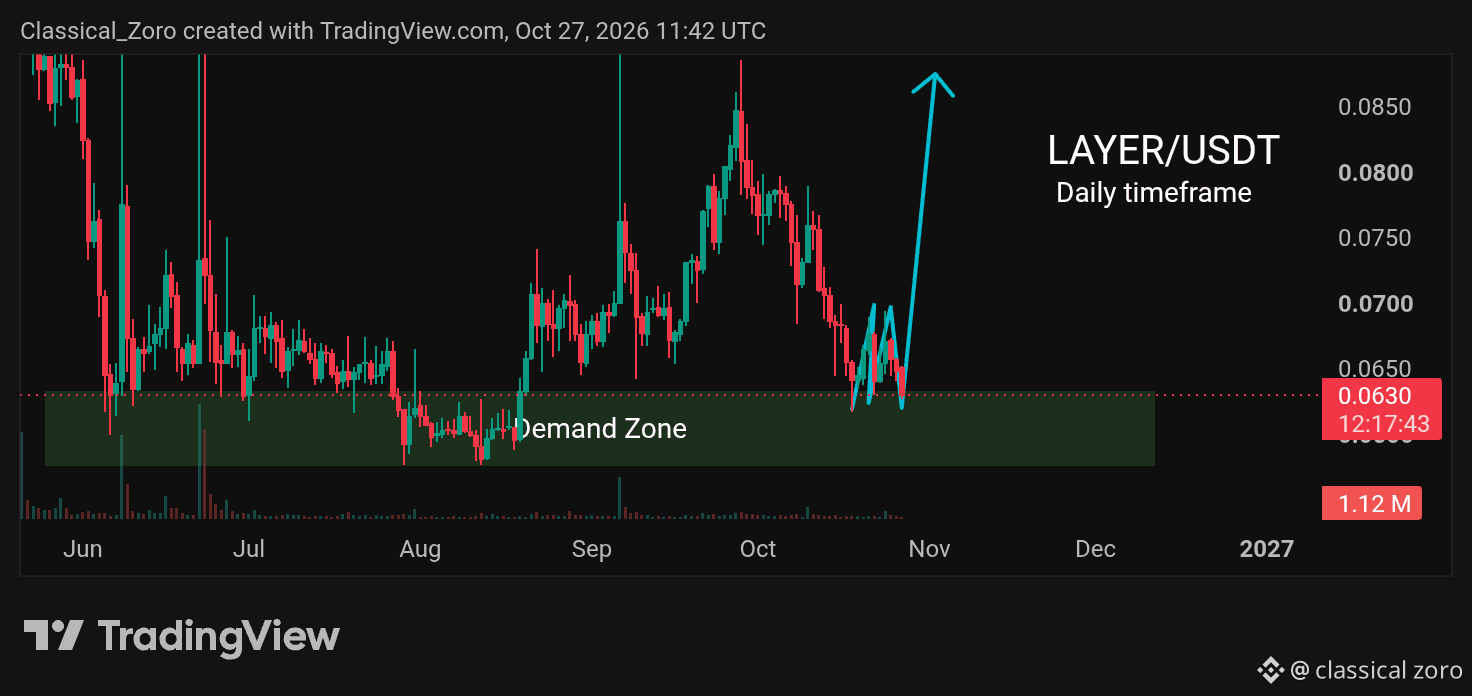
$LAYER is setting a classic liquidity trap right where it matters.
Price has dropped into a major demand zone and is currently consolidating sideways instead of bouncing immediately.
This isn't weakness; it's a deliberate move to invite more short sellers into the market.
By chopping around this level, it makes support look weak, tricking bears into building up their positions right before the real move.
Once enough liquidity is built up on the short side, the game changes. Expect a violent upward push to squeeze those late shorts and force a liquidation cascade.
If this trap springs, the next major upside target sits right back up near the 0.0850 resistance level.
Lose the bottom of this demand zone, though, and the setup is invalidated, opening the door for a deeper drop.
Bears might think they have the edge right now, but this looks like a spring loading for a massive upside squeeze.
{spot}(LAYERUSDT)
#layerusdt
$LAYER is setting a classic liquidity trap right where it matters.
Price has dropped into a major demand zone and is currently consolidating sideways instead of bouncing immediately.
This isn't weakness; it's a deliberate move to invite more short sellers into the market.
By chopping around this level, it makes support look weak, tricking bears into building up their positions right before the real move.
Once enough liquidity is built up on the short side, the game changes. Expect a violent upward push to squeeze those late shorts and force a liquidation cascade.
If this trap springs, the next major upside target sits right back up near the 0.0850 resistance level.
Lose the bottom of this demand zone, though, and the setup is invalidated, opening the door for a deeper drop.
Bears might think they have the edge right now, but this looks like a spring loading for a massive upside squeeze.
#layerusdt
1
287
·
--
Рост
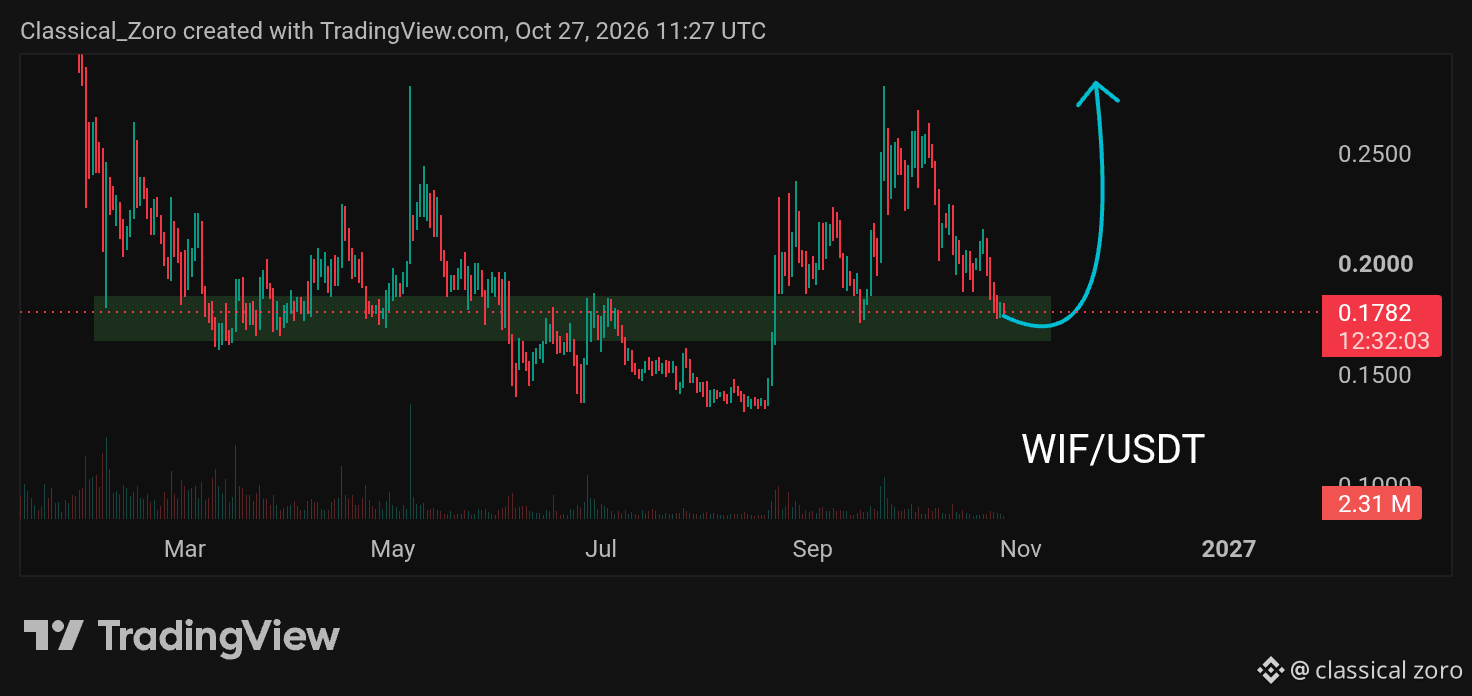
$WIF bulls are gearing up for a major bounce right from a critical demand zone.
After a sharp rejection from the 0.25 resistance level, the price has cooled off and pulled all the way back to a massive support block between 0.165 and 0.185.
This isn't just any random level. The chart shows this exact green zone has acted as a brick wall multiple times over the past year, consistently stopping sellers in their tracks.
Currently trading right inside this zone at 0.1782, the downside momentum is clearly fading.
If buyers step up here and defend this floor, a strong bounce is highly likely, setting the stage for a massive push right back toward the 0.25 highs.
Lose this support zone, though, and the bullish structure is invalidated, opening the door for a much deeper correction.
Bulls have a textbook setup right in front of them, but they need to prove it with a strong reaction here.
{spot}(WIFUSDT)
#WIFUSDT
$WIF bulls are gearing up for a major bounce right from a critical demand zone.
After a sharp rejection from the 0.25 resistance level, the price has cooled off and pulled all the way back to a massive support block between 0.165 and 0.185.
This isn't just any random level. The chart shows this exact green zone has acted as a brick wall multiple times over the past year, consistently stopping sellers in their tracks.
Currently trading right inside this zone at 0.1782, the downside momentum is clearly fading.
If buyers step up here and defend this floor, a strong bounce is highly likely, setting the stage for a massive push right back toward the 0.25 highs.
Lose this support zone, though, and the bullish structure is invalidated, opening the door for a much deeper correction.
Bulls have a textbook setup right in front of them, but they need to prove it with a strong reaction here.
#WIFUSDT
1
156
·
--
Рост
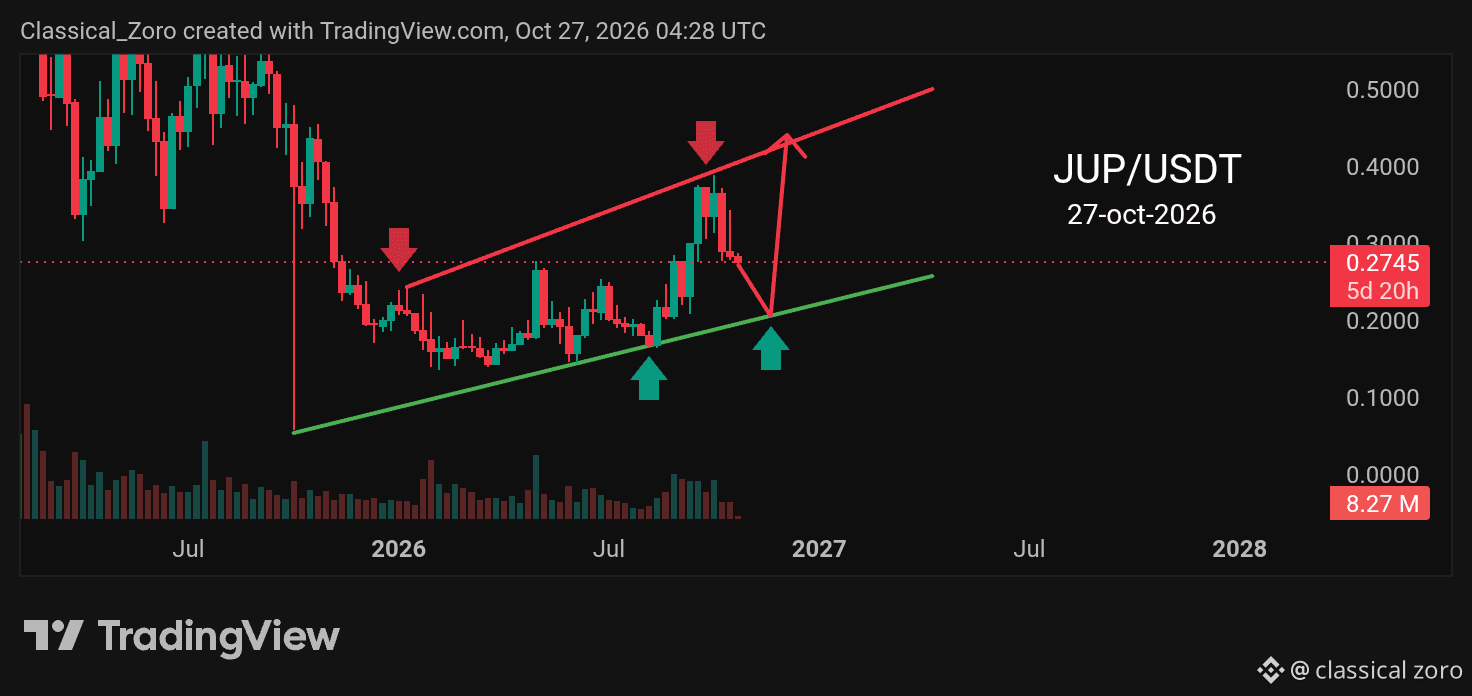
$JUP is setting up a textbook play on the weekly timeframe that most traders might overlook.
The chart is printing a massive ascending channel—one of the most reliable bullish structures out there. After getting rejected at the top, price is now cooling off and trending downward.
Right now, it’s highly likely we see the price tap the lower green trendline to test demand.
That’s exactly where the game begins.
If buyers step in and defend that lower trendline, we have a high-probability setup for a massive bounce. The next major target would be a push right back up to the 0.43 resistance level.
Lose that lower trendline, though, and the bullish structure is broken, opening the door for a deeper drop.
This isn’t a 1-minute chart where noise rules. This is the weekly timeframe, meaning this setup holds serious weight.
Bulls are patiently waiting for their entry, but the reaction at the bottom will decide the next major trend.
{spot}(JUPUSDT)
#JUPUSDT
$JUP is setting up a textbook play on the weekly timeframe that most traders might overlook.
The chart is printing a massive ascending channel—one of the most reliable bullish structures out there. After getting rejected at the top, price is now cooling off and trending downward.
Right now, it’s highly likely we see the price tap the lower green trendline to test demand.
That’s exactly where the game begins.
If buyers step in and defend that lower trendline, we have a high-probability setup for a massive bounce. The next major target would be a push right back up to the 0.43 resistance level.
Lose that lower trendline, though, and the bullish structure is broken, opening the door for a deeper drop.
This isn’t a 1-minute chart where noise rules. This is the weekly timeframe, meaning this setup holds serious weight.
Bulls are patiently waiting for their entry, but the reaction at the bottom will decide the next major trend.
#JUPUSDT
1
236
·
--
Рост
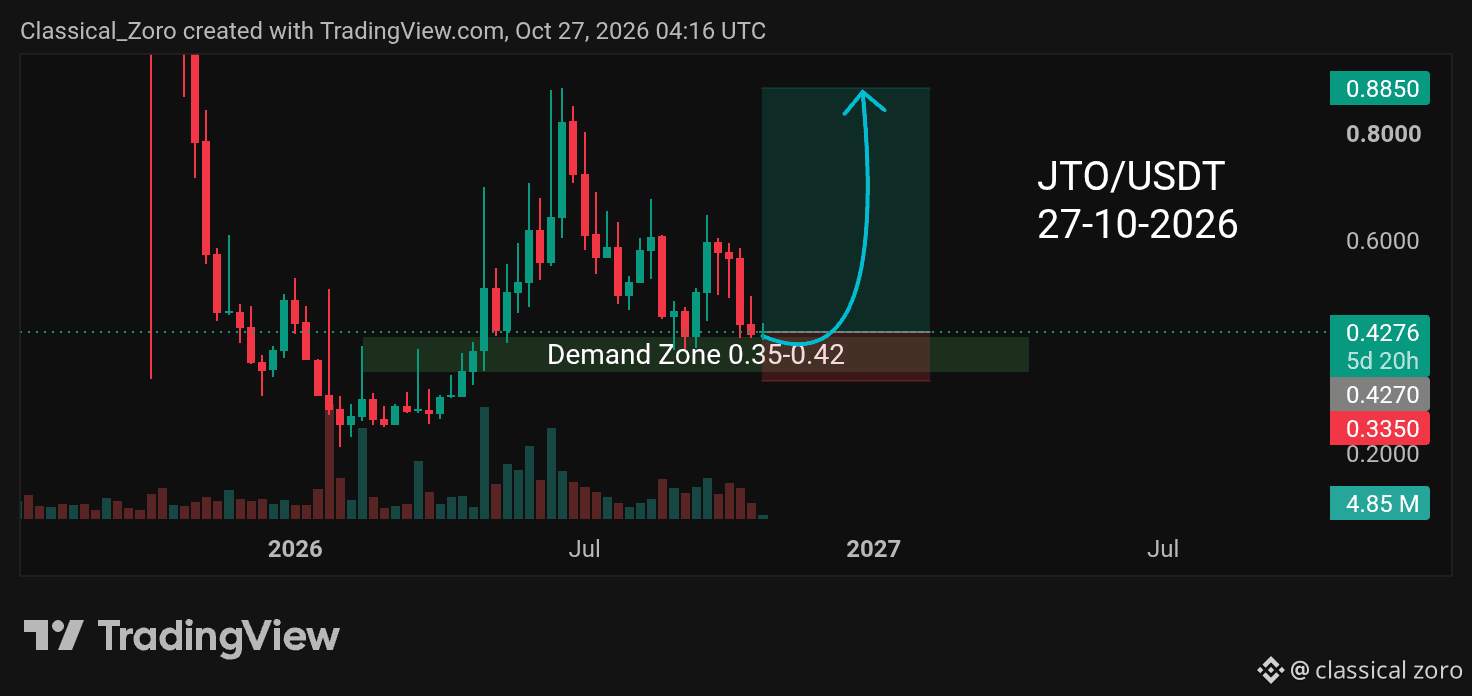
$JTO bulls are eyeing a major reversal right from a key demand zone.
The price has pulled back significantly from its recent highs, but it’s now tapping directly into a fresh demand zone between 0.35 and 0.42.
This isn't just random support; it's a level where buyers previously stepped in aggressively to fuel the last major leg up.
Currently holding around 0.42, the price is showing early signs of exhaustion from sellers, setting the stage for a potential bounce.
If this demand zone holds firm and buyers take control, the next major upside target sits up at the 0.8850 resistance level.
Lose the 0.35 level, though, and this bullish setup is invalidated, likely leading to a deeper correction.
Bulls are sitting at a critical defense line, but they need a strong reaction here to confirm the next move higher.
{spot}(JTOUSDT)
#JTO/USDT
$JTO bulls are eyeing a major reversal right from a key demand zone.
The price has pulled back significantly from its recent highs, but it’s now tapping directly into a fresh demand zone between 0.35 and 0.42.
This isn't just random support; it's a level where buyers previously stepped in aggressively to fuel the last major leg up.
Currently holding around 0.42, the price is showing early signs of exhaustion from sellers, setting the stage for a potential bounce.
If this demand zone holds firm and buyers take control, the next major upside target sits up at the 0.8850 resistance level.
Lose the 0.35 level, though, and this bullish setup is invalidated, likely leading to a deeper correction.
Bulls are sitting at a critical defense line, but they need a strong reaction here to confirm the next move higher.
#JTO/USDT
1
319
·
--
Рост
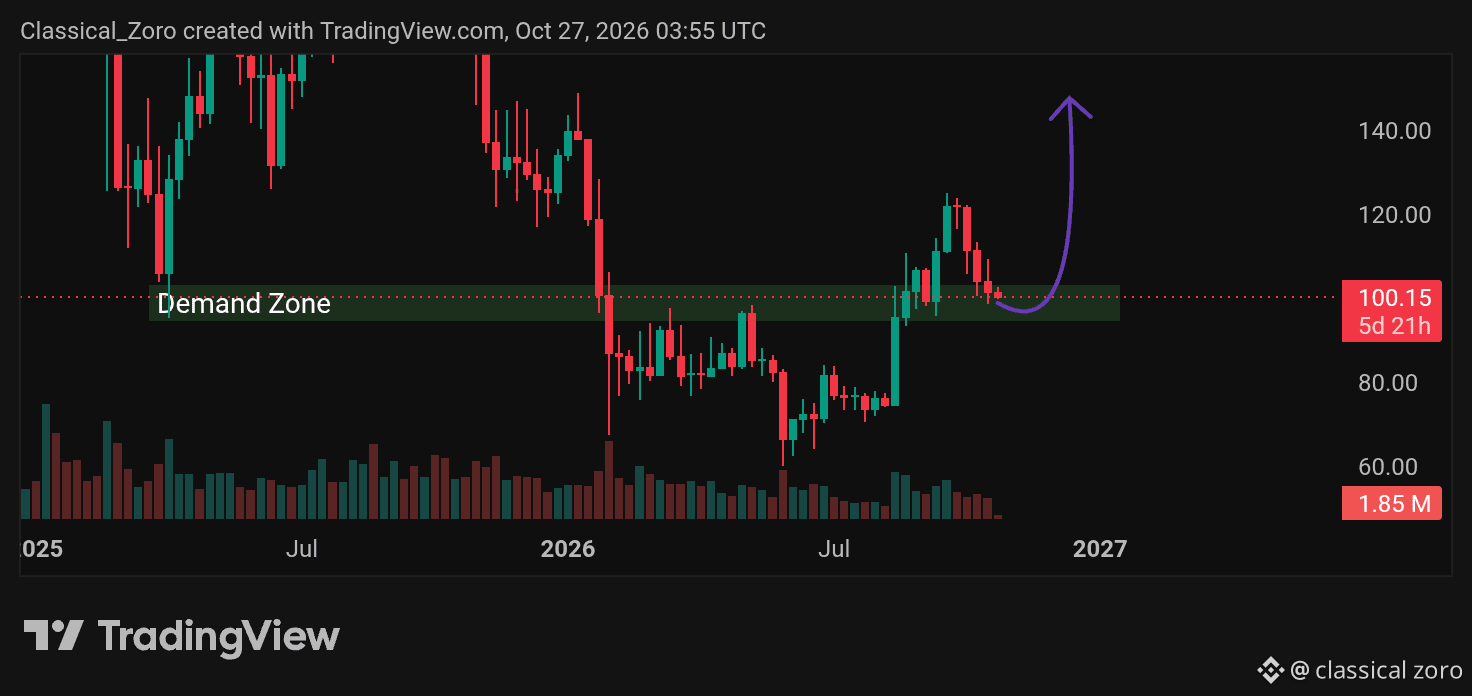
$SOL is sitting at the weekly demand zone of 94–107. A strong bullish candle close above that zone could confirm a move towards 147.
{spot}(SOLUSDT)
#Solana
$SOL is sitting at the weekly demand zone of 94–107. A strong bullish candle close above that zone could confirm a move towards 147.
#Solana
#Solana
1
389
·
--
Рост
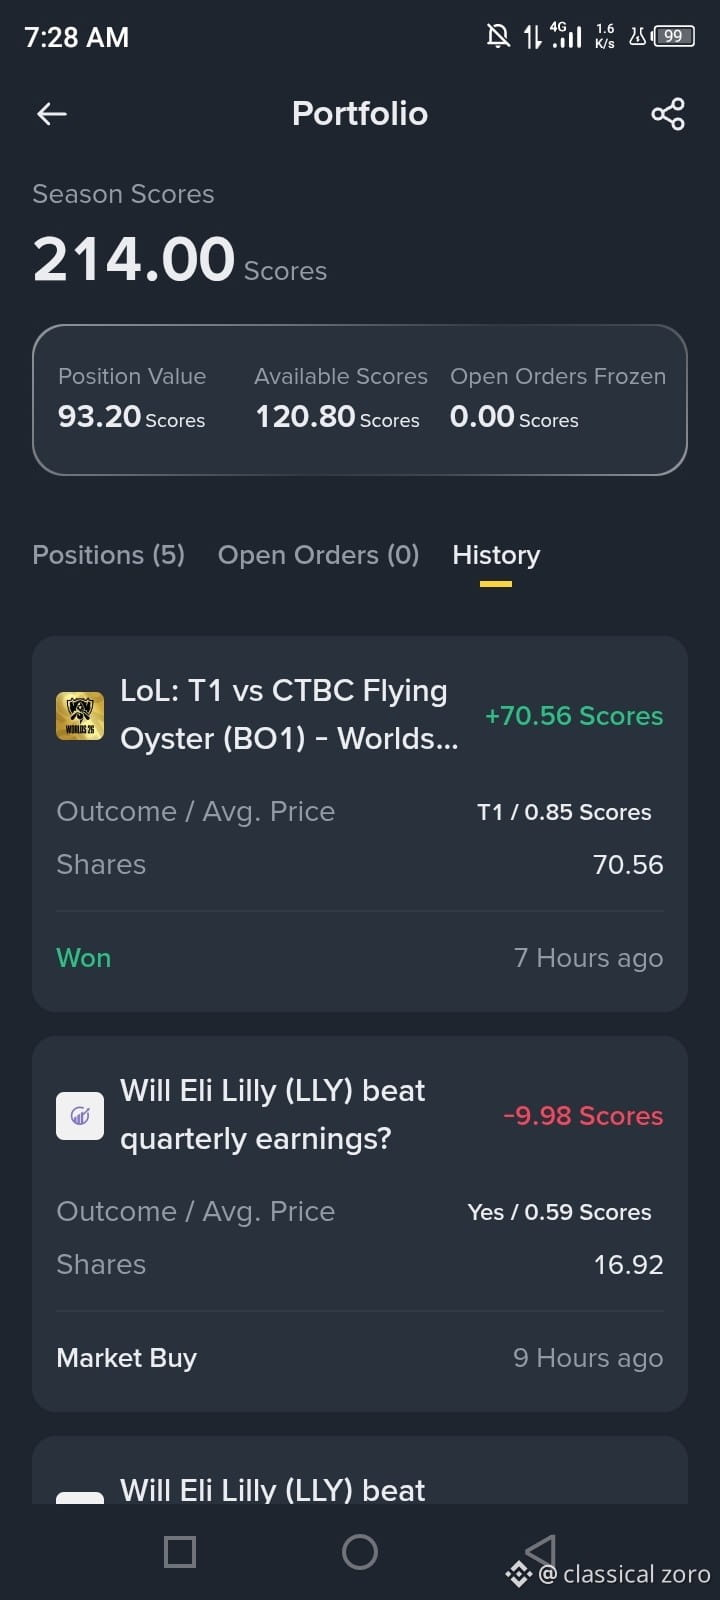
Won My First Prediction on #BinancePick
I'm Bullish in $GOOGL , $AMZNB , $LLYB
what is The Your Prediction? I'm Very excited to Know
Won My First Prediction on #BinancePick
I'm Bullish in $GOOGL , $AMZNB , $LLYB
what is The Your Prediction? I'm Very excited to Know
I'm Bullish in $GOOGL , $AMZNB , $LLYB
what is The Your Prediction? I'm Very excited to Know
15
#BinancePick Binance is putting up a massive 1,000,000 USDC rewards pool. If you’ve got the golden touch, it’s time to show it off. 👑🏀
#BinancePick Binance is putting up a massive 1,000,000 USDC rewards pool. If you’ve got the golden touch, it’s time to show it off. 👑🏀

1
12
Статья
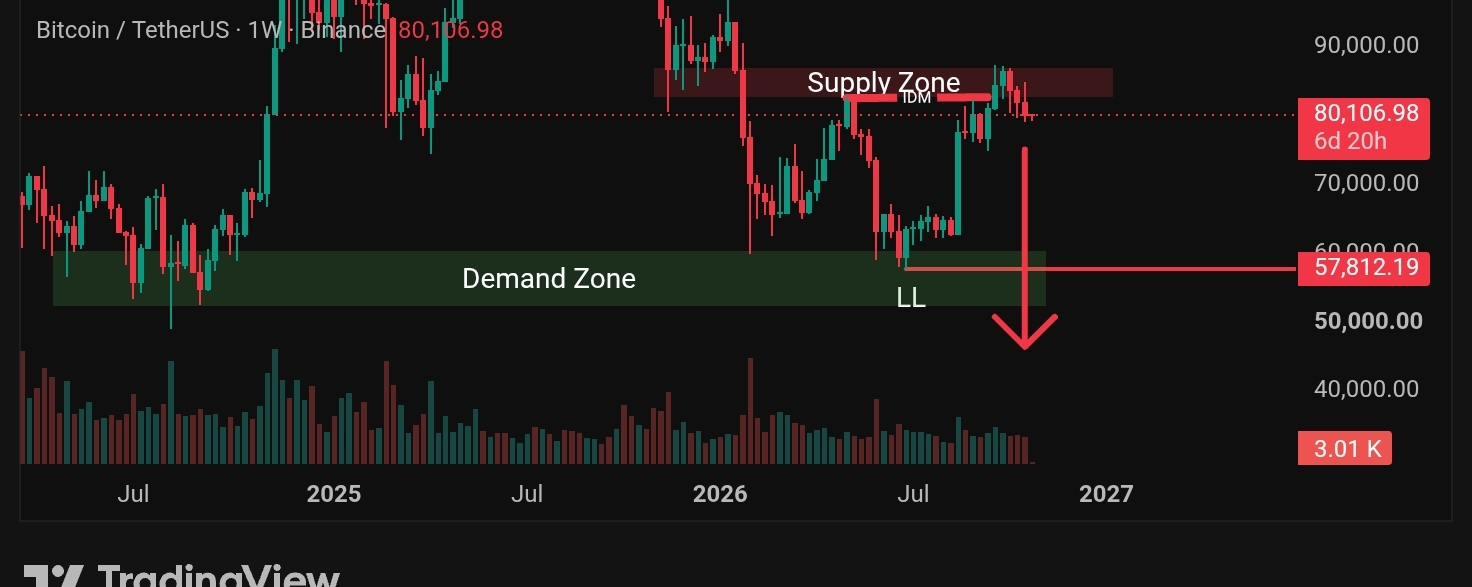
🔴 Bitcoin Weekly Deep Dive: CHOCH Confirmed & The Road to a Lower Low? 📉Attention Traders! The weekly chart for BTC/USDT is flashing some major structural signals. If you follow Smart Money Concepts (SMC) or market structure, this setup demands your attention.
After a confirmed Change of Character (CHOCH), the broader weekly trend has shifted Bearish. Here is the exact scenario playing out on the chart and how we can prepare for the next move.
📉 The SMC Scenario Breakdown
1. The Bearish Trend & CHOCH
The weekly chart has established a bearish bias. We have seen a clear CHOCH, indicating that the previous bullish momentum has failed and sellers are now in control of the higher timeframe structure.
2. The IDM Confirmation
The chart highlights an Inducement (IDM). Price recently took demand/liquidity from the lower zones to confirm this IDM. This is classic market maker behavior—trapping early buyers and building liquidity before the real move. With the IDM confirmed, the framework for a Lower Low (LL) is now decided.
3. The Rejection at Supply
Price has pushed up into the heavy red Supply Zone (~$85K - $90K) and is currently facing strong rejection around the $80,106 level. This aligns perfectly with our bearish thesis. The smart money is likely using this premium zone to load up on shorts.
🎯 The Path Forward: BOS and LH
So, what's next? According to this market structure, we are anticipating a heavy drop from the current Supply Zone.
· The Drop: Expect price to distribute downward from this red zone, validating our confirmed IDM.· The Target: Price will target the LL at $57,812.19, aiming to tap into the massive green Demand Zone below.· The BOS: This downward move is necessary to create a Break of Structure (BOS). Once the BOS occurs, the market will print a new Lower High (LH), definitively confirming the continuation of the bearish market structure.
💡 Trader's Game Plan
· Short-Term Bias: Bearish. Look for entries in the current supply zone.· Invalidation: A strong weekly close above the Supply Zone would invalidate this bearish setup.· Long-Term Accumulation: The massive green Demand Zone (around the $57K target) is where the true, high-timeframe demand lies.
Are you shorting this rejection, or waiting to accumulate in the green demand zone?
Drop your thoughts below! 👇
$BTC
#BTC
{spot}(BTCUSDT)
🔴 Bitcoin Weekly Deep Dive: CHOCH Confirmed & The Road to a Lower Low? 📉
Attention Traders! The weekly chart for BTC/USDT is flashing some major structural signals. If you follow Smart Money Concepts (SMC) or market structure, this setup demands your attention.
After a confirmed Change of Character (CHOCH), the broader weekly trend has shifted Bearish. Here is the exact scenario playing out on the chart and how we can prepare for the next move.
📉 The SMC Scenario Breakdown
1. The Bearish Trend & CHOCH
The weekly chart has established a bearish bias. We have seen a clear CHOCH, indicating that the previous bullish momentum has failed and sellers are now in control of the higher timeframe structure.
2. The IDM Confirmation
The chart highlights an Inducement (IDM). Price recently took demand/liquidity from the lower zones to confirm this IDM. This is classic market maker behavior—trapping early buyers and building liquidity before the real move. With the IDM confirmed, the framework for a Lower Low (LL) is now decided.
3. The Rejection at Supply
Price has pushed up into the heavy red Supply Zone (~$85K - $90K) and is currently facing strong rejection around the $80,106 level. This aligns perfectly with our bearish thesis. The smart money is likely using this premium zone to load up on shorts.
🎯 The Path Forward: BOS and LH
So, what's next? According to this market structure, we are anticipating a heavy drop from the current Supply Zone.
· The Drop: Expect price to distribute downward from this red zone, validating our confirmed IDM.· The Target: Price will target the LL at $57,812.19, aiming to tap into the massive green Demand Zone below.· The BOS: This downward move is necessary to create a Break of Structure (BOS). Once the BOS occurs, the market will print a new Lower High (LH), definitively confirming the continuation of the bearish market structure.
💡 Trader's Game Plan
· Short-Term Bias: Bearish. Look for entries in the current supply zone.· Invalidation: A strong weekly close above the Supply Zone would invalidate this bearish setup.· Long-Term Accumulation: The massive green Demand Zone (around the $57K target) is where the true, high-timeframe demand lies.
Are you shorting this rejection, or waiting to accumulate in the green demand zone?
Drop your thoughts below! 👇
$BTC
#BTC
1
141
·
--
Рост
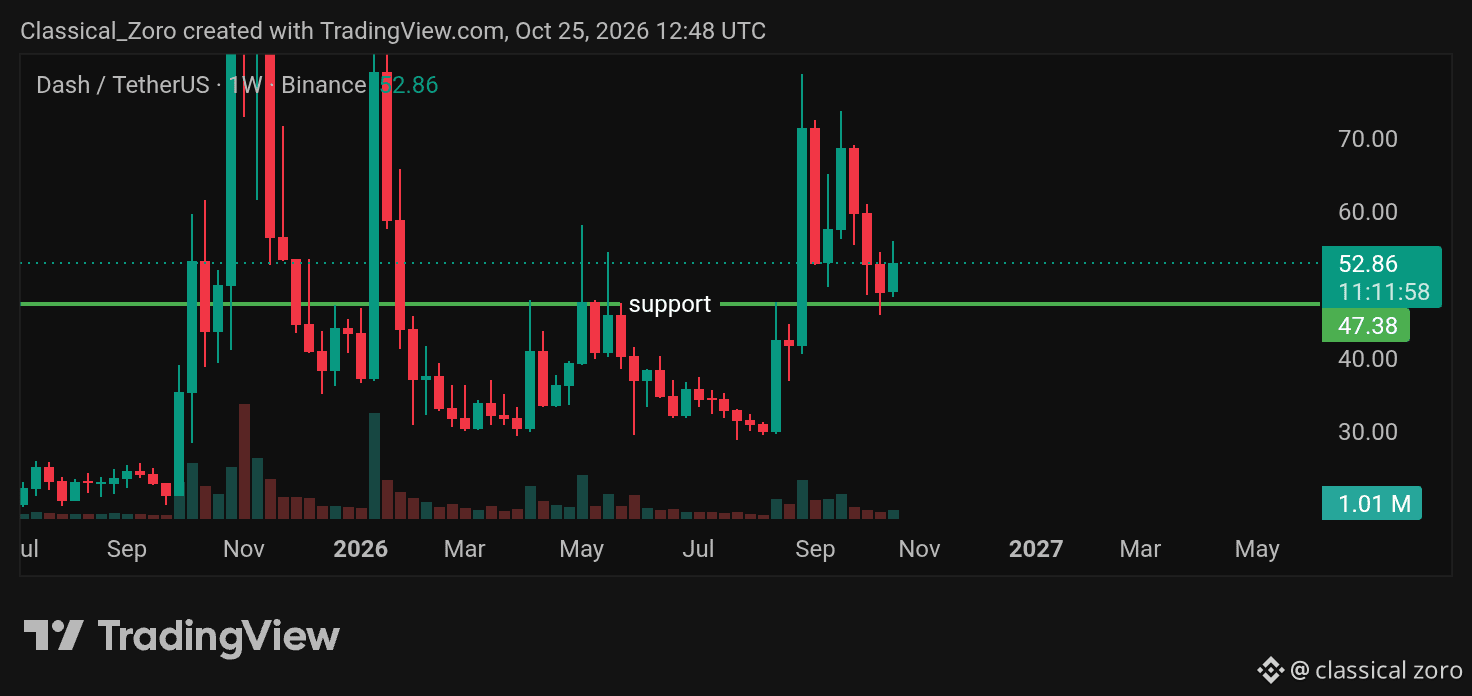
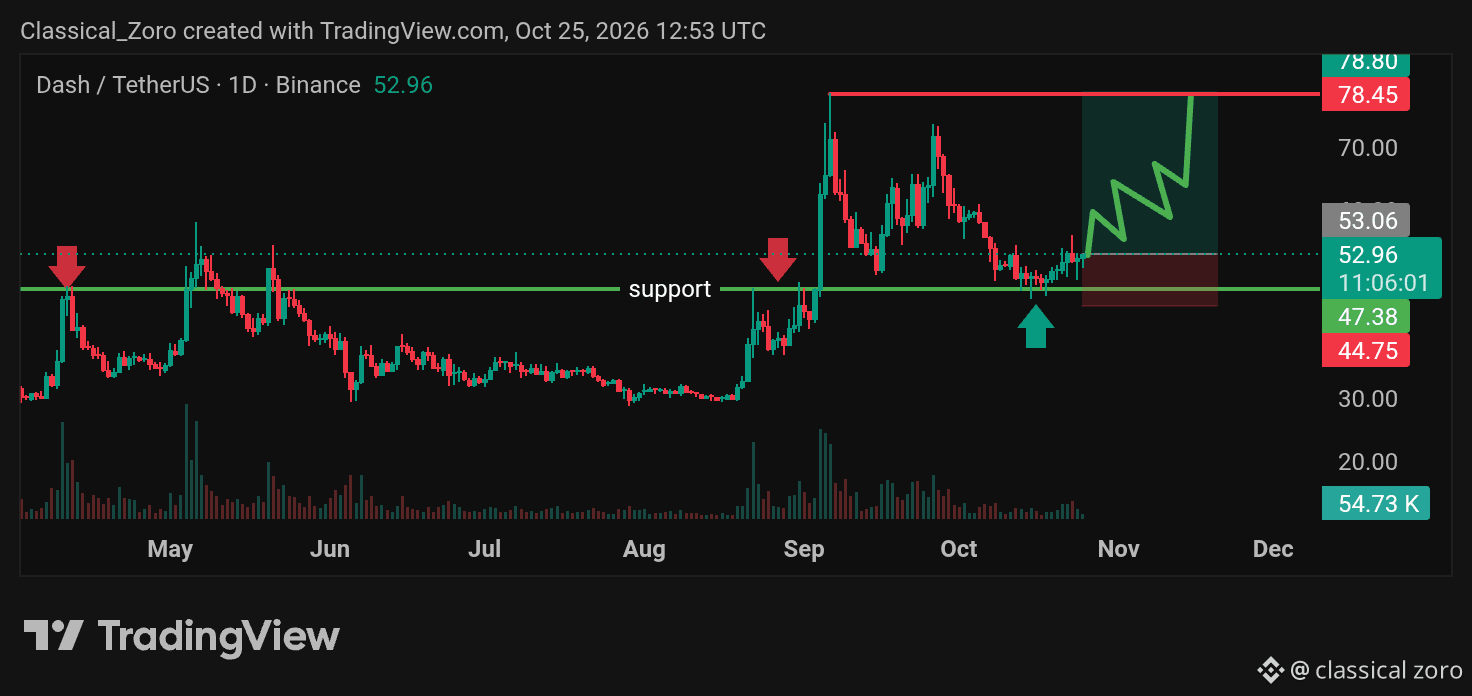
$DASH bulls are stepping up right at a massive historical floor.
Despite a deep retracement from the recent highs, the weekly chart shows price landing perfectly on its long-term support level around 47.38.
Zooming into the daily timeframe, this level has acted as a brick wall multiple times. It previously flipped from a heavy resistance zone into a strong support base, launching the last major rally.
The price is currently holding steady at 52.96, refusing to break lower.
If this support holds and buyers regain momentum, a bounce from here could easily push the price back up to test the previous resistance at 78.45.
Lose the 47.38 support level, though, and the bullish structure is completely invalidated, opening the door for a much deeper correction.
{spot}(DASHUSDT)
#DASH/USDT
$DASH bulls are stepping up right at a massive historical floor.
Despite a deep retracement from the recent highs, the weekly chart shows price landing perfectly on its long-term support level around 47.38.
Zooming into the daily timeframe, this level has acted as a brick wall multiple times. It previously flipped from a heavy resistance zone into a strong support base, launching the last major rally.
The price is currently holding steady at 52.96, refusing to break lower.
If this support holds and buyers regain momentum, a bounce from here could easily push the price back up to test the previous resistance at 78.45.
Lose the 47.38 support level, though, and the bullish structure is completely invalidated, opening the door for a much deeper correction.
#DASH/USDT
3
3
1.4k
·
--
Рост
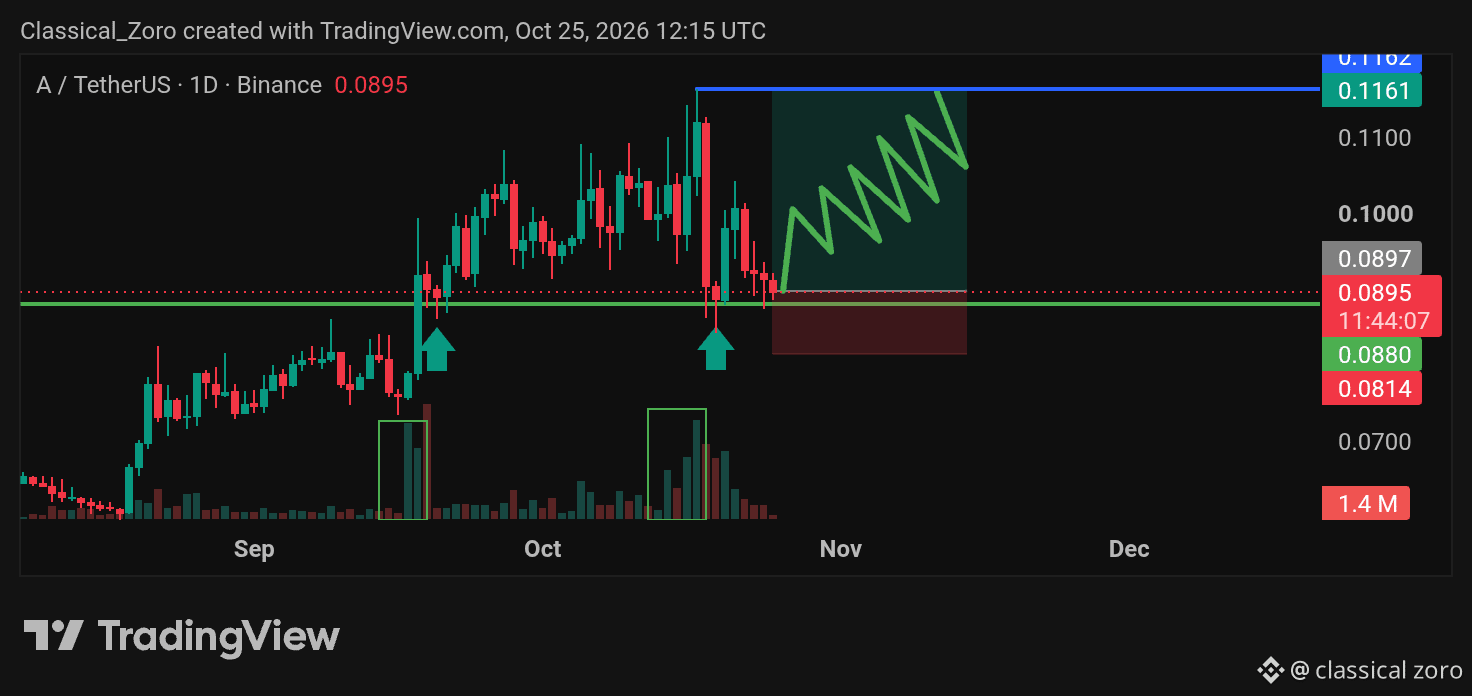
$A bulls are stepping in at the perfect time after a textbook breakout.
The daily chart shows a classic breakout and retest setup. The price initially blasted through the 0.088 level with massive volume, pushing to a new local high.
Now, the price has pulled back and is tapping that exact 0.088 level again. What makes this retest so strong is the reaction—we just saw big bullish candles close on high volume, proving buyers are aggressively defending this zone.
If this support holds and the bounce kicks in, the next major target sits right up at the 0.1161 resistance level.
Lose the 0.088 level, though, and the breakout is invalidated, opening the door for a deeper drop.
Bulls clearly have the edge right now, but a strong daily close here is needed to confirm the next leg up.
{spot}(AUSDT)
#aUSDT
$A bulls are stepping in at the perfect time after a textbook breakout.
The daily chart shows a classic breakout and retest setup. The price initially blasted through the 0.088 level with massive volume, pushing to a new local high.
Now, the price has pulled back and is tapping that exact 0.088 level again. What makes this retest so strong is the reaction—we just saw big bullish candles close on high volume, proving buyers are aggressively defending this zone.
If this support holds and the bounce kicks in, the next major target sits right up at the 0.1161 resistance level.
Lose the 0.088 level, though, and the breakout is invalidated, opening the door for a deeper drop.
Bulls clearly have the edge right now, but a strong daily close here is needed to confirm the next leg up.
#aUSDT
4
657
·
--
Рост
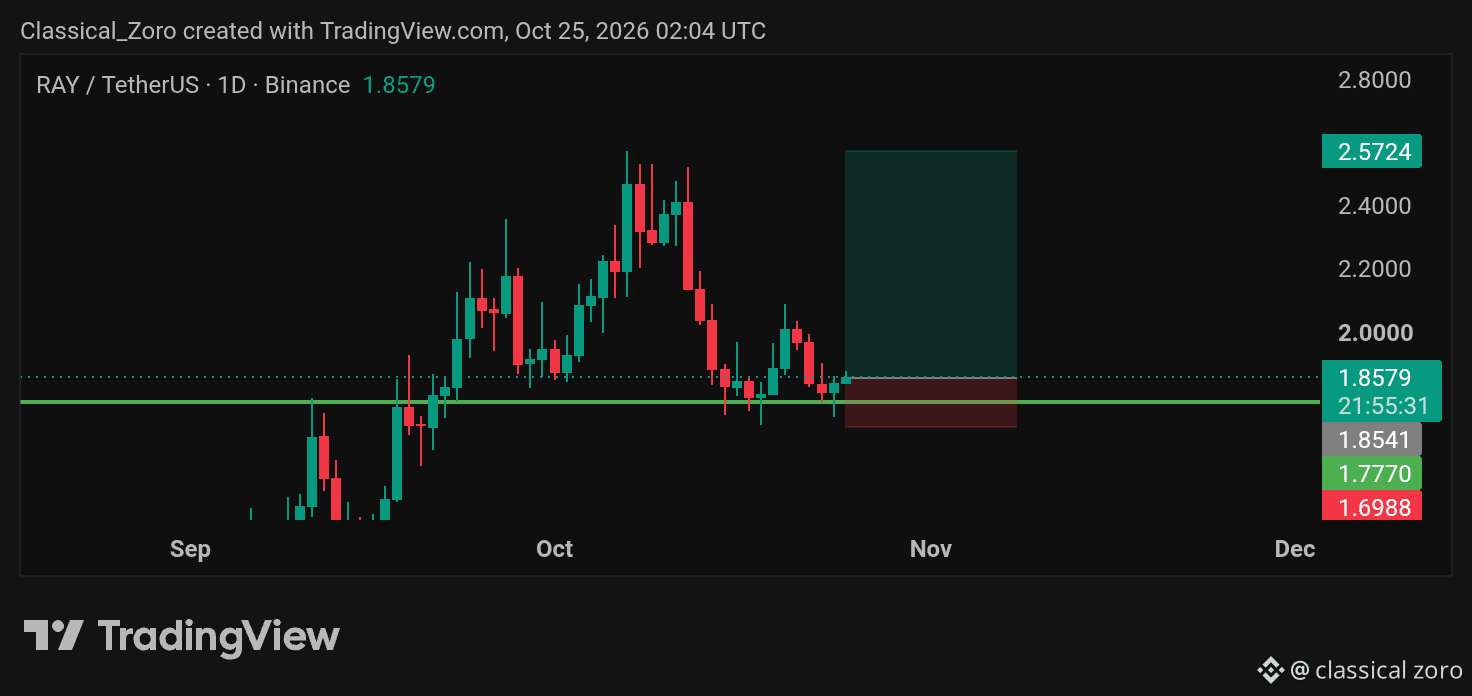
$RAY bulls are stepping up right where it matters most.
The daily chart is showing a textbook retracement. After a strong push to the upside, the price has pulled back and landed right back at the major support level of 1.777.
Buyers are clearly defending this floor. Instead of breaking down, the price is holding steady and showing early bullish signs, creating a strong foundation on this retest.
If the 1.777 support holds firm and the bounce gets confirmed, the next major move could easily push $RAY back up to test the 2.57 resistance zone.
Lose the 1.777 support, though, and this bullish setup is completely invalidated, opening the door for a much deeper slide.
Bulls are in a good position to reclaim momentum, but holding this line is non-negotiable.
{spot}(RAYUSDT)
#RAY/USDT
$RAY bulls are stepping up right where it matters most.
The daily chart is showing a textbook retracement. After a strong push to the upside, the price has pulled back and landed right back at the major support level of 1.777.
Buyers are clearly defending this floor. Instead of breaking down, the price is holding steady and showing early bullish signs, creating a strong foundation on this retest.
If the 1.777 support holds firm and the bounce gets confirmed, the next major move could easily push $RAY back up to test the 2.57 resistance zone.
Lose the 1.777 support, though, and this bullish setup is completely invalidated, opening the door for a much deeper slide.
Bulls are in a good position to reclaim momentum, but holding this line is non-negotiable.
#RAY/USDT
2
407
·
--
Рост
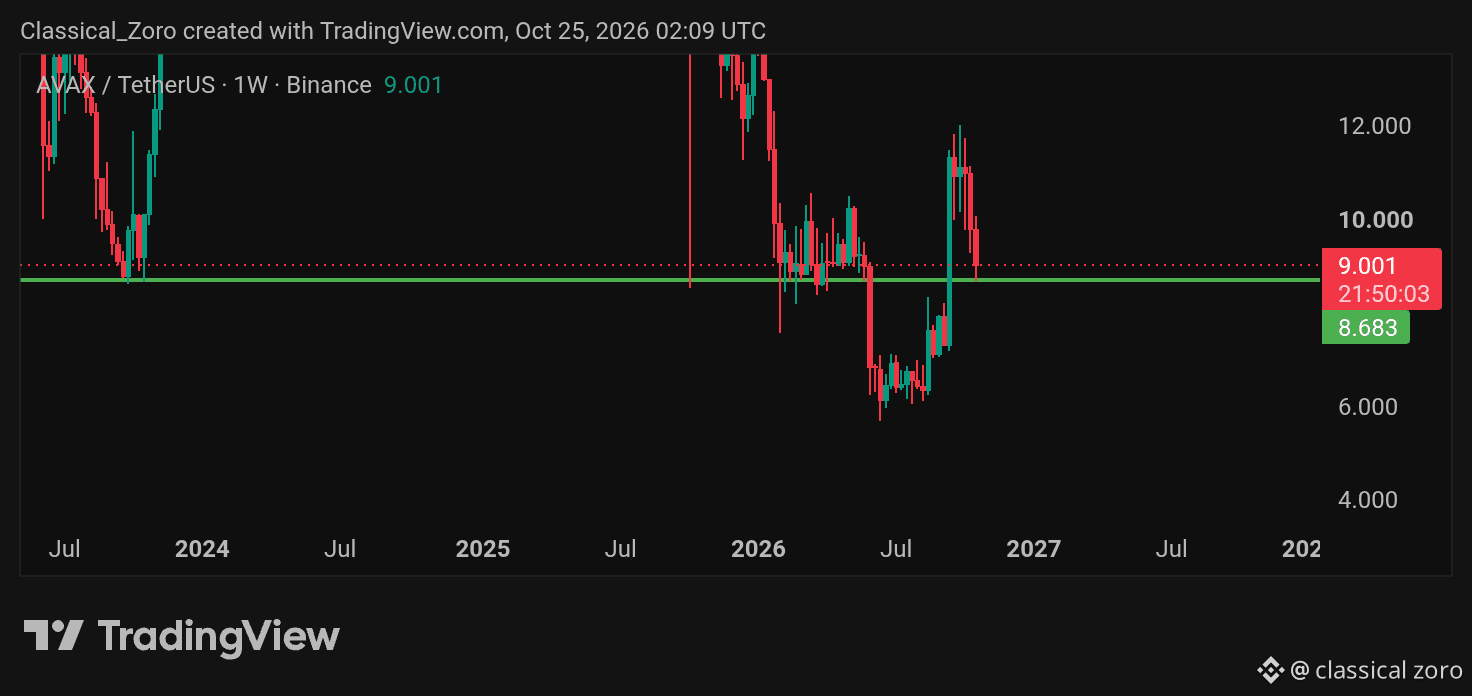
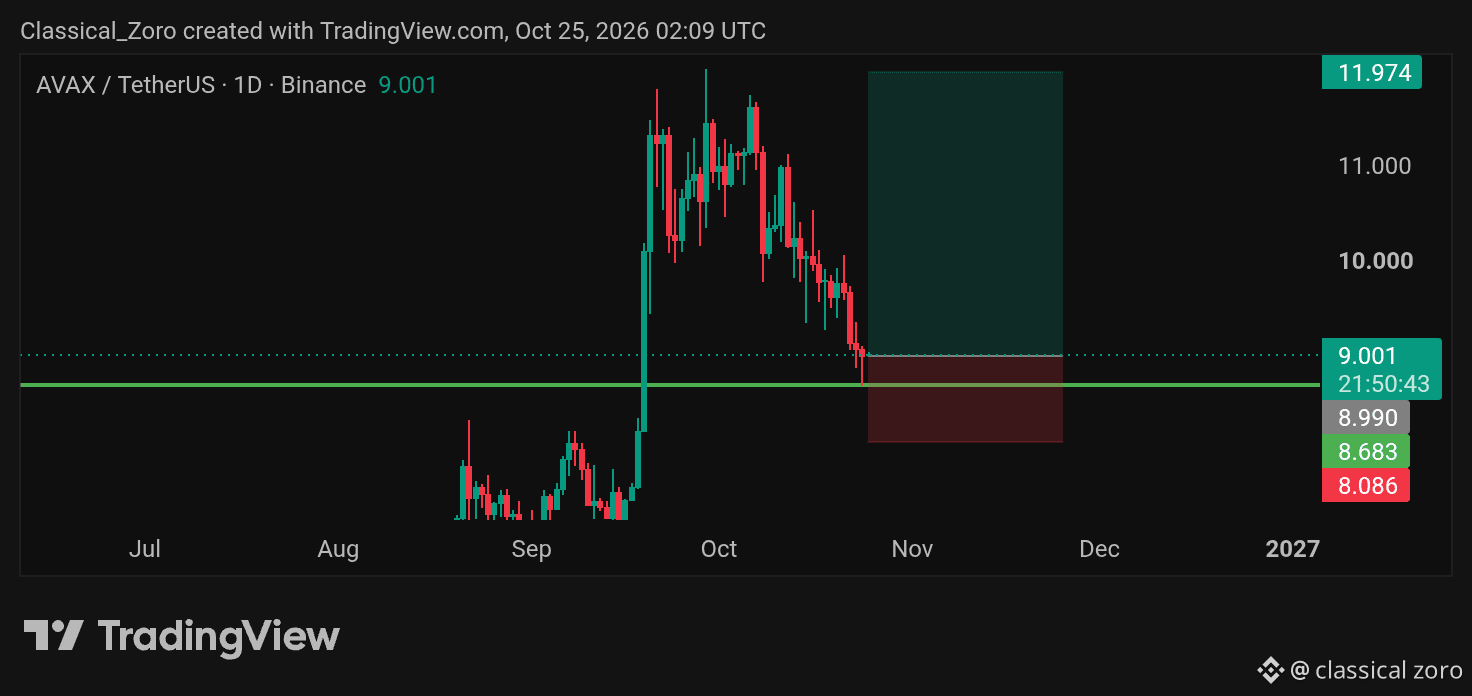
$AVAX bulls are making a stand right where it matters most.
The price has dropped directly into a major weekly support zone at 8.683, and buyers are finally showing signs of life.
Despite the heavy selling pressure, the daily chart just printed a clear bullish pin bar.
Yes, the candle closed red, but that long lower wick tells the real story: sellers pushed the price down, but buyers aggressively stepped in to reject the lows.
The price is currently hovering right at the 8.783 level, defending this weekly floor.
If this support holds and the pin bar confirms a reversal, we could see a strong bounce back toward the 10.00 and 11.00 resistance levels.
Lose the 8.683 weekly support, though, and the bullish thesis is invalidated, opening the door for a much deeper correction.
Bulls have the first signal, but a strong daily close here is needed to truly shift the momentum.
{spot}(AVAXUSDT)
#AVAX
$AVAX bulls are making a stand right where it matters most.
The price has dropped directly into a major weekly support zone at 8.683, and buyers are finally showing signs of life.
Despite the heavy selling pressure, the daily chart just printed a clear bullish pin bar.
Yes, the candle closed red, but that long lower wick tells the real story: sellers pushed the price down, but buyers aggressively stepped in to reject the lows.
The price is currently hovering right at the 8.783 level, defending this weekly floor.
If this support holds and the pin bar confirms a reversal, we could see a strong bounce back toward the 10.00 and 11.00 resistance levels.
Lose the 8.683 weekly support, though, and the bullish thesis is invalidated, opening the door for a much deeper correction.
Bulls have the first signal, but a strong daily close here is needed to truly shift the momentum.
#AVAX
4
1
821
Войдите, чтобы посмотреть больше материала
Присоединяйтесь к пользователям криптовалют по всему миру на Binance Square
⚡️ Получайте новейшую и полезную информацию о криптоактивах.
💬 Нам доверяет крупнейшая в мире криптобиржа.
👍 Получите достоверные аналитические данные от верифицированных создателей контента.
Эл. почта/номер телефона
В тренде
FedWatch
Просмотров: 16.3M
39,276 обсуждают
🚨 🇺🇸 PETER SCHIFF JUST THREW A BIG WARNING AT THE FED!
Peter Schiff is calling Kevin Warsh’s tough talk on inflation a “bluff,” and his prediction could have major implications for the markets.
Schiff believes the Fed could eventually return to money printing through quantitative easing (QE) and even cut interest rates next year, despite inflation continuing to rise.
Think about that for a moment.
🔥 Inflation could remain a problem. 🔥 The Fed could still move toward easier monetary policy. 🔥 More liquidity could flow into financial markets.
If this scenario plays out, it could create a very different market environment for stocks, gold, Bitcoin, and the wider crypto market.
But there’s a catch: if inflation stays high, the Fed could face a difficult choice between fighting rising prices and supporting the economy.
Will Warsh stick to a tough inflation policy, or will the Fed eventually change direction?
The next move could matter a lot for investors.
#FedWatch #EarningsSeason #USMidtermElections #BrazilCryptoExchangesMustApplyForLicensesByFriday #StanDruckenmillerBecomesInvestorInTradeXYZ
Jackson Liam
·Лайков: 3
·Просмотров: 7.7k
EarningsSeason
Просмотров: 6.4M
31,983 обсуждают
USMidtermElections
Просмотров: 32,308
559 обсуждают