

612 Ceros
29.8k Публикации
 LIVE
612 Ceros
 Square Verified+
Отправить жалобу
Заблокировать пользователя
📊 Crypto strategist | Market signals daily | Trade smart, not emotional. Find me on X: @612Ceros
Открытая сделка

Владелец BNB
Трейдер с частыми сделками
5.1 г
57 подписок(и/а)
180.2K+ подписчиков(а)
229.5K+ понравилось
Посты
Портфель
Все
Цитирования
Активно
·
--
Падение
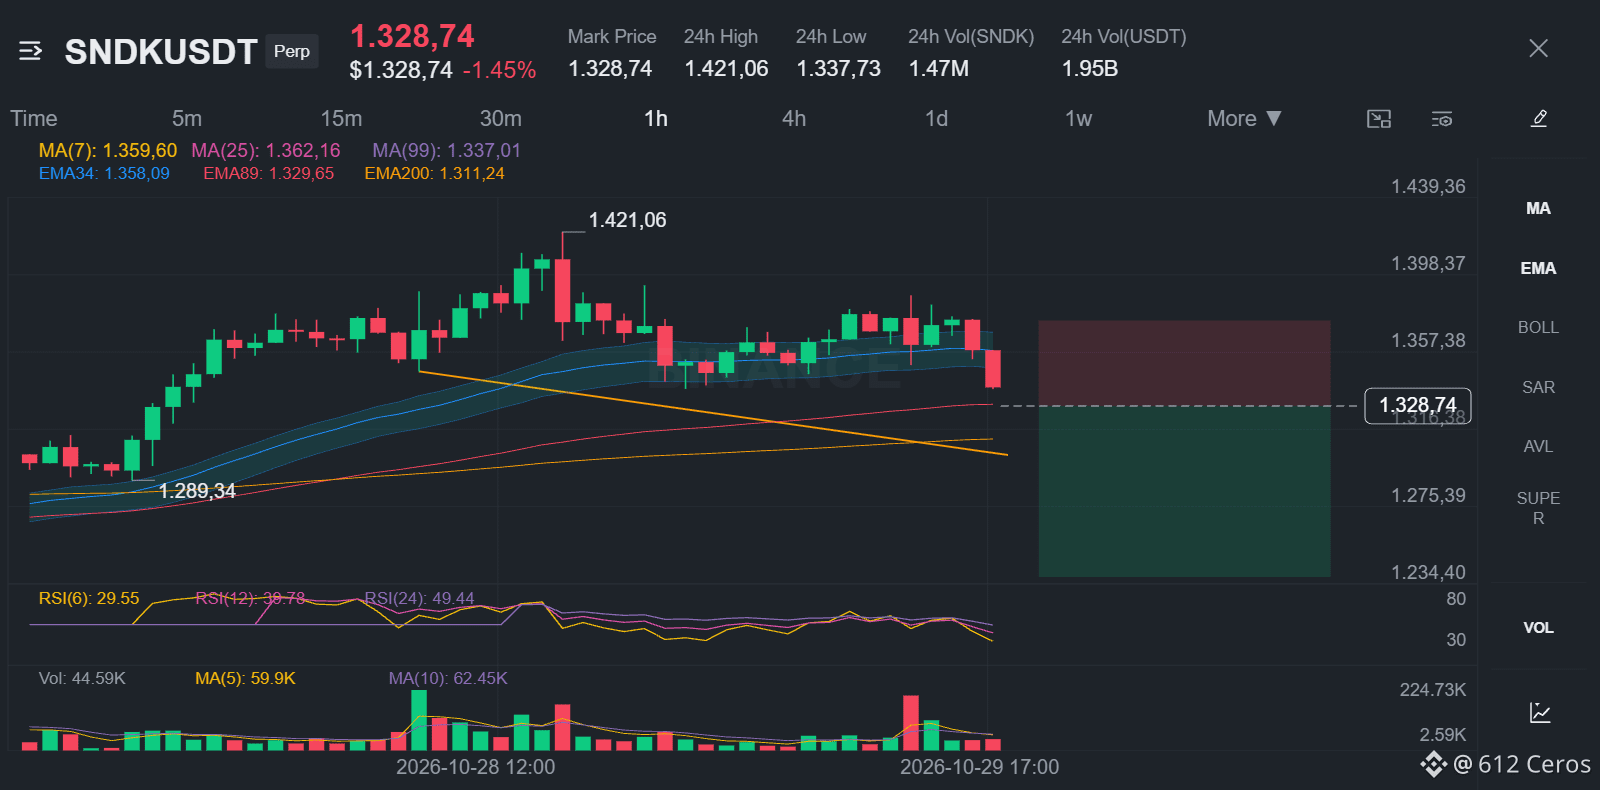
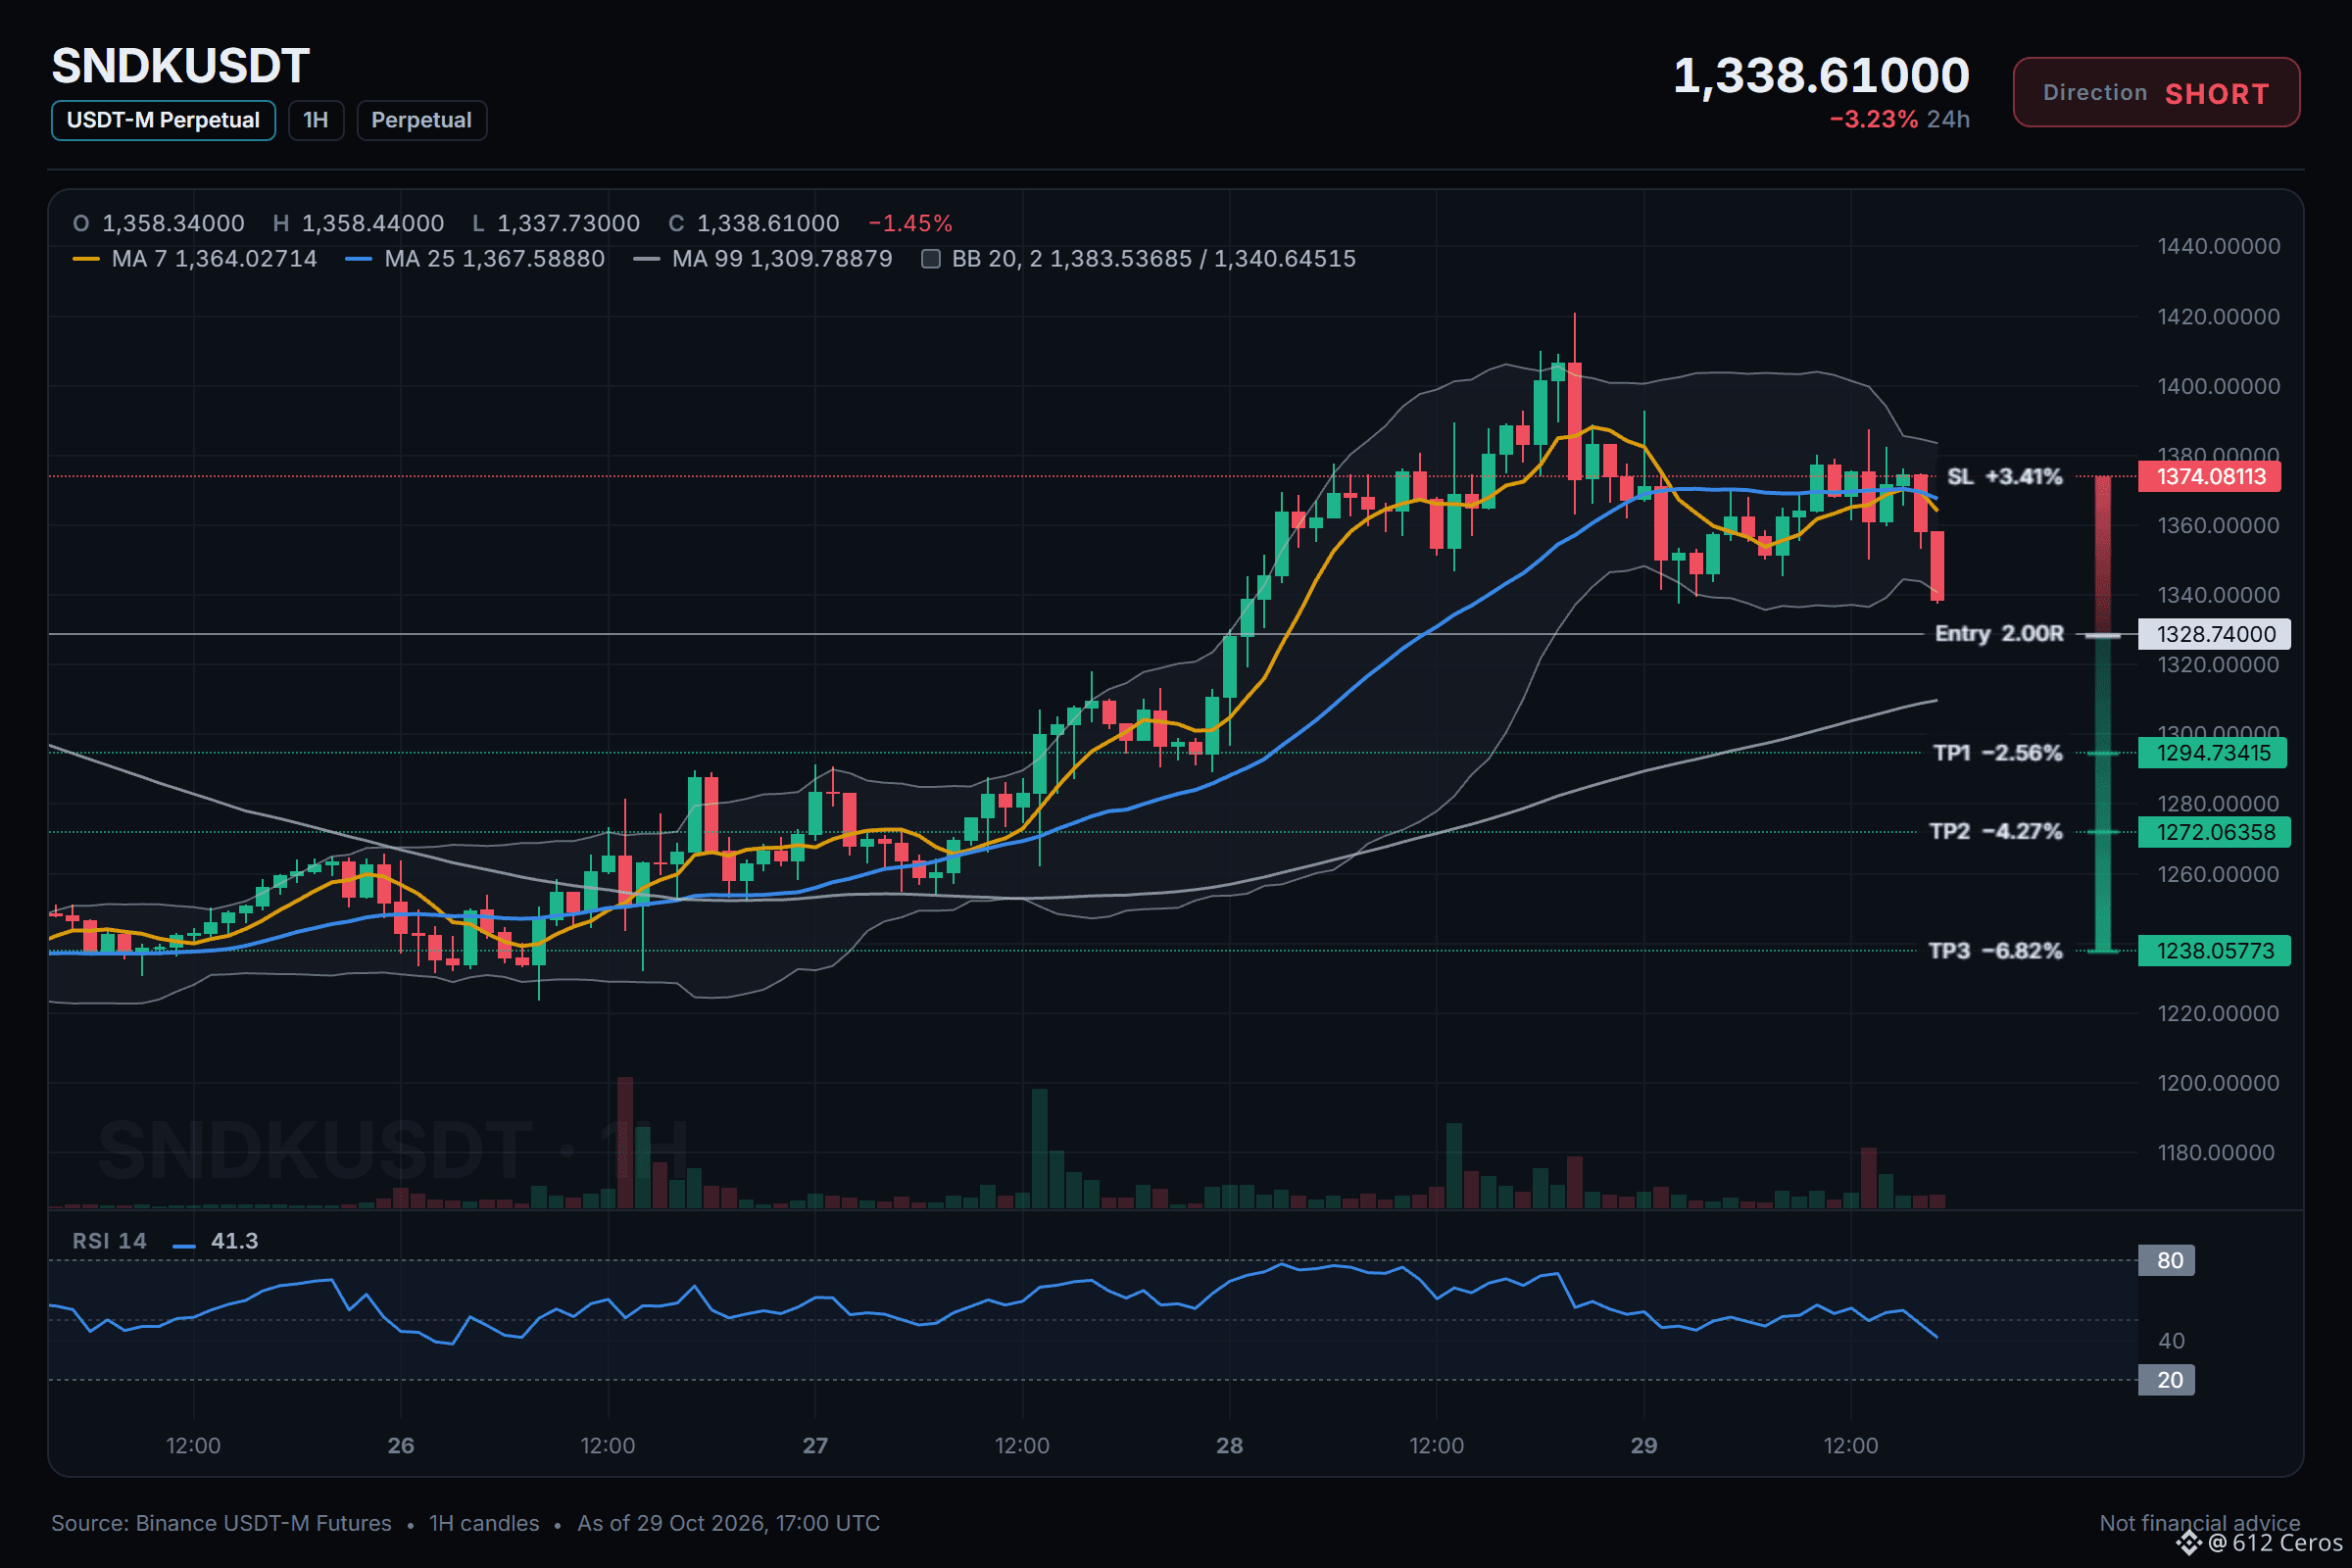
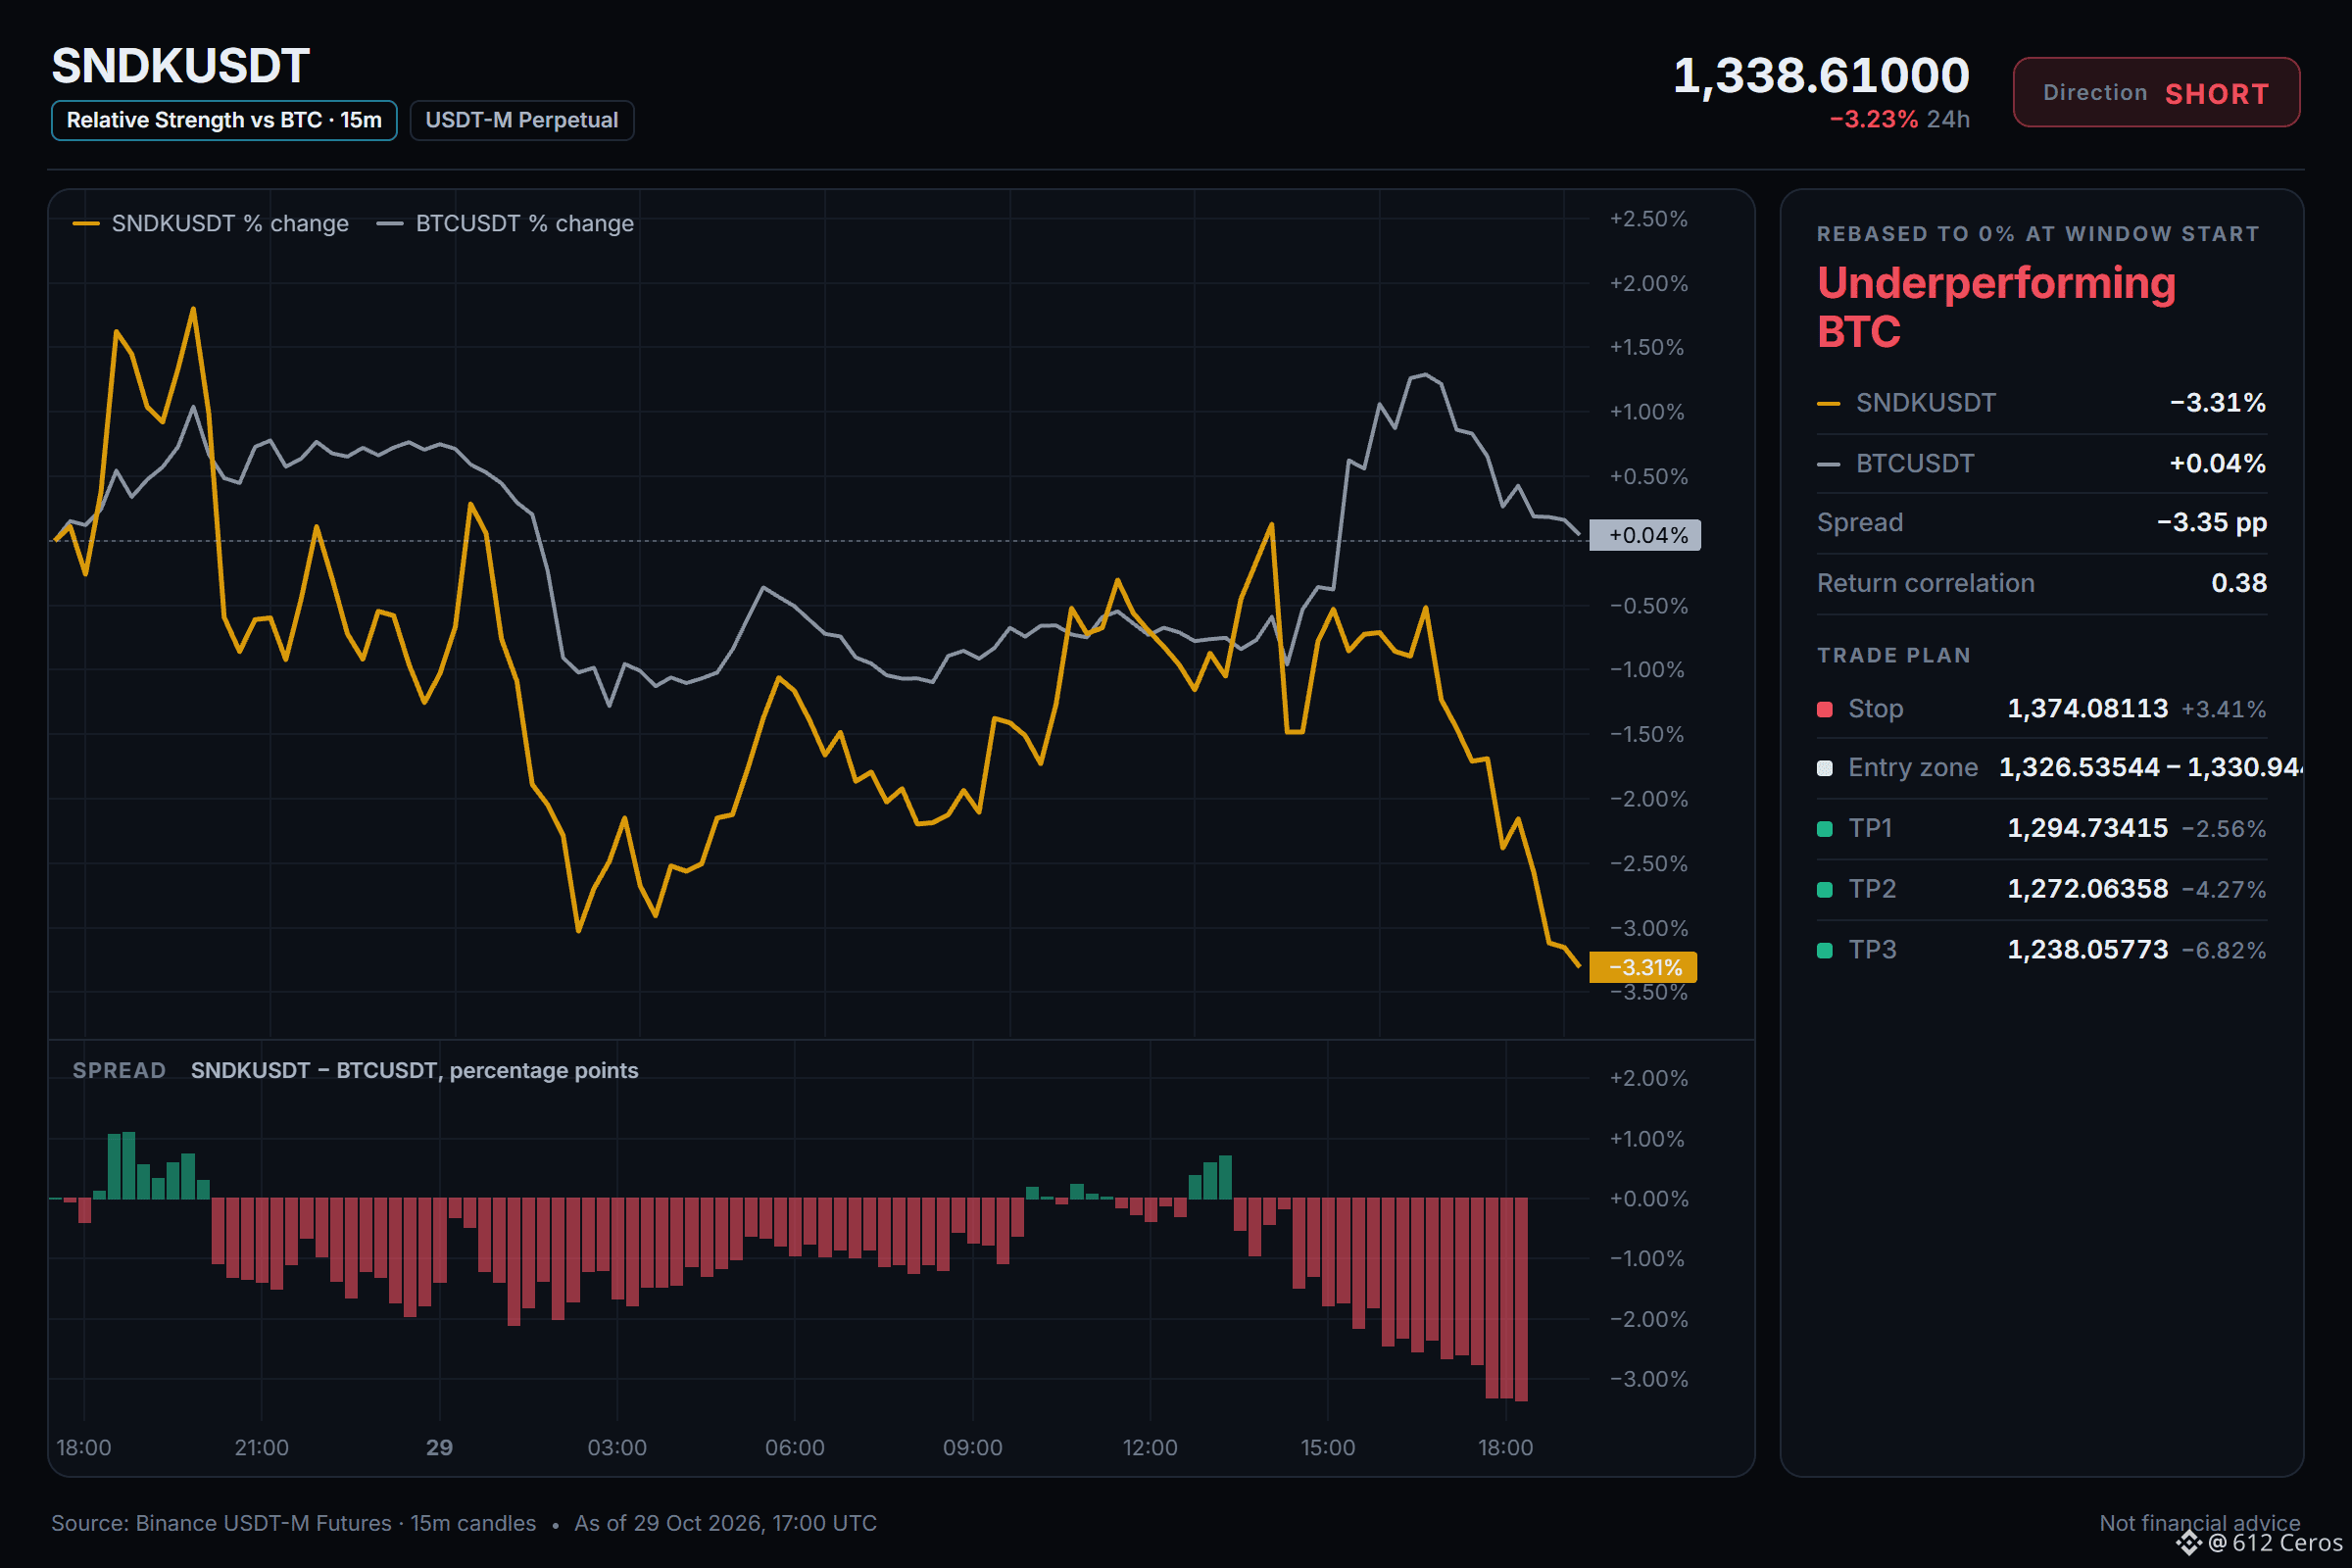
SNDK short setup: the levels I'm watching
🔴 SHORT $SNDK /USDT: expecting price to go DOWN
Bias: SHORT · Leaning
Entry: 1326.53544 – 1330.94456
TP1: 1294.73415 (-2.6%)
TP2: 1272.06358 (-4.3%)
TP3: 1238.05773 (-6.8%)
SL: 1374.08113 (+3.4%)
Plan: enter only inside the zone, close 50% at TP1, 25% at TP2, 25% at TP3, and move the stop to entry after TP1.
Note: moderate conviction only, keep size light.
Why SHORT? 5/12 signals agree, 2 against.
• Daily trend down (below EMA50 & EMA200)
• Sellers are driving the move (15m ADX 22.0)
• Sellers have the momentum (1h RSI 41.3)
Risk: Buyers have the momentum (4h RSI 63.3)
In plain words:
The daily trend reads bearish, and 5/12 signals aligned favour the short side. The plan is to work the 1326.53544 – 1330.94456 zone, scale out at 1294.73415 and 1272.06358, and stay patient for 1238.05773. A move through 1374.08113 means the idea is wrong and the stop does its job.
Does SNDK tag 1294.73415 first, or the stop?
Levels mapped on the chart below.
{future}(SNDKUSDT)
📲 Want more of my latest signals? Join me here:
[https://app.binance.com/uni-qr/D26WbL9t](https://app.binance.com/uni-qr/D26WbL9t)
⚠️ Personal market analysis only. NFA — manage risk and DYOR.
Educational content, not investment advice or a recommendation to buy, sell, deposit, or withdraw any asset. No paid promotion or referral/affiliate links.
SNDK short setup: the levels I'm watching
🔴 SHORT $SNDK /USDT: expecting price to go DOWN
Bias: SHORT · Leaning
Entry: 1326.53544 – 1330.94456
TP1: 1294.73415 (-2.6%)
TP2: 1272.06358 (-4.3%)
TP3: 1238.05773 (-6.8%)
SL: 1374.08113 (+3.4%)
Plan: enter only inside the zone, close 50% at TP1, 25% at TP2, 25% at TP3, and move the stop to entry after TP1.
Note: moderate conviction only, keep size light.
Why SHORT? 5/12 signals agree, 2 against.
• Daily trend down (below EMA50 & EMA200)
• Sellers are driving the move (15m ADX 22.0)
• Sellers have the momentum (1h RSI 41.3)
Risk: Buyers have the momentum (4h RSI 63.3)
In plain words:
The daily trend reads bearish, and 5/12 signals aligned favour the short side. The plan is to work the 1326.53544 – 1330.94456 zone, scale out at 1294.73415 and 1272.06358, and stay patient for 1238.05773. A move through 1374.08113 means the idea is wrong and the stop does its job.
Does SNDK tag 1294.73415 first, or the stop?
Levels mapped on the chart below.
📲 Want more of my latest signals? Join me here:
https://app.binance.com/uni-qr/D26WbL9t
⚠️ Personal market analysis only. NFA — manage risk and DYOR.
Educational content, not investment advice or a recommendation to buy, sell, deposit, or withdraw any asset. No paid promotion or referral/affiliate links.
779
·
--
Падение
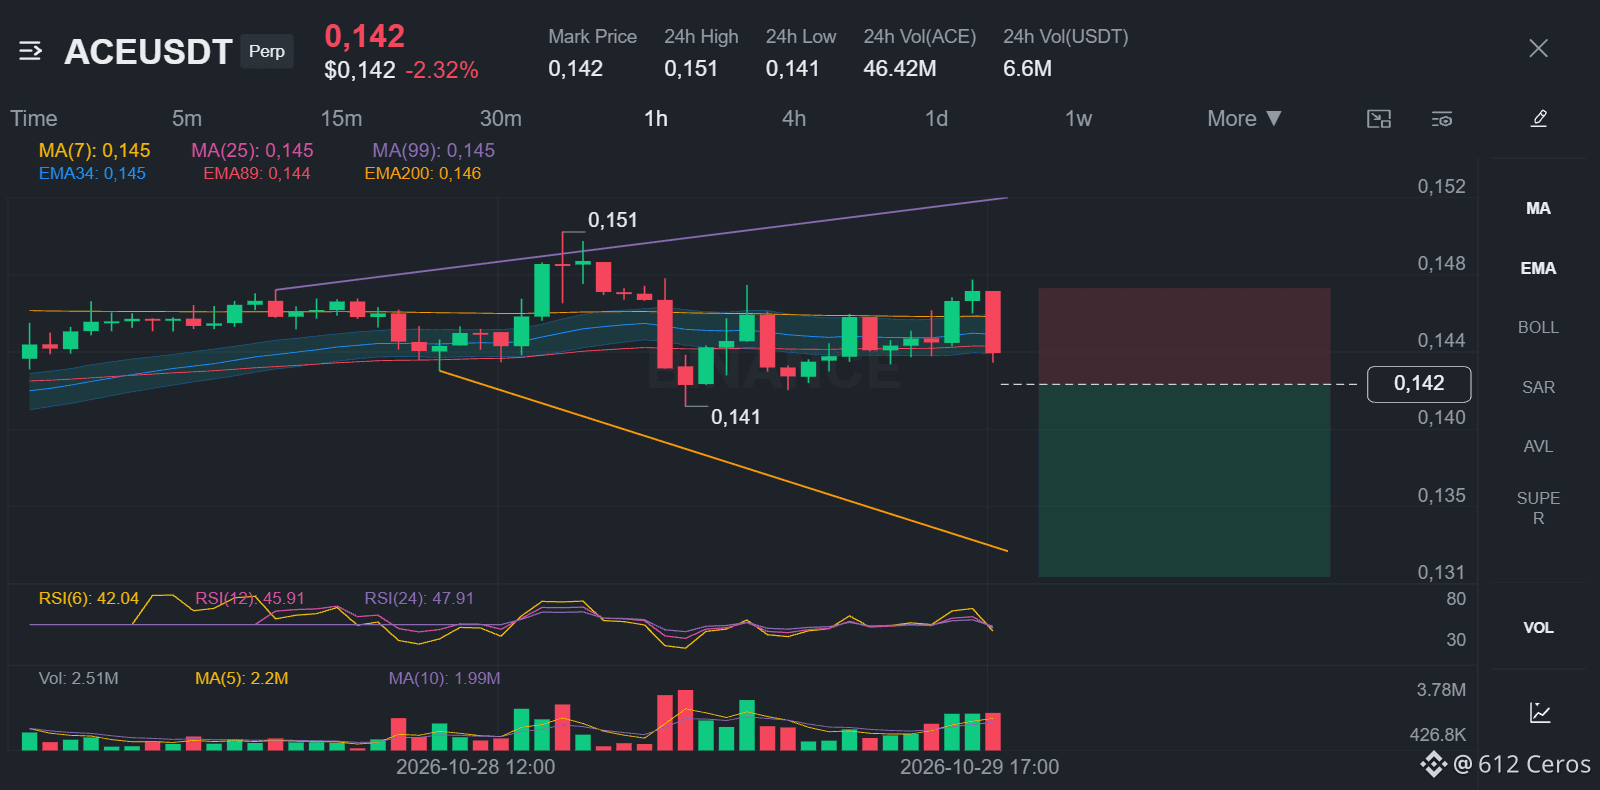
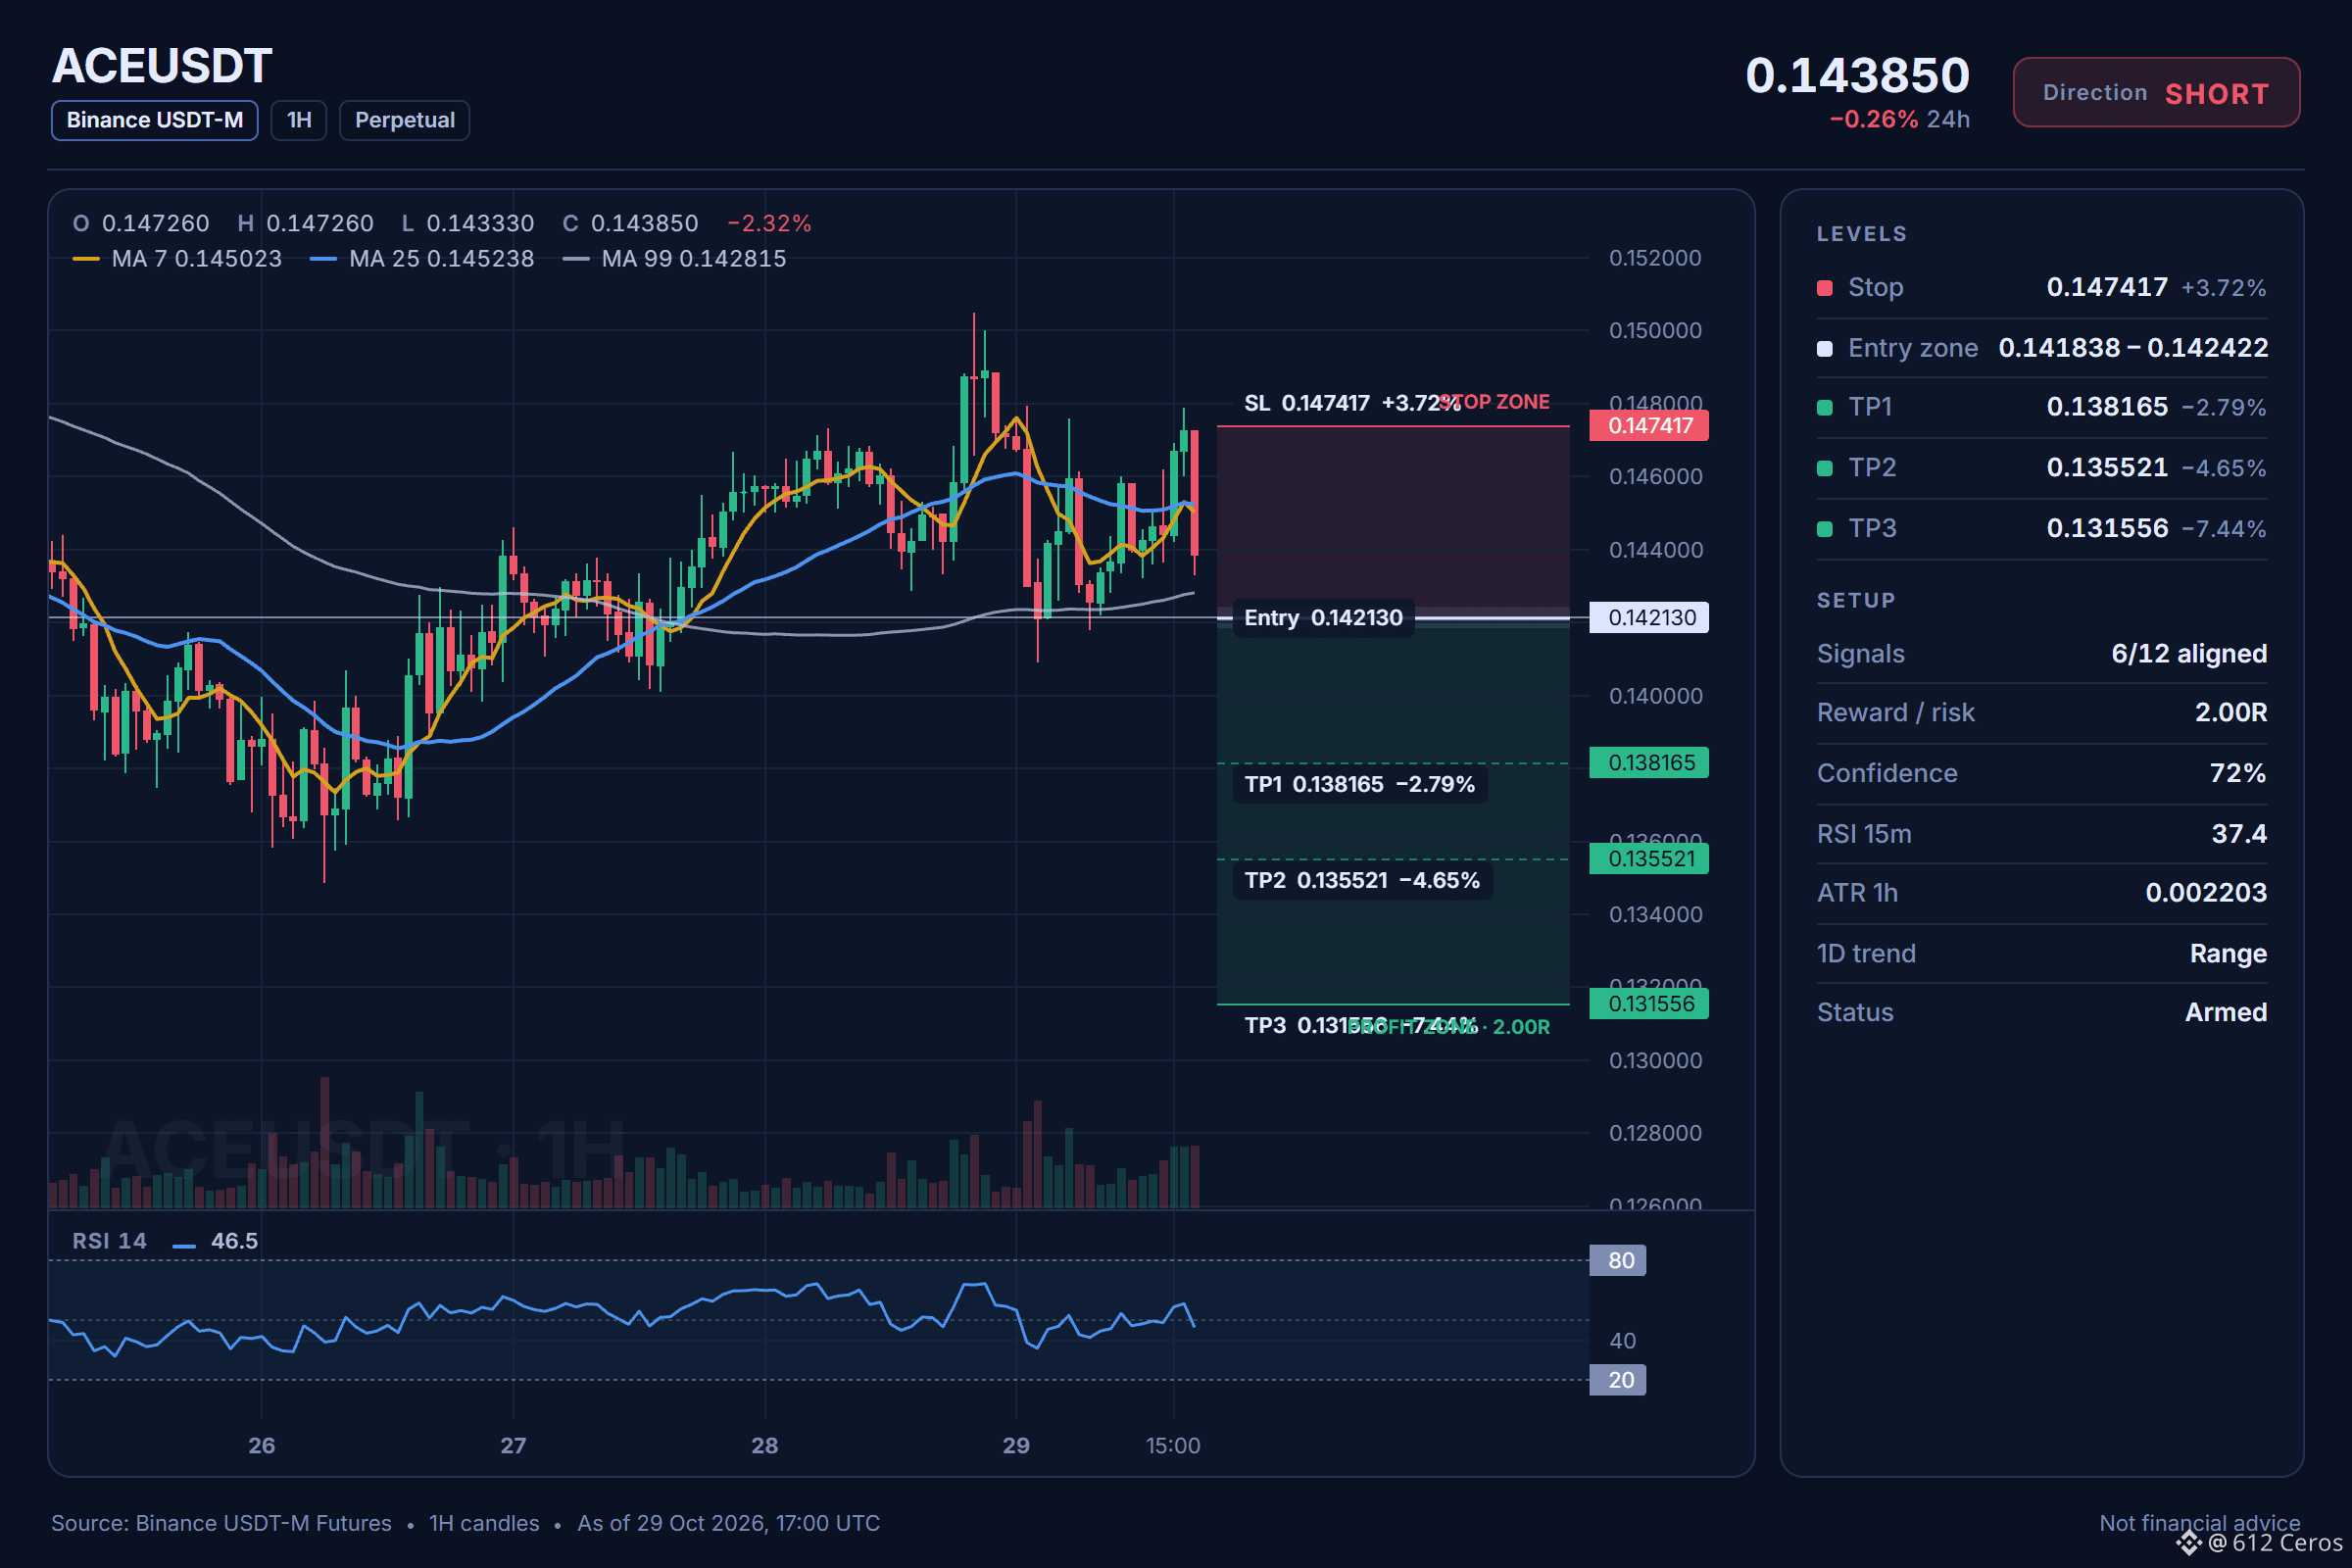
ACE keeps sliding below its moving averages
🔴 SHORT $ACE /USDT: expecting price to go DOWN
Bias: SHORT · Strong
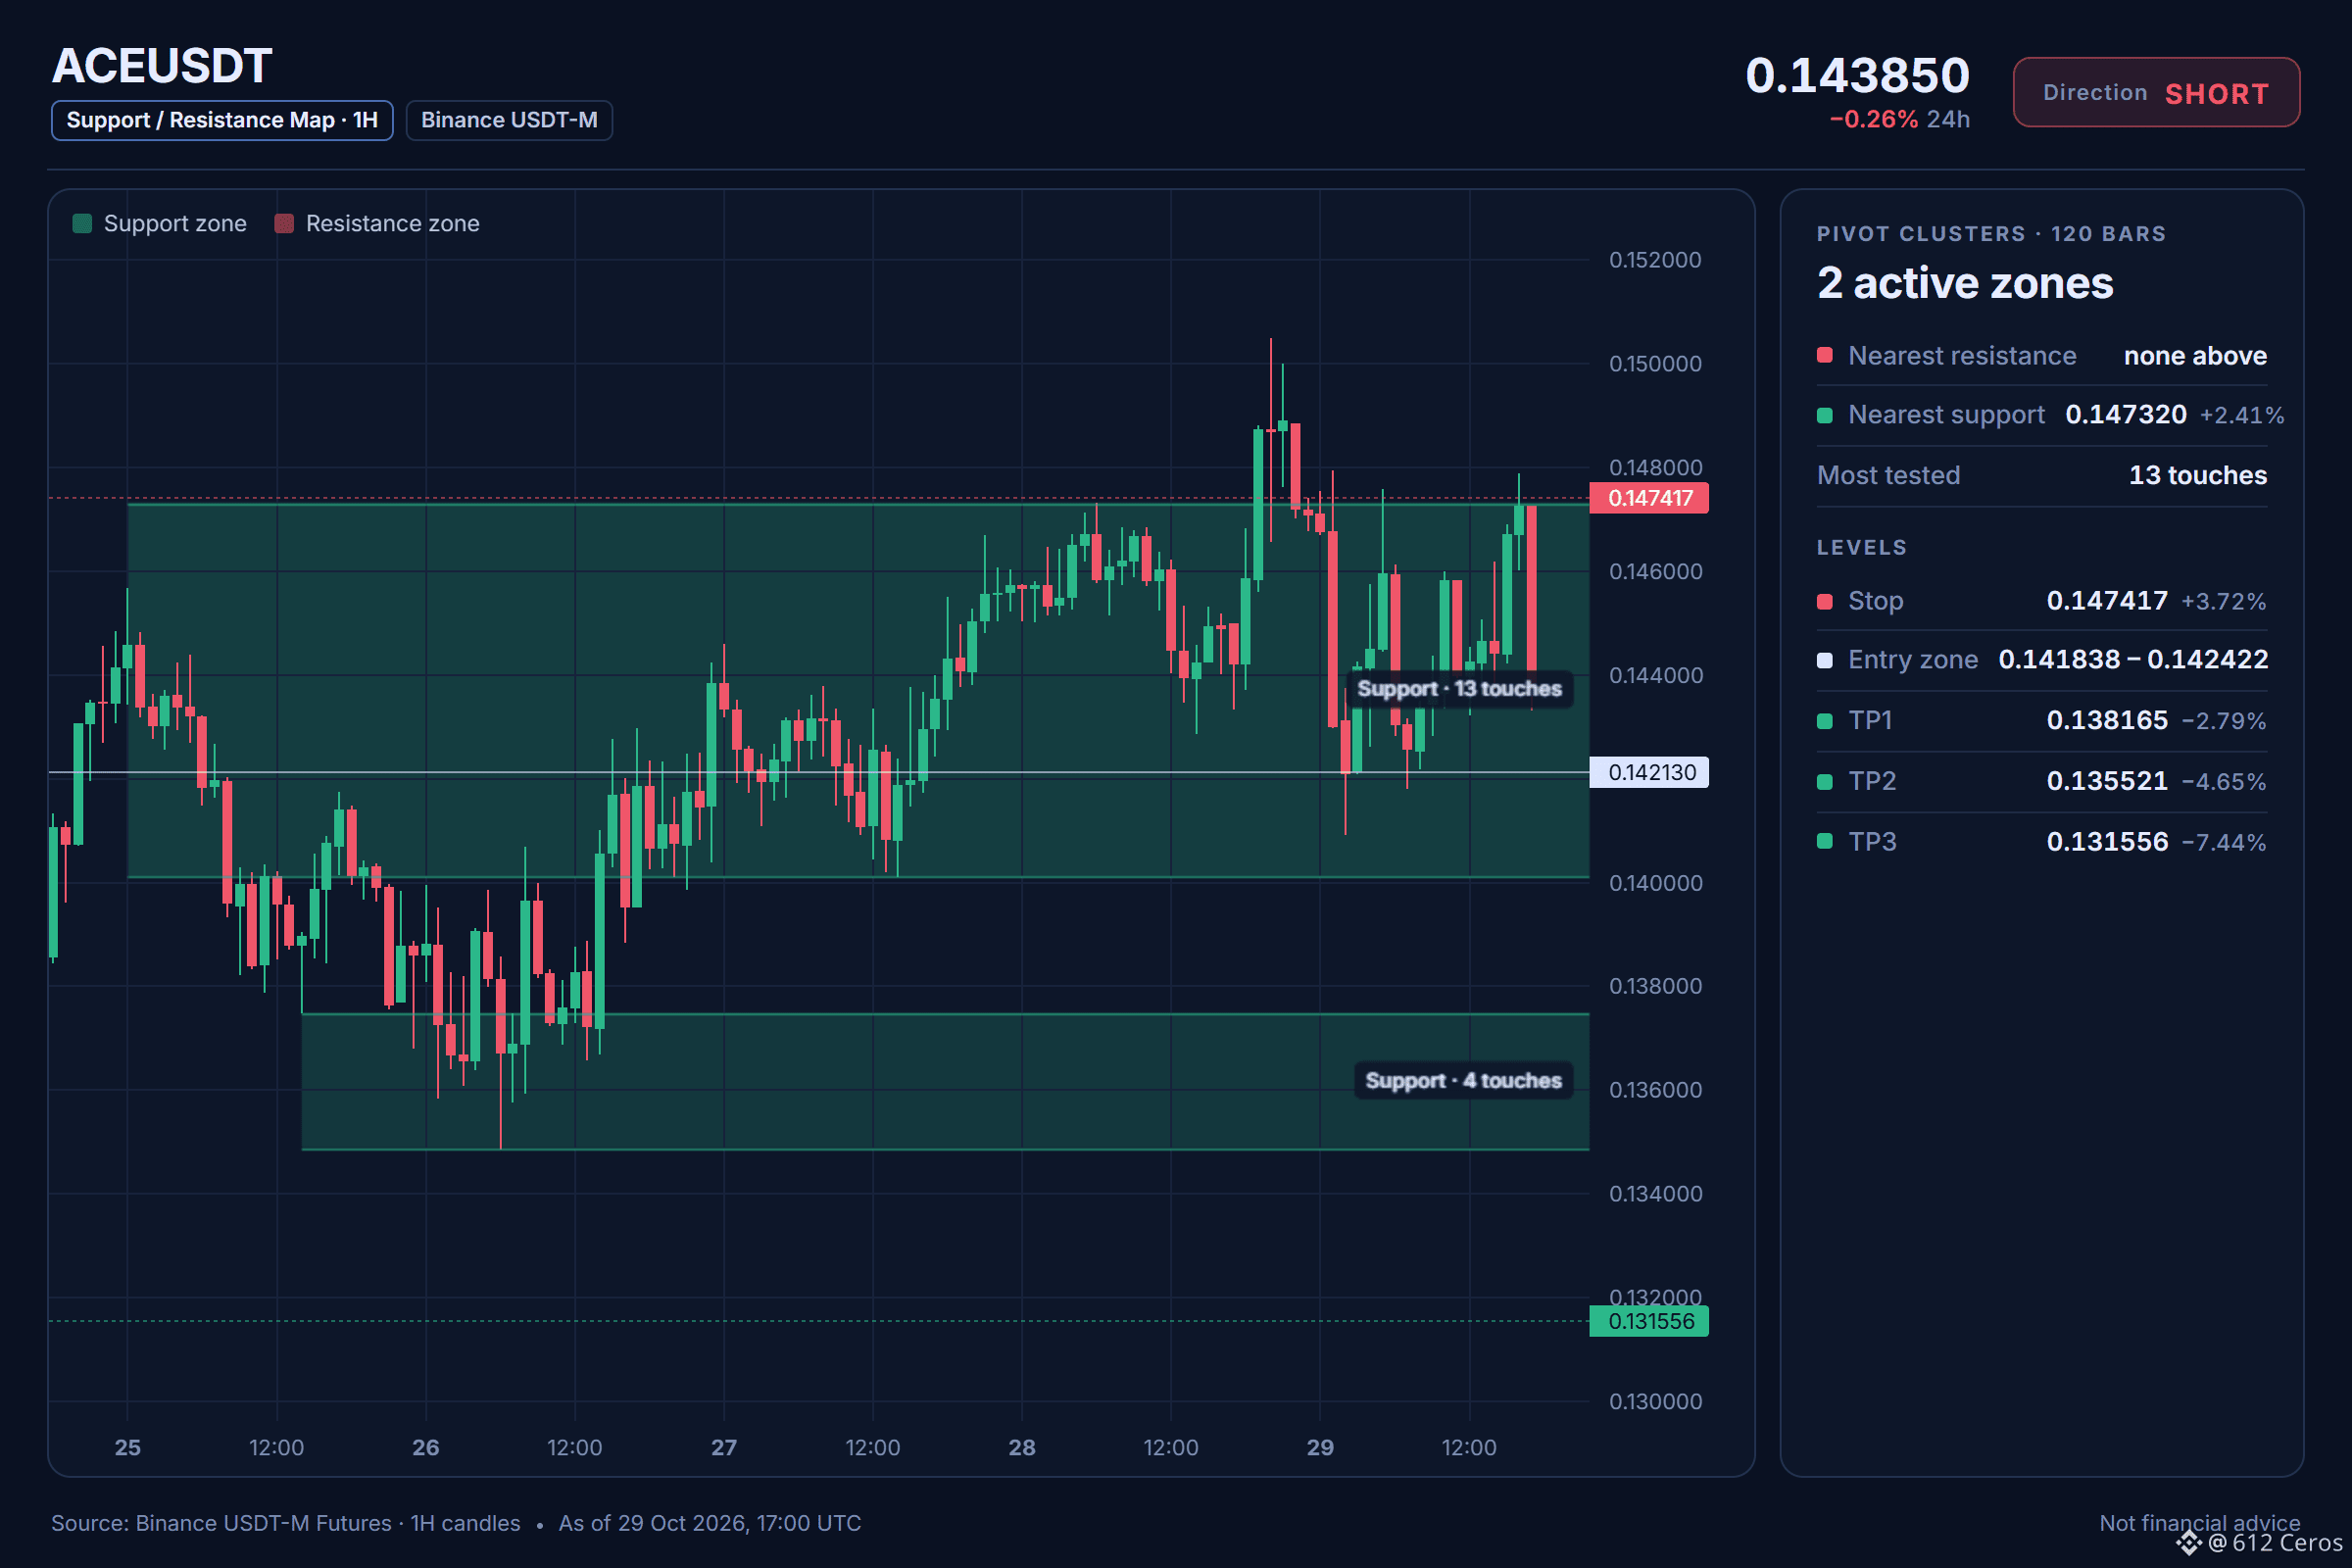
Entry: 0.141838 – 0.142422
TP1: 0.138165 (-2.8%)
TP2: 0.135521 (-4.6%)
TP3: 0.131556 (-7.4%)
SL: 0.147417 (+3.7%)
Plan: enter only inside the zone, close 50% at TP1, 25% at TP2, 25% at TP3, and move the stop to entry after TP1.
Why SHORT? 6/12 signals agree, 0 against.
• 4h trend down (below EMA50 & EMA200)
• 1h trend down (below EMA50 & EMA200)
• Sellers are driving the move (15m ADX 23.3)
Q: Why short ACE here?
A: The 4h trend shows price below EMA50 below EMA200, a bearish stack.
Q: When is this trade wrong?
A: If price reaches the stop at 0.147417, the setup is invalidated.
Where is your invalidation level for this short?
Chart with every level below.
{future}(ACEUSDT)
📲 Want more of my latest signals? Join me here:
[https://app.binance.com/uni-qr/D26WbL9t](https://app.binance.com/uni-qr/D26WbL9t)
⚠️ Personal market analysis only. NFA — manage risk and DYOR.
Educational content, not investment advice or a recommendation to buy, sell, deposit, or withdraw any asset. No paid promotion or referral/affiliate links.
ACE keeps sliding below its moving averages
🔴 SHORT $ACE /USDT: expecting price to go DOWN
Bias: SHORT · Strong
Entry: 0.141838 – 0.142422
TP1: 0.138165 (-2.8%)
TP2: 0.135521 (-4.6%)
TP3: 0.131556 (-7.4%)
SL: 0.147417 (+3.7%)
Plan: enter only inside the zone, close 50% at TP1, 25% at TP2, 25% at TP3, and move the stop to entry after TP1.
Why SHORT? 6/12 signals agree, 0 against.
• 4h trend down (below EMA50 & EMA200)
• 1h trend down (below EMA50 & EMA200)
• Sellers are driving the move (15m ADX 23.3)
Q: Why short ACE here?
A: The 4h trend shows price below EMA50 below EMA200, a bearish stack.
Q: When is this trade wrong?
A: If price reaches the stop at 0.147417, the setup is invalidated.
Where is your invalidation level for this short?
Chart with every level below.
📲 Want more of my latest signals? Join me here:
https://app.binance.com/uni-qr/D26WbL9t
⚠️ Personal market analysis only. NFA — manage risk and DYOR.
Educational content, not investment advice or a recommendation to buy, sell, deposit, or withdraw any asset. No paid promotion or referral/affiliate links.
1
763
·
--
Рост
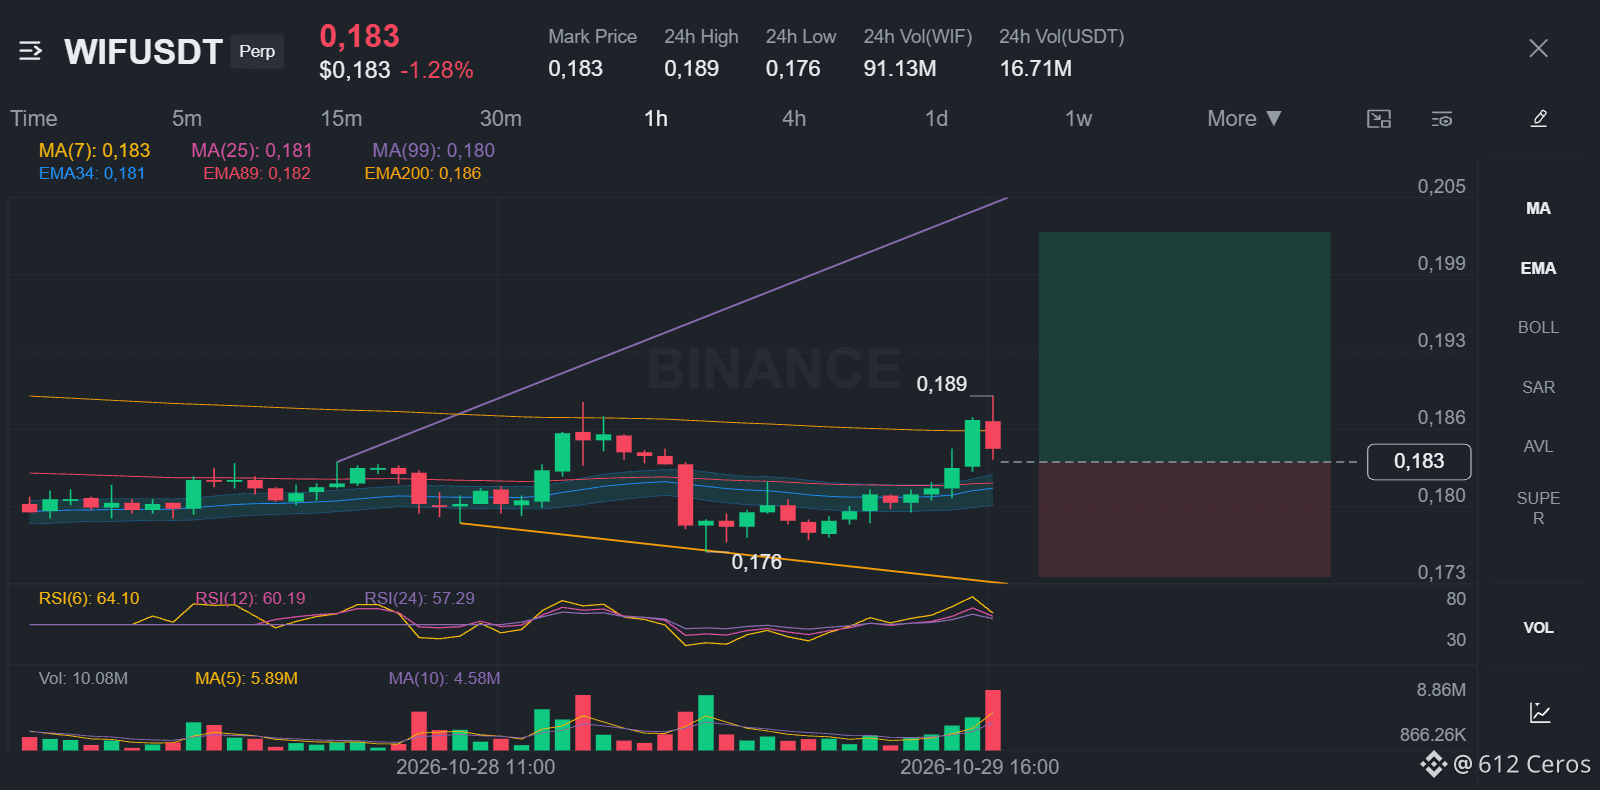
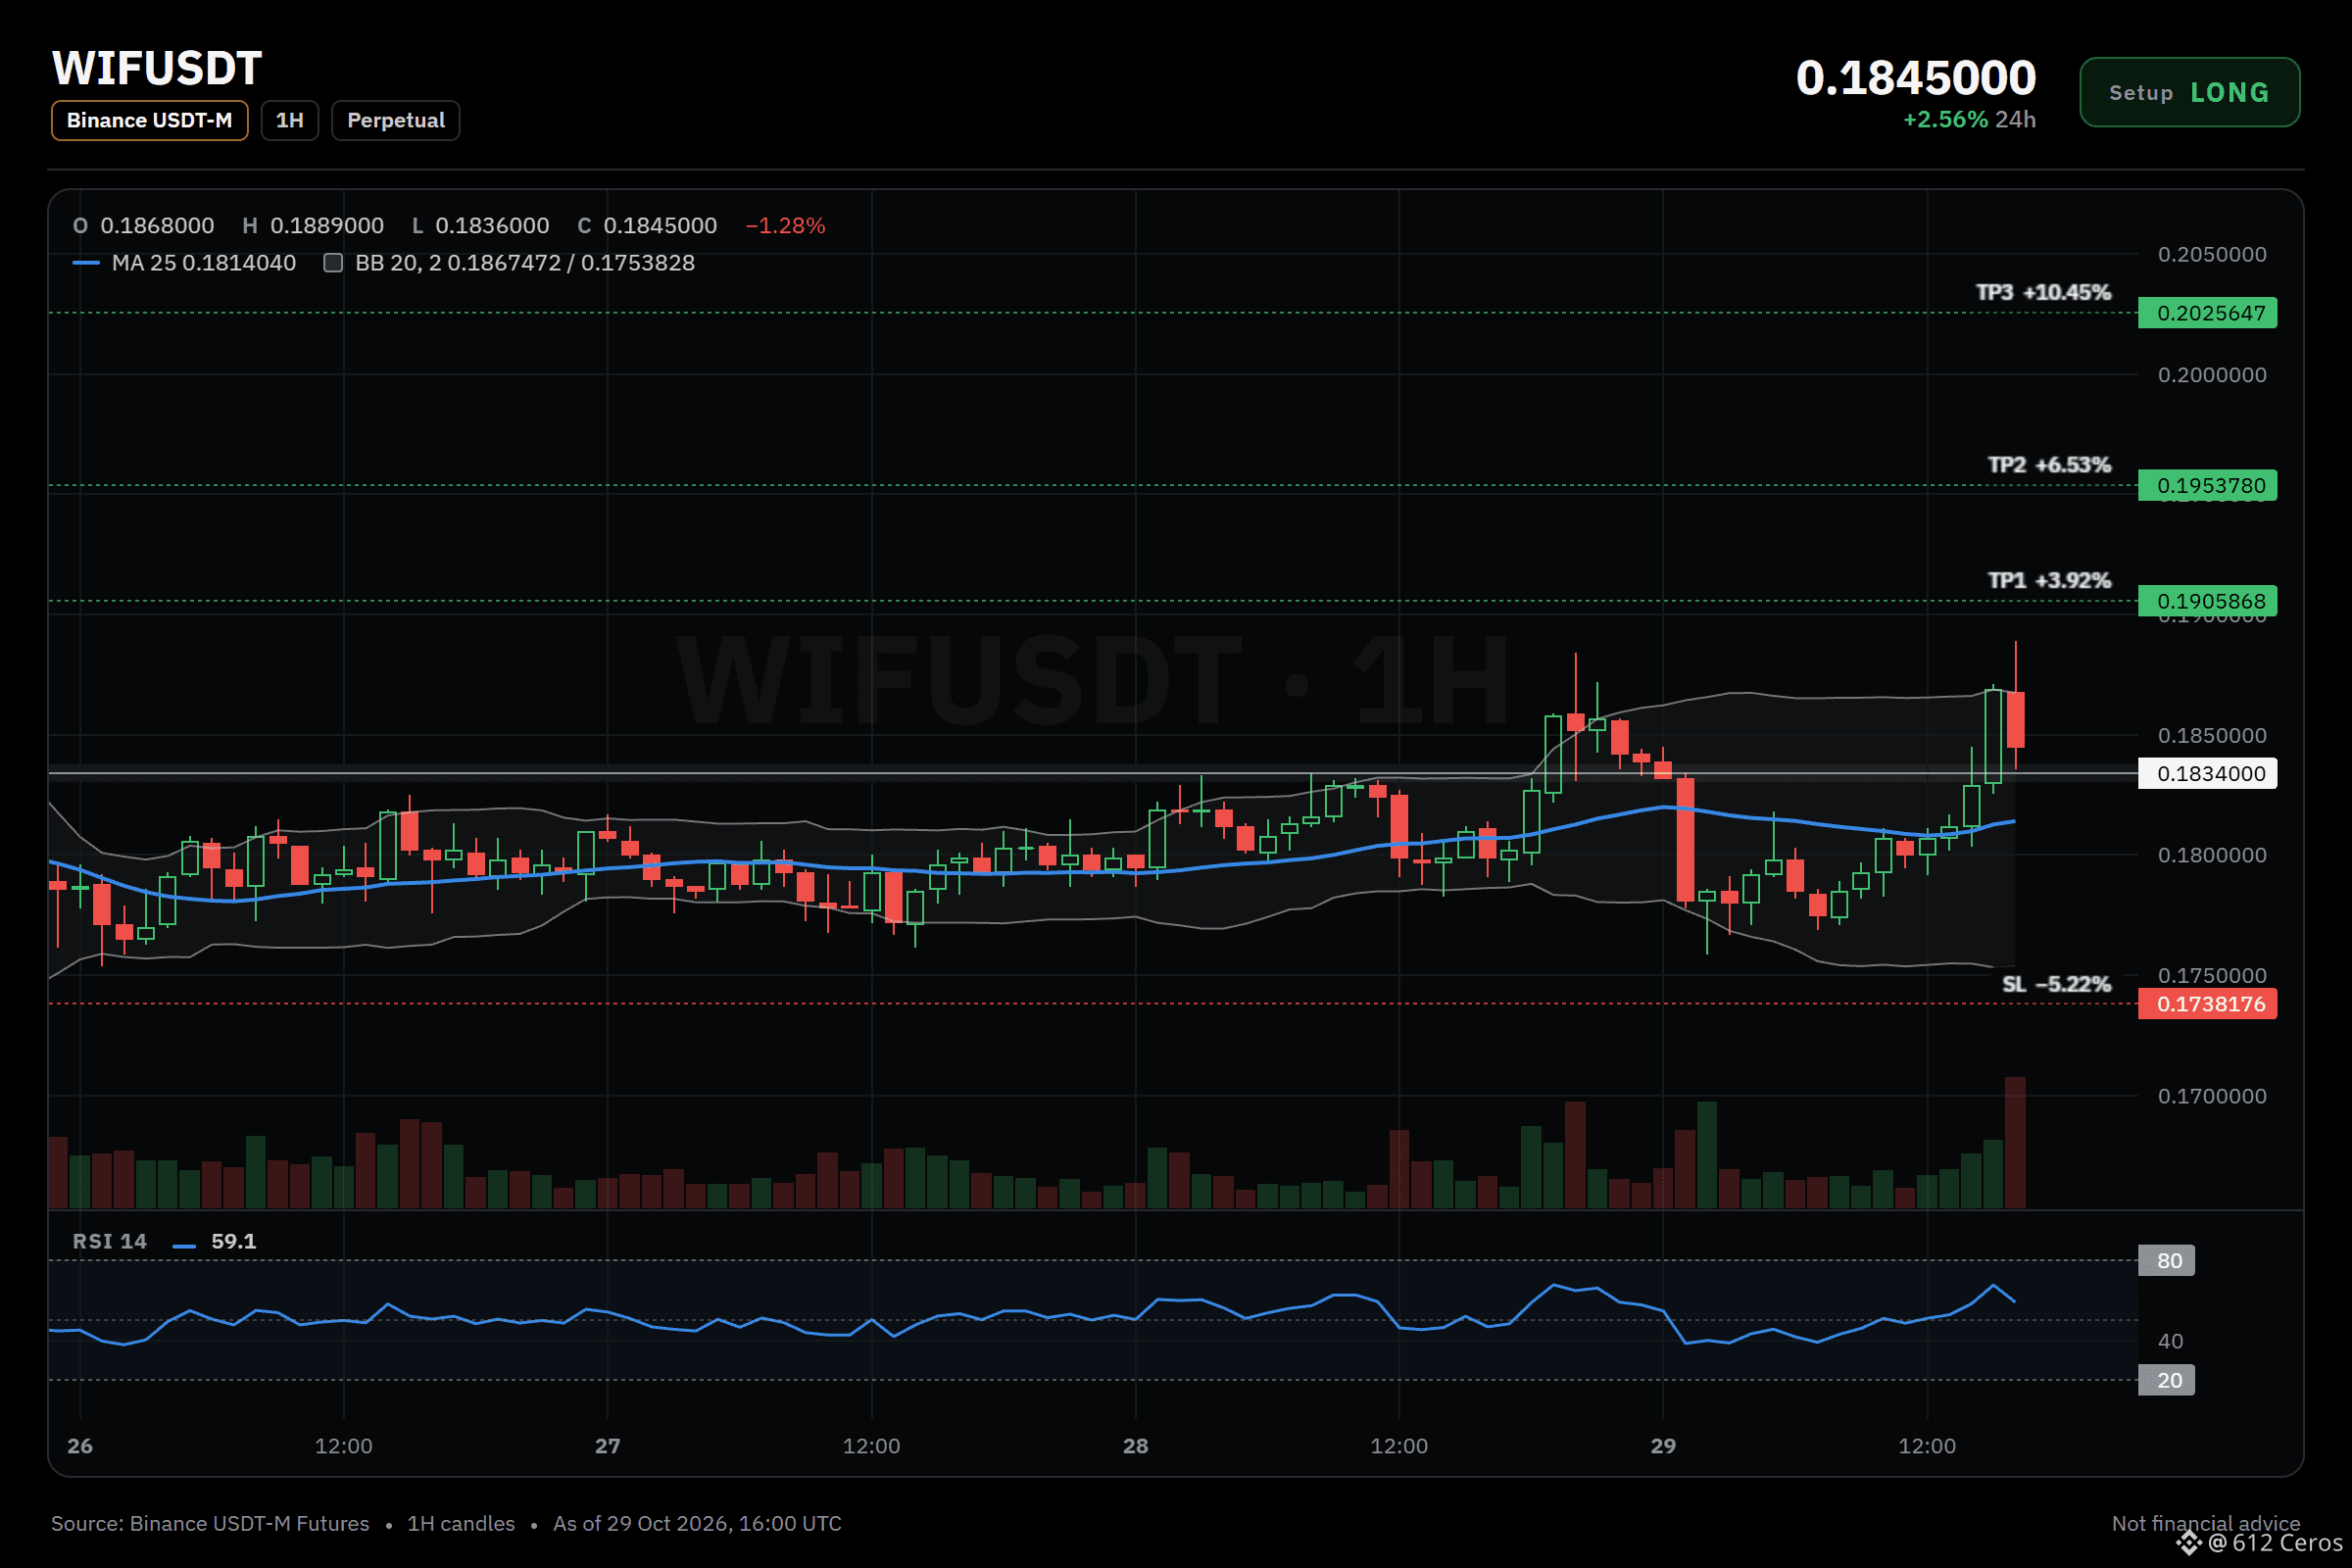
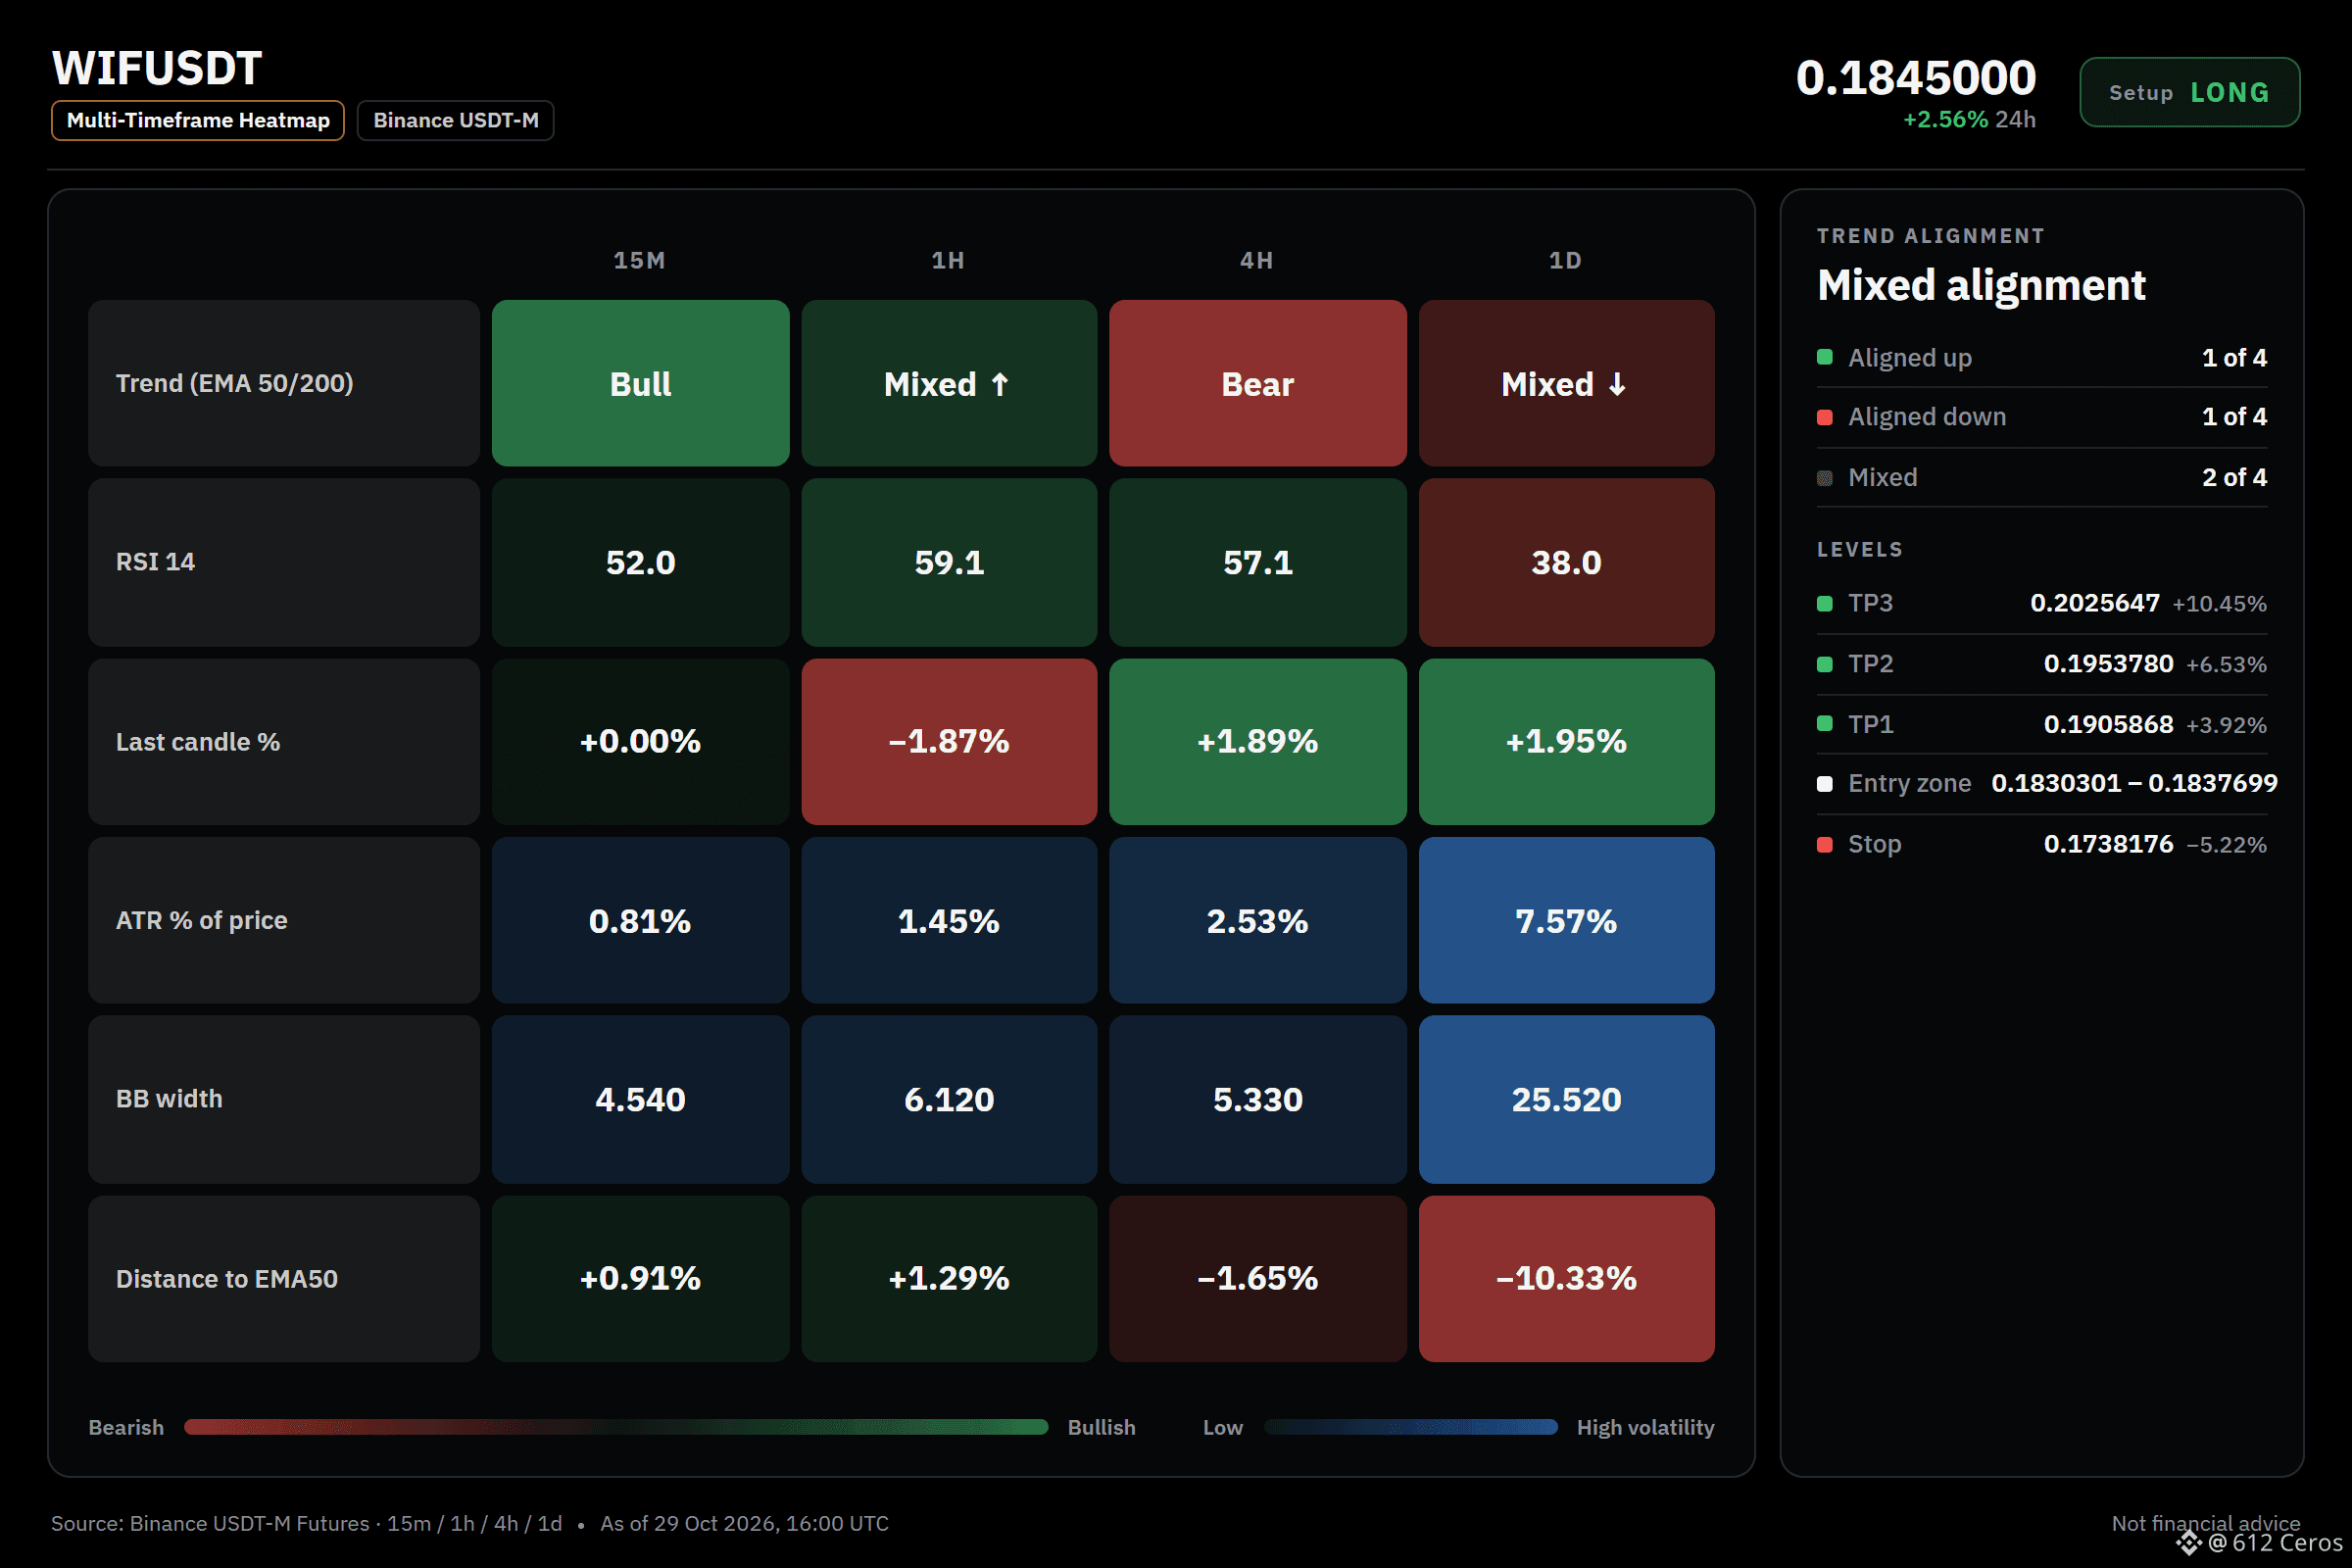
🟢 LONG $WIF /USDT: expecting price to go UP
Bias: LONG · Leaning
Entry: 0.1830301 – 0.1837699
TP1: 0.1905868 (+3.9%)
TP2: 0.1953780 (+6.5%)
TP3: 0.2025647 (+10.4%)
SL: 0.1738176 (-5.2%)
Plan: enter only inside the zone, close 50% at TP1, 25% at TP2, 25% at TP3, and move the stop to entry after TP1.
Note: moderate conviction only, keep size light.
The crowd is short WIF, but the buyers are in control
Why LONG? 5/12 signals agree, 1 against.
• Buyers are driving the move (15m ADX 38.7)
• BTC is rising, this coin follows (corr 0.74)
• Buyers have the momentum (4h RSI 57.1)
Risk: 4h trend down (below EMA50 & EMA200)
The 1h price shows ADX at 38.7 with buyers driving the move, and the 4h momentum is bullish with RSI above 55.
Where do you put your invalidation if the daily stack stays bearish?
Full setup on the chart below.
{future}(WIFUSDT)
📲 Want more of my latest signals? Join me here:
[https://app.binance.com/uni-qr/D26WbL9t](https://app.binance.com/uni-qr/D26WbL9t)
⚠️ Personal market analysis only. NFA — manage risk and DYOR.
Educational content, not investment advice or a recommendation to buy, sell, deposit, or withdraw any asset. No paid promotion or referral/affiliate links.
🟢 LONG $WIF /USDT: expecting price to go UP
Bias: LONG · Leaning
Entry: 0.1830301 – 0.1837699
TP1: 0.1905868 (+3.9%)
TP2: 0.1953780 (+6.5%)
TP3: 0.2025647 (+10.4%)
SL: 0.1738176 (-5.2%)
Plan: enter only inside the zone, close 50% at TP1, 25% at TP2, 25% at TP3, and move the stop to entry after TP1.
Note: moderate conviction only, keep size light.
The crowd is short WIF, but the buyers are in control
Why LONG? 5/12 signals agree, 1 against.
• Buyers are driving the move (15m ADX 38.7)
• BTC is rising, this coin follows (corr 0.74)
• Buyers have the momentum (4h RSI 57.1)
Risk: 4h trend down (below EMA50 & EMA200)
The 1h price shows ADX at 38.7 with buyers driving the move, and the 4h momentum is bullish with RSI above 55.
Where do you put your invalidation if the daily stack stays bearish?
Full setup on the chart below.
📲 Want more of my latest signals? Join me here:
https://app.binance.com/uni-qr/D26WbL9t
⚠️ Personal market analysis only. NFA — manage risk and DYOR.
Educational content, not investment advice or a recommendation to buy, sell, deposit, or withdraw any asset. No paid promotion or referral/affiliate links.
1
1.2k
·
--
Падение
Can AKE flip its 4h bearish stack now?
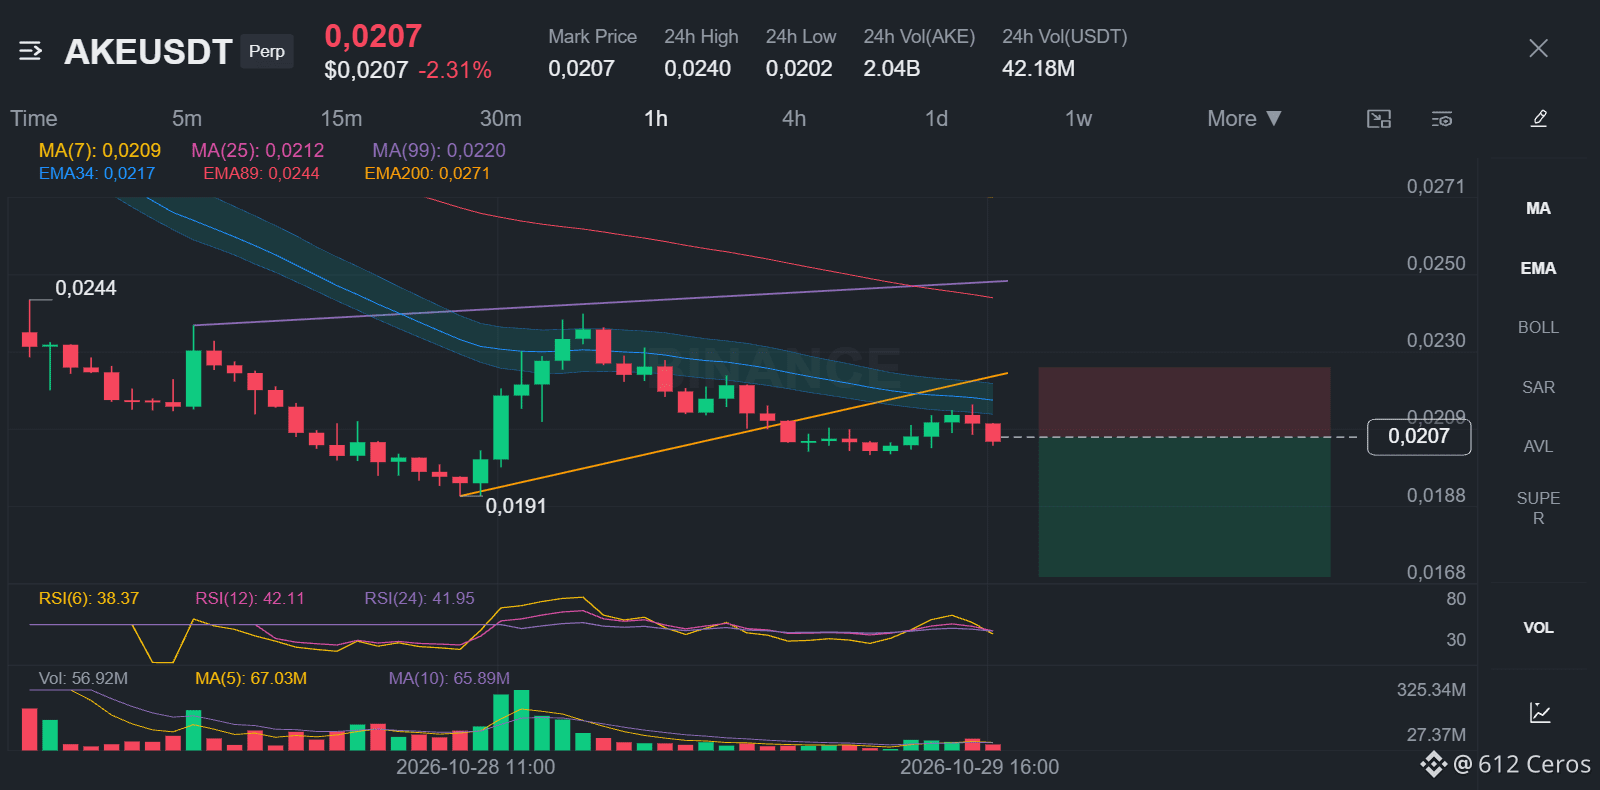
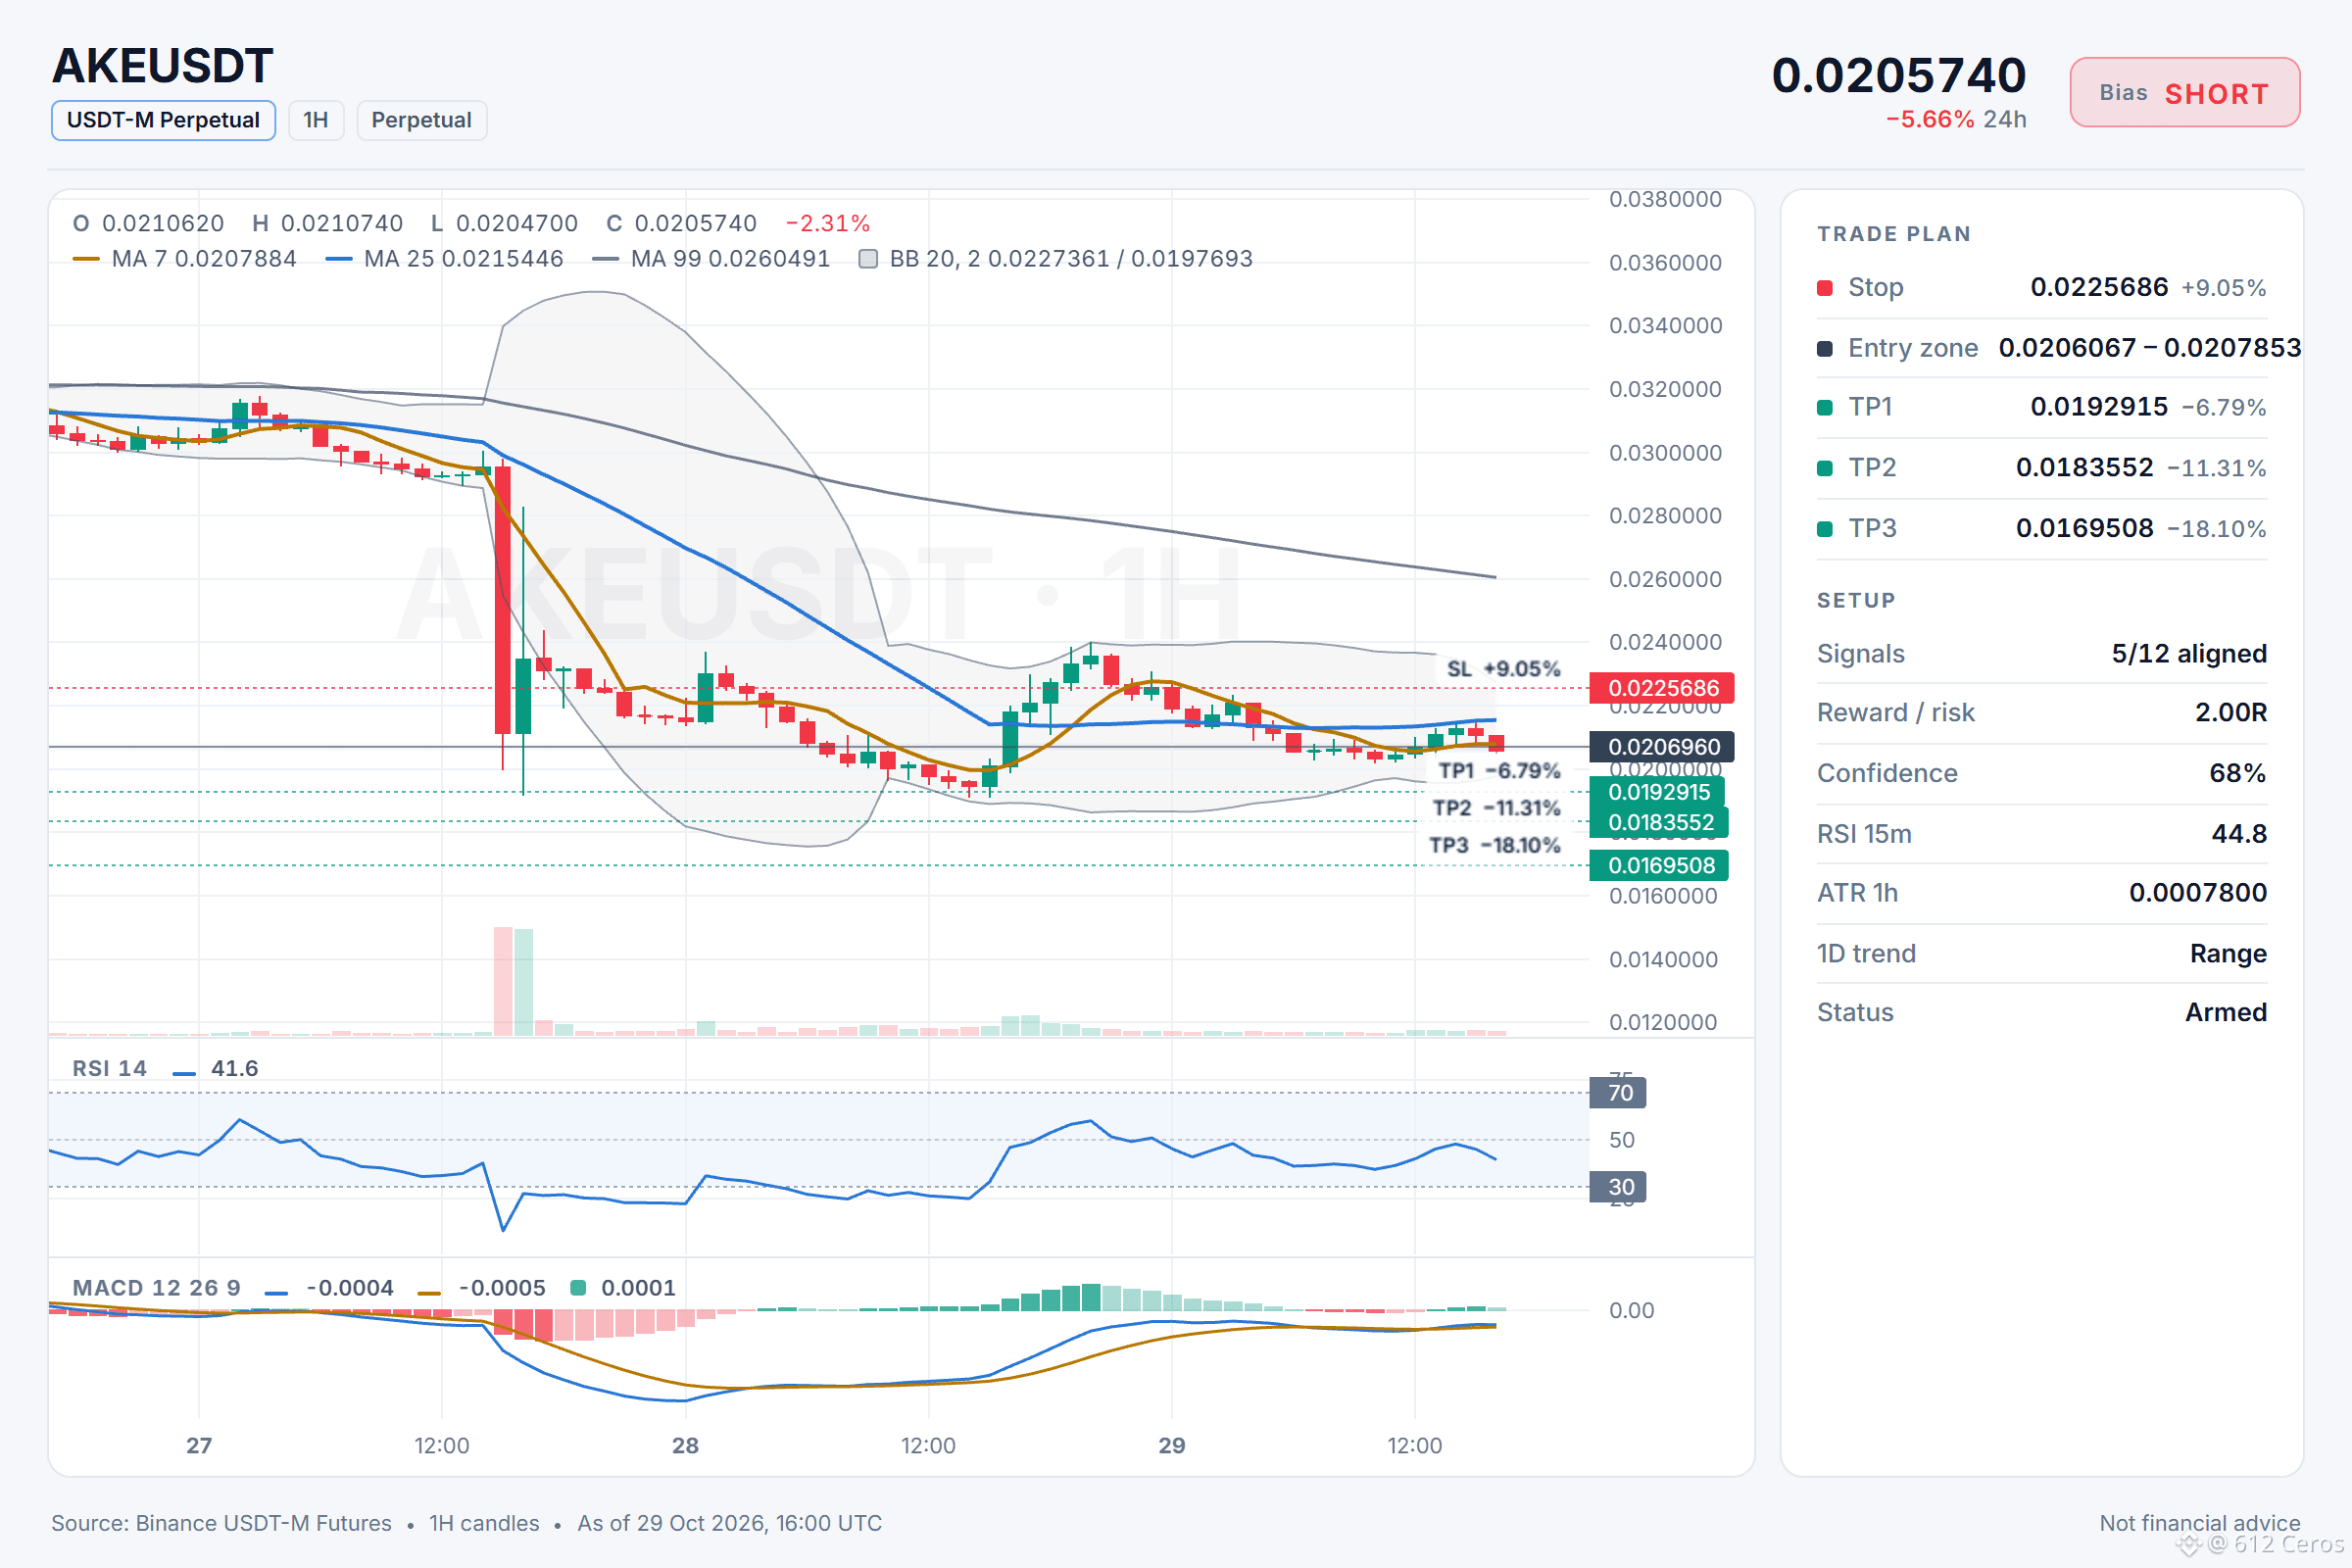
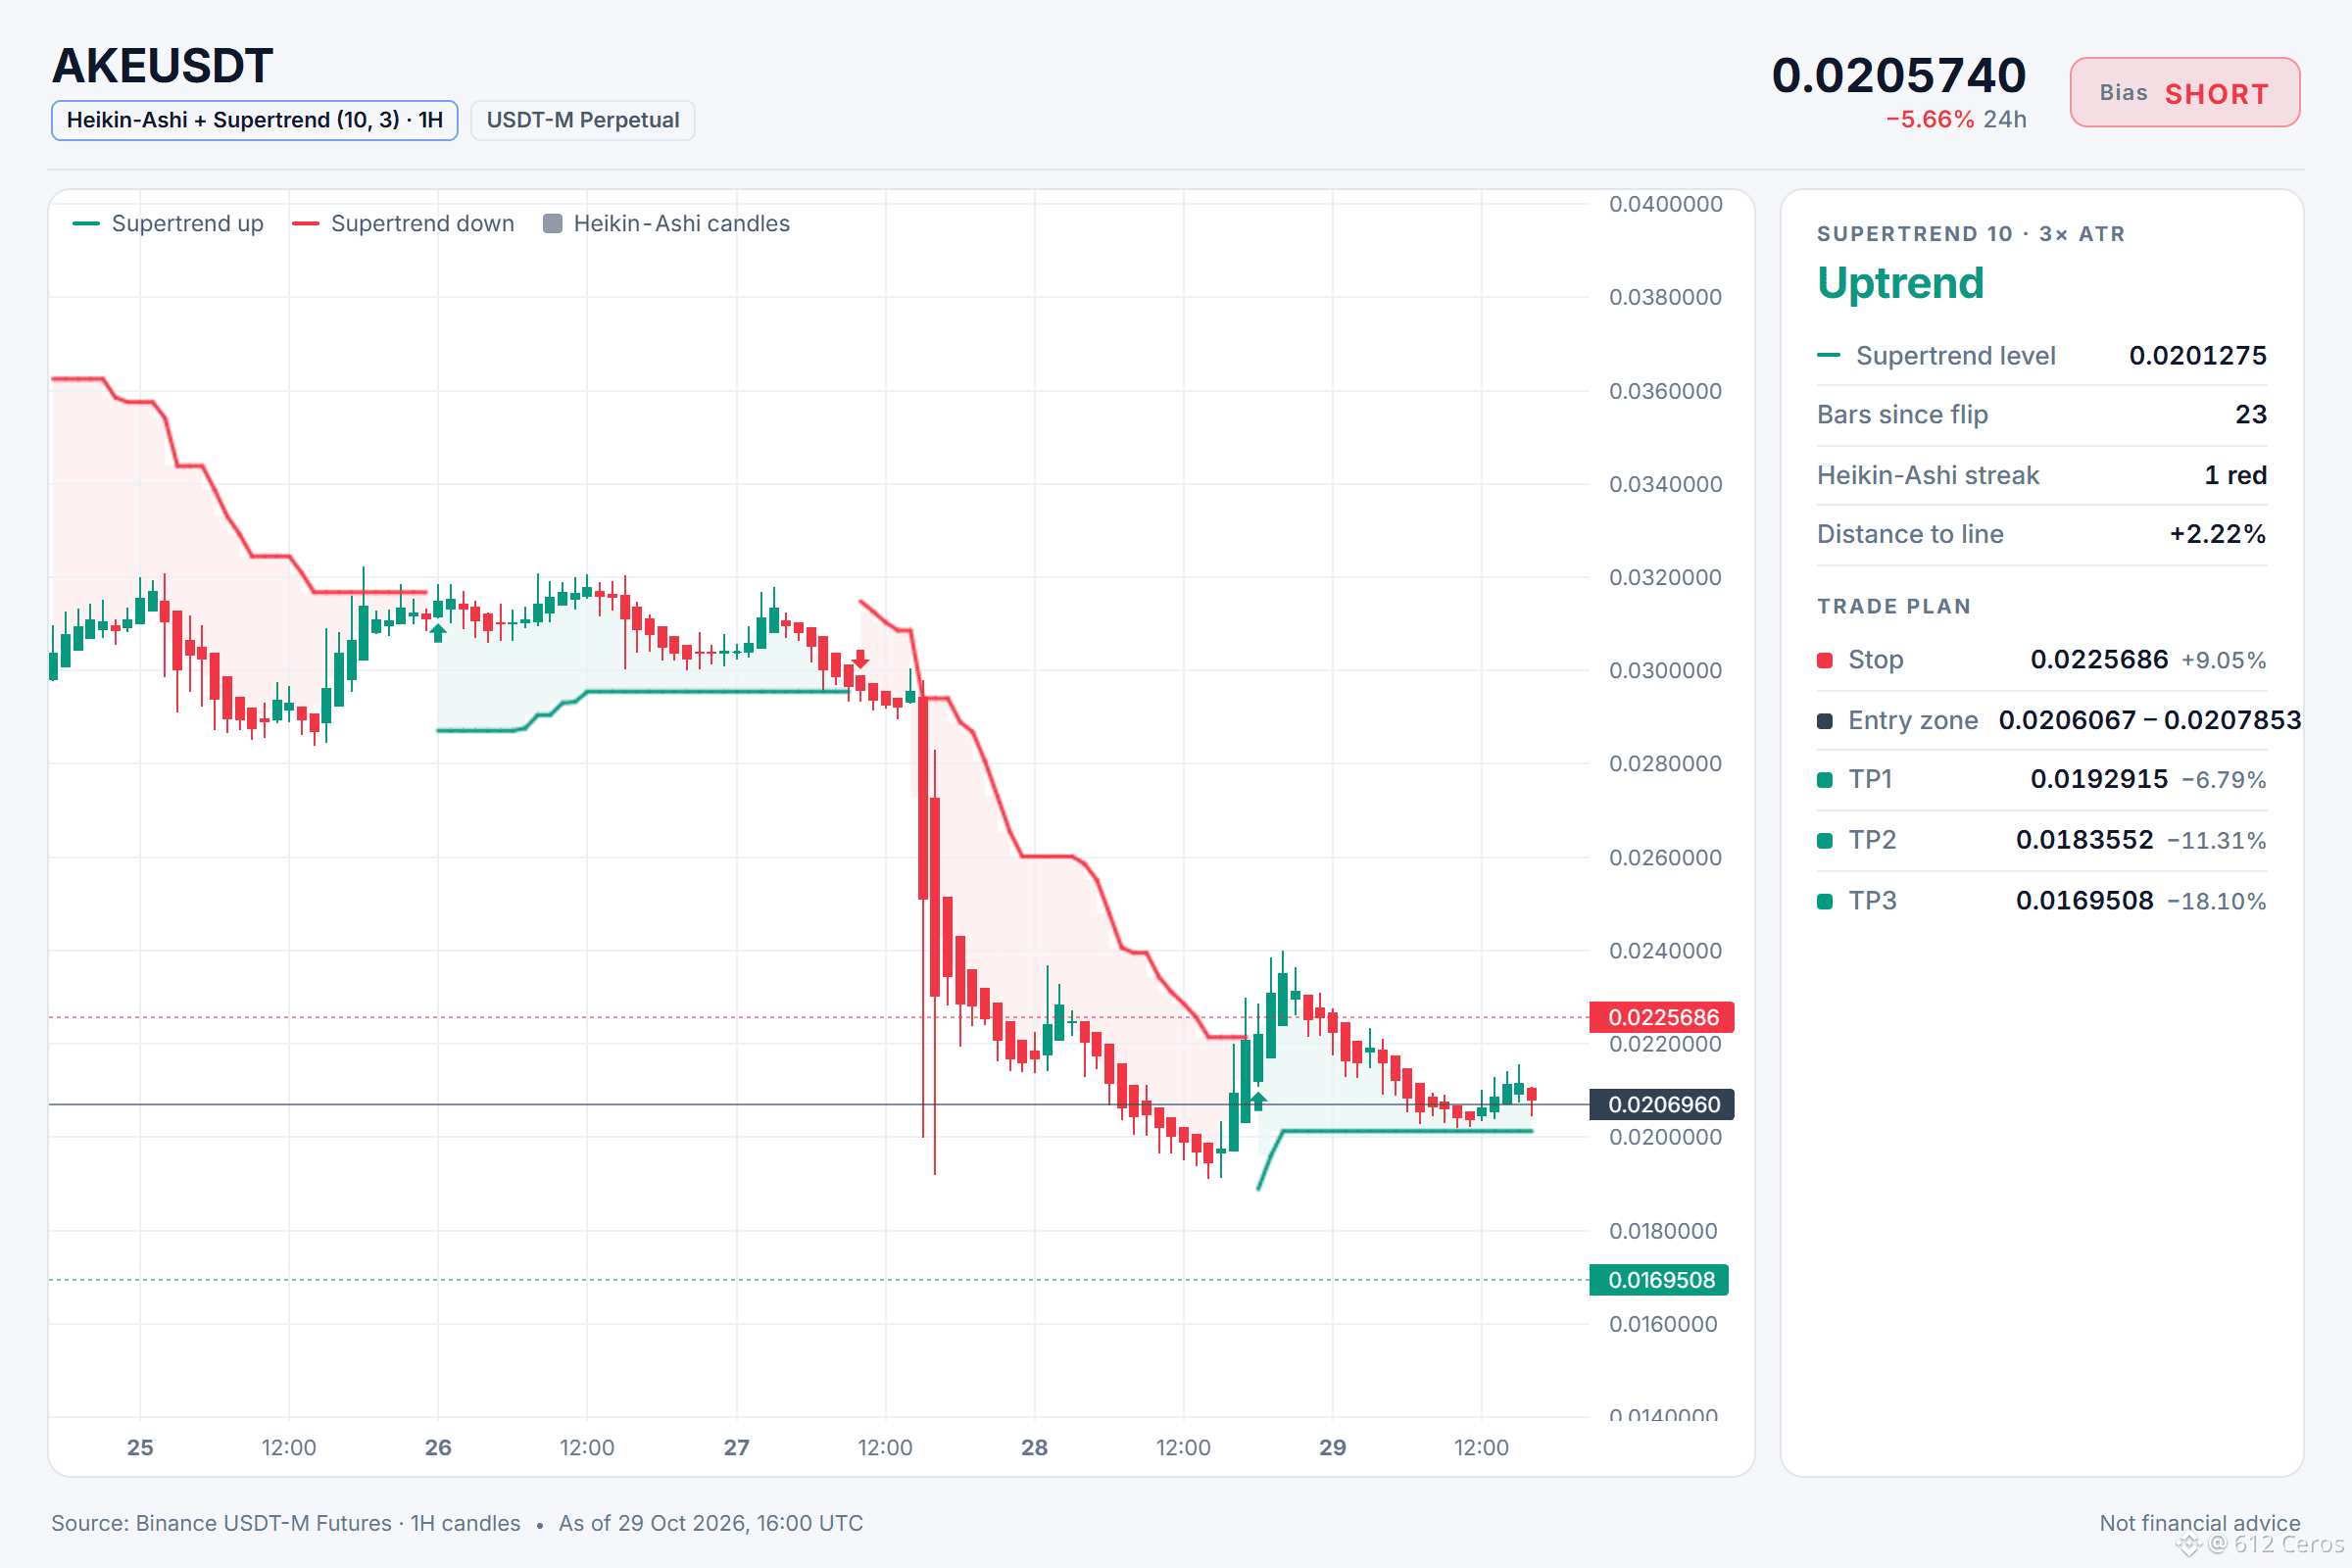
🔴 SHORT $AKE /USDT: expecting price to go DOWN
Bias: SHORT · Leaning
Entry: 0.0206067 – 0.0207853
TP1: 0.0192915 (-6.8%)
TP2: 0.0183552 (-11.3%)
TP3: 0.0169508 (-18.1%)
SL: 0.0225686 (+9.0%)
Plan: enter only inside the zone, close 50% at TP1, 25% at TP2, 25% at TP3, and move the stop to entry after TP1.
Note: moderate conviction only, keep size light.
Why SHORT? AKE checklist: 5/12 agree, 0 against.
• 4h trend down (below EMA50 & EMA200)
• 1h trend down (below EMA50 & EMA200)
• Sellers have the momentum (4h RSI 37.2)
Watch: The idea is wrong if price reaches the stop at 0.0225686
Bottom line: The 4h bearish stack (price below EMA50 below EMA200) and 1h bearish stack both mean the trend is down, but the daily trend is range-bound and ADX shows no clear direction, so conviction stays moderate.
Would you short here or wait for a lower entry?
Full setup on the chart below.
{future}(AKEUSDT)
📲 Want more of my latest signals? Join me here:
[https://app.binance.com/uni-qr/D26WbL9t](https://app.binance.com/uni-qr/D26WbL9t)
⚠️ Personal market analysis only. NFA — manage risk and DYOR.
Educational content, not investment advice or a recommendation to buy, sell, deposit, or withdraw any asset. No paid promotion or referral/affiliate links.
Can AKE flip its 4h bearish stack now?
🔴 SHORT $AKE /USDT: expecting price to go DOWN
Bias: SHORT · Leaning
Entry: 0.0206067 – 0.0207853
TP1: 0.0192915 (-6.8%)
TP2: 0.0183552 (-11.3%)
TP3: 0.0169508 (-18.1%)
SL: 0.0225686 (+9.0%)
Plan: enter only inside the zone, close 50% at TP1, 25% at TP2, 25% at TP3, and move the stop to entry after TP1.
Note: moderate conviction only, keep size light.
Why SHORT? AKE checklist: 5/12 agree, 0 against.
• 4h trend down (below EMA50 & EMA200)
• 1h trend down (below EMA50 & EMA200)
• Sellers have the momentum (4h RSI 37.2)
Watch: The idea is wrong if price reaches the stop at 0.0225686
Bottom line: The 4h bearish stack (price below EMA50 below EMA200) and 1h bearish stack both mean the trend is down, but the daily trend is range-bound and ADX shows no clear direction, so conviction stays moderate.
Would you short here or wait for a lower entry?
Full setup on the chart below.
📲 Want more of my latest signals? Join me here:
https://app.binance.com/uni-qr/D26WbL9t
⚠️ Personal market analysis only. NFA — manage risk and DYOR.
Educational content, not investment advice or a recommendation to buy, sell, deposit, or withdraw any asset. No paid promotion or referral/affiliate links.
1
800
·
--
🎙️ $10000 to $1,000,000 Crypto Trading Challenge - Day 8 💰

 В ЭФИРЕ
Слушатели: 869 · 1 в Центре торговли в реальном времени
4
0
·
--
Рост
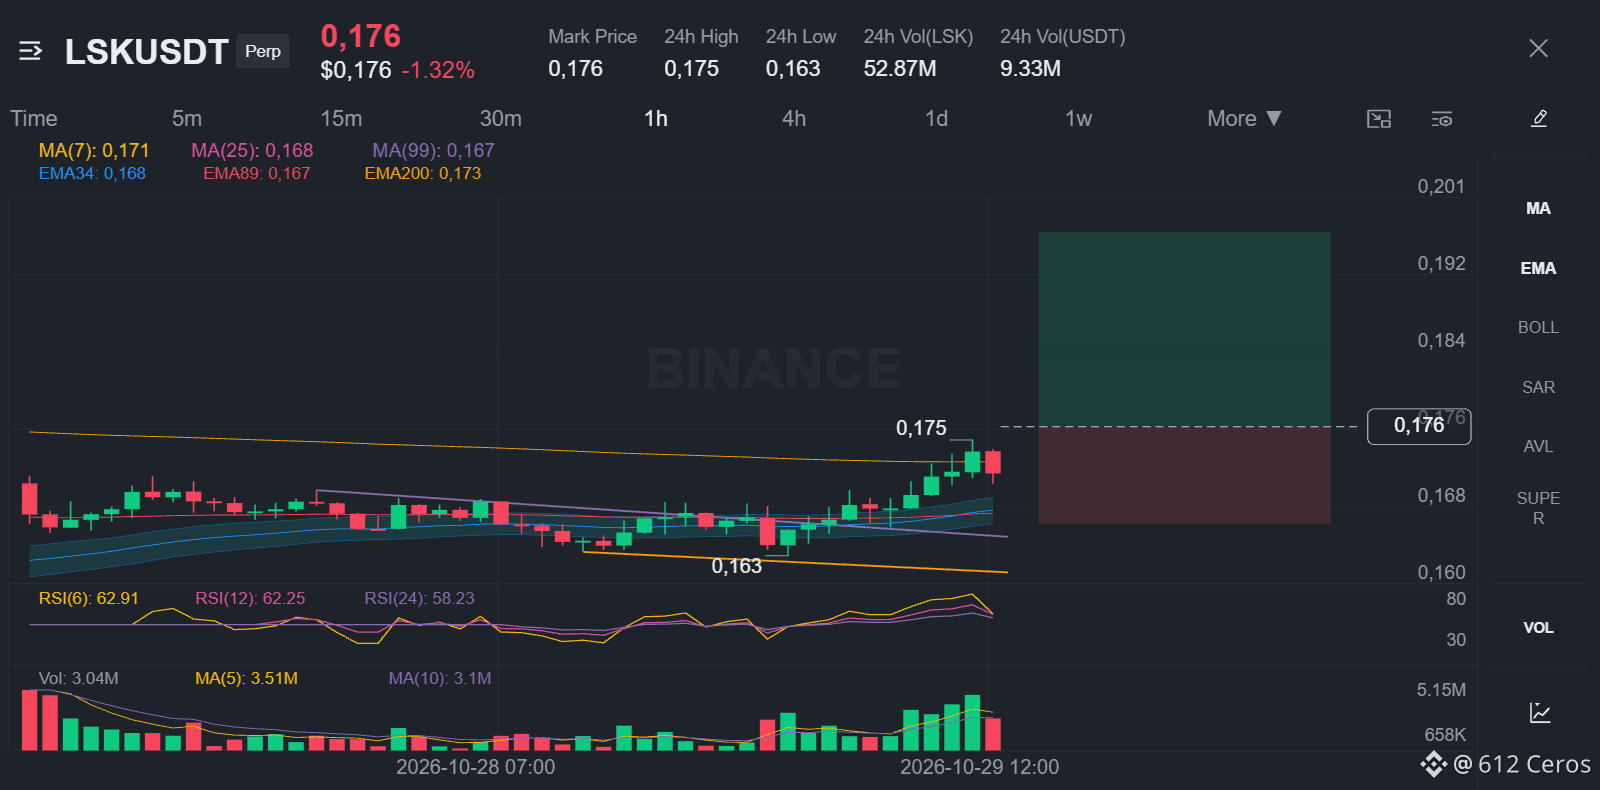
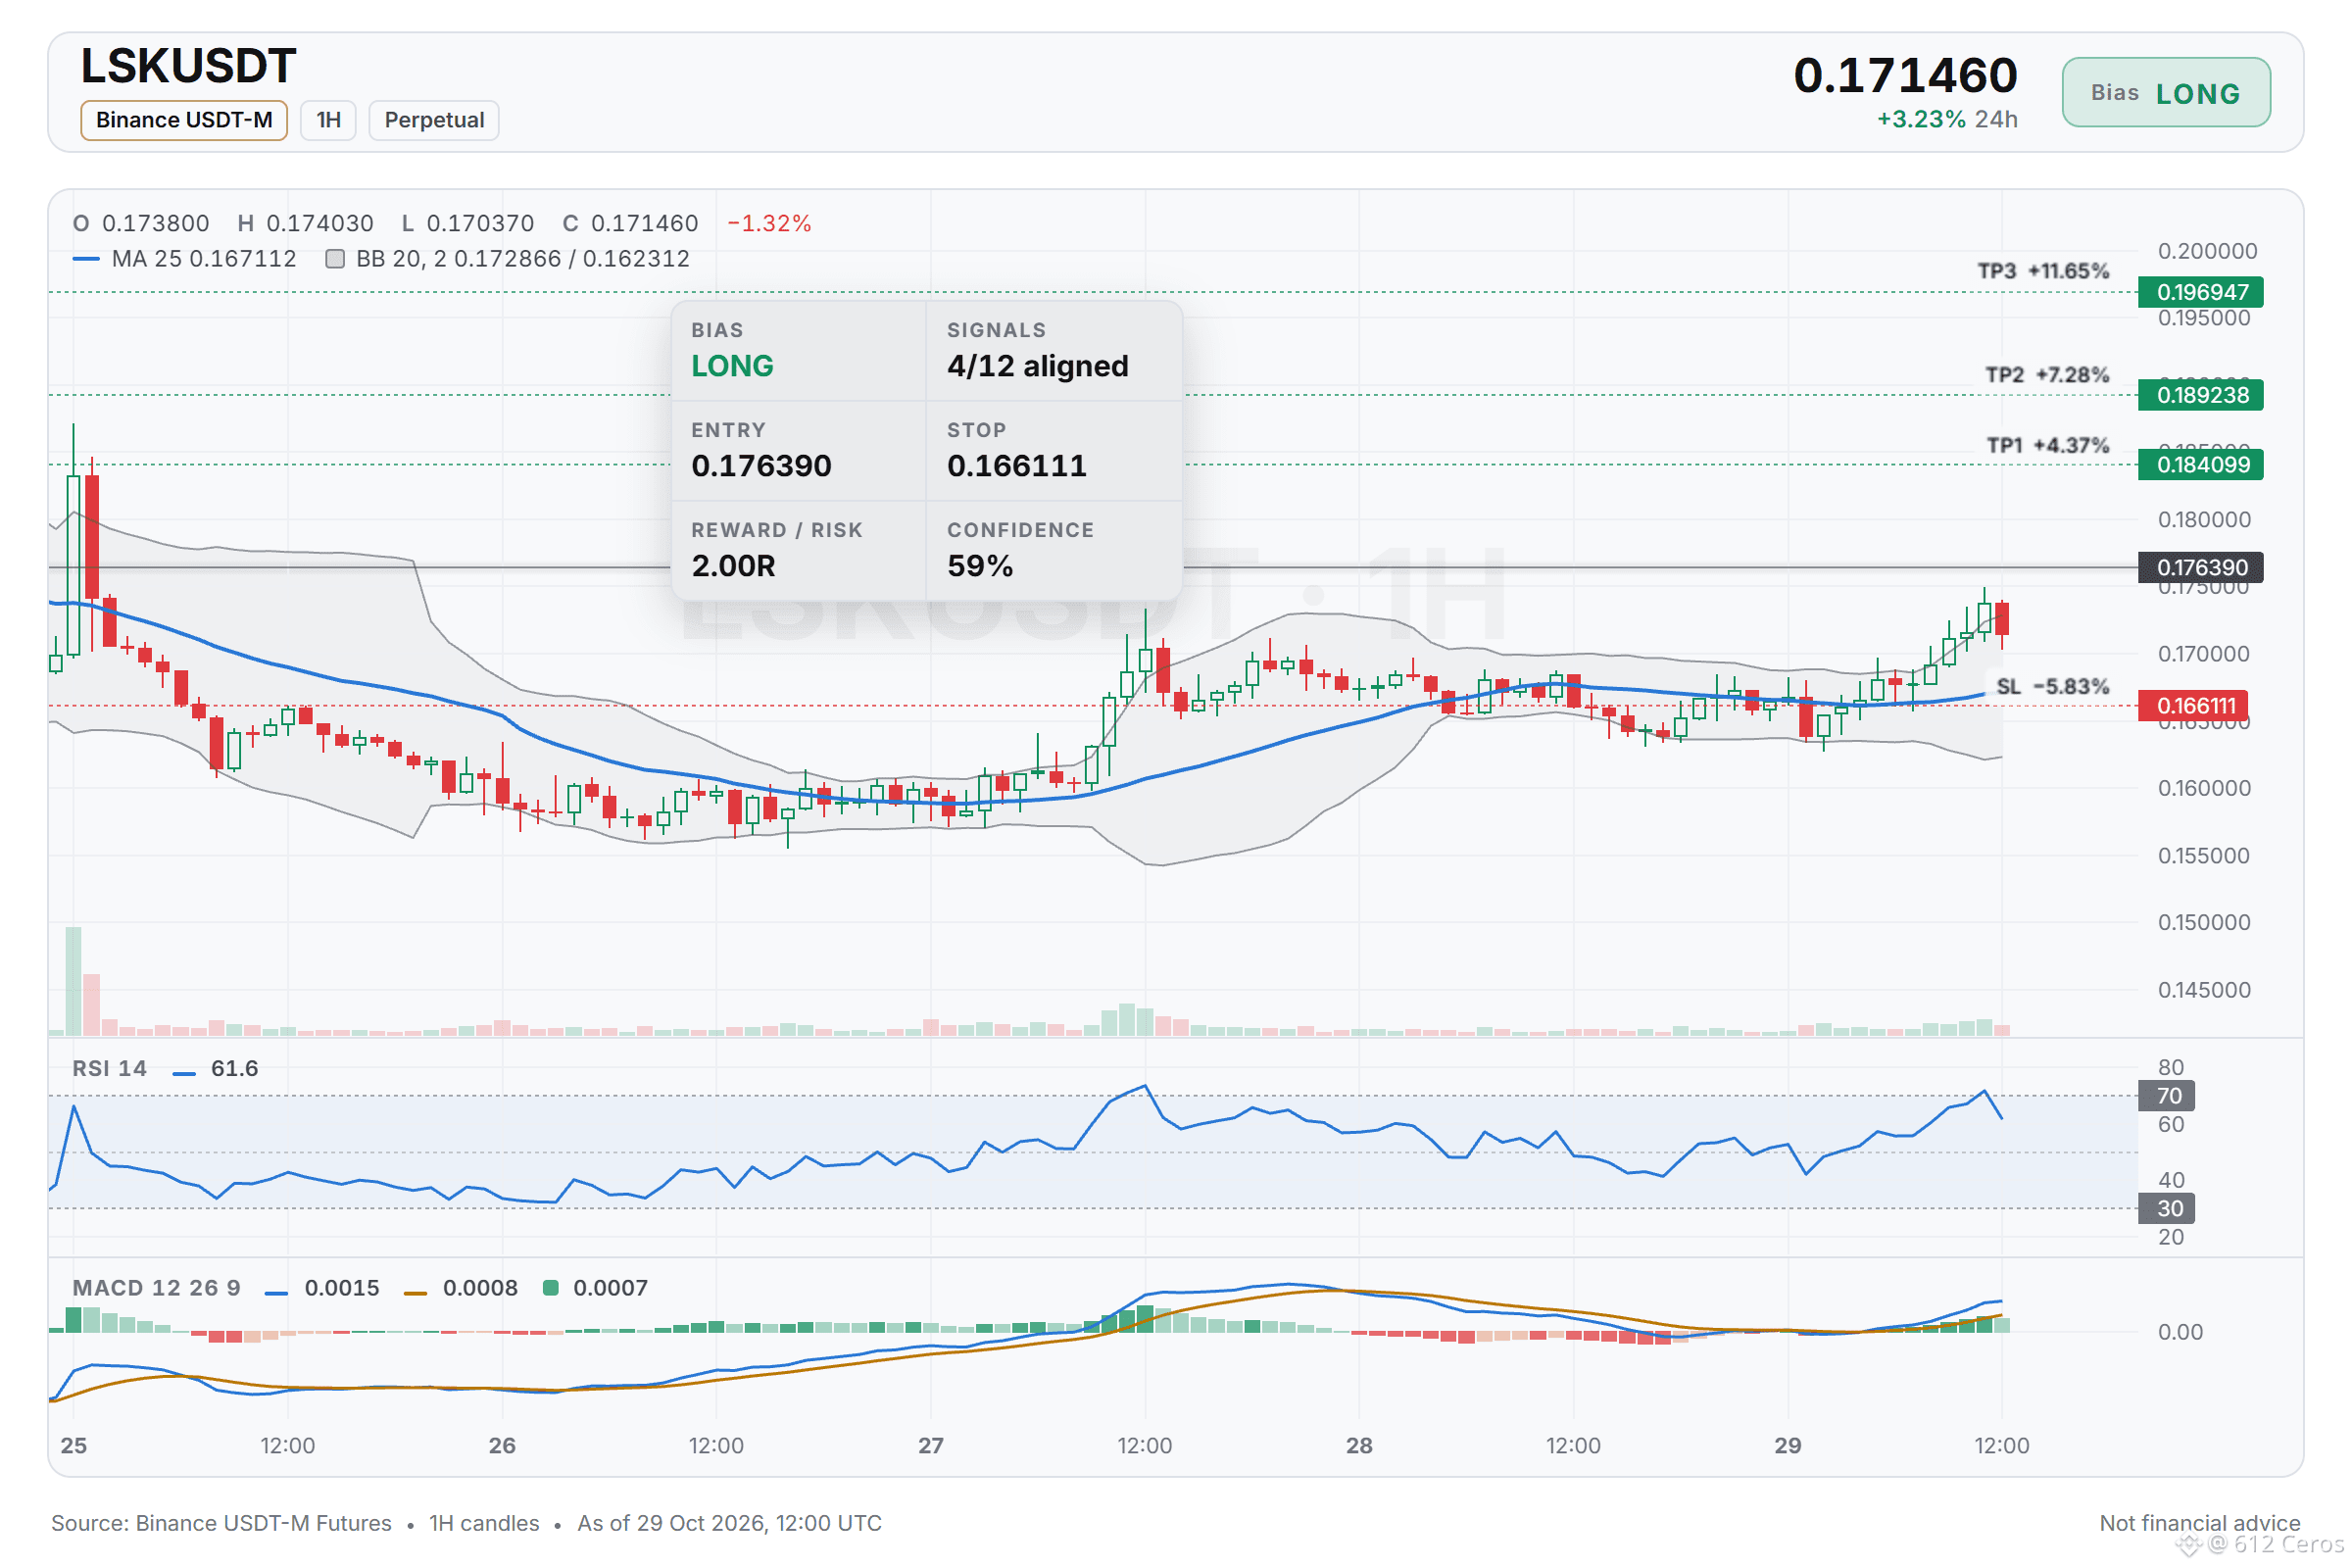
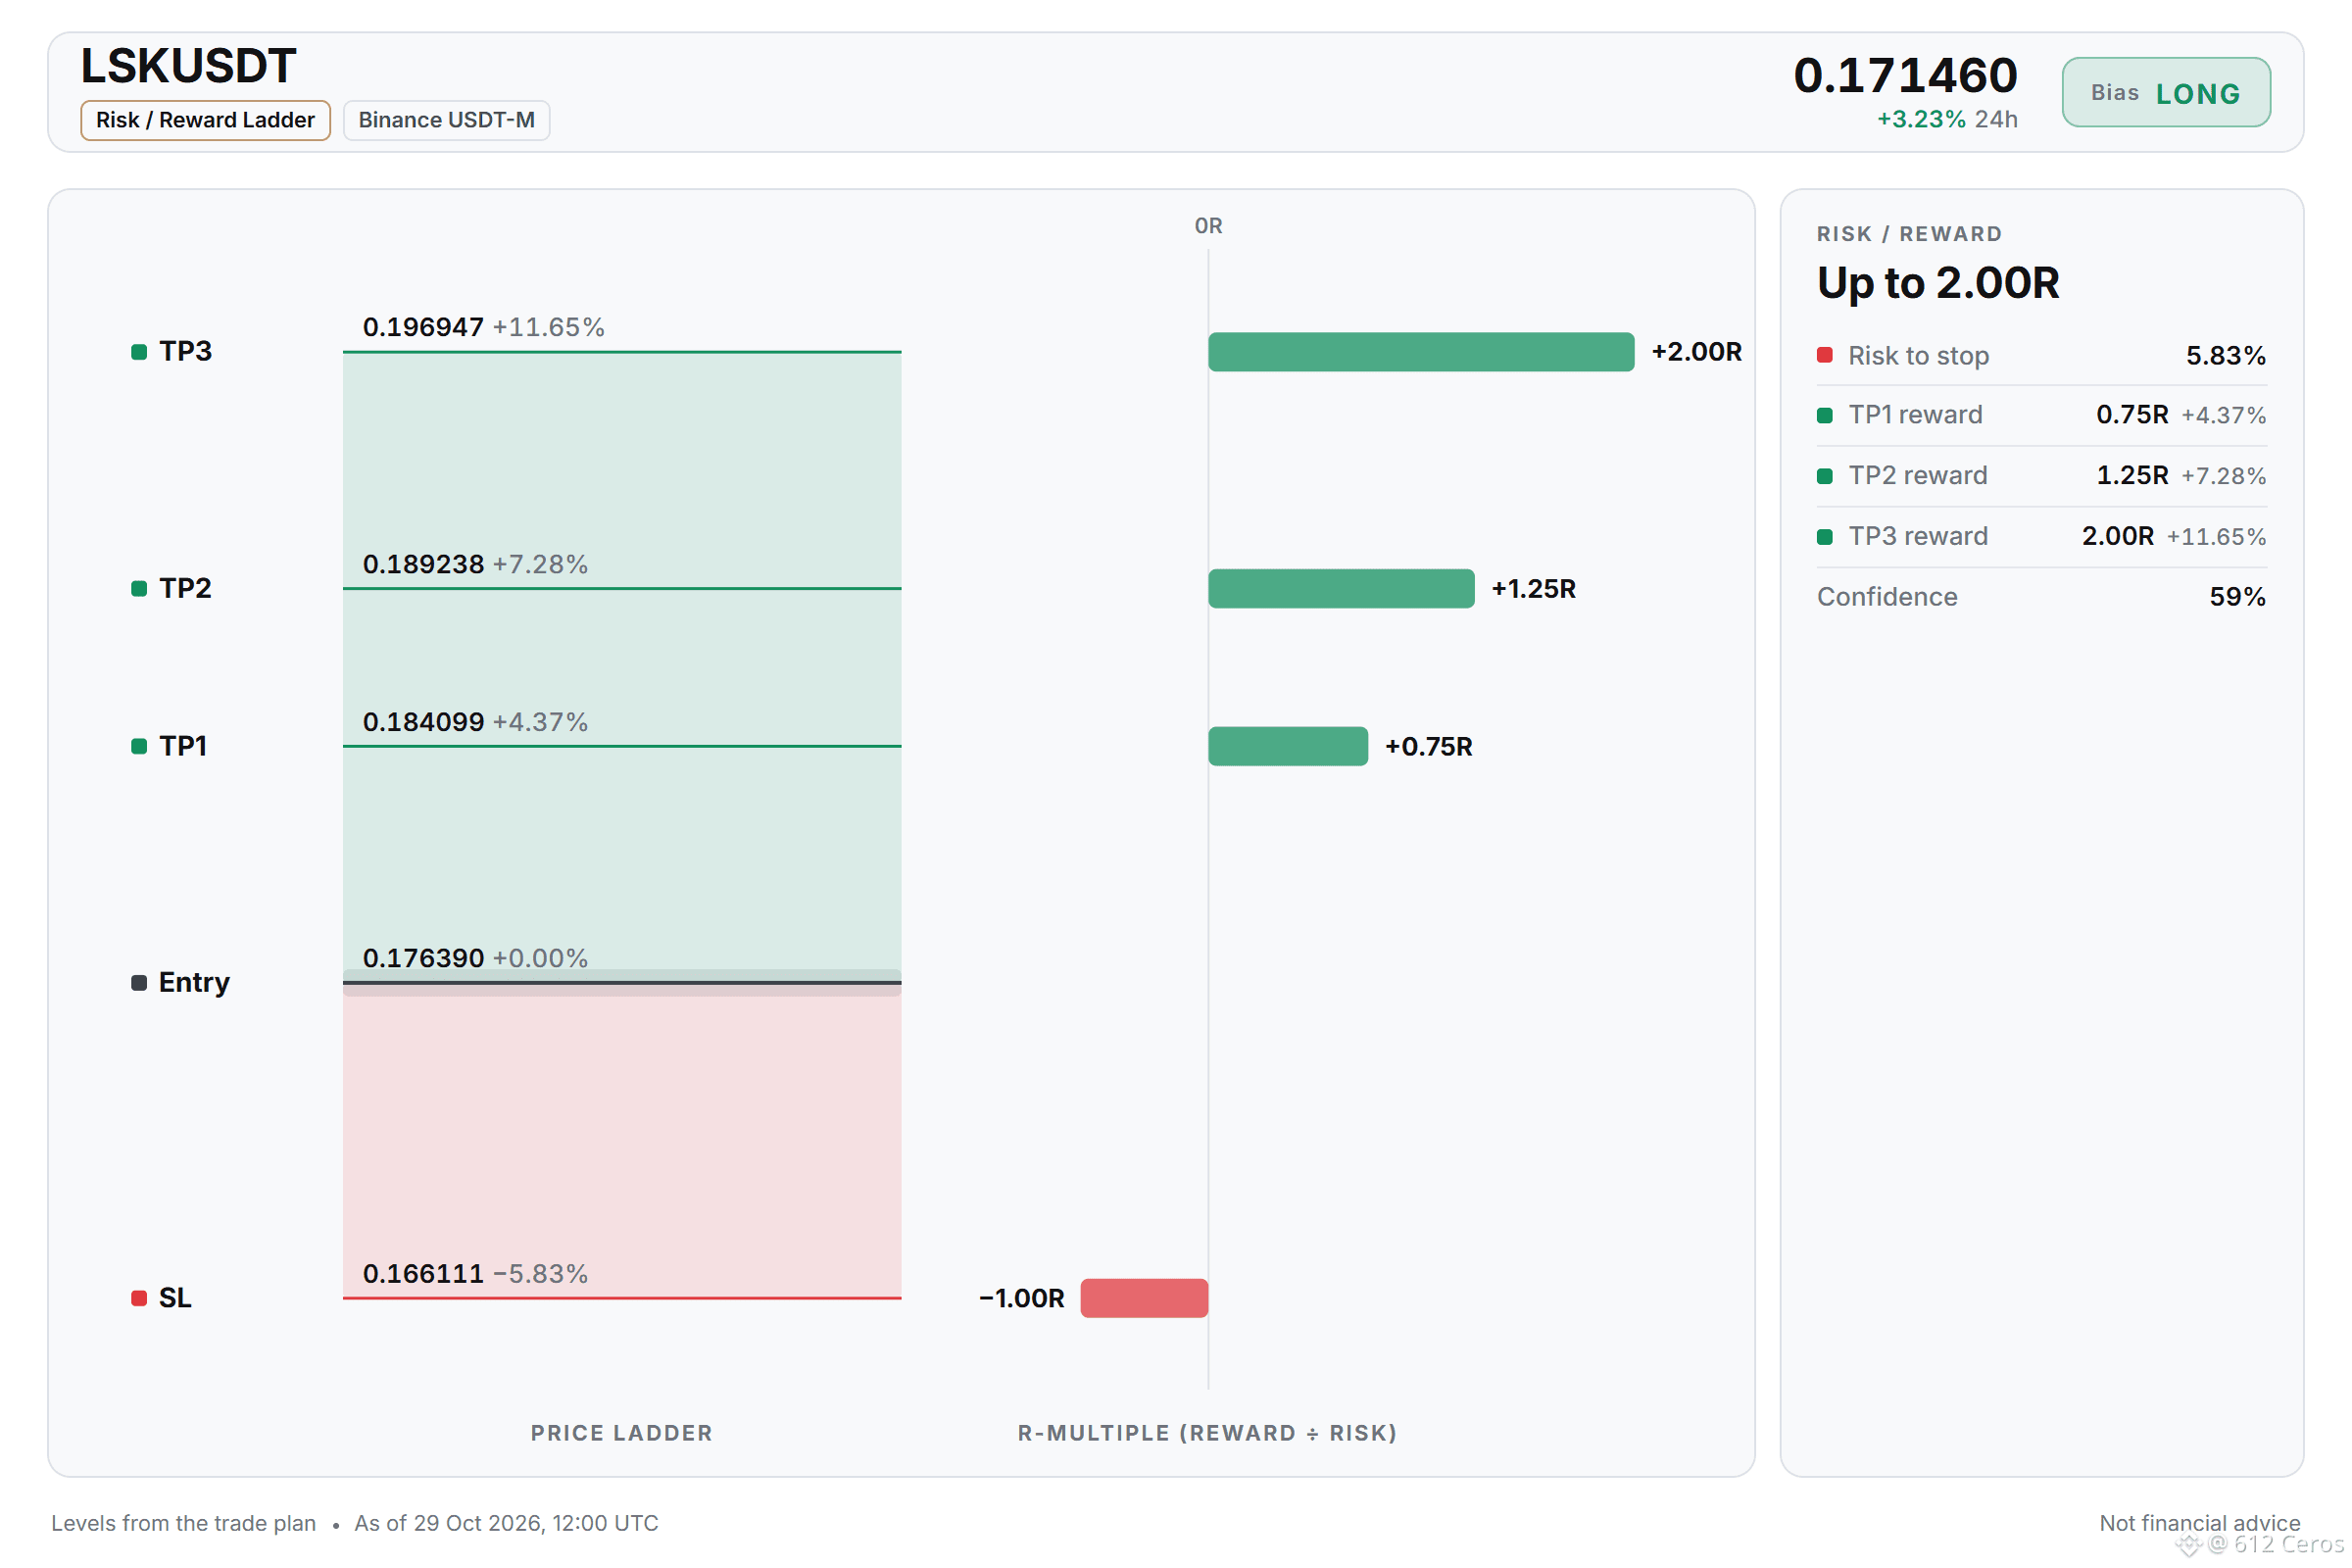
LSK is leaning long but conviction stays moderate
🟢 LONG $LSK /USDT: expecting price to go UP
Bias: LONG · Leaning
Entry: 0.175949 – 0.176831
TP1: 0.184099 (+4.4%)
TP2: 0.189238 (+7.3%)
TP3: 0.196947 (+11.7%)
SL: 0.166111 (-5.8%)
Plan: enter only inside the zone, close 50% at TP1, 25% at TP2, 25% at TP3, and move the stop to entry after TP1.
Note: moderate conviction only, keep size light.
Why LONG? 4/12 signals agree, 1 against.
• Buyers are driving the move (15m ADX 35.3)
• Buyers have the momentum (4h RSI 59.7)
• Buyers have the momentum (1h RSI 61.6)
Risk: Far above its average, pullback likely (+3.3 ATR from 1h EMA50)
My read on LSK today
I'm watching LSK for a long futures entry. The 1h price sits at 0.176390, and I want to see a clean retrace to the 1h EMA50 before I commit. My stop sits at 0.166111, which is 3.3 ATR below the EMA, so a pullback is the real risk here.
What level would make you hesitant to take this long?
Full setup on the chart below.
{future}(LSKUSDT)
📲 Want more of my latest signals? Join me here:
[https://app.binance.com/uni-qr/D26WbL9t](https://app.binance.com/uni-qr/D26WbL9t)
⚠️ Personal market analysis only. NFA — manage risk and DYOR.
Educational content, not investment advice or a recommendation to buy, sell, deposit, or withdraw any asset. No paid promotion or referral/affiliate links.
LSK is leaning long but conviction stays moderate
🟢 LONG $LSK /USDT: expecting price to go UP
Bias: LONG · Leaning
Entry: 0.175949 – 0.176831
TP1: 0.184099 (+4.4%)
TP2: 0.189238 (+7.3%)
TP3: 0.196947 (+11.7%)
SL: 0.166111 (-5.8%)
Plan: enter only inside the zone, close 50% at TP1, 25% at TP2, 25% at TP3, and move the stop to entry after TP1.
Note: moderate conviction only, keep size light.
Why LONG? 4/12 signals agree, 1 against.
• Buyers are driving the move (15m ADX 35.3)
• Buyers have the momentum (4h RSI 59.7)
• Buyers have the momentum (1h RSI 61.6)
Risk: Far above its average, pullback likely (+3.3 ATR from 1h EMA50)
My read on LSK today
I'm watching LSK for a long futures entry. The 1h price sits at 0.176390, and I want to see a clean retrace to the 1h EMA50 before I commit. My stop sits at 0.166111, which is 3.3 ATR below the EMA, so a pullback is the real risk here.
What level would make you hesitant to take this long?
Full setup on the chart below.
📲 Want more of my latest signals? Join me here:
https://app.binance.com/uni-qr/D26WbL9t
⚠️ Personal market analysis only. NFA — manage risk and DYOR.
Educational content, not investment advice or a recommendation to buy, sell, deposit, or withdraw any asset. No paid promotion or referral/affiliate links.
6
1
2
1.4k
·
--
Рост
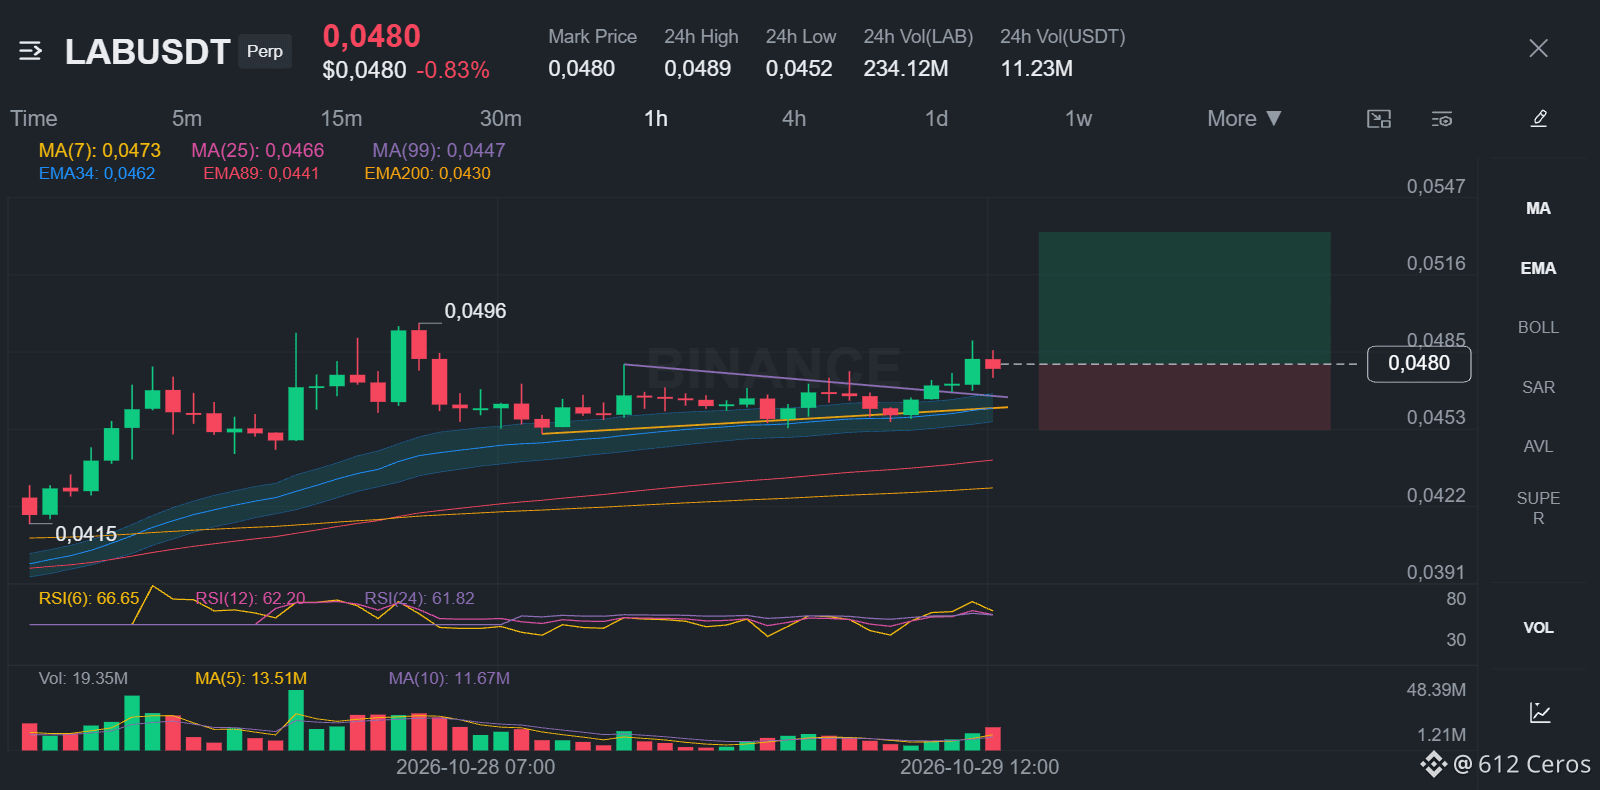
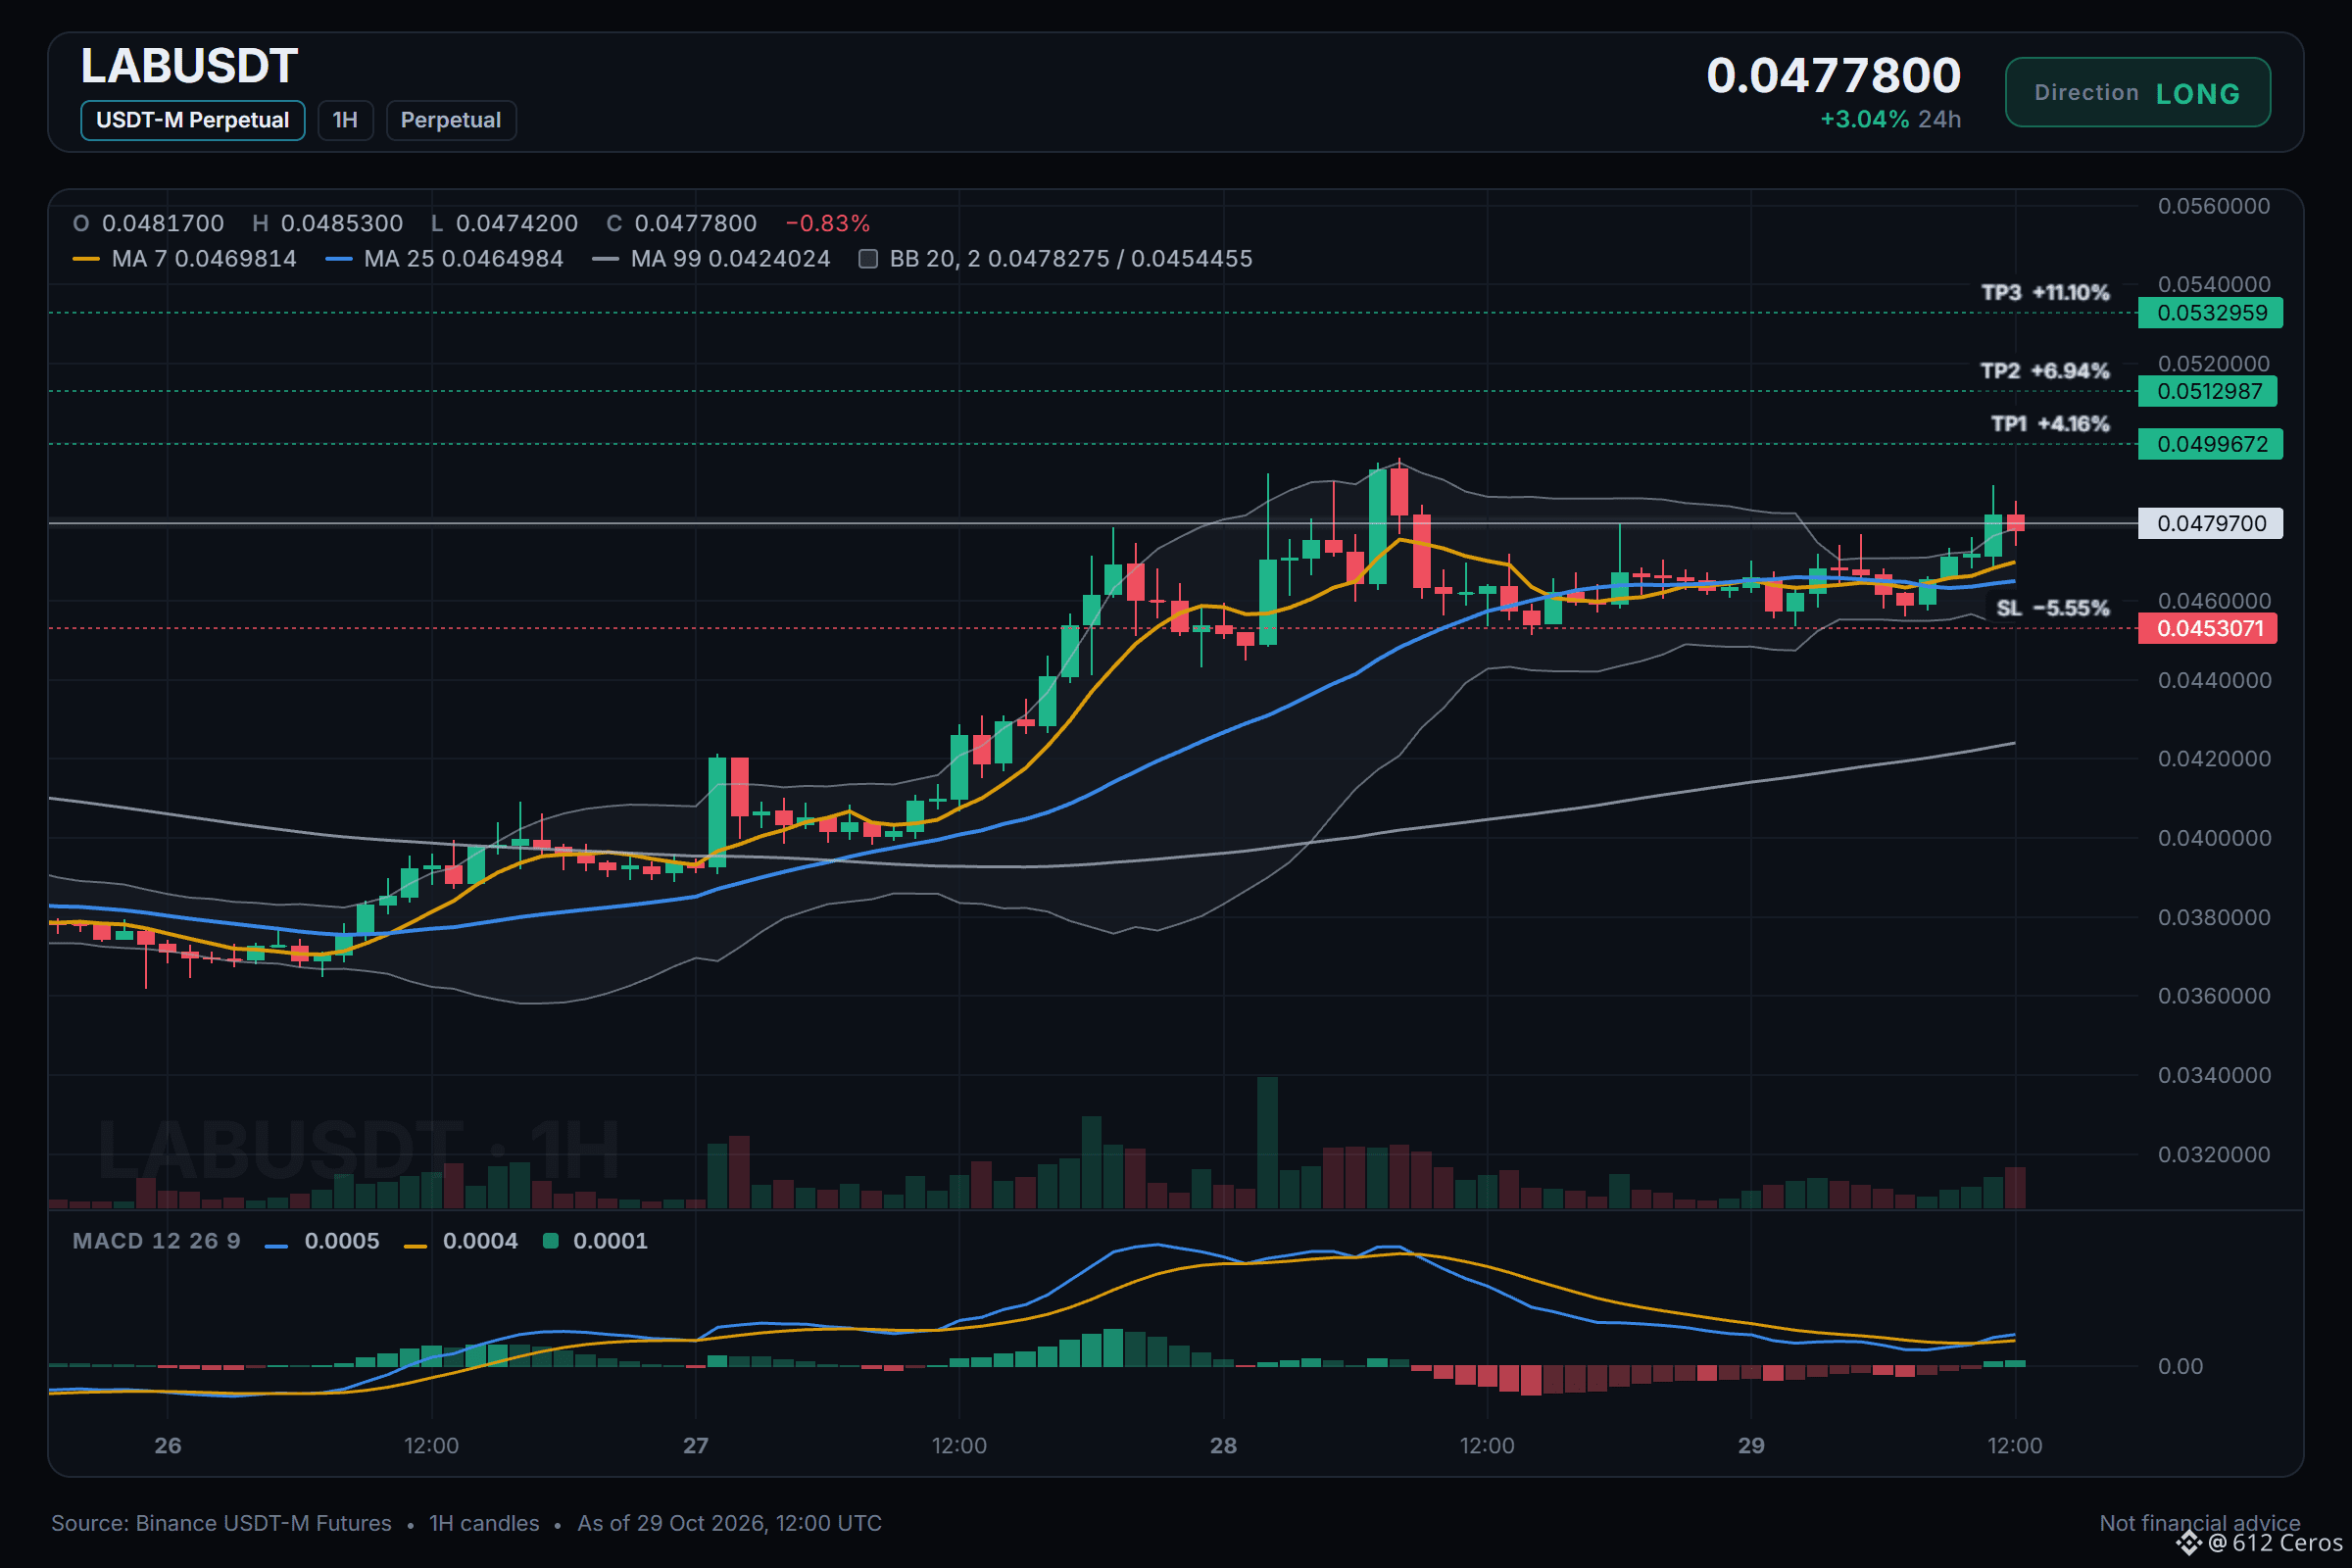
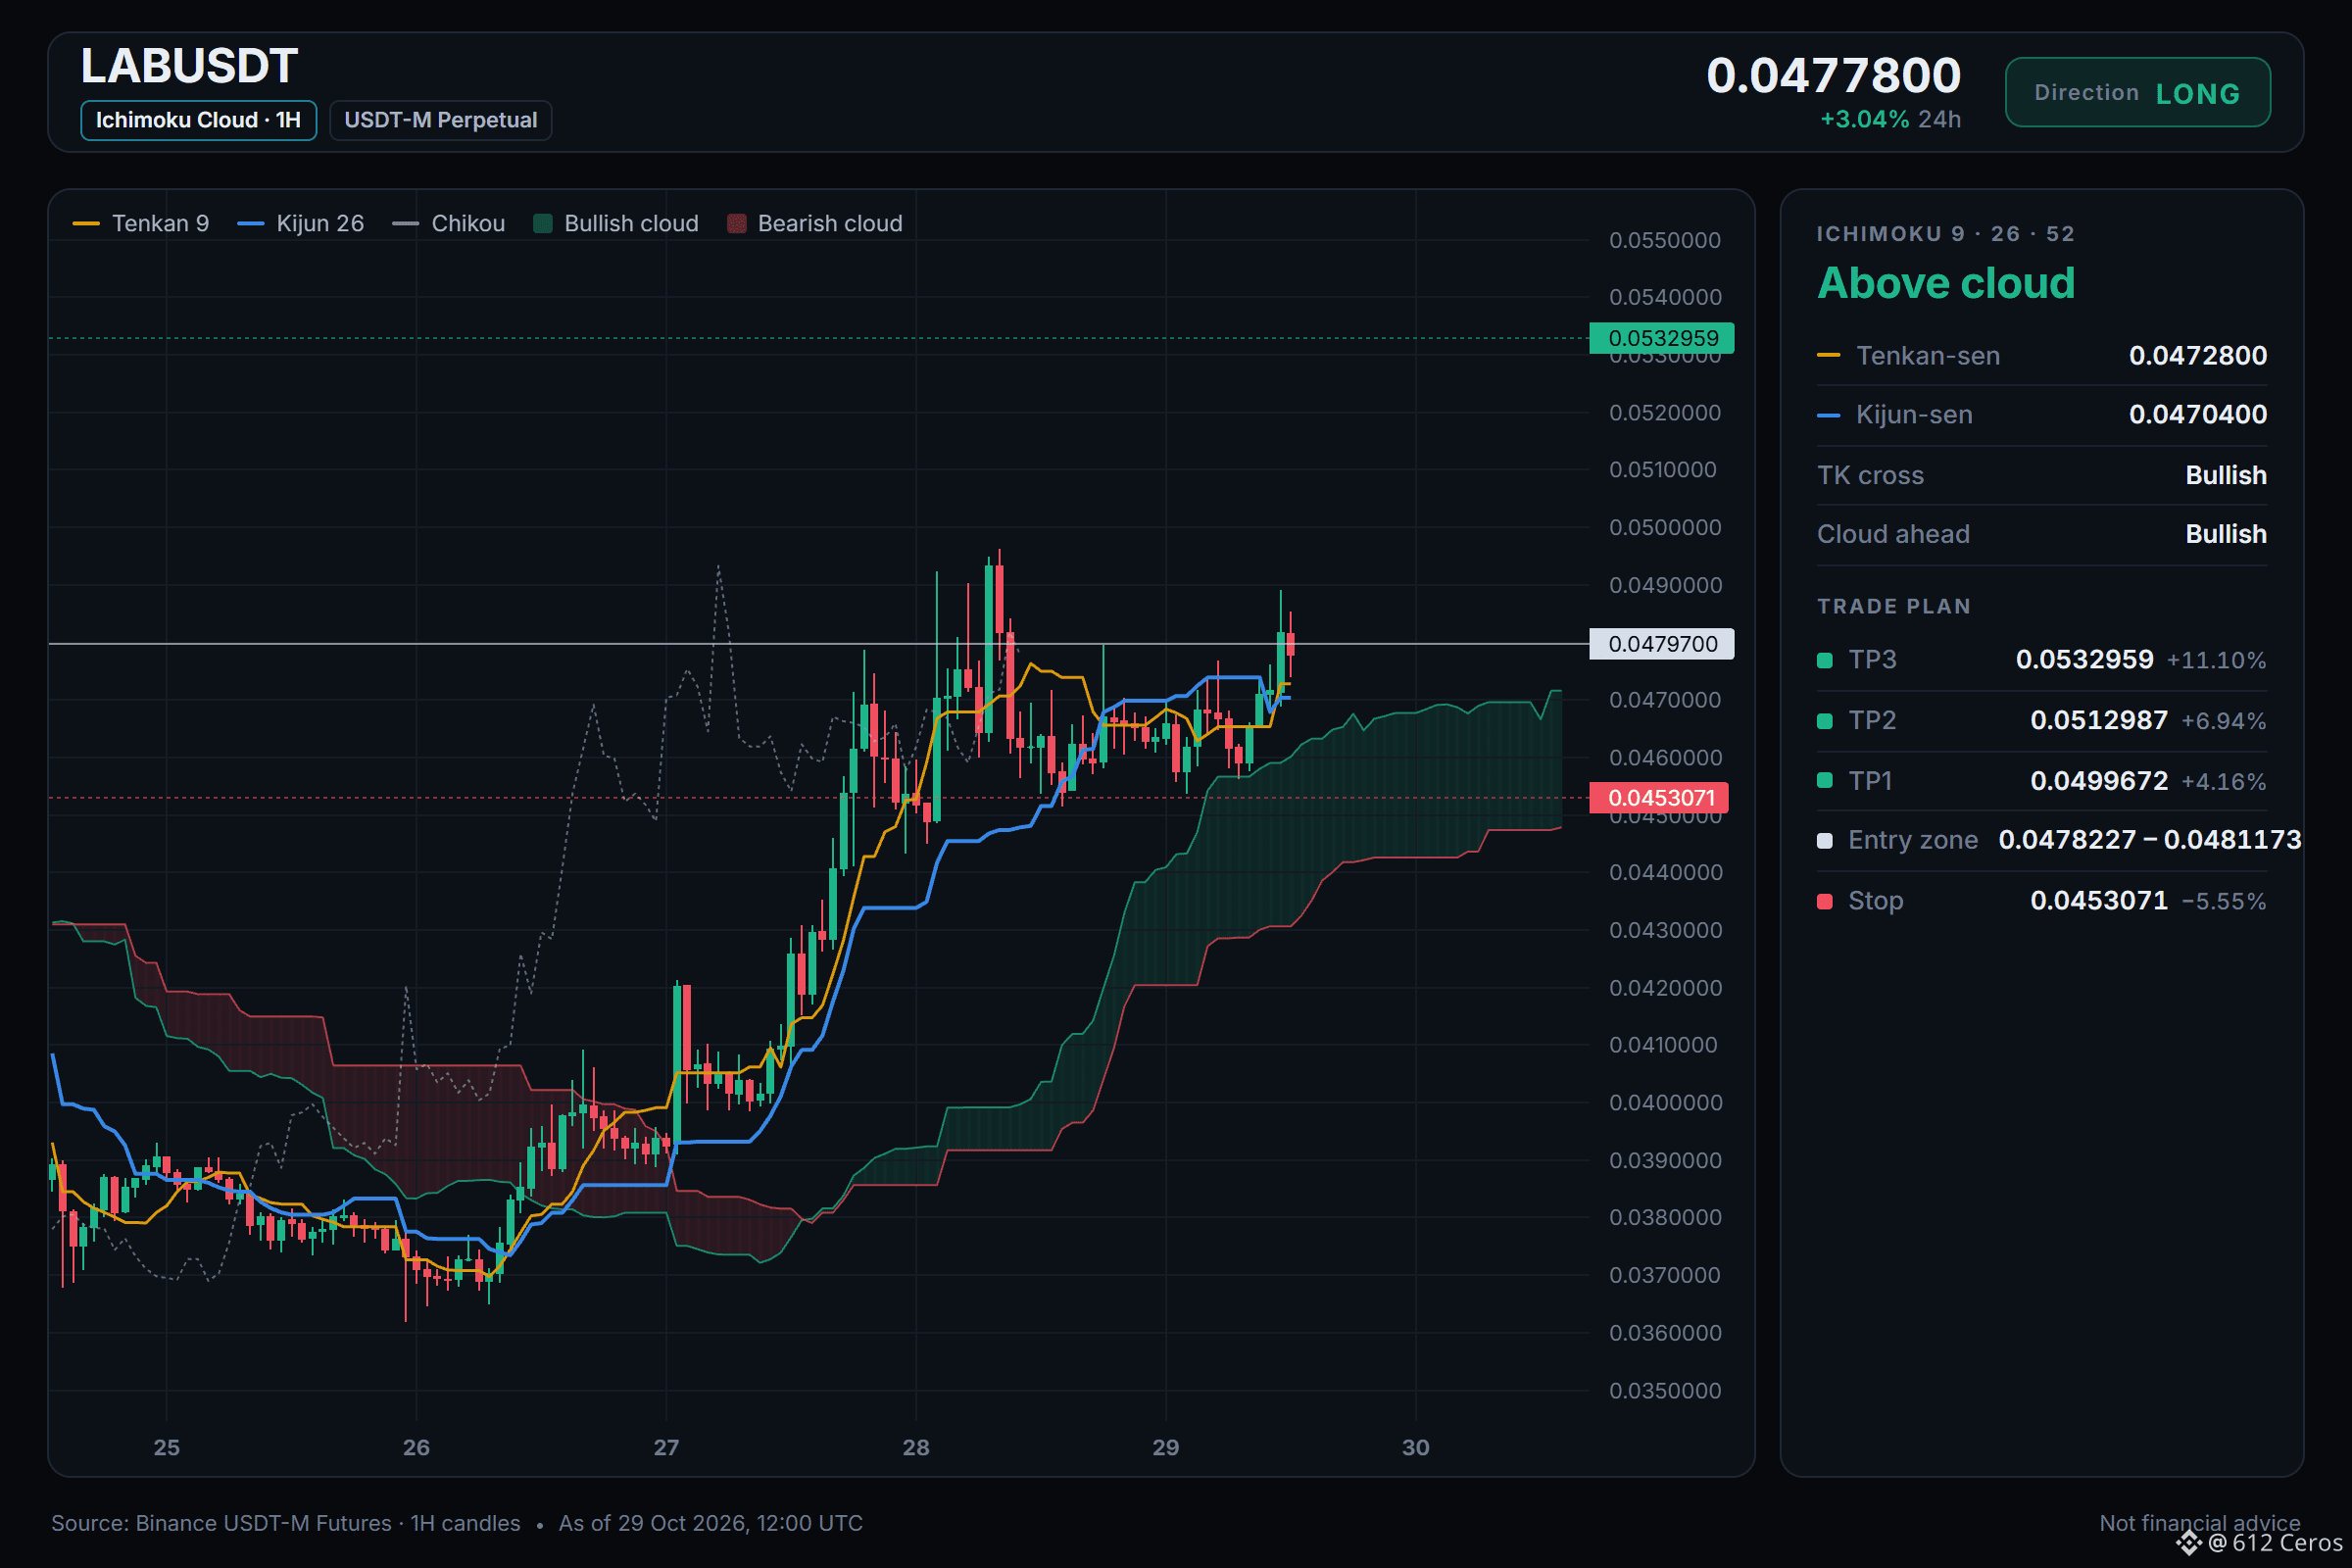
LAB in a counter-trend squeeze against the daily structure
🟢 LONG $LAB /USDT: expecting price to go UP
Bias: LONG · Leaning
Entry: 0.0478227 – 0.0481173
TP1: 0.0499672 (+4.2%)
TP2: 0.0512987 (+6.9%)
TP3: 0.0532959 (+11.1%)
SL: 0.0453071 (-5.6%)
Plan: enter only inside the zone, close 50% at TP1, 25% at TP2, 25% at TP3, and move the stop to entry after TP1.
Caution: counter-trend idea backed by 5 signals only. Smaller size, hard stop.
Why LONG? 5/12 signals agree, 1 against.
• 1h trend up (above EMA50 & EMA200)
• Buyers are driving the move (15m ADX 24.0)
• Buyers have the momentum (4h RSI 65.1)
Risk: Daily trend down (below EMA50 & EMA200)
Quick LAB read:
1. The 1h trend is up, with the price above the EMA50 and EMA200.
2. Momentum on the 1h RSI shows buyers in control above 55.
3. The daily trend is bearish, so this is a reversal bet and size down.
Where would you place your invalidation level on LAB?
Full setup on the chart below.
{future}(LABUSDT)
📲 Want more of my latest signals? Join me here:
[https://app.binance.com/uni-qr/D26WbL9t](https://app.binance.com/uni-qr/D26WbL9t)
⚠️ Personal market analysis only. NFA — manage risk and DYOR.
Educational content, not investment advice or a recommendation to buy, sell, deposit, or withdraw any asset. No paid promotion or referral/affiliate links.
LAB in a counter-trend squeeze against the daily structure
🟢 LONG $LAB /USDT: expecting price to go UP
Bias: LONG · Leaning
Entry: 0.0478227 – 0.0481173
TP1: 0.0499672 (+4.2%)
TP2: 0.0512987 (+6.9%)
TP3: 0.0532959 (+11.1%)
SL: 0.0453071 (-5.6%)
Plan: enter only inside the zone, close 50% at TP1, 25% at TP2, 25% at TP3, and move the stop to entry after TP1.
Caution: counter-trend idea backed by 5 signals only. Smaller size, hard stop.
Why LONG? 5/12 signals agree, 1 against.
• 1h trend up (above EMA50 & EMA200)
• Buyers are driving the move (15m ADX 24.0)
• Buyers have the momentum (4h RSI 65.1)
Risk: Daily trend down (below EMA50 & EMA200)
Quick LAB read:
1. The 1h trend is up, with the price above the EMA50 and EMA200.
2. Momentum on the 1h RSI shows buyers in control above 55.
3. The daily trend is bearish, so this is a reversal bet and size down.
Where would you place your invalidation level on LAB?
Full setup on the chart below.
📲 Want more of my latest signals? Join me here:
https://app.binance.com/uni-qr/D26WbL9t
⚠️ Personal market analysis only. NFA — manage risk and DYOR.
Educational content, not investment advice or a recommendation to buy, sell, deposit, or withdraw any asset. No paid promotion or referral/affiliate links.
1
2
1.1k
·
--
Падение
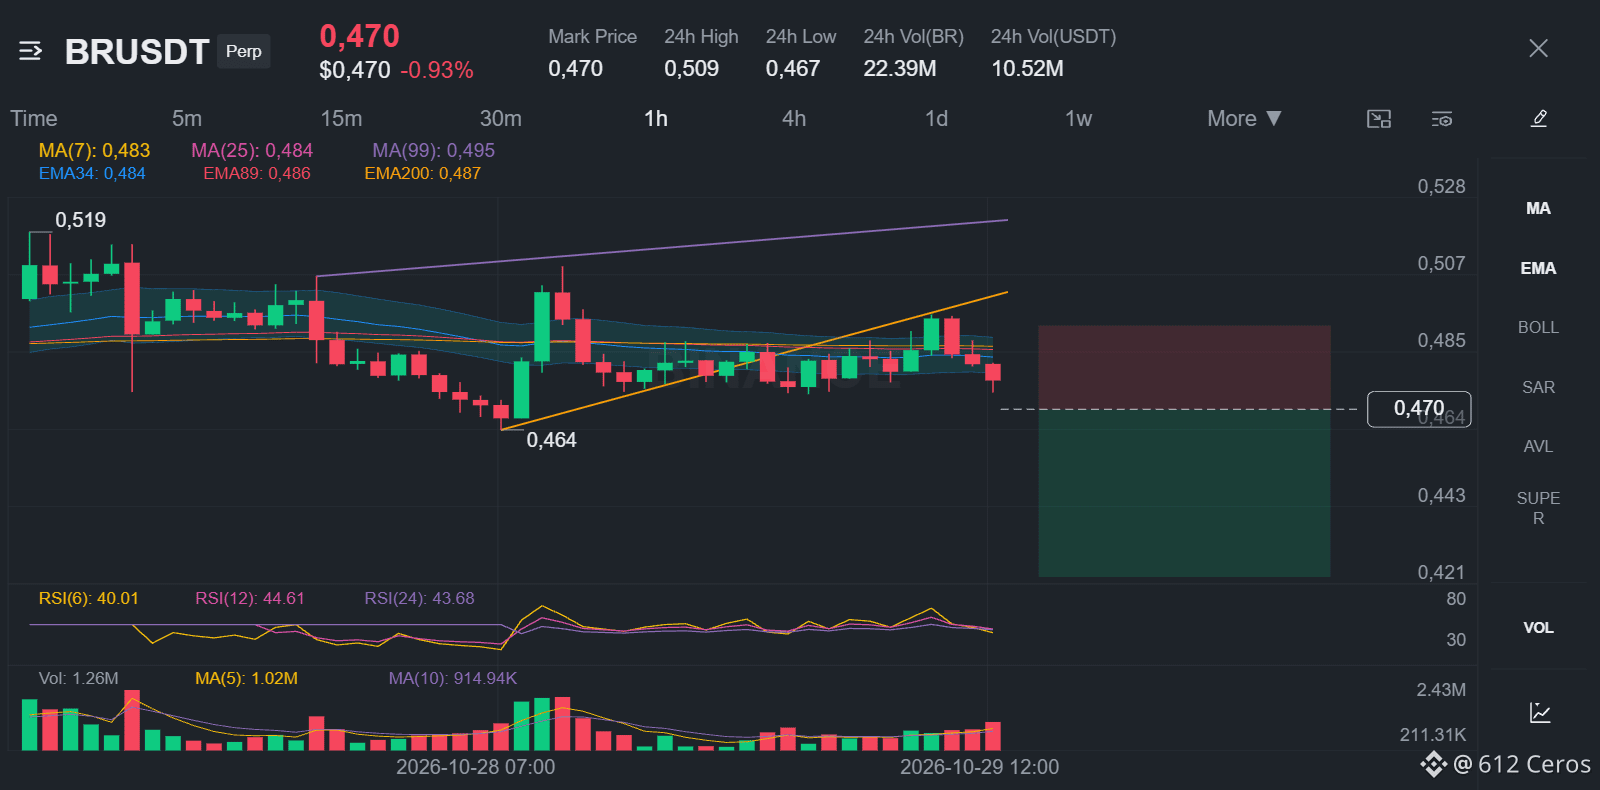
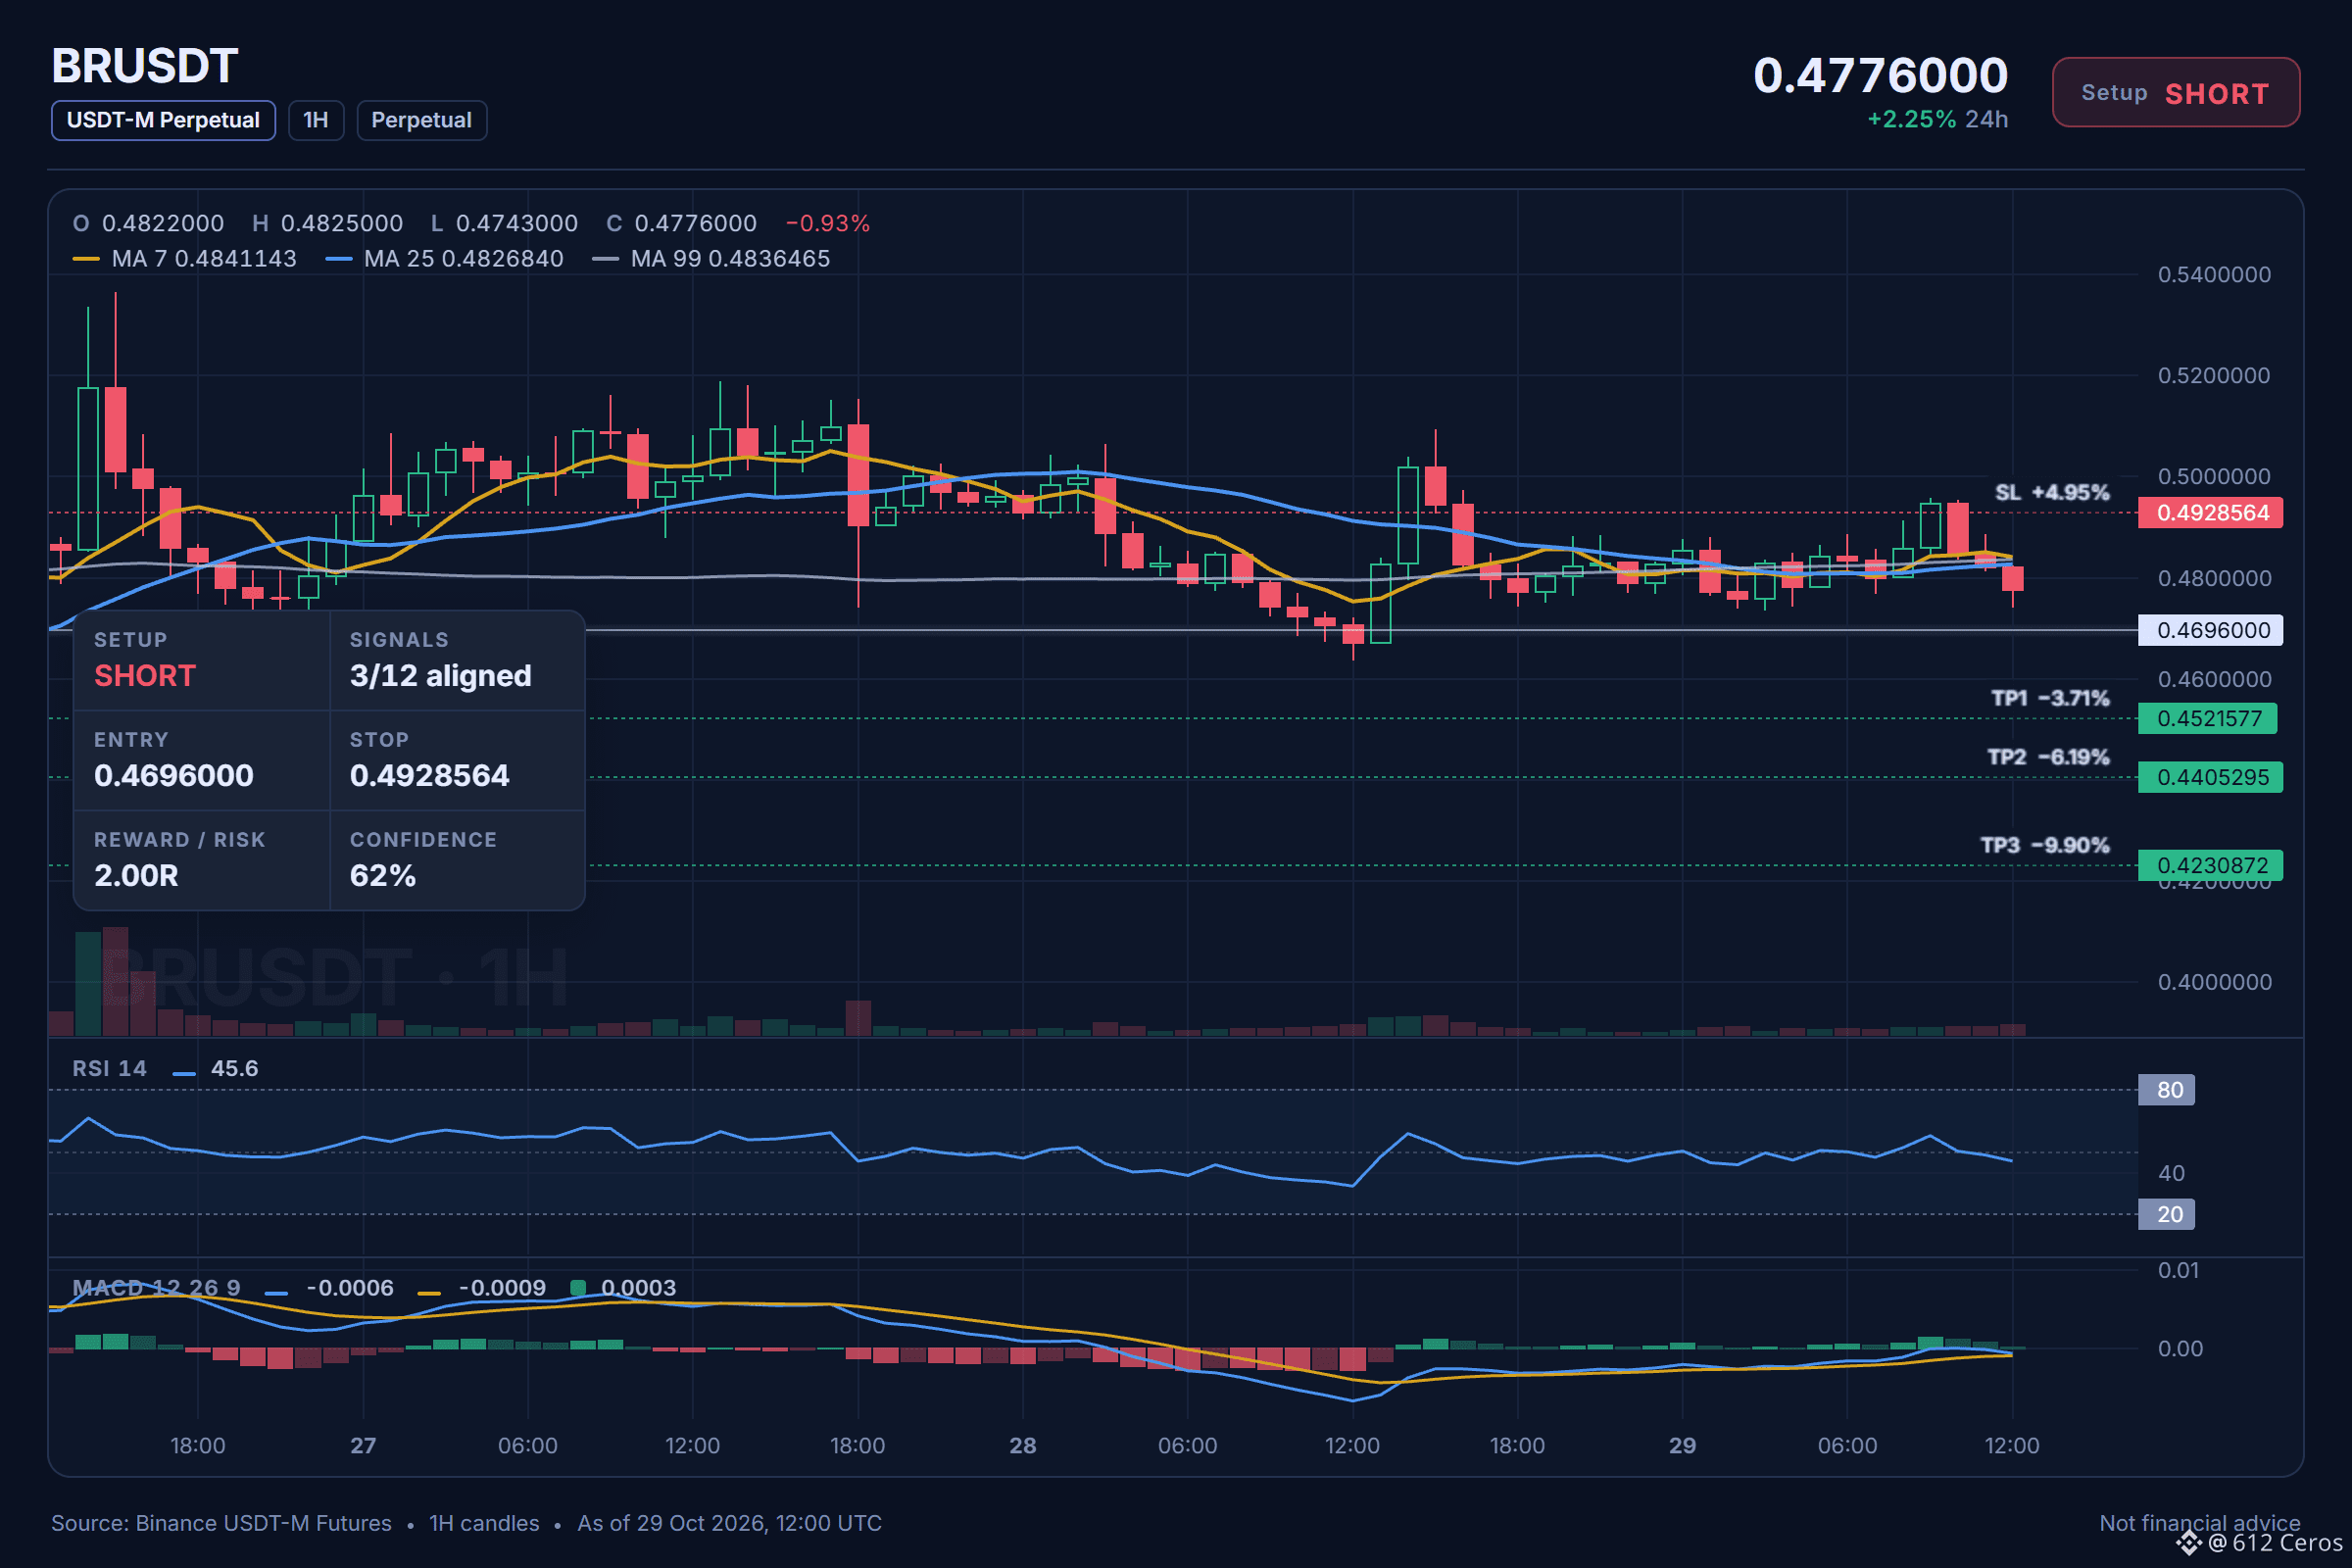
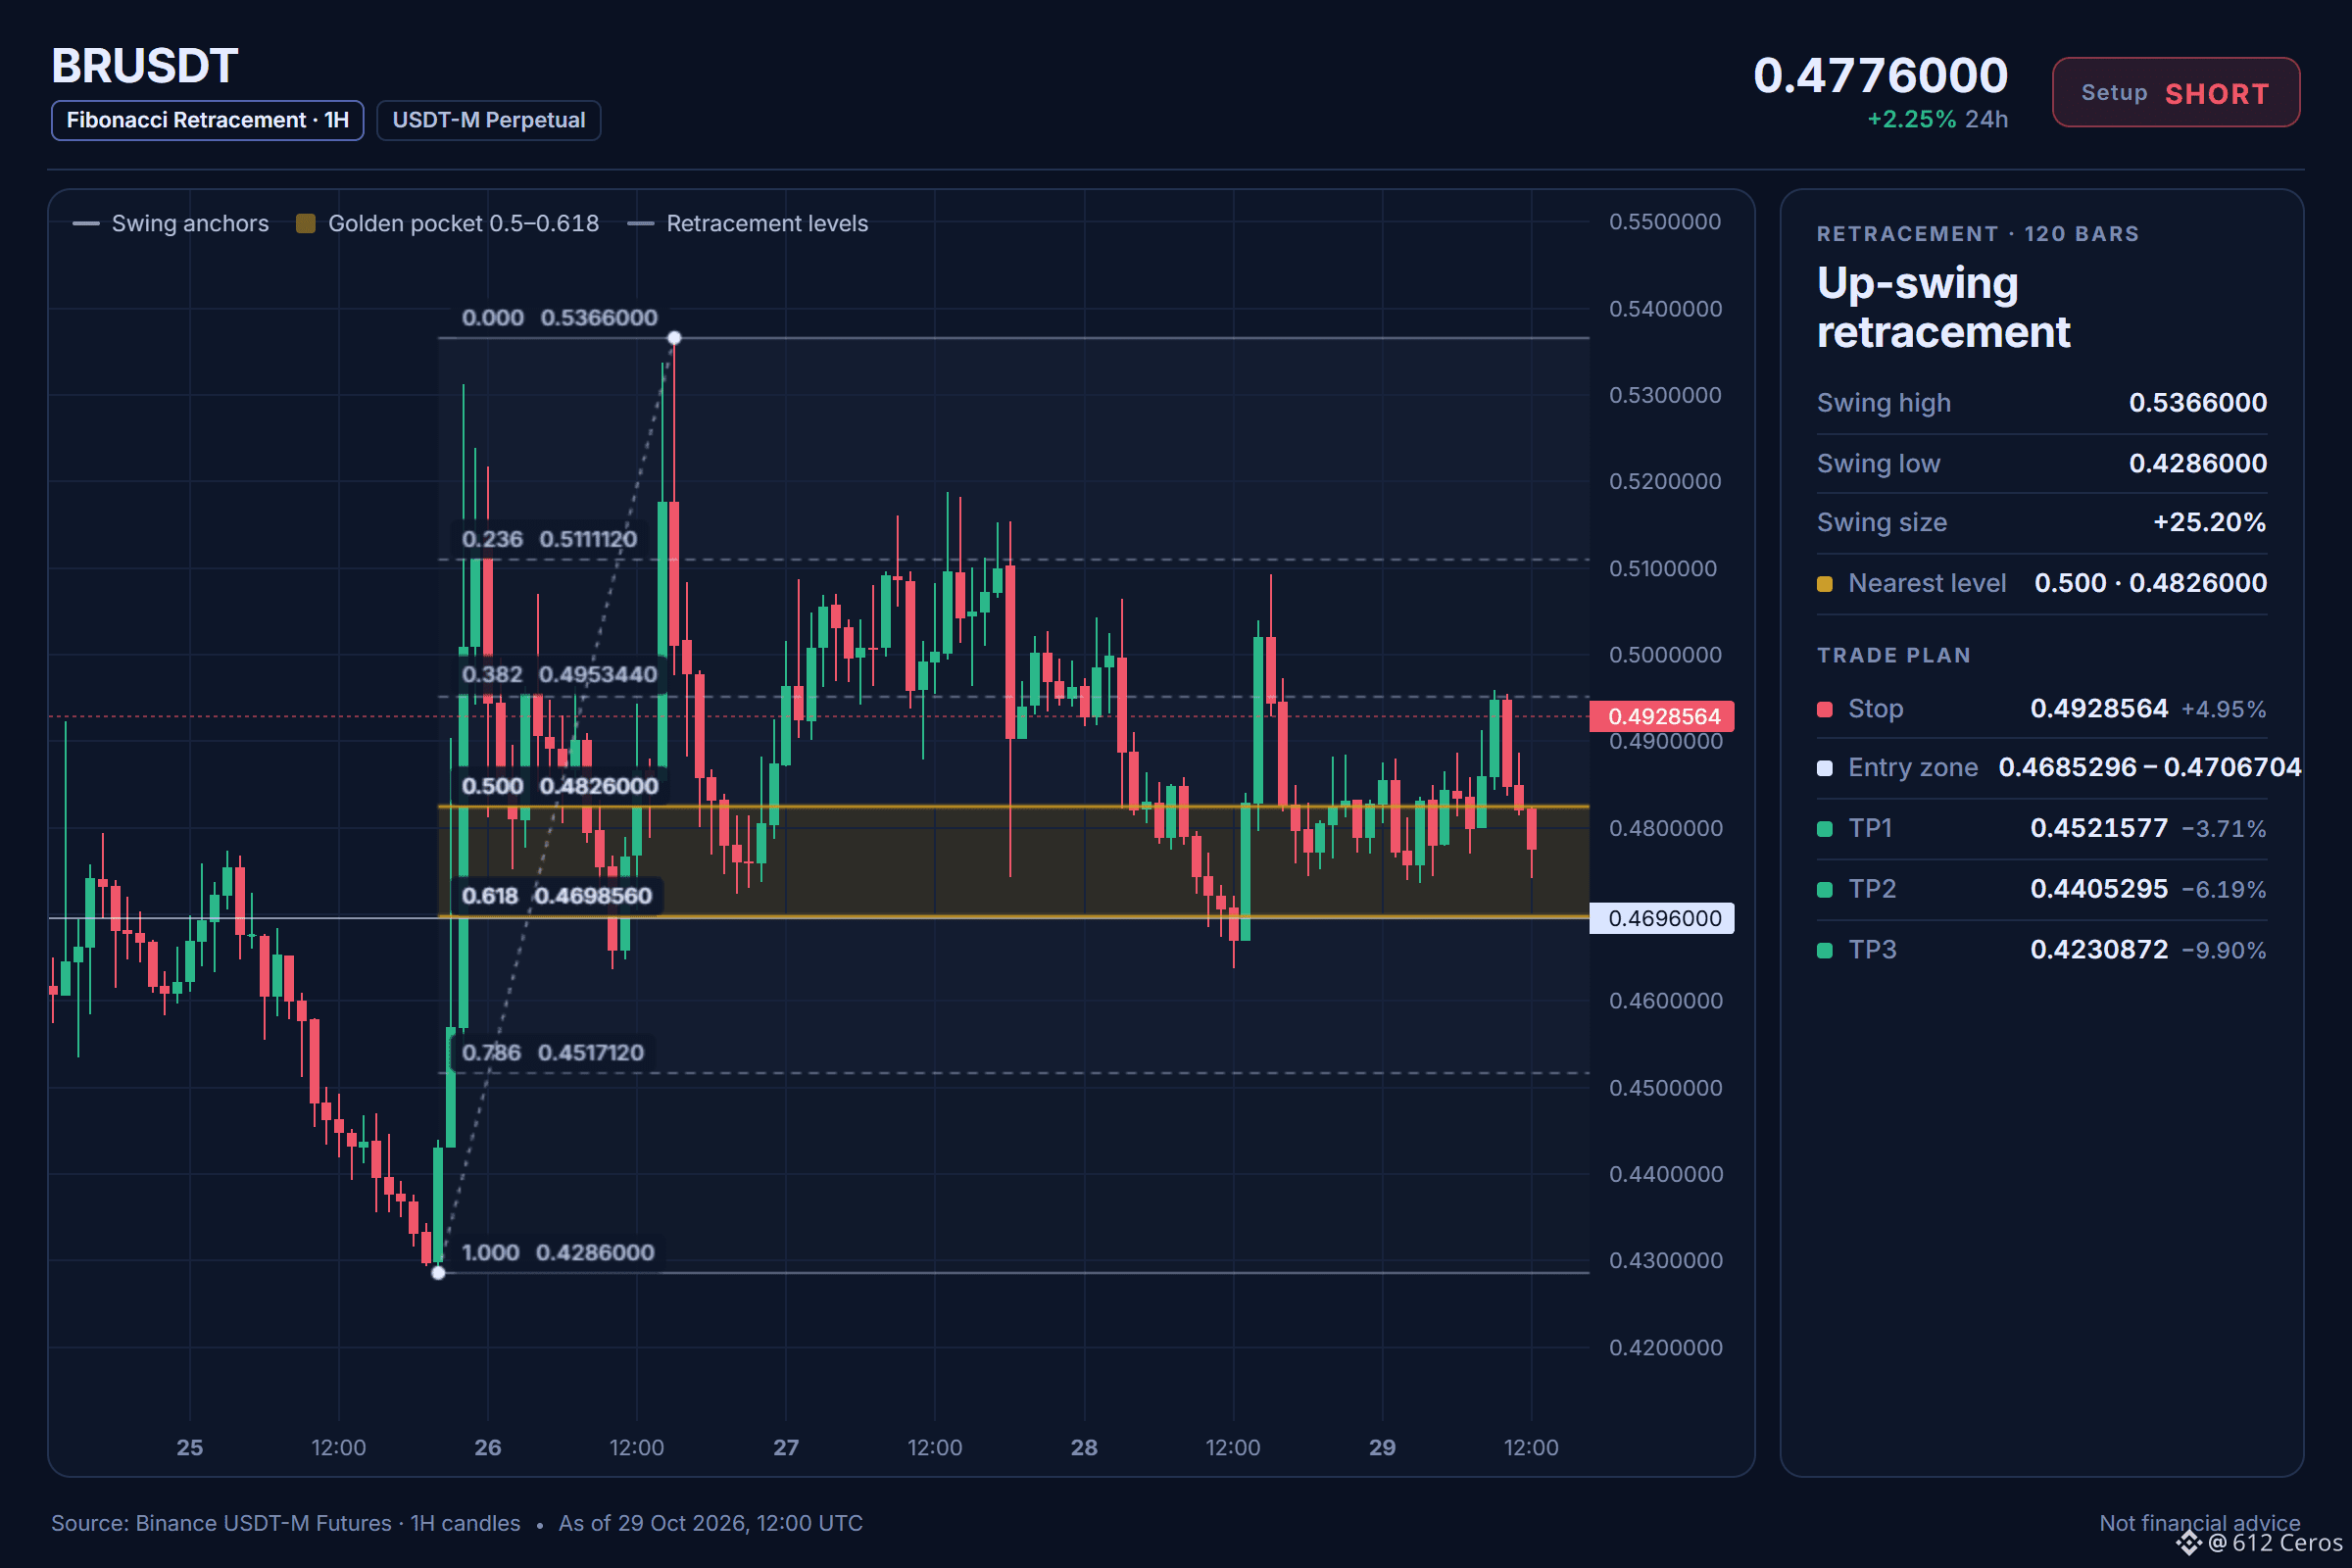
Range-bound BR gets a bear stack on the 4h
🔴 SHORT $BR /USDT: expecting price to go DOWN
Bias: SHORT · Leaning
Entry: 0.4685296 – 0.4706704
TP1: 0.4521577 (-3.7%)
TP2: 0.4405295 (-6.2%)
TP3: 0.4230872 (-9.9%)
SL: 0.4928564 (+5.0%)
Plan: enter only inside the zone, close 50% at TP1, 25% at TP2, 25% at TP3, and move the stop to entry after TP1.
Note: moderate conviction only, keep size light.
Why SHORT? 3/12 signals agree, 0 against.
• 4h trend down (below EMA50 & EMA200)
• 1h trend down (below EMA50 & EMA200)
• Sellers are pushing right now (−1.86% 15m candle)
Q: Why short when the daily trend is range?
A: The 4h stack shows price below EMA50 and EMA200.
Q: When does this short setup turn wrong?
A: A move back above the 1h EMA50 invalidates the bearish stack.
Where do you put your BR short invalidation?
Chart with every level below.
{future}(BRUSDT)
📲 Want more of my latest signals? Join me here:
[https://app.binance.com/uni-qr/D26WbL9t](https://app.binance.com/uni-qr/D26WbL9t)
⚠️ Personal market analysis only. NFA — manage risk and DYOR.
Educational content, not investment advice or a recommendation to buy, sell, deposit, or withdraw any asset. No paid promotion or referral/affiliate links.
Range-bound BR gets a bear stack on the 4h
🔴 SHORT $BR /USDT: expecting price to go DOWN
Bias: SHORT · Leaning
Entry: 0.4685296 – 0.4706704
TP1: 0.4521577 (-3.7%)
TP2: 0.4405295 (-6.2%)
TP3: 0.4230872 (-9.9%)
SL: 0.4928564 (+5.0%)
Plan: enter only inside the zone, close 50% at TP1, 25% at TP2, 25% at TP3, and move the stop to entry after TP1.
Note: moderate conviction only, keep size light.
Why SHORT? 3/12 signals agree, 0 against.
• 4h trend down (below EMA50 & EMA200)
• 1h trend down (below EMA50 & EMA200)
• Sellers are pushing right now (−1.86% 15m candle)
Q: Why short when the daily trend is range?
A: The 4h stack shows price below EMA50 and EMA200.
Q: When does this short setup turn wrong?
A: A move back above the 1h EMA50 invalidates the bearish stack.
Where do you put your BR short invalidation?
Chart with every level below.
📲 Want more of my latest signals? Join me here:
https://app.binance.com/uni-qr/D26WbL9t
⚠️ Personal market analysis only. NFA — manage risk and DYOR.
Educational content, not investment advice or a recommendation to buy, sell, deposit, or withdraw any asset. No paid promotion or referral/affiliate links.
1
815
·
--
Рост
ZEC holding above its moving averages?
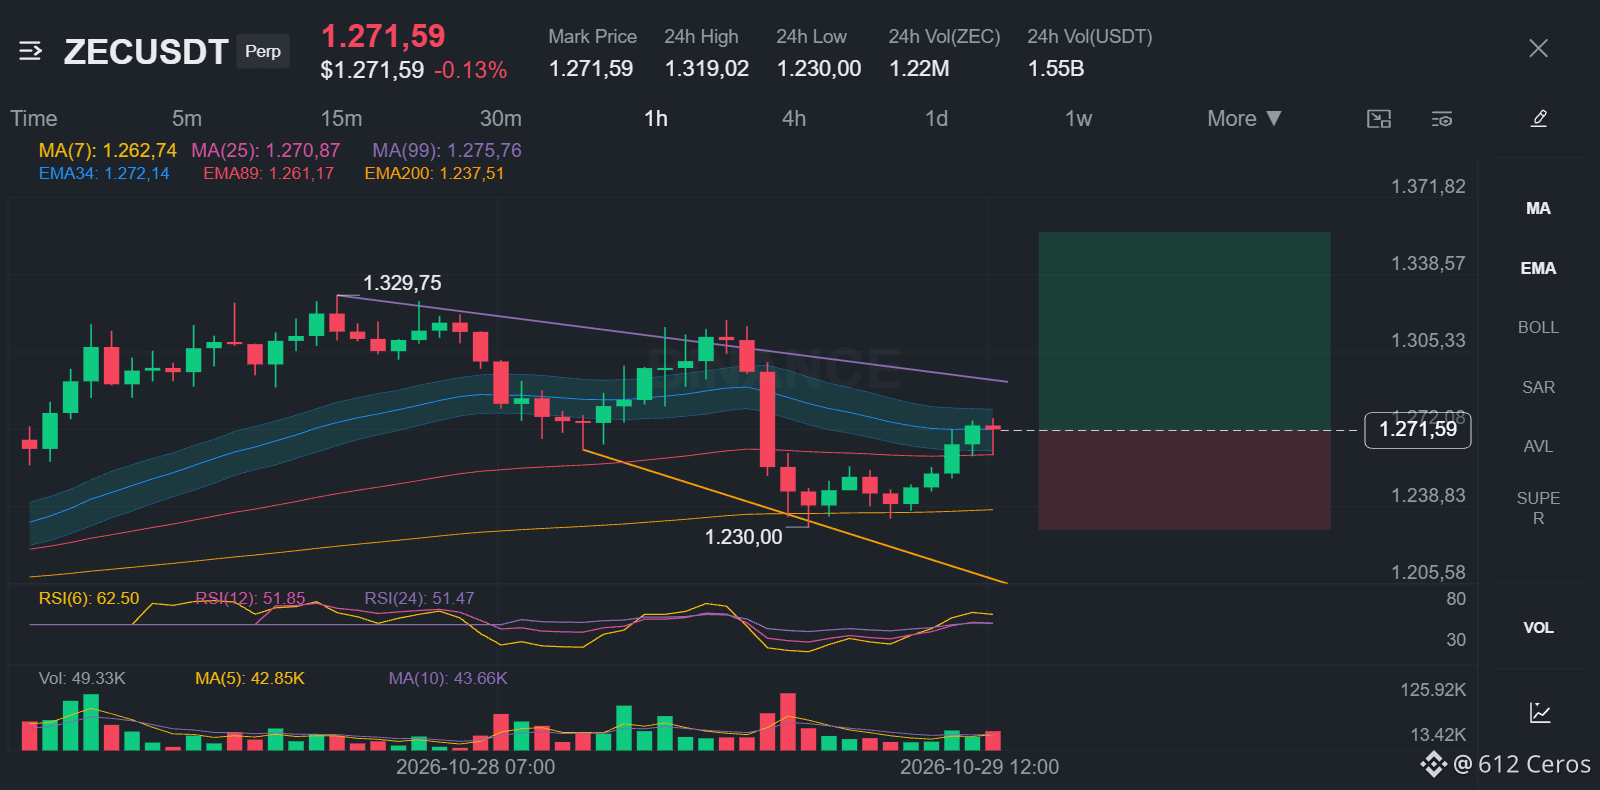
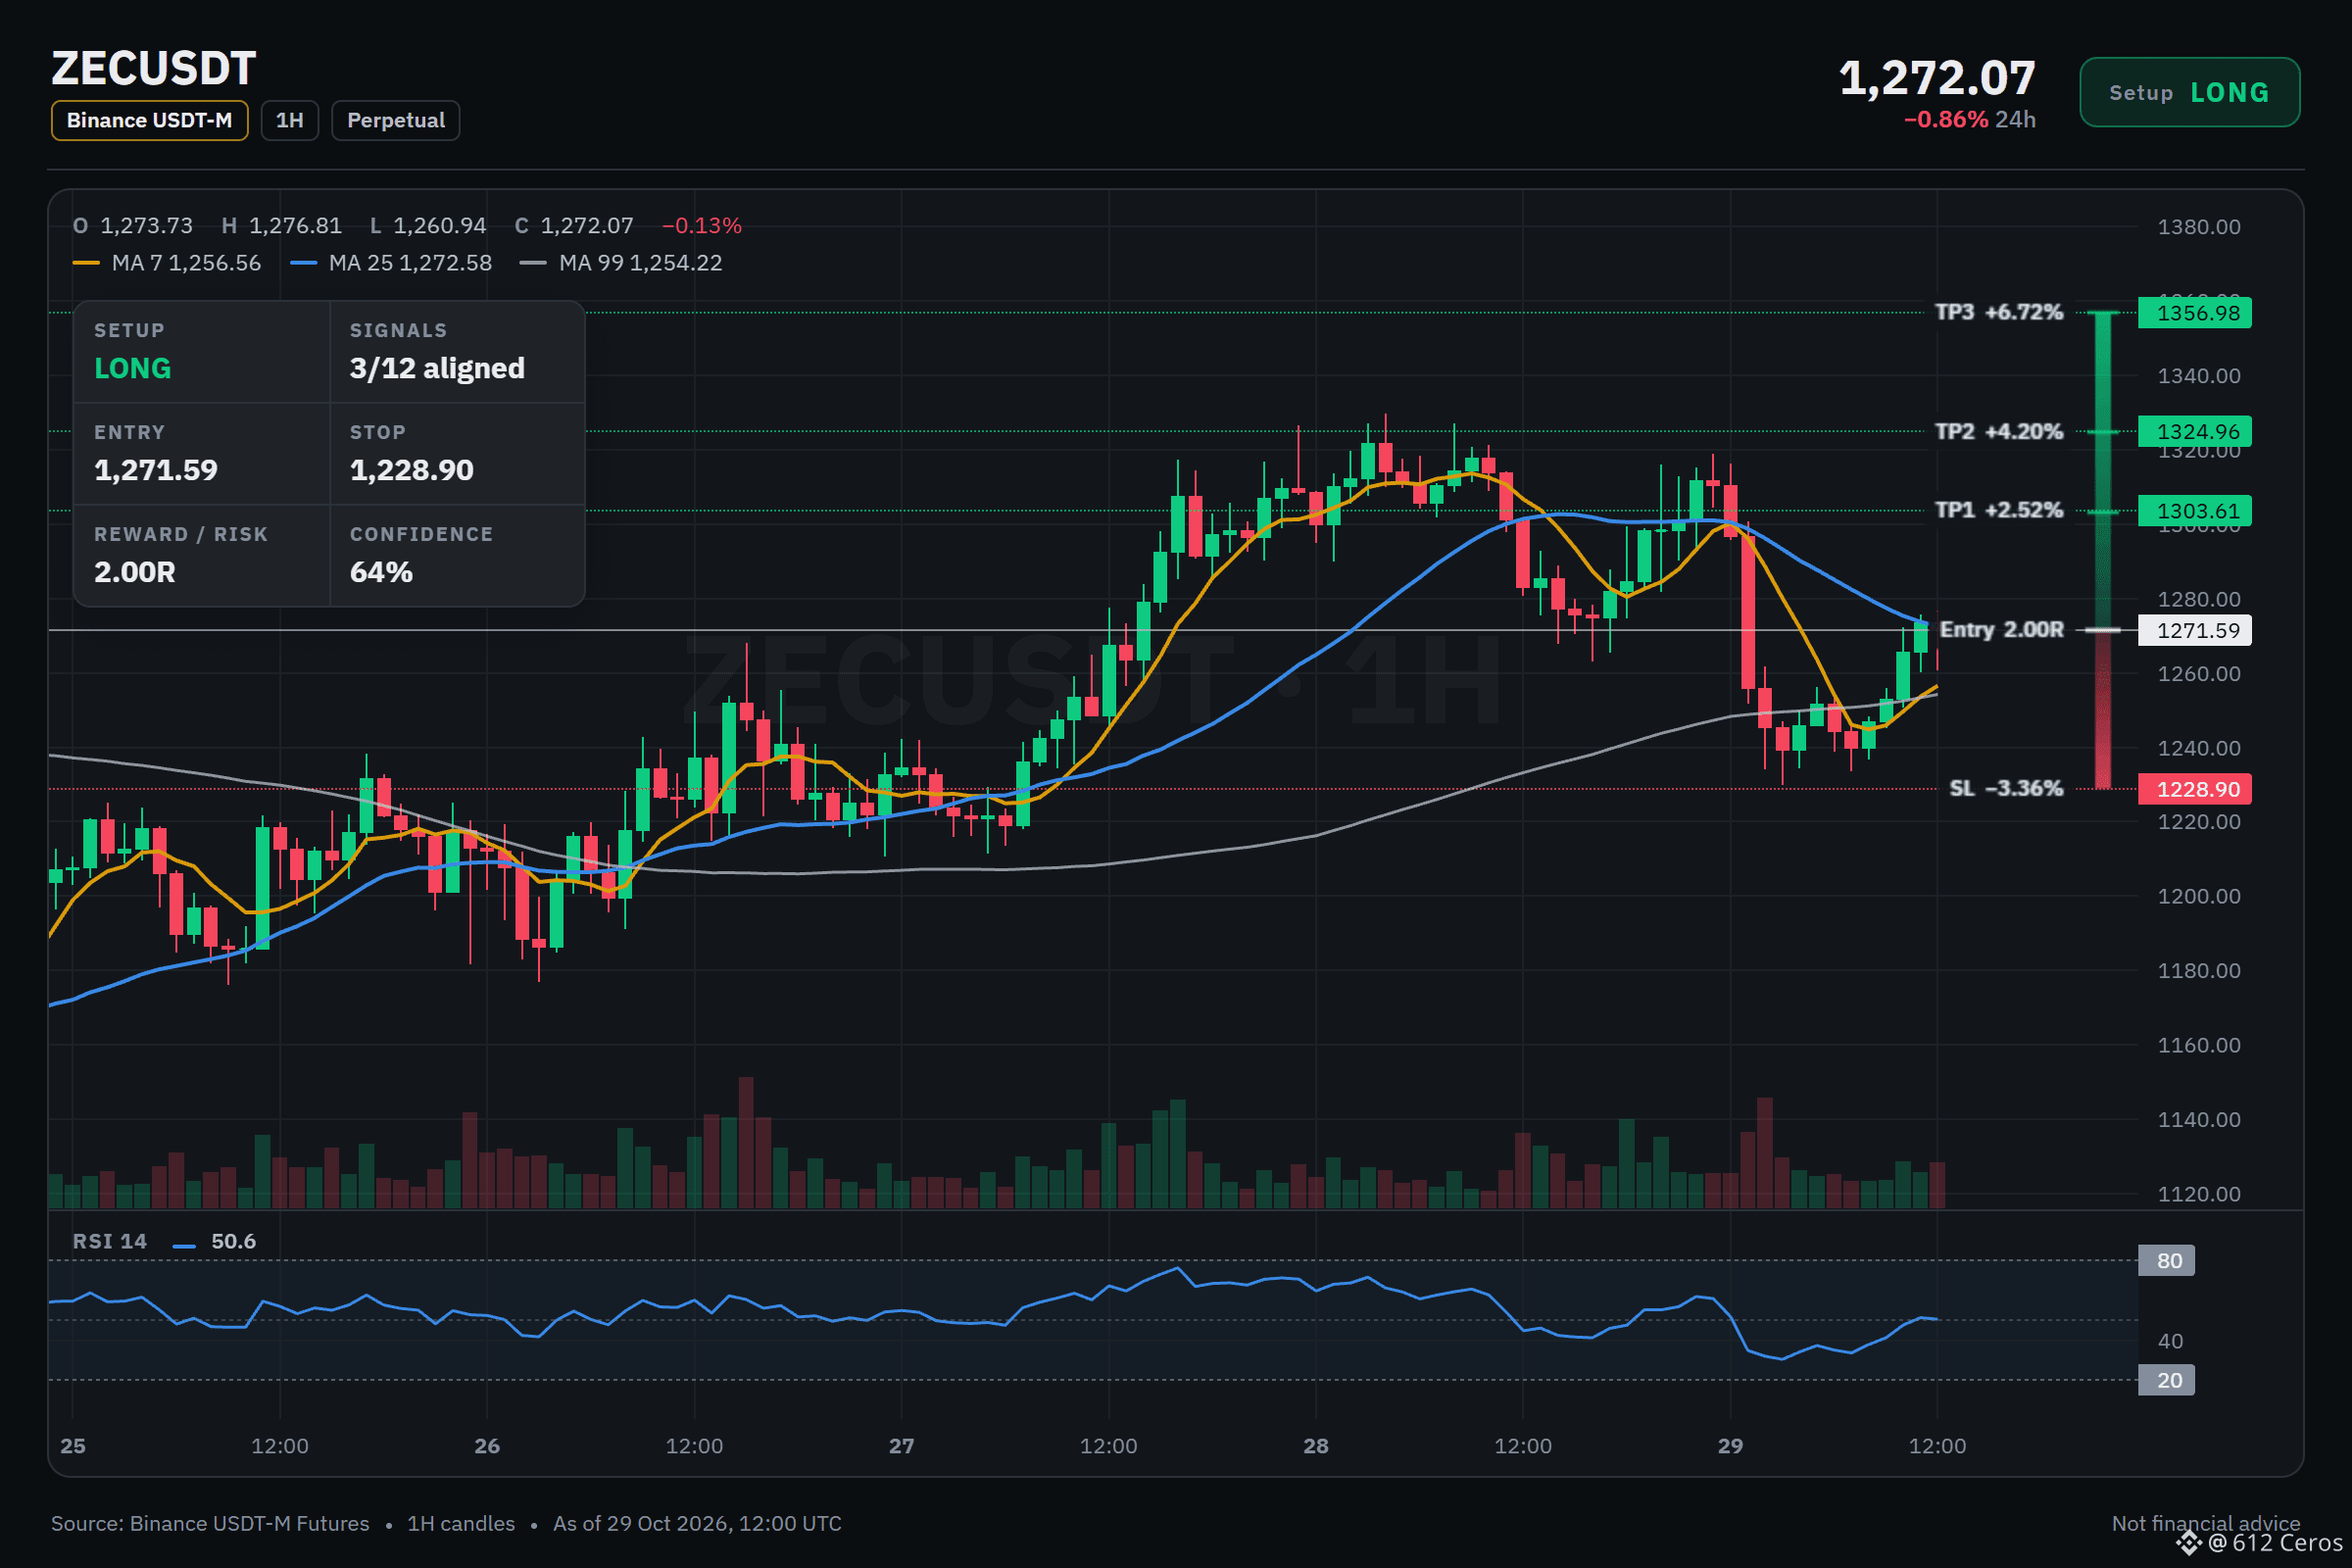
🟢 LONG $ZEC /USDT: expecting price to go UP
Bias: LONG · Leaning
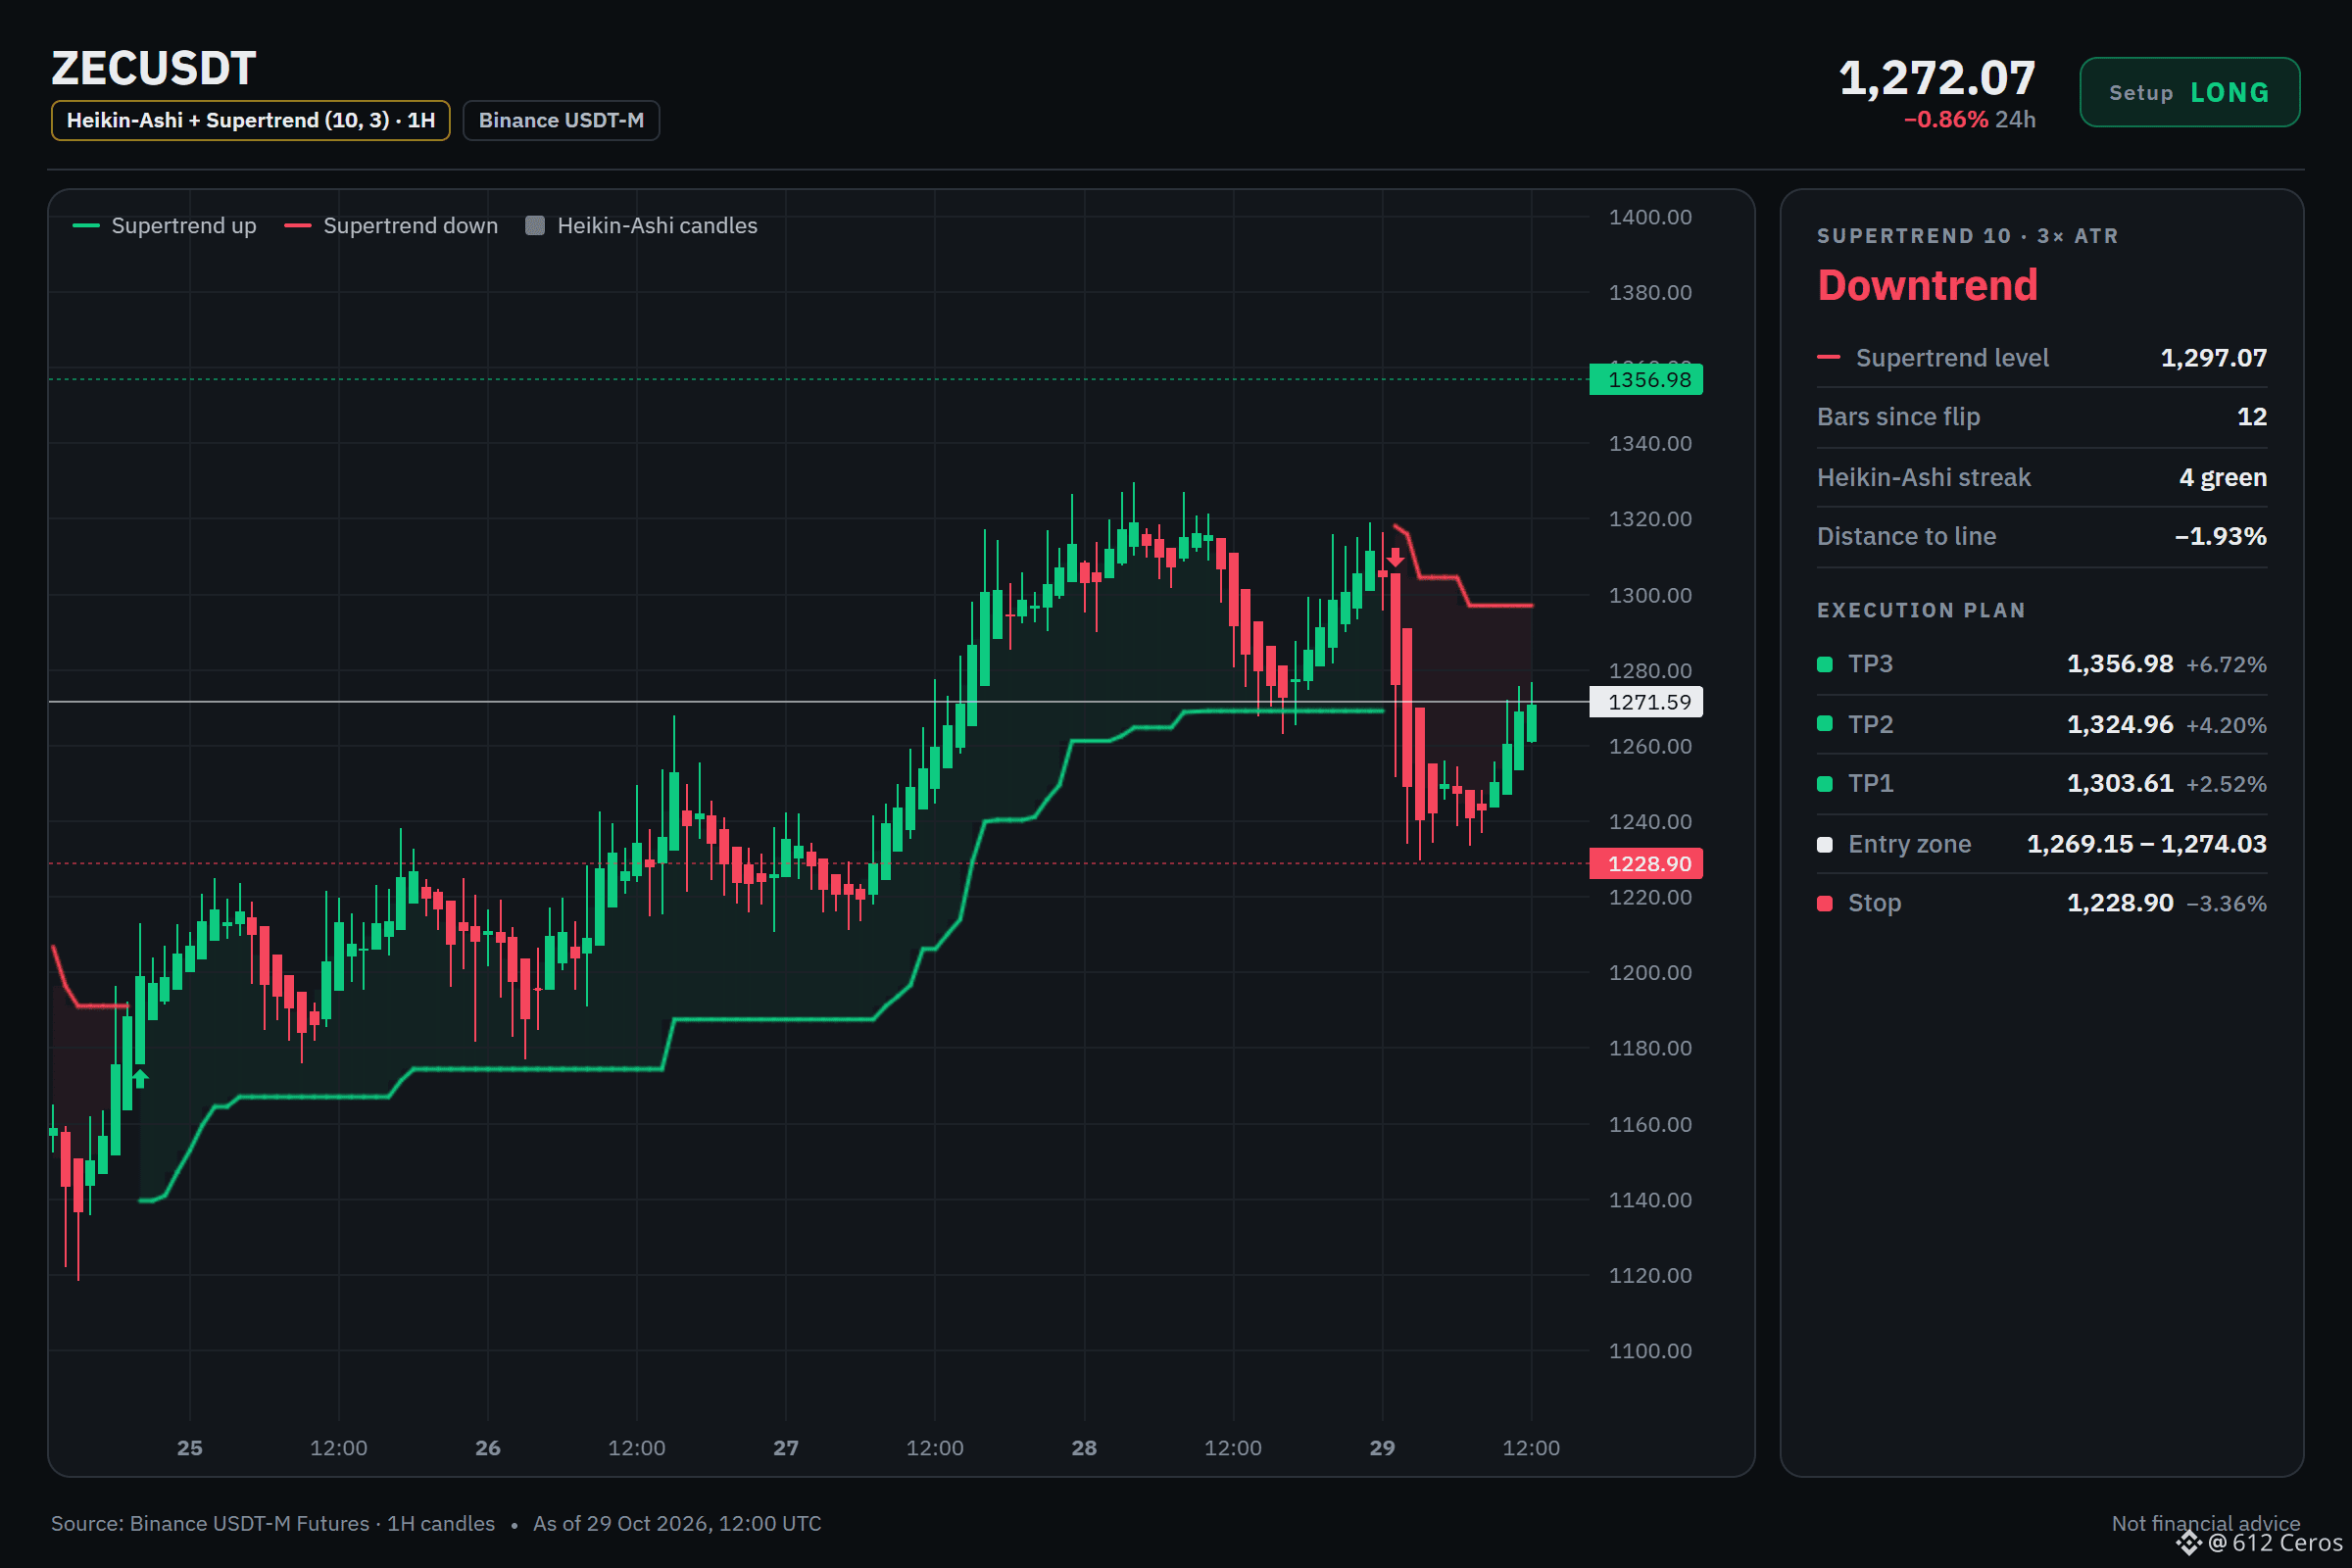
Entry: 1269.15 – 1274.03
TP1: 1303.61 (+2.5%)
TP2: 1324.96 (+4.2%)
TP3: 1356.98 (+6.7%)
SL: 1228.90 (-3.4%)
Plan: enter only inside the zone, close 50% at TP1, 25% at TP2, 25% at TP3, and move the stop to entry after TP1.
Note: moderate conviction only, keep size light.
Why LONG? 3/12 signals agree, 0 against.
• Daily trend up (above EMA50 & EMA200)
• 1h trend up (above EMA50 & EMA200)
• Buyers are driving the move (15m ADX 26.2)
Why I like it:
ZEC shows a leaning long setup with a lean conviction. The daily trend is bullish, and the 1h trend is also bullish. A risk is that the 4h trend is mixed, and the 1h RSI is neutral at 50.6.
Where would you place your invalidation?
Chart with every level below.
{future}(ZECUSDT)
📲 Want more of my latest signals? Join me here:
[https://app.binance.com/uni-qr/D26WbL9t](https://app.binance.com/uni-qr/D26WbL9t)
⚠️ Personal market analysis only. NFA — manage risk and DYOR.
Educational content, not investment advice or a recommendation to buy, sell, deposit, or withdraw any asset. No paid promotion or referral/affiliate links.
ZEC holding above its moving averages?
🟢 LONG $ZEC /USDT: expecting price to go UP
Bias: LONG · Leaning
Entry: 1269.15 – 1274.03
TP1: 1303.61 (+2.5%)
TP2: 1324.96 (+4.2%)
TP3: 1356.98 (+6.7%)
SL: 1228.90 (-3.4%)
Plan: enter only inside the zone, close 50% at TP1, 25% at TP2, 25% at TP3, and move the stop to entry after TP1.
Note: moderate conviction only, keep size light.
Why LONG? 3/12 signals agree, 0 against.
• Daily trend up (above EMA50 & EMA200)
• 1h trend up (above EMA50 & EMA200)
• Buyers are driving the move (15m ADX 26.2)
Why I like it:
ZEC shows a leaning long setup with a lean conviction. The daily trend is bullish, and the 1h trend is also bullish. A risk is that the 4h trend is mixed, and the 1h RSI is neutral at 50.6.
Where would you place your invalidation?
Chart with every level below.
📲 Want more of my latest signals? Join me here:
https://app.binance.com/uni-qr/D26WbL9t
⚠️ Personal market analysis only. NFA — manage risk and DYOR.
Educational content, not investment advice or a recommendation to buy, sell, deposit, or withdraw any asset. No paid promotion or referral/affiliate links.
1
1.2k
·
--
Падение
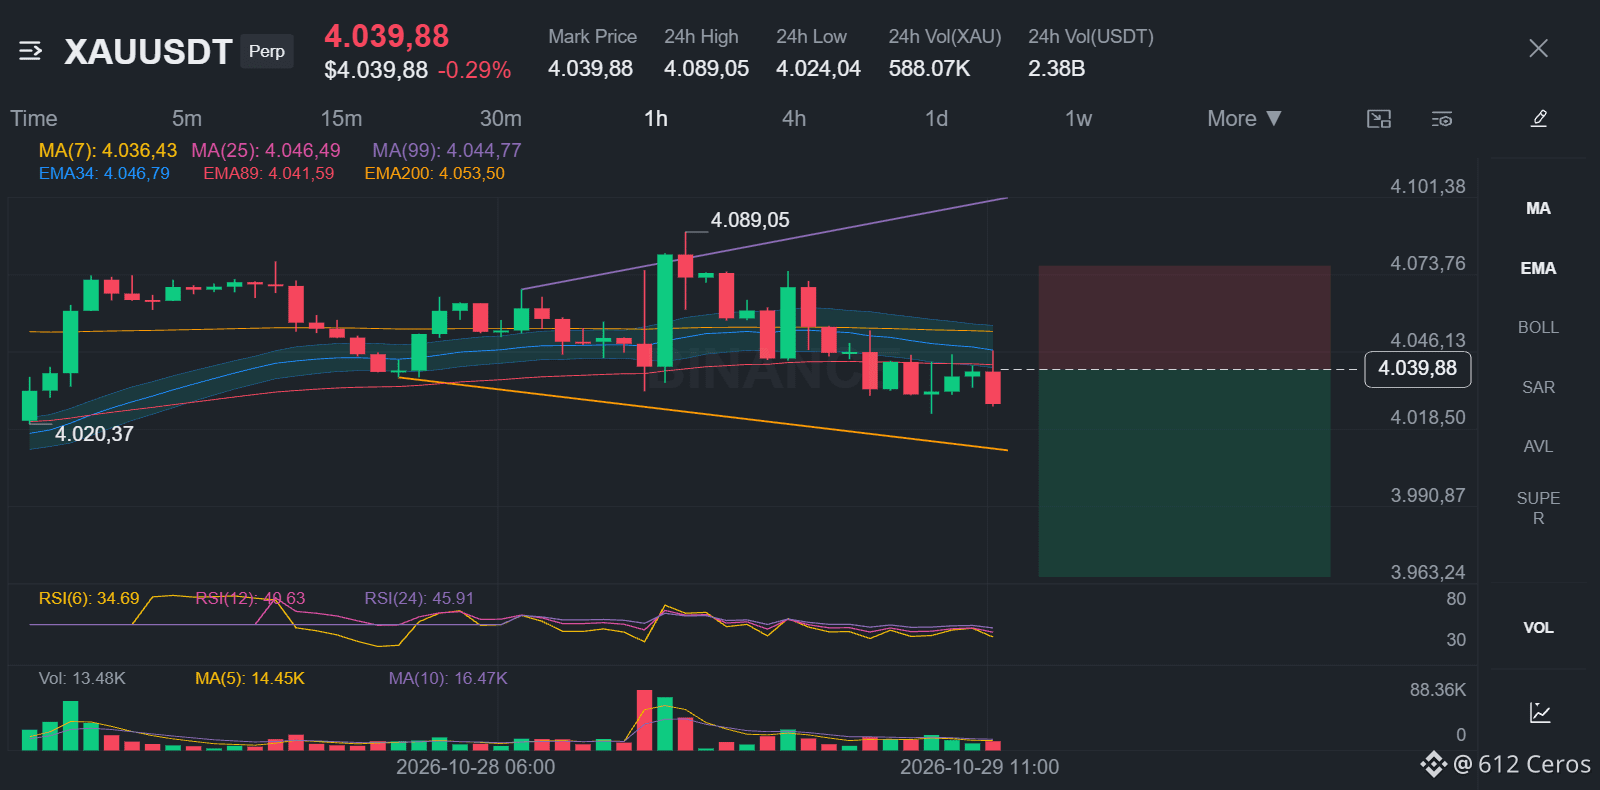
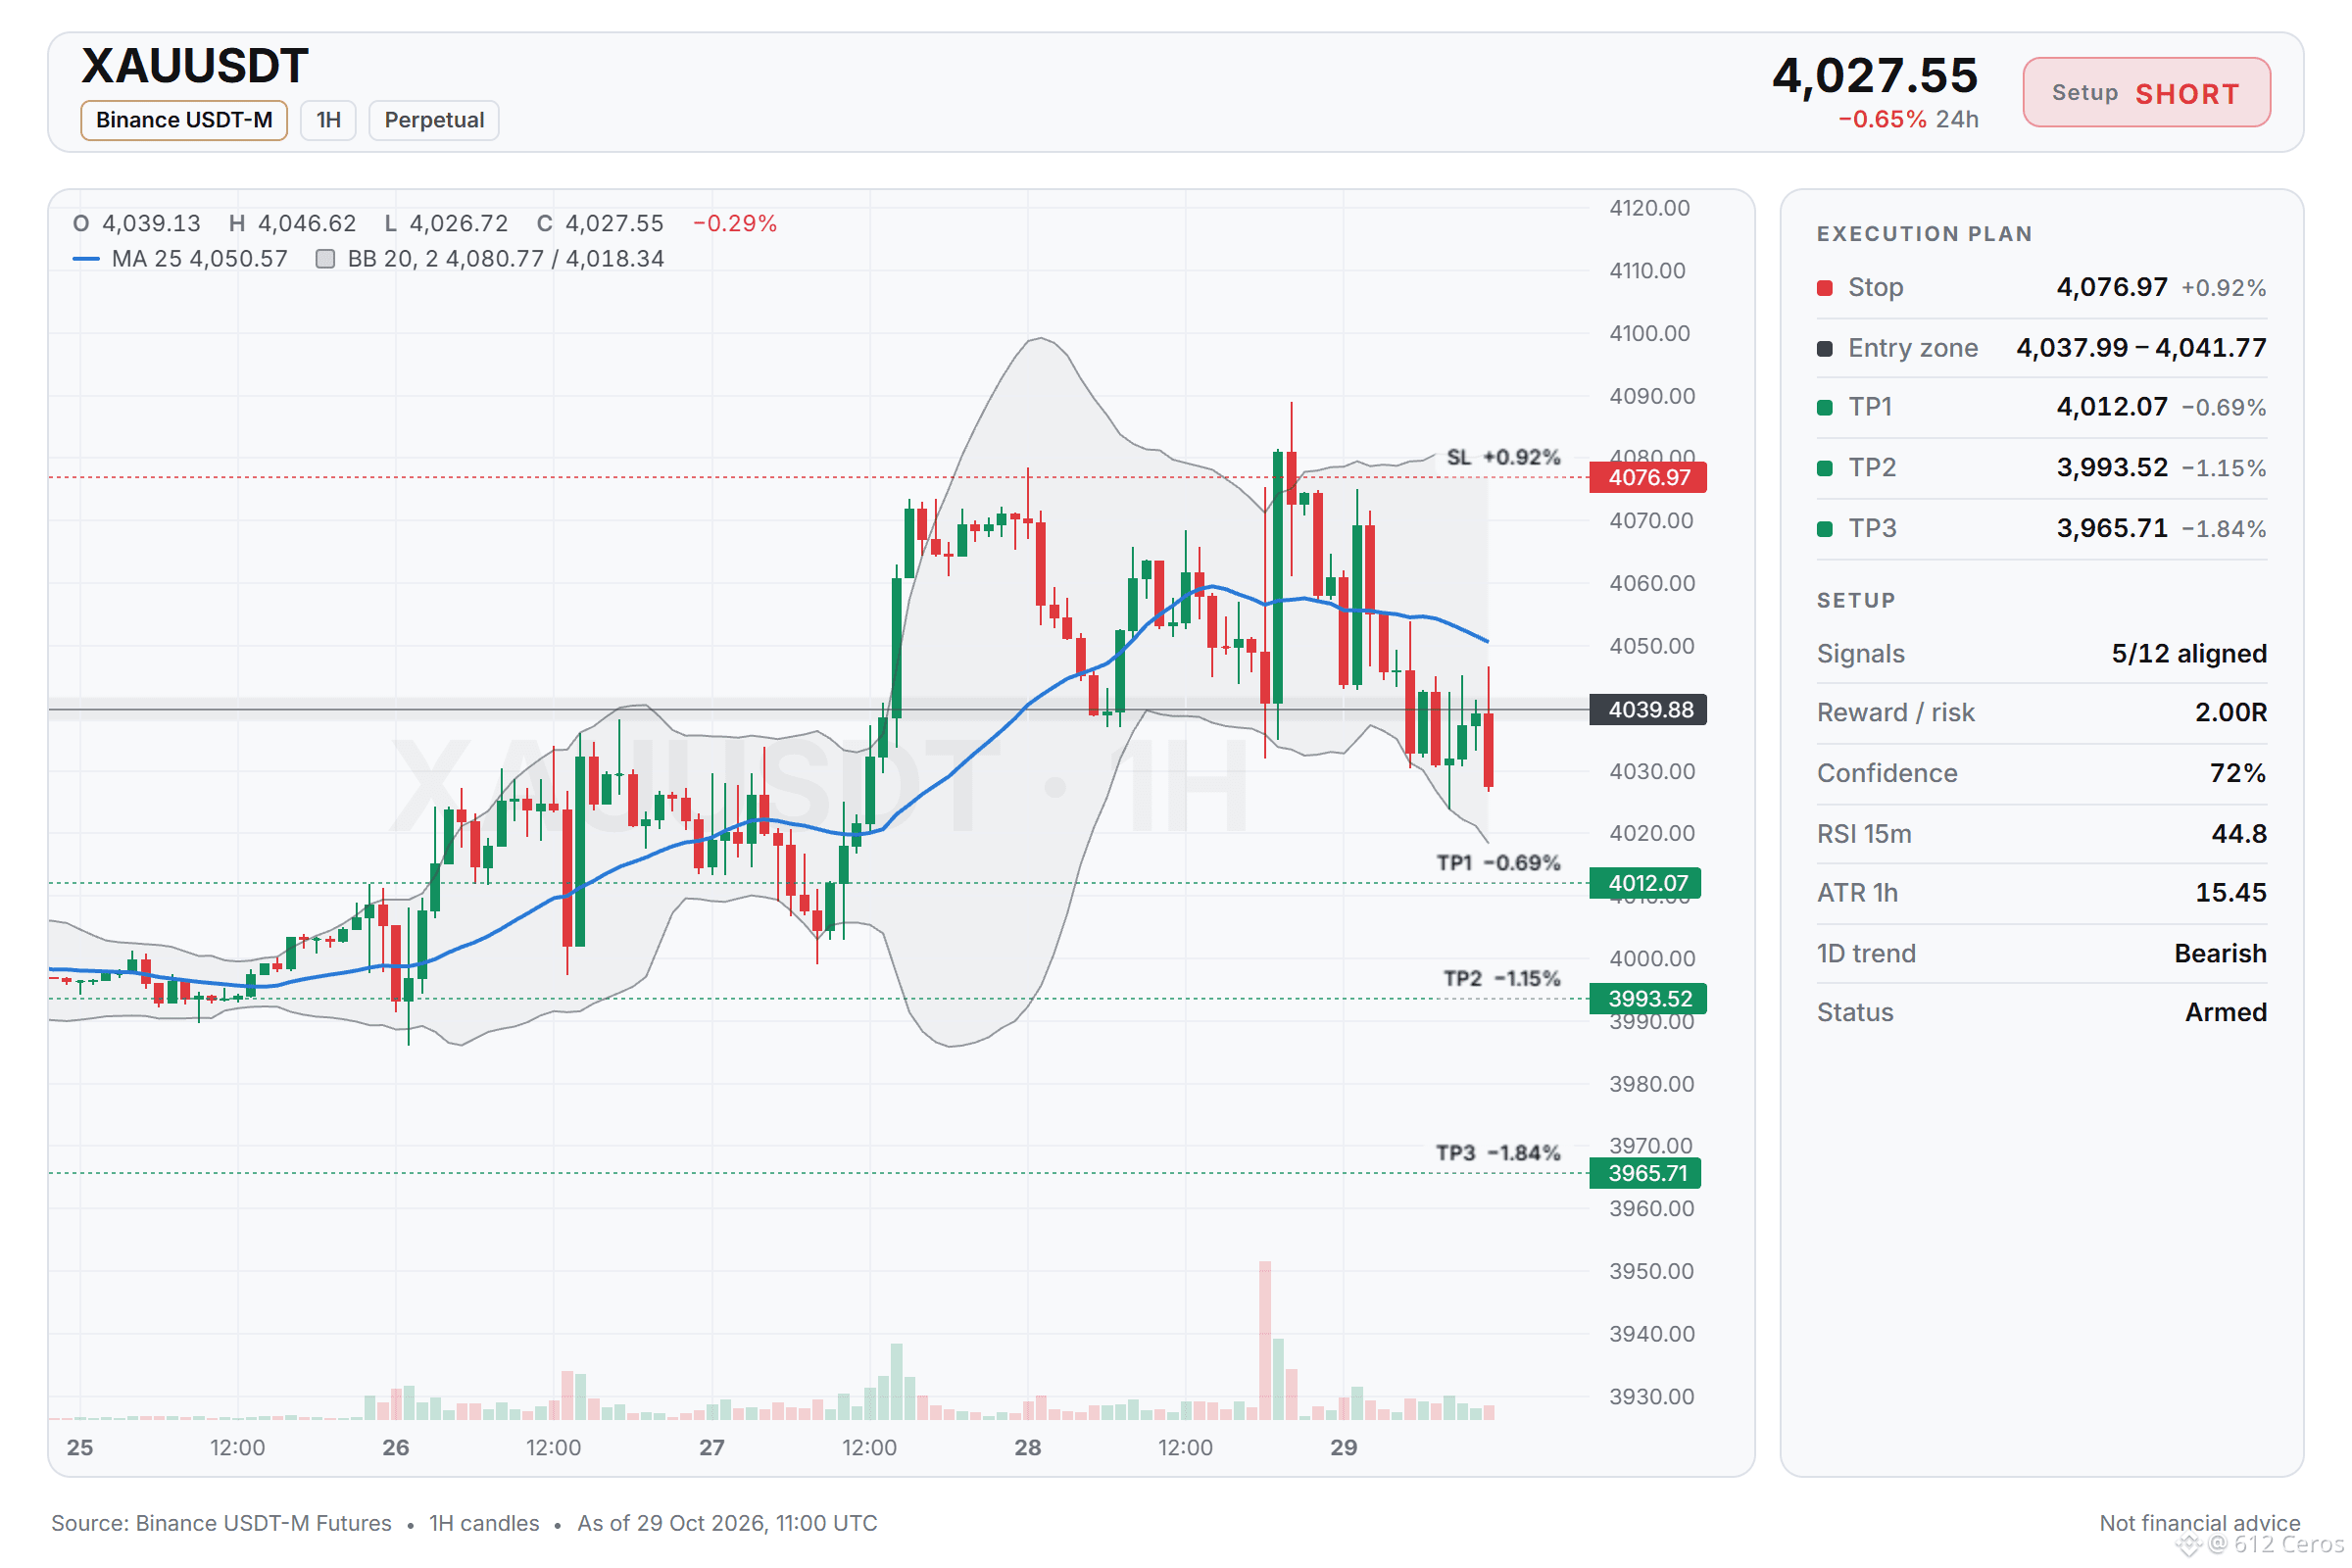
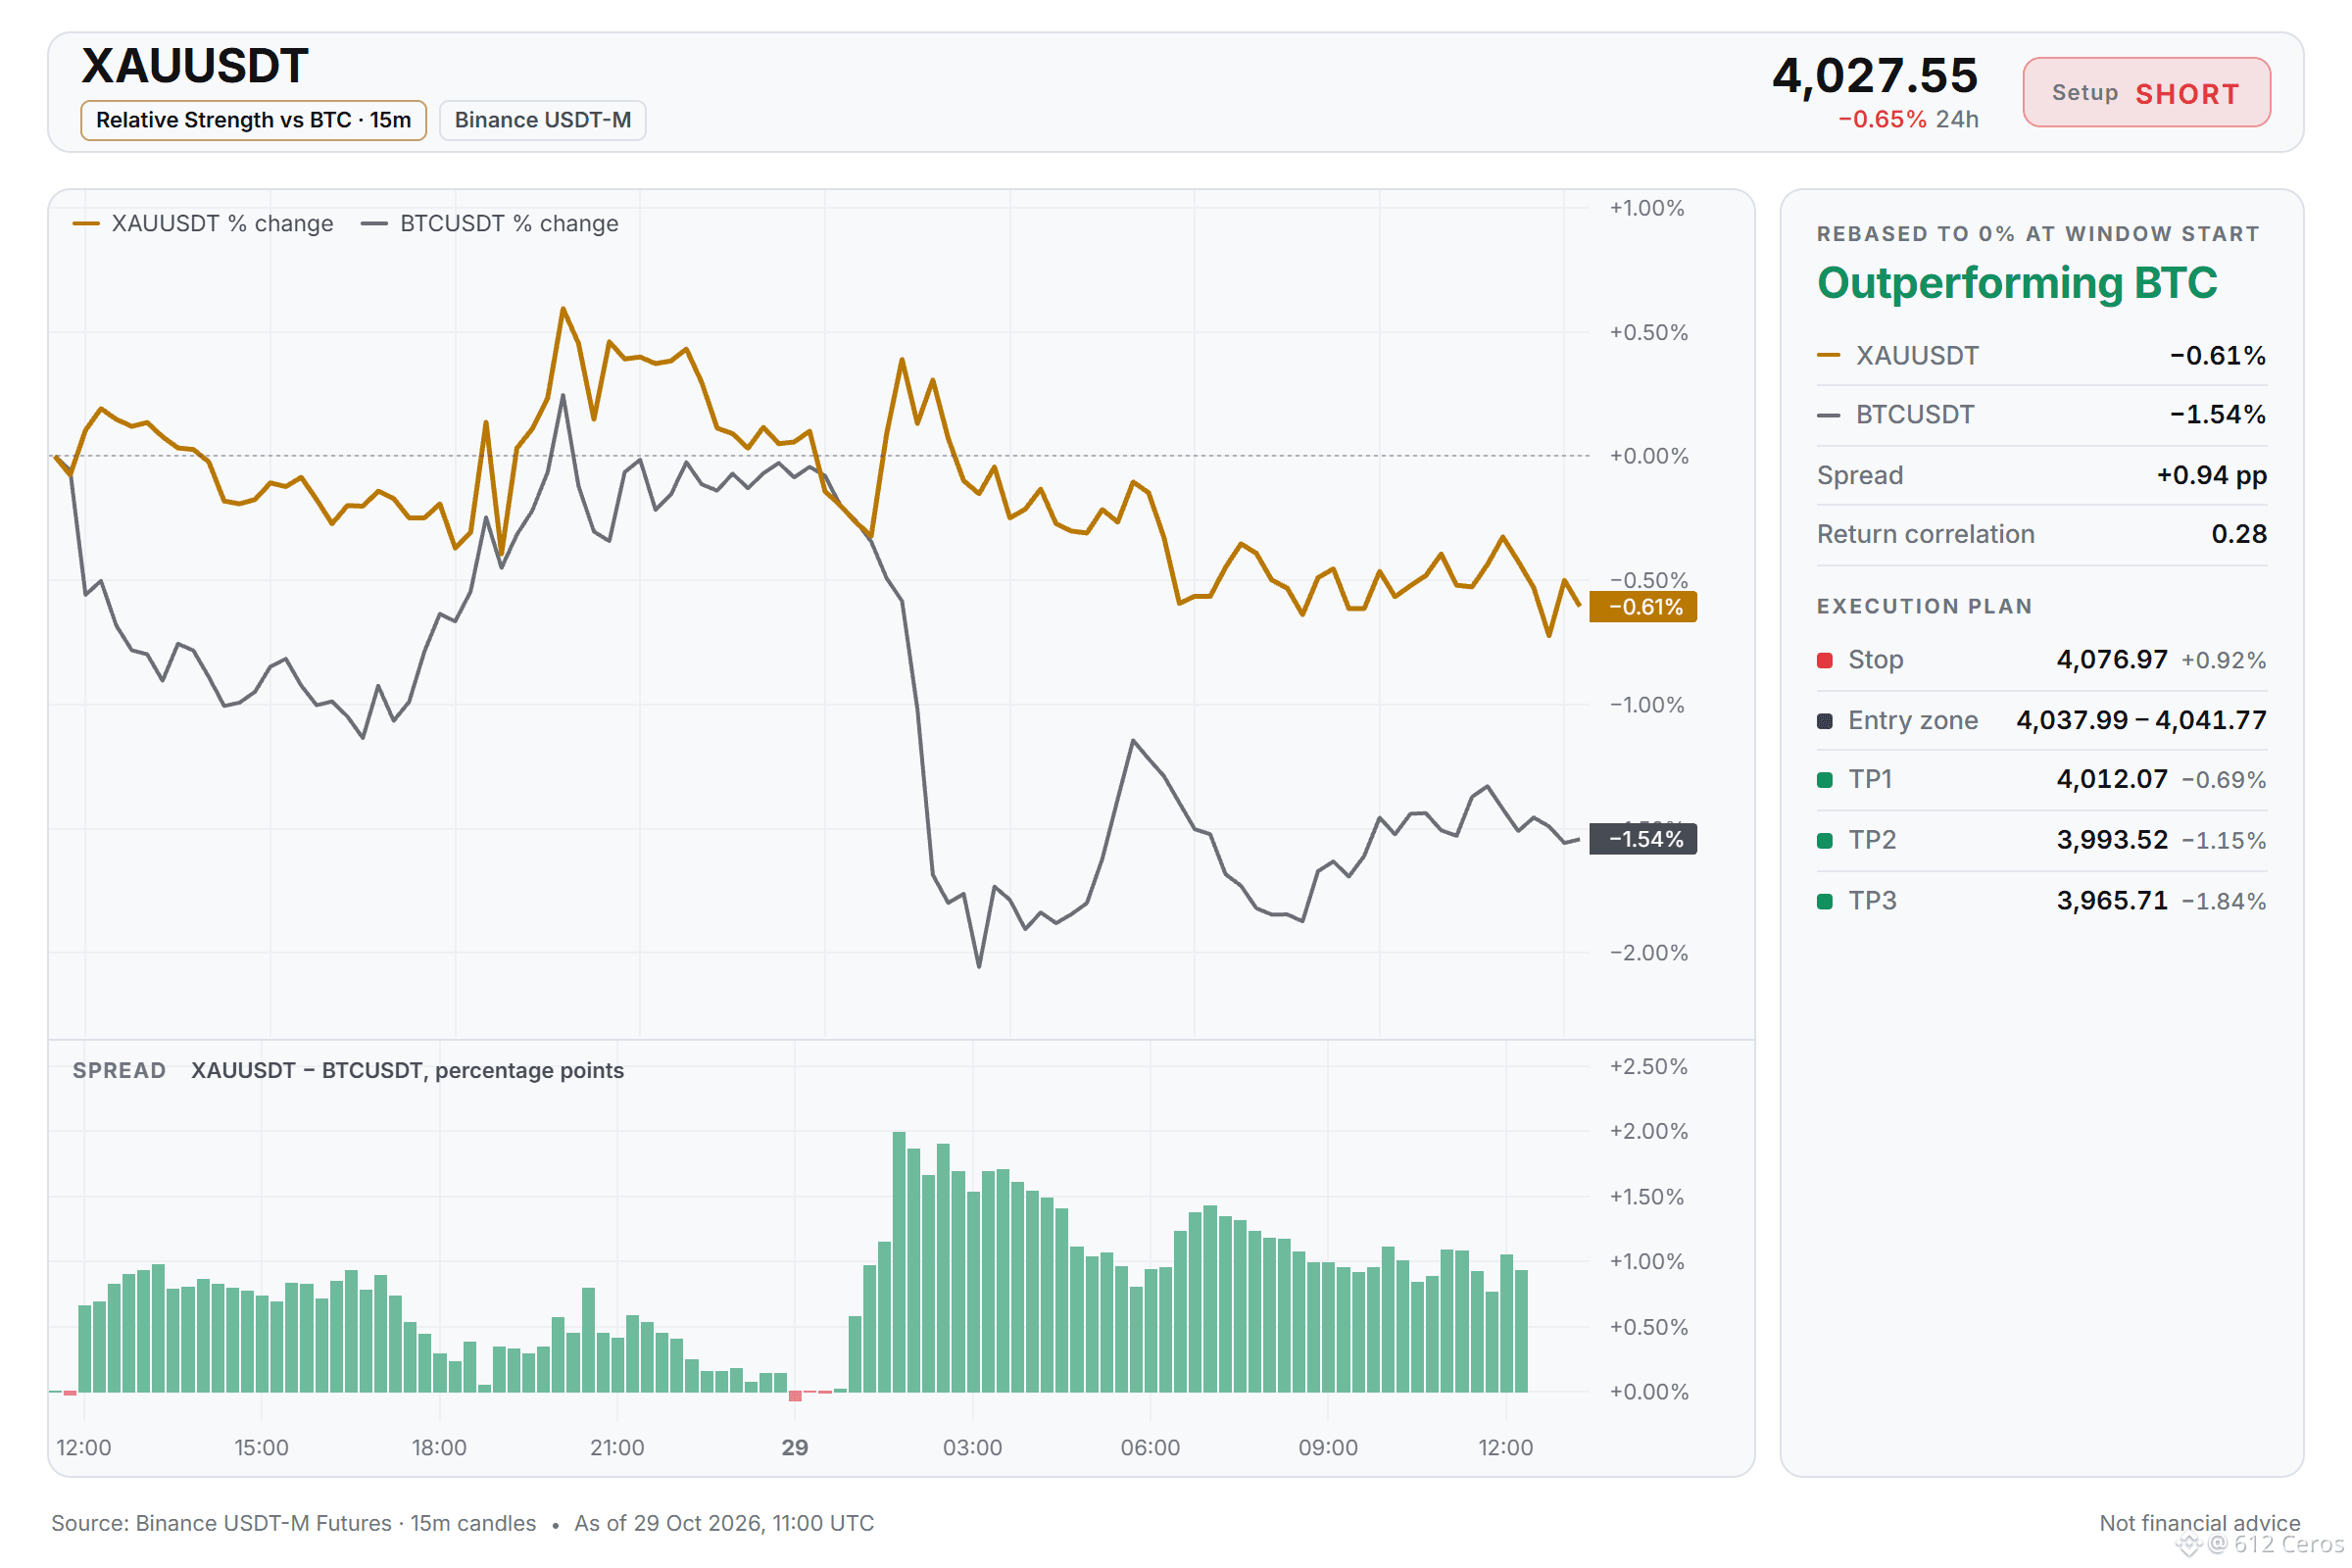
XAU looks ripe for a short here
🔴 SHORT $XAU /USDT: expecting price to go DOWN
Bias: SHORT · Leaning
Entry: 4037.99 – 4041.77
TP1: 4012.07 (-0.7%)
TP2: 3993.52 (-1.1%)
TP3: 3965.71 (-1.8%)
SL: 4076.97 (+0.9%)
Plan: enter only inside the zone, close 50% at TP1, 25% at TP2, 25% at TP3, and move the stop to entry after TP1.
Note: moderate conviction only, keep size light.
Why SHORT? 5/12 signals agree, 0 against.
• Daily trend down (below EMA50 & EMA200)
• 4h trend down (below EMA50 & EMA200)
• 1h trend down (below EMA50 & EMA200)
Plan A:
If price pushes toward 4041.77 and the 4h bearish stack holds, it may roll toward the first target near 4012.07.
Plan B (invalidation):
A break above 4076.97 would prove the short wrong, so I would exit immediately.
Where do you see this failing?
Levels mapped on the chart below.
{future}(XAUUSDT)
📲 Want more of my latest signals? Join me here:
[https://app.binance.com/uni-qr/D26WbL9t](https://app.binance.com/uni-qr/D26WbL9t)
⚠️ Personal market analysis only. NFA — manage risk and DYOR.
Educational content, not investment advice or a recommendation to buy, sell, deposit, or withdraw any asset. No paid promotion or referral/affiliate links.
XAU looks ripe for a short here
🔴 SHORT $XAU /USDT: expecting price to go DOWN
Bias: SHORT · Leaning
Entry: 4037.99 – 4041.77
TP1: 4012.07 (-0.7%)
TP2: 3993.52 (-1.1%)
TP3: 3965.71 (-1.8%)
SL: 4076.97 (+0.9%)
Plan: enter only inside the zone, close 50% at TP1, 25% at TP2, 25% at TP3, and move the stop to entry after TP1.
Note: moderate conviction only, keep size light.
Why SHORT? 5/12 signals agree, 0 against.
• Daily trend down (below EMA50 & EMA200)
• 4h trend down (below EMA50 & EMA200)
• 1h trend down (below EMA50 & EMA200)
Plan A:
If price pushes toward 4041.77 and the 4h bearish stack holds, it may roll toward the first target near 4012.07.
Plan B (invalidation):
A break above 4076.97 would prove the short wrong, so I would exit immediately.
Where do you see this failing?
Levels mapped on the chart below.
📲 Want more of my latest signals? Join me here:
https://app.binance.com/uni-qr/D26WbL9t
⚠️ Personal market analysis only. NFA — manage risk and DYOR.
Educational content, not investment advice or a recommendation to buy, sell, deposit, or withdraw any asset. No paid promotion or referral/affiliate links.
1
1
866
·
--
Падение
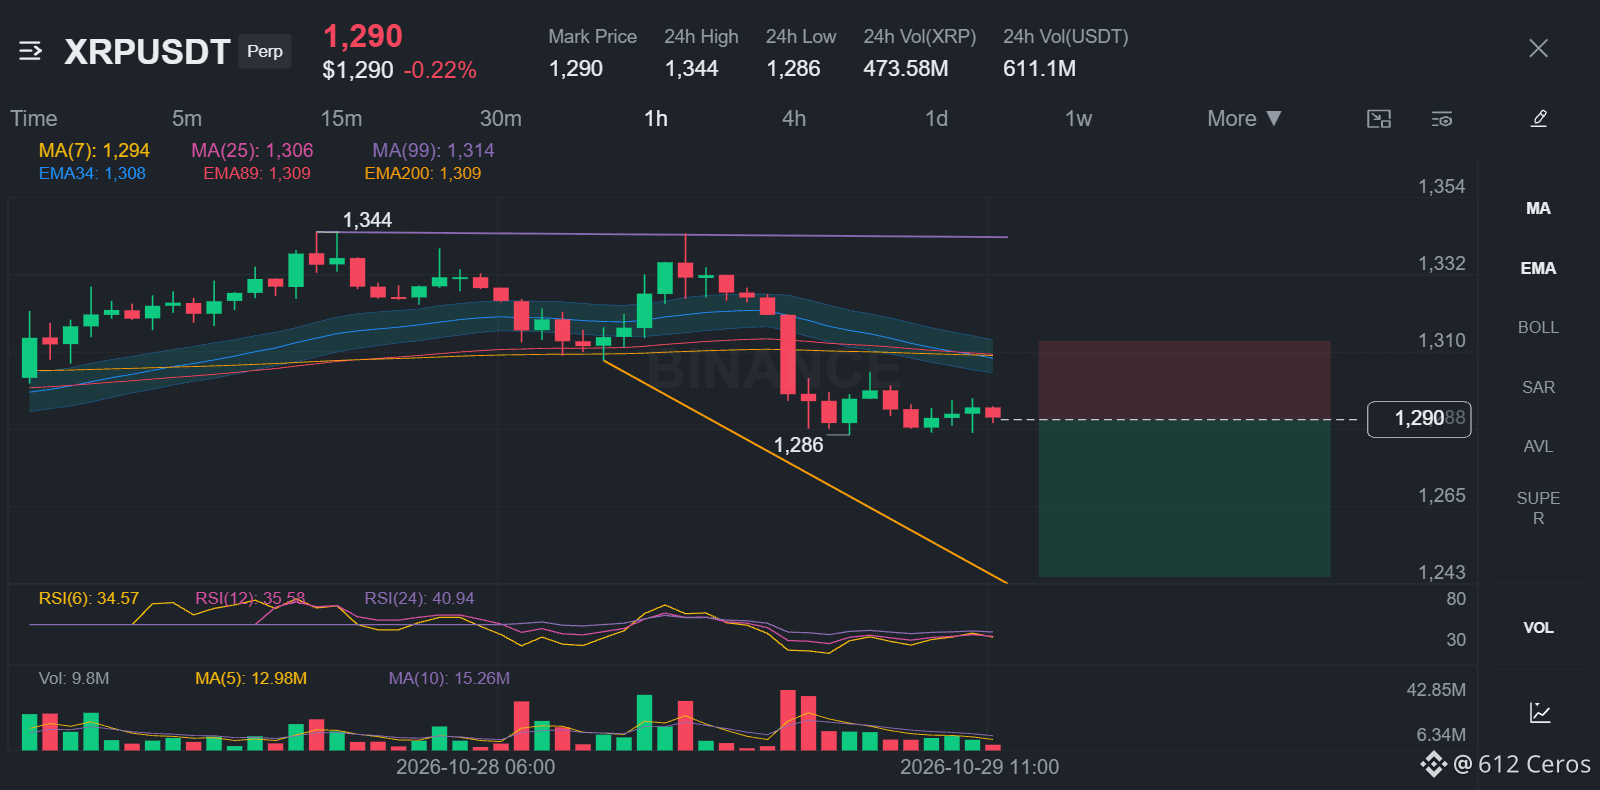
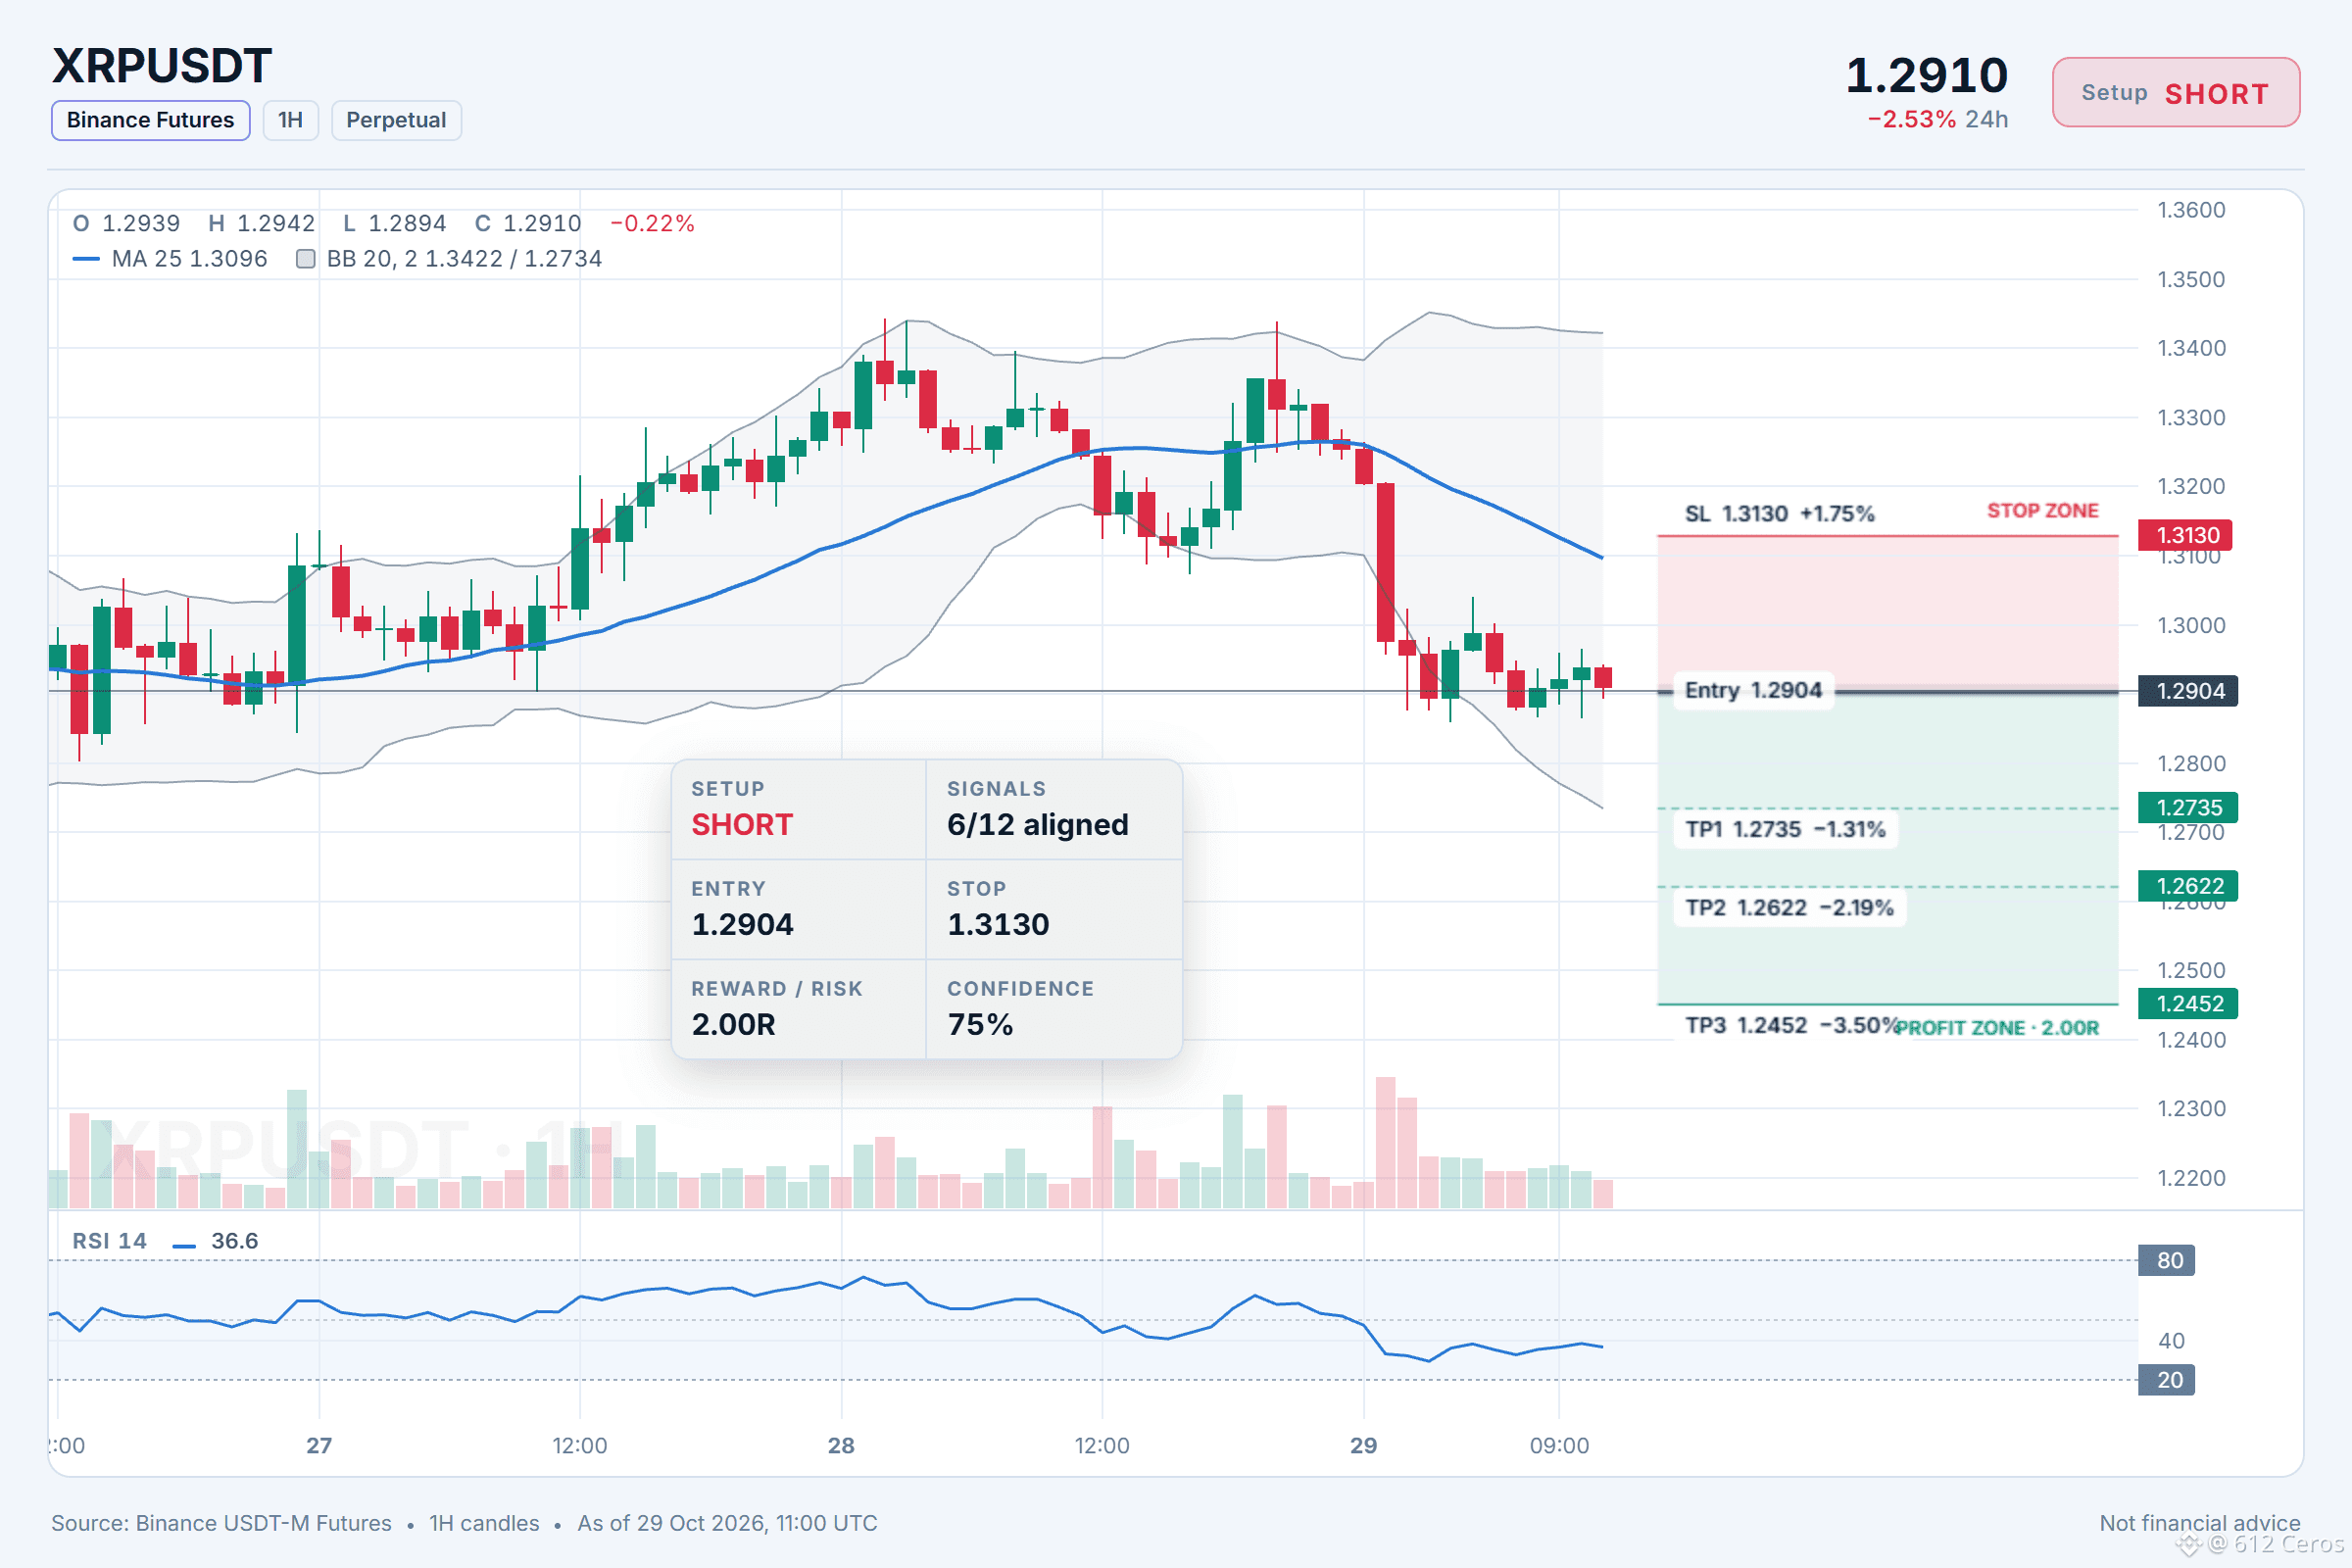
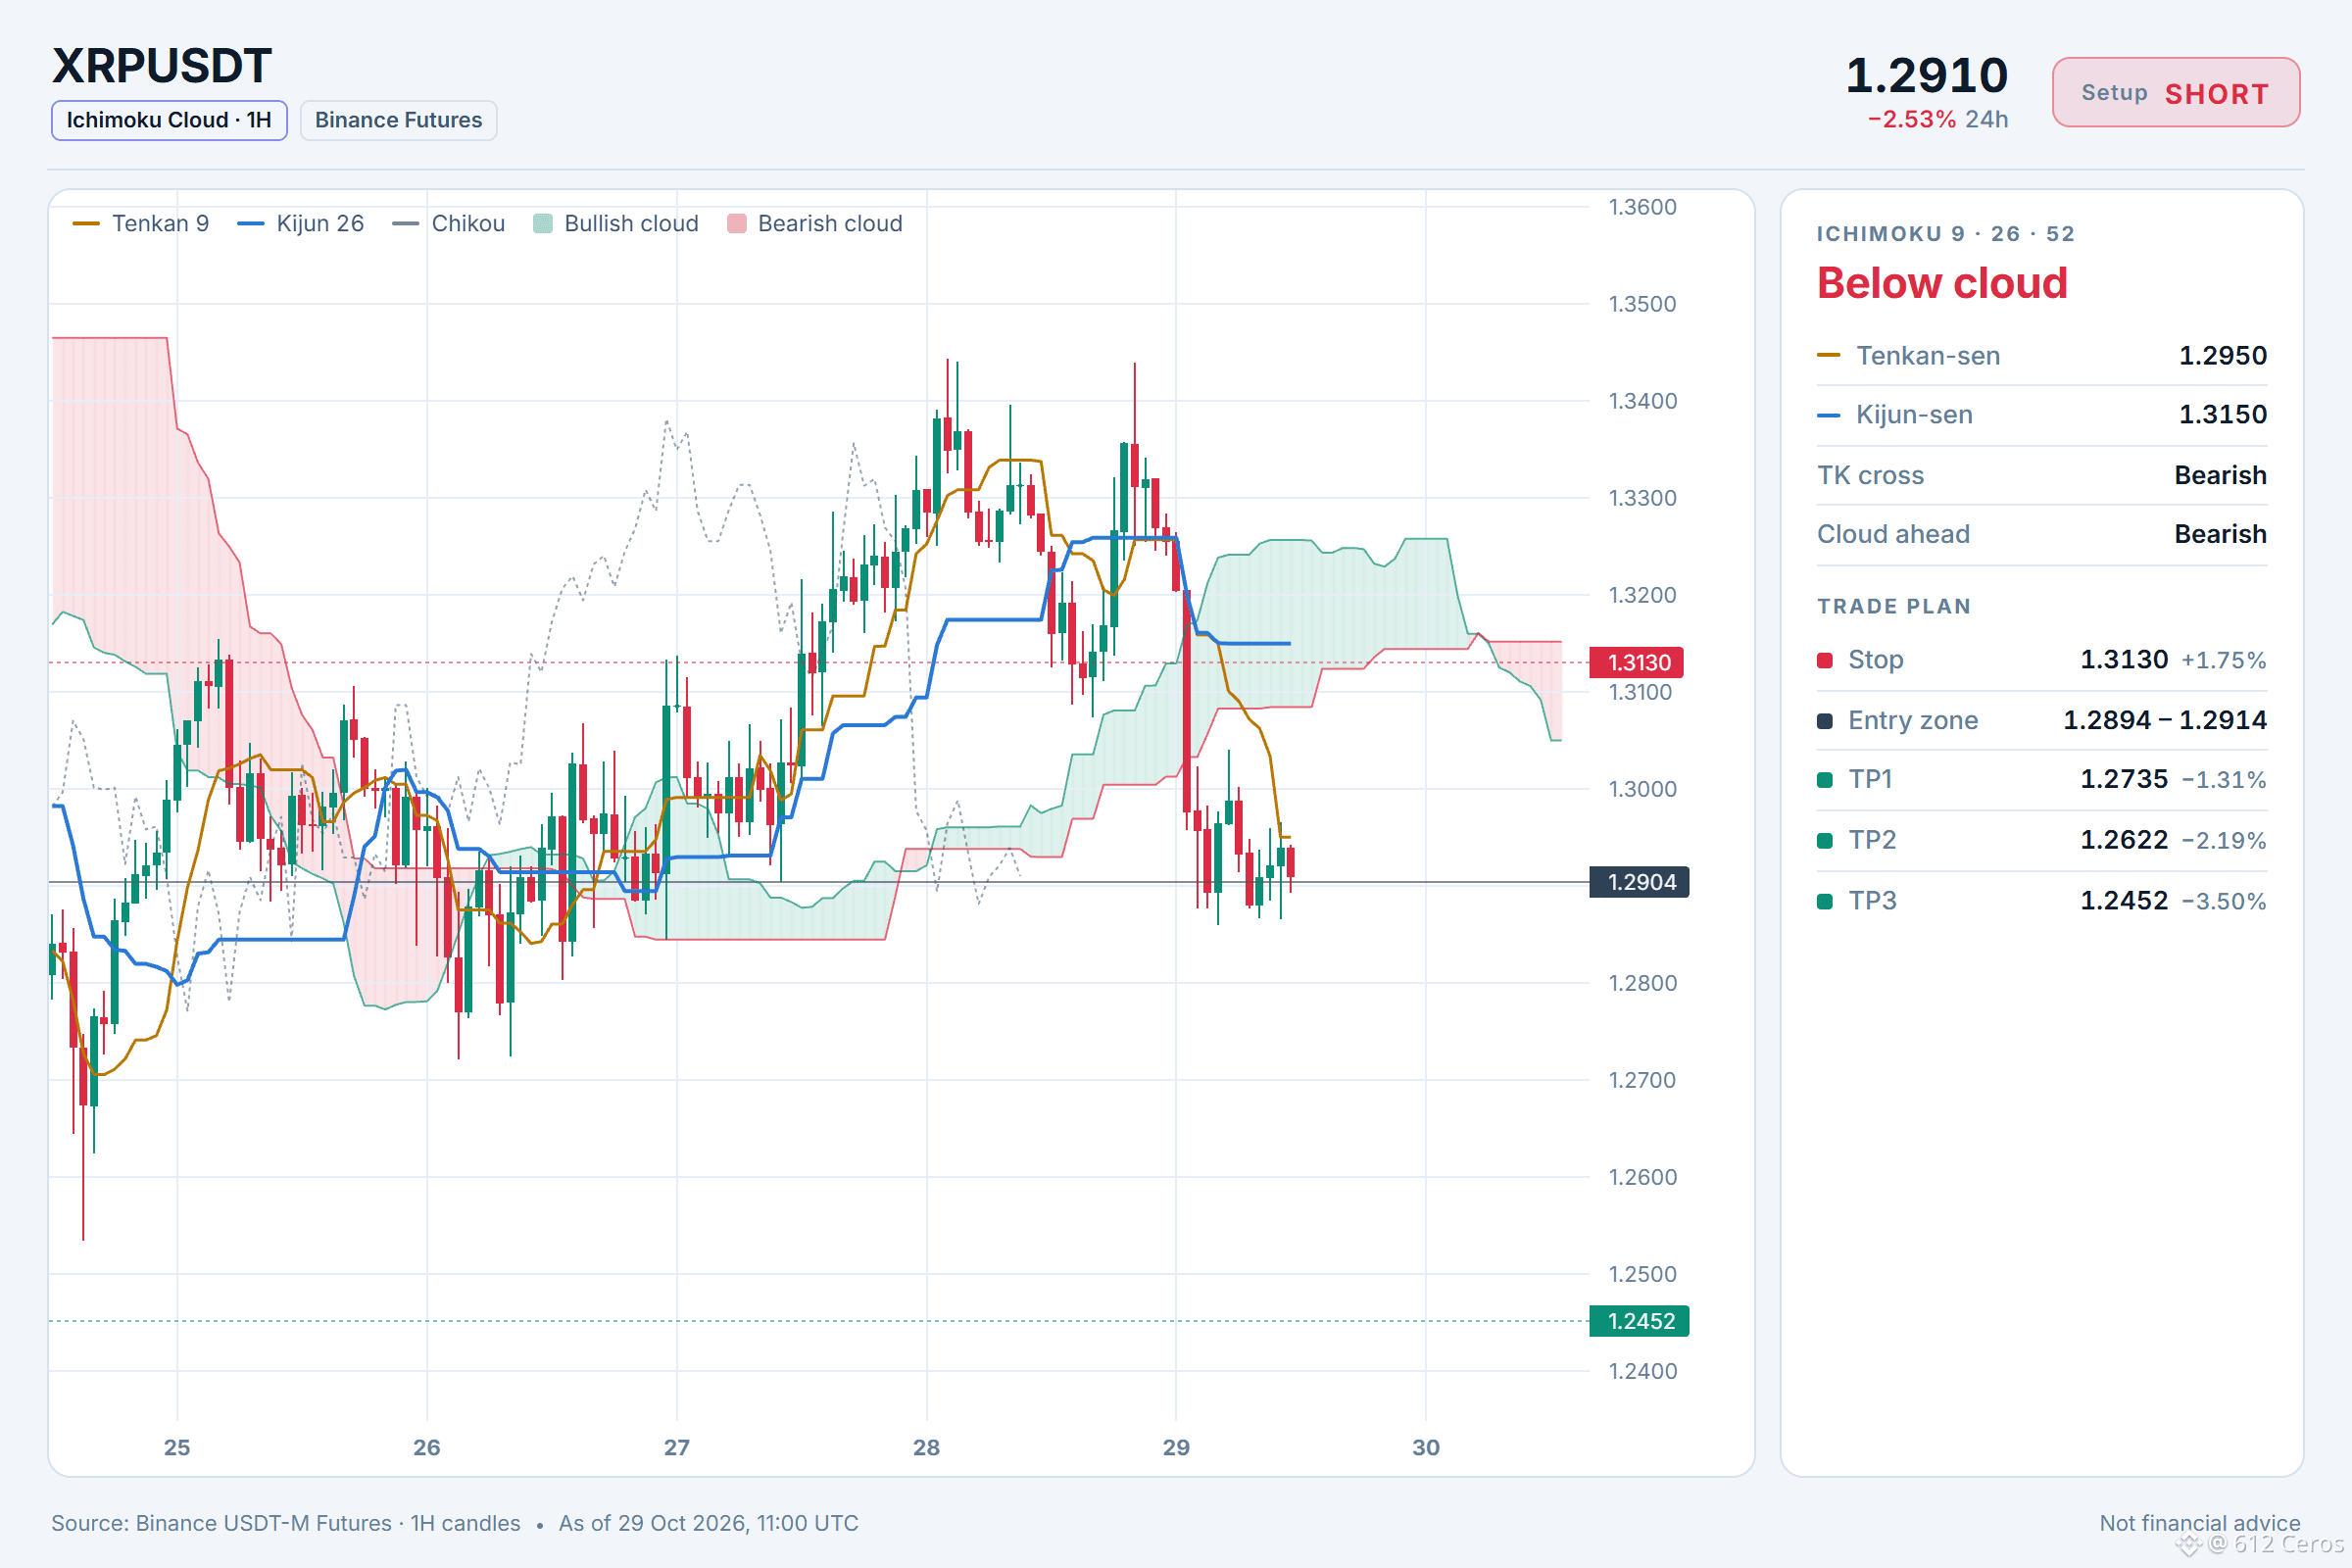
Is XRP sliding into a clear short entry?
🔴 SHORT $XRP /USDT: expecting price to go DOWN
Bias: SHORT · Strong
Entry: 1.2894 – 1.2914
TP1: 1.2735 (-1.3%)
TP2: 1.2622 (-2.2%)
TP3: 1.2452 (-3.5%)
SL: 1.3130 (+1.8%)
Plan: enter only inside the zone, close 50% at TP1, 25% at TP2, 25% at TP3, and move the stop to entry after TP1.
Why SHORT? 6/12 signals agree, 0 against.
• Daily trend down (below EMA50 & EMA200)
• 4h trend down (below EMA50 & EMA200)
• BTC is falling, this coin follows (corr 0.92)
Trade note: XRP
I'm watching XRP because the daily trend and the 4h trend are both bearish, with price below EMA50 and EMA200 on both timeframes. I want to see sellers keep control, and the 4h RSI at 43.1 and the 1h RSI at 36.6 confirm bearish momentum. The daily trend is down and the BTC backdrop is bearish with a correlation of 0.92, so XRP often follows. The main risk is that the 1h trend is mixed, meaning the short-term trend is undecided.
Where do you take profit on a short here?
Full setup on the chart below.
{future}(XRPUSDT)
📲 Want more of my latest signals? Join me here:
[https://app.binance.com/uni-qr/D26WbL9t](https://app.binance.com/uni-qr/D26WbL9t)
⚠️ Personal market analysis only. NFA — manage risk and DYOR.
Educational content, not investment advice or a recommendation to buy, sell, deposit, or withdraw any asset. No paid promotion or referral/affiliate links.
Is XRP sliding into a clear short entry?
🔴 SHORT $XRP /USDT: expecting price to go DOWN
Bias: SHORT · Strong
Entry: 1.2894 – 1.2914
TP1: 1.2735 (-1.3%)
TP2: 1.2622 (-2.2%)
TP3: 1.2452 (-3.5%)
SL: 1.3130 (+1.8%)
Plan: enter only inside the zone, close 50% at TP1, 25% at TP2, 25% at TP3, and move the stop to entry after TP1.
Why SHORT? 6/12 signals agree, 0 against.
• Daily trend down (below EMA50 & EMA200)
• 4h trend down (below EMA50 & EMA200)
• BTC is falling, this coin follows (corr 0.92)
Trade note: XRP
I'm watching XRP because the daily trend and the 4h trend are both bearish, with price below EMA50 and EMA200 on both timeframes. I want to see sellers keep control, and the 4h RSI at 43.1 and the 1h RSI at 36.6 confirm bearish momentum. The daily trend is down and the BTC backdrop is bearish with a correlation of 0.92, so XRP often follows. The main risk is that the 1h trend is mixed, meaning the short-term trend is undecided.
Where do you take profit on a short here?
Full setup on the chart below.
📲 Want more of my latest signals? Join me here:
https://app.binance.com/uni-qr/D26WbL9t
⚠️ Personal market analysis only. NFA — manage risk and DYOR.
Educational content, not investment advice or a recommendation to buy, sell, deposit, or withdraw any asset. No paid promotion or referral/affiliate links.
1.1k
·
--
Рост
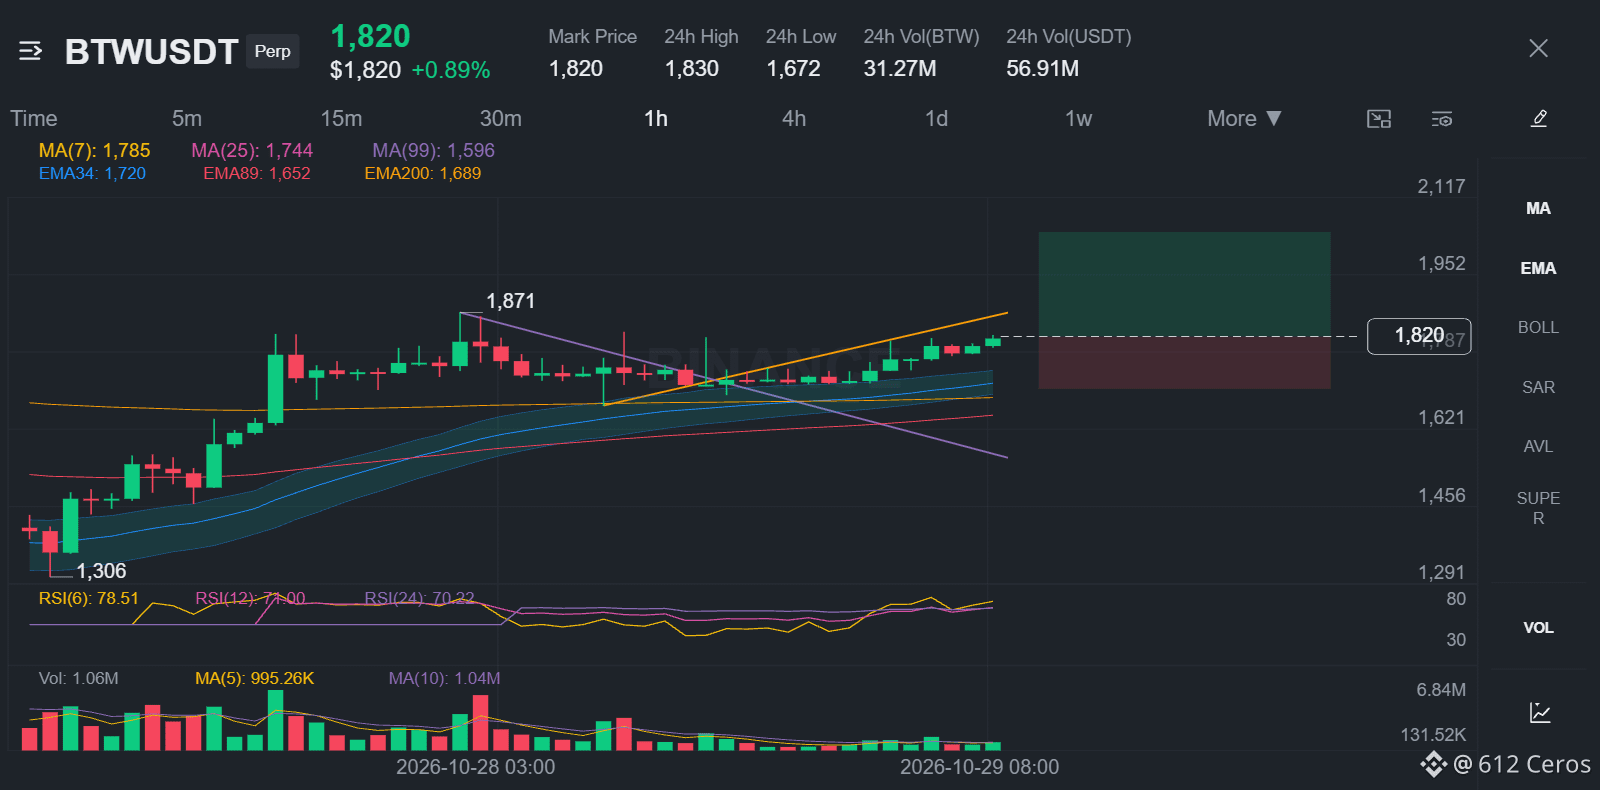
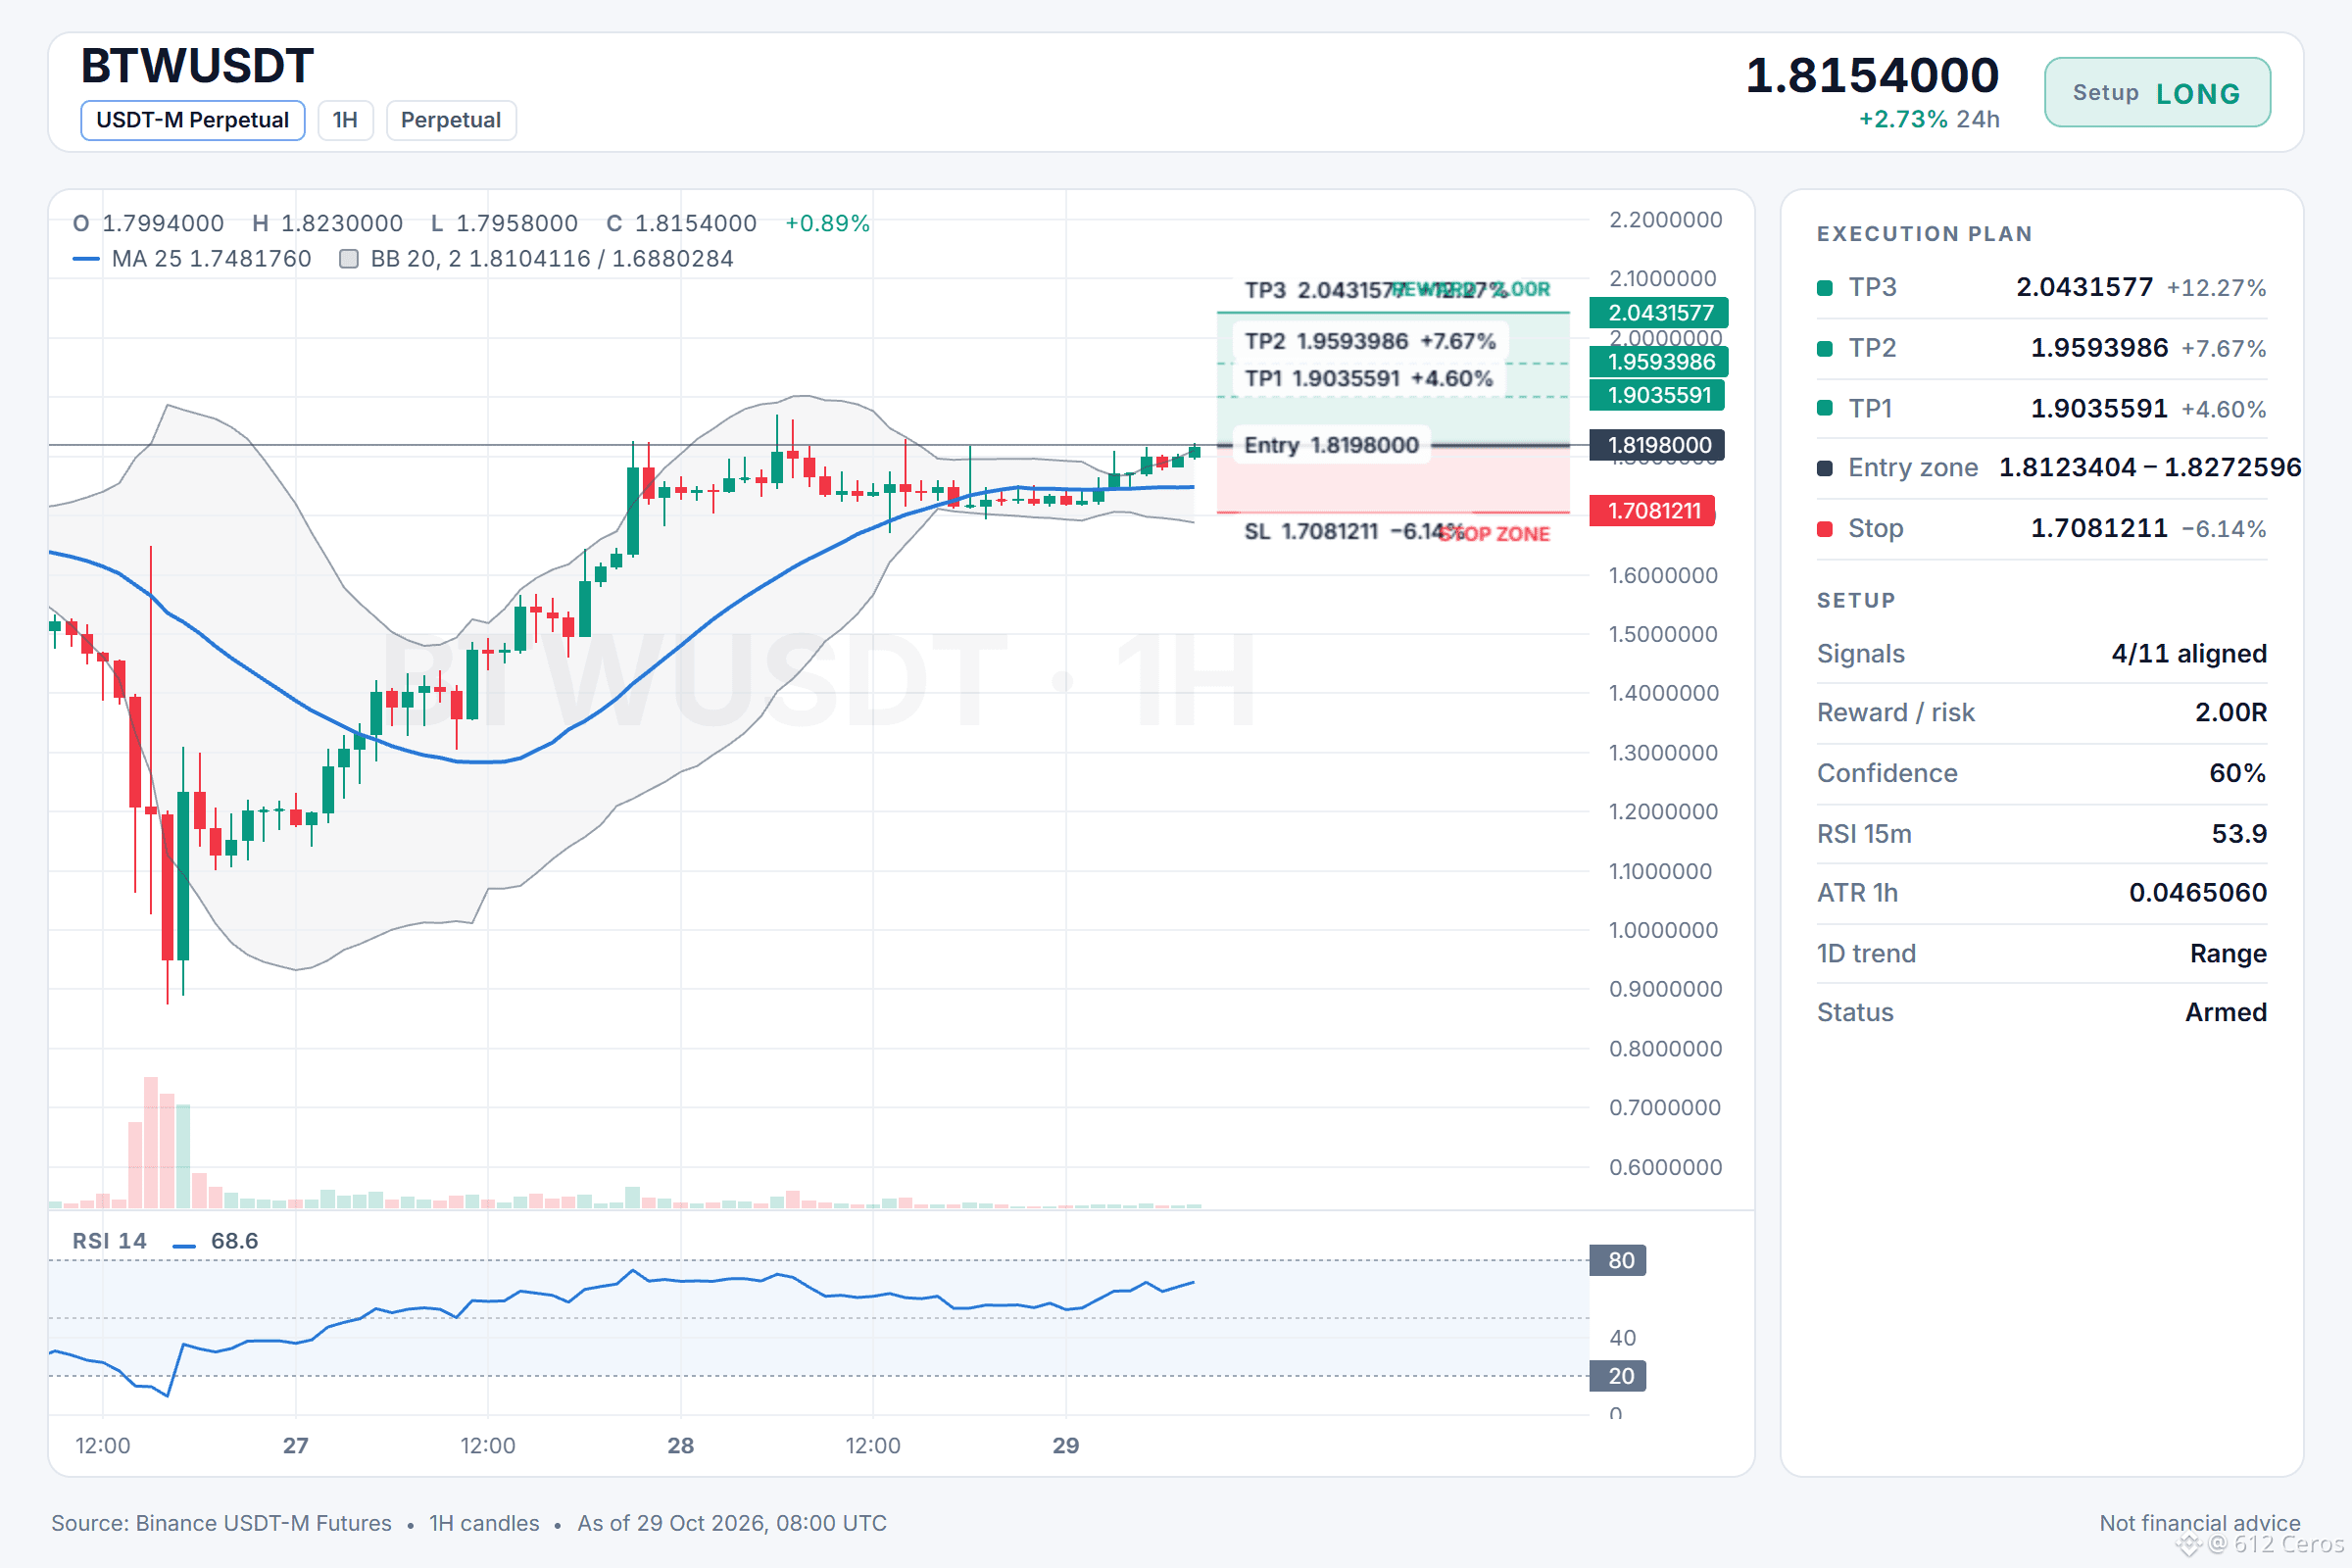
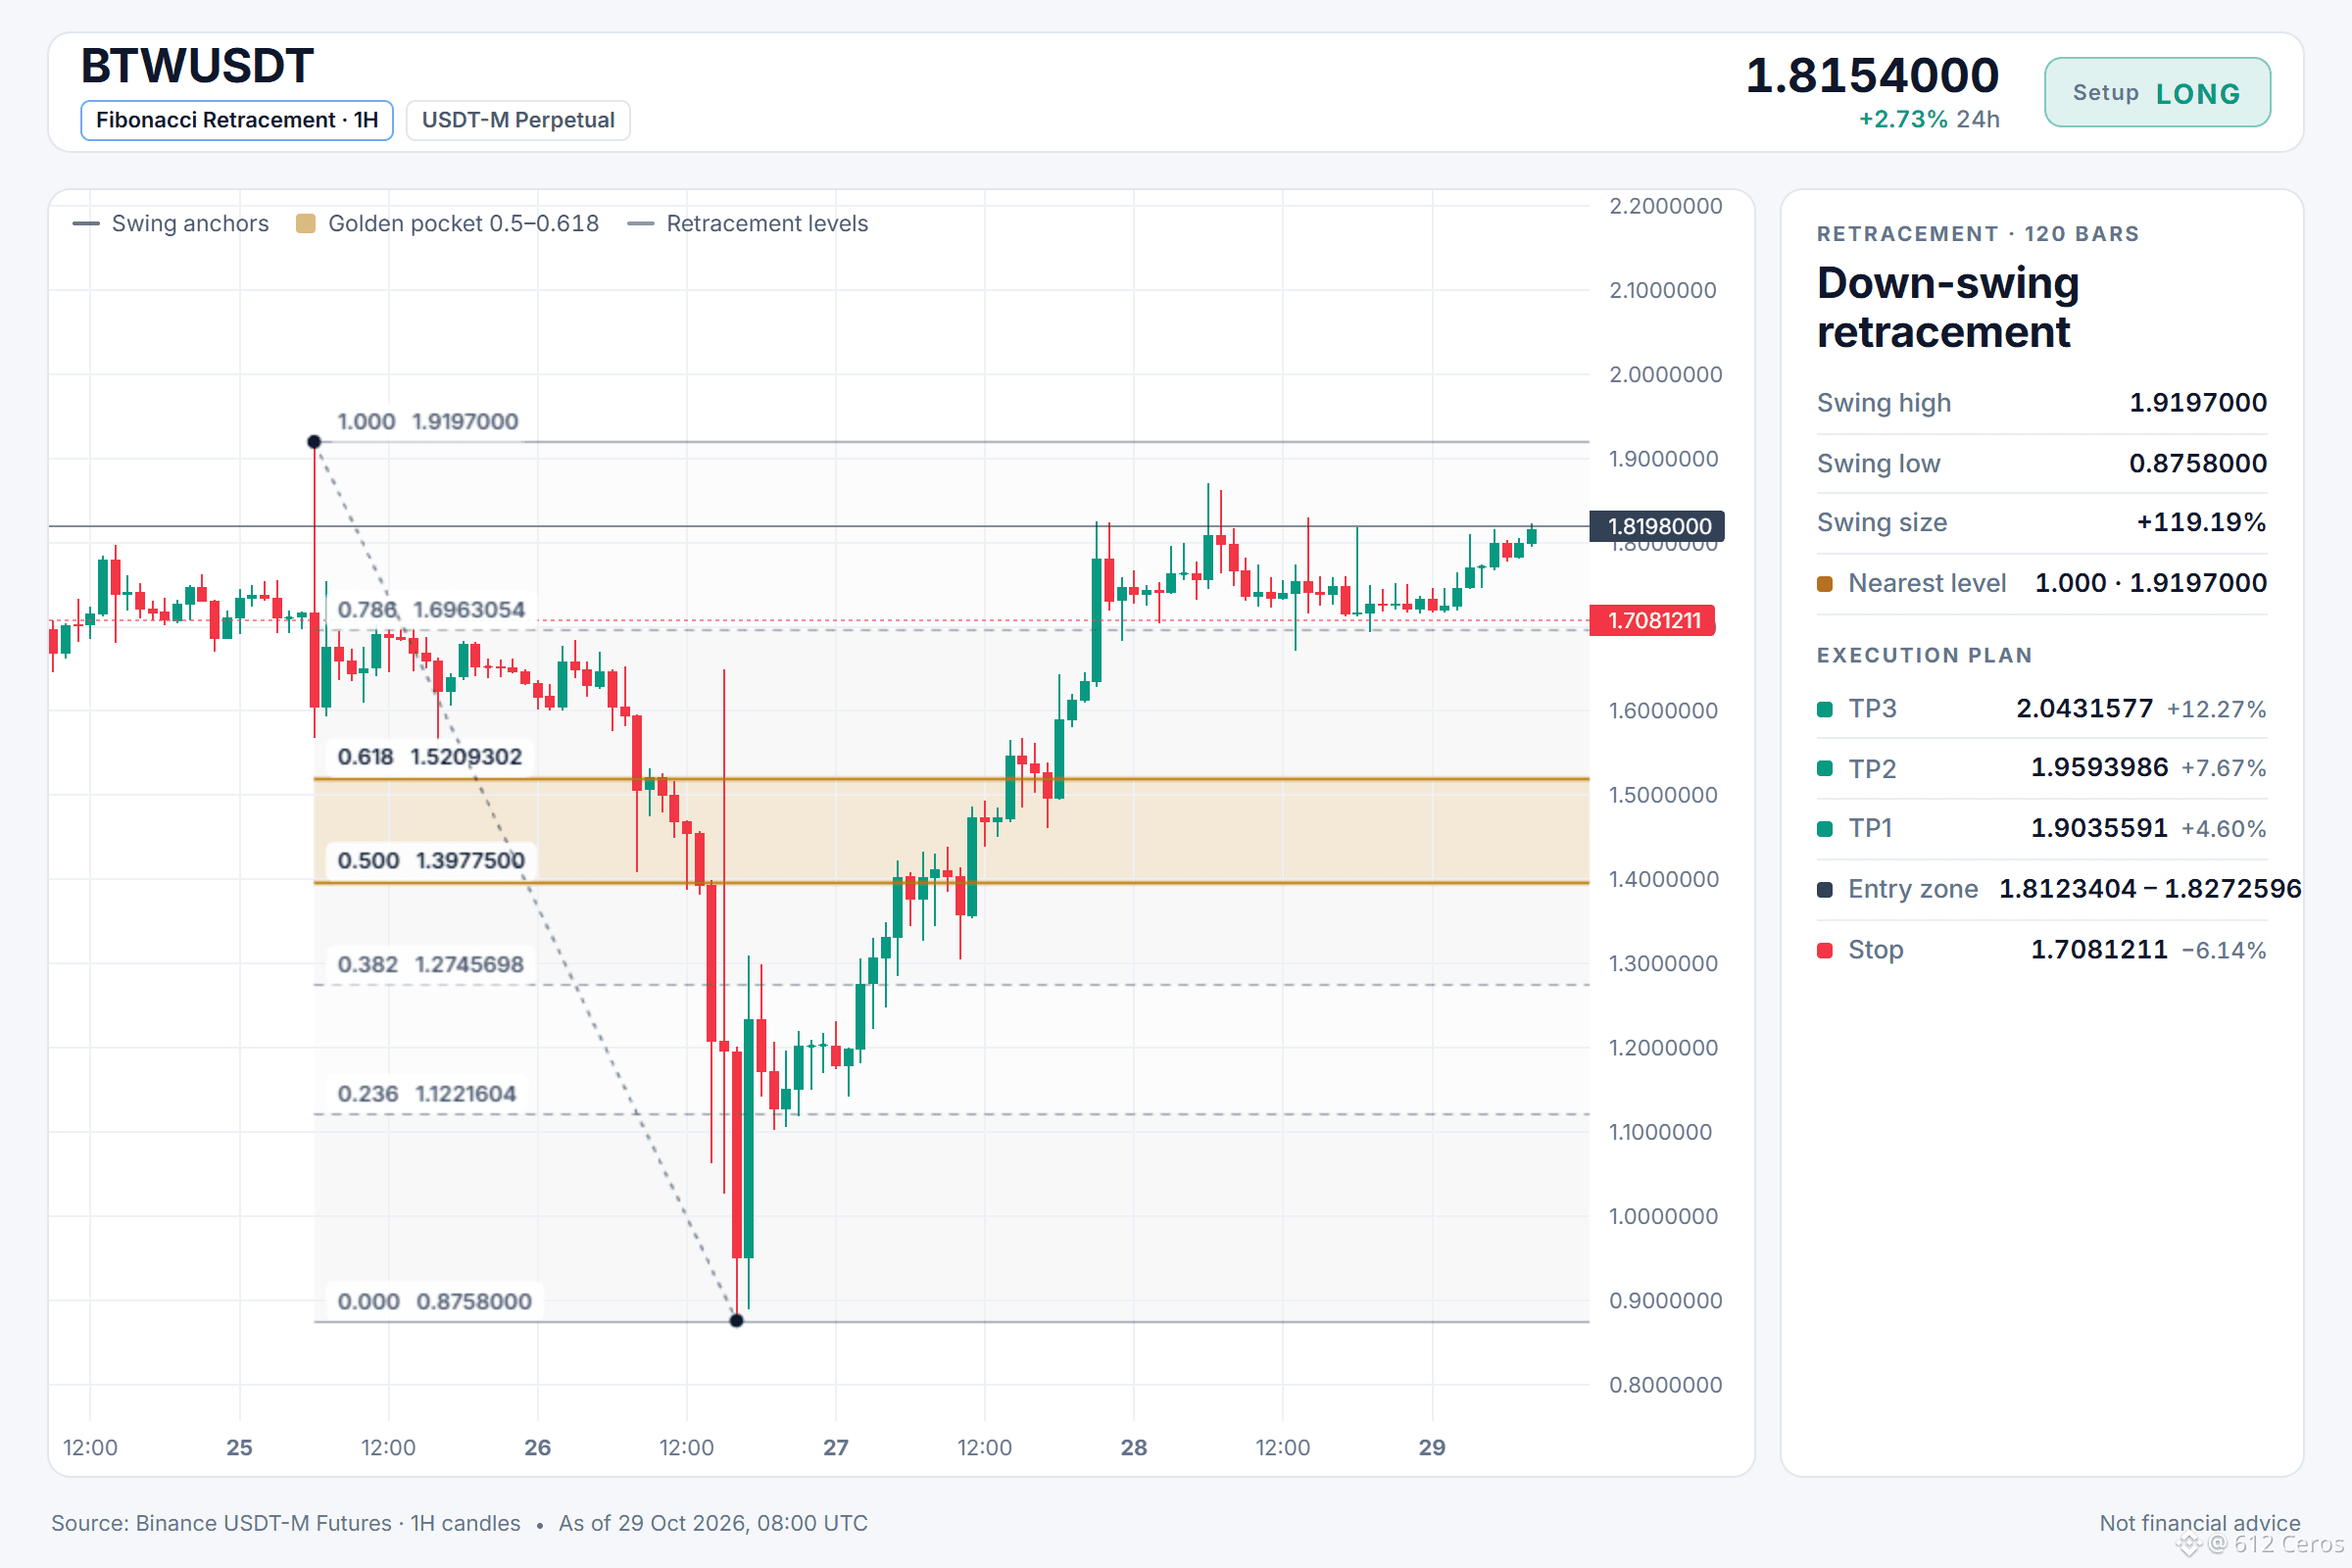
What makes BTW look ripe for a long?
🟢 LONG $BTW /USDT: expecting price to go UP
Bias: LONG · Leaning
Entry: 1.8123404 – 1.8272596
TP1: 1.9035591 (+4.6%)
TP2: 1.9593986 (+7.7%)
TP3: 2.0431577 (+12.3%)
SL: 1.7081211 (-6.1%)
Plan: enter only inside the zone, close 50% at TP1, 25% at TP2, 25% at TP3, and move the stop to entry after TP1.
Note: moderate conviction only, keep size light.
Why LONG? 4/11 signals agree, 2 against.
• 4h trend up (above EMA50 & EMA200)
• Buyers have the momentum (4h RSI 59.5)
• Buyers have the momentum (1h RSI 68.6)
Risk: Sellers are driving the move (15m ADX 41.4)
Q: Why go long if the daily trend is range?
A: The 4h trend shows price above EMA50 above EMA200.
Q: What if the sellers are still in control?
A: The 4h RSI is 59.5, showing buyers have momentum.
Where would you set your level for this trade?
Chart with every level below.
{future}(BTWUSDT)
📲 Want more of my latest signals? Join me here:
[https://app.binance.com/uni-qr/D26WbL9t](https://app.binance.com/uni-qr/D26WbL9t)
⚠️ Personal market analysis only. NFA — manage risk and DYOR.
Educational content, not investment advice or a recommendation to buy, sell, deposit, or withdraw any asset. No paid promotion or referral/affiliate links.
What makes BTW look ripe for a long?
🟢 LONG $BTW /USDT: expecting price to go UP
Bias: LONG · Leaning
Entry: 1.8123404 – 1.8272596
TP1: 1.9035591 (+4.6%)
TP2: 1.9593986 (+7.7%)
TP3: 2.0431577 (+12.3%)
SL: 1.7081211 (-6.1%)
Plan: enter only inside the zone, close 50% at TP1, 25% at TP2, 25% at TP3, and move the stop to entry after TP1.
Note: moderate conviction only, keep size light.
Why LONG? 4/11 signals agree, 2 against.
• 4h trend up (above EMA50 & EMA200)
• Buyers have the momentum (4h RSI 59.5)
• Buyers have the momentum (1h RSI 68.6)
Risk: Sellers are driving the move (15m ADX 41.4)
Q: Why go long if the daily trend is range?
A: The 4h trend shows price above EMA50 above EMA200.
Q: What if the sellers are still in control?
A: The 4h RSI is 59.5, showing buyers have momentum.
Where would you set your level for this trade?
Chart with every level below.
📲 Want more of my latest signals? Join me here:
https://app.binance.com/uni-qr/D26WbL9t
⚠️ Personal market analysis only. NFA — manage risk and DYOR.
Educational content, not investment advice or a recommendation to buy, sell, deposit, or withdraw any asset. No paid promotion or referral/affiliate links.
2
1
1.2k
·
--
Падение
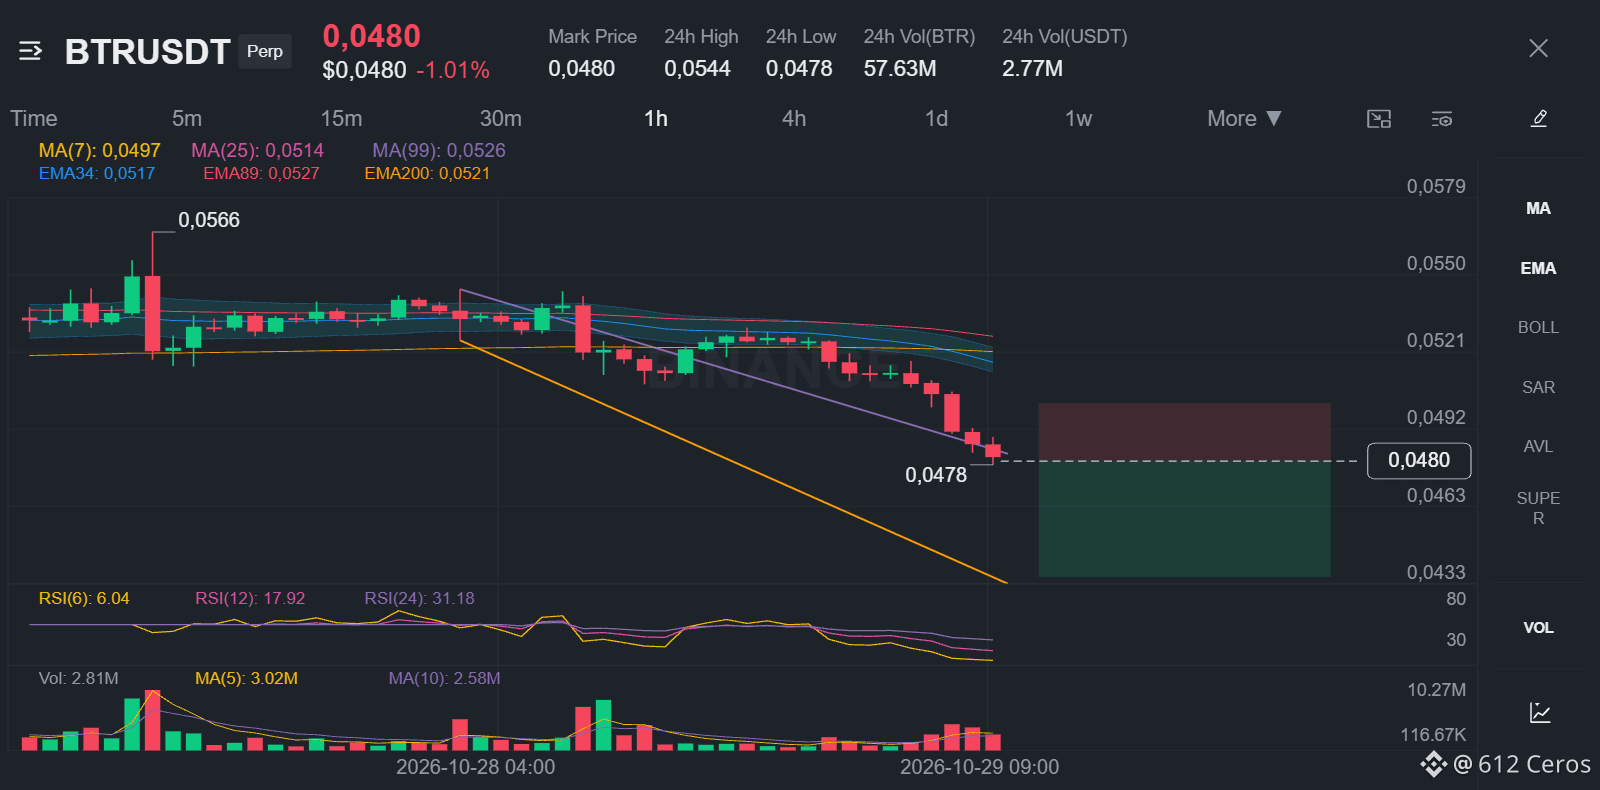
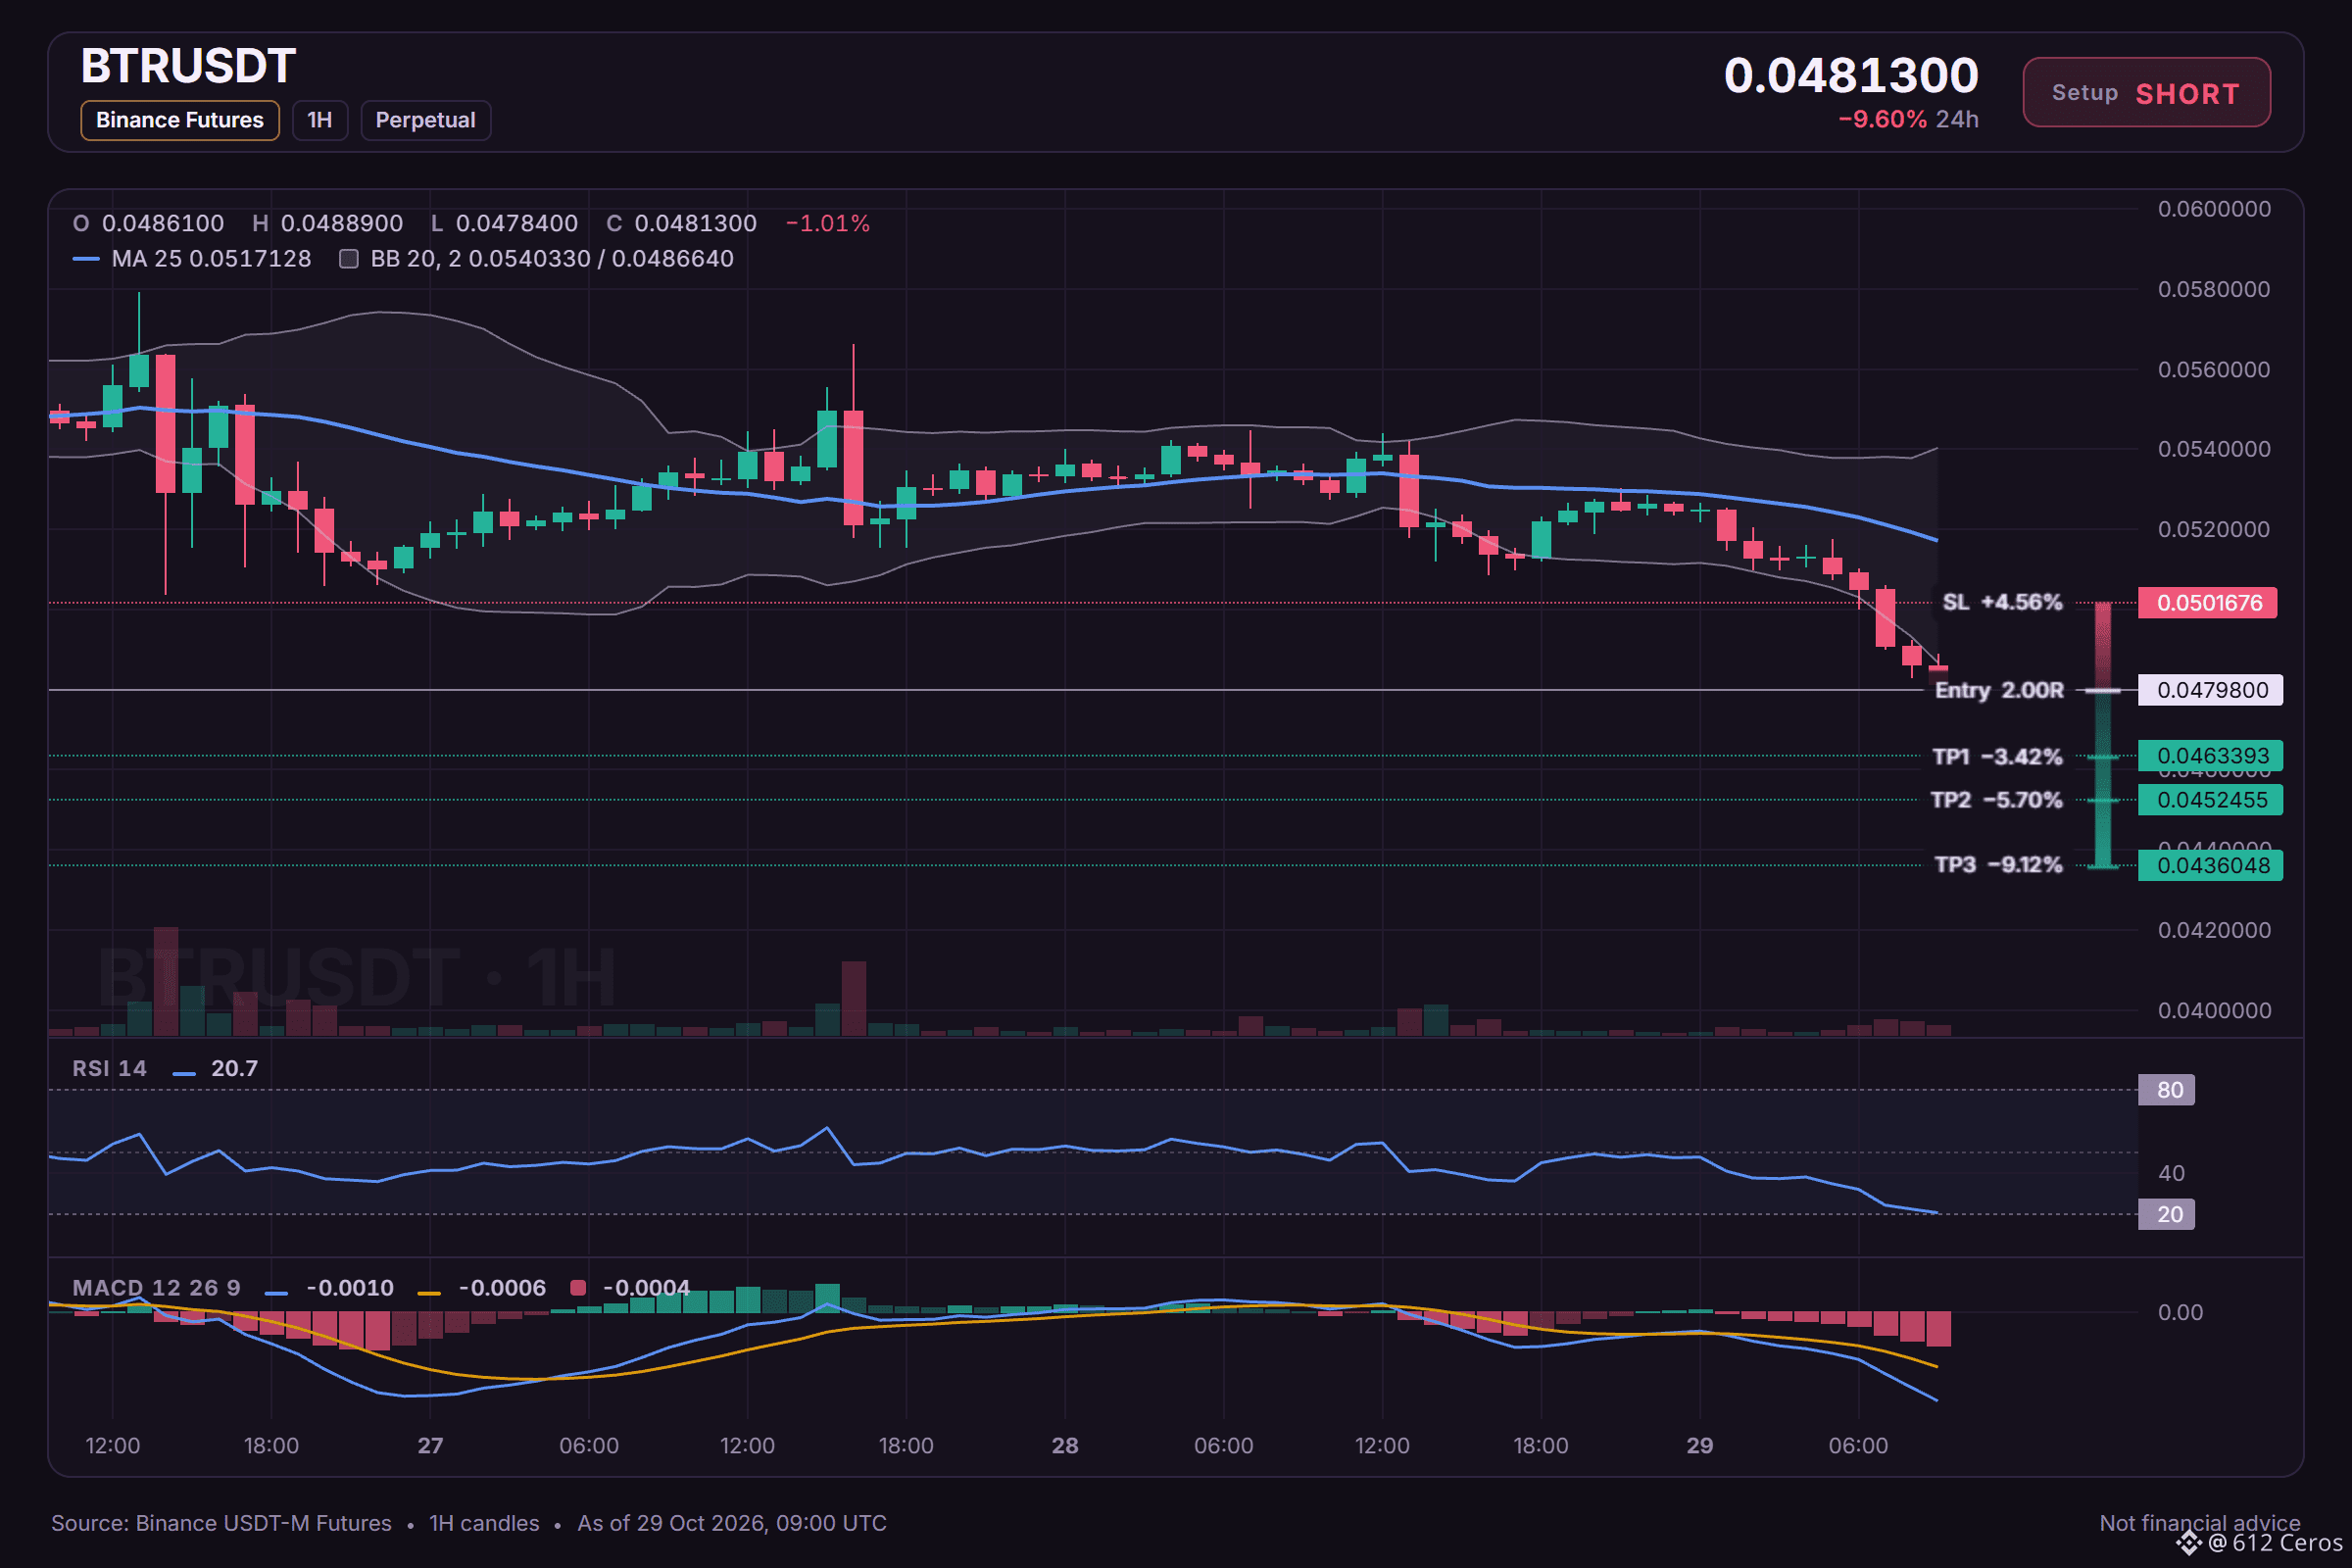
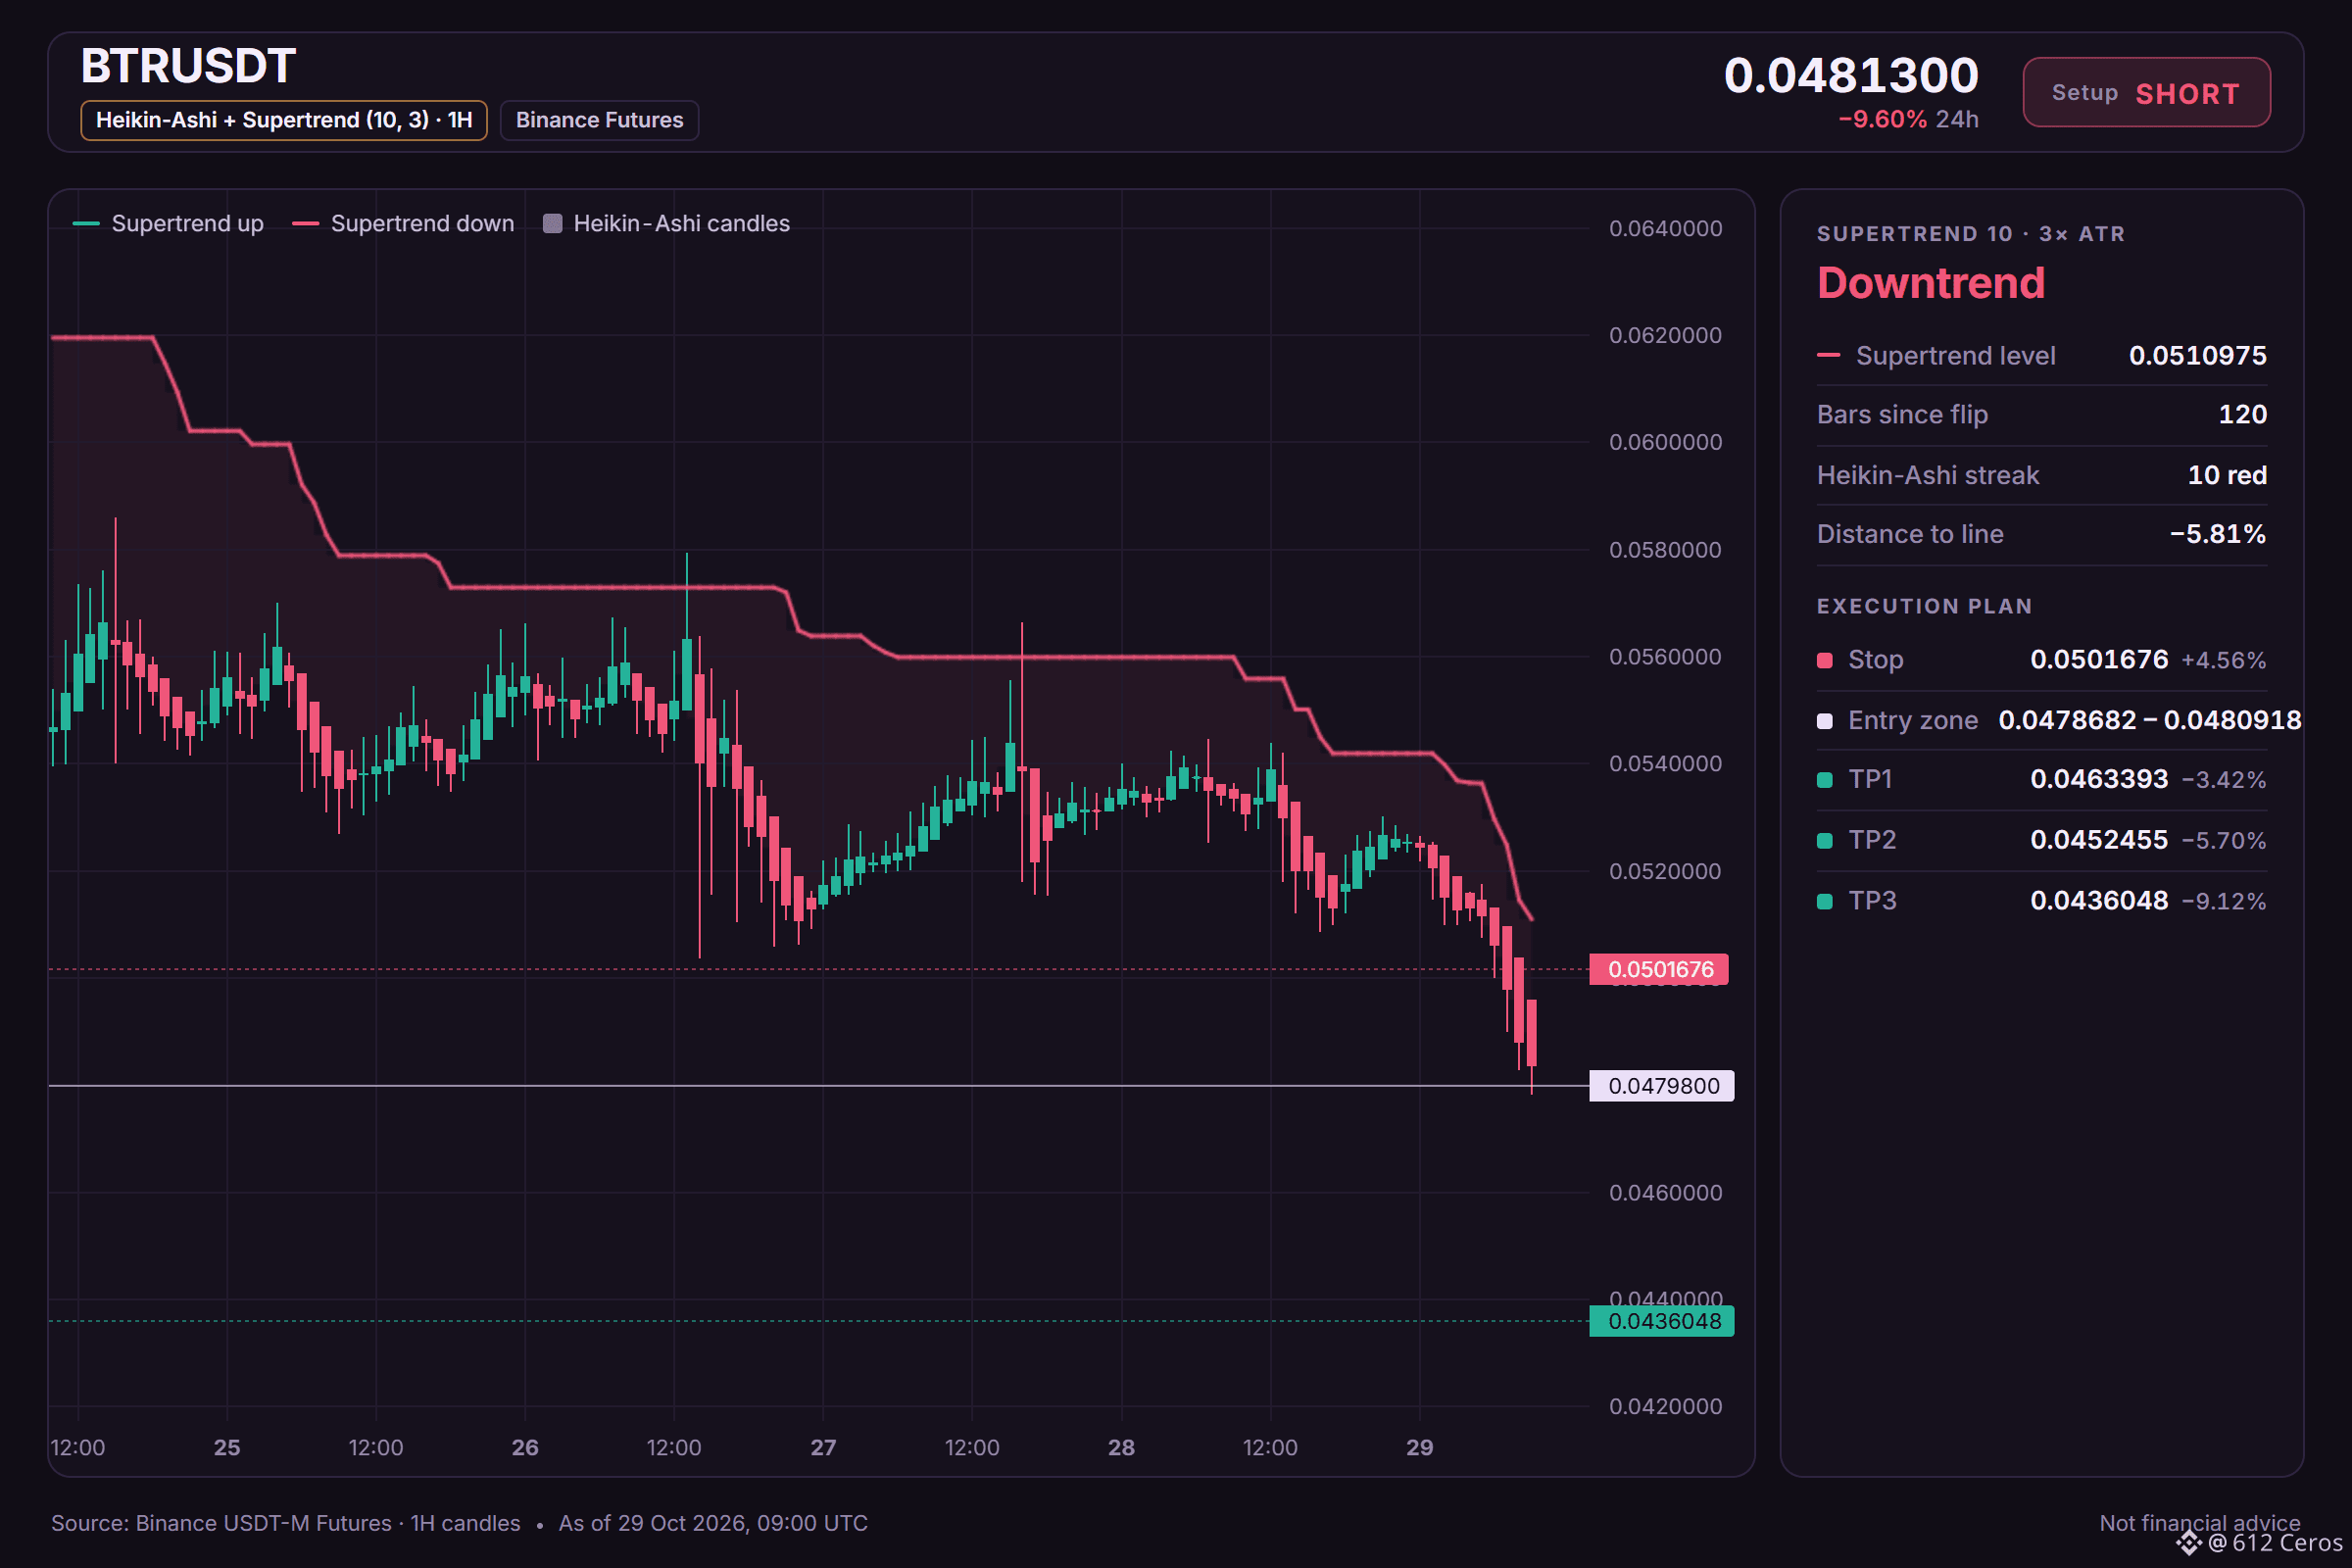
BTR short setup: the levels I'm watching
🔴 SHORT $BTR /USDT: expecting price to go DOWN
Bias: SHORT · Leaning
Entry: 0.0478682 – 0.0480918
TP1: 0.0463393 (-3.4%)
TP2: 0.0452455 (-5.7%)
TP3: 0.0436048 (-9.1%)
SL: 0.0501676 (+4.6%)
Plan: enter only inside the zone, close 50% at TP1, 25% at TP2, 25% at TP3, and move the stop to entry after TP1.
Note: moderate conviction only, keep size light.
Why SHORT? 5/12 signals agree, 1 against.
• Daily trend down (below EMA50 & EMA200)
• Sellers are driving the move (15m ADX 58.0)
• Sellers have the momentum (4h RSI 36.3)
Risk: Price is washed out, bounces are common from here (1h RSI 20.7, oversold)
Why I like it:
The daily trend reads bearish, and 5/12 signals aligned favour the short side. The plan is to work the 0.0478682 – 0.0480918 zone, scale out at 0.0463393 and 0.0452455, and stay patient for 0.0436048. A move through 0.0501676 means the idea is wrong and the stop does its job.
Does BTR tag 0.0463393 first, or the stop?
Full setup on the chart below.
{future}(BTRUSDT)
📲 Want more of my latest signals? Join me here:
[https://app.binance.com/uni-qr/D26WbL9t](https://app.binance.com/uni-qr/D26WbL9t)
⚠️ Personal market analysis only. NFA — manage risk and DYOR.
Educational content, not investment advice or a recommendation to buy, sell, deposit, or withdraw any asset. No paid promotion or referral/affiliate links.
BTR short setup: the levels I'm watching
🔴 SHORT $BTR /USDT: expecting price to go DOWN
Bias: SHORT · Leaning
Entry: 0.0478682 – 0.0480918
TP1: 0.0463393 (-3.4%)
TP2: 0.0452455 (-5.7%)
TP3: 0.0436048 (-9.1%)
SL: 0.0501676 (+4.6%)
Plan: enter only inside the zone, close 50% at TP1, 25% at TP2, 25% at TP3, and move the stop to entry after TP1.
Note: moderate conviction only, keep size light.
Why SHORT? 5/12 signals agree, 1 against.
• Daily trend down (below EMA50 & EMA200)
• Sellers are driving the move (15m ADX 58.0)
• Sellers have the momentum (4h RSI 36.3)
Risk: Price is washed out, bounces are common from here (1h RSI 20.7, oversold)
Why I like it:
The daily trend reads bearish, and 5/12 signals aligned favour the short side. The plan is to work the 0.0478682 – 0.0480918 zone, scale out at 0.0463393 and 0.0452455, and stay patient for 0.0436048. A move through 0.0501676 means the idea is wrong and the stop does its job.
Does BTR tag 0.0463393 first, or the stop?
Full setup on the chart below.
📲 Want more of my latest signals? Join me here:
https://app.binance.com/uni-qr/D26WbL9t
⚠️ Personal market analysis only. NFA — manage risk and DYOR.
Educational content, not investment advice or a recommendation to buy, sell, deposit, or withdraw any asset. No paid promotion or referral/affiliate links.
1
1.3k
·
--
Рост
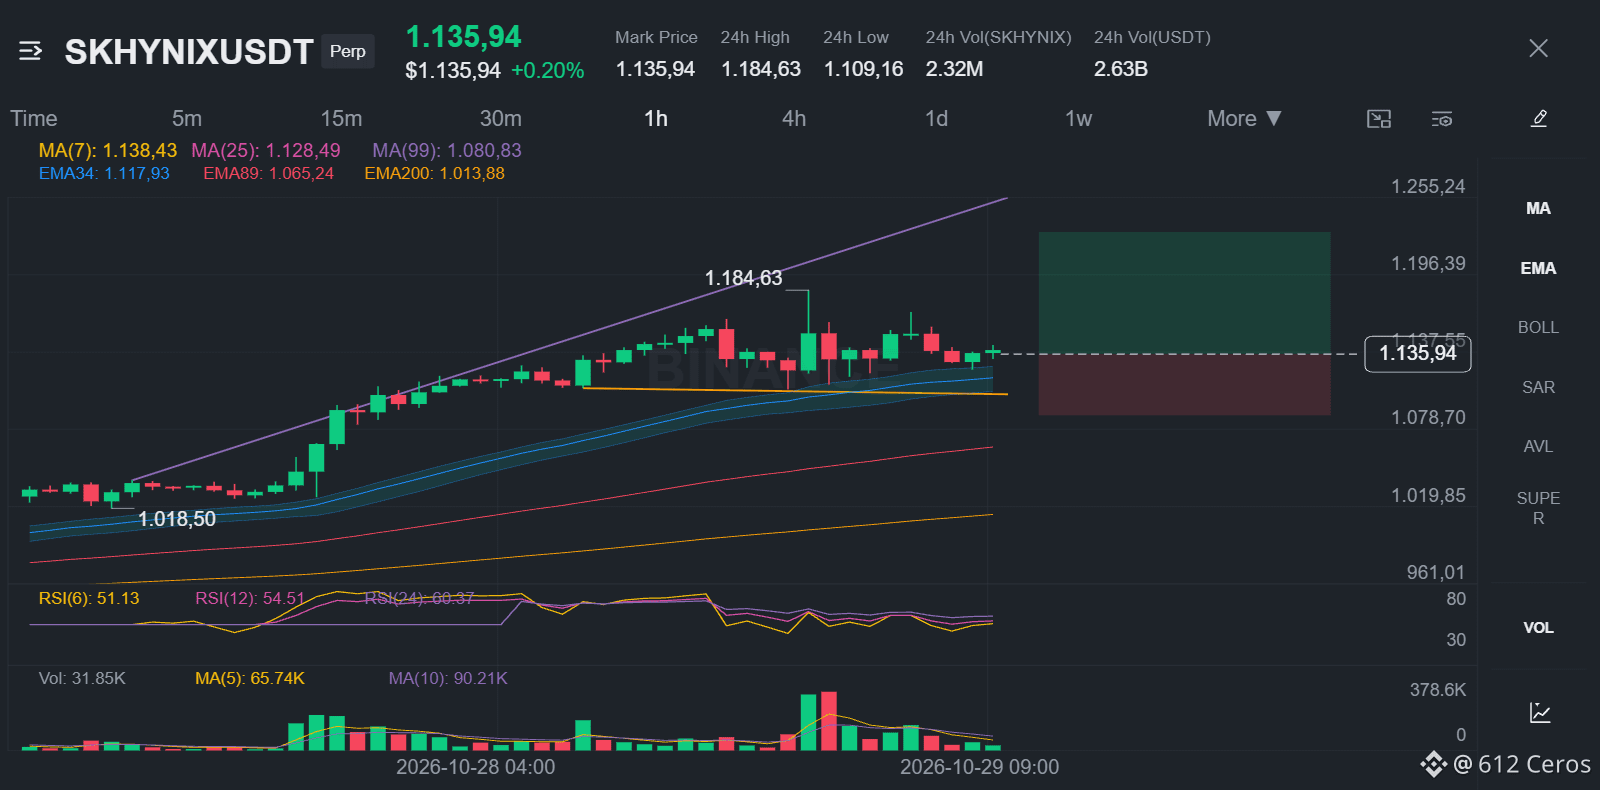
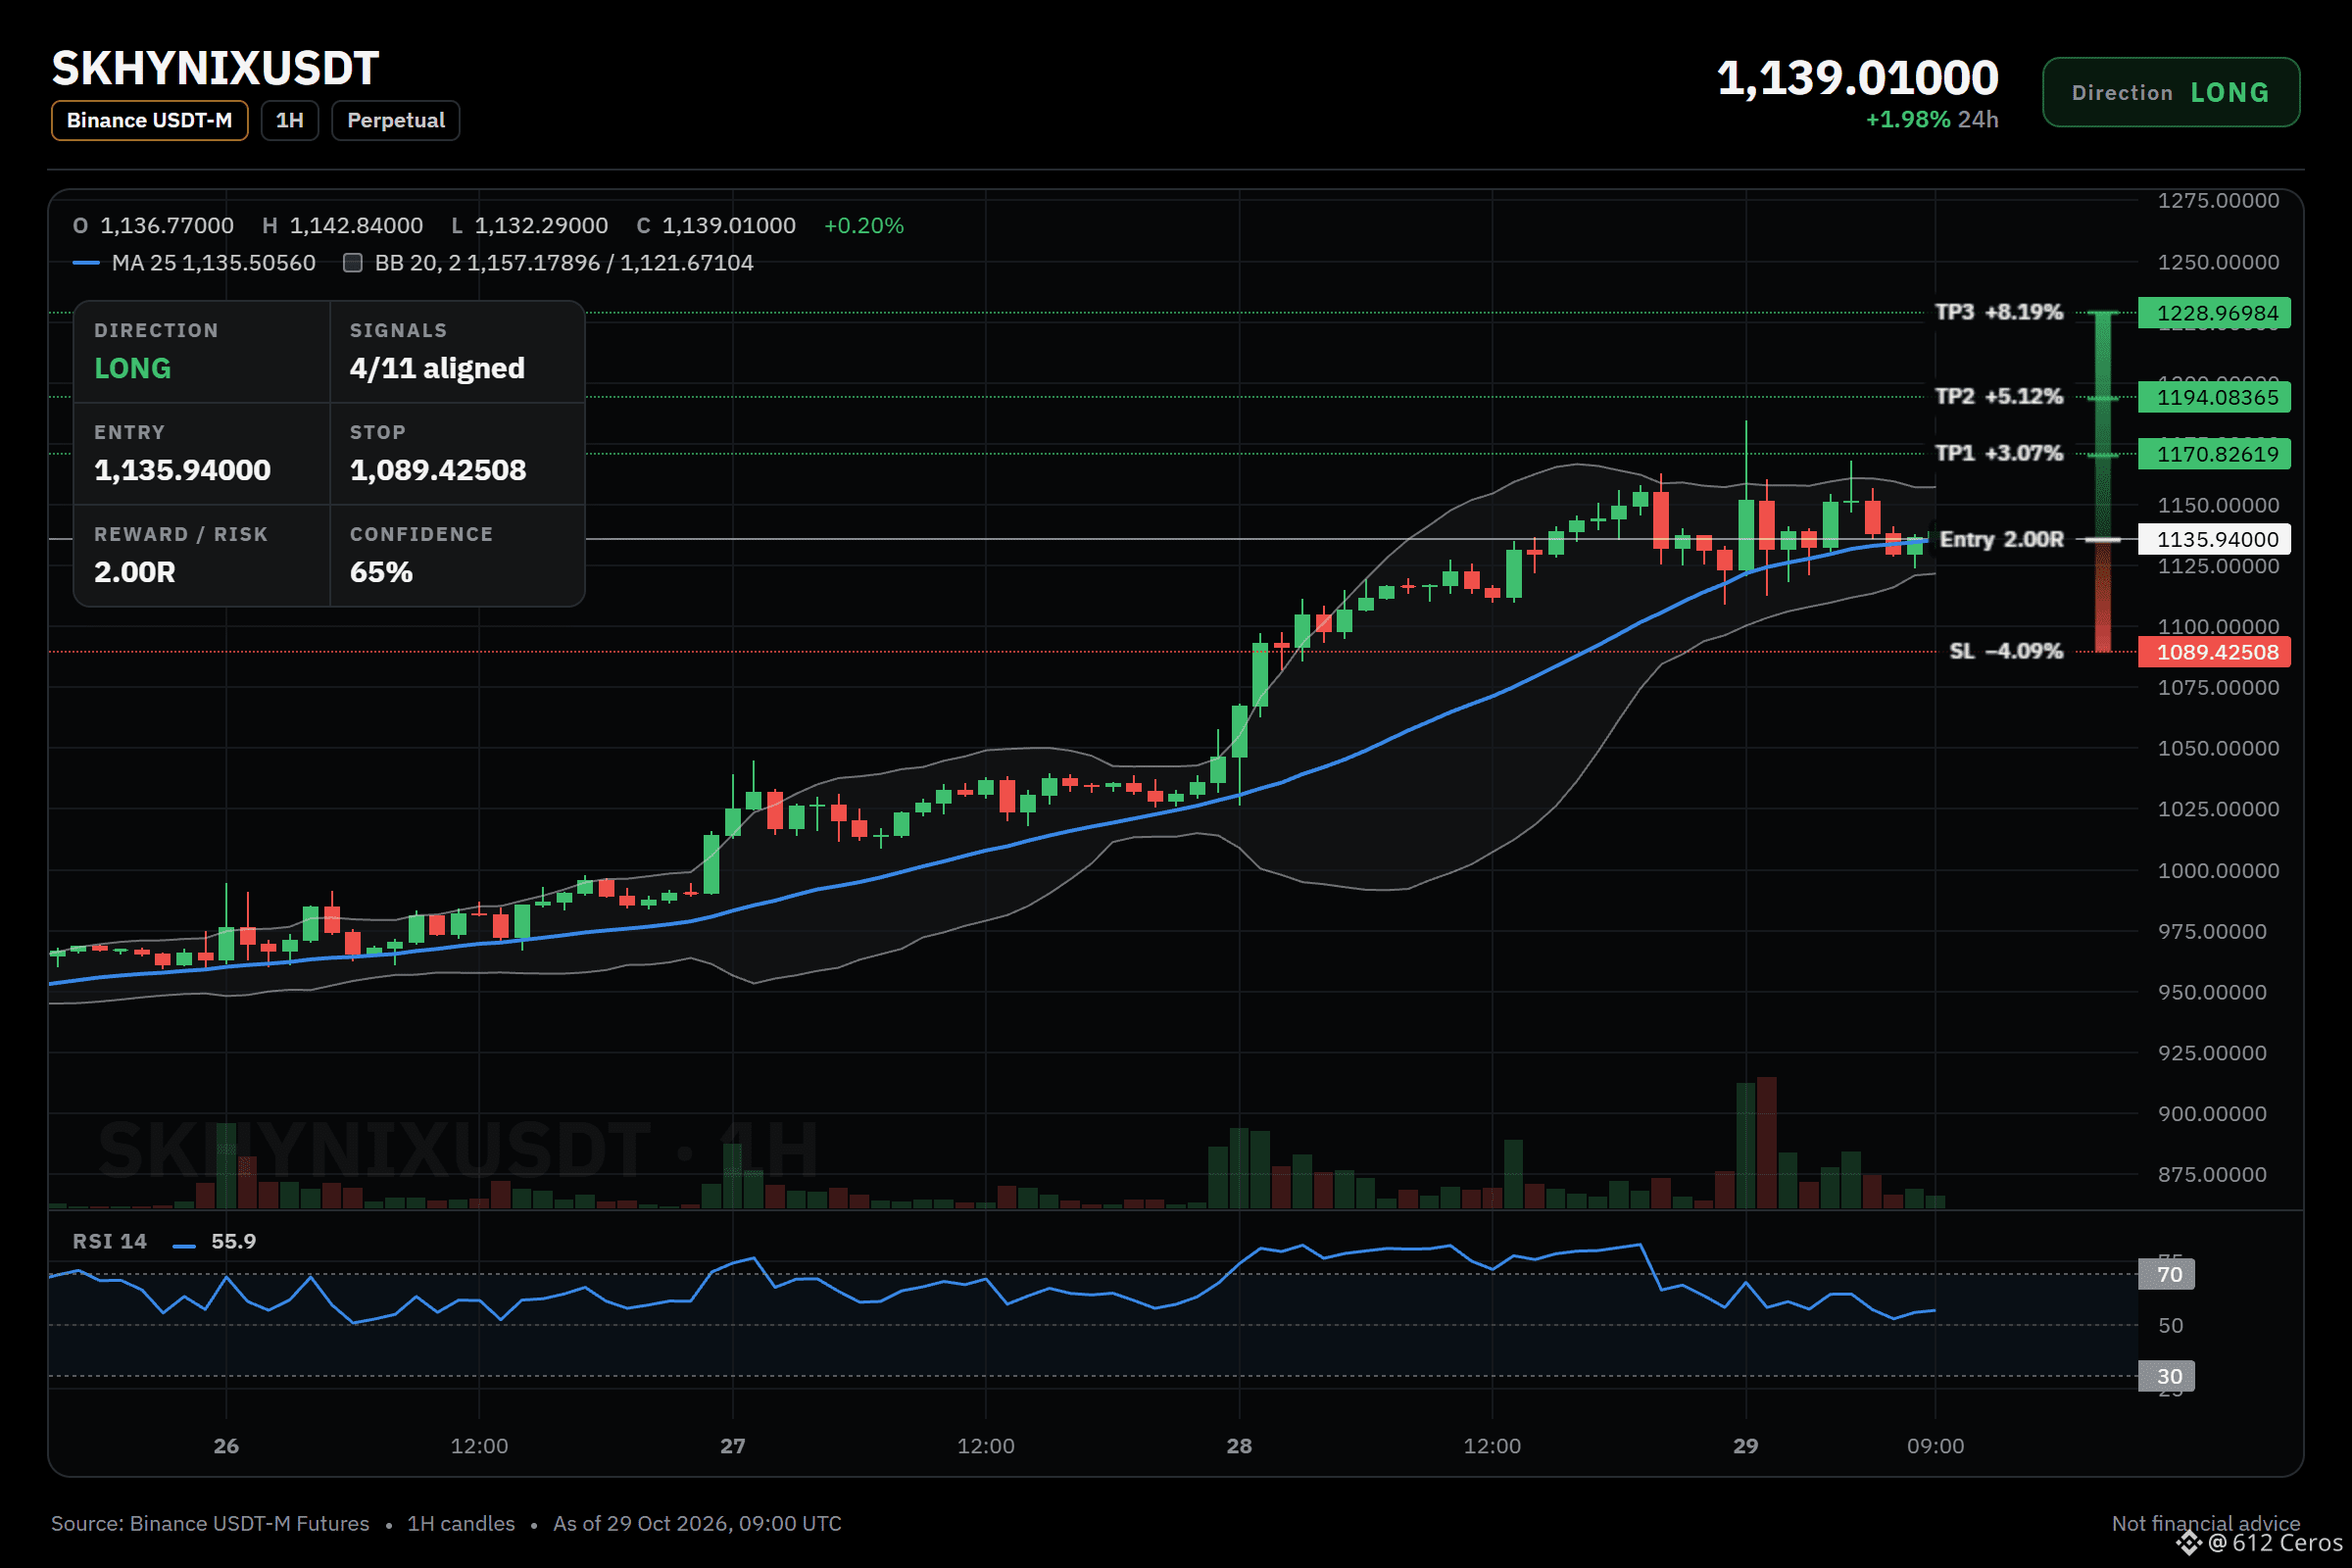
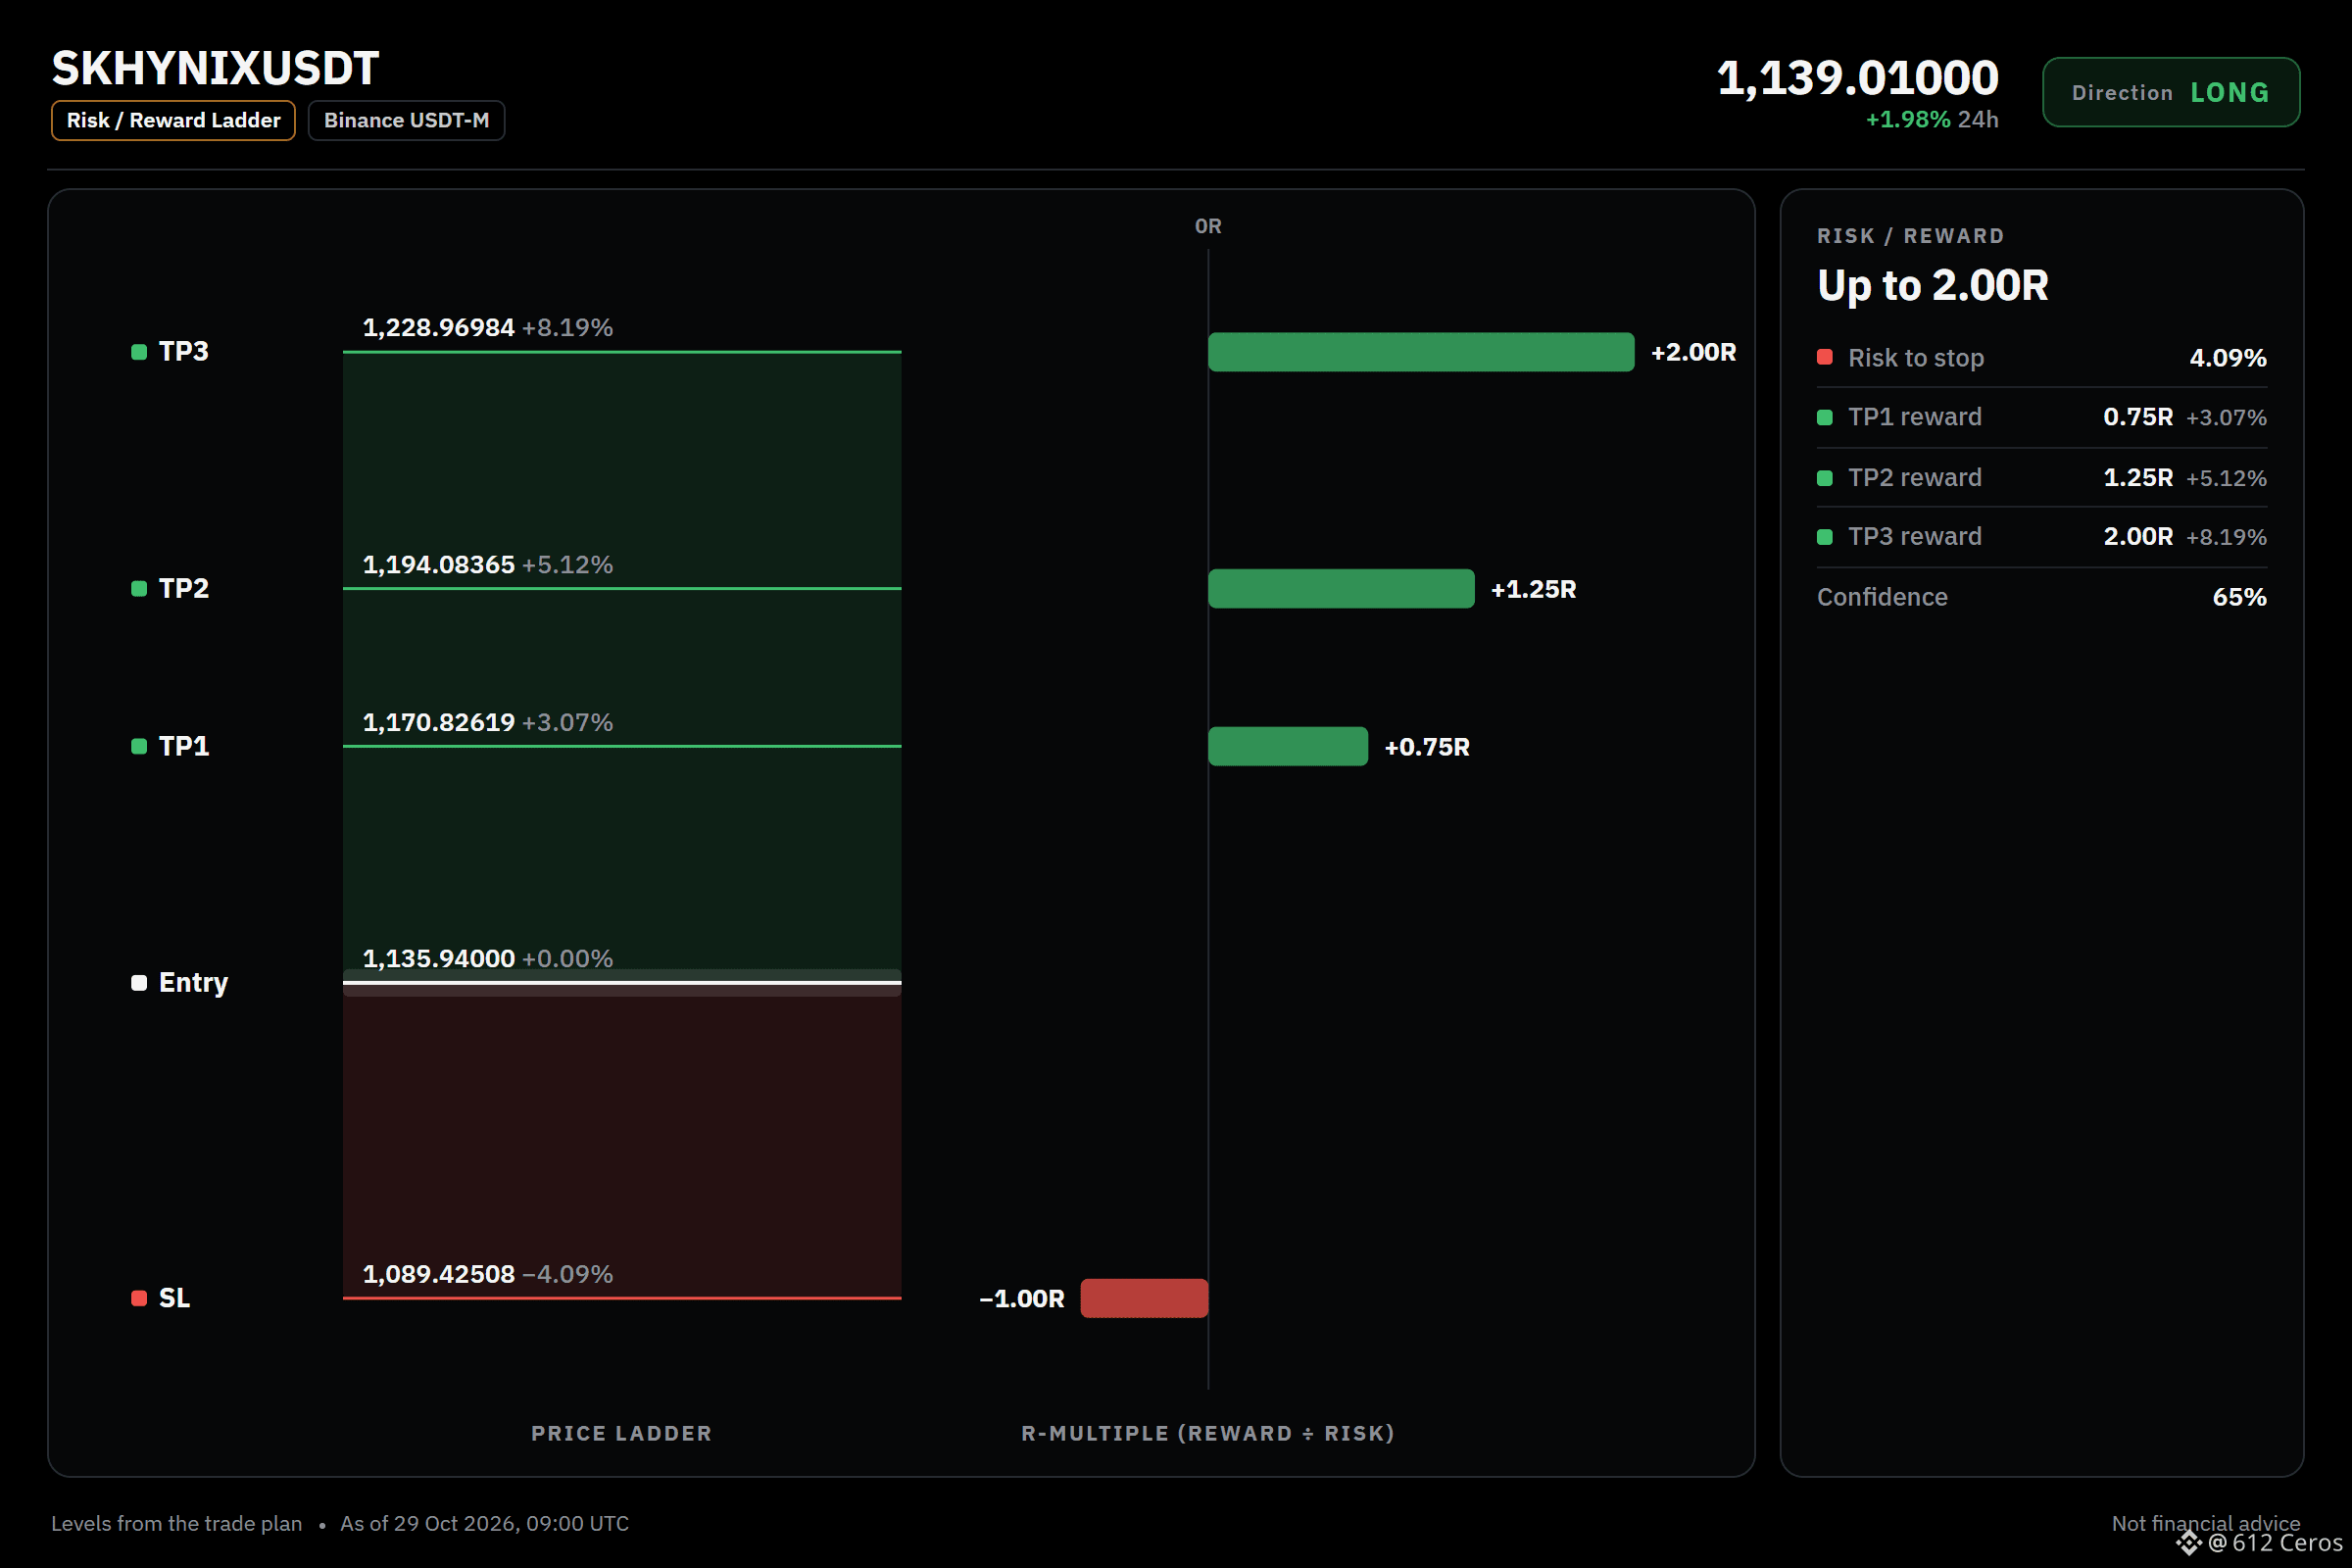
SKHYNIX long setup: the levels I'm watching
🟢 LONG $SKHYNIX /USDT: expecting price to go UP
Bias: LONG · Leaning
Entry: 1133.89135 – 1137.98865
TP1: 1170.82619 (+3.1%)
TP2: 1194.08365 (+5.1%)
TP3: 1228.96984 (+8.2%)
SL: 1089.42508 (-4.1%)
Plan: enter only inside the zone, close 50% at TP1, 25% at TP2, 25% at TP3, and move the stop to entry after TP1.
Note: moderate conviction only, keep size light.
Why LONG? 4/11 signals agree, 0 against.
• 1h trend up (above EMA50 & EMA200)
• Buyers have the momentum (4h RSI 72.9)
• Buyers have the momentum (1h RSI 55.9)
Why now?
The daily trend reads range, and 4/11 signals aligned favour the long side. The plan is to work the 1133.89135 – 1137.98865 zone, scale out at 1170.82619 and 1194.08365, and stay patient for 1228.96984. A move through 1089.42508 means the idea is wrong and the stop does its job.
Does SKHYNIX tag 1170.82619 first, or the stop?
Levels mapped on the chart below.
{future}(SKHYNIXUSDT)
📲 Want more of my latest signals? Join me here:
[https://app.binance.com/uni-qr/D26WbL9t](https://app.binance.com/uni-qr/D26WbL9t)
⚠️ Personal market analysis only. NFA — manage risk and DYOR.
Educational content, not investment advice or a recommendation to buy, sell, deposit, or withdraw any asset. No paid promotion or referral/affiliate links.
SKHYNIX long setup: the levels I'm watching
🟢 LONG $SKHYNIX /USDT: expecting price to go UP
Bias: LONG · Leaning
Entry: 1133.89135 – 1137.98865
TP1: 1170.82619 (+3.1%)
TP2: 1194.08365 (+5.1%)
TP3: 1228.96984 (+8.2%)
SL: 1089.42508 (-4.1%)
Plan: enter only inside the zone, close 50% at TP1, 25% at TP2, 25% at TP3, and move the stop to entry after TP1.
Note: moderate conviction only, keep size light.
Why LONG? 4/11 signals agree, 0 against.
• 1h trend up (above EMA50 & EMA200)
• Buyers have the momentum (4h RSI 72.9)
• Buyers have the momentum (1h RSI 55.9)
Why now?
The daily trend reads range, and 4/11 signals aligned favour the long side. The plan is to work the 1133.89135 – 1137.98865 zone, scale out at 1170.82619 and 1194.08365, and stay patient for 1228.96984. A move through 1089.42508 means the idea is wrong and the stop does its job.
Does SKHYNIX tag 1170.82619 first, or the stop?
Levels mapped on the chart below.
📲 Want more of my latest signals? Join me here:
https://app.binance.com/uni-qr/D26WbL9t
⚠️ Personal market analysis only. NFA — manage risk and DYOR.
Educational content, not investment advice or a recommendation to buy, sell, deposit, or withdraw any asset. No paid promotion or referral/affiliate links.
3
1.8k
·
--
Падение
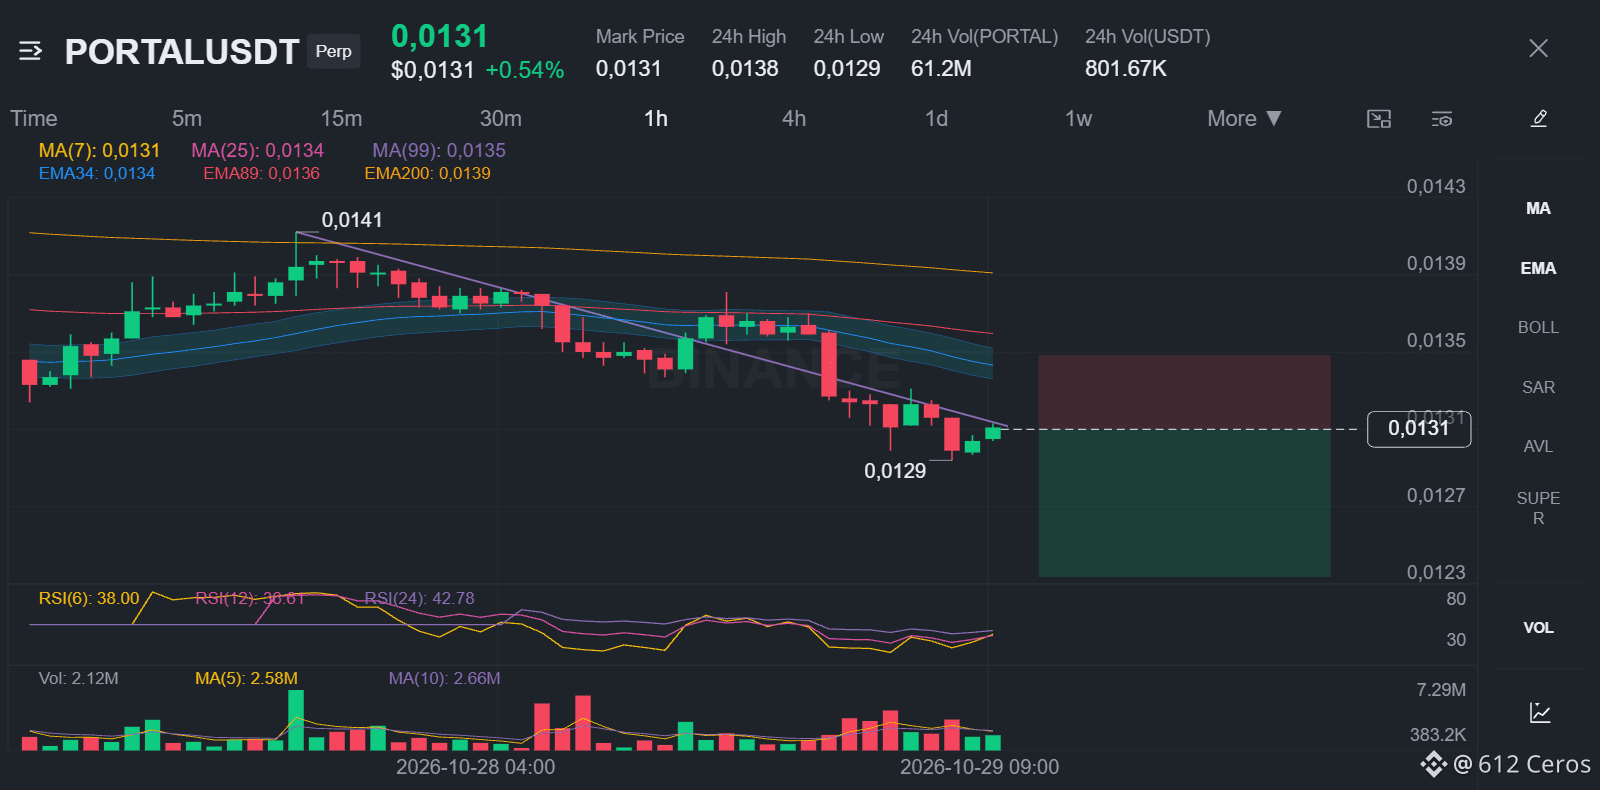
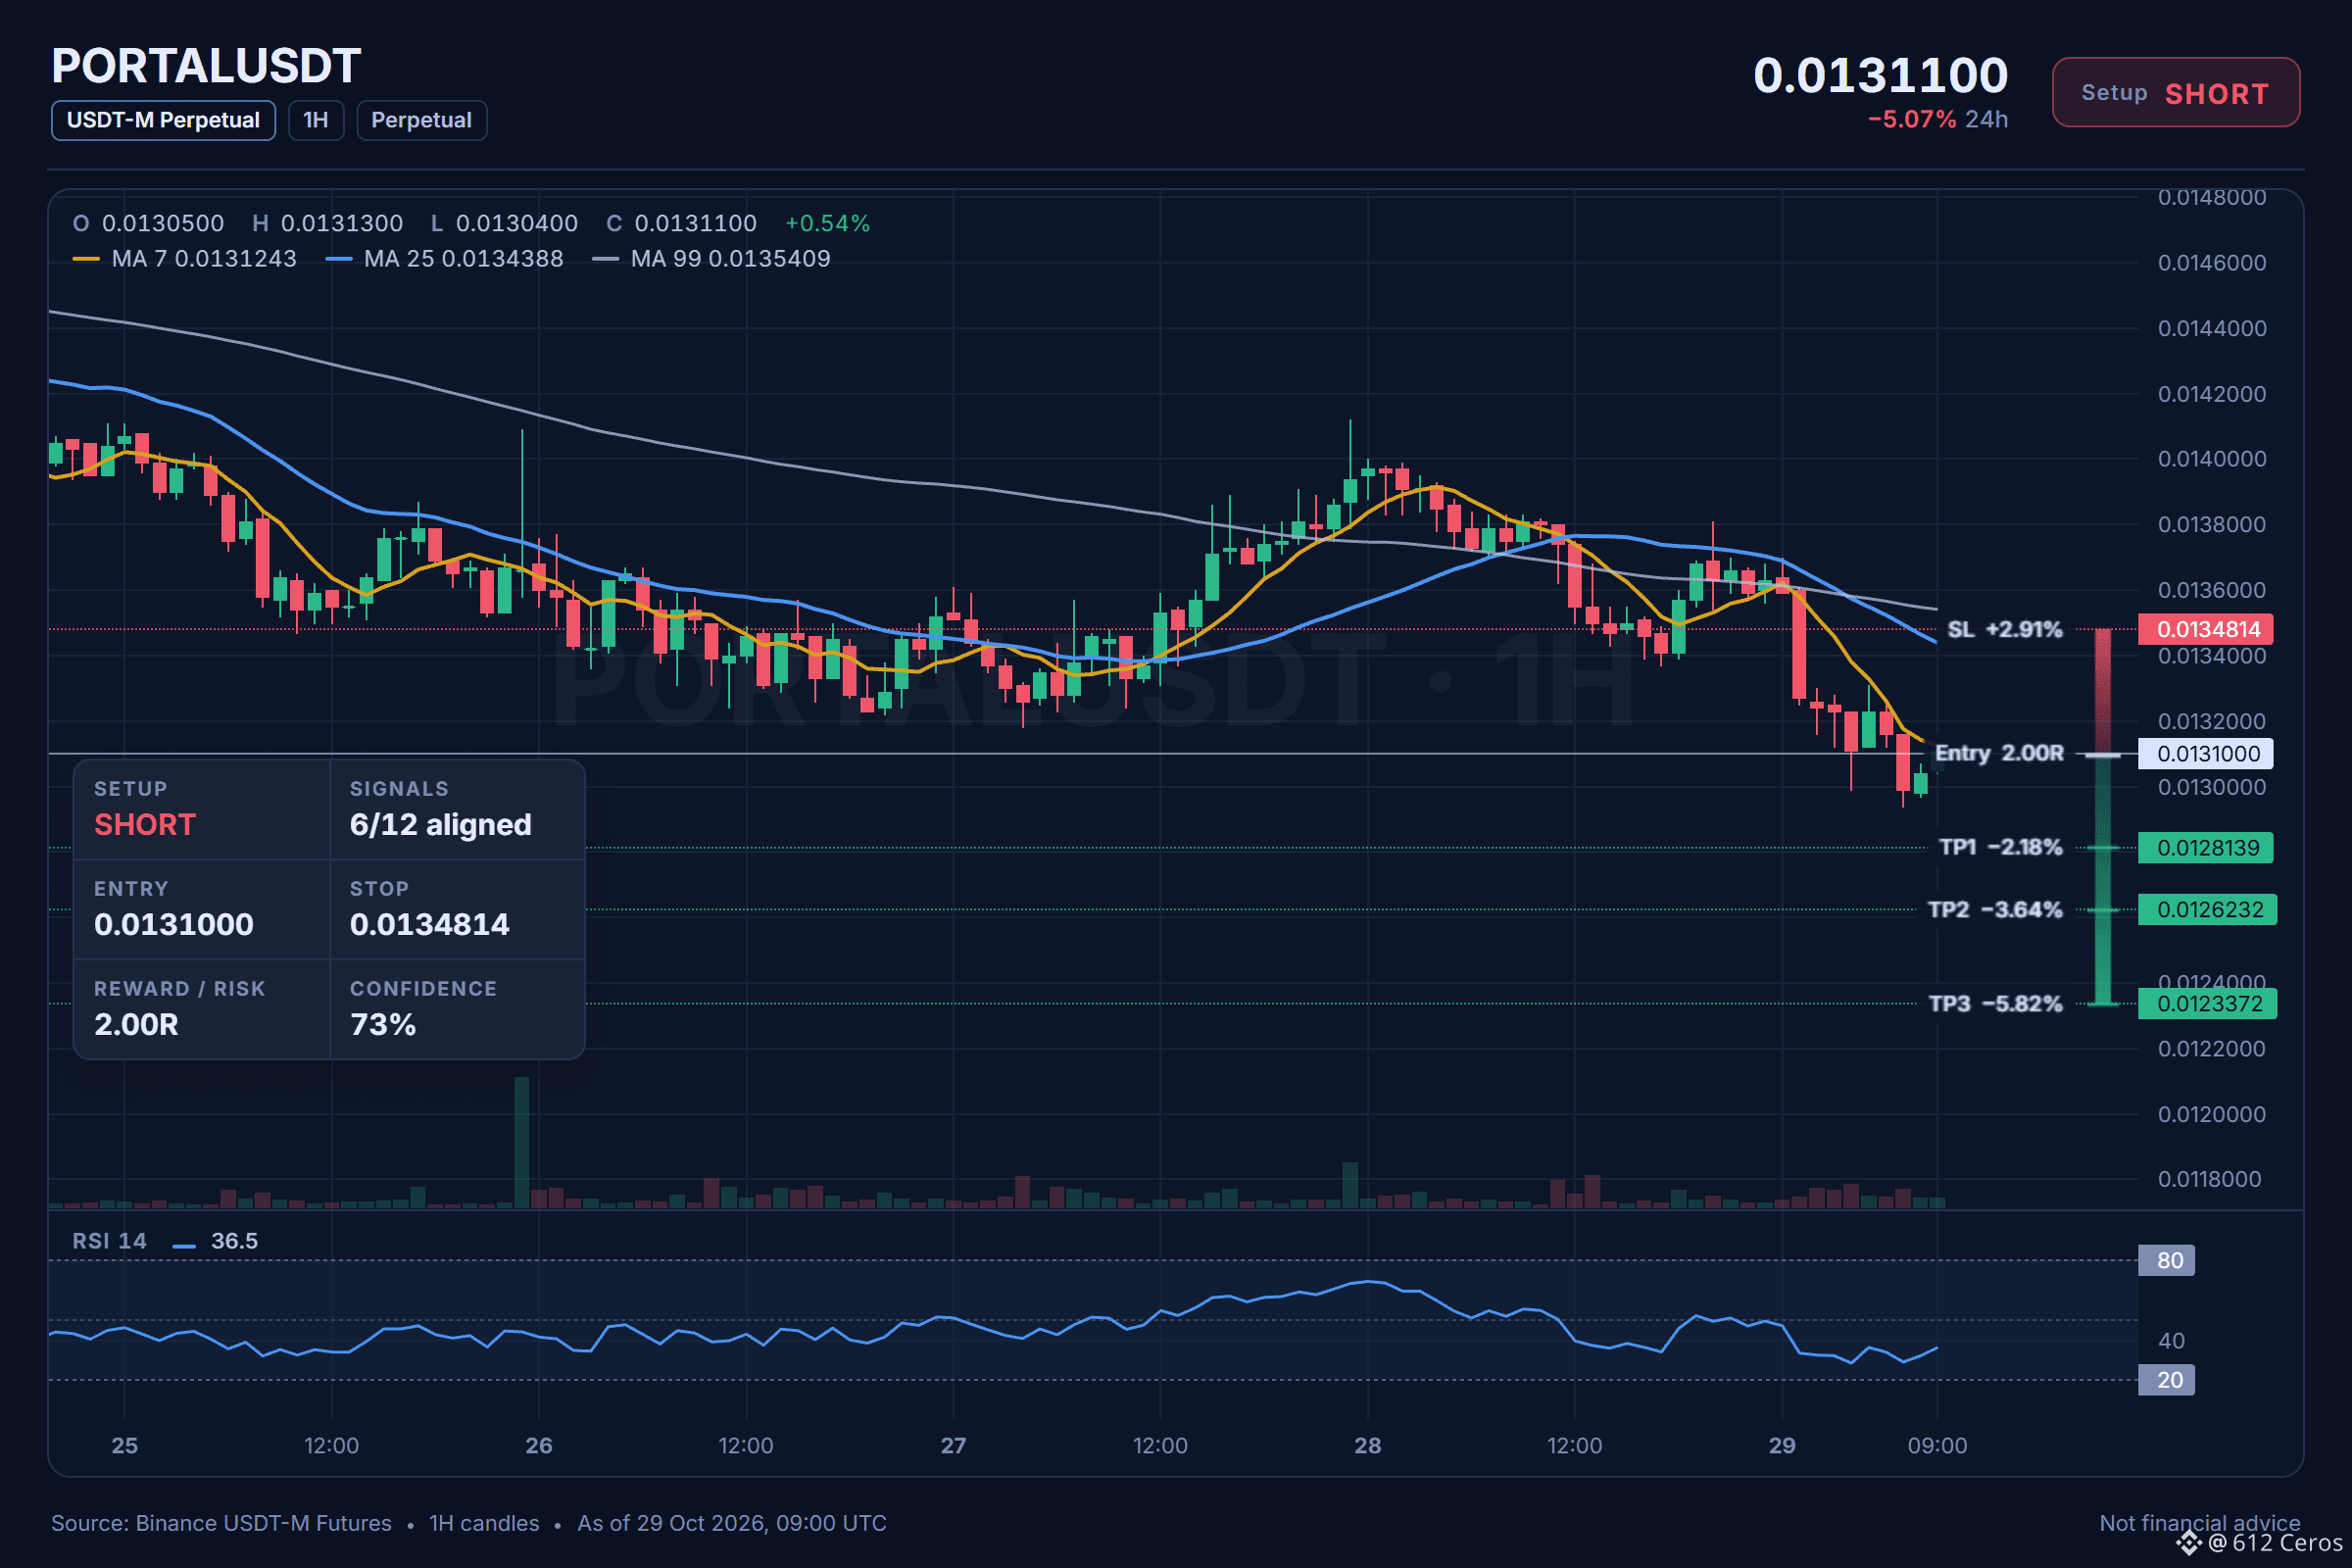
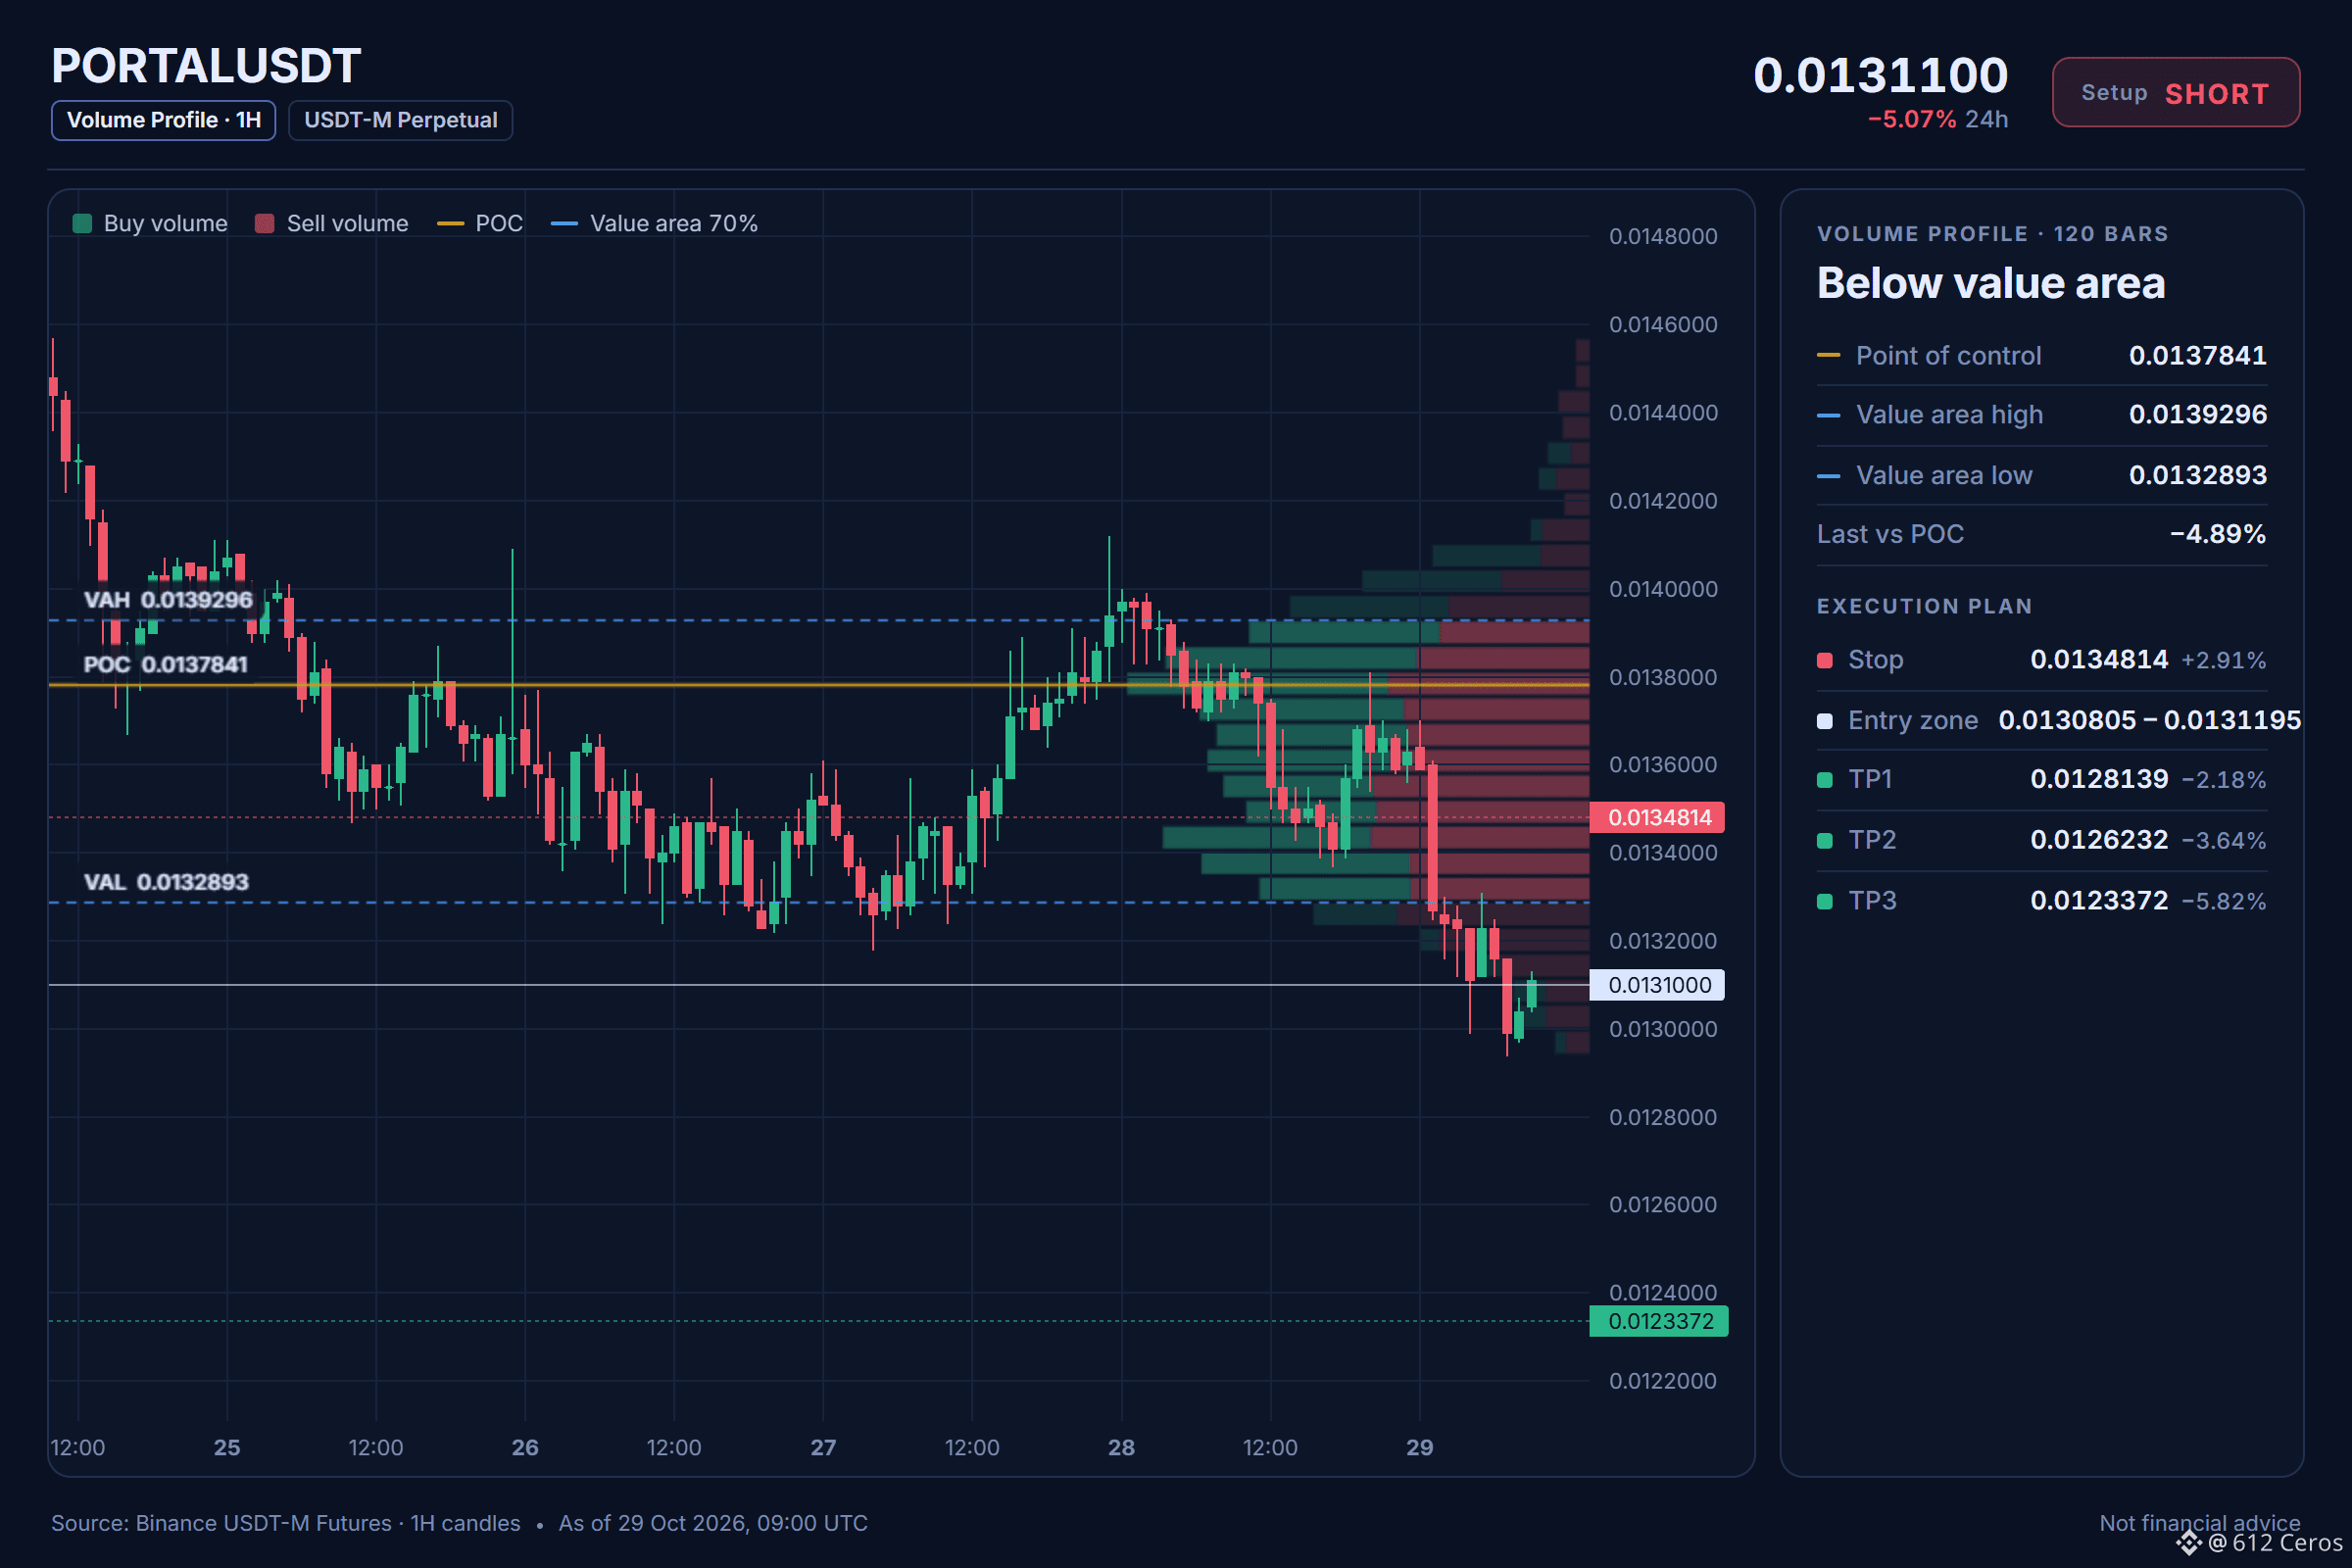
PORTAL is sliding in a clear 4h downtrend.
🔴 SHORT $PORTAL /USDT: expecting price to go DOWN
Bias: SHORT · Strong
Entry: 0.0130805 – 0.0131195
TP1: 0.0128139 (-2.2%)
TP2: 0.0126232 (-3.6%)
TP3: 0.0123372 (-5.8%)
SL: 0.0134814 (+2.9%)
Plan: enter only inside the zone, close 50% at TP1, 25% at TP2, 25% at TP3, and move the stop to entry after TP1.
Why SHORT? What I checked: 6/12 agree, 0 against.
• 4h trend down (below EMA50 & EMA200)
• 1h trend down (below EMA50 & EMA200)
• Sellers are driving the move (15m ADX 40.6)
Watch: The idea is wrong if price reaches the stop at 0.0134814
Bottom line: The 4h trend is strongly bearish, but the daily trend is a range, which means the bigger picture is not clearly bearish.
Where would you place your short stop on PORTAL?
Chart with every level below.
{future}(PORTALUSDT)
📲 Want more of my latest signals? Join me here:
[https://app.binance.com/uni-qr/D26WbL9t](https://app.binance.com/uni-qr/D26WbL9t)
⚠️ Personal market analysis only. NFA — manage risk and DYOR.
Educational content, not investment advice or a recommendation to buy, sell, deposit, or withdraw any asset. No paid promotion or referral/affiliate links.
PORTAL is sliding in a clear 4h downtrend.
🔴 SHORT $PORTAL /USDT: expecting price to go DOWN
Bias: SHORT · Strong
Entry: 0.0130805 – 0.0131195
TP1: 0.0128139 (-2.2%)
TP2: 0.0126232 (-3.6%)
TP3: 0.0123372 (-5.8%)
SL: 0.0134814 (+2.9%)
Plan: enter only inside the zone, close 50% at TP1, 25% at TP2, 25% at TP3, and move the stop to entry after TP1.
Why SHORT? What I checked: 6/12 agree, 0 against.
• 4h trend down (below EMA50 & EMA200)
• 1h trend down (below EMA50 & EMA200)
• Sellers are driving the move (15m ADX 40.6)
Watch: The idea is wrong if price reaches the stop at 0.0134814
Bottom line: The 4h trend is strongly bearish, but the daily trend is a range, which means the bigger picture is not clearly bearish.
Where would you place your short stop on PORTAL?
Chart with every level below.
📲 Want more of my latest signals? Join me here:
https://app.binance.com/uni-qr/D26WbL9t
⚠️ Personal market analysis only. NFA — manage risk and DYOR.
Educational content, not investment advice or a recommendation to buy, sell, deposit, or withdraw any asset. No paid promotion or referral/affiliate links.
2
1
1
799
·
--
Падение
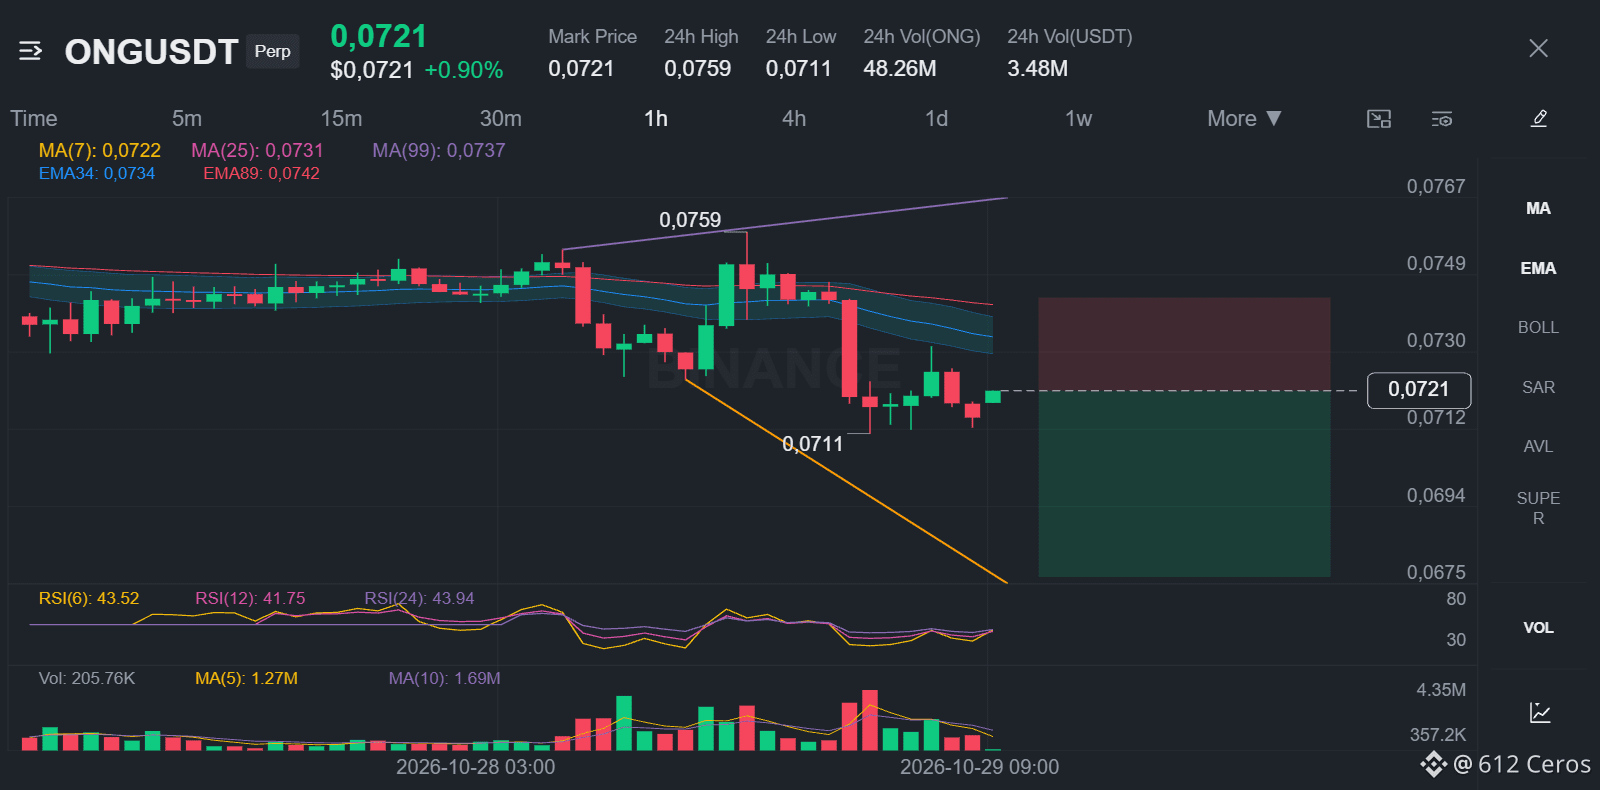
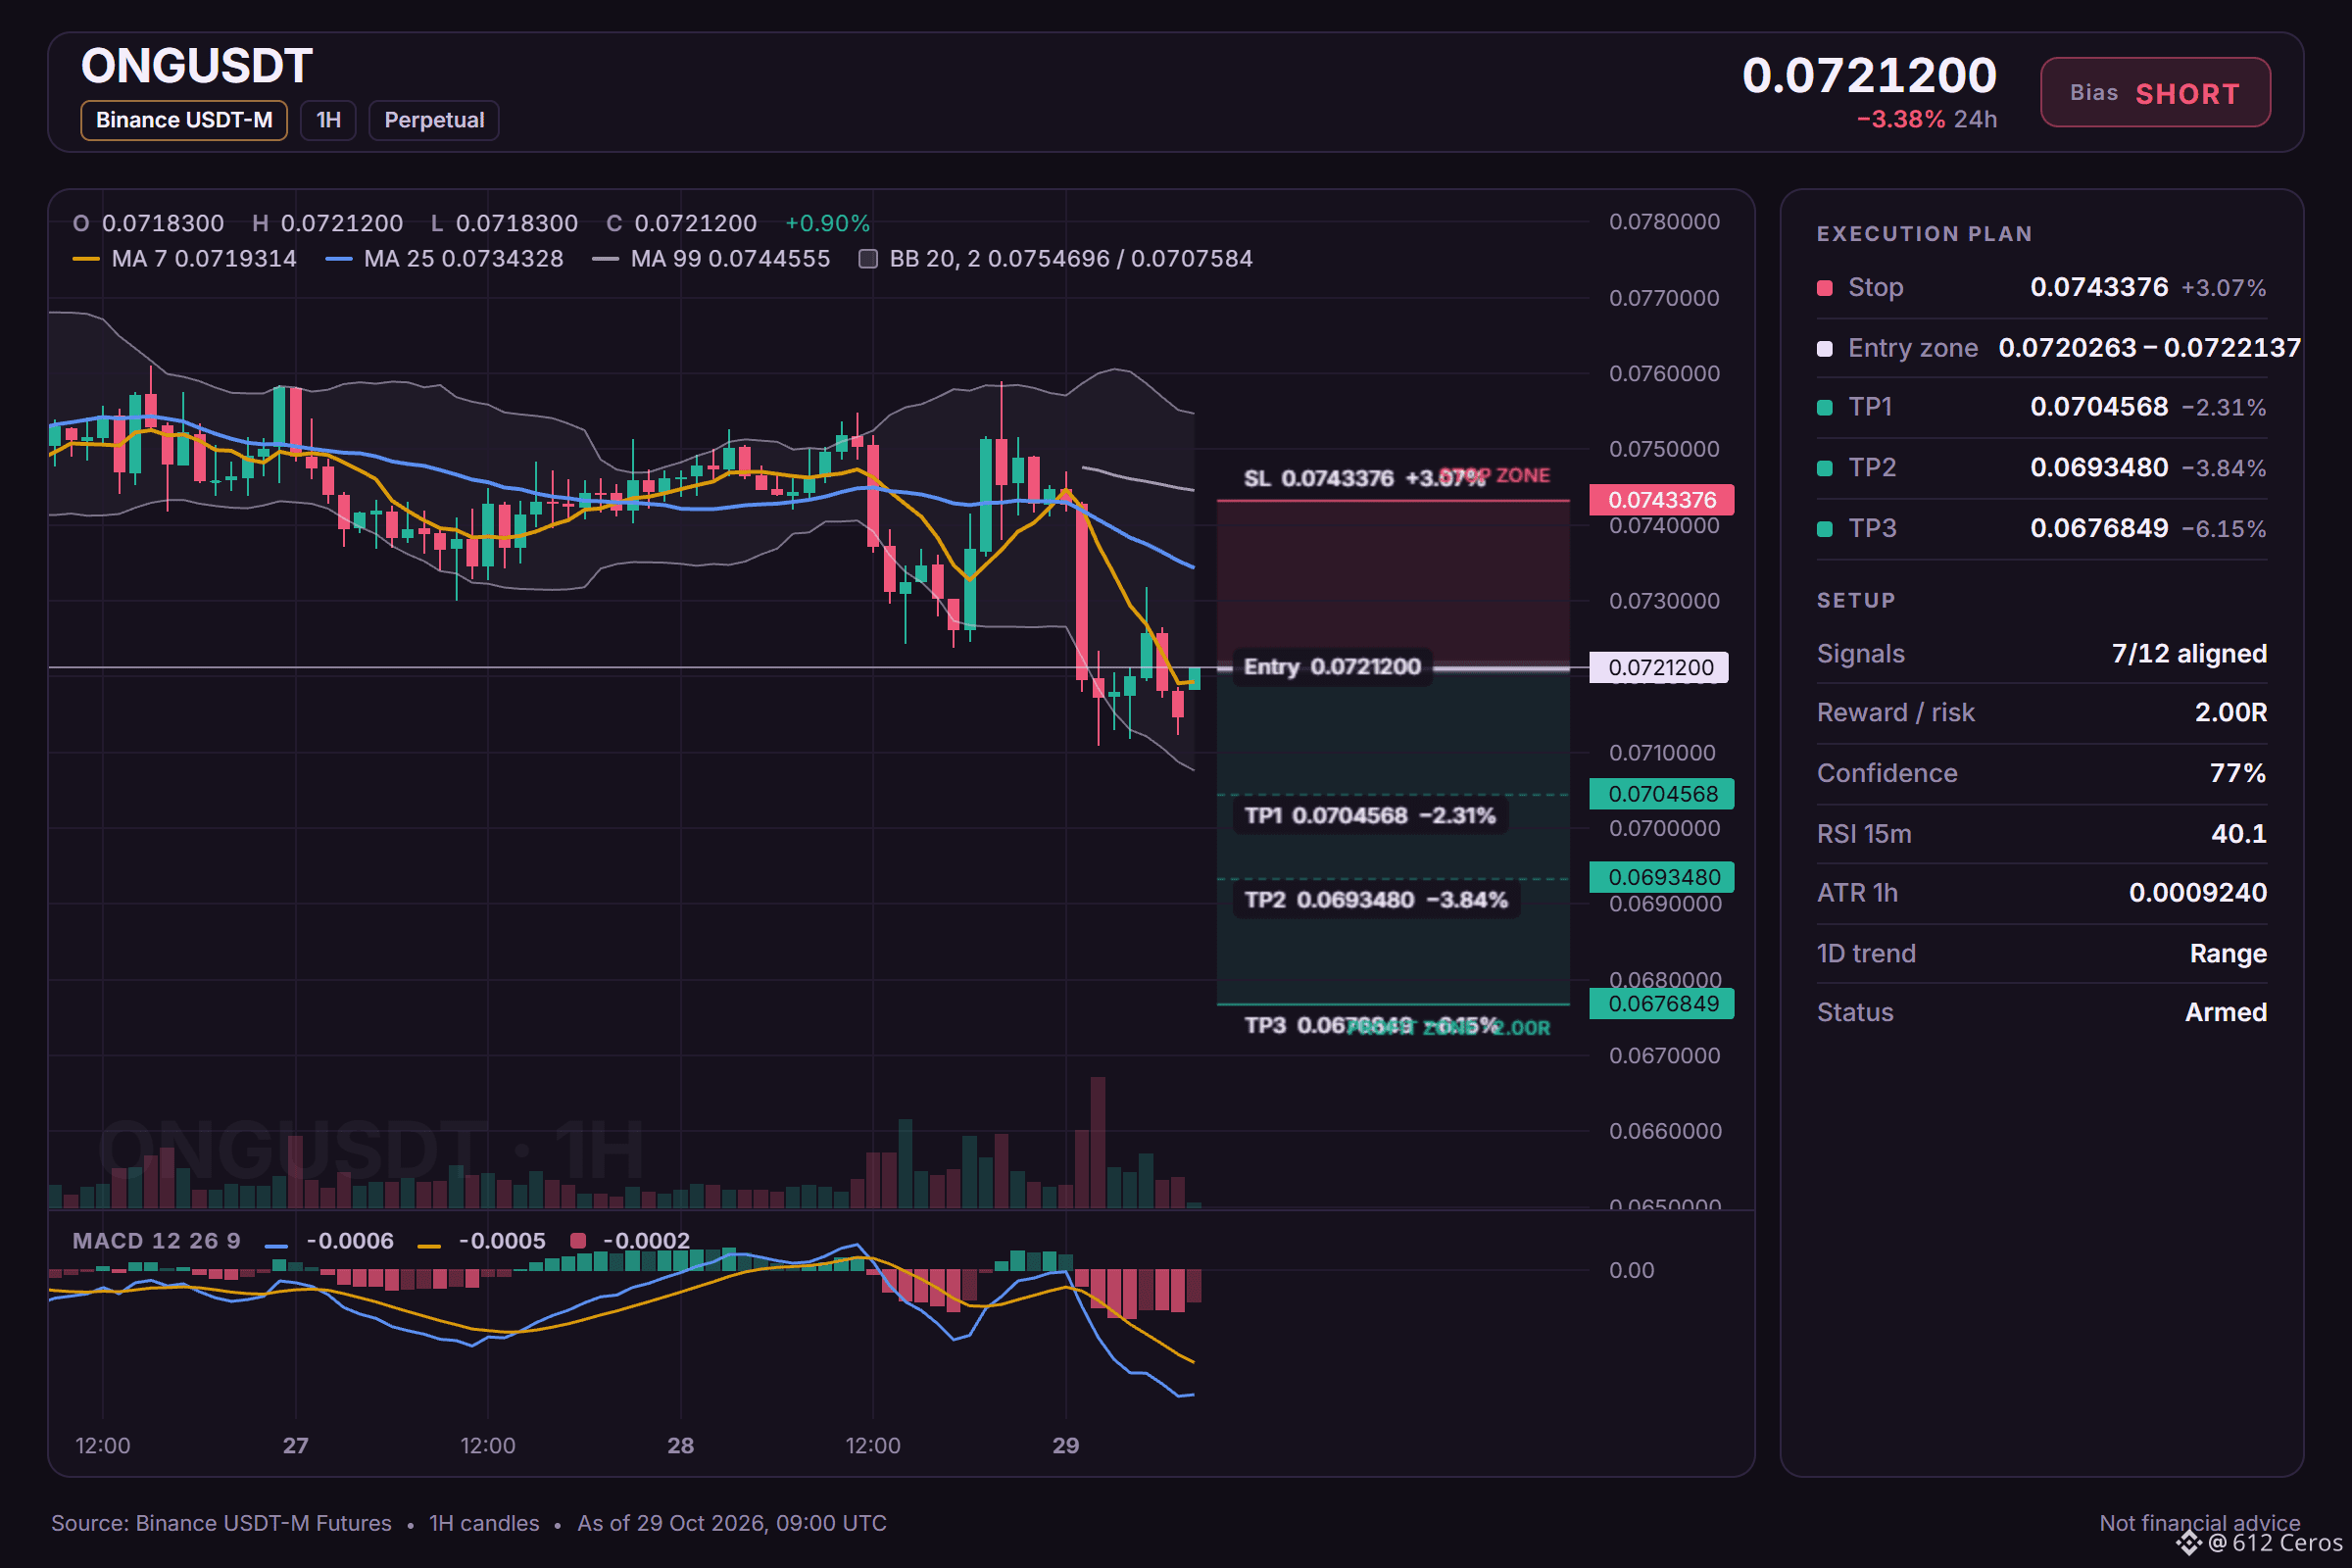
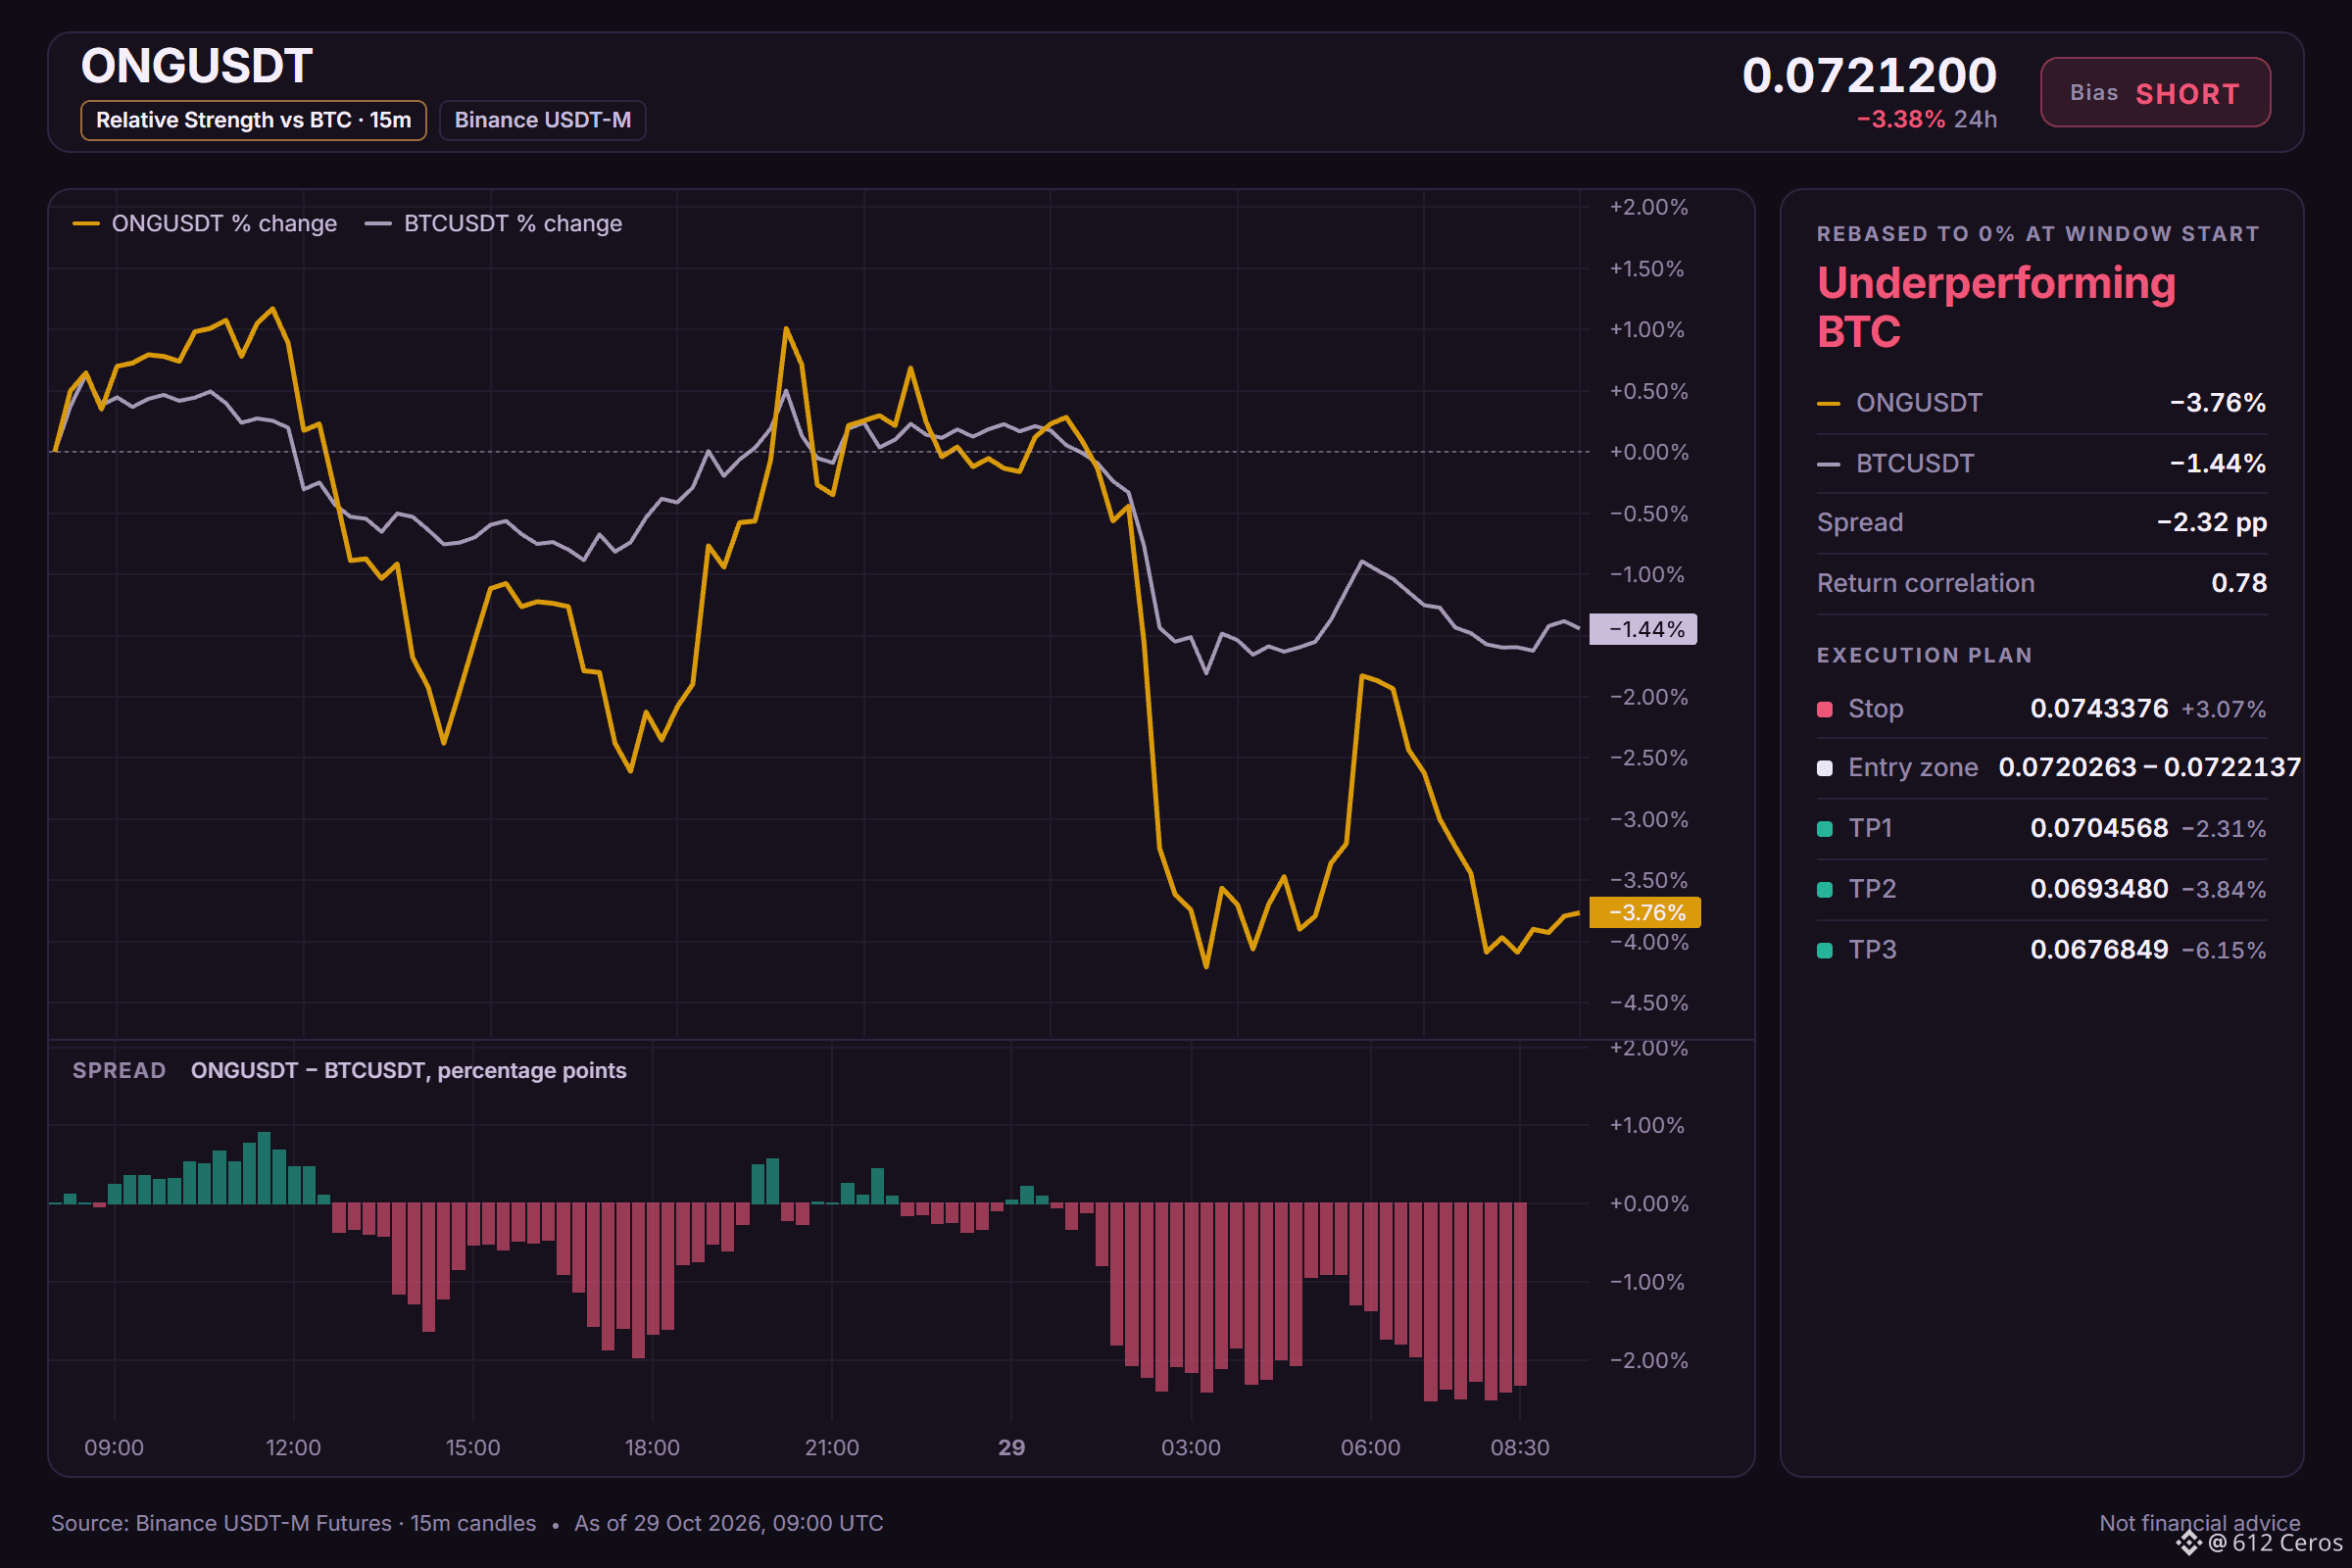
ONG short setup: the levels I'm watching
🔴 SHORT $ONG /USDT: expecting price to go DOWN
Bias: SHORT · Strong
Entry: 0.0720263 – 0.0722137
TP1: 0.0704568 (-2.3%)
TP2: 0.0693480 (-3.8%)
TP3: 0.0676849 (-6.1%)
SL: 0.0743376 (+3.1%)
Plan: enter only inside the zone, close 50% at TP1, 25% at TP2, 25% at TP3, and move the stop to entry after TP1.
Why SHORT? 7/12 signals agree, 0 against.
• 4h trend down (below EMA50 & EMA200)
• 1h trend down (below EMA50 & EMA200)
• Sellers are driving the move (15m ADX 28.6)
Why now?
The daily trend reads range, and 7/12 signals aligned favour the short side. The plan is to work the 0.0720263 – 0.0722137 zone, scale out at 0.0704568 and 0.0693480, and stay patient for 0.0676849. A move through 0.0743376 means the idea is wrong and the stop does its job.
Does ONG tag 0.0704568 first, or the stop?
Full setup on the chart below.
{future}(ONGUSDT)
📲 Want more of my latest signals? Join me here:
[https://app.binance.com/uni-qr/D26WbL9t](https://app.binance.com/uni-qr/D26WbL9t)
⚠️ Personal market analysis only. NFA — manage risk and DYOR.
Educational content, not investment advice or a recommendation to buy, sell, deposit, or withdraw any asset. No paid promotion or referral/affiliate links.
ONG short setup: the levels I'm watching
🔴 SHORT $ONG /USDT: expecting price to go DOWN
Bias: SHORT · Strong
Entry: 0.0720263 – 0.0722137
TP1: 0.0704568 (-2.3%)
TP2: 0.0693480 (-3.8%)
TP3: 0.0676849 (-6.1%)
SL: 0.0743376 (+3.1%)
Plan: enter only inside the zone, close 50% at TP1, 25% at TP2, 25% at TP3, and move the stop to entry after TP1.
Why SHORT? 7/12 signals agree, 0 against.
• 4h trend down (below EMA50 & EMA200)
• 1h trend down (below EMA50 & EMA200)
• Sellers are driving the move (15m ADX 28.6)
Why now?
The daily trend reads range, and 7/12 signals aligned favour the short side. The plan is to work the 0.0720263 – 0.0722137 zone, scale out at 0.0704568 and 0.0693480, and stay patient for 0.0676849. A move through 0.0743376 means the idea is wrong and the stop does its job.
Does ONG tag 0.0704568 first, or the stop?
Full setup on the chart below.
📲 Want more of my latest signals? Join me here:
https://app.binance.com/uni-qr/D26WbL9t
⚠️ Personal market analysis only. NFA — manage risk and DYOR.
Educational content, not investment advice or a recommendation to buy, sell, deposit, or withdraw any asset. No paid promotion or referral/affiliate links.
705
·
--
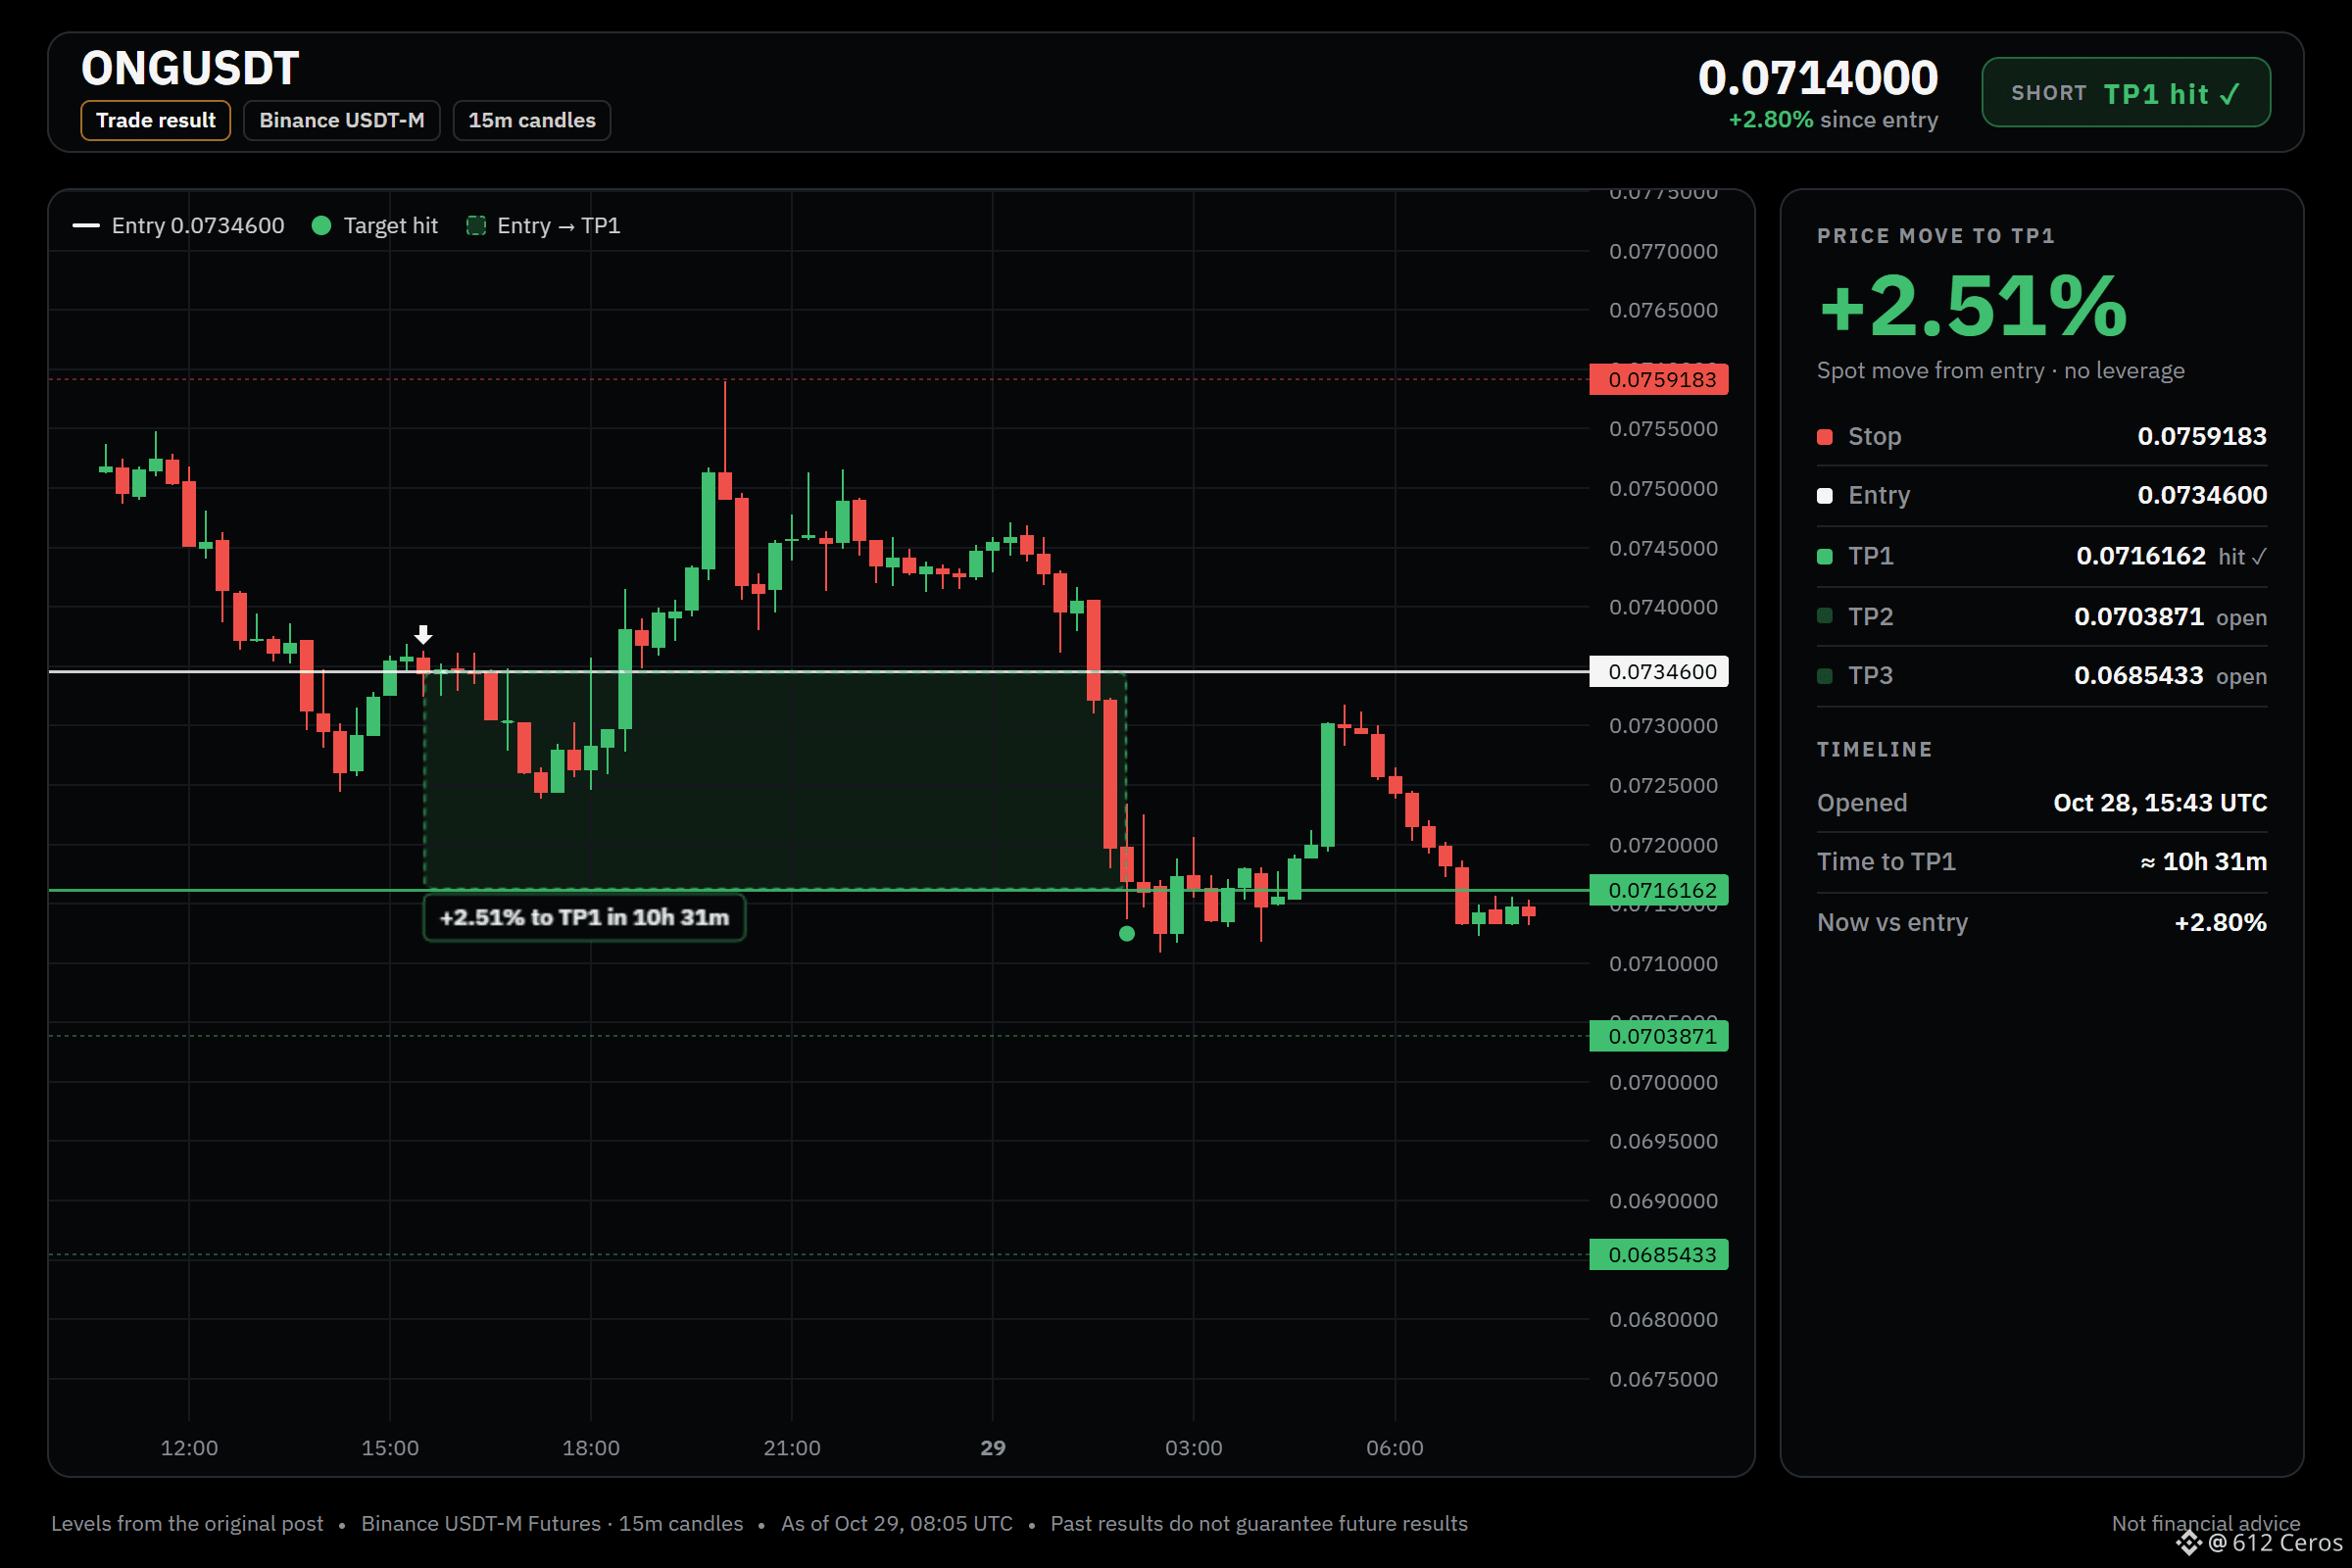
ONGUSDT short setup hit TP1 ✅ Spot move of +2.51% in about 10h 31m. Target reached. Always manage risk and size positions carefully.
ONGUSDT short setup hit TP1 ✅ Spot move of +2.51% in about 10h 31m. Target reached. Always manage risk and size positions carefully.
612 Ceros
·
--
ПадениеWhat makes ONG the weakest link right now?
🔴 SHORT $ONG /USDT: expecting price to go DOWN
Bias: SHORT · Strong
Entry: 0.0733642 – 0.0735558
TP1: 0.0716162 (-2.5%)
TP2: 0.0703871 (-4.2%)
TP3: 0.0685433 (-6.7%)
SL: 0.0759183 (+3.3%)
Plan: enter only inside the zone, close 50% at TP1, 25% at TP2, 25% at TP3, and move the stop to entry after TP1.
Why SHORT? What I checked: 6/12 agree, 0 against.
• 4h trend down (below EMA50 & EMA200)
• 1h trend down (below EMA50 & EMA200)
• Sellers are driving the move (15m ADX 32.9)
Watch: The idea is wrong if price reaches the stop at 0.0759183
Verdict: The 4h trend is bearish with price below stacked EMAs, meaning the swing is clearly down. The 1h trend is also bearish with price below stacked EMAs, meaning short-term momentum is down. The main risk is the daily trend is range-bound and undecided, meaning the big picture lacks a clear direction.
Where do you set your stop if this setup fails?
Full setup on the chart below.
📲 Want more of my latest signals? Join me here:
https://app.binance.com/uni-qr/D26WbL9t
⚠️ Personal market analysis only. NFA — manage risk and DYOR.
Educational content, not investment advice or a recommendation to buy, sell, deposit, or withdraw any asset. No paid promotion or referral/affiliate links.
921
·
--
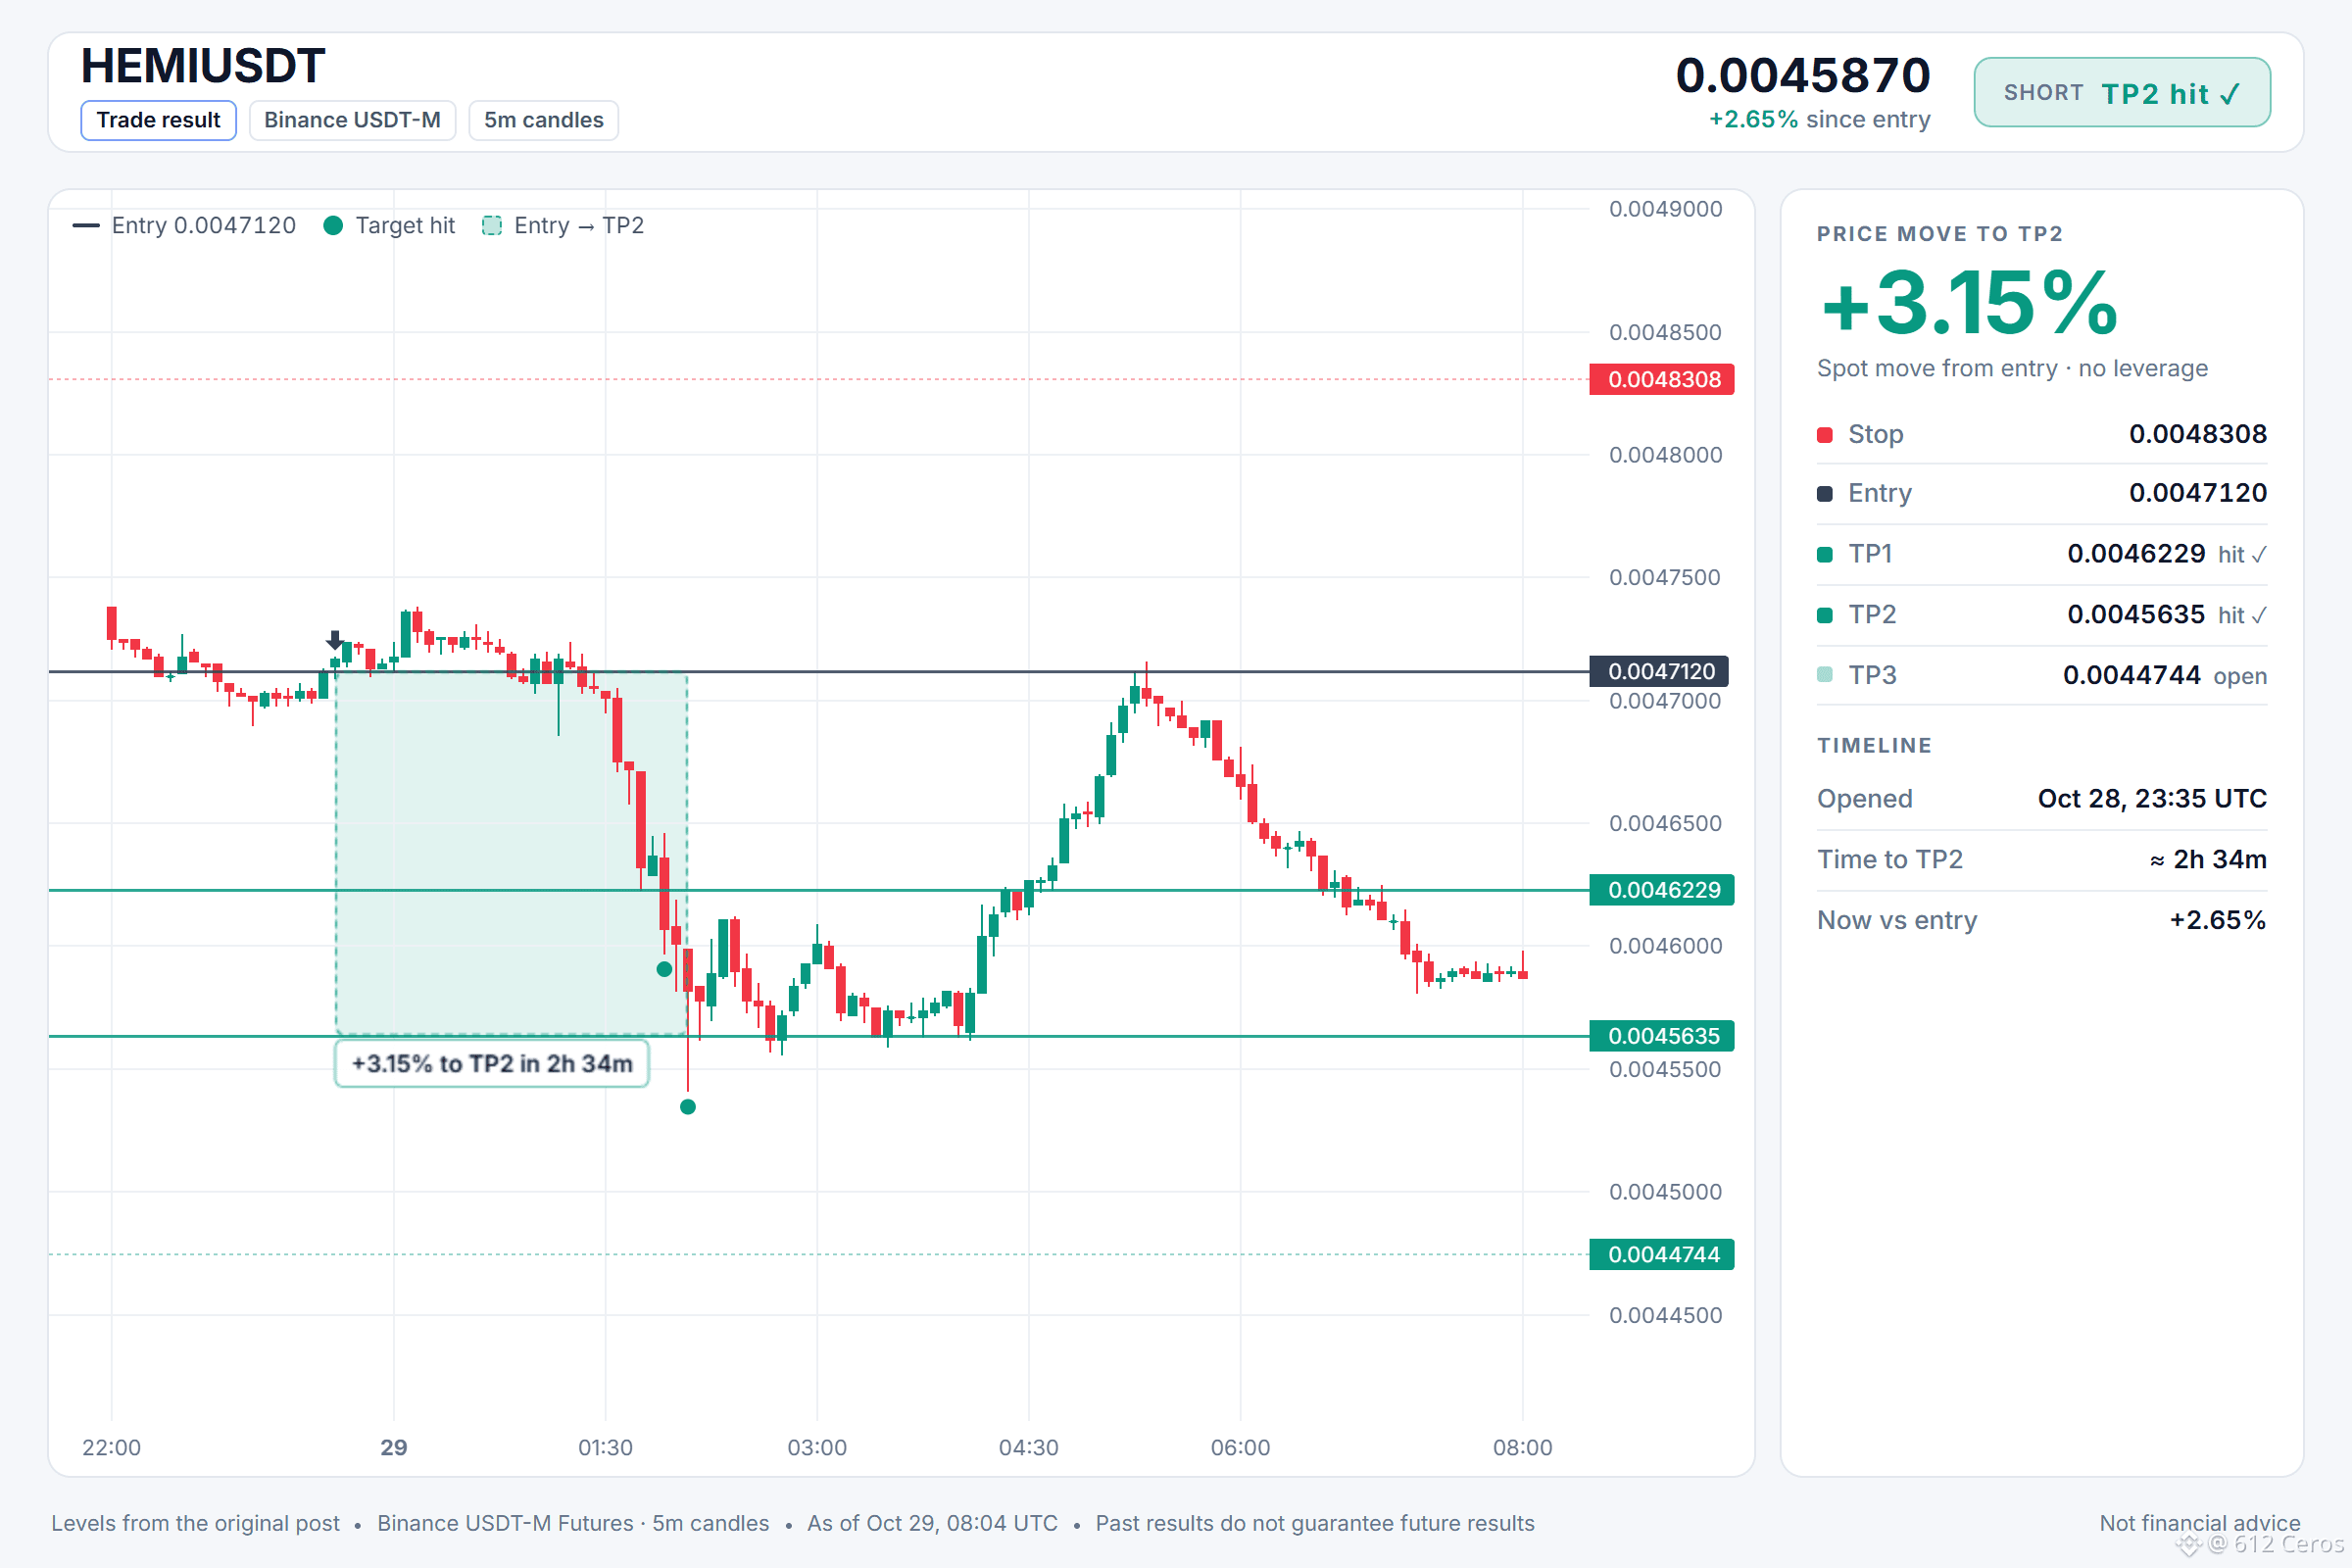
Short HEMIUSDT setup hit TP2. Spot price moved +3.15% over about 2h 34m. Stay disciplined, always manage risk. 🚀📉
Short HEMIUSDT setup hit TP2. Spot price moved +3.15% over about 2h 34m. Stay disciplined, always manage risk. 🚀📉
612 Ceros
·
--
ПадениеHEMI looks strong, but that is exactly why you should sell.
🔴 SHORT $HEMI /USDT: expecting price to go DOWN
Bias: SHORT · Leaning
Entry: 0.0047064 – 0.0047176
TP1: 0.0046229 (-1.9%)
TP2: 0.0045635 (-3.2%)
TP3: 0.0044744 (-5.0%)
SL: 0.0048308 (+2.5%)
Plan: enter only inside the zone, close 50% at TP1, 25% at TP2, 25% at TP3, and move the stop to entry after TP1.
Note: moderate conviction only, keep size light.
Why SHORT? 3/12 signals agree, 2 against.
• Daily trend down (below EMA50 & EMA200)
• 4h trend down (below EMA50 & EMA200)
• Weaker than BTC (−1.03% 24h vs BTC)
Risk: Buyers are driving the move (15m ADX 26.4)
Why now?
The daily trend is bearish with price below both key moving averages, and the 4h trend shows the same down structure. The 1h price is at 0.0047120, and the daily trend remains bearish, so a short setup makes sense to me.
Where would you place your invalidation level for this short?
Full setup on the chart below.
📲 Want more of my latest signals? Join me here:
https://app.binance.com/uni-qr/D26WbL9t
⚠️ Personal market analysis only. NFA — manage risk and DYOR.
Educational content, not investment advice or a recommendation to buy, sell, deposit, or withdraw any asset. No paid promotion or referral/affiliate links.
902
·
--
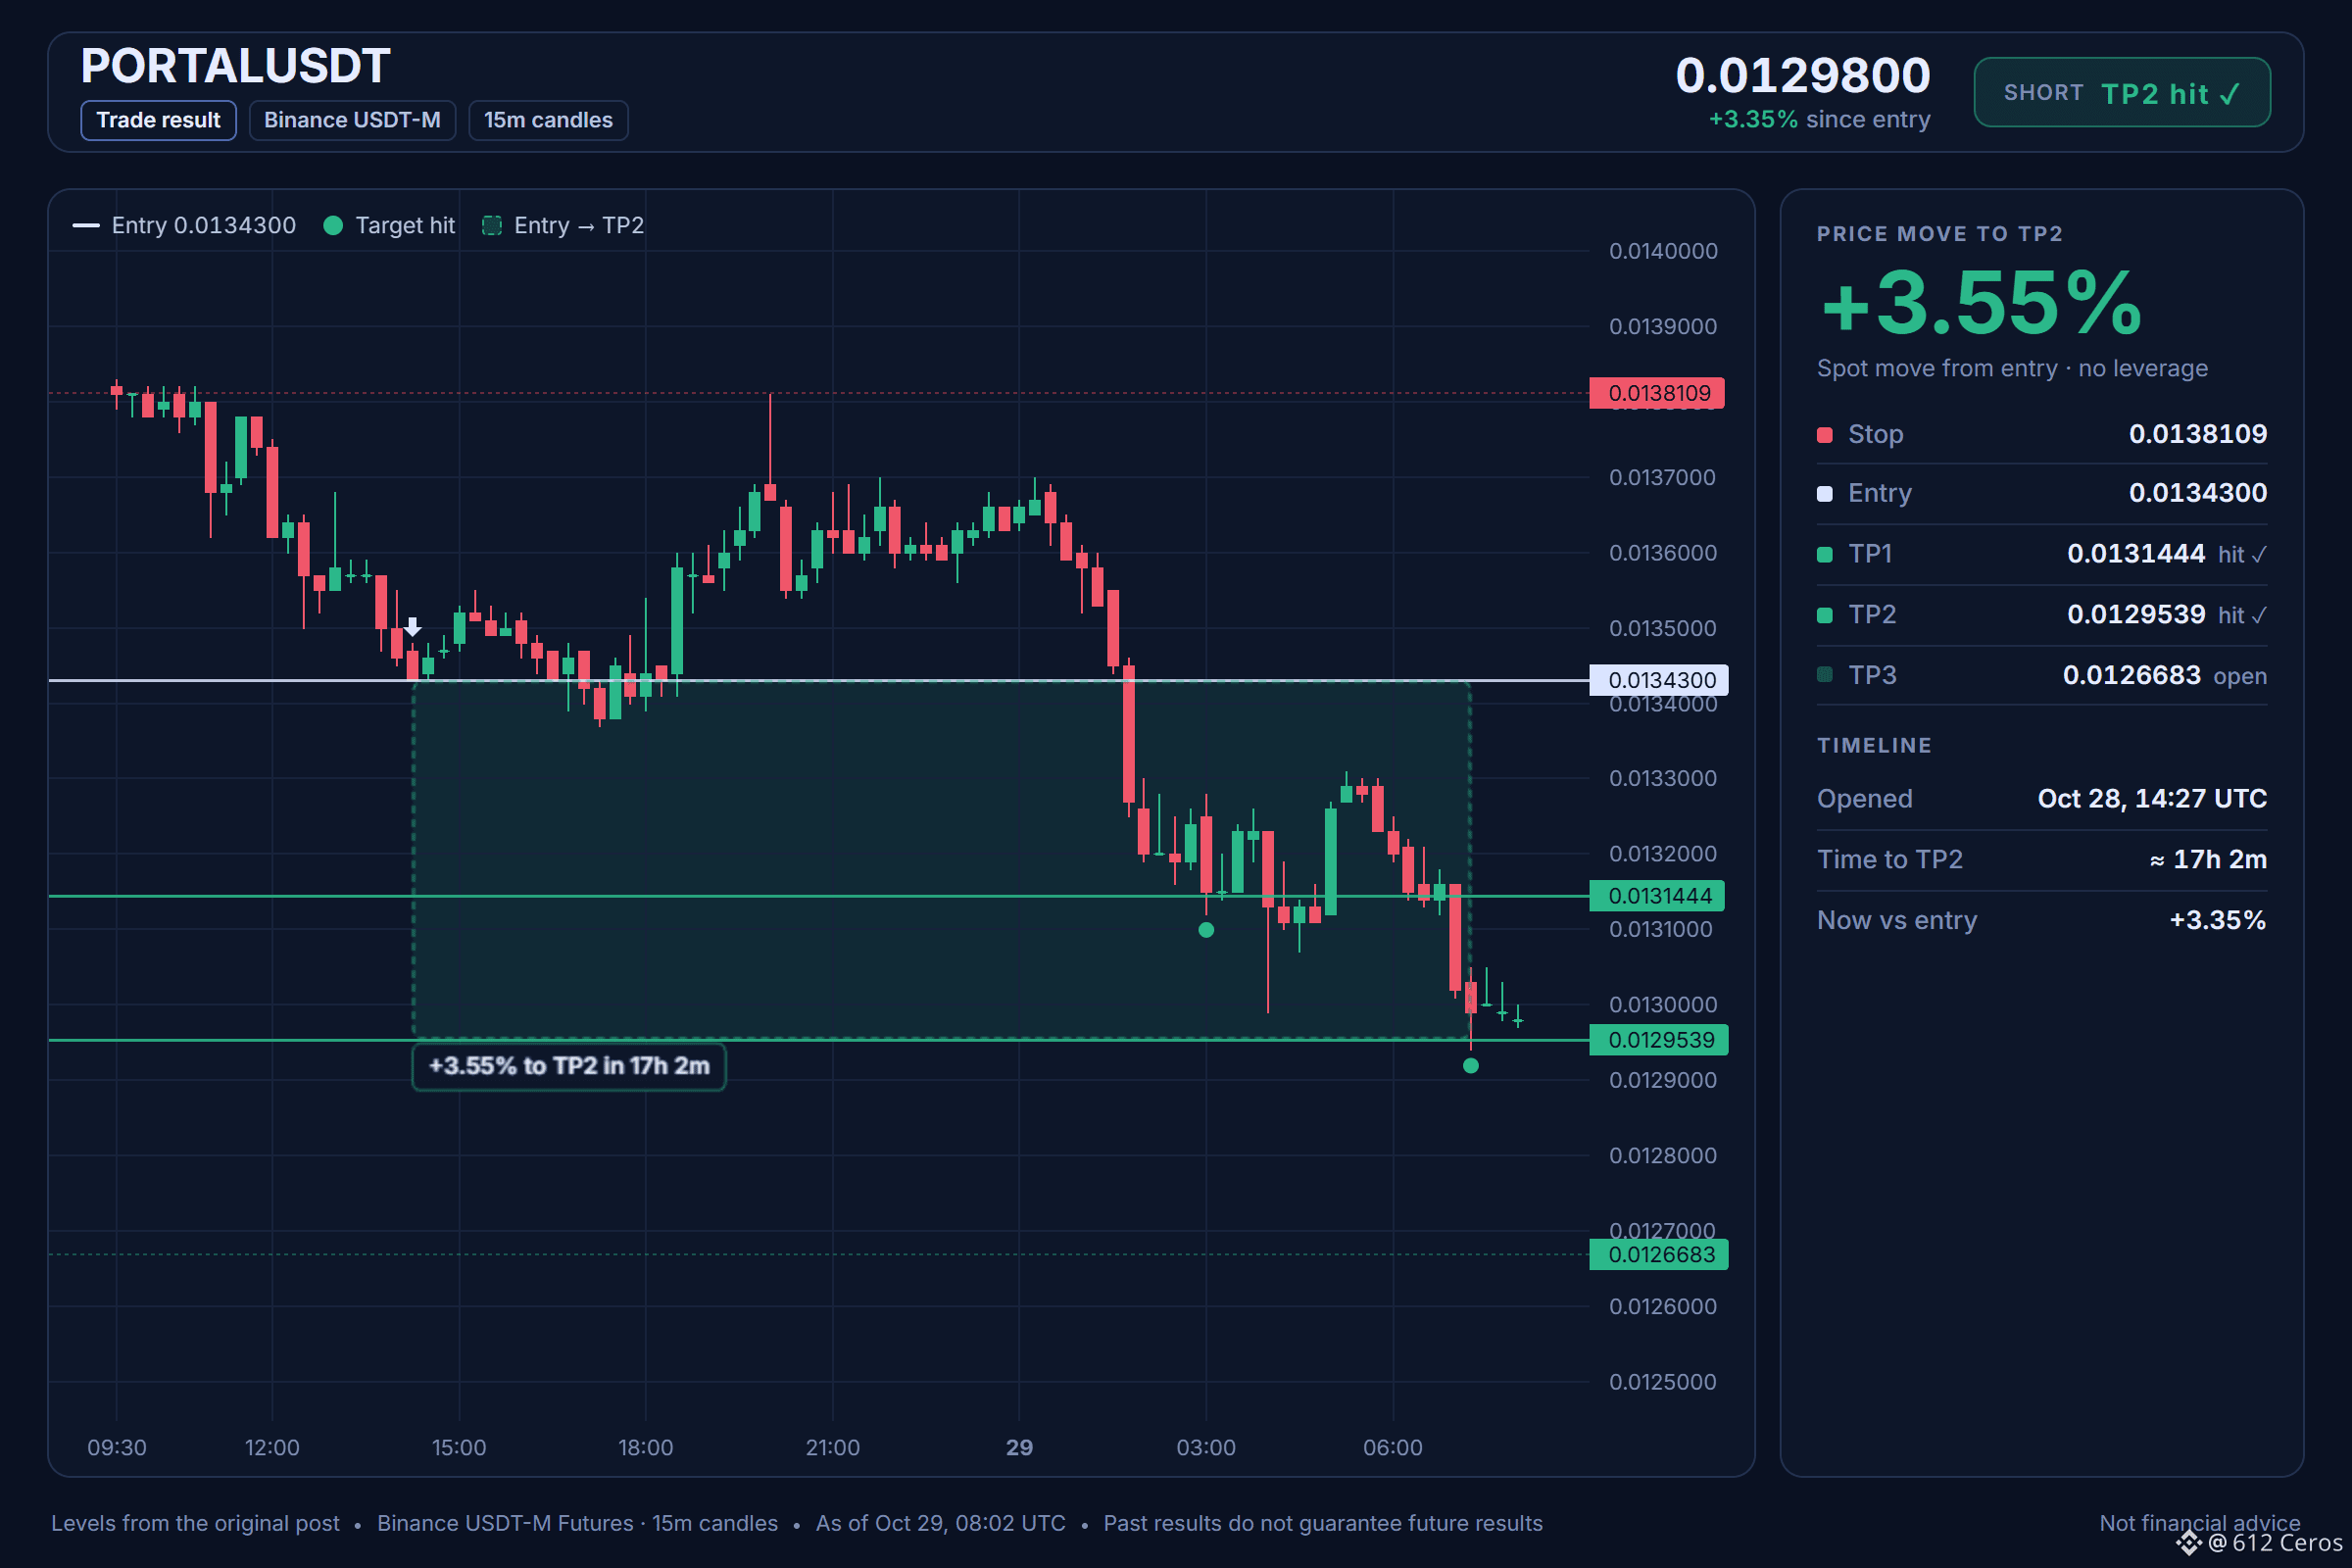
Portal short hit TP2. Spot moved +3.55% in about 17 hours. Remember to manage risk. 📉✅
Portal short hit TP2. Spot moved +3.55% in about 17 hours. Remember to manage risk. 📉✅
612 Ceros
·
--
ПадениеRange-bound coins often drop the farthest.
🔴 SHORT $PORTAL /USDT: expecting price to go DOWN
Bias: SHORT · Leaning
Entry: 0.0134112 – 0.0134488
TP1: 0.0131444 (-2.1%)
TP2: 0.0129539 (-3.5%)
TP3: 0.0126683 (-5.7%)
SL: 0.0138109 (+2.8%)
Plan: enter only inside the zone, close 50% at TP1, 25% at TP2, 25% at TP3, and move the stop to entry after TP1.
Note: moderate conviction only, keep size light.
Why SHORT? 5/12 signals agree, 1 against.
• 4h trend down (below EMA50 & EMA200)
• 1h trend down (below EMA50 & EMA200)
• Sellers are driving the move (15m ADX 24.5)
Risk: Range bottom, buyers often step in (RSI z −2.58)
Plan A:
If the 1h price breaks below the bearish stack, it may push toward the first target, as sellers are driving the move.
Plan B (invalidation):
If the 1h RSI snaps back above 45 and price holds the entry level, the setup fails and I would exit immediately.
What level would make you take the other side?
Full setup on the chart below.
📲 Want more of my latest signals? Join me here:
https://app.binance.com/uni-qr/D26WbL9t
⚠️ Personal market analysis only. NFA — manage risk and DYOR.
Educational content, not investment advice or a recommendation to buy, sell, deposit, or withdraw any asset. No paid promotion or referral/affiliate links.
1
611
·
--
Падение
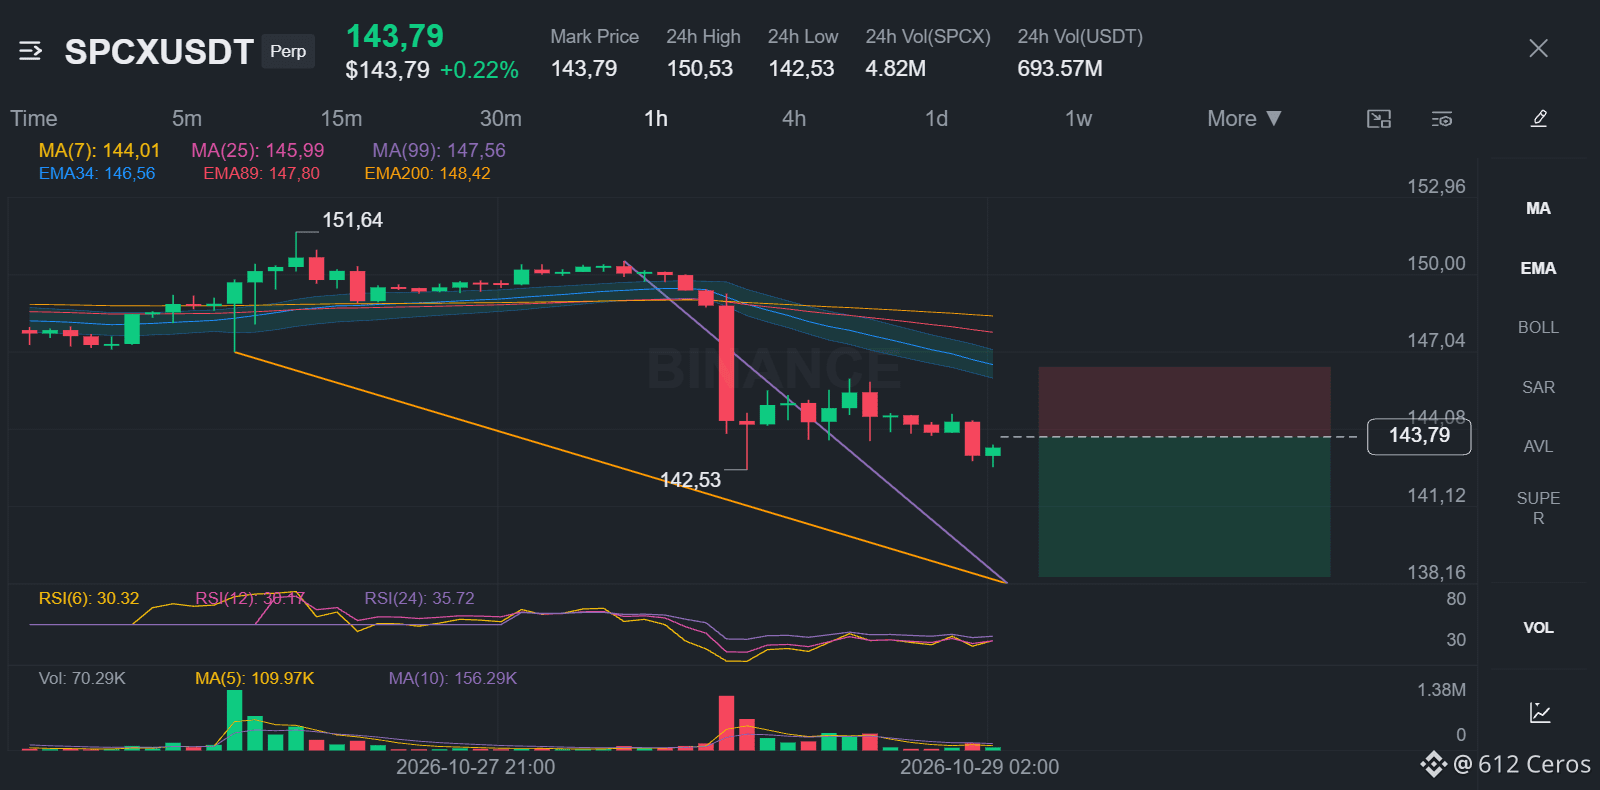
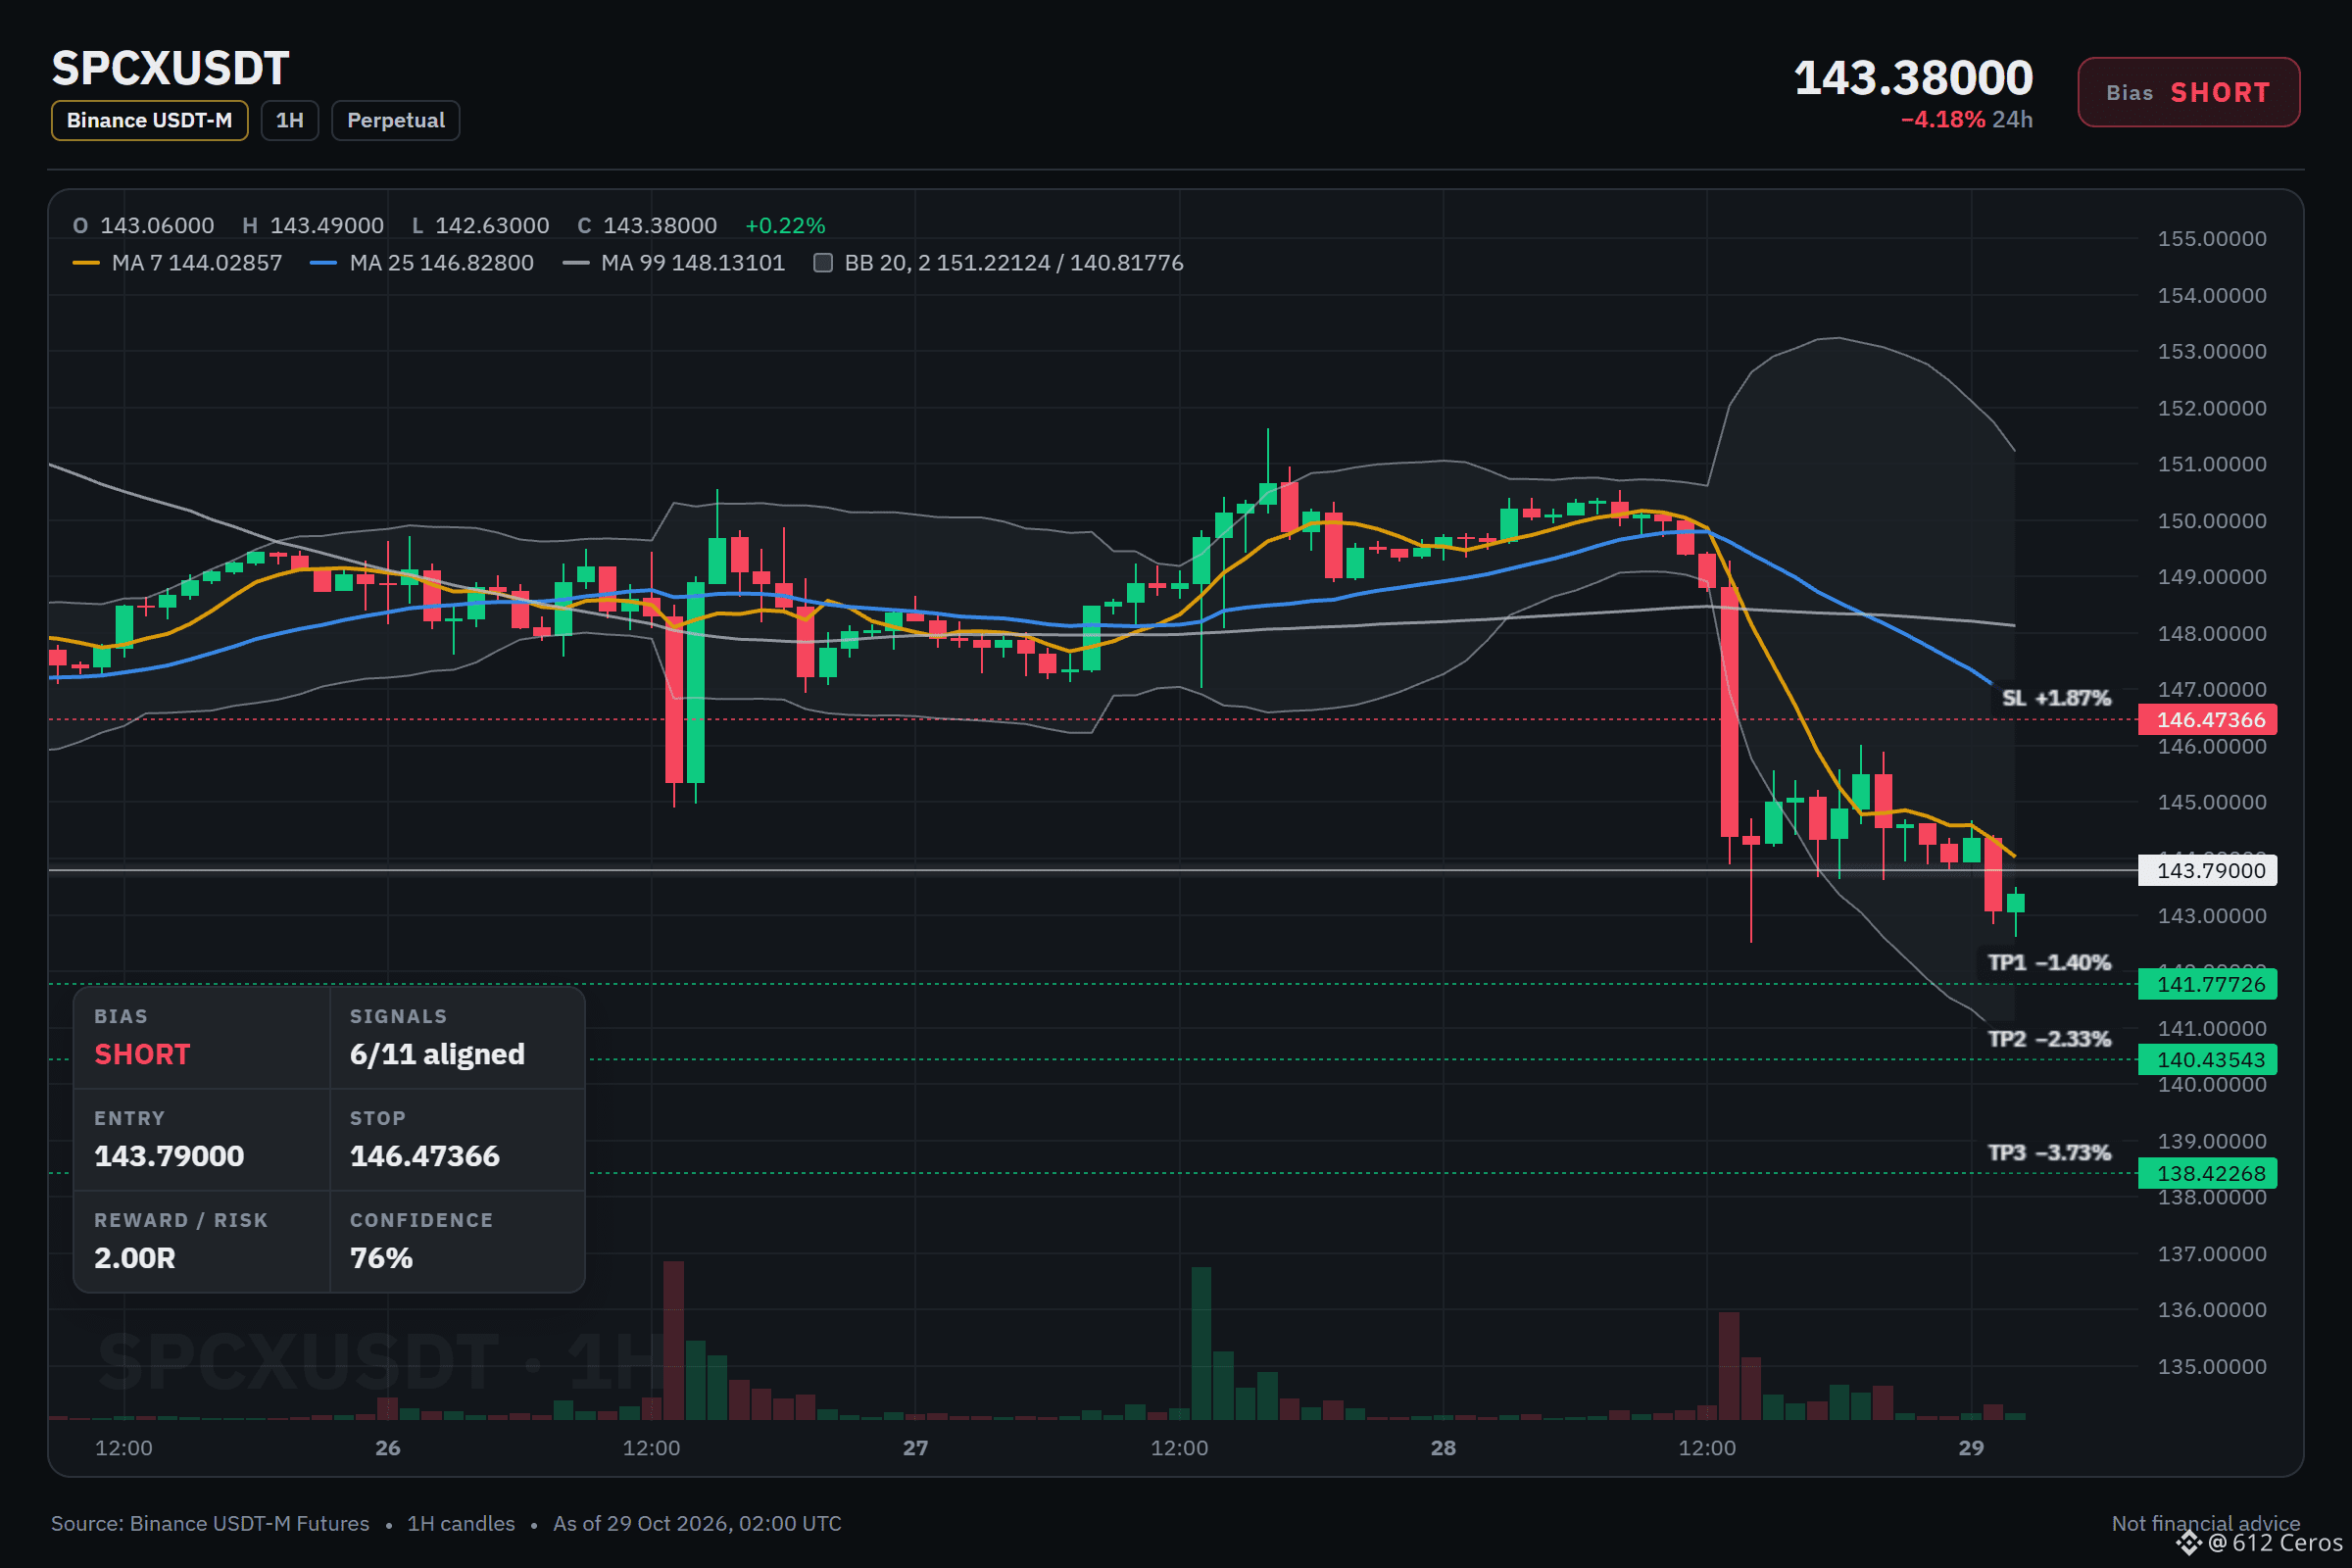
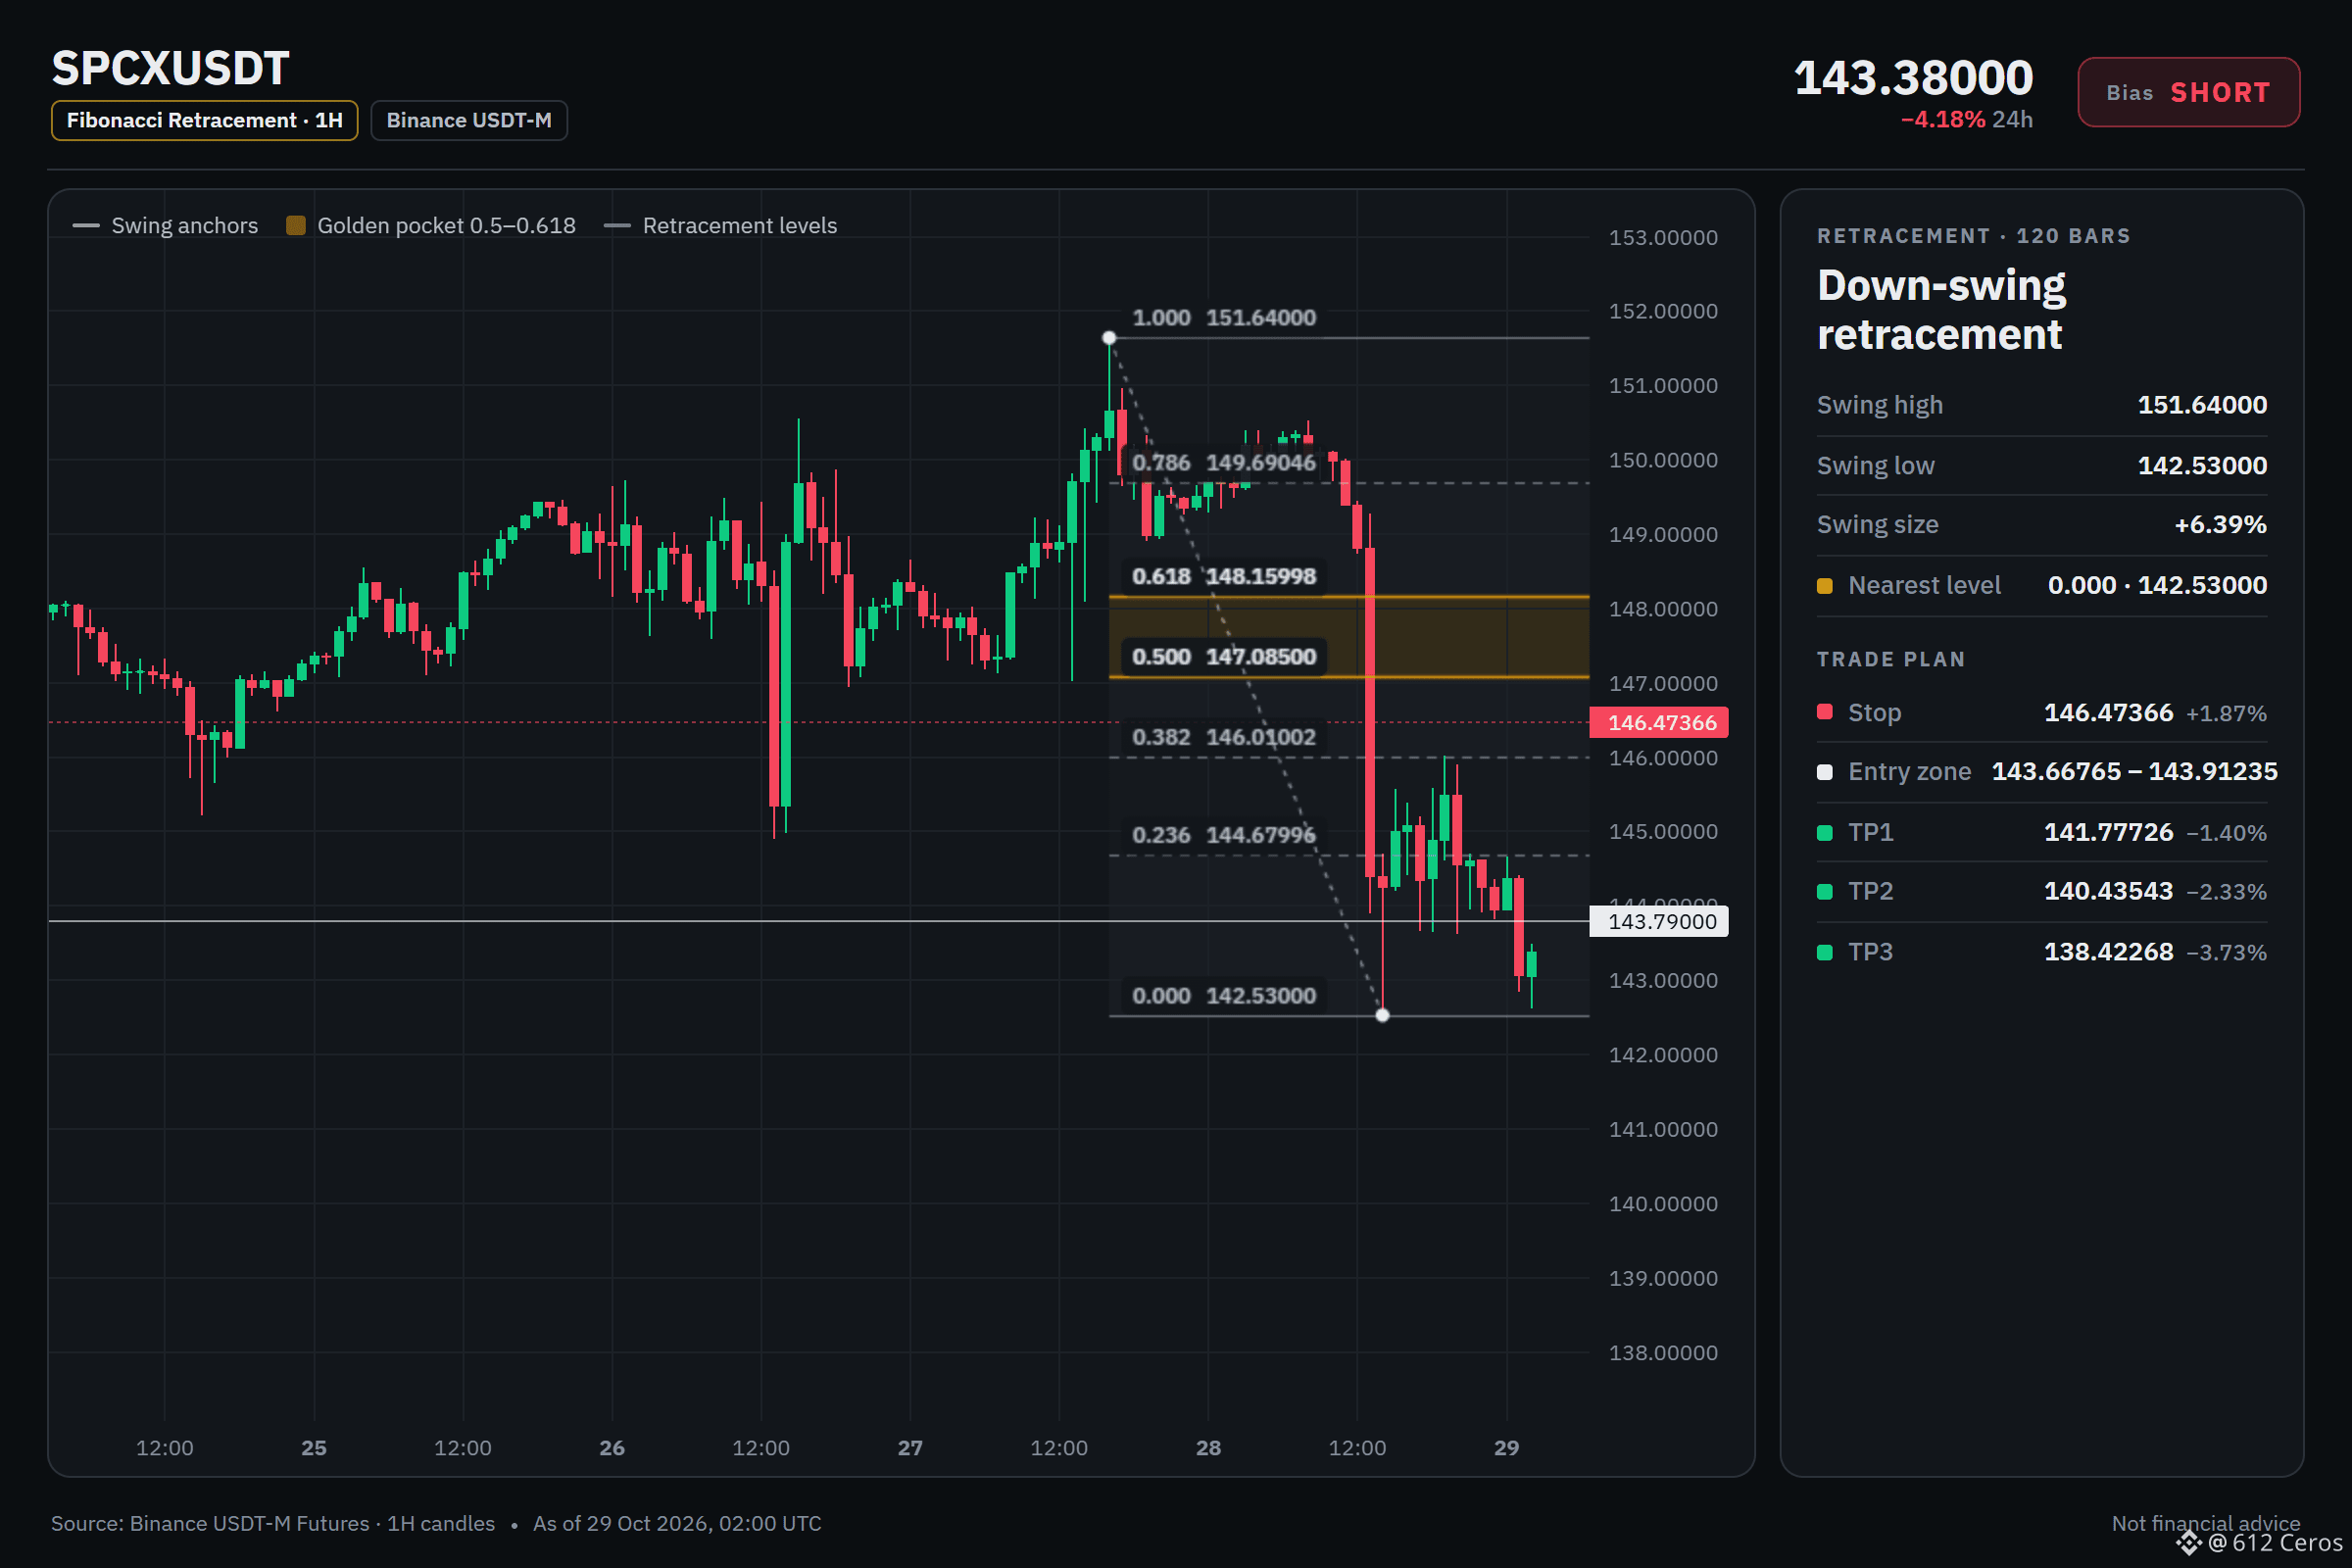
🔴 SHORT $SPCX /USDT: expecting price to go DOWN
Bias: SHORT · Strong
Entry: 143.66765 – 143.91235
TP1: 141.77726 (-1.4%)
TP2: 140.43543 (-2.3%)
TP3: 138.42268 (-3.7%)
SL: 146.47366 (+1.9%)
Plan: enter only inside the zone, close 50% at TP1, 25% at TP2, 25% at TP3, and move the stop to entry after TP1.
SPCX keeps sliding in the 4h bearish trend
Why SHORT? 6/11 signals agree, 0 against.
• 4h trend down (below EMA50 & EMA200)
• 1h trend down (below EMA50 & EMA200)
• Sellers are driving the move (15m ADX 28.4)
The 1h price is below its EMA50 and EMA200, showing sellers are in control, and the 1h RSI is at 30.6 meaning momentum is deeply bearish.
Where would you place your invalidation level?
Levels mapped on the chart below.
{future}(SPCXUSDT)
📲 Want more of my latest signals? Join me here:
[https://app.binance.com/uni-qr/D26WbL9t](https://app.binance.com/uni-qr/D26WbL9t)
⚠️ Personal market analysis only. NFA — manage risk and DYOR.
Educational content, not investment advice or a recommendation to buy, sell, deposit, or withdraw any asset. No paid promotion or referral/affiliate links.
🔴 SHORT $SPCX /USDT: expecting price to go DOWN
Bias: SHORT · Strong
Entry: 143.66765 – 143.91235
TP1: 141.77726 (-1.4%)
TP2: 140.43543 (-2.3%)
TP3: 138.42268 (-3.7%)
SL: 146.47366 (+1.9%)
Plan: enter only inside the zone, close 50% at TP1, 25% at TP2, 25% at TP3, and move the stop to entry after TP1.
SPCX keeps sliding in the 4h bearish trend
Why SHORT? 6/11 signals agree, 0 against.
• 4h trend down (below EMA50 & EMA200)
• 1h trend down (below EMA50 & EMA200)
• Sellers are driving the move (15m ADX 28.4)
The 1h price is below its EMA50 and EMA200, showing sellers are in control, and the 1h RSI is at 30.6 meaning momentum is deeply bearish.
Where would you place your invalidation level?
Levels mapped on the chart below.
📲 Want more of my latest signals? Join me here:
https://app.binance.com/uni-qr/D26WbL9t
⚠️ Personal market analysis only. NFA — manage risk and DYOR.
Educational content, not investment advice or a recommendation to buy, sell, deposit, or withdraw any asset. No paid promotion or referral/affiliate links.
2
853
Войдите, чтобы посмотреть больше материала
Присоединяйтесь к пользователям криптовалют по всему миру на Binance Square
⚡️ Получайте новейшую и полезную информацию о криптоактивах.
💬 Нам доверяет крупнейшая в мире криптобиржа.
👍 Получите достоверные аналитические данные от верифицированных создателей контента.
Эл. почта/номер телефона
В тренде
FedWatch
Просмотров: 16.3M
39,182 обсуждают
🚨 THE ALARM BELLS ARE RINGING LOUDLY AGAIN!
As you know, the FED announced its interest rate decision last night, keeping rates unchanged. Here is the situation regarding the other data that followed #FedWatch
Annual inflation rose to 3.6%, while monthly inflation climbed to 0.5%. The core PCE Personal Consumption Expenditures Price Index also reached 3.1% on an annual basis.
Although these figures align with expectations, the truly concerning aspect is that inflation has begun to accelerate once again. The FED’s 2% target still seems quite far off.
In my view, this makes it difficult to justify any interest rate cuts in the near term. If high interest rates persist for a longer period, it could create additional selling pressure on $BTC and altcoins.
Do you think crypto assets will be able to hold their ground?
Kripto Kurdu
·Лайков: 20
·Просмотров: 3.8k
EarningsSeason
Просмотров: 6.4M
31,900 обсуждают
USMidtermElections
Просмотров: 26,759
524 обсуждают