

#stock
stock
Просмотров: 892,111
1,515 обсуждают
Популярные
Новые

Проверено

Статья
🚨 GOOGLE Is This a Buying Opportunity or a Warning Sign? 📉Guys, $GOOGL is not a random memecoin! 😂
Alphabet Inc. $GOOGL Google's parent company, is one of the major players in technology, digital advertising, cloud computing, and artificial intelligence.
Why Does Google's Stock Price Move?
Investors closely monitor several important factors:
Earnings Reports: Results that differ from expectations can move the share price sharply.Advertising Revenue: Google's advertising business is a major source of income.AI Competition: Competition in artificial intelligence could affect future growth.Cloud Business: Google Cloud's growth and profitability matter to investors.Market Sentiment: Economic conditions and investor expectations also influence prices.
🔥 The Big Question
When a major technology stock falls sharply, is it a buying opportunity or a warning sign?
The answer depends on the company's financial performance, valuation, future outlook, and broader market conditions. A falling price alone does not guarantee a bargain.
💡 Remember: Google stock is different from Google-themed crypto tokens. Always verify the asset, market, and trading pair before investing.
What do you think? 📊 Is Alphabet a long-term growth opportunity, or is competition becoming a bigger risk?
👇 Share your thoughts in the comments!
#EarningsSeason google #GoldenOpportunity #Alphabet #Stock Market #CryptoNews #BinanceSquare #Investing #Aİ $$
🚨 GOOGLE Is This a Buying Opportunity or a Warning Sign? 📉
Guys, $GOOGL is not a random memecoin! 😂
Alphabet Inc. $GOOGL Google's parent company, is one of the major players in technology, digital advertising, cloud computing, and artificial intelligence.
Why Does Google's Stock Price Move?
Investors closely monitor several important factors:
Earnings Reports: Results that differ from expectations can move the share price sharply.Advertising Revenue: Google's advertising business is a major source of income.AI Competition: Competition in artificial intelligence could affect future growth.Cloud Business: Google Cloud's growth and profitability matter to investors.Market Sentiment: Economic conditions and investor expectations also influence prices.
🔥 The Big Question
When a major technology stock falls sharply, is it a buying opportunity or a warning sign?
The answer depends on the company's financial performance, valuation, future outlook, and broader market conditions. A falling price alone does not guarantee a bargain.
💡 Remember: Google stock is different from Google-themed crypto tokens. Always verify the asset, market, and trading pair before investing.
What do you think? 📊 Is Alphabet a long-term growth opportunity, or is competition becoming a bigger risk?
👇 Share your thoughts in the comments!
#EarningsSeason google #GoldenOpportunity #Alphabet #Stock Market #CryptoNews #BinanceSquare #Investing #Aİ $$
GOOGL-4,73%
GOOGUS-1,18%
977

·
--
Падение
Проверено
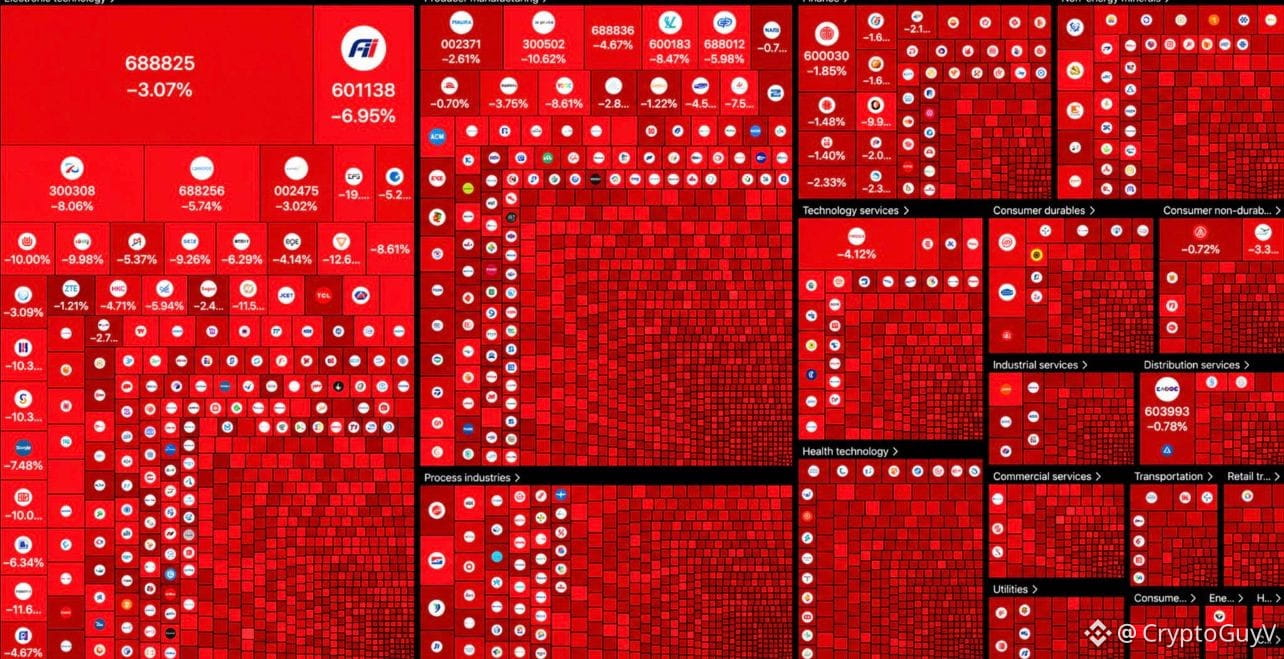
ABSOLUTE BLOODBATH IN CHINA'S STOCK MARKET.
¥1.1 TRILLION has been wiped out from Chinese stocks today as China's AI bubble bursts.
#stock
ABSOLUTE BLOODBATH IN CHINA'S STOCK MARKET.
¥1.1 TRILLION has been wiped out from Chinese stocks today as China's AI bubble bursts.
#stock
¥1.1 TRILLION has been wiped out from Chinese stocks today as China's AI bubble bursts.
#stock
1
615

·
--
Рост
An AI can analyze a stock, track market movements, and find a trading opportunity. But there's another side to making a financial decision that market data alone cannot answer, what does the AI actually know about the person it is trading for?
Verona × Stockcoin
Stockcoin brings AI-powered trading into one account across US, Hong Kong, and Korean stock markets, alongside stock perpetuals and IPO and pre-IPO opportunities. It gives users a way to explore markets and let AI help carry out their strategies.
But finding an opportunity is only part of the process. An AI may need to know whether someone qualifies for an IPO allocation or what assets they already hold on another platform. Those details belong to the user, not the market, and accessing them can mean exposing sensitive financial information.
Verona approaches this problem through verification. It can turn information into reusable proofs, allowing authorized agents to verify relevant facts without seeing the underlying data.
The roles are different, but the connection is meaningful.
Stockcoin brings AI closer to financial action. Verona can help give that AI verified context about the person behind the decision, without requiring access to every piece of their private information.
Market intelligence helps an AI find an opportunity. Verified personal facts can help it understand whether that opportunity makes sense for the user.
As AI takes on a bigger role in financial decisions, that distinction becomes harder to ignore. The next step is seeing how this verification capability takes shape within Stockcoin.
#stock

61
·
--
Падение
Проверено
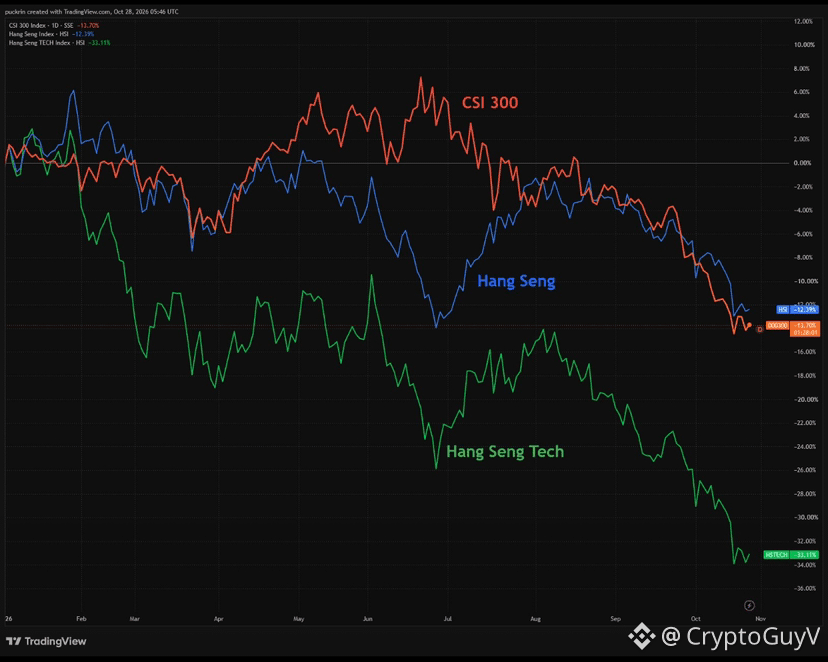
Chinese stocks are collapsing!
And the government is doing everything it can to prop it up.
They're relaxing margin trading is encouraging buybacks.
State media is pushing positive narratives.
It's even deploying the "national team" (state-aligned funds and brokers) to help buy stocks.
When it has to intervene this aggressively, the problem is bigger than they're admitting.
#stock
426

·
--
Рост
🚨 Binance تفتح أبواب البورصة العالمية أمام متداولي الكريبتو!
أعلنت Binance إطلاق 4 عقود دائمة مرتبطة بأسهم شركات عالمية:
🔹 EIDOUSDT. $EIDO
🔹 EQTUSDT. $EQT
🔹 STMUSDT. $STM
🔹 ABBVUSDT
⚡ رافعة مالية تصل إلى 20 ضعفاً!
📊 خطوة جديدة نحو دمج الأسواق التقليدية بعالم العملات الرقمية.
⚠️ هذه عقود مشتقات، وليست ملكية فعلية للأسهم.
هل نحن أمام مستقبل تصبح فيه الأسهم والعملات الرقمية داخل منصة واحدة؟
#Binance #Crypto #Stock
{future}(STMUSDT)
{future}(EQTUSDT)
{etf_us}(EIDO.ETF)
🚨 Binance تفتح أبواب البورصة العالمية أمام متداولي الكريبتو!
أعلنت Binance إطلاق 4 عقود دائمة مرتبطة بأسهم شركات عالمية:
🔹 EIDOUSDT. $EIDO
🔹 EQTUSDT. $EQT
🔹 STMUSDT. $STM
🔹 ABBVUSDT
⚡ رافعة مالية تصل إلى 20 ضعفاً!
📊 خطوة جديدة نحو دمج الأسواق التقليدية بعالم العملات الرقمية.
⚠️ هذه عقود مشتقات، وليست ملكية فعلية للأسهم.
هل نحن أمام مستقبل تصبح فيه الأسهم والعملات الرقمية داخل منصة واحدة؟
#Binance #Crypto #Stock
Trader_97:
نحن نعيش ذلك حاليا..من ان اكتشفت الكريبتو في 2023 ...كنت اعلم ان هذا هو مستقبل المال وهو آخر شكل من اشكال المال الذي قد تعرفه البشريه
1
80
·
--
Падение
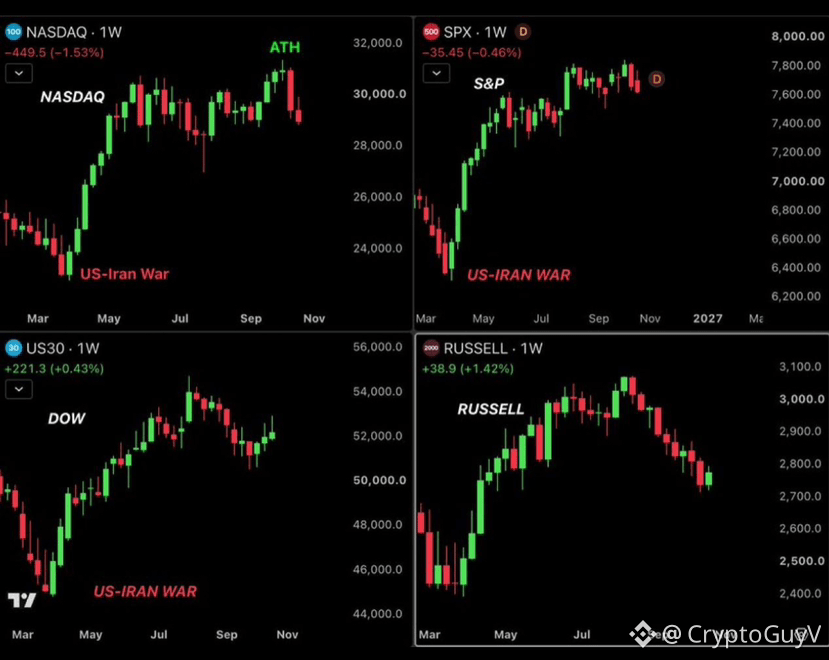
The S&P 500 and Nasdaq indices ended the week at their lowest levels in 3 months.
S&P 500: -0.46%
Nasdaq 100: -1.53%
Brent crude oil surged above $117, reaching its highest level since March 2026, which heightened concerns about inflation.
#stock #iol
The S&P 500 and Nasdaq indices ended the week at their lowest levels in 3 months.
S&P 500: -0.46%
Nasdaq 100: -1.53%
Brent crude oil surged above $117, reaching its highest level since March 2026, which heightened concerns about inflation.
#stock #iol
S&P 500: -0.46%
Nasdaq 100: -1.53%
Brent crude oil surged above $117, reaching its highest level since March 2026, which heightened concerns about inflation.
#stock #iol
269

·
--
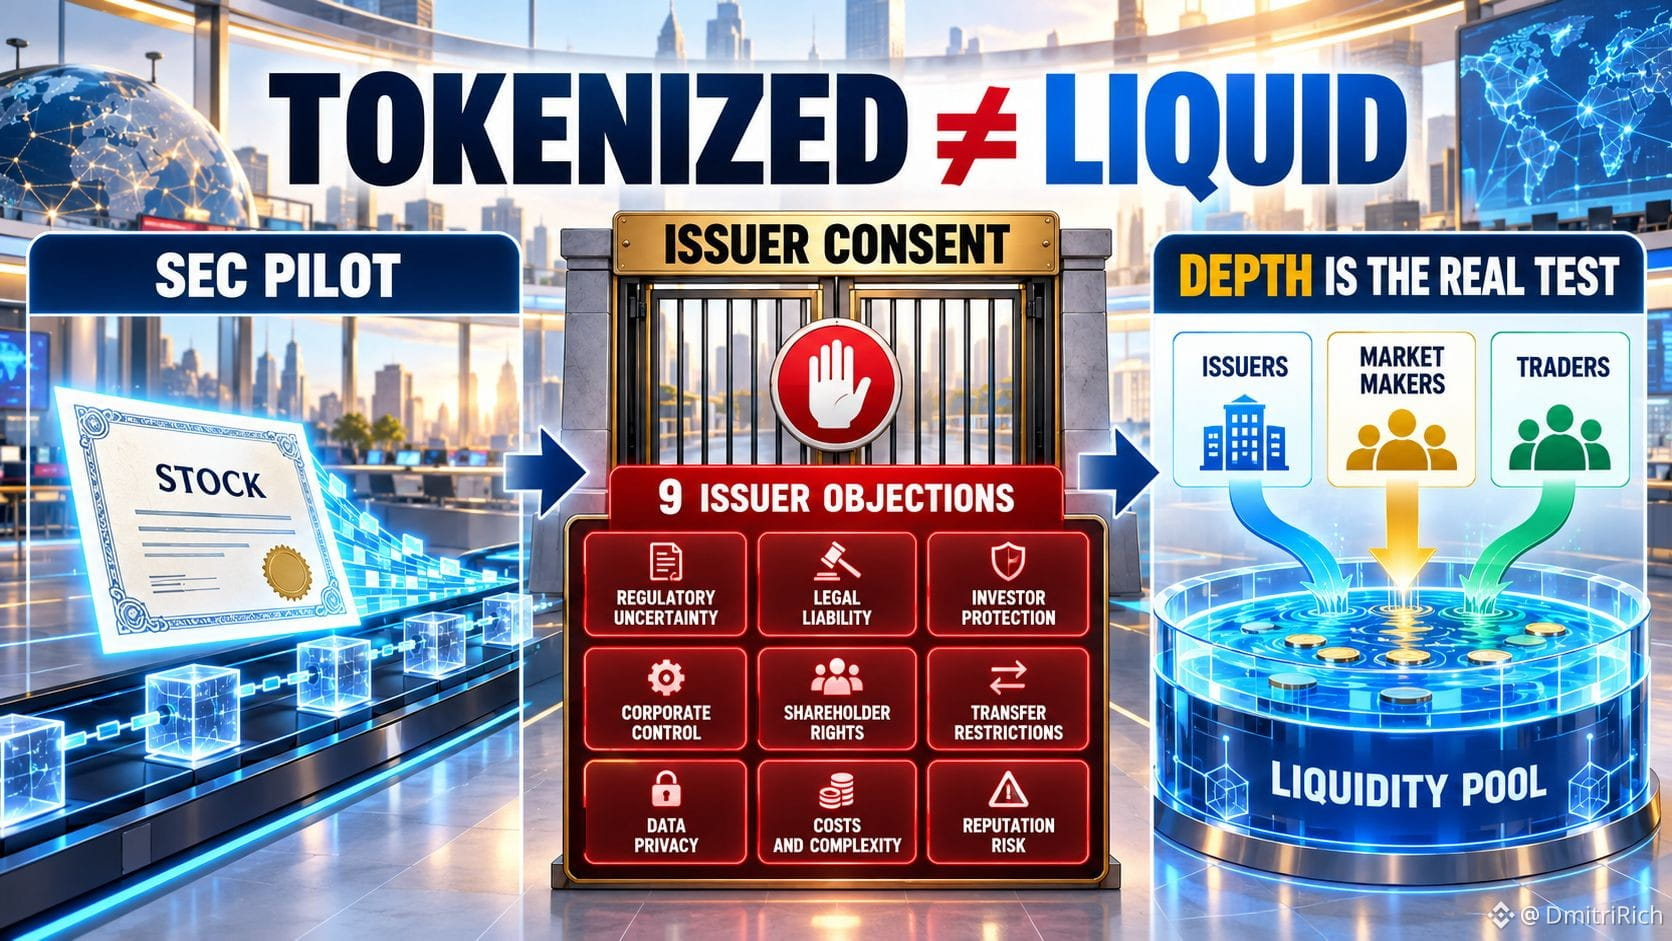
Tokenization can move a stock on-chain. It cannot manufacture liquidity.
OKXICE’s latest public notice lists issuer objections from nine companies, including Verizon, #Broadcom and #UnitedHealth . The #SEC ’s temporary framework gives issuers the right to object and requires token holders to receive the same rights as owners of the underlying stock.
The interesting part is not whether 24/7 #stock trading is technically possible. It is whether issuers, market makers and traders all show up at the same venue.
A token can be fully backed and legally permitted, yet still trade in a shallow pool with poor execution. For the tokenized-equity narrative, issuer participation and market depth now matter more than chain speed.
Watch the pools, not just the launch headlines.
101

·
--
Рост
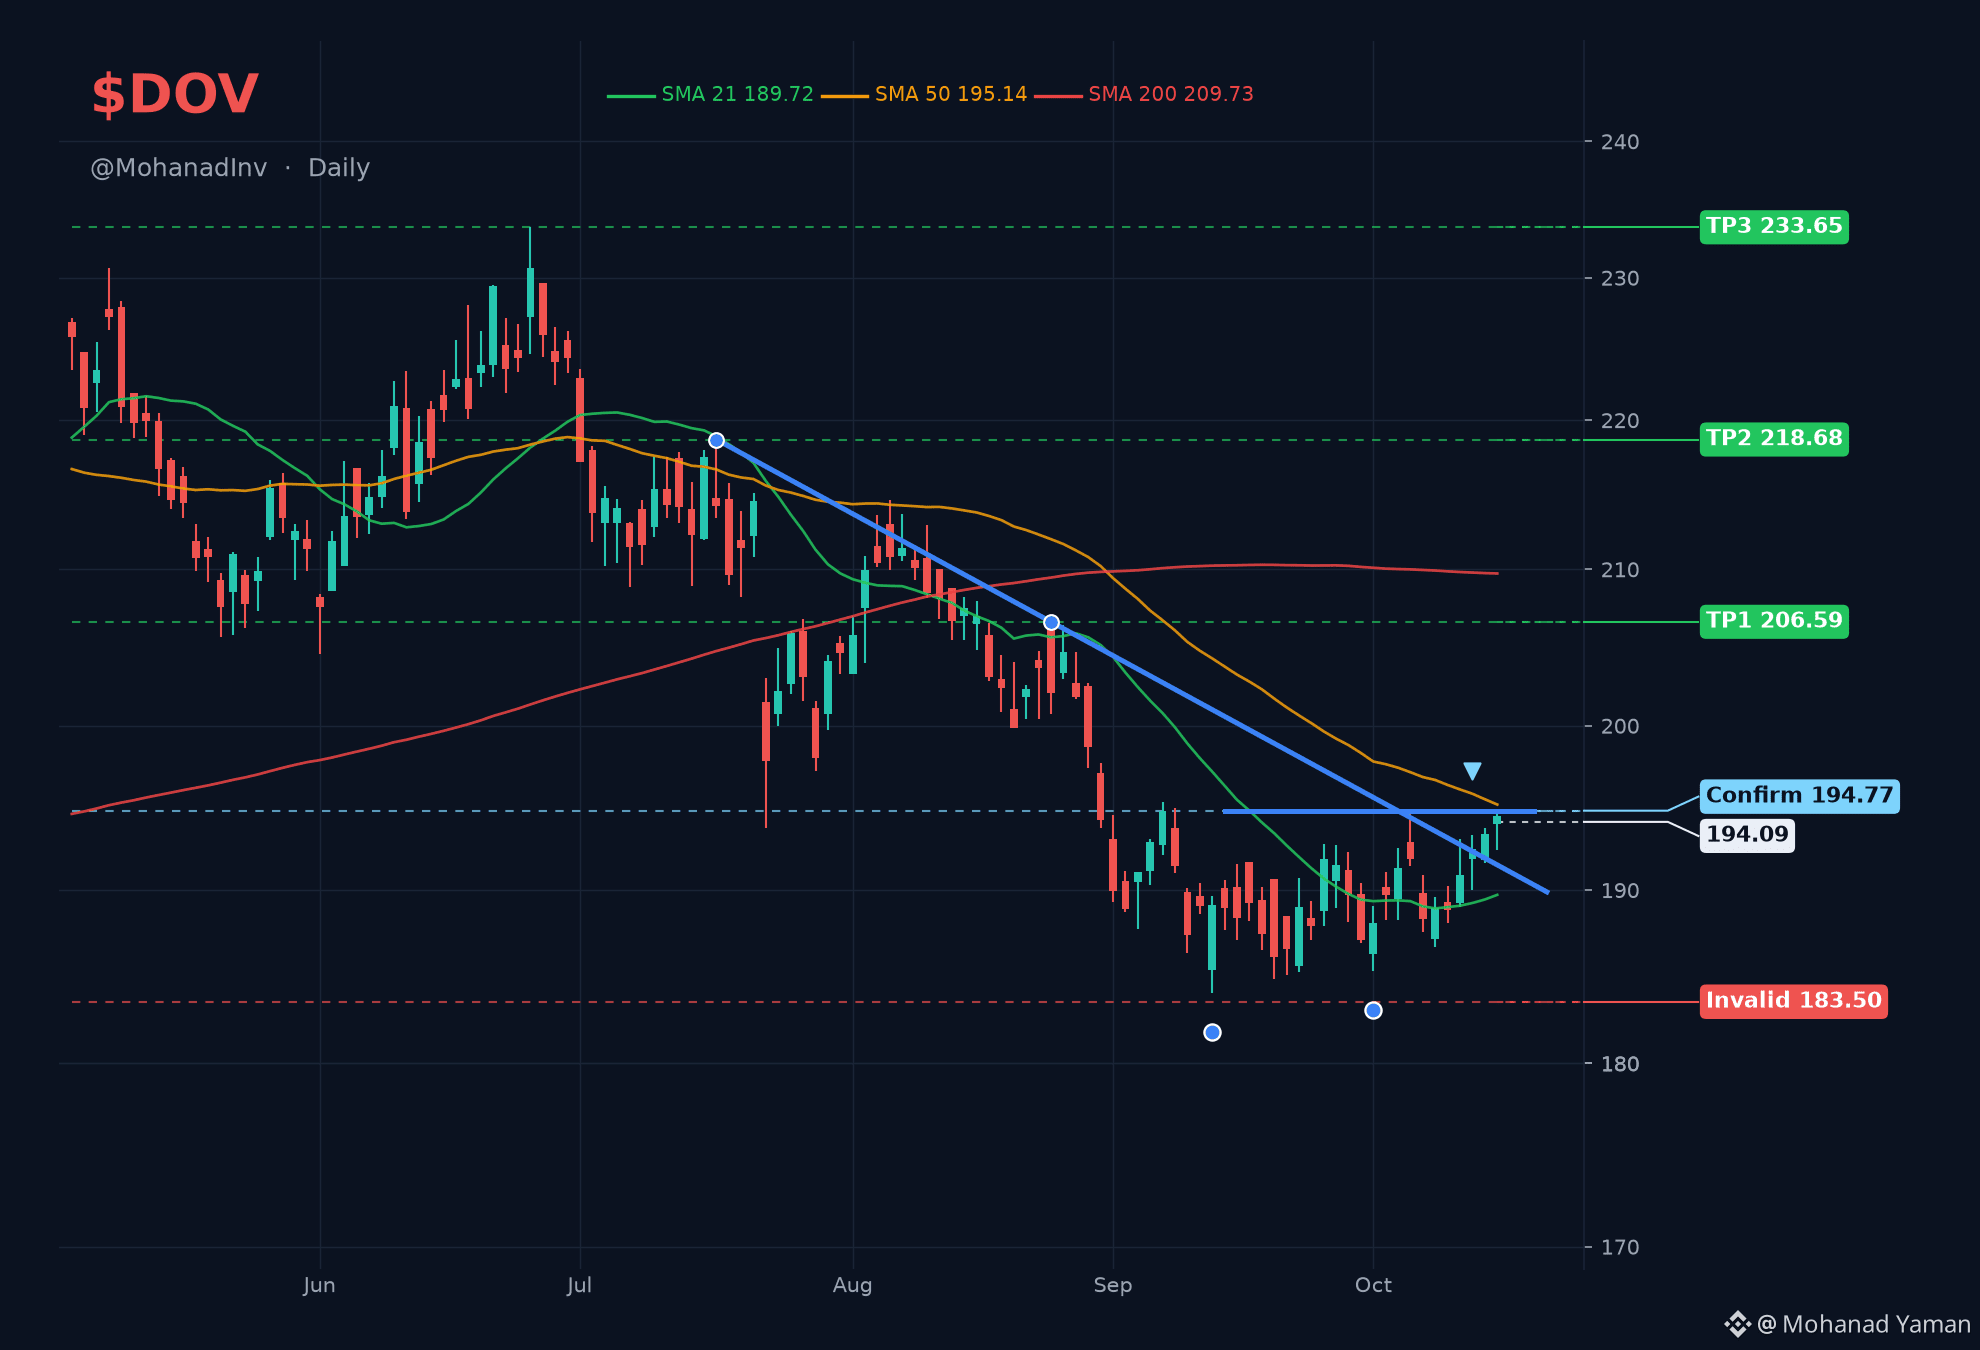
$DOV • double bottom and descending line breakout 👀
Dover makes industrial equipment: pumps, compressors, refrigeration and thermal systems for data centers.
🔹 Double bottom at 184.00 and 185.26, and closed over the descending line from the July high on Oct 13
🔹 Trading over 194.77 today. Needs a daily close above it to confirm
📊 Q2 revenue $2.19B (+6.9%)
💰 Q2 EBITDA $506M
📈 Q2 free cash flow $188M
⚠️ Q3 earnings Oct 22 before the open, confirmed by the company. Size accordingly
✅️ Confirm close over $194.77
🟢 TP1 $206.59 (+6.1%) • TP2 $218.68 (+12.3%) • TP3 $233.65 (+20.0%)
⛔️ Invalid close under $183.50 (-5.8%)
Please respect your SL level 🙏
#stock
121

·
--
🚨 TSLA STOCK UPDATE — OCTOBER 15, 2026 🚗📉
Tesla (NASDAQ: TSLA) is trading around $360–$362, based on the latest available market quotes.
📊 Market Snapshot
🔹 Previous Close: $367.16
🔹 Current Price: Around $360–$362
🔹 Market Trend: Under pressure
🔹 Next Major Catalyst: Tesla’s Q3 earnings report, expected October 21.
🔍 What’s Next for $TSLA ?
🐂 Bullish Scenario: Buyers step in and the stock begins recovering.
🐻 Bearish Scenario: Selling pressure continues and the price moves lower.
💡 My Take: Tesla is approaching an important price area. I’m watching price action and volume for confirmation instead of guessing the next move.
👇 What’s your prediction?
🟢 Bullish
🔴 Bearish
🟡 Waiting for confirmation
Share your thoughts in the comments!
#TSLA #StockMarketSuccess #stock #Investing"

154

·
--
PayPal Holdings, Inc. (ticker: PYPLB) є одним із найбільших світових фінтех-гігантів у сфері цифрових платежів. Сьогодні компанія знаходиться на перехідному етапі: перетворюється із класичної історіі зростання (growth stock) на вартісну акцію (value stock) з високим вільним грошовим потоком.
1. Фінансовий стан та ключові показники
Ціна акції та оцінка: Зараз папери торгуються у районі $53–$56 за акцію (ринкова капіталізація близько $45–$49 млрд). Для порівняння, на піку у 2021 році капіталізація перевищувала $360 млрд.
Мультиплікатори:
P/E (TTM): ~10x (дуже низька оцінка для фінтех-сектору).
P/FCF (Price / Free Cash Flow): ~9.5x – 10x.
EV/EBITDA: ~6.5x – 7.6x.
Доходи та маржинальність:
Квартальна виручка становить близько $8.68 млрд (+5% YoY).
Загальний обсяг платежів (TPD/TPV) демонструє стійке зростання (+9–10% YoY) і досяг $486.4 млрд за квартал.
Грошові потоки та зворотний викуп (Buyback): Компанія генерує потужний операційний та вільний грошовий потік (прогноз FCF на рік — понад $6 млрд). Менеджмент активно спрямовує ці кошти на викуп власних акцій (викуплено акцій на ~$6 млрд за останні 12 місяців), що зменшує загальну кількість паперів у обігу та підтримує показник прибутку на акцію (EPS).
2. Драйвери зростання та позитивні фактори
1. Трансформація брендового еквайрингу (Branded Checkout): Основне джерело доходу — branded checkout — демонструє стабілізацію за рахунок впровадження нових технологій (наприклад, інтеграція Fastlane для прискореного розрахунку без авторизації).
2. Монетизація Venmo: Платіжний сервіс Venmo показує двозначне зростання обсягу платежів (+14% YoY) та поступово збільшує рівень монетизації.
3. Ефективне використання капіталу: Завдяки масштабній програмі викупу акцій PayPal зменшує кількість shares outstanding на ~7-8% на рік, підвищуючи цінність кожної акції для довгострокових інвесторів.
4. Високий рівень вільного грошового потоку: Вільна грошова дохідність (FCF Yield) знаходиться на рівні понад 10%, що є високим показником для платіжного сектору.
3. Ризики та слабкі сторони
1. Стиснення маржі (Take Rate & Transaction Margin): Швидше зростає небрендована обробка карткових платежів (Unbranded/Braintree), яка має суттєво нижчу маржинальність порівняно із класичним PayPal Checkout. Це чинить тиск на операційну маржу.
2. Жорстка конкуренція: Зростаючий тиск з боку Apple Pay, Google Pay, Stripe та Buy Now Pay Later (BNPL) платформ ускладнює утримання частки ринку серед молодої аудиторії.
3. Повільне зростання активних акаунтів: Кількість активних користувачів стабілізувалася в районі ~438–439 млн (+0.3–1% YoY), тому зростання бізнесу більше залежить від збільшення кількості транзакцій на один акаунт, ніж від залучення нових клієнтів.
4. Інвестиційний підсумок
Категорія: Value-акція / Cash-flow generator.
Для кого підходить: Для інвесторів із середнім або помірним ризиком, які шукають недооцінену технологічну компанію з сильним балансом ($15.3 млрд готівки та інвестицій) та високим грошовим потоком.
Технічний та фундаментальний вигляд: Акція торгується поблизу нижньої межі свого 52-тижневого діапазону. Оцінка $53–$56 за акцію закладає значний песимізм щодо майбутніх темпів зростання. Якщо нове керівництво зможе зупинити падіння транзакційної маржі та розкрити потенціал Venmo/Fastlane, можлива переоцінка мультиплікаторів ринком
$PYPLB #stock
PayPal Holdings, Inc. (ticker: PYPLB)
є одним із найбільших світових фінтех-гігантів у сфері цифрових платежів. Сьогодні компанія знаходиться на перехідному етапі: перетворюється із класичної історіі зростання (growth stock) на вартісну акцію (value stock) з високим вільним грошовим потоком.
1. Фінансовий стан та ключові показники
Ціна акції та оцінка: Зараз папери торгуються у районі $53–$56 за акцію (ринкова капіталізація близько $45–$49 млрд). Для порівняння, на піку у 2021 році капіталізація перевищувала $360 млрд.
Мультиплікатори:
P/E (TTM): ~10x (дуже низька оцінка для фінтех-сектору).
P/FCF (Price / Free Cash Flow): ~9.5x – 10x.
EV/EBITDA: ~6.5x – 7.6x.
Доходи та маржинальність:
Квартальна виручка становить близько $8.68 млрд (+5% YoY).
Загальний обсяг платежів (TPD/TPV) демонструє стійке зростання (+9–10% YoY) і досяг $486.4 млрд за квартал.
Грошові потоки та зворотний викуп (Buyback): Компанія генерує потужний операційний та вільний грошовий потік (прогноз FCF на рік — понад $6 млрд). Менеджмент активно спрямовує ці кошти на викуп власних акцій (викуплено акцій на ~$6 млрд за останні 12 місяців), що зменшує загальну кількість паперів у обігу та підтримує показник прибутку на акцію (EPS).
2. Драйвери зростання та позитивні фактори
1. Трансформація брендового еквайрингу (Branded Checkout): Основне джерело доходу — branded checkout — демонструє стабілізацію за рахунок впровадження нових технологій (наприклад, інтеграція Fastlane для прискореного розрахунку без авторизації).
2. Монетизація Venmo: Платіжний сервіс Venmo показує двозначне зростання обсягу платежів (+14% YoY) та поступово збільшує рівень монетизації.
3. Ефективне використання капіталу: Завдяки масштабній програмі викупу акцій PayPal зменшує кількість shares outstanding на ~7-8% на рік, підвищуючи цінність кожної акції для довгострокових інвесторів.
4. Високий рівень вільного грошового потоку: Вільна грошова дохідність (FCF Yield) знаходиться на рівні понад 10%, що є високим показником для платіжного сектору.
3. Ризики та слабкі сторони
1. Стиснення маржі (Take Rate & Transaction Margin): Швидше зростає небрендована обробка карткових платежів (Unbranded/Braintree), яка має суттєво нижчу маржинальність порівняно із класичним PayPal Checkout. Це чинить тиск на операційну маржу.
2. Жорстка конкуренція: Зростаючий тиск з боку Apple Pay, Google Pay, Stripe та Buy Now Pay Later (BNPL) платформ ускладнює утримання частки ринку серед молодої аудиторії.
3. Повільне зростання активних акаунтів: Кількість активних користувачів стабілізувалася в районі ~438–439 млн (+0.3–1% YoY), тому зростання бізнесу більше залежить від збільшення кількості транзакцій на один акаунт, ніж від залучення нових клієнтів.
4. Інвестиційний підсумок
Категорія: Value-акція / Cash-flow generator.
Для кого підходить: Для інвесторів із середнім або помірним ризиком, які шукають недооцінену технологічну компанію з сильним балансом ($15.3 млрд готівки та інвестицій) та високим грошовим потоком.
Технічний та фундаментальний вигляд: Акція торгується поблизу нижньої межі свого 52-тижневого діапазону. Оцінка $53–$56 за акцію закладає значний песимізм щодо майбутніх темпів зростання. Якщо нове керівництво зможе зупинити падіння транзакційної маржі та розкрити потенціал Venmo/Fastlane, можлива переоцінка мультиплікаторів ринком
$PYPLB #stock
222

·
--
Las acciones en EE. UU. y varios mercados caen este 14 de octubre de 2026 impulsadas por datos de inflación más altos de lo esperado y resultados corporativos negativos:
• Dato de inflación (IPC): El Índice de Precios al Consumo de EE. UU. de septiembre se aceleró al 3,6% interanual, lo que aumenta el temor a que la Reserva Federal (Fed) mantenga o suba las tasas de interés.
• Oracle (ORCL): Sus acciones se desploman tras reportar ingresos trimestrales (16.060 millones de dólares) por debajo de las previsiones, lo que arrastra a otras empresas del sector de inteligencia artificial como Nvidia, Microsoft y Micron.
• Bank of America (BAC): Cae en la preapertura tras presentar resultados por debajo de las expectativas, afectados por menores ingresos en operaciones bursátiles y un cargo regulatorio de 1.200 millones de dólares.
• Tecnología y semiconductores: El índice Nasdaq y empresas como Micron y Applied Materials registran retrocesos por presiones de costos e incertidumbre en el sector tecnológico.
$SPYB #stock
123

·
--
Рост
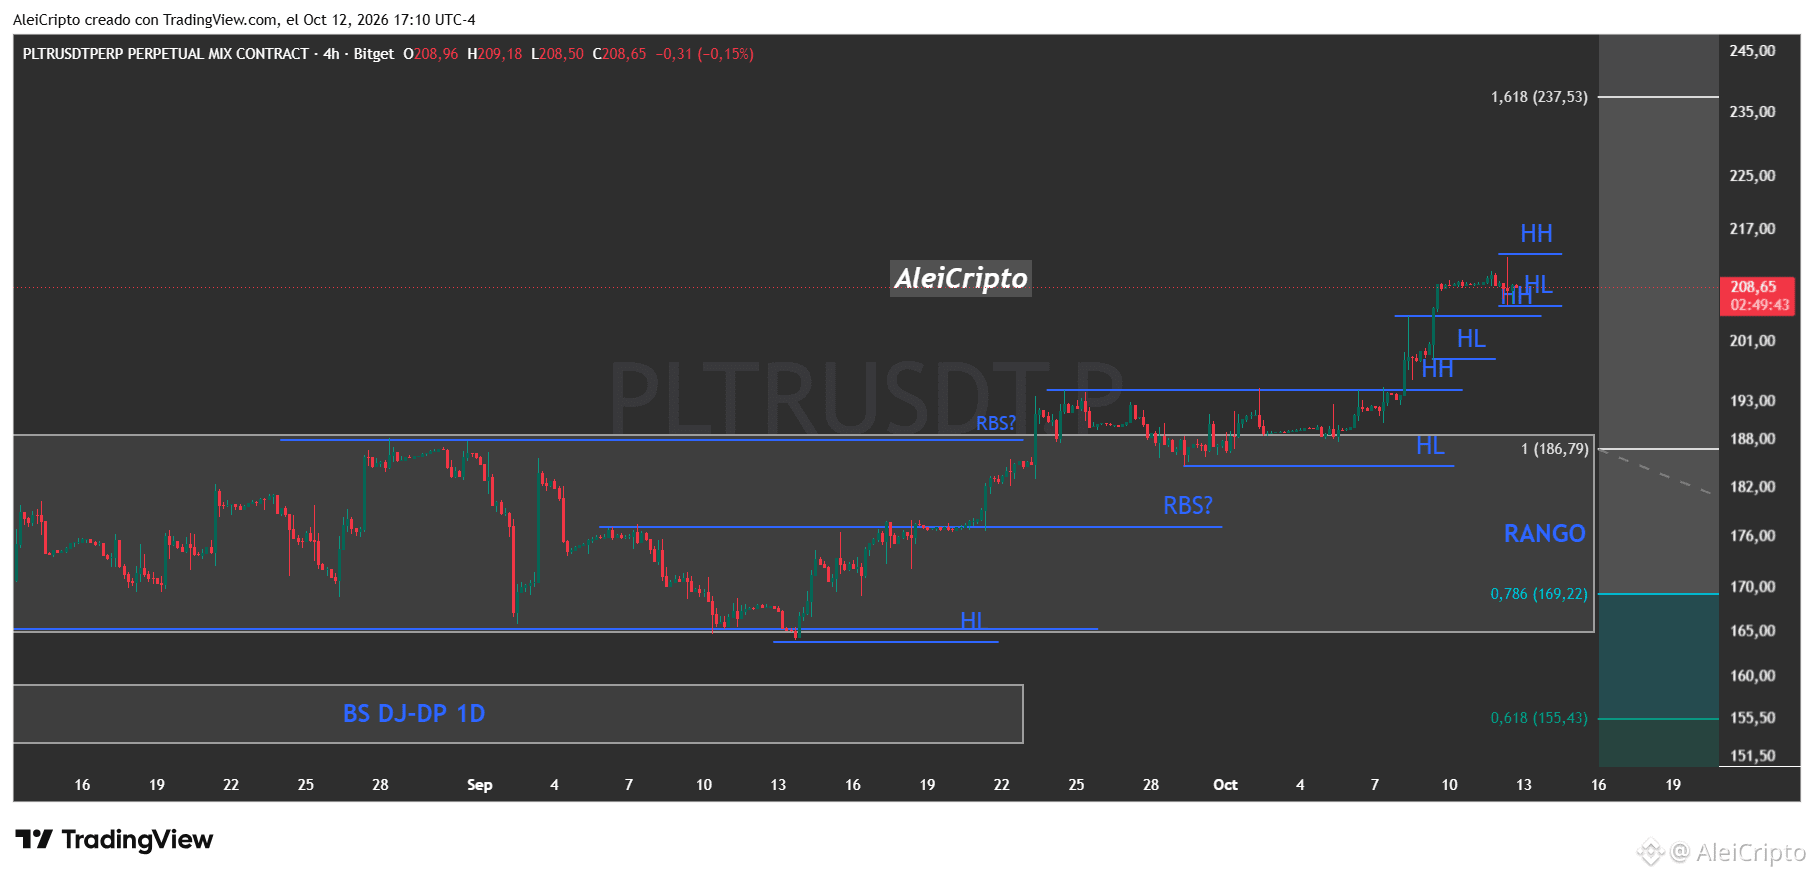
ANÁLISIS TÉCNICO | $PLTR
$PLTR comprimiendo en los $208,65 tras marcar un nuevo máximo expansivo en los $217,00 y reabsorber con fuerza sobre la estructura previa. El nivel decisivo para la continuidad del impulso alcista se ubica en los $201,00.
• Zona: consolidar la posición sobre la franja de $201,00 - $208,00 en esta vela de 4H.
• Invalidación: cierre de 4H bajo $201,00 invalida el impulso y busca retestear la zona del rango previo ($193,00).
• Objetivo: reanudar la aceleración alcista para romper los $217,00 y buscar la extensión en $237,53.
¿Mantiene la consolidación arriba o busca liquidez en los $193,00? 📈
#stock
{future}(PLTRUSDT)
{spot}(PLTRBUSDT)
ANÁLISIS TÉCNICO | $PLTR
$PLTR comprimiendo en los $208,65 tras marcar un nuevo máximo expansivo en los $217,00 y reabsorber con fuerza sobre la estructura previa. El nivel decisivo para la continuidad del impulso alcista se ubica en los $201,00.
• Zona: consolidar la posición sobre la franja de $201,00 - $208,00 en esta vela de 4H.
• Invalidación: cierre de 4H bajo $201,00 invalida el impulso y busca retestear la zona del rango previo ($193,00).
• Objetivo: reanudar la aceleración alcista para romper los $217,00 y buscar la extensión en $237,53.
¿Mantiene la consolidación arriba o busca liquidez en los $193,00? 📈
#stock
20
·
--
Рост
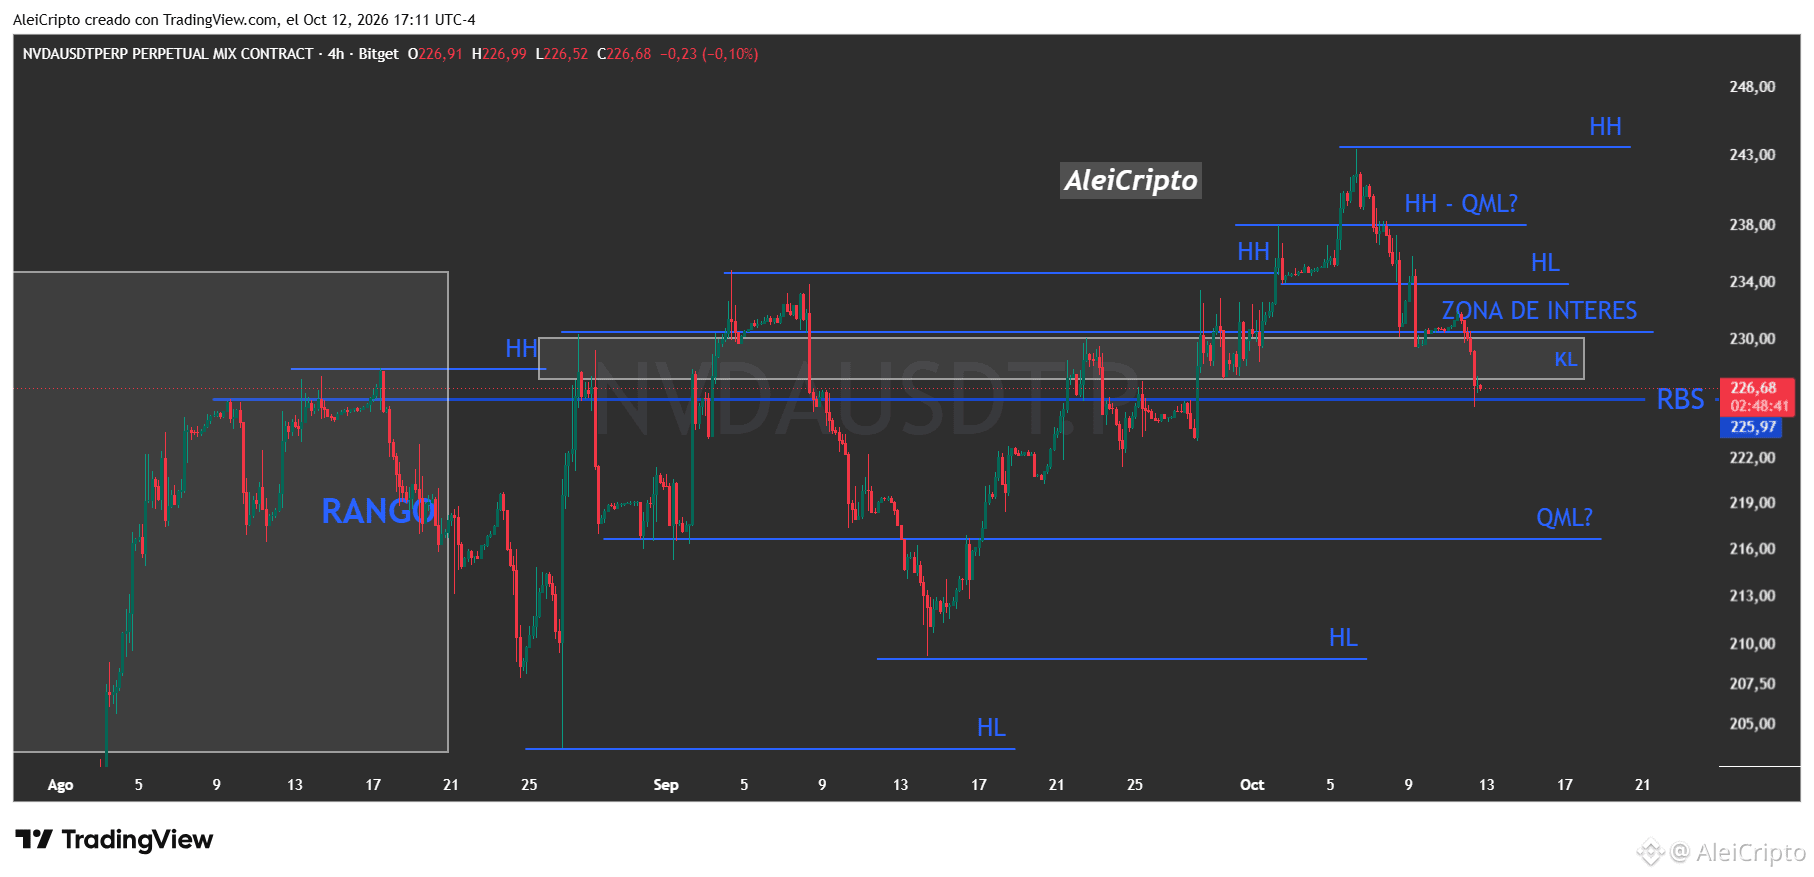
ANÁLISIS TÉCNICO | $NVDA
$NVDA testeando la zona de soporte clave en los $226,68 tras perder la zona de interés previa ($230,00 - $234,00) y buscar apoyo directo sobre la línea clave en $225,97. El punto decisivo para evitar mayor corrección se ubica en los $225,97.
• Zona: defender el nivel de soporte en $225,97 en este cierre de vela de 4H.
• Invalidación: cierre de 4H bajo $225,97 confirma quiebre de estructura y busca piso en $218,00.
• Objetivo: rebotar directo a recuperar la zona de resistencia en $230,00.
¿Aguanta la defensa sobre $225,97 o acelera la caída hacia los $218,00? 📉
#stock
{future}(NVDAUSDT)
{spot}(NVDABUSDT)
ANÁLISIS TÉCNICO | $NVDA
$NVDA testeando la zona de soporte clave en los $226,68 tras perder la zona de interés previa ($230,00 - $234,00) y buscar apoyo directo sobre la línea clave en $225,97. El punto decisivo para evitar mayor corrección se ubica en los $225,97.
• Zona: defender el nivel de soporte en $225,97 en este cierre de vela de 4H.
• Invalidación: cierre de 4H bajo $225,97 confirma quiebre de estructura y busca piso en $218,00.
• Objetivo: rebotar directo a recuperar la zona de resistencia en $230,00.
¿Aguanta la defensa sobre $225,97 o acelera la caída hacia los $218,00? 📉
#stock
21
·
--
Рост
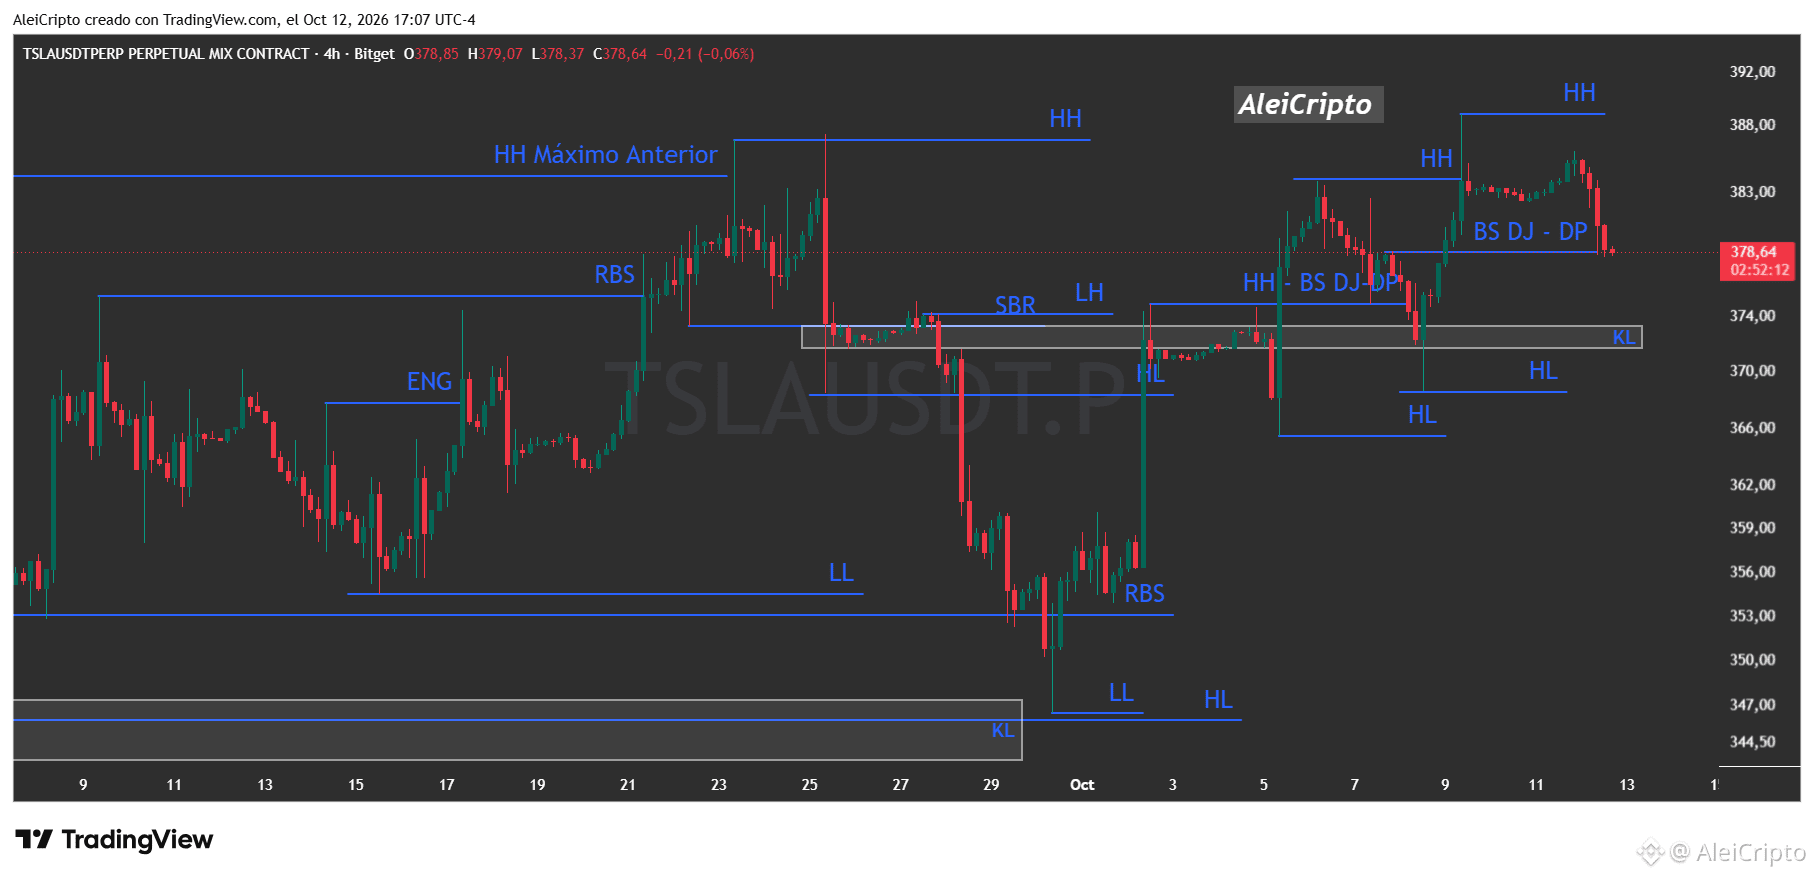
ANÁLISIS TÉCNICO | $TSLA
$TSLA reabsorbiendo sobre los $378,64 tras testear la zona de soporte en los $374,00 y reaccionar al alza. El nivel decisivo para mantener el sesgo alcista a corto plazo se ubica en los $374,00.
• Zona: defender el soporte clave entre $374,00 y $378,00 en esta vela de 4H.
• Invalidación: cierre de 4H bajo $374,00 confirma la trampa y habilita la caída hacia los $366,00.
• Objetivo: reanudar el impulso hacia la resistencia superior en $383,00 y retestear el máximo en $388,00.
¿Aguanta la defensa sobre los $374,00 o acelera la corrección hacia el piso inferior? 📈
#stock
{future}(TSLAUSDT)
{spot}(TSLABUSDT)
ANÁLISIS TÉCNICO | $TSLA
$TSLA reabsorbiendo sobre los $378,64 tras testear la zona de soporte en los $374,00 y reaccionar al alza. El nivel decisivo para mantener el sesgo alcista a corto plazo se ubica en los $374,00.
• Zona: defender el soporte clave entre $374,00 y $378,00 en esta vela de 4H.
• Invalidación: cierre de 4H bajo $374,00 confirma la trampa y habilita la caída hacia los $366,00.
• Objetivo: reanudar el impulso hacia la resistencia superior en $383,00 y retestear el máximo en $388,00.
¿Aguanta la defensa sobre los $374,00 o acelera la corrección hacia el piso inferior? 📈
#stock
2
1
106
·
--
Падение
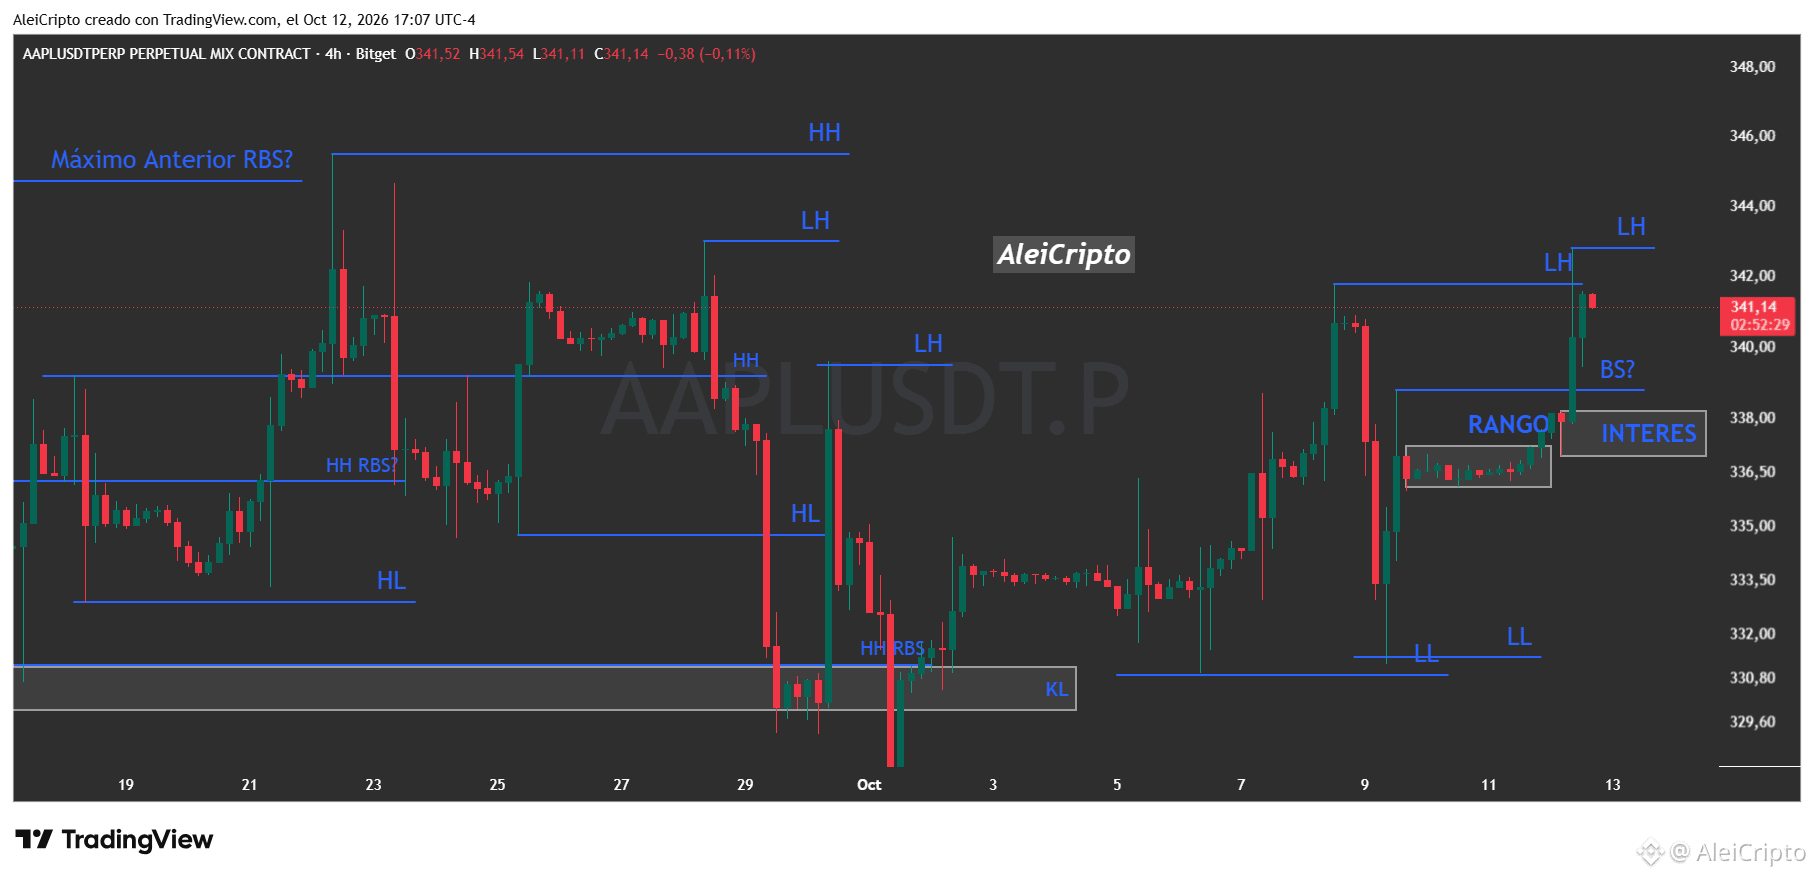
ANÁLISIS TÉCNICO | $AAPL
$AAPL comprimiendo sobre los $341,14 tras rechazar la resistencia en $343,50 y mantener el sesgo alcista tras el quiebre del rango. El nivel decisivo para confirmar la continuidad se ubica en los $339,50.
• Zona: consolidar el soporte de $339,50 en el cierre de esta vela de 4H.
• Invalidación: cierre abajo de $339,50 confirma la trampa y devuelve el precio a la zona de interés en $336,50.
• Objetivo: reanudar el impulso comprador hacia los máximos previos en $343,50 y $345,50.
¿Mantiene la consolidación sobre $339,50 o busca el retest del rango inferior? 📈
#stock
{future}(AAPLUSDT)
{spot}(AAPLBUSDT)
ANÁLISIS TÉCNICO | $AAPL
$AAPL comprimiendo sobre los $341,14 tras rechazar la resistencia en $343,50 y mantener el sesgo alcista tras el quiebre del rango. El nivel decisivo para confirmar la continuidad se ubica en los $339,50.
• Zona: consolidar el soporte de $339,50 en el cierre de esta vela de 4H.
• Invalidación: cierre abajo de $339,50 confirma la trampa y devuelve el precio a la zona de interés en $336,50.
• Objetivo: reanudar el impulso comprador hacia los máximos previos en $343,50 y $345,50.
¿Mantiene la consolidación sobre $339,50 o busca el retest del rango inferior? 📈
#stock
2
124

🚀$NVDAB NVIDIA ($NVDA): THE AI GIANT TO WATCH! 🤖📈
NVIDIA continues to be one of the most closely watched companies in the artificial intelligence industry. Its GPUs power AI models, data centers, and advanced computing systems, making it a major player in the global technology market.
🔥 Why is NVIDIA worth watching?
✅ Strong demand for AI computing
✅ Expansion of data center infrastructure
✅ Growing adoption of artificial intelligence
✅ Potential opportunities alongside risks in the semiconductor sector
📊 My Market Take: NVIDIA's long-term outlook will depend on AI demand, competition, earnings growth, and its valuation. Investors should watch its latest financial results and price movements before making decisions.
💬 Your opinion matters!
Can NVIDIA remain a leader in the AI revolution, or will competitors challenge its dominance?
👇 Comment your thoughts!
#NVDA #AI #stock #Technology #BinanceSquare
1
60
·
--
Рост
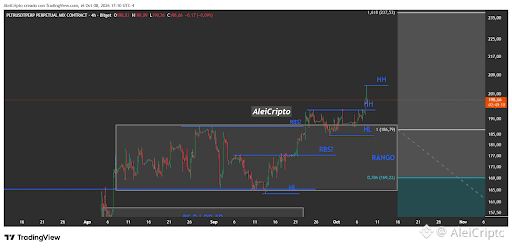
$PLTR comprimiendo sobre los $198,66 tras marcar el máximo expansivo en $205,00. Todo se decide en la zona de retest en $194,00.
• Zona: consolidar el cierre sobre los $194,00 en esta vela de 4H.
• Invalidación: cierre abajo liquida la salida y regresa al rango ($186,79).
• Objetivo: reanudar la aceleración hacia la extensión en $205,00 y $237,50.
¿Mantiene la consolidación arriba o mete trampa de vuelta al rango? 📈
#TradFi #stock
{spot}(PLTRBUSDT)
{future}(PLTRUSDT)
$PLTR comprimiendo sobre los $198,66 tras marcar el máximo expansivo en $205,00. Todo se decide en la zona de retest en $194,00.
• Zona: consolidar el cierre sobre los $194,00 en esta vela de 4H.
• Invalidación: cierre abajo liquida la salida y regresa al rango ($186,79).
• Objetivo: reanudar la aceleración hacia la extensión en $205,00 y $237,50.
¿Mantiene la consolidación arriba o mete trampa de vuelta al rango? 📈
#TradFi #stock
1
38
·
--
Рост
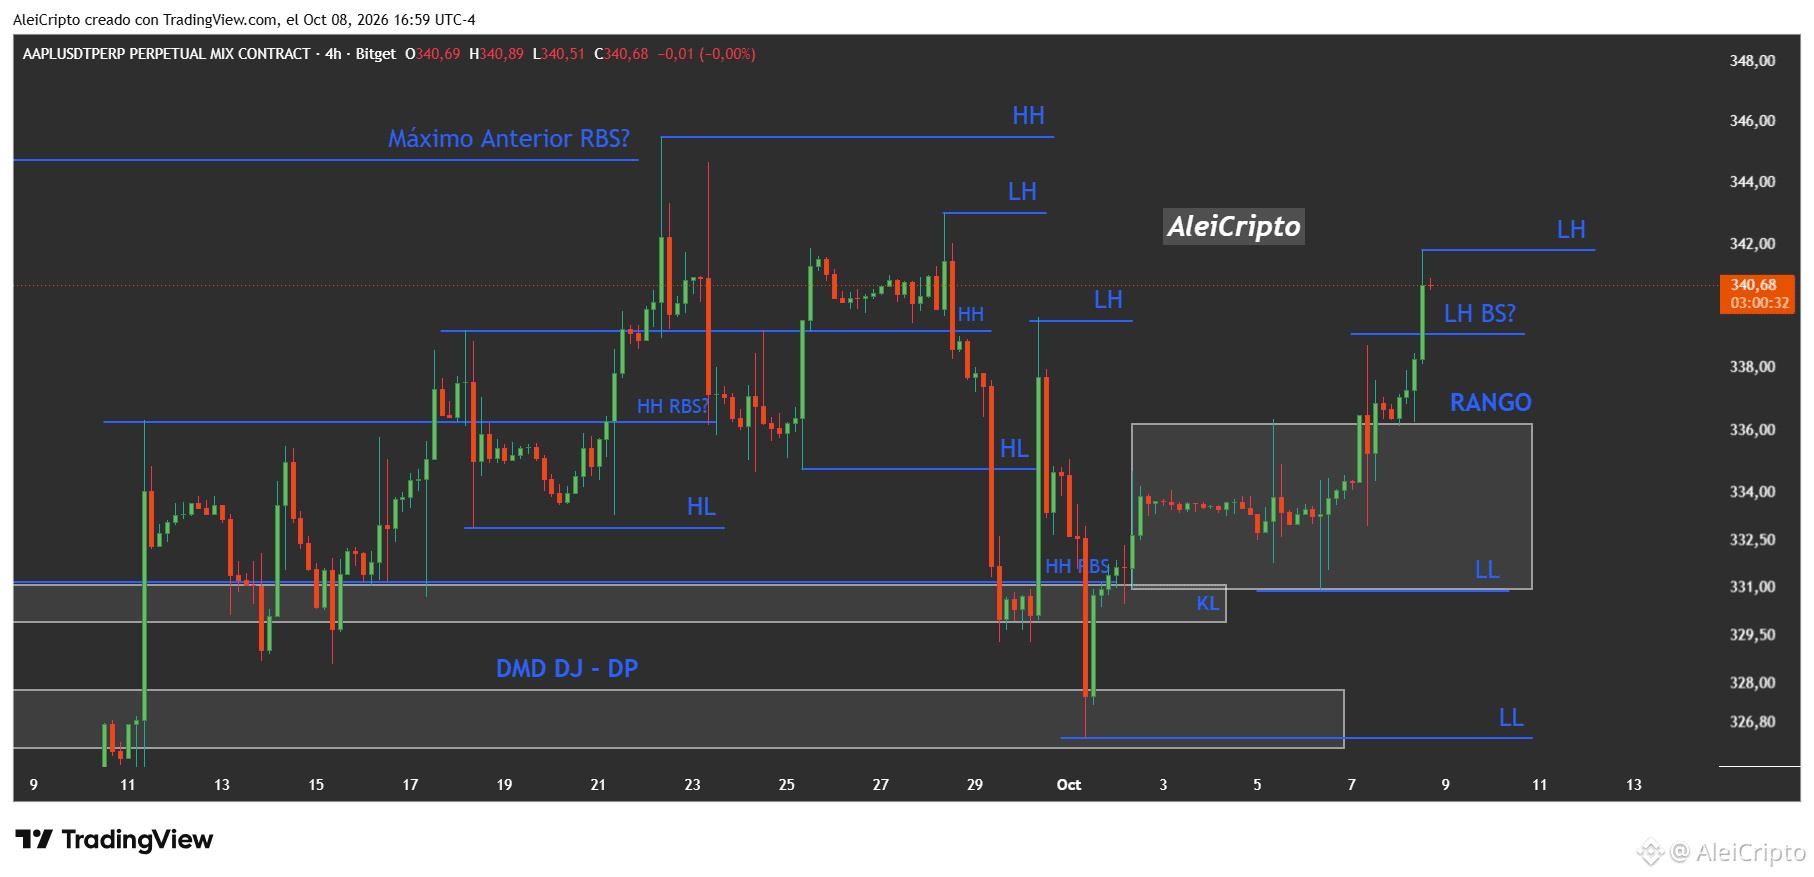
$AAPL marcando la aceleración impulsiva hasta $340,68 tras quebrar el rango en $336,00. El nivel que decide la continuidad es $339,50.
• Zona: consolidar el cierre de esta vela sobre los $339,50.
• Invalidación: cierre abajo confirma trampa y devuelve el precio al rango ($336,00).
• Objetivo: continuar la expansión hacia el máximo previo en $343,50.
¿Mantiene la aceleración sobre $339,50 o busca el retest del rango? 📈
#stock
{future}(AAPLUSDT)
{spot}(AAPLBUSDT)
$AAPL marcando la aceleración impulsiva hasta $340,68 tras quebrar el rango en $336,00. El nivel que decide la continuidad es $339,50.
• Zona: consolidar el cierre de esta vela sobre los $339,50.
• Invalidación: cierre abajo confirma trampa y devuelve el precio al rango ($336,00).
• Objetivo: continuar la expansión hacia el máximo previo en $343,50.
¿Mantiene la aceleración sobre $339,50 o busca el retest del rango? 📈
#stock
• Zona: consolidar el cierre de esta vela sobre los $339,50.
• Invalidación: cierre abajo confirma trampa y devuelve el precio al rango ($336,00).
• Objetivo: continuar la expansión hacia el máximo previo en $343,50.
¿Mantiene la aceleración sobre $339,50 o busca el retest del rango? 📈
#stock
2
69
·
--
Рост
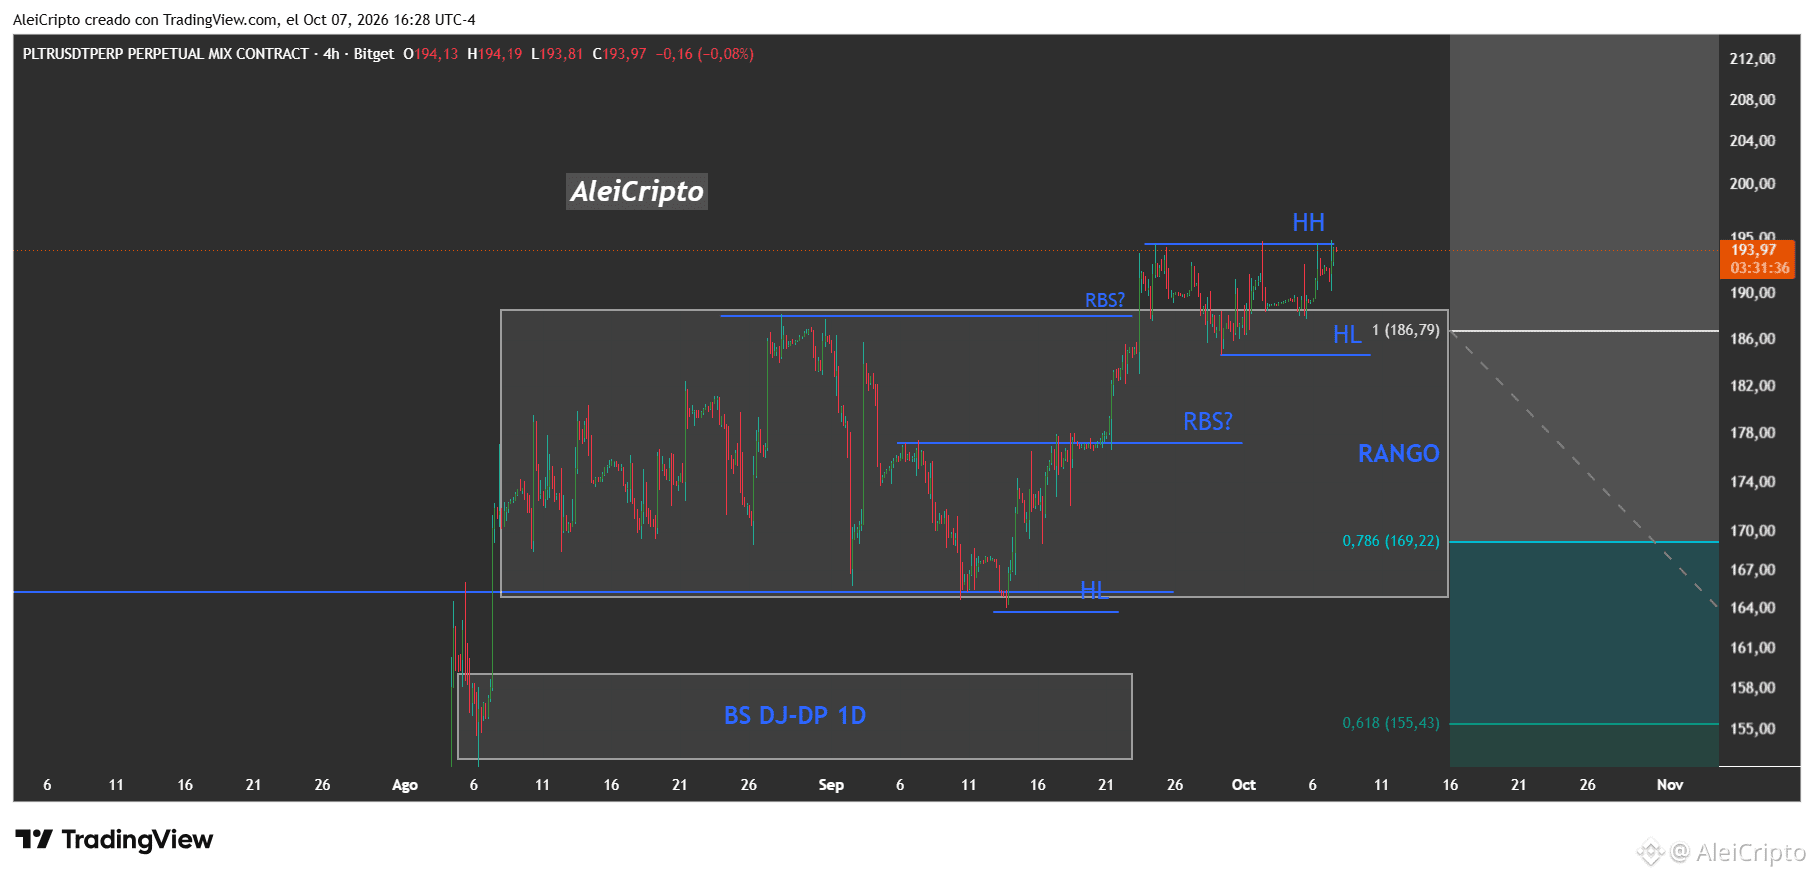
$PLTR testeando la zona de máximo anterior en $193,97 tras rebotar sobre los $186,79; el punto decisivo se mantiene en la resistencia de los $194,00.
• Zona: consolidar sobre $194,00 en esta vela de 4H.
• Invalidación: cierre abajo y regresa a buscar el piso en $186,79.
• Objetivo: proyectar la expansión hacia la zona del canal superior en $200,00+.
¿Rompe la resistencia en $194,00 o vuelve a meterse al rango? 📈
#BinanceLaunchesBinanceIntelligence #stock
{spot}(PLTRBUSDT)
{future}(PLTRUSDT)
$PLTR testeando la zona de máximo anterior en $193,97 tras rebotar sobre los $186,79; el punto decisivo se mantiene en la resistencia de los $194,00.
• Zona: consolidar sobre $194,00 en esta vela de 4H.
• Invalidación: cierre abajo y regresa a buscar el piso en $186,79.
• Objetivo: proyectar la expansión hacia la zona del canal superior en $200,00+.
¿Rompe la resistencia en $194,00 o vuelve a meterse al rango? 📈
#BinanceLaunchesBinanceIntelligence #stock
63
Войдите, чтобы посмотреть больше материала
Присоединяйтесь к пользователям криптовалют по всему миру на Binance Square
⚡️ Получайте новейшую и полезную информацию о криптоактивах.
💬 Нам доверяет крупнейшая в мире криптобиржа.
👍 Получите достоверные аналитические данные от верифицированных создателей контента.
Эл. почта/номер телефона
В тренде
1
#FedWatch
Просмотров: 16.3M
39,394 обсуждают
2
#EarningsSeason
Просмотров: 6.4M
32,090 обсуждают
3
#USMidtermElections
Просмотров: 42,628
619 обсуждают
4
#BitcoinDropsBelow$80K
Просмотров: 28,741
118 обсуждают
5
#BoEOpensConsultationOnTokenizedCollateralForClearing
Просмотров: 607
29 обсуждают
6
#BrazilCryptoExchangesMustApplyForLicensesByFriday
Просмотров: 32,751
504 обсуждают
7
#ICEPartnersWithTradeXYZToBringPerpetualContractsToUS
Просмотров: 706
19 обсуждают
8
#SolidusLabsReportsSuspected$170MSpoofingOnHyperliquidOilContracts
Просмотров: 1,618
28 обсуждают
9
#StanDruckenmillerBecomesInvestorInTradeXYZ
Просмотров: 24,614
437 обсуждают
10
#RussiaProposedNonCustodialWalletLimitsExcludeIntlSettlements
Просмотров: 2,110
41 обсуждают