

#overbought
overbought
Просмотров: 92,528
588 обсуждают
Популярные
Новые

·
--
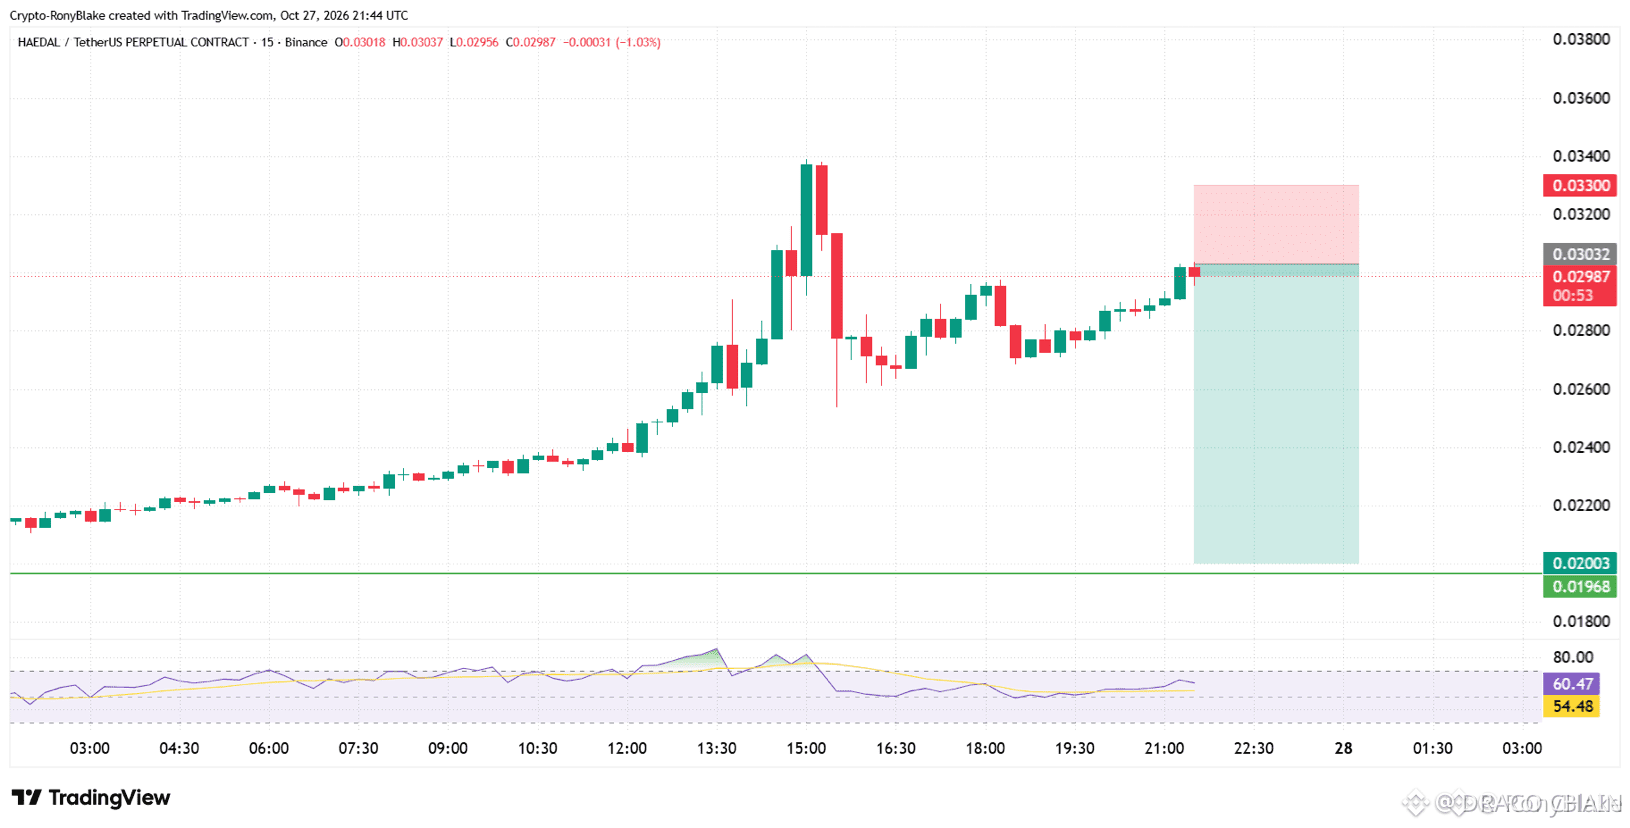
🔴 $HAEDAL SLIPPING INTO OVERBOUGHT TRAP – SHORT TIMEFRAME ALERT! 📉
Target: 0.024 / 0.020 🚀
Stop Loss: 0.033 ⚠️
The 4‑hour RSI is deep in the overbought zone, flashing a clear exhaustion signal 📊. Volume has been tapering while price still climbs, a classic sign that buying pressure is evaporating 🦈.
Liquidity is stacking above the $0.033 barrier, primed for a swift dump. A short positioned now captures the imminent reversal with a clean risk‑to‑reward profile 💡.
💬 Are you ready to ride the pullback or waiting for a deeper break? 👇
⚠️ Not financial advice. Always manage your risk. 🛡️
🏷️ #HAEDAL #ShortSetup #Overbought #Crypto
🚀 🔥
4

#Overbought & #oversold
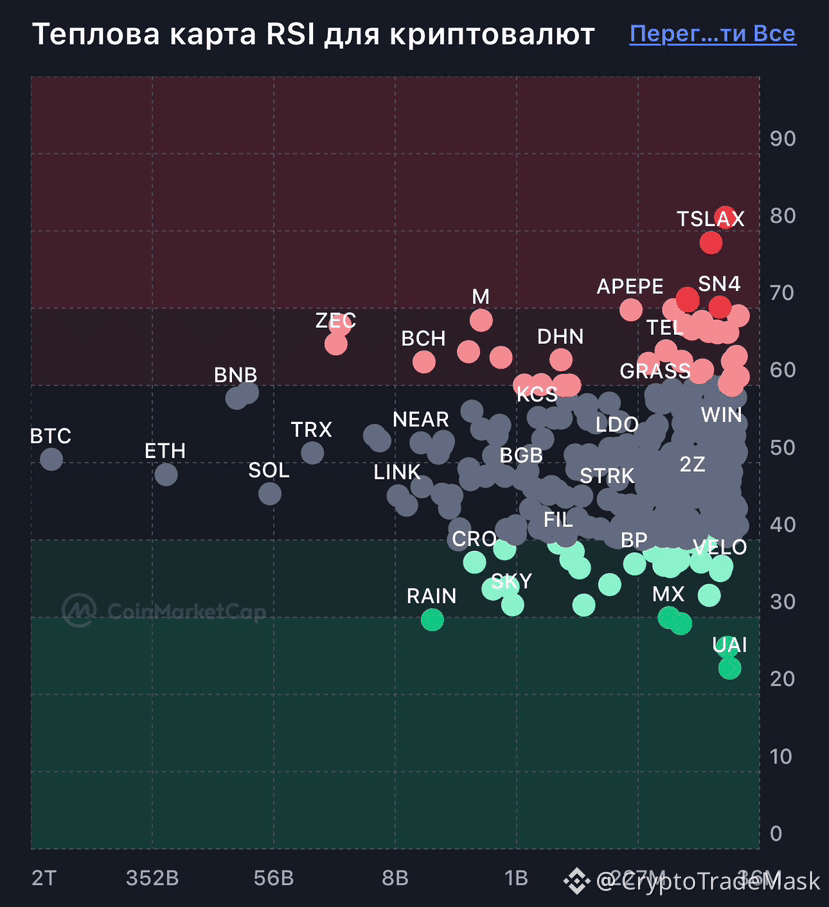
📊 Overbought & Oversold: How does it work? 📈📉
Key market zones that indicate when the price may reverse.
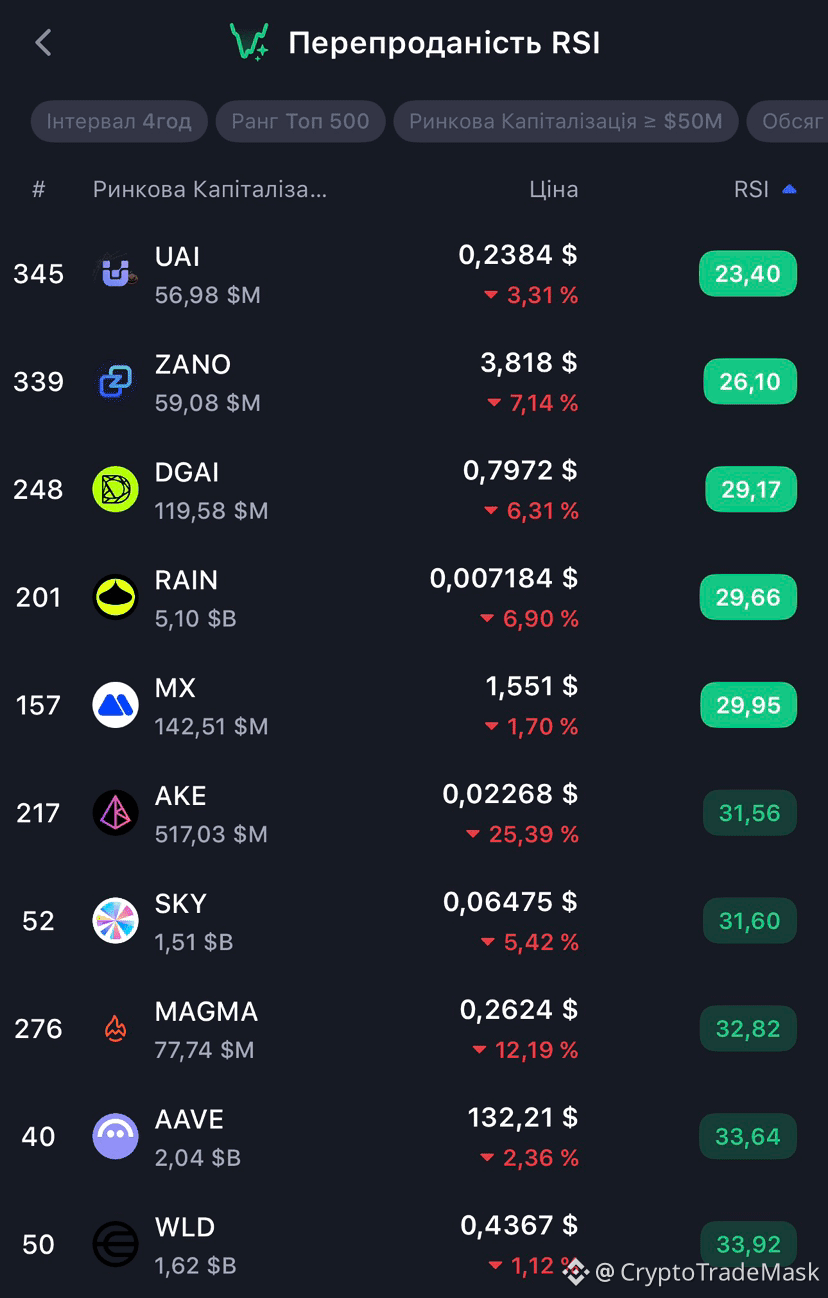
🟢 Oversold
• The price has fallen too low - temporarily or excessively.
• RSI < 30.
• There may be a chance of a rebound - the asset is becoming interesting to buy.
• Many coins are now in this zone: $UAI - a bottom may be forming.
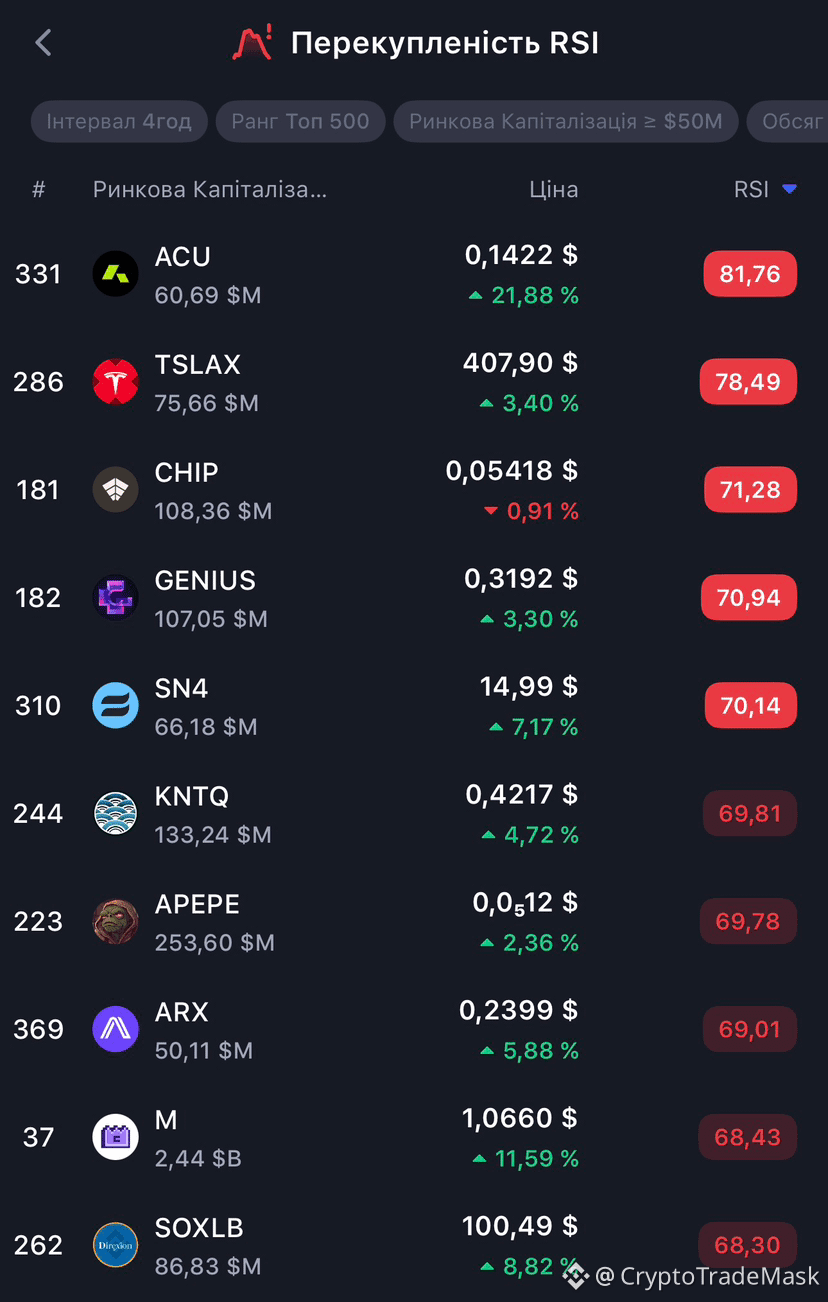
🔴 Overbought
• The price has risen too much.
• RSI > 70.
• A correction or pause after growth is likely - it's time to take profits.
• In this zone now: $ACU , $CHIP - a cooling after a surge is possible.
⚠️ Rule of thumb: no indicator gives guarantees - they are only hints, not a verdict.
{future}(CHIPUSDT)
{future}(ACUUSDT)
{future}(UAIUSDT)
#Overbought & #oversold
📊 Overbought & Oversold: How does it work? 📈📉
Key market zones that indicate when the price may reverse.
🟢 Oversold
• The price has fallen too low - temporarily or excessively.
• RSI < 30.
• There may be a chance of a rebound - the asset is becoming interesting to buy.
• Many coins are now in this zone: $UAI - a bottom may be forming.
🔴 Overbought
• The price has risen too much.
• RSI > 70.
• A correction or pause after growth is likely - it's time to take profits.
• In this zone now: $ACU , $CHIP - a cooling after a surge is possible.
⚠️ Rule of thumb: no indicator gives guarantees - they are only hints, not a verdict.
1
841
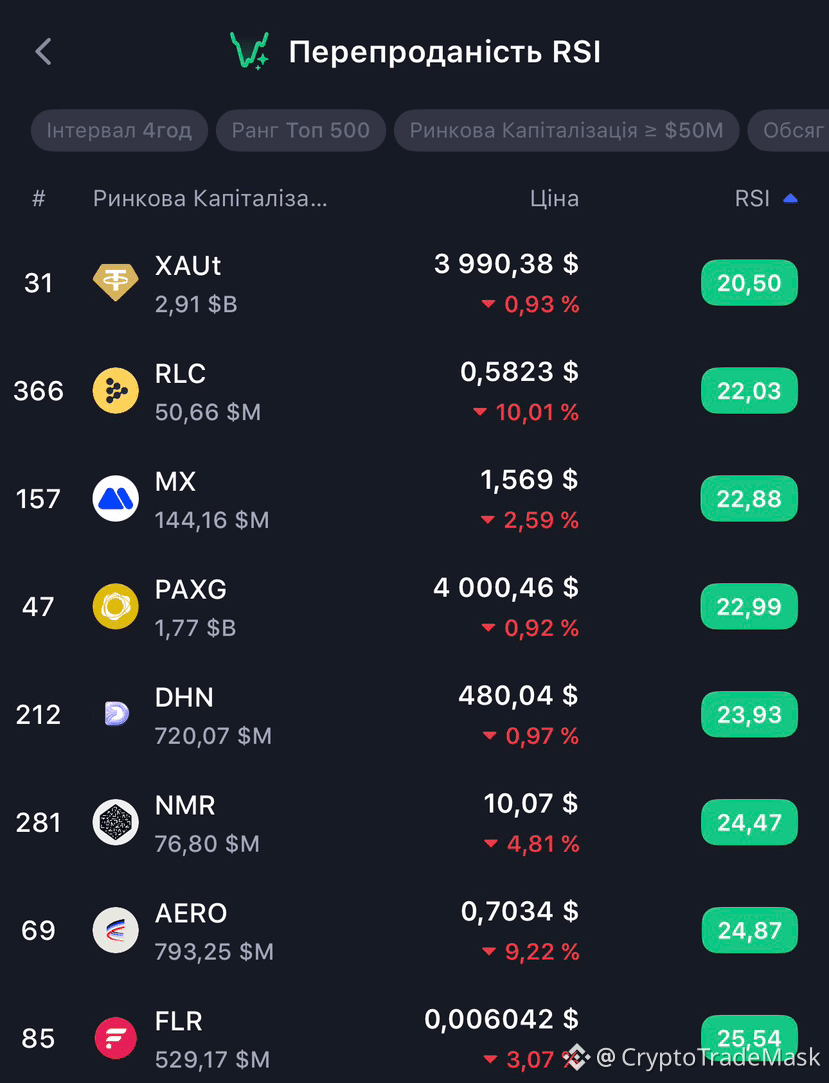
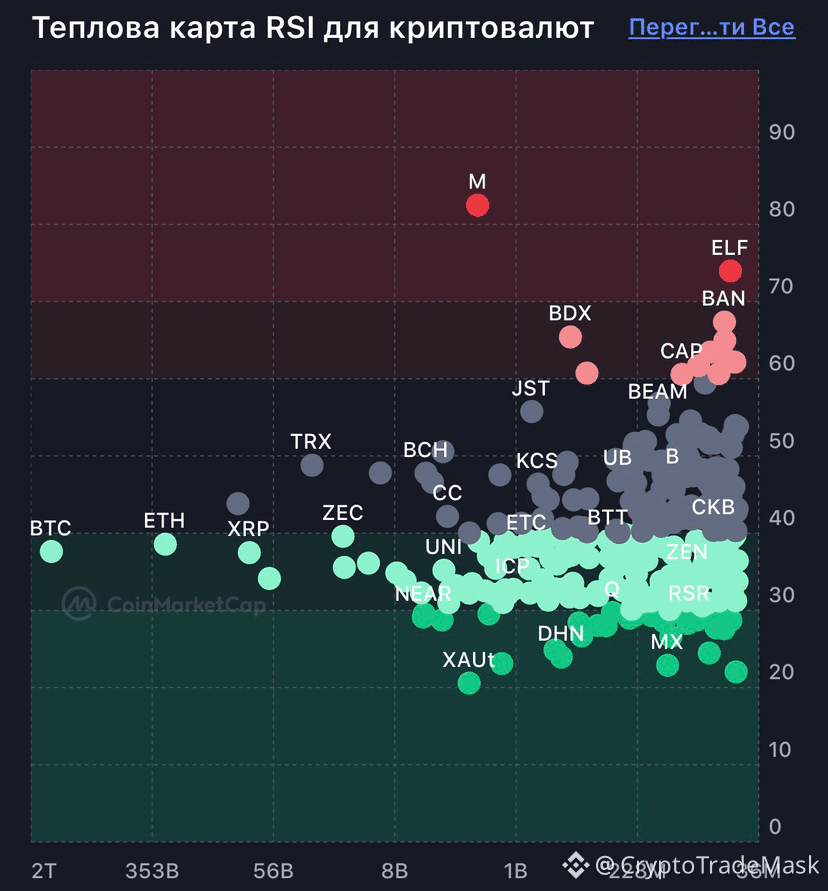
#Overbought & #oversold
📊 Overbought & Oversold: How does it work? 📈📉
Key market zones that indicate when the price may reverse.
🟢 Oversold
• The price has fallen too low - temporarily or excessively.
• RSI < 30.
• There may be a chance of a rebound - the asset is becoming interesting to buy.
• Many coins are now in this zone: $XAUT ,$RLC
- a bottom may be forming.
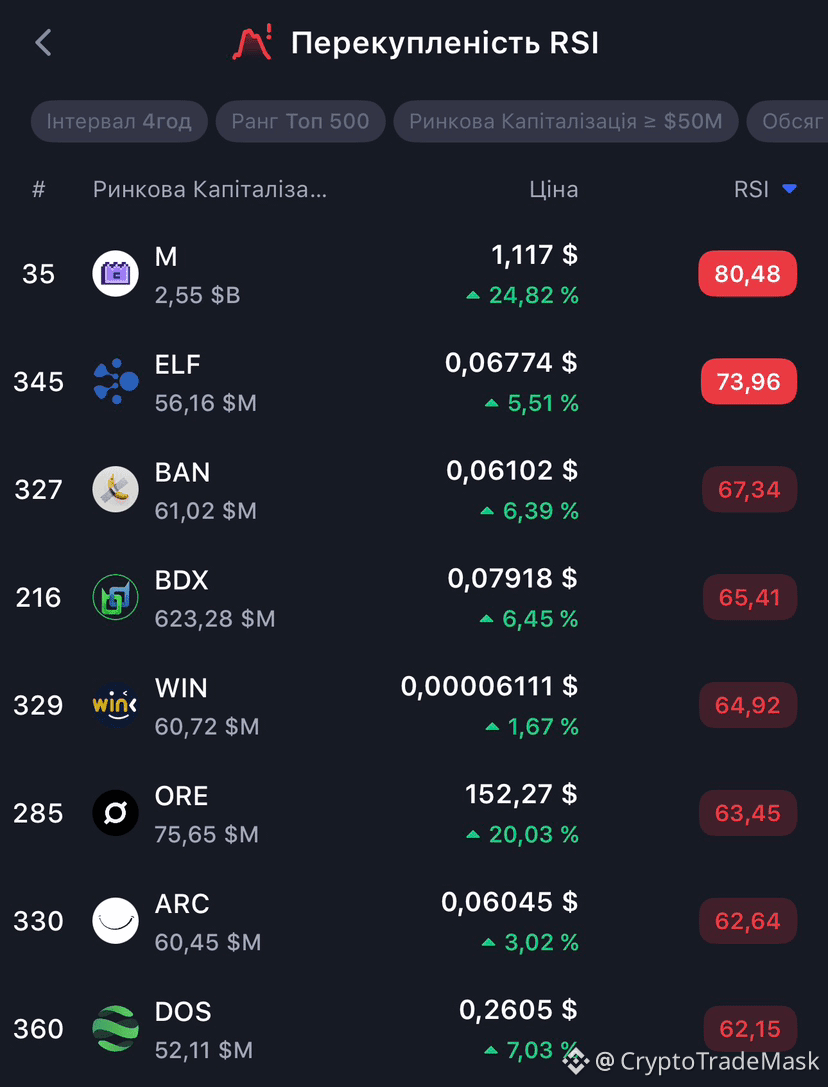
🔴 Overbought
• The price has risen too much.
• RSI > 70.
• A correction or pause after growth is likely - it's time to take profits.
• In this zone now: $ELF - a cooling after a surge is possible.
⚠️ Rule of thumb: no indicator gives guarantees - they are only hints, not a verdict.
{future}(PAXGUSDT)
{future}(RLCUSDT)
{future}(XAUTUSDT)
#Overbought & #oversold
📊 Overbought & Oversold: How does it work? 📈📉
Key market zones that indicate when the price may reverse.
🟢 Oversold
• The price has fallen too low - temporarily or excessively.
• RSI < 30.
• There may be a chance of a rebound - the asset is becoming interesting to buy.
• Many coins are now in this zone: $XAUT ,$RLC
- a bottom may be forming.
🔴 Overbought
• The price has risen too much.
• RSI > 70.
• A correction or pause after growth is likely - it's time to take profits.
• In this zone now: $ELF - a cooling after a surge is possible.
⚠️ Rule of thumb: no indicator gives guarantees - they are only hints, not a verdict.
1
633

·
--
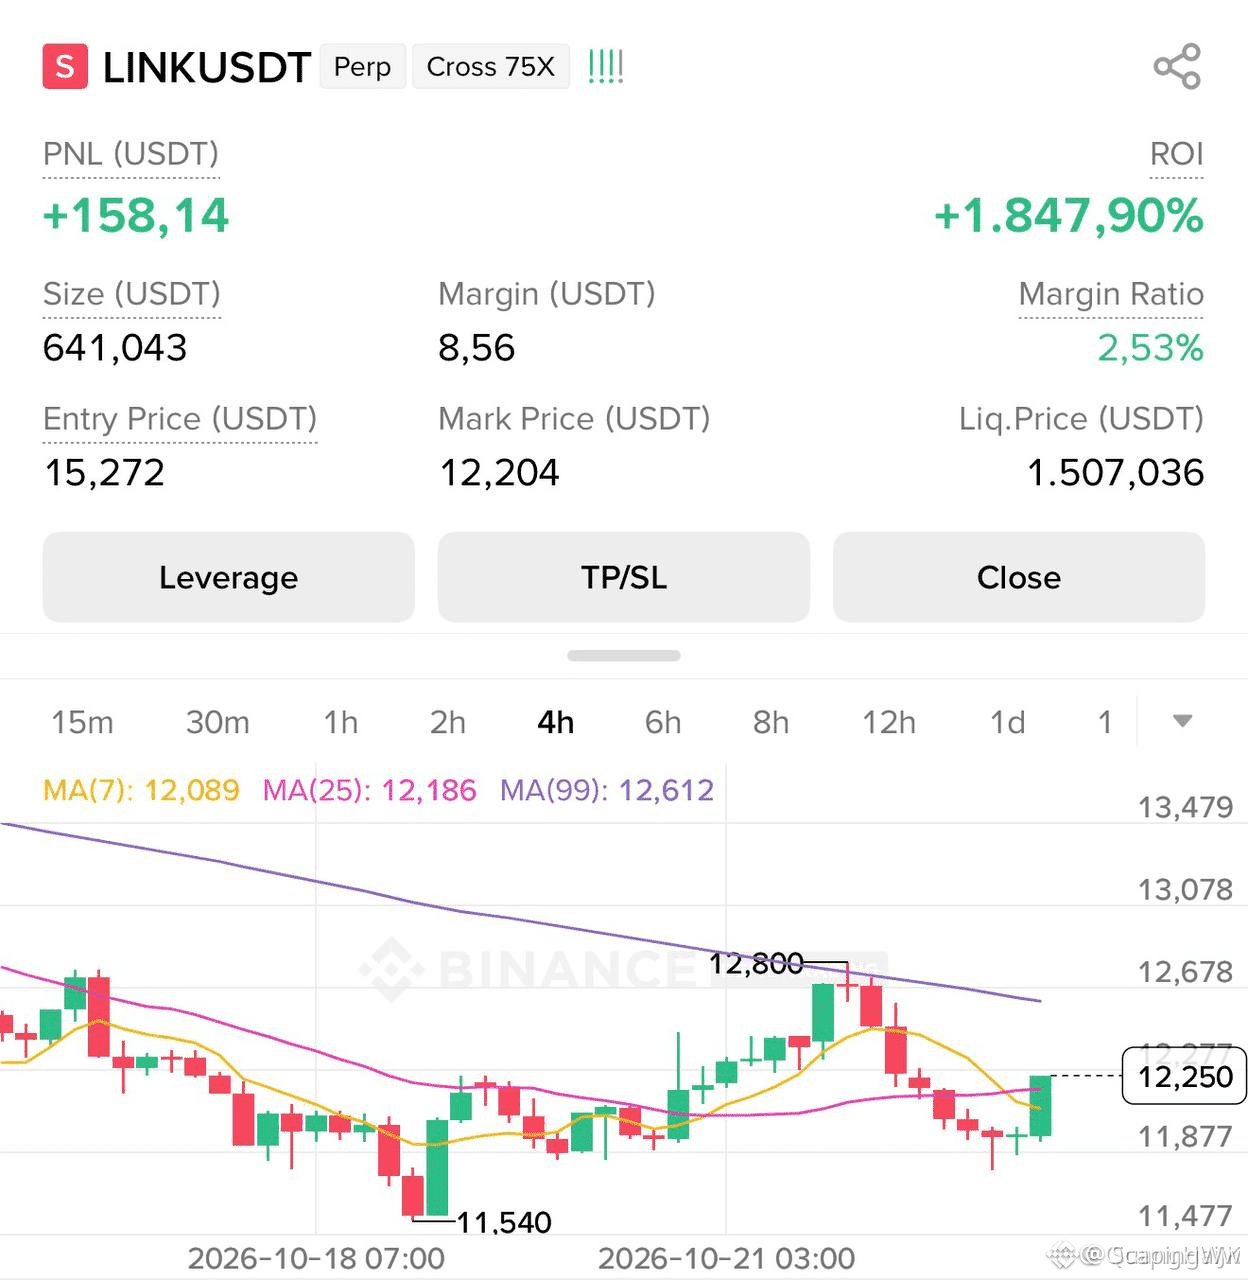
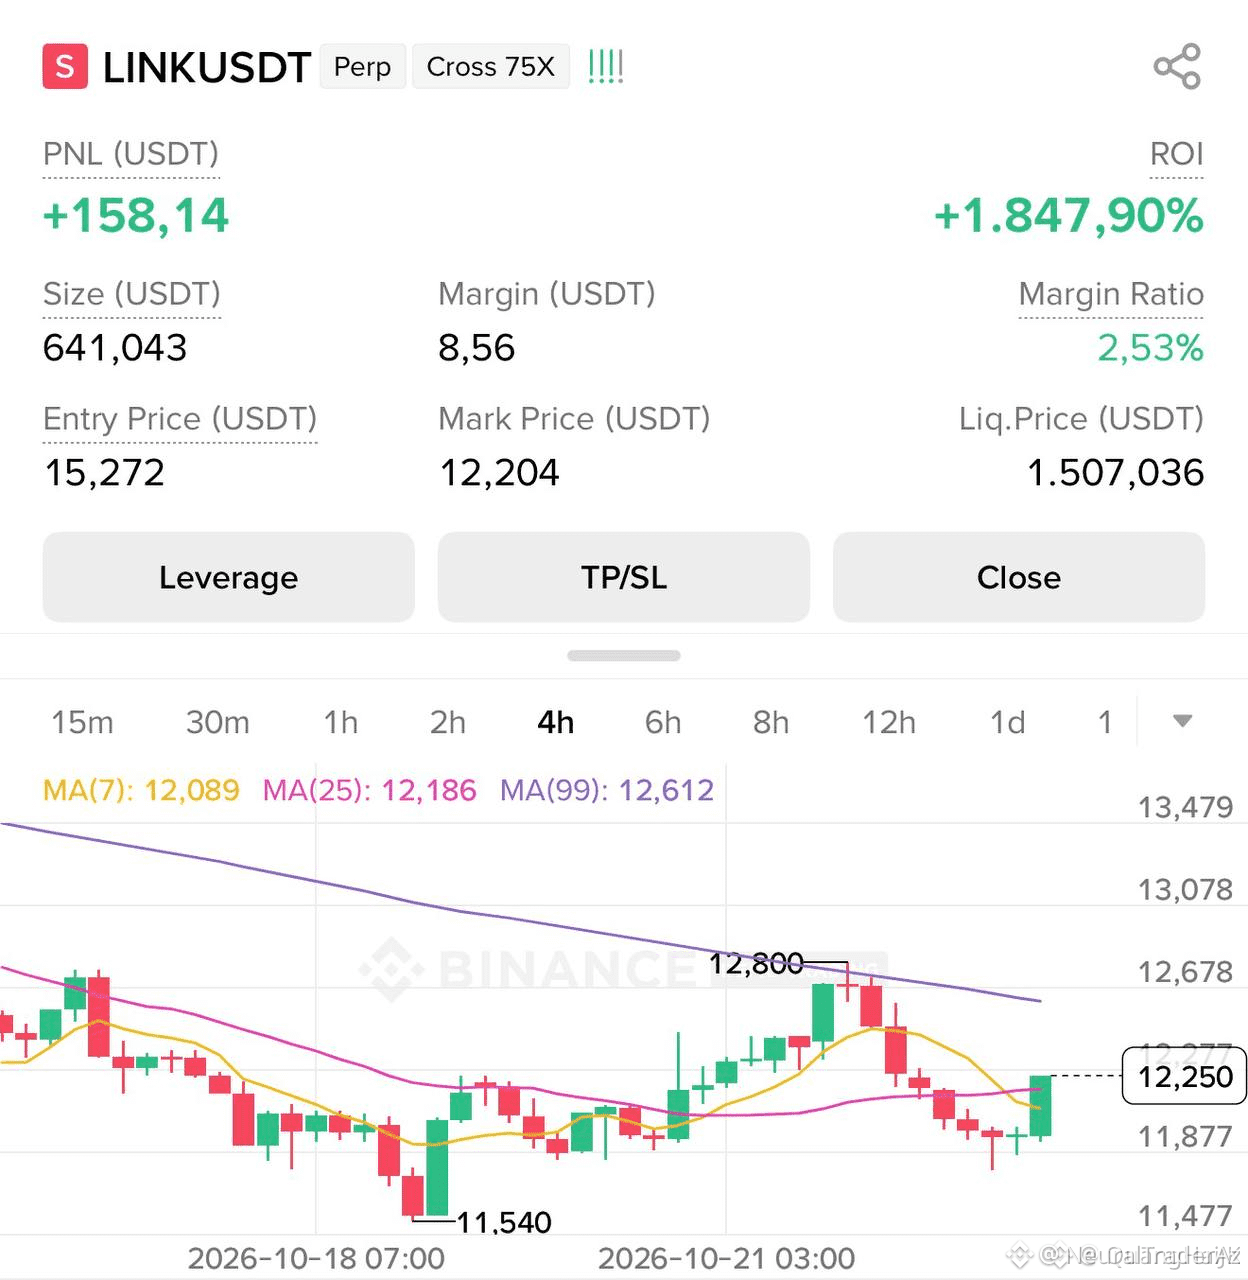
🚨 $LINK CRASH ALERT: SHORT THE OVERBOUGHT SPIKE! 🔴
Entry: 12.8-14.2 ⚡
Target: 11.9 🚀
Target: 10.3 🚀
Target: 9.6 🚀
Stop Loss: 15.6 ⚠️
RSI_6 just blew past 80, and $LINK punched the upper Bollinger Band at $12.19, screaming a classic overbought flare‑up. The momentum engine is revving, but the price is perched on a fragile peak ready to tumble. 📊⚡
Smart money is likely flushing out lingering longs, hunting the next liquidity pool. A clean short from 12.8‑14.2 targets 11.9, 10.3 and 9.6, while the stop sits at 15.6 to guard against a sudden reversal. 🌊💡
💬 Are you positioning your bids for the downside swing?
⚠️ Not financial advice. Always manage your risk. 🛡️
🏷️ #LINK #ShortSetup #Overbought #Crypto
🔥 💎
18

🔴 $LINK SINKS INTO OVERBOUGHT PIT – SHORT ALERT! ⚡
Entry: 12.8-14.2 ⚡
Target: 11.9 🚀
Target: 10.3 🚀
Target: 9.6 🚀
Stop Loss: 15.6 ⚠️
📊 RSI_6 exploded to 80.12 while price tore through the upper Bollinger Band at $12.19, signaling a sharp mean‑reversion pullback. 🔍 The overbought pressure aligns with a classic liquidity sweep, priming smart money to absorb sellers at the 12.8‑14.2 demand zone.
📌 The short range captures the imbalance left by aggressive buying, offering a clean 1:3+ risk‑reward profile as price targets cascade down the next support clusters. 💬 How aggressively are you sizing into this short wave? 👇
⚠️ Not financial advice. Always manage your risk. 🛡️
🏷️ #LINK #ShortSetup #Overbought #Crypto
🦈 🔥
5

·
--
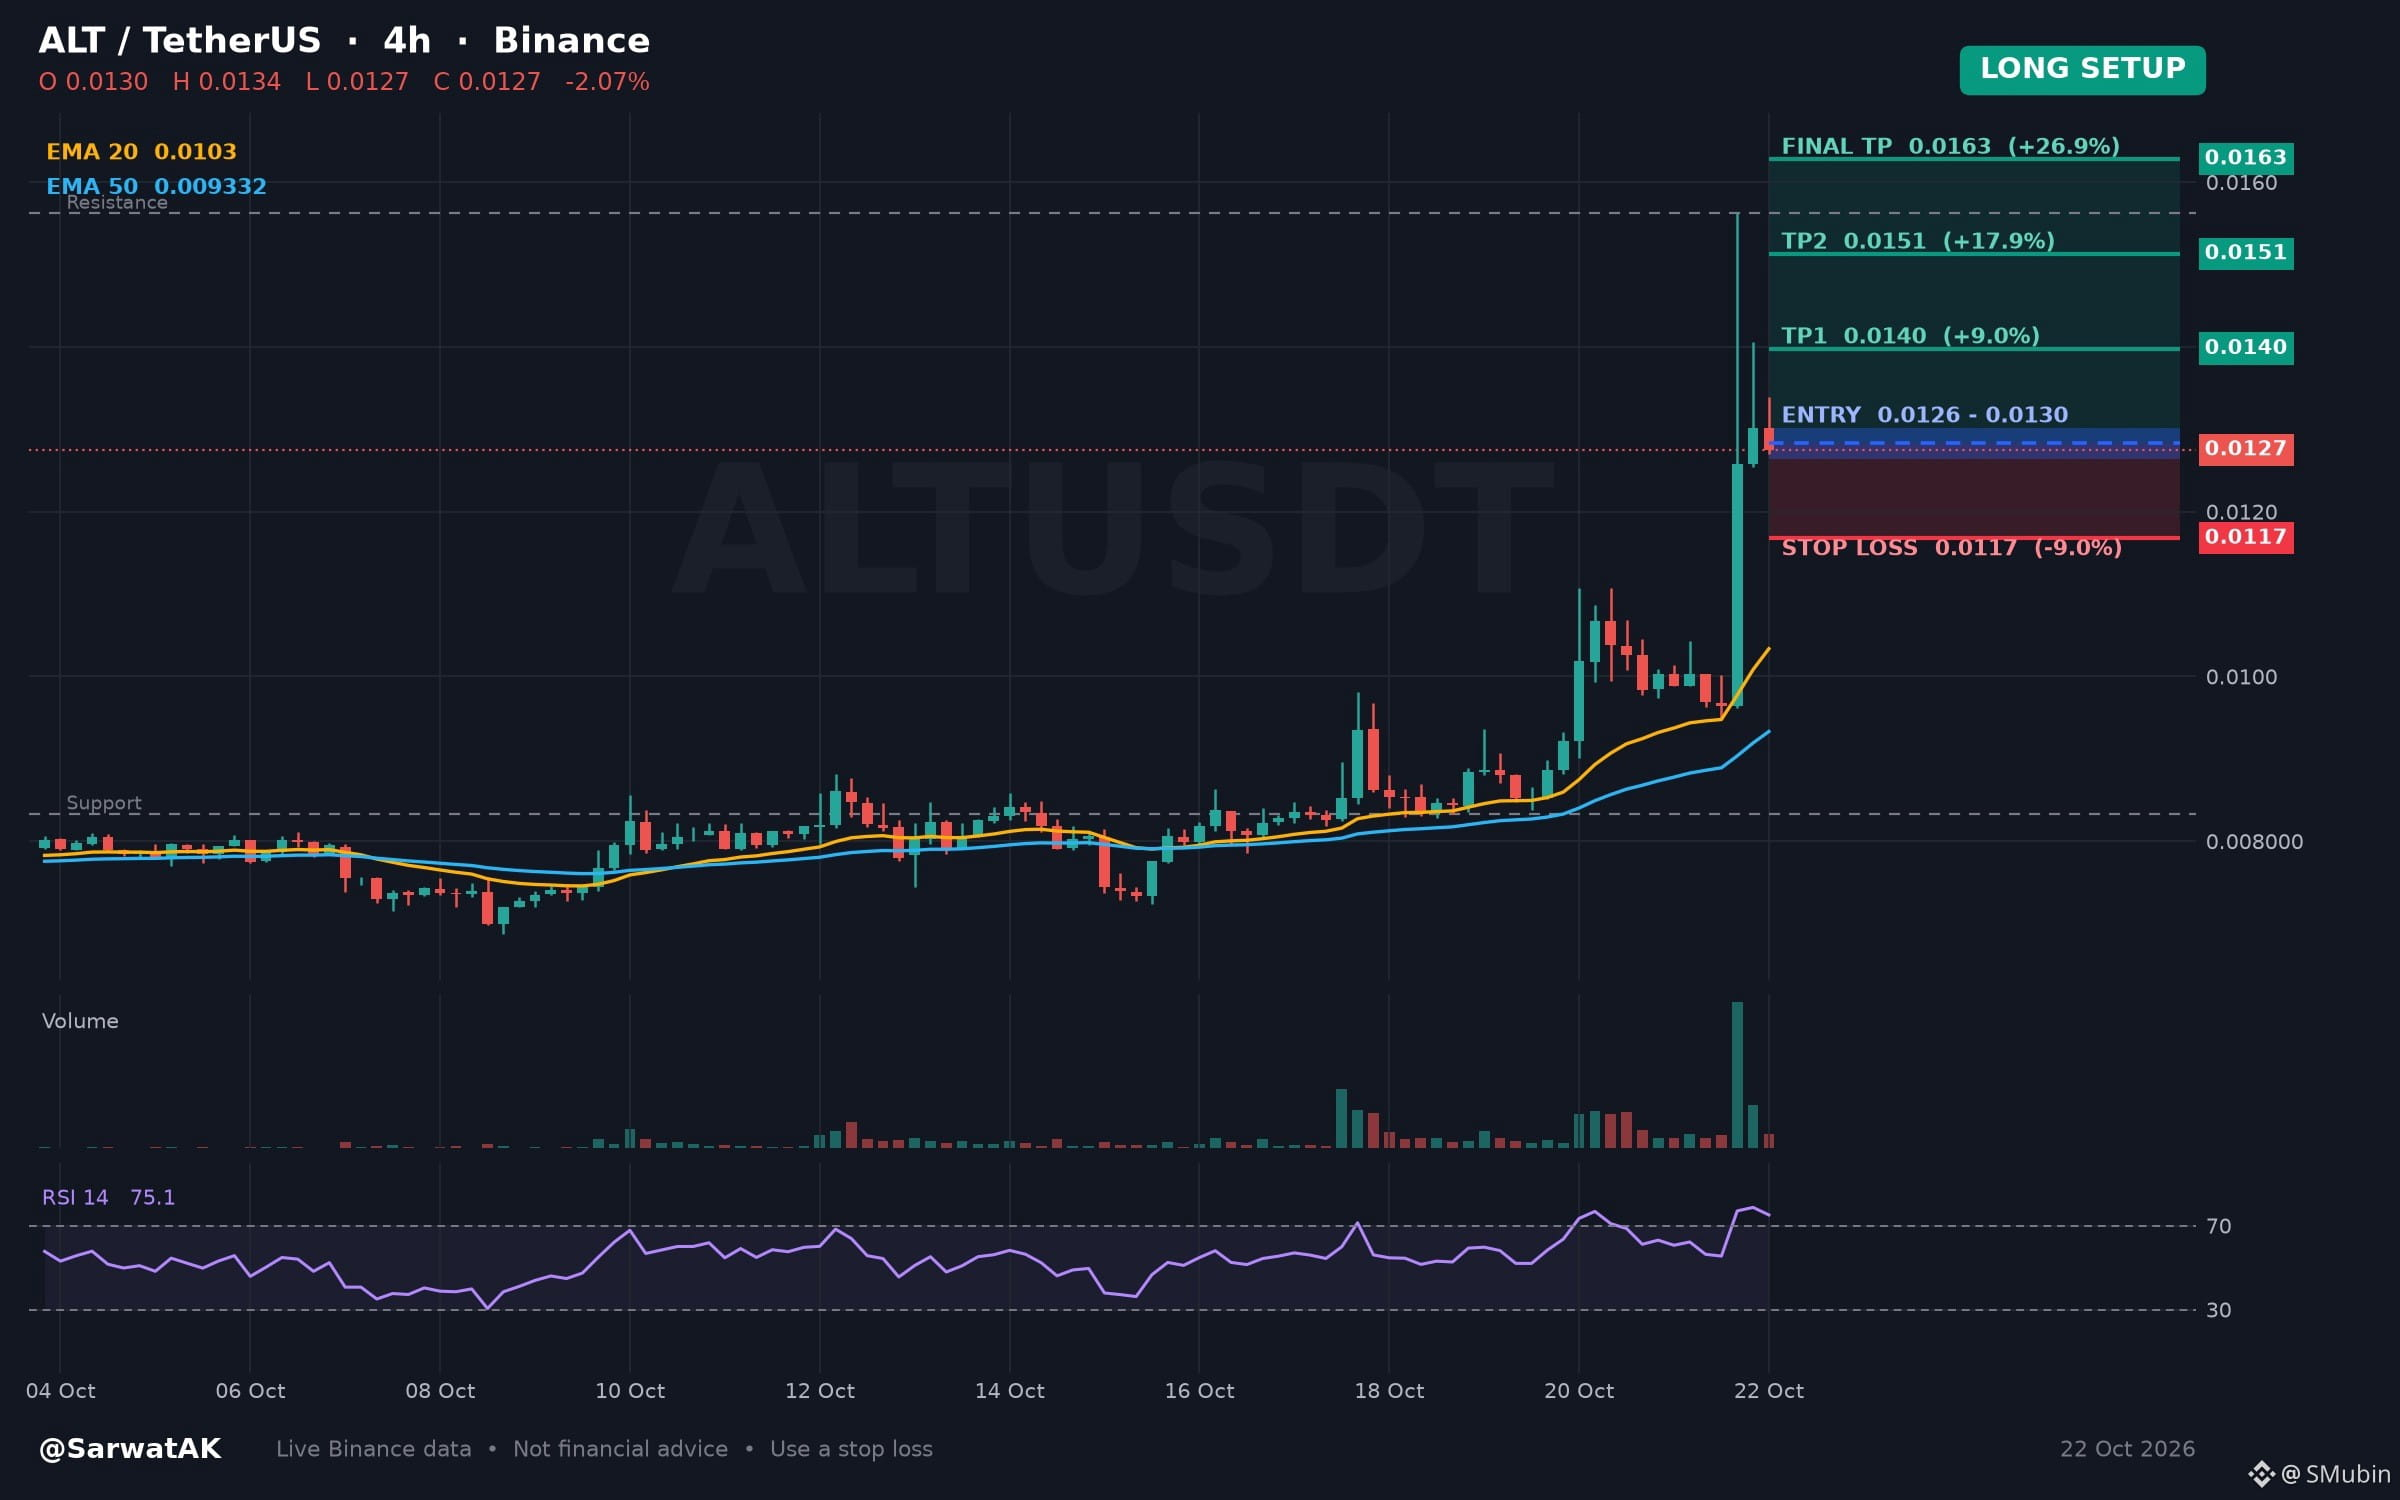
$ALT LONG SETUP ... NEXT TARGET 0.0163
Four-Hour Momentum Enters Overbought Conditions Following Recent Upward Price Movement
Entry: 0.0126 - 0.0130 (Long)
TP1: 0.0140
TP2: 0.0151
Final TP: 0.0163
SL: 0.0117
Upward price action over the past twenty-four hours has driven the four-hour relative strength index into overbought territory. Such conditions typically lead observers to monitor for momentum exhaustion or sustained consolidation.
As long as 0.0126 holds, structure stays constructive
Must use stop loss while trading
Trade $ALT
Not financial advice. Always DYOR.
Like & Follow for Daily Trade Analytics & Insider News. @SarwatAK
#ALT #Overbought #TradingSignals
126
·
--
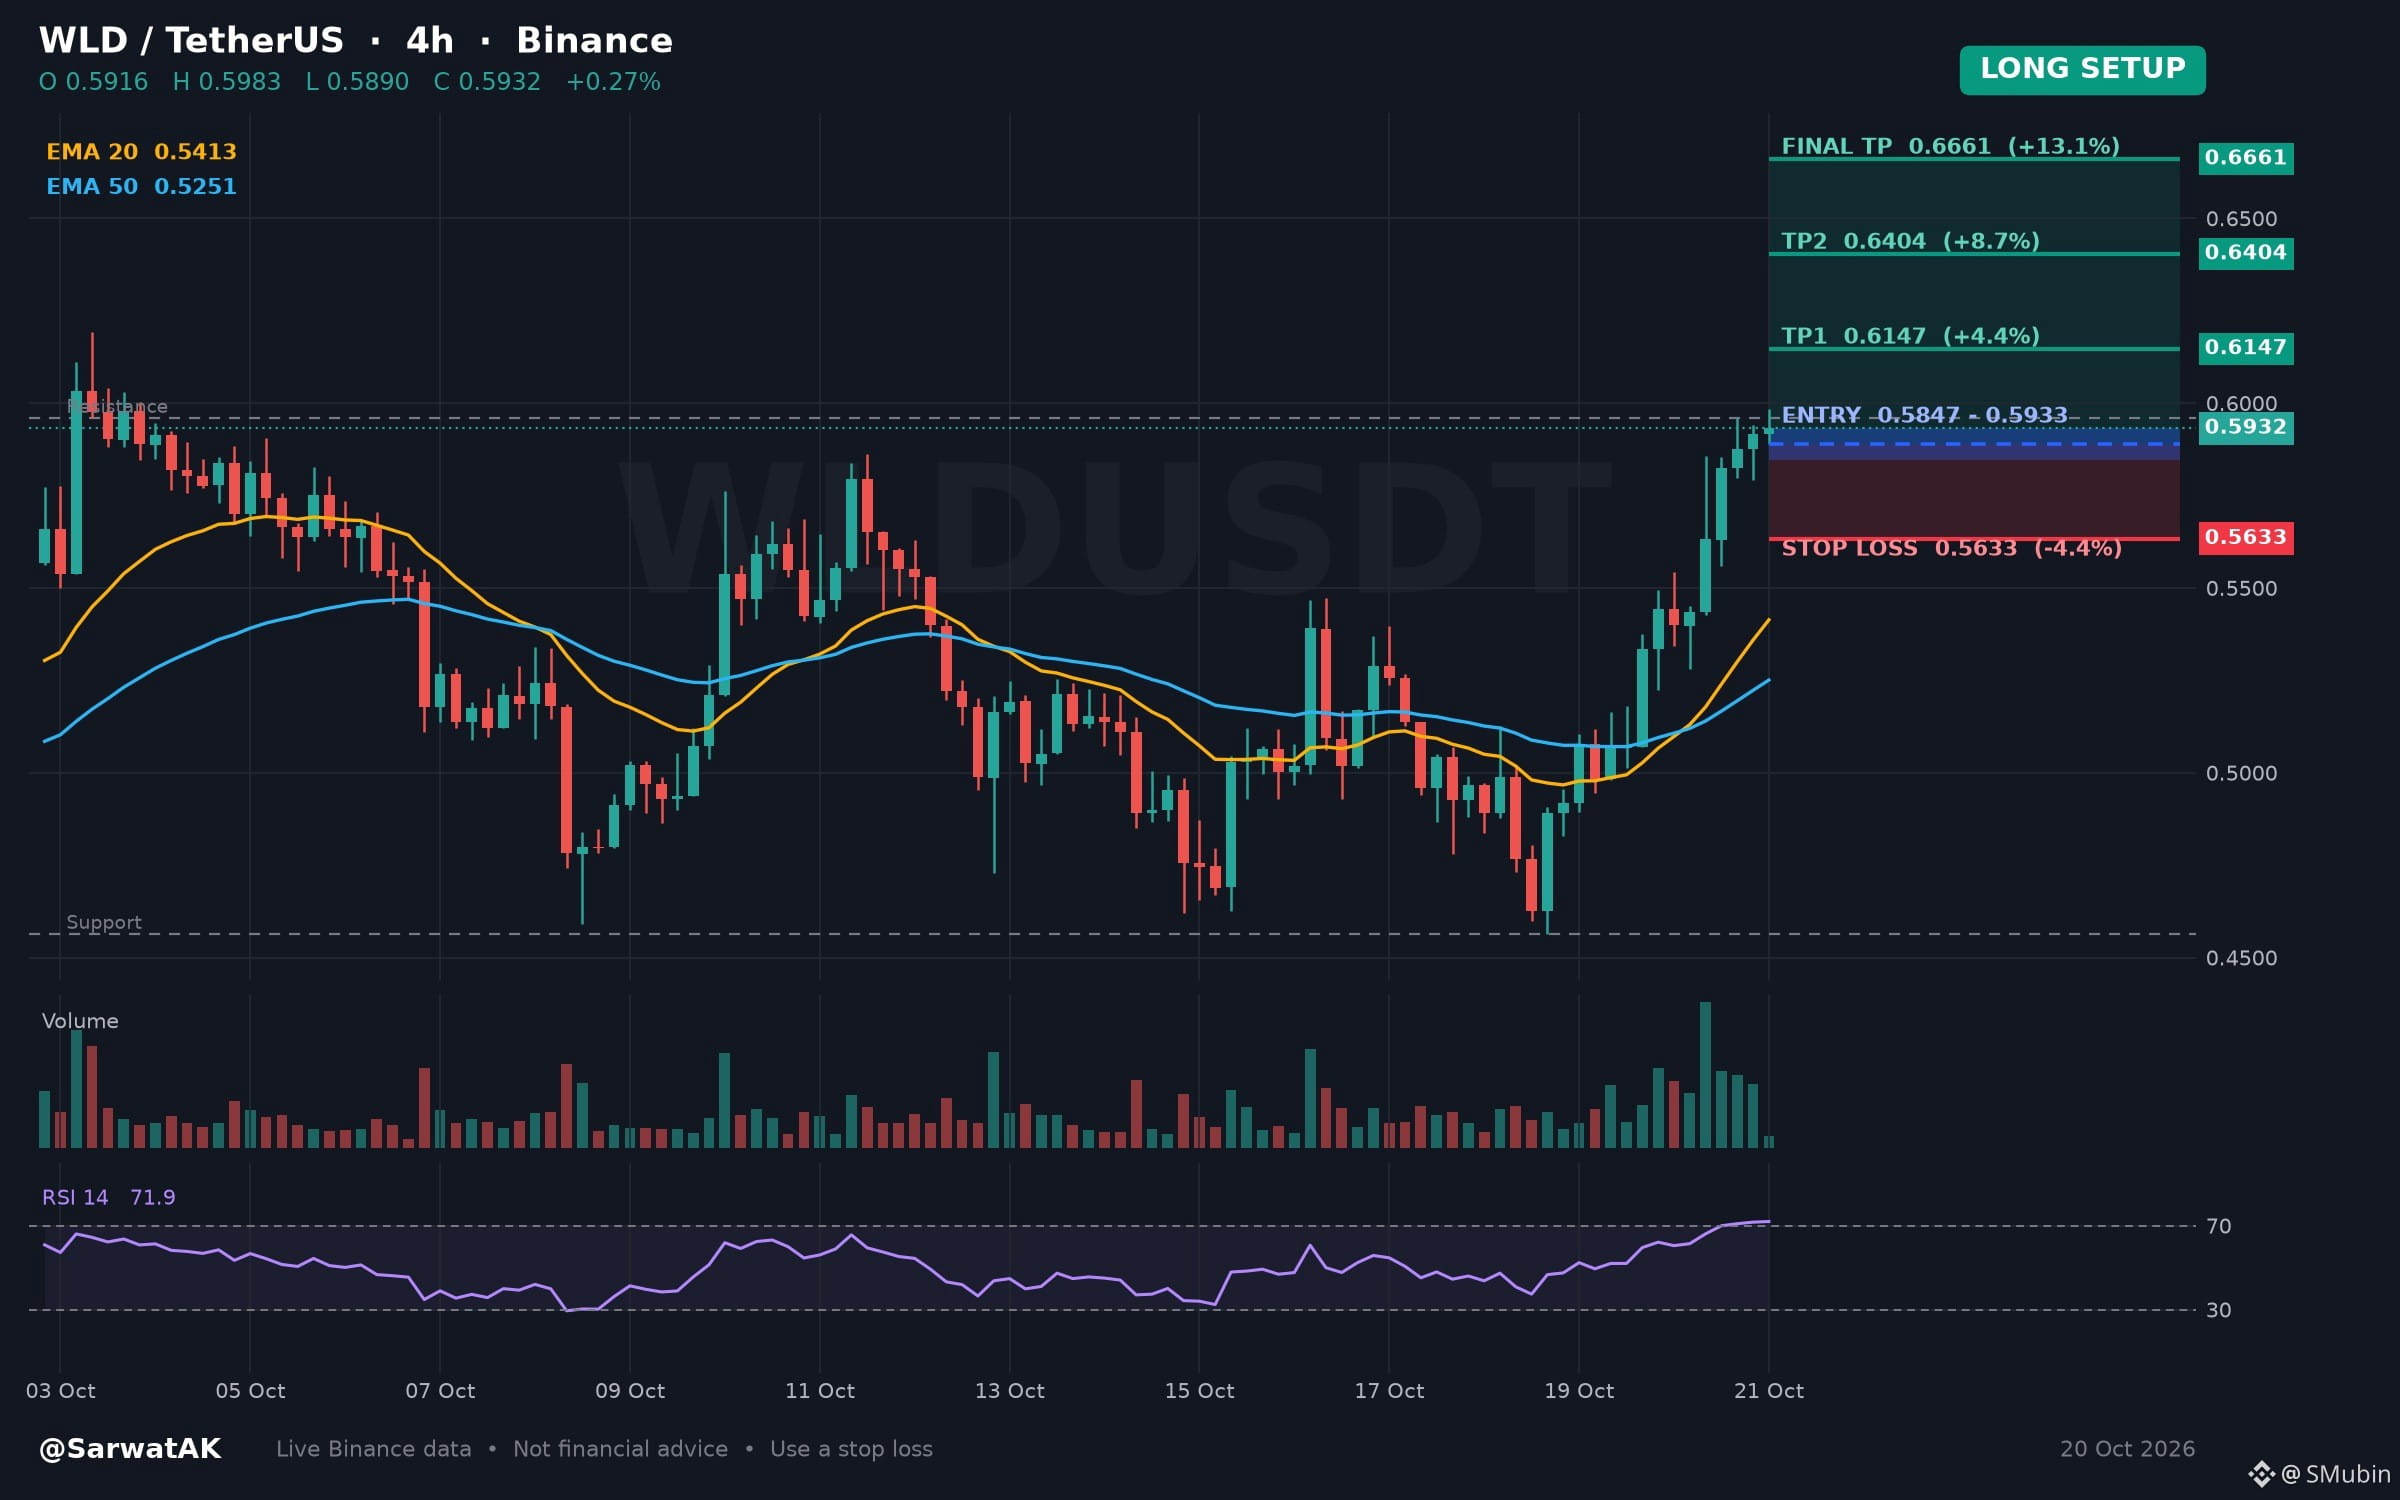
$WLD LONG SETUP ... NEXT TARGET 0.6661
Upward Twenty-Four Hour Movement Meets Overbought Four-Hour Momentum Reading
Entry: 0.5847 - 0.5933 (Long)
TP1: 0.6147
TP2: 0.6404
Final TP: 0.6661
SL: 0.5633
Price has pushed higher over the past twenty-four hours, placing the four-hour relative strength index into overbought territory. This alignment reflects persistent upward strength alongside conditions where momentum often pauses.
As long as 0.5847 holds, structure stays constructive
Must use stop loss while trading
Trade $WLD
Not financial advice. Always DYOR.
Like & Follow for Daily Trade Analytics & Insider News. @SarwatAK
#WLD #Overbought #TrendingTopic
{spot}(WLDUSDT)
$WLD LONG SETUP ... NEXT TARGET 0.6661
Upward Twenty-Four Hour Movement Meets Overbought Four-Hour Momentum Reading
Entry: 0.5847 - 0.5933 (Long)
TP1: 0.6147
TP2: 0.6404
Final TP: 0.6661
SL: 0.5633
Price has pushed higher over the past twenty-four hours, placing the four-hour relative strength index into overbought territory. This alignment reflects persistent upward strength alongside conditions where momentum often pauses.
As long as 0.5847 holds, structure stays constructive
Must use stop loss while trading
Trade $WLD
Not financial advice. Always DYOR.
Like & Follow for Daily Trade Analytics & Insider News. @SarwatAK
#WLD #Overbought #TrendingTopic
159

·
--
🚨 AVA 涨疯了!24H 飙升 34%,成交量放大至 36.7 倍!
但真正奇怪的是:1H 还涨 8.6%,5M 已回落 2.3%,OI 反而下降 4.0%;散户多空情绪达到 9.4×,讨论区几乎一边倒看多。
📊 这意味着什么?所有人都在喊突破,但 24H 已经涨了 34%。现在追进去,可能不是错过行情,而是接住最后一棒。看对方向,却未必赚得到钱。
🎯 关键位置:
压力:$0.3764 / $0.4106
观察支撑:$0.323 / $0.2988
放量站稳前高,趋势才算继续确认。
我的看法:趋势仍偏多,但绝不盲目追高!站稳 $0.3764 才看更高;冲高失败并跌破 $0.323,警惕多头踩踏,数据待核验。
你觉得 AVA 下一步冲 $0.4106,还是先回踩 $0.2988?👇
#AVA #overbought-risk
10

🔴 $BTC APPROACHING A TOP, OVERBOUGHT AND PRIMED FOR SELL‑OFF ⚡
Target: 84,000 🚀
📊 The 4‑hour RSI is screaming overbought, a classic warning flag as buyers wrestle for the last inch of demand. 🦈 Smart money is already unloading, leaving a thin liquidity cushion that could collapse under the next wave of sell pressure. 📉 A breach below the 84k zone would flip the narrative into a bearish cascade, echoing the last liquidity sweep we saw in March.
💬 Are you ready to ride the downside or waiting for the next reversal? 👇
⚠️ Not financial advice. Always manage your risk. 🛡️
🏷️ #BTC #ShortSetup #Overbought #Crypto
🐻 🔥
14
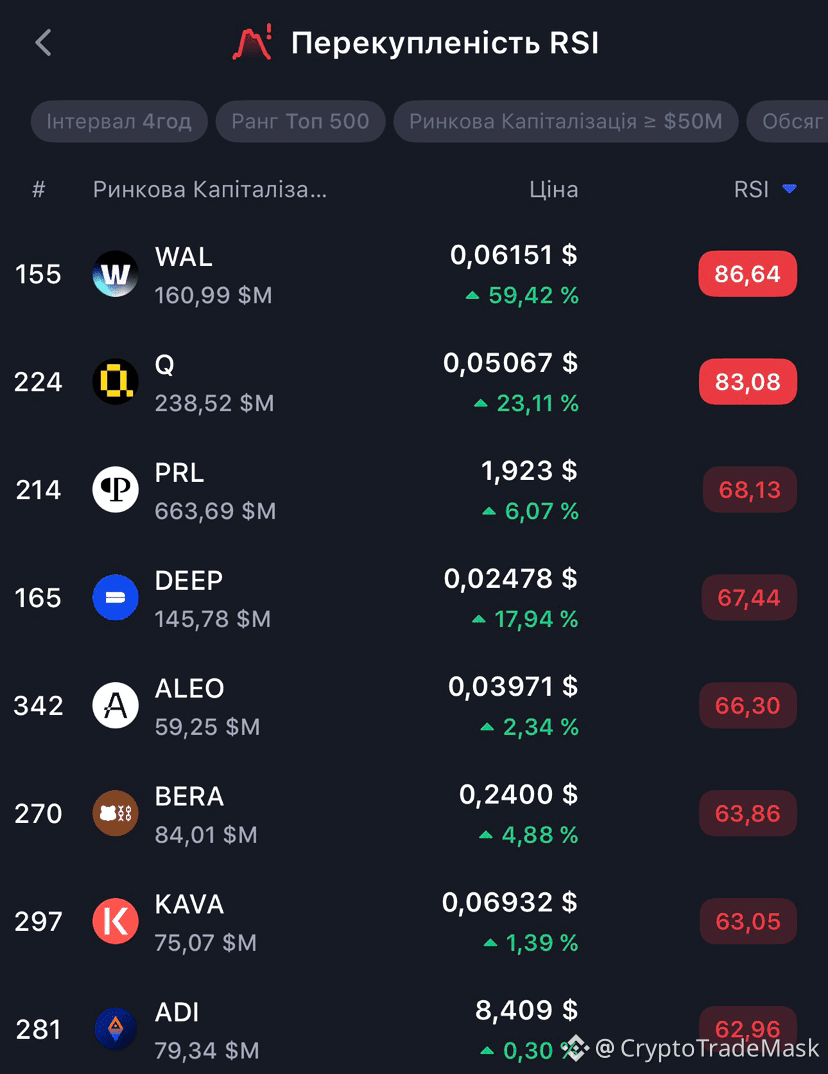
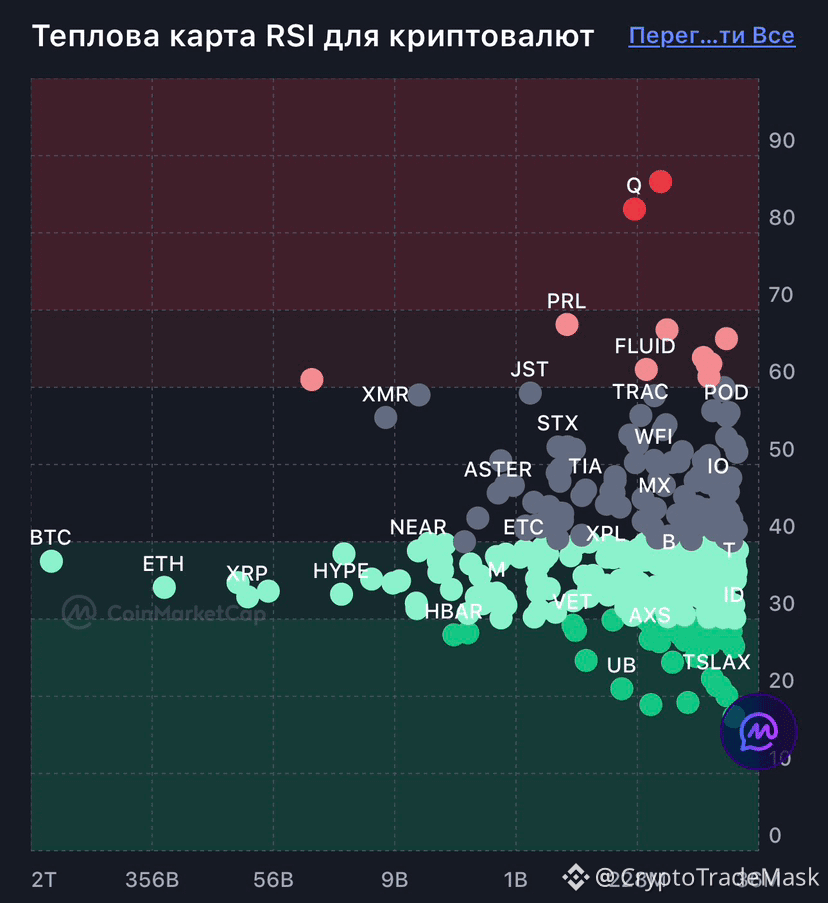
#Overbought & #oversold
📊 Overbought & Oversold: How does it work? 📈📉
Key market zones that indicate when the price may reverse.
🟢 Oversold
• The price has fallen too low - temporarily or excessively.
• RSI < 30.
• There may be a chance of a rebound - the asset is becoming interesting to buy.
• Many coins are now in this zone: $MUBARAK , $SPCXB - a bottom may be forming.
🔴 Overbought
• The price has risen too much.
• RSI > 70.
• A correction or pause after growth is likely - it's time to take profits.
• In this zone now: $WAL - a cooling after a surge is possible.
⚠️ Rule of thumb: no indicator gives guarantees - they are only hints, not a verdict.
{spot}(SPCXBUSDT)
{future}(WALUSDT)
{future}(MUBARAKUSDT)
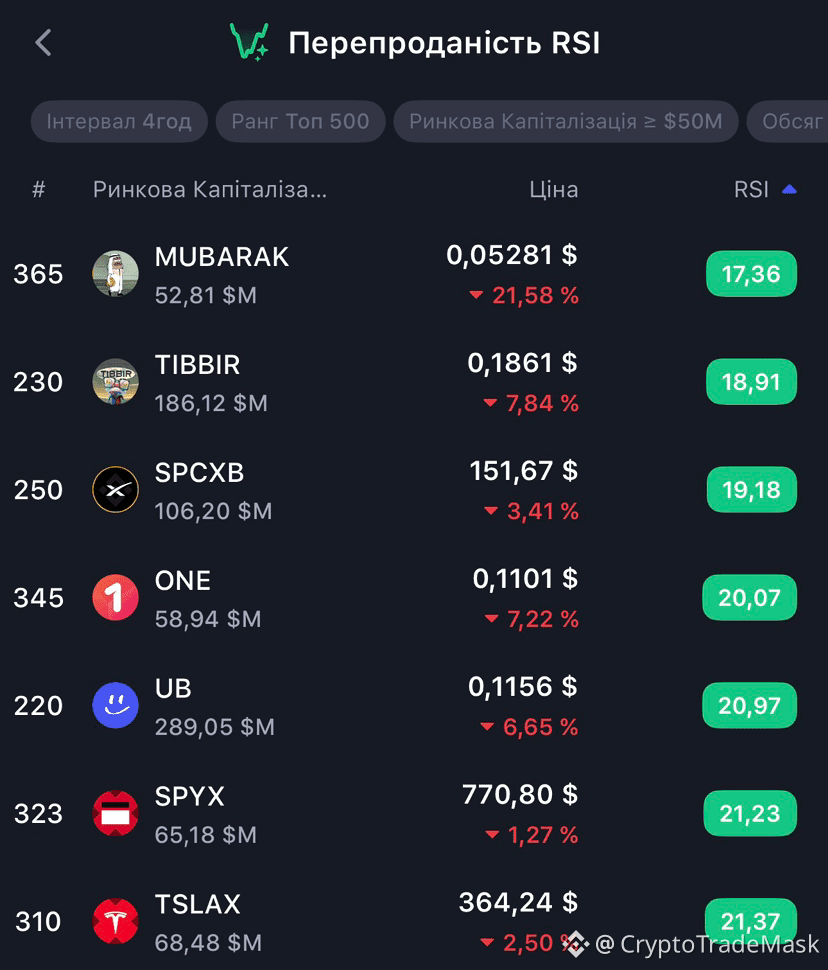
#Overbought & #oversold
📊 Overbought & Oversold: How does it work? 📈📉
Key market zones that indicate when the price may reverse.
🟢 Oversold
• The price has fallen too low - temporarily or excessively.
• RSI < 30.
• There may be a chance of a rebound - the asset is becoming interesting to buy.
• Many coins are now in this zone: $MUBARAK , $SPCXB - a bottom may be forming.
🔴 Overbought
• The price has risen too much.
• RSI > 70.
• A correction or pause after growth is likely - it's time to take profits.
• In this zone now: $WAL - a cooling after a surge is possible.
⚠️ Rule of thumb: no indicator gives guarantees - they are only hints, not a verdict.
1
62
·
--
🚨 S 24H 涨疯了!涨幅达到 23.1%,1H 继续冲高 11.6%!
但真正奇怪的是:OI 一边显示 +1.0%,讨论区却给出 +14.67%;1H 放量数据也出现 8.5×与 3.7×两种说法,数据待核验。散户看多情绪已到 2.9×。
📊 这意味着什么?突破 $0.06 后,大家都在喊多,最怕的不是看错方向,而是害怕踏空、追在高位,最后成为接盘者。日线 RSI 76.9 超买,坑确实在这里。
🎯 关键位置:
压力:$0.064 / $0.067 / $0.070–0.080
支撑:$0.060–0.062 / $0.059
放量站稳 $0.06,趋势才算继续有效。
我的看法:趋势偏多,但绝不盲目追高!站稳 $0.06看延续,跌破 $0.059则警惕多头踩踏。
你觉得 S 下一步冲 $0.067,还是先回踩 $0.059?👇
#S #breakout #overbought
27
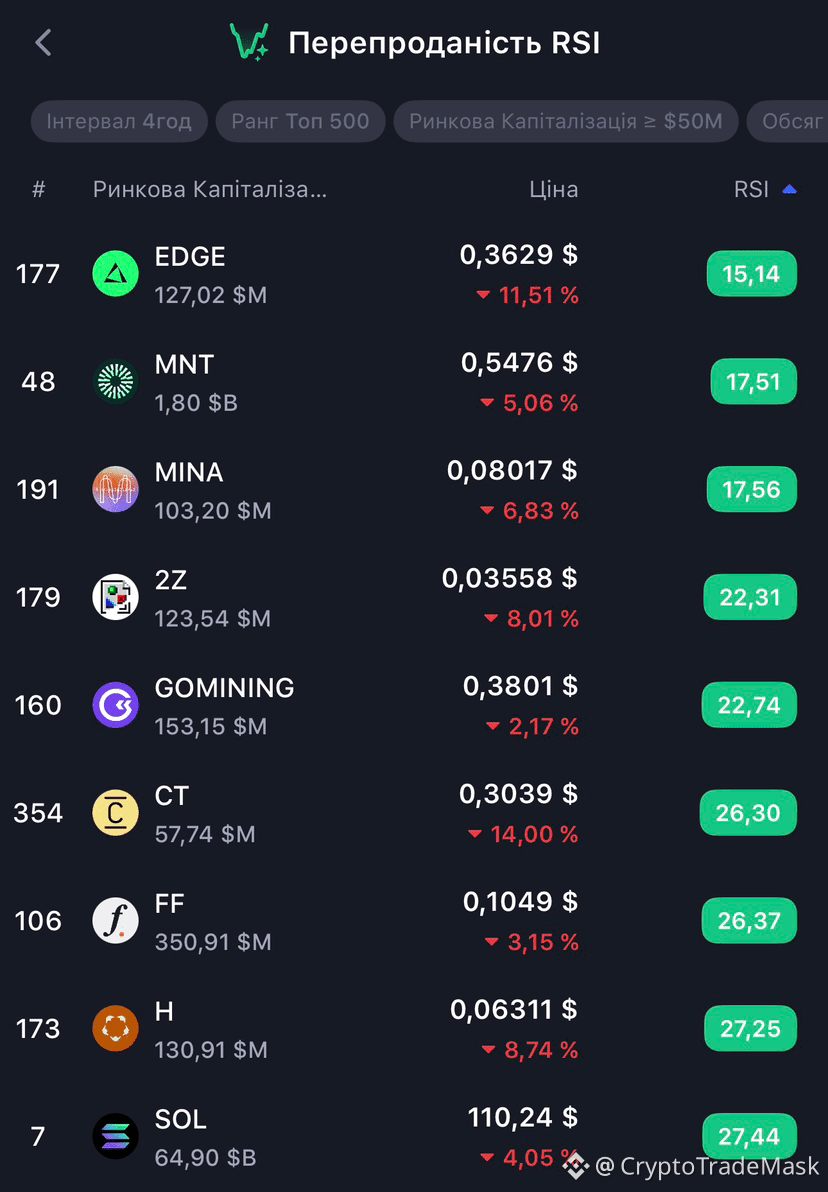
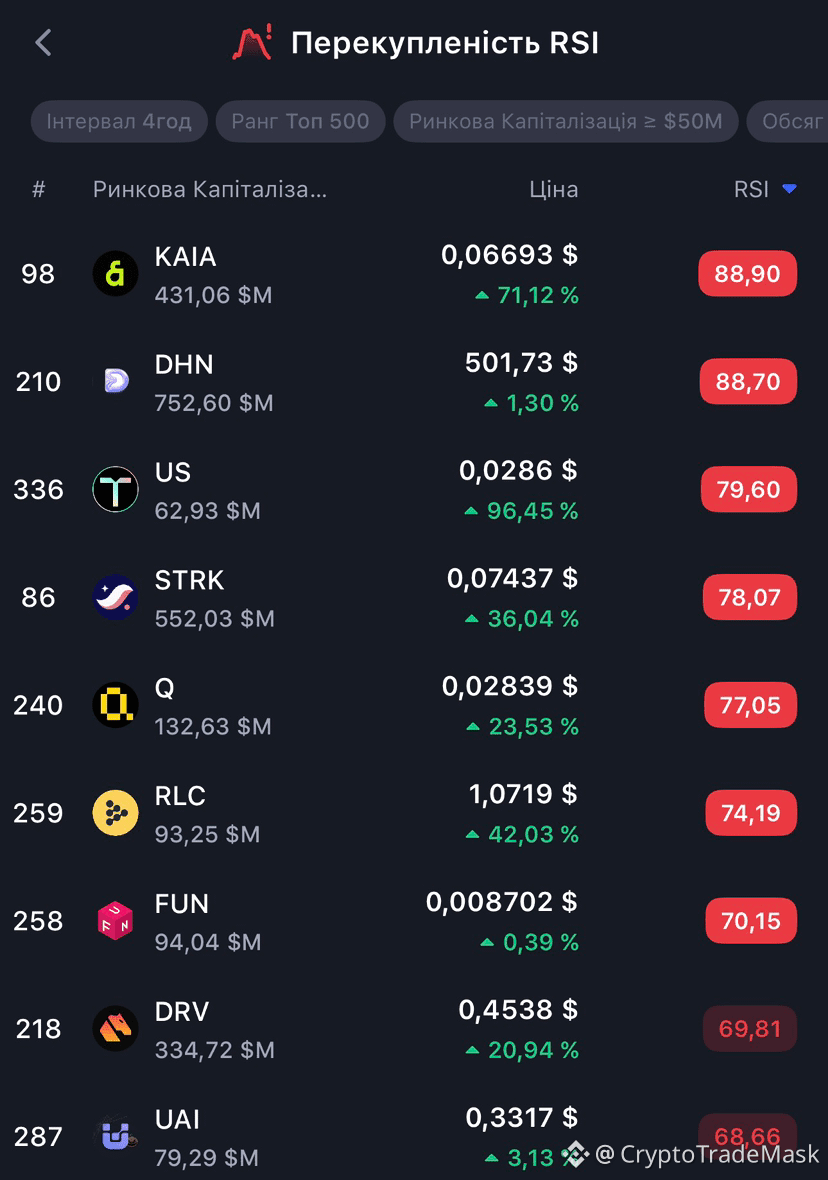
#Overbought & #oversold
📊 Overbought & Oversold: How does it work? 📈📉
Key market zones that indicate when the price may reverse.
🟢 Oversold
• The price has fallen too low - temporarily or excessively.
• RSI < 30.
• There may be a chance of a rebound - the asset is becoming interesting to buy.
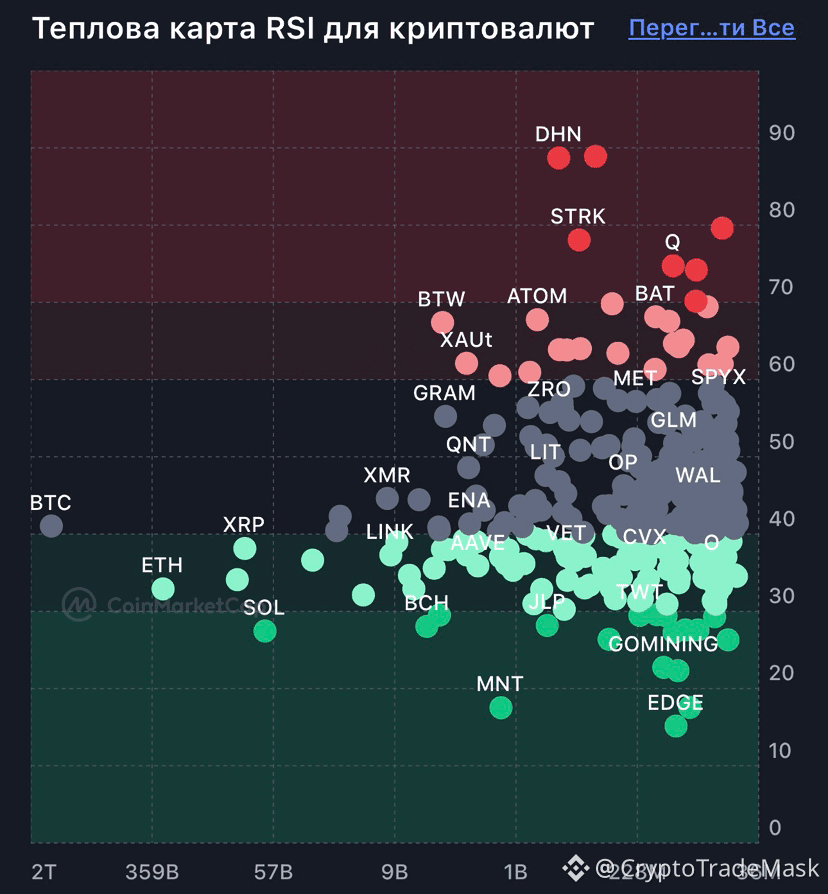
• Many coins are now in this zone: $EDGE - a bottom may be forming.
🔴 Overbought
• The price has risen too much.
• RSI > 70.
• A correction or pause after growth is likely - it's time to take profits.
• In this zone now: $KAIA , $STRK - a cooling after a surge is possible.
⚠️ Rule of thumb: no indicator gives guarantees - they are only hints, not a verdict.
{future}(STRKUSDT)
{future}(KAIAUSDT)
{future}(EDGEUSDT)
#Overbought & #oversold
📊 Overbought & Oversold: How does it work? 📈📉
Key market zones that indicate when the price may reverse.
🟢 Oversold
• The price has fallen too low - temporarily or excessively.
• RSI < 30.
• There may be a chance of a rebound - the asset is becoming interesting to buy.
• Many coins are now in this zone: $EDGE - a bottom may be forming.
🔴 Overbought
• The price has risen too much.
• RSI > 70.
• A correction or pause after growth is likely - it's time to take profits.
• In this zone now: $KAIA , $STRK - a cooling after a surge is possible.
⚠️ Rule of thumb: no indicator gives guarantees - they are only hints, not a verdict.
147
#Overbought & #oversold
📊 Overbought & Oversold: How does it work? 📈📉
Key market zones that indicate when the price may reverse.
🟢 Oversold
• The price has fallen too low - temporarily or excessively.
• RSI < 30.
• There may be a chance of a rebound - the asset is becoming interesting to buy.
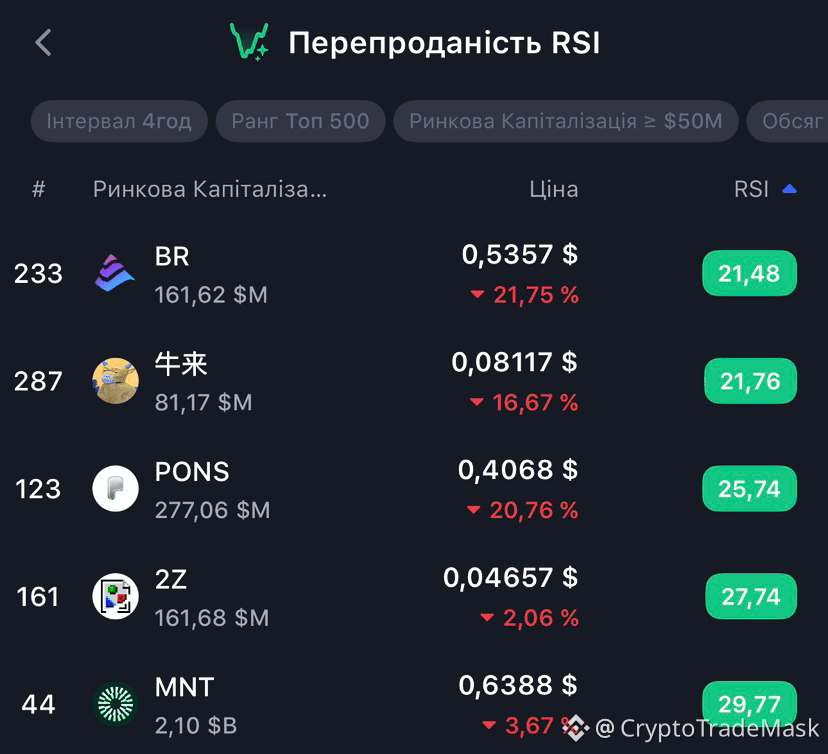
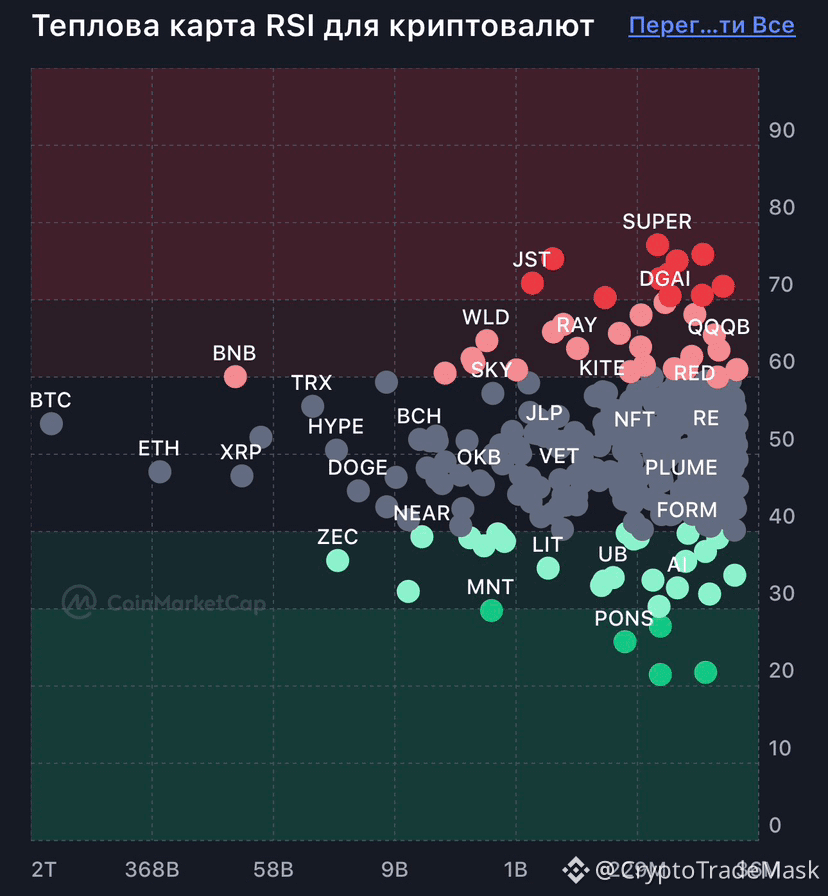
• Many coins are now in this zone: $BR - a bottom may be forming.
🔴 Overbought
• The price has risen too much.
• RSI > 70.
• A correction or pause after growth is likely - it's time to take profits.
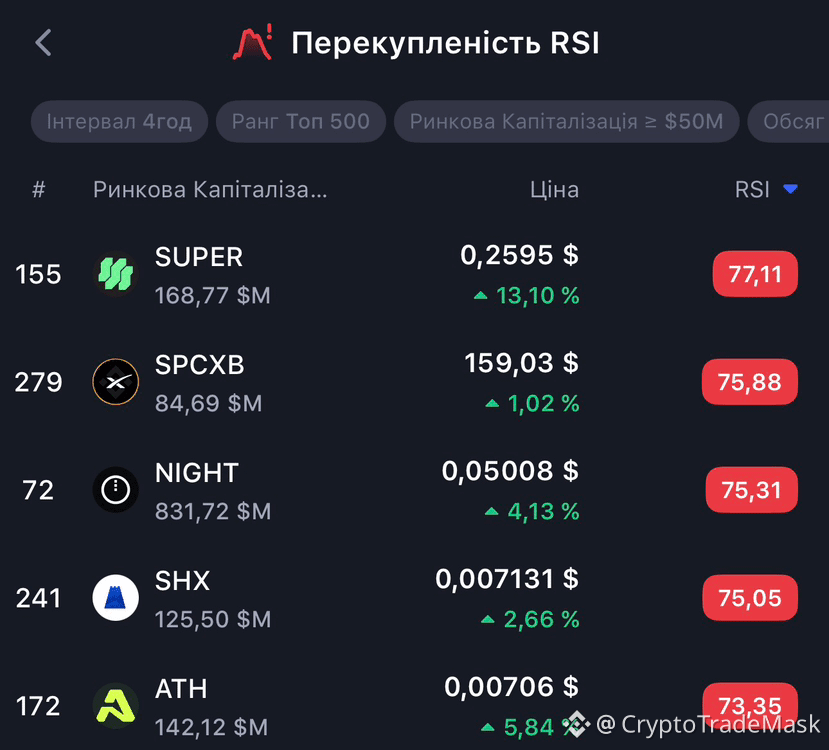
• In this zone now: $SPCXB , $SUPER - a cooling after a surge is possible.
⚠️ Rule of thumb: no indicator gives guarantees - they are only hints, not a verdict.
{future}(NIGHTUSDT)
{future}(SUPERUSDT)
{future}(BRUSDT)
#Overbought & #oversold
📊 Overbought & Oversold: How does it work? 📈📉
Key market zones that indicate when the price may reverse.
🟢 Oversold
• The price has fallen too low - temporarily or excessively.
• RSI < 30.
• There may be a chance of a rebound - the asset is becoming interesting to buy.
• Many coins are now in this zone: $BR - a bottom may be forming.
🔴 Overbought
• The price has risen too much.
• RSI > 70.
• A correction or pause after growth is likely - it's time to take profits.
• In this zone now: $SPCXB , $SUPER - a cooling after a surge is possible.
⚠️ Rule of thumb: no indicator gives guarantees - they are only hints, not a verdict.
98

·
--
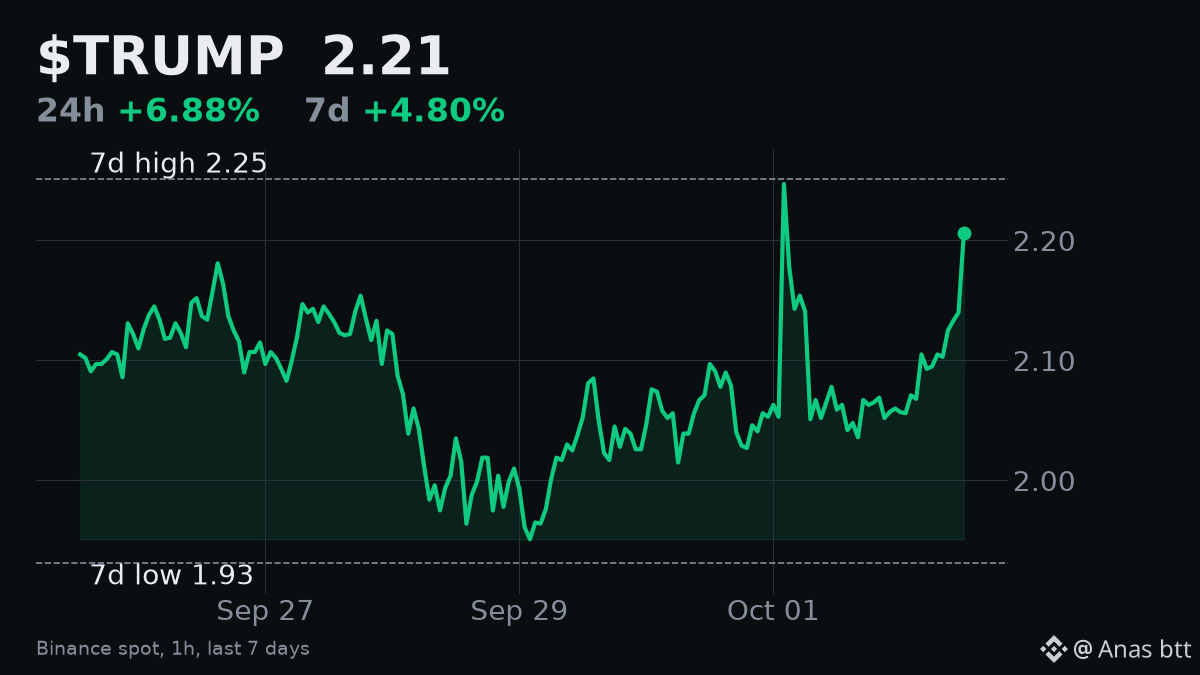
$TRUMP is up 6.9% today, and fewer people traded it than on an average day. That gap is the whole story for me.
Price is 2.205, about 2% under the 7-day high of 2.251. Volume was about 20.7M USDT, only 0.93 times its 7-day average. A rise on thinner trading usually means sellers stepped aside, not that buyers rushed in.
Hourly RSI is 75.1, the hottest reading in my recent coin checks. Add $BTC up 3.2% on the day, and a lot of this move looks like the market lifting everything, not demand for TRUMP itself. On the week it is only up 4.8%.
My view: no trade. Low volume plus an overbought RSI right under a range high is a weak setup to buy into.
What would change my mind: a break above 2.251 with volume clearly above average. If it slips back under 2.10, today's gain was just the market tide.
Watching: whether volume shows up on the next push, or the move fades with BTC.
#TRUMP #Overbought
1
376
·
--
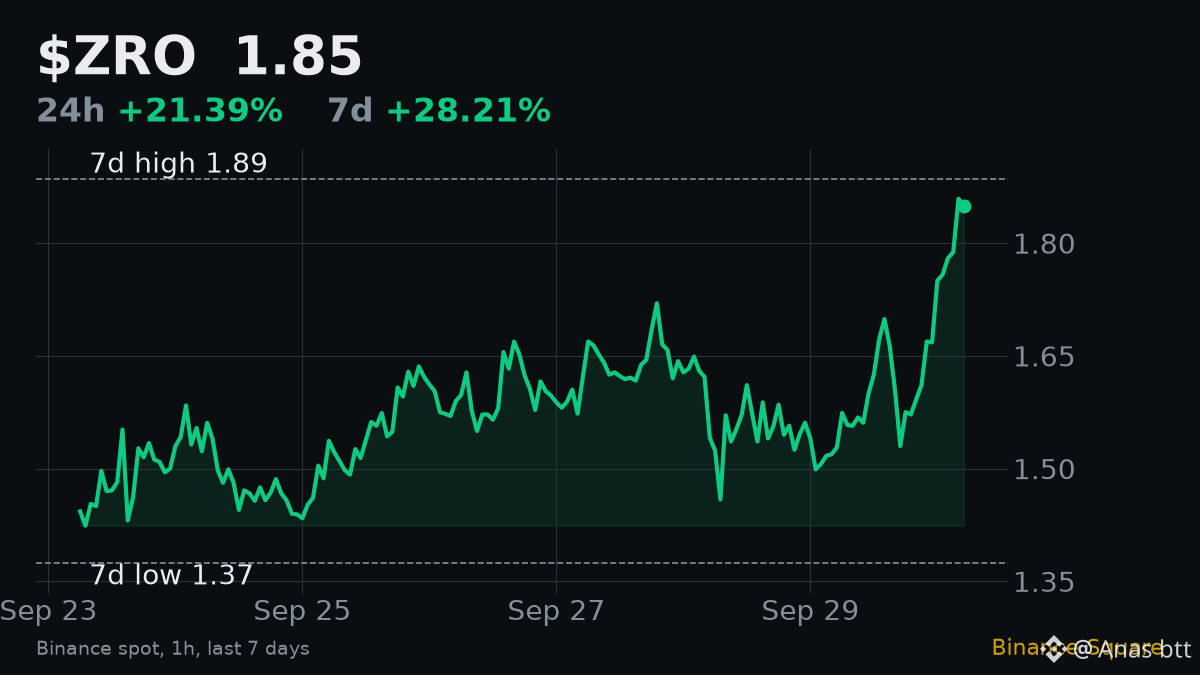
$ZRO is pressing its 7-day high with less fuel than the chart suggests.
The price side is loud. ZRO is at 1.85, up 21.4% on the day and 28.2% on the week, only 1.9% under the 7-day high of 1.885.
The volume side is quiet. 24h turnover is about 22.6M USDT, just 1.33 times its 7-day average. For a 21% day, that is a small step up in participation.
And momentum is already stretched. Hourly RSI is 73.1, above the usual overbought line. $BTC moved only 0.33%, so there is no market wave to carry ZRO through resistance either.
Breakouts on weak volume usually fail. That is the rule I lean on here.
My view: skeptical of this push. No trade yet.
I change my mind if price holds above 1.885 with volume at 2x its average or more.
A drop back below about 1.52, where the day started, would confirm the move was thin and is unwinding.
Next I watch the first test of 1.885. A rejection there on flat volume is the setup I expect.
#ZRO #Overbought
1
69
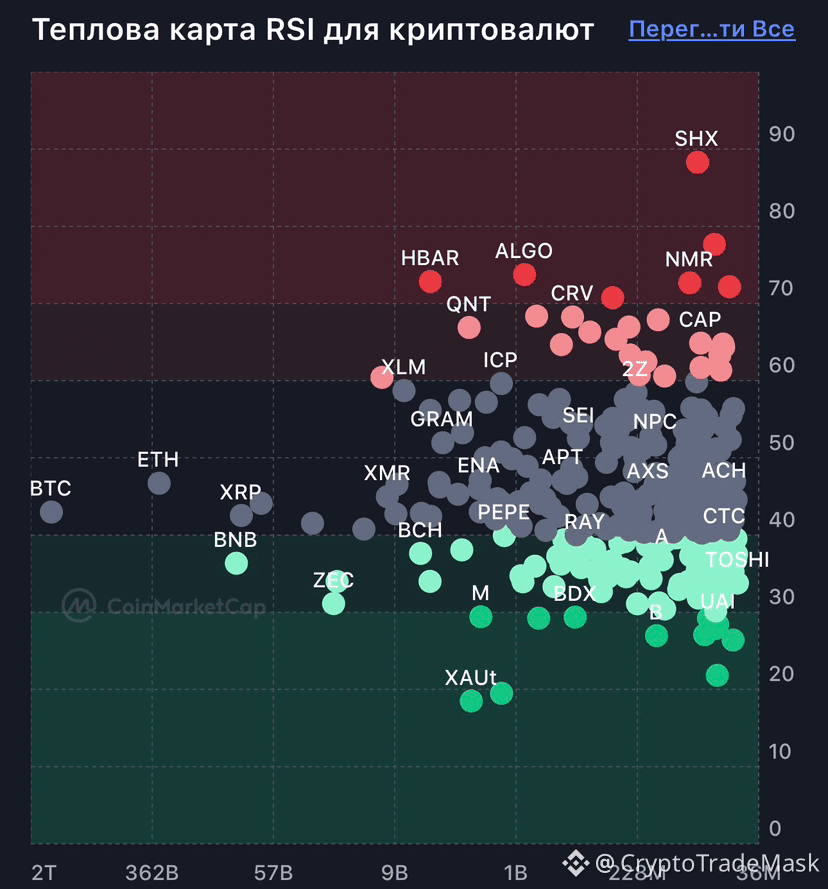
#Overbought & #oversold
📊 Overbought & Oversold: How does it work? 📈📉
Key market zones that indicate when the price may reverse.
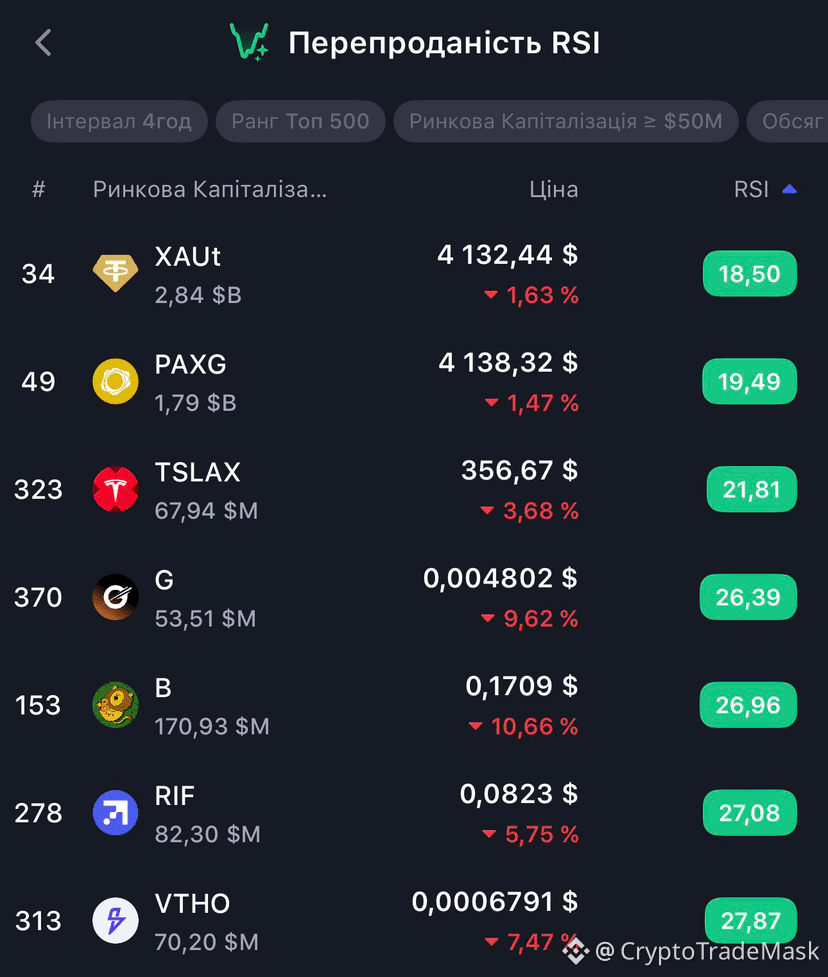
🟢 Oversold
• The price has fallen too low - temporarily or excessively.
• RSI < 30.
• There may be a chance of a rebound - the asset is becoming interesting to buy.
• Many coins are now in this zone: $G - a bottom may be forming.
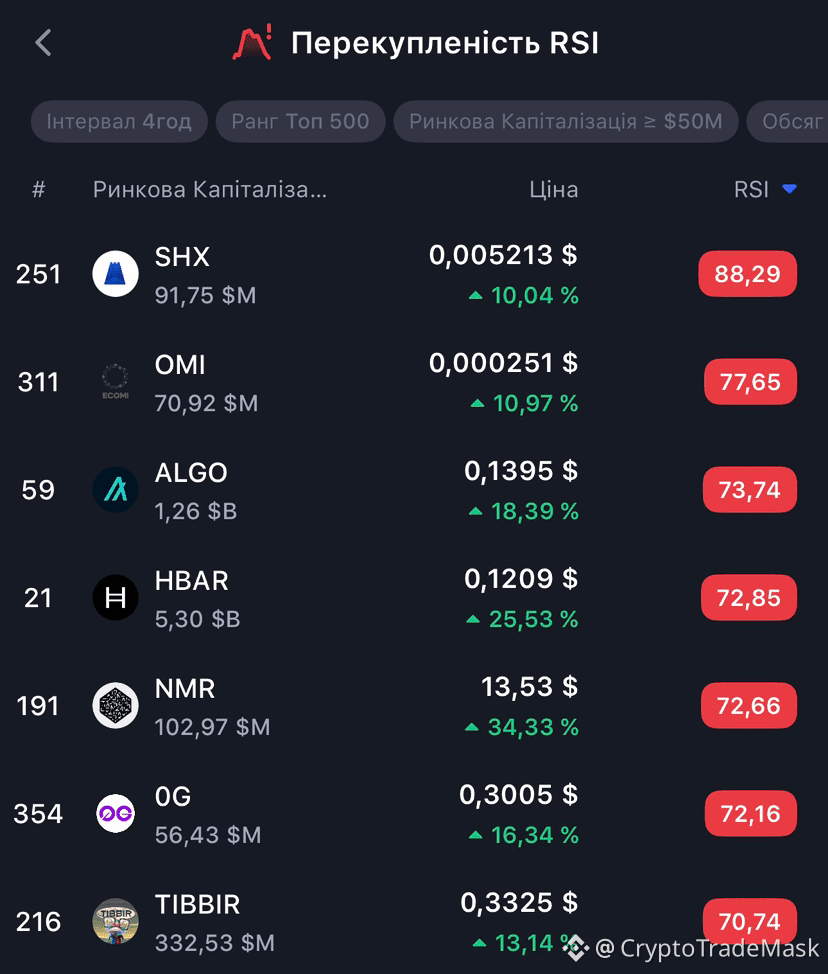
🔴 Overbought
• The price has risen too much.
• RSI > 70.
• A correction or pause after growth is likely - it's time to take profits.
• In this zone now: $ALGO , $HBAR - a cooling after a surge is possible.
⚠️ Rule of thumb: no indicator gives guarantees - they are only hints, not a verdict.
{future}(HBARUSDT)
{future}(ALGOUSDT)
{future}(GUSDT)
#Overbought & #oversold
📊 Overbought & Oversold: How does it work? 📈📉
Key market zones that indicate when the price may reverse.
🟢 Oversold
• The price has fallen too low - temporarily or excessively.
• RSI < 30.
• There may be a chance of a rebound - the asset is becoming interesting to buy.
• Many coins are now in this zone: $G - a bottom may be forming.
🔴 Overbought
• The price has risen too much.
• RSI > 70.
• A correction or pause after growth is likely - it's time to take profits.
• In this zone now: $ALGO , $HBAR - a cooling after a surge is possible.
⚠️ Rule of thumb: no indicator gives guarantees - they are only hints, not a verdict.
1
178
#Overbought & #oversold
📊 Overbought & Oversold: How does it work? 📈📉
Key market zones that indicate when the price may reverse.
🟢 Oversold
• The price has fallen too low - temporarily or excessively.
• RSI < 30.
• There may be a chance of a rebound - the asset is becoming interesting to buy.
• Many coins are now in this zone: $SKY - a bottom may be forming.
🔴 Overbought
• The price has risen too much.
• RSI > 70.
• A correction or pause after growth is likely - it's time to take profits.
• In this zone now: $LAB , $HOME - a cooling after a surge is possible.
⚠️ Rule of thumb: no indicator gives guarantees - they are only hints, not a verdict.
{future}(HOMEUSDT)
{future}(LABUSDT)
{future}(SKYUSDT)
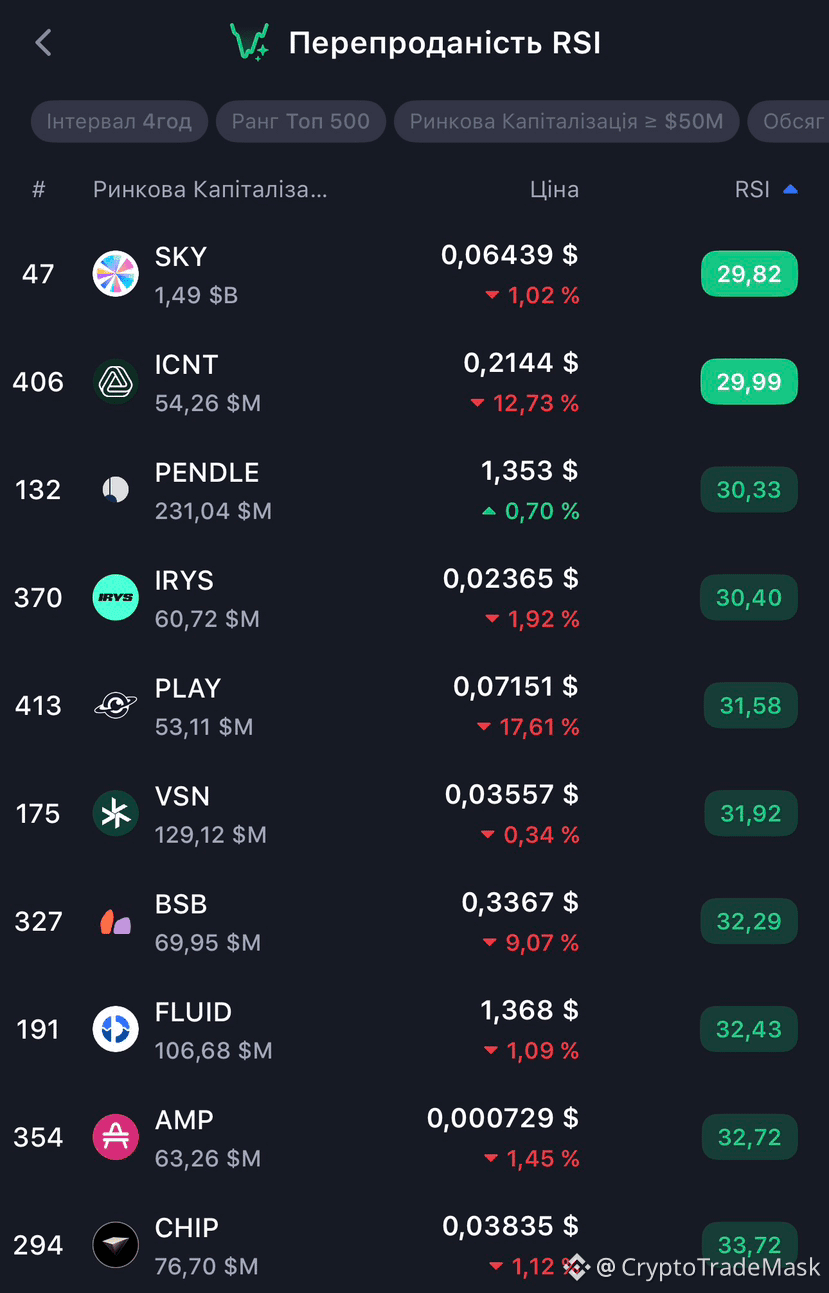
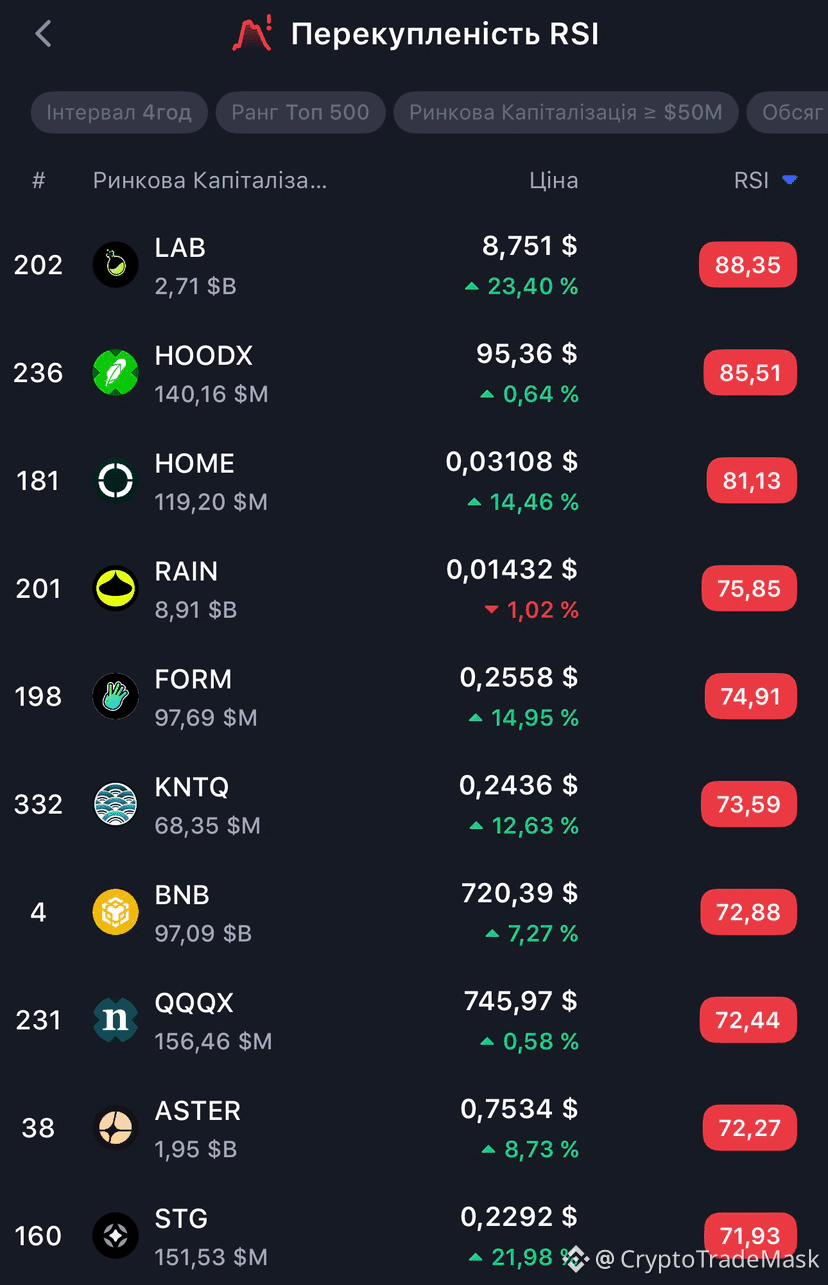
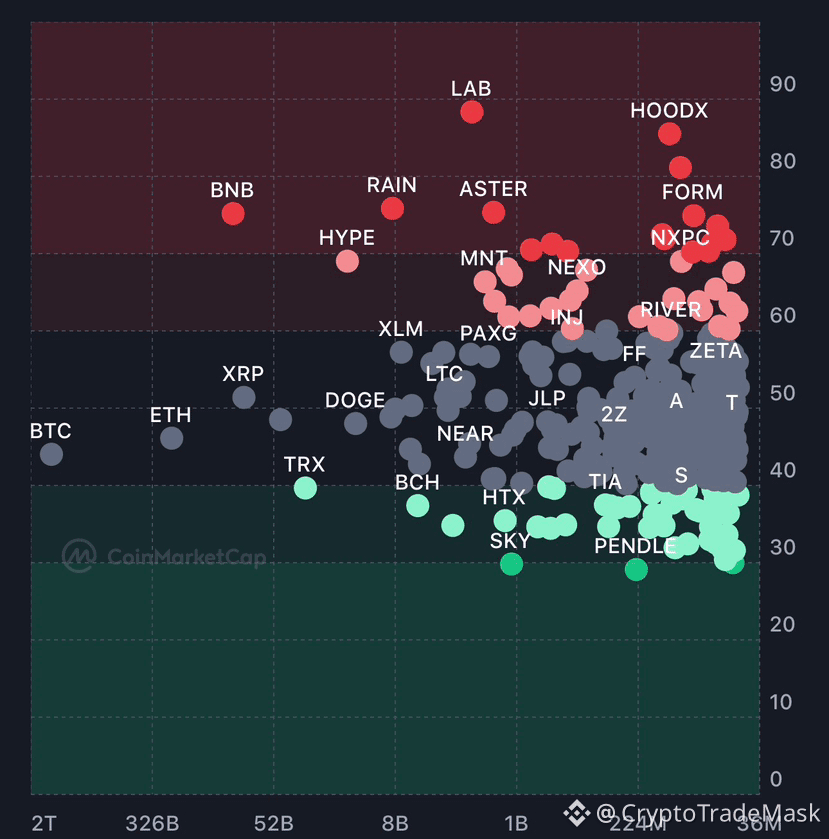
#Overbought & #oversold
📊 Overbought & Oversold: How does it work? 📈📉
Key market zones that indicate when the price may reverse.
🟢 Oversold
• The price has fallen too low - temporarily or excessively.
• RSI < 30.
• There may be a chance of a rebound - the asset is becoming interesting to buy.
• Many coins are now in this zone: $SKY - a bottom may be forming.
🔴 Overbought
• The price has risen too much.
• RSI > 70.
• A correction or pause after growth is likely - it's time to take profits.
• In this zone now: $LAB , $HOME - a cooling after a surge is possible.
⚠️ Rule of thumb: no indicator gives guarantees - they are only hints, not a verdict.
370

·
--
Рост
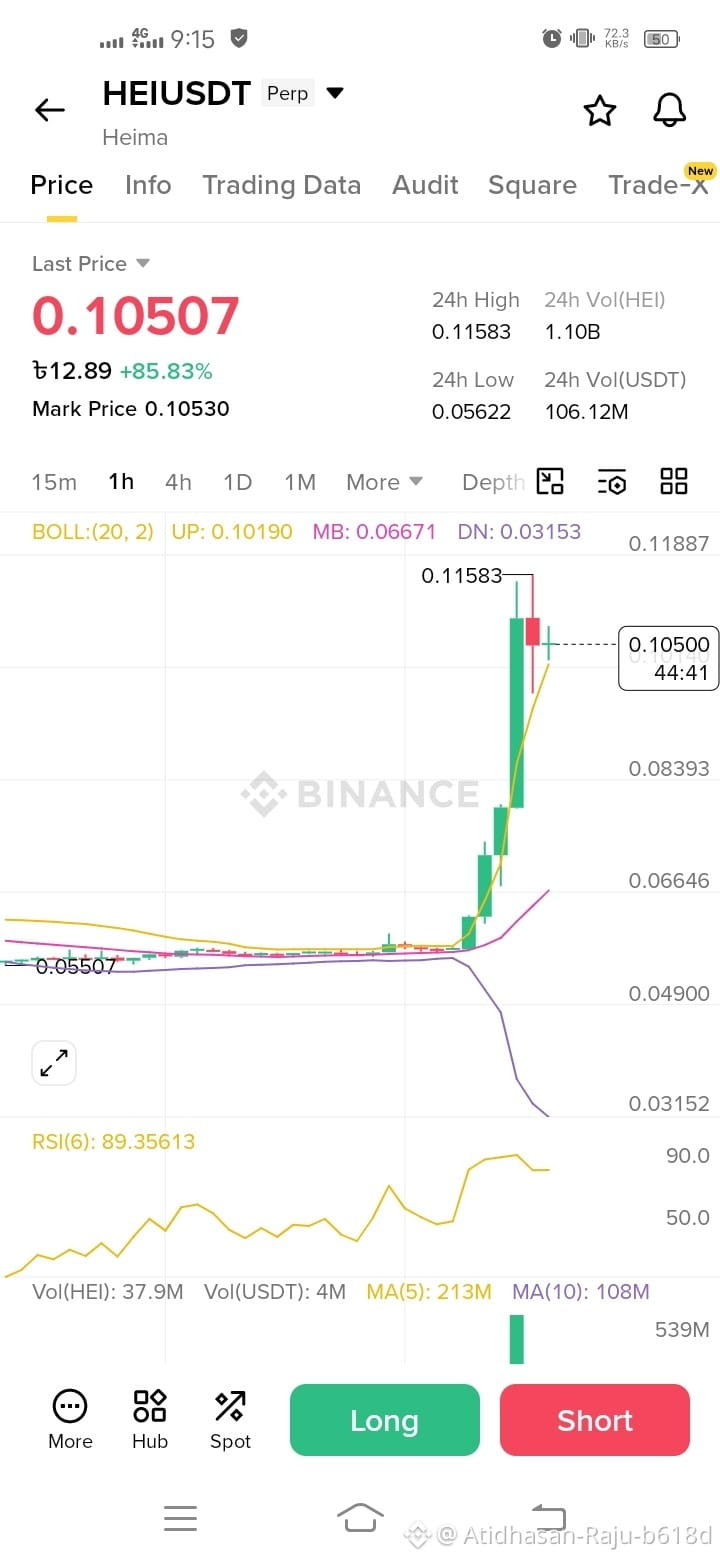
🚨 $HEI /USDT: Extreme Overbought Alert! Correction Imminent?
HEI has experienced an explosive parabolic move, pumping over 85% in the last 24 hours! However, looking at the 1H chart, the price has severely overextended, piercing straight through the Upper Bollinger Band (UP: 0.10190) and hitting a high of 0.11583. The RSI (6) is sitting at an extreme 89.35, which is heavily overbought. The current candle is flashing a potential exhaustion signal. A sharp technical cooling-off/correction back toward the middle band looks highly overdue here!
Direction: SHORT / SELL 🔴 (Scalp Setup)
Entry Range: 0.10500 - 0.10900Leverage: 2x - 3x (Keep it low, extremely high volatility)
Take Profit (TP):🎯 TP1: 0.09500 (Immediate local support)
🎯 TP2: 0.08300 (Key psychological level)🎯 TP3: 0.06800 (Towards Middle Bollinger Band)
Stop Loss (SL): 🛑 0.11850 (Strictly enforced above the 24h High)
👉 Is HEI ready to crash back down, or will the short squeeze push it higher? Drop your thoughts below! 👇
$HEI
{future}(HEIUSDT)
Will HEI drop below 0.09000 soon?
[Yes, dump is starting! 📉 / No, pumping to 0.15! 🚀]
#HEI #Heima #CryptoTrading #FuturesTrading #TradingSignals #BinanceSquare #TechnicalAnalysis #Overbought #CryptoShort
🚨 $HEI /USDT: Extreme Overbought Alert! Correction Imminent?
HEI has experienced an explosive parabolic move, pumping over 85% in the last 24 hours! However, looking at the 1H chart, the price has severely overextended, piercing straight through the Upper Bollinger Band (UP: 0.10190) and hitting a high of 0.11583. The RSI (6) is sitting at an extreme 89.35, which is heavily overbought. The current candle is flashing a potential exhaustion signal. A sharp technical cooling-off/correction back toward the middle band looks highly overdue here!
Direction: SHORT / SELL 🔴 (Scalp Setup)
Entry Range: 0.10500 - 0.10900Leverage: 2x - 3x (Keep it low, extremely high volatility)
Take Profit (TP):🎯 TP1: 0.09500 (Immediate local support)
🎯 TP2: 0.08300 (Key psychological level)🎯 TP3: 0.06800 (Towards Middle Bollinger Band)
Stop Loss (SL): 🛑 0.11850 (Strictly enforced above the 24h High)
👉 Is HEI ready to crash back down, or will the short squeeze push it higher? Drop your thoughts below! 👇
$HEI
Will HEI drop below 0.09000 soon?
[Yes, dump is starting! 📉 / No, pumping to 0.15! 🚀]
#HEI #Heima #CryptoTrading #FuturesTrading #TradingSignals #BinanceSquare #TechnicalAnalysis #Overbought #CryptoShort
144

·
--
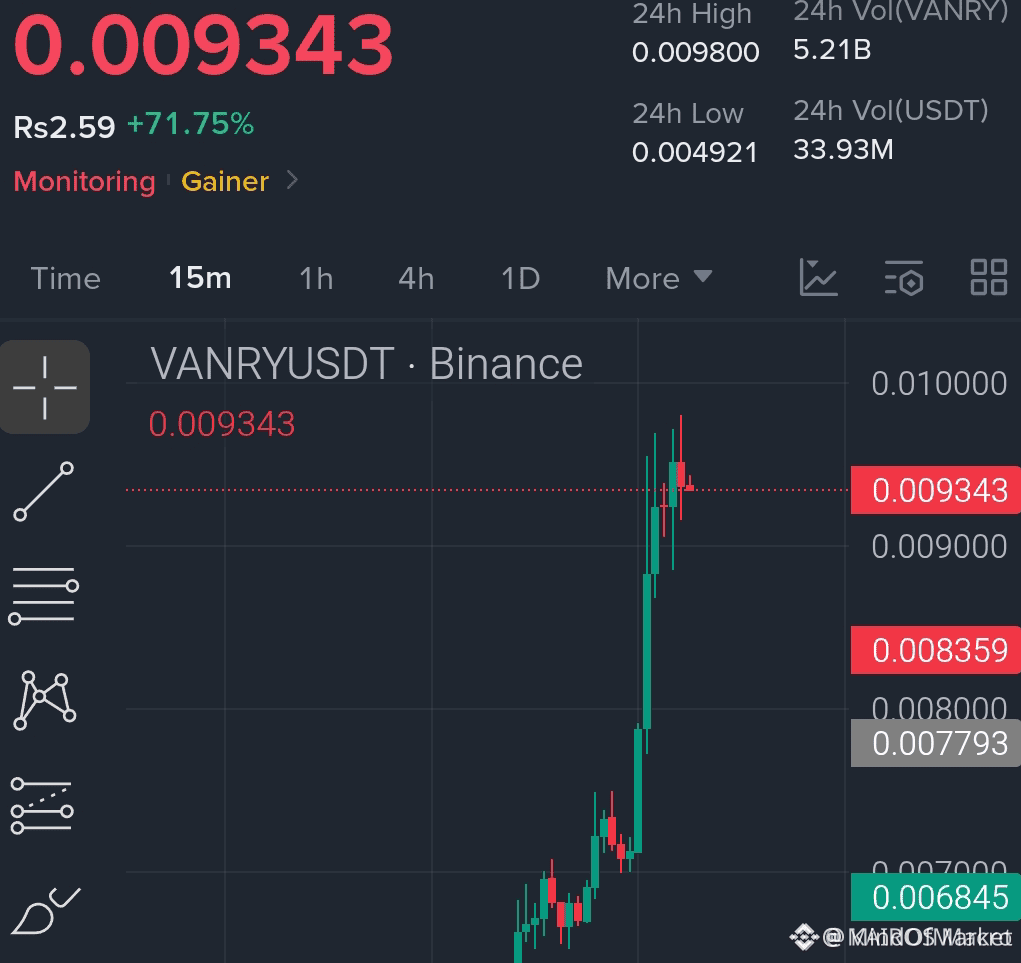
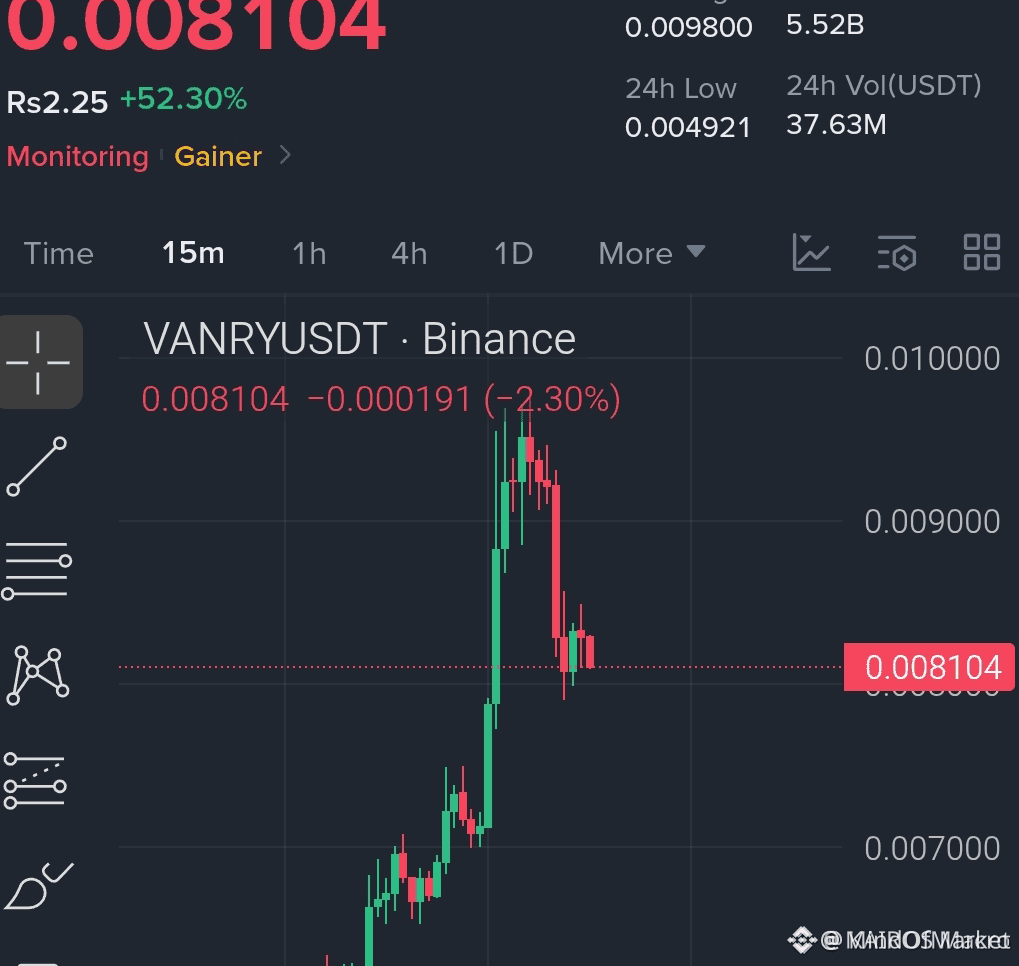
$VANRY OVERBOUGHT AND REJECTING KEY RESISTANCE – SHORT SETUP IN PLAY 🔥
Entry: 0.0081 - 0.0083 🔥
Target: 0.0077 🚀
Stop Loss: 0.0089 ⚠️
RSI on the 4H has been pinned above 80 for consecutive candles, a zone that has preceded every correction in the last three weeks. Price is now stalling at a prior order block with visible sell-side liquidity clustering above.
The structure suggests a liquidity sweep before a move lower toward the first target. Volume divergence is already showing on shorter timeframes. Are you shorting this rejection or waiting for a retest of resistance?
Not financial advice. Always manage your risk.
#VANRY #ShortSetup #Overbought #Crypto
🔥
115

·
--
Падение
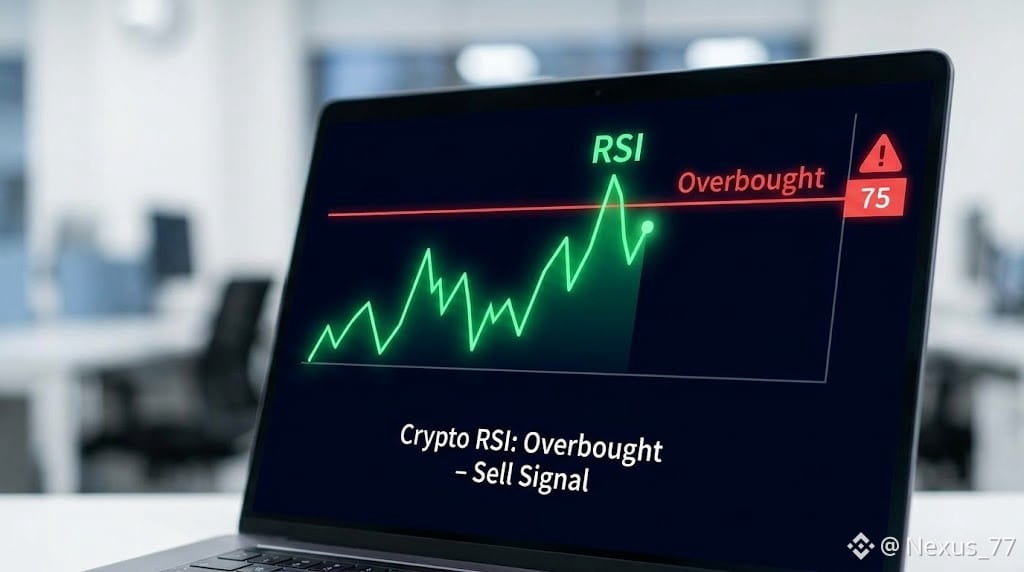
𝗥𝘀𝗶 𝗼𝘃𝗲𝗿 𝗯𝗼𝘂𝗴𝗵𝘁 𝗖𝗿𝘆𝗽𝘁𝗼 👀🔥
Friends, these coins are currently sitting in the RSI overbought zone on the 4H chart. 👀
That doesn't always mean a drop is coming, but they're definitely worth keeping on your watchlist. I'll be watching for confirmation before making any decisions.
What do you think? Which coin catches your attention the most? 👇📈
#BİNANCE #TechnicalAnalysiss #Overbought
$KAITO $PIEVERSE $XPL
{future}(XPLUSDT)
{future}(PIEVERSEUSDT)
{future}(KAITOUSDT)
𝗥𝘀𝗶 𝗼𝘃𝗲𝗿 𝗯𝗼𝘂𝗴𝗵𝘁 𝗖𝗿𝘆𝗽𝘁𝗼 👀🔥
Friends, these coins are currently sitting in the RSI overbought zone on the 4H chart. 👀
That doesn't always mean a drop is coming, but they're definitely worth keeping on your watchlist. I'll be watching for confirmation before making any decisions.
What do you think? Which coin catches your attention the most? 👇📈
#BİNANCE #TechnicalAnalysiss #Overbought
$KAITO $PIEVERSE $XPL
182
Войдите, чтобы посмотреть больше материала
Присоединяйтесь к пользователям криптовалют по всему миру на Binance Square
⚡️ Получайте новейшую и полезную информацию о криптоактивах.
💬 Нам доверяет крупнейшая в мире криптобиржа.
👍 Получите достоверные аналитические данные от верифицированных создателей контента.
Эл. почта/номер телефона
В тренде
1
#EarningsSeason
Просмотров: 6.5M
32,636 обсуждают
2
#USMidtermElections
Просмотров: 70,030
889 обсуждают
3
#StrategySTRCReaches$99.95ForFirstTimeIn165Days
Просмотров: 130
7 обсуждают
4
#BinanceWillListPredictPREDICT
Просмотров: 3,264
148 обсуждают
5
#SwitzerlandFirstSpotBitcoinETFExpectedToTradeInNovember
Просмотров: 277
20 обсуждают
6
#StrategyReports$21BQ3OperatingProfit
Просмотров: 131
9 обсуждают
7
#TwoAddressesHoldingAbout1.28BUSDTFrozen
Просмотров: 352
45 обсуждают
8
#FirstDigitalBlacklistsAttackerAddressHoldingAbout3.4MFDUSD
Просмотров: 100
5 обсуждают
9
#BitcoinDropsBelow$80K
Просмотров: 50,771
147 обсуждают
10
#BoEOpensConsultationOnTokenizedCollateralForClearing
Просмотров: 1,913
39 обсуждают