
#marketcycle
marketcycle
Просмотров: 926,981
2,793 обсуждают
Популярные
Новые

·
--
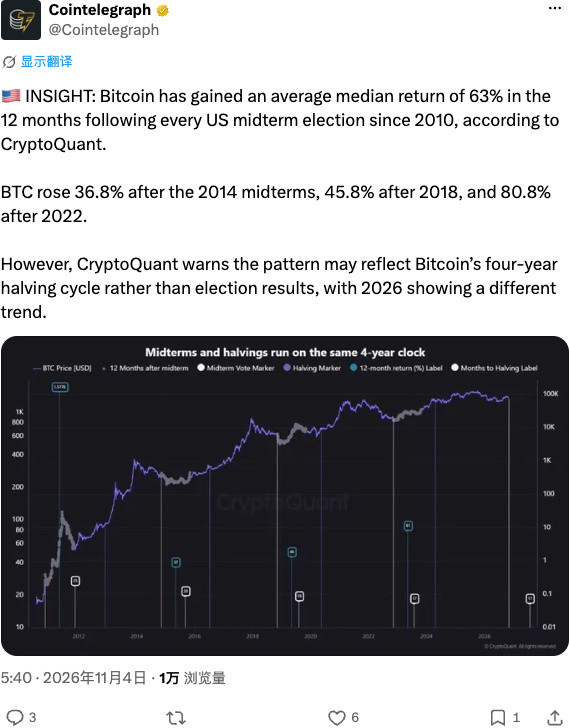
中期选举后涨63%,看着很香,但别被K线骗了。CryptoQuant泼了盆冷水:这波红利其实是四年减半周期的自然反应,2026年搞不好是个坑。别把周期当信仰,别把选举当神迹。
#Bitcoin #Crypto #MarketCycle #BTC #ElectionCycle
中期选举后涨63%,看着很香,但别被K线骗了。CryptoQuant泼了盆冷水:这波红利其实是四年减半周期的自然反应,2026年搞不好是个坑。别把周期当信仰,别把选举当神迹。
#Bitcoin #Crypto #MarketCycle #BTC #ElectionCycle
#Bitcoin #Crypto #MarketCycle #BTC #ElectionCycle
19

·
--
Market Cycle Analysis: Why the 4-Year Halving Clock Is Only Half the Story
The Bitcoin halving dominates crypto cycle narratives. Supply issuance dropping 50% every four years is a structural demand shock with no historical parallel in traditional markets. But traders who anchor only to the halving calendar miss the second equally powerful force: global liquidity cycles.
BTC price action increasingly tracks M2 money supply expansion of major central banks. When global liquidity contracts - as it did through 2022 - even a post-halving setup is not enough to overcome macro headwinds. The asset reprices risk, and altcoins suffer disproportionately.
The insight: halving sets the structural ceiling for a bull cycle. Liquidity timing determines when the market actually reaches for it.
This cycle divergence creates a useful signal framework:
- Halving marks the multi-year supply floor
- M2 expansion creates the on-ramp
- Stablecoin dry powder on-chain reveals whether demand is ready to deploy
$ETH and $SOL tend to amplify this signal - they outperform when the halving-cycle tailwind and liquidity expansion align simultaneously. Ecosystem tokens follow with a lag, showing additional sensitivity to fee flow dynamics.
The practical takeaway: do not just count months since the halving. Watch real-rate trajectories and central bank balance sheets. When those turn, the structural supply compression from the halving compounds fast.
Two clocks. Not one.
#Bitcoin #MarketCycle #CryptoAnalysis #Halving #Macroeconomics
Market Cycle Analysis: Why the 4-Year Halving Clock Is Only Half the Story
The Bitcoin halving dominates crypto cycle narratives. Supply issuance dropping 50% every four years is a structural demand shock with no historical parallel in traditional markets. But traders who anchor only to the halving calendar miss the second equally powerful force: global liquidity cycles.
BTC price action increasingly tracks M2 money supply expansion of major central banks. When global liquidity contracts - as it did through 2022 - even a post-halving setup is not enough to overcome macro headwinds. The asset reprices risk, and altcoins suffer disproportionately.
The insight: halving sets the structural ceiling for a bull cycle. Liquidity timing determines when the market actually reaches for it.
This cycle divergence creates a useful signal framework:
- Halving marks the multi-year supply floor
- M2 expansion creates the on-ramp
- Stablecoin dry powder on-chain reveals whether demand is ready to deploy
$ETH and $SOL tend to amplify this signal - they outperform when the halving-cycle tailwind and liquidity expansion align simultaneously. Ecosystem tokens follow with a lag, showing additional sensitivity to fee flow dynamics.
The practical takeaway: do not just count months since the halving. Watch real-rate trajectories and central bank balance sheets. When those turn, the structural supply compression from the halving compounds fast.
Two clocks. Not one.
#Bitcoin #MarketCycle #CryptoAnalysis #Halving #Macroeconomics
The Bitcoin halving dominates crypto cycle narratives. Supply issuance dropping 50% every four years is a structural demand shock with no historical parallel in traditional markets. But traders who anchor only to the halving calendar miss the second equally powerful force: global liquidity cycles.
BTC price action increasingly tracks M2 money supply expansion of major central banks. When global liquidity contracts - as it did through 2022 - even a post-halving setup is not enough to overcome macro headwinds. The asset reprices risk, and altcoins suffer disproportionately.
The insight: halving sets the structural ceiling for a bull cycle. Liquidity timing determines when the market actually reaches for it.
This cycle divergence creates a useful signal framework:
- Halving marks the multi-year supply floor
- M2 expansion creates the on-ramp
- Stablecoin dry powder on-chain reveals whether demand is ready to deploy
$ETH and $SOL tend to amplify this signal - they outperform when the halving-cycle tailwind and liquidity expansion align simultaneously. Ecosystem tokens follow with a lag, showing additional sensitivity to fee flow dynamics.
The practical takeaway: do not just count months since the halving. Watch real-rate trajectories and central bank balance sheets. When those turn, the structural supply compression from the halving compounds fast.
Two clocks. Not one.
#Bitcoin #MarketCycle #CryptoAnalysis #Halving #Macroeconomics
65
·
--
Bitcoin dominance is one of the most misread charts in crypto — and the best rotation clock you are not using.
When BTC dominance climbs, capital is consolidating into the perceived safe haven of the cycle. Investors reduce altcoin exposure and park in $BTC. This is the compression phase — often frustrating for altcoin holders, but it is setting the spring.
The inflection point is what matters. When dominance peaks and begins a sustained rollover, it signals that risk appetite is returning. Capital does not rotate evenly or randomly — it follows a predictable sequence:
1. Large-cap smart contract layers move first, capturing institutional beta before smaller names.
2. Ecosystem tokens with narrative and liquidity follow — names with genuine on-chain activity to justify re-rating.
3. Mid- and small-caps see the final surge once retail FOMO re-enters.
The practical edge here is patience and sequencing. Most traders enter alts too early, during the dominance-rise phase, and watch their positions bleed in $BTC terms even as USD prices drift sideways.
Watch dominance — not just price. A lower high in dominance while BTC consolidates is a stronger early rotation signal than any single price candle.
The clock does not ring loudly. It just shifts.
$BTC $ETH $BNB
#Bitcoin #CryptoMarket #Altcoin #MarketCycle #CryptoStrategy
Bitcoin dominance is one of the most misread charts in crypto — and the best rotation clock you are not using.
When BTC dominance climbs, capital is consolidating into the perceived safe haven of the cycle. Investors reduce altcoin exposure and park in $BTC . This is the compression phase — often frustrating for altcoin holders, but it is setting the spring.
The inflection point is what matters. When dominance peaks and begins a sustained rollover, it signals that risk appetite is returning. Capital does not rotate evenly or randomly — it follows a predictable sequence:
1. Large-cap smart contract layers move first, capturing institutional beta before smaller names.
2. Ecosystem tokens with narrative and liquidity follow — names with genuine on-chain activity to justify re-rating.
3. Mid- and small-caps see the final surge once retail FOMO re-enters.
The practical edge here is patience and sequencing. Most traders enter alts too early, during the dominance-rise phase, and watch their positions bleed in $BTC terms even as USD prices drift sideways.
Watch dominance — not just price. A lower high in dominance while BTC consolidates is a stronger early rotation signal than any single price candle.
The clock does not ring loudly. It just shifts.
$BTC $ETH $BNB
#Bitcoin #CryptoMarket #Altcoin #MarketCycle #CryptoStrategy
When BTC dominance climbs, capital is consolidating into the perceived safe haven of the cycle. Investors reduce altcoin exposure and park in $BTC . This is the compression phase — often frustrating for altcoin holders, but it is setting the spring.
The inflection point is what matters. When dominance peaks and begins a sustained rollover, it signals that risk appetite is returning. Capital does not rotate evenly or randomly — it follows a predictable sequence:
1. Large-cap smart contract layers move first, capturing institutional beta before smaller names.
2. Ecosystem tokens with narrative and liquidity follow — names with genuine on-chain activity to justify re-rating.
3. Mid- and small-caps see the final surge once retail FOMO re-enters.
The practical edge here is patience and sequencing. Most traders enter alts too early, during the dominance-rise phase, and watch their positions bleed in $BTC terms even as USD prices drift sideways.
Watch dominance — not just price. A lower high in dominance while BTC consolidates is a stronger early rotation signal than any single price candle.
The clock does not ring loudly. It just shifts.
$BTC $ETH $BNB
#Bitcoin #CryptoMarket #Altcoin #MarketCycle #CryptoStrategy
68


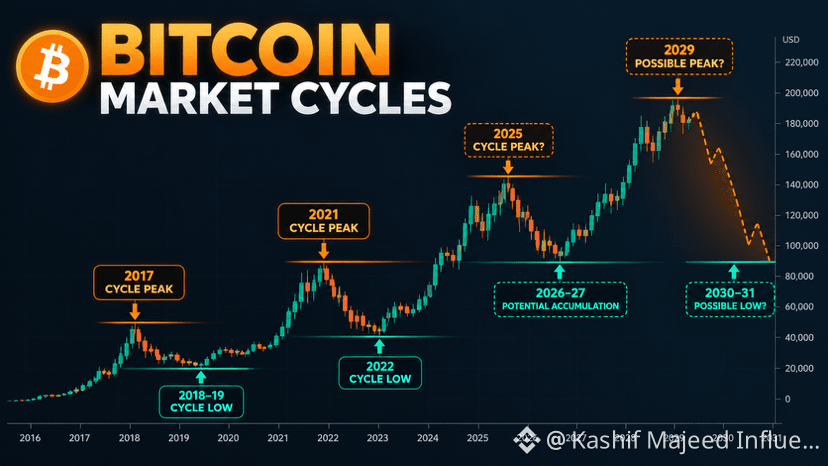
🚨 THE NEXT 6–12 MONTHS COULD CHANGE YOUR FINANCIAL FUTURE.
Most people will realize what happened only AFTER it’s too late.
Here’s the scenario I’m watching closely:
📈 Stocks could make one final explosive move.
₿ Crypto could follow with a powerful rally.
🧠 Euphoria returns. Everyone thinks the bull run will last forever.
And then?
⚠️ The economy slows down. The recession fears hit. Markets turn.
This is where disciplined investors separate themselves from the crowd.
The biggest mistake isn’t missing the bottom.
It’s buying because of FOMO and selling because of panic.
I’m watching more than just price. I’m tracking market sentiment, liquidity, and investor behavior.
The goal isn’t to predict every move. It’s to be prepared before the crowd reacts.
The next major opportunity could be closer than most people think.
But remember: no one can guarantee the next market move. Manage your risk and never invest money you can’t afford to lose.
🔔 Stay informed. Stay prepared. Stay ahead.
#bitcoin #crypto #stockmarket #trading #MarketCycle
🚨 THE NEXT 6–12 MONTHS COULD CHANGE YOUR FINANCIAL FUTURE.
Most people will realize what happened only AFTER it’s too late.
Here’s the scenario I’m watching closely:
📈 Stocks could make one final explosive move.
₿ Crypto could follow with a powerful rally.
🧠 Euphoria returns. Everyone thinks the bull run will last forever.
And then?
⚠️ The economy slows down. The recession fears hit. Markets turn.
This is where disciplined investors separate themselves from the crowd.
The biggest mistake isn’t missing the bottom.
It’s buying because of FOMO and selling because of panic.
I’m watching more than just price. I’m tracking market sentiment, liquidity, and investor behavior.
The goal isn’t to predict every move. It’s to be prepared before the crowd reacts.
The next major opportunity could be closer than most people think.
But remember: no one can guarantee the next market move. Manage your risk and never invest money you can’t afford to lose.
🔔 Stay informed. Stay prepared. Stay ahead.
#bitcoin #crypto #stockmarket #trading #MarketCycle
Most people will realize what happened only AFTER it’s too late.
Here’s the scenario I’m watching closely:
📈 Stocks could make one final explosive move.
₿ Crypto could follow with a powerful rally.
🧠 Euphoria returns. Everyone thinks the bull run will last forever.
And then?
⚠️ The economy slows down. The recession fears hit. Markets turn.
This is where disciplined investors separate themselves from the crowd.
The biggest mistake isn’t missing the bottom.
It’s buying because of FOMO and selling because of panic.
I’m watching more than just price. I’m tracking market sentiment, liquidity, and investor behavior.
The goal isn’t to predict every move. It’s to be prepared before the crowd reacts.
The next major opportunity could be closer than most people think.
But remember: no one can guarantee the next market move. Manage your risk and never invest money you can’t afford to lose.
🔔 Stay informed. Stay prepared. Stay ahead.
#bitcoin #crypto #stockmarket #trading #MarketCycle
11
207
·
--
Is the 4-Year Crypto Cycle Dead — or Just Evolving?
The Bitcoin halving cycle has long been the market's metronome. Reduce supply issuance every ~4 years, demand holds, price eventually rips. Simple narrative, historically powerful.
But here's what's changing: institutional participation is compressing the cycle timeline. When spot Bitcoin ETFs channel billions in systematic inflows, and corporate treasuries treat $BTC as a reserve asset, the post-halving "patience period" shrinks. Institutions don't panic-sell in bear markets the same way retail does — but they also front-run catalysts with more precision.
What this means practically:
1. Volatility is dampening at cycle peaks. Fewer parabolic blow-offs, more structured distribution phases.
2. Altcoin rotation is becoming more selective. $ETH and $SOL with real revenue and developer gravity are getting institutional bids. Pure narrative plays fade faster.
3. Bear markets may be shallower but longer. Sustained sideways > sharp 85% drawdowns as institutional holders absorb sell pressure.
4. The signal to watch: on-chain activity health — exchange volume, DeFi usage, and new wallet growth all pointing in the same direction at once is the real confirmation.
The 4-year cycle isn't dead. It's being institutionalized. Adapt your timeframes and position sizing accordingly.
#Bitcoin #CryptoMarket #MarketCycle #HalvingCycle #CryptoInsights
Is the 4-Year Crypto Cycle Dead — or Just Evolving?
The Bitcoin halving cycle has long been the market's metronome. Reduce supply issuance every ~4 years, demand holds, price eventually rips. Simple narrative, historically powerful.
But here's what's changing: institutional participation is compressing the cycle timeline. When spot Bitcoin ETFs channel billions in systematic inflows, and corporate treasuries treat $BTC as a reserve asset, the post-halving "patience period" shrinks. Institutions don't panic-sell in bear markets the same way retail does — but they also front-run catalysts with more precision.
What this means practically:
1. Volatility is dampening at cycle peaks. Fewer parabolic blow-offs, more structured distribution phases.
2. Altcoin rotation is becoming more selective. $ETH and $SOL with real revenue and developer gravity are getting institutional bids. Pure narrative plays fade faster.
3. Bear markets may be shallower but longer. Sustained sideways > sharp 85% drawdowns as institutional holders absorb sell pressure.
4. The signal to watch: on-chain activity health — exchange volume, DeFi usage, and new wallet growth all pointing in the same direction at once is the real confirmation.
The 4-year cycle isn't dead. It's being institutionalized. Adapt your timeframes and position sizing accordingly.
#Bitcoin #CryptoMarket #MarketCycle #HalvingCycle #CryptoInsights
The Bitcoin halving cycle has long been the market's metronome. Reduce supply issuance every ~4 years, demand holds, price eventually rips. Simple narrative, historically powerful.
But here's what's changing: institutional participation is compressing the cycle timeline. When spot Bitcoin ETFs channel billions in systematic inflows, and corporate treasuries treat $BTC as a reserve asset, the post-halving "patience period" shrinks. Institutions don't panic-sell in bear markets the same way retail does — but they also front-run catalysts with more precision.
What this means practically:
1. Volatility is dampening at cycle peaks. Fewer parabolic blow-offs, more structured distribution phases.
2. Altcoin rotation is becoming more selective. $ETH and $SOL with real revenue and developer gravity are getting institutional bids. Pure narrative plays fade faster.
3. Bear markets may be shallower but longer. Sustained sideways > sharp 85% drawdowns as institutional holders absorb sell pressure.
4. The signal to watch: on-chain activity health — exchange volume, DeFi usage, and new wallet growth all pointing in the same direction at once is the real confirmation.
The 4-year cycle isn't dead. It's being institutionalized. Adapt your timeframes and position sizing accordingly.
#Bitcoin #CryptoMarket #MarketCycle #HalvingCycle #CryptoInsights
94
·
--
Is the 4-Year Crypto Cycle Compressing?
The halving-anchored 4-year cycle has been crypto's most durable rhythm. But there's a credible case that it's compressing — and smart money should prepare for that shift.
Three forces are rewriting the clock:
1. Institutional bid depth. ETF inflows and treasury-grade allocations have created a persistent baseline demand that historically didn't exist. Deep buyers don't sell on 30% drawdowns — they accumulate. This floors corrections that would have become 80%+ bear markets in prior cycles.
2. 24/7 global liquidity arbitrage. Macro rates, dollar strength, and risk-on/off signals now move crypto in real time alongside equities. The old post-halving 12-18 month lag between supply shock and price response shrinks when TradFi capital can rotate instantly.
3. Derivatives market maturity. Leveraged-long flushes that took 6-9 months to resolve in 2018 and 2022 now clear in weeks via cascade liquidations. Pain is faster. Recovery is faster.
The implication: waiting for a "classic" 2-year bear market before deploying capital into $BTC $ETH $BNB may mean waiting for a window that never arrives at that depth or duration.
Cycle compression doesn't mean no cycles — it means tighter, shallower, faster. Position sizing and entry discipline matter more than ever.
#Bitcoin #CryptoMarkets #MarketCycle #CryptoStrategy #BinanceSquare
Is the 4-Year Crypto Cycle Compressing?
The halving-anchored 4-year cycle has been crypto's most durable rhythm. But there's a credible case that it's compressing — and smart money should prepare for that shift.
Three forces are rewriting the clock:
1. Institutional bid depth. ETF inflows and treasury-grade allocations have created a persistent baseline demand that historically didn't exist. Deep buyers don't sell on 30% drawdowns — they accumulate. This floors corrections that would have become 80%+ bear markets in prior cycles.
2. 24/7 global liquidity arbitrage. Macro rates, dollar strength, and risk-on/off signals now move crypto in real time alongside equities. The old post-halving 12-18 month lag between supply shock and price response shrinks when TradFi capital can rotate instantly.
3. Derivatives market maturity. Leveraged-long flushes that took 6-9 months to resolve in 2018 and 2022 now clear in weeks via cascade liquidations. Pain is faster. Recovery is faster.
The implication: waiting for a "classic" 2-year bear market before deploying capital into $BTC $ETH $BNB may mean waiting for a window that never arrives at that depth or duration.
Cycle compression doesn't mean no cycles — it means tighter, shallower, faster. Position sizing and entry discipline matter more than ever.
#Bitcoin #CryptoMarkets #MarketCycle #CryptoStrategy #BinanceSquare
The halving-anchored 4-year cycle has been crypto's most durable rhythm. But there's a credible case that it's compressing — and smart money should prepare for that shift.
Three forces are rewriting the clock:
1. Institutional bid depth. ETF inflows and treasury-grade allocations have created a persistent baseline demand that historically didn't exist. Deep buyers don't sell on 30% drawdowns — they accumulate. This floors corrections that would have become 80%+ bear markets in prior cycles.
2. 24/7 global liquidity arbitrage. Macro rates, dollar strength, and risk-on/off signals now move crypto in real time alongside equities. The old post-halving 12-18 month lag between supply shock and price response shrinks when TradFi capital can rotate instantly.
3. Derivatives market maturity. Leveraged-long flushes that took 6-9 months to resolve in 2018 and 2022 now clear in weeks via cascade liquidations. Pain is faster. Recovery is faster.
The implication: waiting for a "classic" 2-year bear market before deploying capital into $BTC $ETH $BNB may mean waiting for a window that never arrives at that depth or duration.
Cycle compression doesn't mean no cycles — it means tighter, shallower, faster. Position sizing and entry discipline matter more than ever.
#Bitcoin #CryptoMarkets #MarketCycle #CryptoStrategy #BinanceSquare
57
·
--
Developer Activity Is the Market Cycle Metric Most Traders Ignore
Price charts get all the attention but developer commit activity often leads the market cycle by 6 to 12 months.
Here is why it matters: protocols with growing developer ecosystems are building the products users will adopt in the next bull leg. By the time the price catches up, the structural work is already done. Developers do not leave when prices drop. The builders who stay through a bear market are the ones who create durable ecosystems.
$SOL is a textbook example. Its developer count accelerated sharply in 2023 to 2024 during a period of heavy price suppression. The result was a DeFi and consumer-app explosion that repriced the whole L1 stack. $ETH continues to dominate raw developer count across rollup, tooling, and protocol layers. $BNB BSC ecosystem is seeing consistent dApp deployment from Southeast Asia and payments verticals.
The practical takeaway: when price is flat but GitHub activity, new wallet deployments, and testnet launches are rising, that is accumulation phase signal, not indifference.
Most retail traders watch price. The edge is in watching what builders are doing when nobody is paying attention.
Developer momentum is a leading indicator. Price momentum is a lagging one.
#CryptoInsights #MarketCycle #DeveloperActivity #BuildingInBear #Crypto2026
Developer Activity Is the Market Cycle Metric Most Traders Ignore
Price charts get all the attention but developer commit activity often leads the market cycle by 6 to 12 months.
Here is why it matters: protocols with growing developer ecosystems are building the products users will adopt in the next bull leg. By the time the price catches up, the structural work is already done. Developers do not leave when prices drop. The builders who stay through a bear market are the ones who create durable ecosystems.
$SOL is a textbook example. Its developer count accelerated sharply in 2023 to 2024 during a period of heavy price suppression. The result was a DeFi and consumer-app explosion that repriced the whole L1 stack. $ETH continues to dominate raw developer count across rollup, tooling, and protocol layers. $BNB BSC ecosystem is seeing consistent dApp deployment from Southeast Asia and payments verticals.
The practical takeaway: when price is flat but GitHub activity, new wallet deployments, and testnet launches are rising, that is accumulation phase signal, not indifference.
Most retail traders watch price. The edge is in watching what builders are doing when nobody is paying attention.
Developer momentum is a leading indicator. Price momentum is a lagging one.
#CryptoInsights #MarketCycle #DeveloperActivity #BuildingInBear #Crypto2026
Price charts get all the attention but developer commit activity often leads the market cycle by 6 to 12 months.
Here is why it matters: protocols with growing developer ecosystems are building the products users will adopt in the next bull leg. By the time the price catches up, the structural work is already done. Developers do not leave when prices drop. The builders who stay through a bear market are the ones who create durable ecosystems.
$SOL is a textbook example. Its developer count accelerated sharply in 2023 to 2024 during a period of heavy price suppression. The result was a DeFi and consumer-app explosion that repriced the whole L1 stack. $ETH continues to dominate raw developer count across rollup, tooling, and protocol layers. $BNB BSC ecosystem is seeing consistent dApp deployment from Southeast Asia and payments verticals.
The practical takeaway: when price is flat but GitHub activity, new wallet deployments, and testnet launches are rising, that is accumulation phase signal, not indifference.
Most retail traders watch price. The edge is in watching what builders are doing when nobody is paying attention.
Developer momentum is a leading indicator. Price momentum is a lagging one.
#CryptoInsights #MarketCycle #DeveloperActivity #BuildingInBear #Crypto2026
41
·
--
Late-Cycle Consolidation Is Not a Death Signal — It's Preparation
One of the most costly mistakes crypto traders make is panic-selling during late-cycle sideways action. After a major leg up, markets don't just rocket forever — they consolidate, shake out weak hands, and build the base for the next move.
Here's what late-cycle consolidation actually looks like:
— Price range tightens after a strong advance
— Volume drops, sentiment cools, CT goes quiet
— Funding rates normalize or flip slightly negative
— Long-term holders stay put; short-term traders rotate out
This is compression, not collapse. The market is doing its job: transferring supply from impatient hands to patient ones.
Historically, $BTC has spent 30-60% of each bull cycle in these grinding sideways phases. Traders who exited during Q1 2021 consolidation missed the entire supercycle.
$ETH and $BNB tend to lag in these phases but break out harder when compression resolves — they carry more beta once conviction returns.
The playbook: hold core positions, reduce leverage, stop watching hourly candles. Consolidation is the market's way of giving you time to prepare — not an invitation to bail.
Patience is a position.
#Bitcoin #CryptoMarkets #MarketCycle #BullMarket #CryptoInsights
Late-Cycle Consolidation Is Not a Death Signal — It's Preparation
One of the most costly mistakes crypto traders make is panic-selling during late-cycle sideways action. After a major leg up, markets don't just rocket forever — they consolidate, shake out weak hands, and build the base for the next move.
Here's what late-cycle consolidation actually looks like:
— Price range tightens after a strong advance
— Volume drops, sentiment cools, CT goes quiet
— Funding rates normalize or flip slightly negative
— Long-term holders stay put; short-term traders rotate out
This is compression, not collapse. The market is doing its job: transferring supply from impatient hands to patient ones.
Historically, $BTC has spent 30-60% of each bull cycle in these grinding sideways phases. Traders who exited during Q1 2021 consolidation missed the entire supercycle.
$ETH and $BNB tend to lag in these phases but break out harder when compression resolves — they carry more beta once conviction returns.
The playbook: hold core positions, reduce leverage, stop watching hourly candles. Consolidation is the market's way of giving you time to prepare — not an invitation to bail.
Patience is a position.
#Bitcoin #CryptoMarkets #MarketCycle #BullMarket #CryptoInsights
One of the most costly mistakes crypto traders make is panic-selling during late-cycle sideways action. After a major leg up, markets don't just rocket forever — they consolidate, shake out weak hands, and build the base for the next move.
Here's what late-cycle consolidation actually looks like:
— Price range tightens after a strong advance
— Volume drops, sentiment cools, CT goes quiet
— Funding rates normalize or flip slightly negative
— Long-term holders stay put; short-term traders rotate out
This is compression, not collapse. The market is doing its job: transferring supply from impatient hands to patient ones.
Historically, $BTC has spent 30-60% of each bull cycle in these grinding sideways phases. Traders who exited during Q1 2021 consolidation missed the entire supercycle.
$ETH and $BNB tend to lag in these phases but break out harder when compression resolves — they carry more beta once conviction returns.
The playbook: hold core positions, reduce leverage, stop watching hourly candles. Consolidation is the market's way of giving you time to prepare — not an invitation to bail.
Patience is a position.
#Bitcoin #CryptoMarkets #MarketCycle #BullMarket #CryptoInsights
59
·
--
Market cycle psychology is the most exploitable edge in crypto — and almost nobody uses it consistently.
When retail sentiment peaks — when everyone is calling for new all-time highs on $BTC, when Twitter is nothing but moon emojis, when search volume spikes — that is precisely when the marginal buyer is exhausted. Supply comes. Price eventually follows.
The inverse is equally true. At genuine cycle lows, most retail participants have either sold at a loss or gone completely silent. Volume dries up. Social chatter shifts from "when moon" to "crypto is dead." That asymmetric silence is historically one of the strongest accumulation signals the market produces.
The reason this edge persists: humans are not built to be contrarian at the extremes. Buying into fear feels wrong. Trimming into euphoria feels like leaving money on the table. Our brains are wired to extrapolate the present, not fade it.
Practical takeaway:
— Track the Fear & Greed Index over rolling 30-day periods, not spot readings
— Compare $ETH and $BNB exchange outflows during fear episodes — smart money behavior diverges from sentiment
— Define trim and accumulation zones in advance, not in the heat of the moment
— Process beats emotion every single cycle. The framework does not change — only the assets do.
#CryptoMarkets #MarketCycle #BTC #CryptoStrategy #Binance
Market cycle psychology is the most exploitable edge in crypto — and almost nobody uses it consistently.
When retail sentiment peaks — when everyone is calling for new all-time highs on $BTC , when Twitter is nothing but moon emojis, when search volume spikes — that is precisely when the marginal buyer is exhausted. Supply comes. Price eventually follows.
The inverse is equally true. At genuine cycle lows, most retail participants have either sold at a loss or gone completely silent. Volume dries up. Social chatter shifts from "when moon" to "crypto is dead." That asymmetric silence is historically one of the strongest accumulation signals the market produces.
The reason this edge persists: humans are not built to be contrarian at the extremes. Buying into fear feels wrong. Trimming into euphoria feels like leaving money on the table. Our brains are wired to extrapolate the present, not fade it.
Practical takeaway:
— Track the Fear & Greed Index over rolling 30-day periods, not spot readings
— Compare $ETH and $BNB exchange outflows during fear episodes — smart money behavior diverges from sentiment
— Define trim and accumulation zones in advance, not in the heat of the moment
— Process beats emotion every single cycle. The framework does not change — only the assets do.
#CryptoMarkets #MarketCycle #BTC #CryptoStrategy #Binance
When retail sentiment peaks — when everyone is calling for new all-time highs on $BTC , when Twitter is nothing but moon emojis, when search volume spikes — that is precisely when the marginal buyer is exhausted. Supply comes. Price eventually follows.
The inverse is equally true. At genuine cycle lows, most retail participants have either sold at a loss or gone completely silent. Volume dries up. Social chatter shifts from "when moon" to "crypto is dead." That asymmetric silence is historically one of the strongest accumulation signals the market produces.
The reason this edge persists: humans are not built to be contrarian at the extremes. Buying into fear feels wrong. Trimming into euphoria feels like leaving money on the table. Our brains are wired to extrapolate the present, not fade it.
Practical takeaway:
— Track the Fear & Greed Index over rolling 30-day periods, not spot readings
— Compare $ETH and $BNB exchange outflows during fear episodes — smart money behavior diverges from sentiment
— Define trim and accumulation zones in advance, not in the heat of the moment
— Process beats emotion every single cycle. The framework does not change — only the assets do.
#CryptoMarkets #MarketCycle #BTC #CryptoStrategy #Binance
40
·
--
Market cycles are getting shorter and more violent — and that tells us something important.
Bitcoin's first two cycles saw 4-year peaks separated by brutal 80%+ drawdowns. The 2017 cycle compressed into a cleaner narrative: retail FOMO, futures launch, top. The 2020–2021 cycle added institutional entrants and split into two peaks. Now we're watching cycle compression continue — faster price discovery, shallower drawdowns on pullbacks, but faster climbs to diminishing peak multiples.
The math makes sense. A 10x on $500B market cap requires $4.5T of new inflows. A 10x from $10B only needed $90B. Each cycle, the base gets bigger and the peak multiplier shrinks. This isn't bearish — it's maturation.
What this means practically:
• Don't use prior cycle peak percentages as targets for this cycle
• Shallower drawdowns mid-cycle = accumulation windows get tighter
• Altcoins with genuine utility absorb capital faster in compressed cycles
• Conviction position sizing beats rapid rotation when cycles are shorter
$BTC is the anchor, but $ETH and $SOL exhibit their own sub-cycle dynamics that can be timed against BTC dominance trends. The playbook evolves every cycle.
Adapt or get left behind.
#Bitcoin #CryptoMarkets #MarketCycle #CryptoStrategy #BTC
Market cycles are getting shorter and more violent — and that tells us something important.
Bitcoin's first two cycles saw 4-year peaks separated by brutal 80%+ drawdowns. The 2017 cycle compressed into a cleaner narrative: retail FOMO, futures launch, top. The 2020–2021 cycle added institutional entrants and split into two peaks. Now we're watching cycle compression continue — faster price discovery, shallower drawdowns on pullbacks, but faster climbs to diminishing peak multiples.
The math makes sense. A 10x on $500B market cap requires $4.5T of new inflows. A 10x from $10B only needed $90B. Each cycle, the base gets bigger and the peak multiplier shrinks. This isn't bearish — it's maturation.
What this means practically:
• Don't use prior cycle peak percentages as targets for this cycle
• Shallower drawdowns mid-cycle = accumulation windows get tighter
• Altcoins with genuine utility absorb capital faster in compressed cycles
• Conviction position sizing beats rapid rotation when cycles are shorter
$BTC is the anchor, but $ETH and $SOL exhibit their own sub-cycle dynamics that can be timed against BTC dominance trends. The playbook evolves every cycle.
Adapt or get left behind.
#Bitcoin #CryptoMarkets #MarketCycle #CryptoStrategy #BTC
Bitcoin's first two cycles saw 4-year peaks separated by brutal 80%+ drawdowns. The 2017 cycle compressed into a cleaner narrative: retail FOMO, futures launch, top. The 2020–2021 cycle added institutional entrants and split into two peaks. Now we're watching cycle compression continue — faster price discovery, shallower drawdowns on pullbacks, but faster climbs to diminishing peak multiples.
The math makes sense. A 10x on $500B market cap requires $4.5T of new inflows. A 10x from $10B only needed $90B. Each cycle, the base gets bigger and the peak multiplier shrinks. This isn't bearish — it's maturation.
What this means practically:
• Don't use prior cycle peak percentages as targets for this cycle
• Shallower drawdowns mid-cycle = accumulation windows get tighter
• Altcoins with genuine utility absorb capital faster in compressed cycles
• Conviction position sizing beats rapid rotation when cycles are shorter
$BTC is the anchor, but $ETH and $SOL exhibit their own sub-cycle dynamics that can be timed against BTC dominance trends. The playbook evolves every cycle.
Adapt or get left behind.
#Bitcoin #CryptoMarkets #MarketCycle #CryptoStrategy #BTC
120
·
--
Twelve hours ago the consensus was $BTC was broken. 74,300 printed. Spot ETFs bled billions. Bear accounts everywhere declared the cycle over.
Then a single headline flipped it.
This is what mid-cycle corrections are designed to do — shake out everyone who bought for the narrative, not the structure. The traders who sold at 74K weren’t wrong about the dip. They were wrong about what it meant.
Here’s what actually happened:
— LTH supply barely moved during the flush
— $ETH held relative structure better than most expected
— Stablecoin dry powder on-chain didn’t rotate out — it waited
— The 200-day MA held. Again.
The GENIUS Act is law. Institutional ETF infrastructure is intact. None of that changed because of a geopolitical macro dip.
Every cycle has its “this time it’s really over” moment. The 2021 May crash. The 2019 mid-rally fade. Today felt like that moment for a lot of people.
The data says otherwise. The structure says otherwise.
The flush wasn’t the end. It was the reset that sets up the next leg.
#Bitcoin #CryptoMarkets #MarketCycle #BTC #CryptoTrading
Twelve hours ago the consensus was $BTC was broken. 74,300 printed. Spot ETFs bled billions. Bear accounts everywhere declared the cycle over.
Then a single headline flipped it.
This is what mid-cycle corrections are designed to do — shake out everyone who bought for the narrative, not the structure. The traders who sold at 74K weren’t wrong about the dip. They were wrong about what it meant.
Here’s what actually happened:
— LTH supply barely moved during the flush
— $ETH held relative structure better than most expected
— Stablecoin dry powder on-chain didn’t rotate out — it waited
— The 200-day MA held. Again.
The GENIUS Act is law. Institutional ETF infrastructure is intact. None of that changed because of a geopolitical macro dip.
Every cycle has its “this time it’s really over” moment. The 2021 May crash. The 2019 mid-rally fade. Today felt like that moment for a lot of people.
The data says otherwise. The structure says otherwise.
The flush wasn’t the end. It was the reset that sets up the next leg.
#Bitcoin #CryptoMarkets #MarketCycle #BTC #CryptoTrading
Then a single headline flipped it.
This is what mid-cycle corrections are designed to do — shake out everyone who bought for the narrative, not the structure. The traders who sold at 74K weren’t wrong about the dip. They were wrong about what it meant.
Here’s what actually happened:
— LTH supply barely moved during the flush
— $ETH held relative structure better than most expected
— Stablecoin dry powder on-chain didn’t rotate out — it waited
— The 200-day MA held. Again.
The GENIUS Act is law. Institutional ETF infrastructure is intact. None of that changed because of a geopolitical macro dip.
Every cycle has its “this time it’s really over” moment. The 2021 May crash. The 2019 mid-rally fade. Today felt like that moment for a lot of people.
The data says otherwise. The structure says otherwise.
The flush wasn’t the end. It was the reset that sets up the next leg.
#Bitcoin #CryptoMarkets #MarketCycle #BTC #CryptoTrading
86

·
--
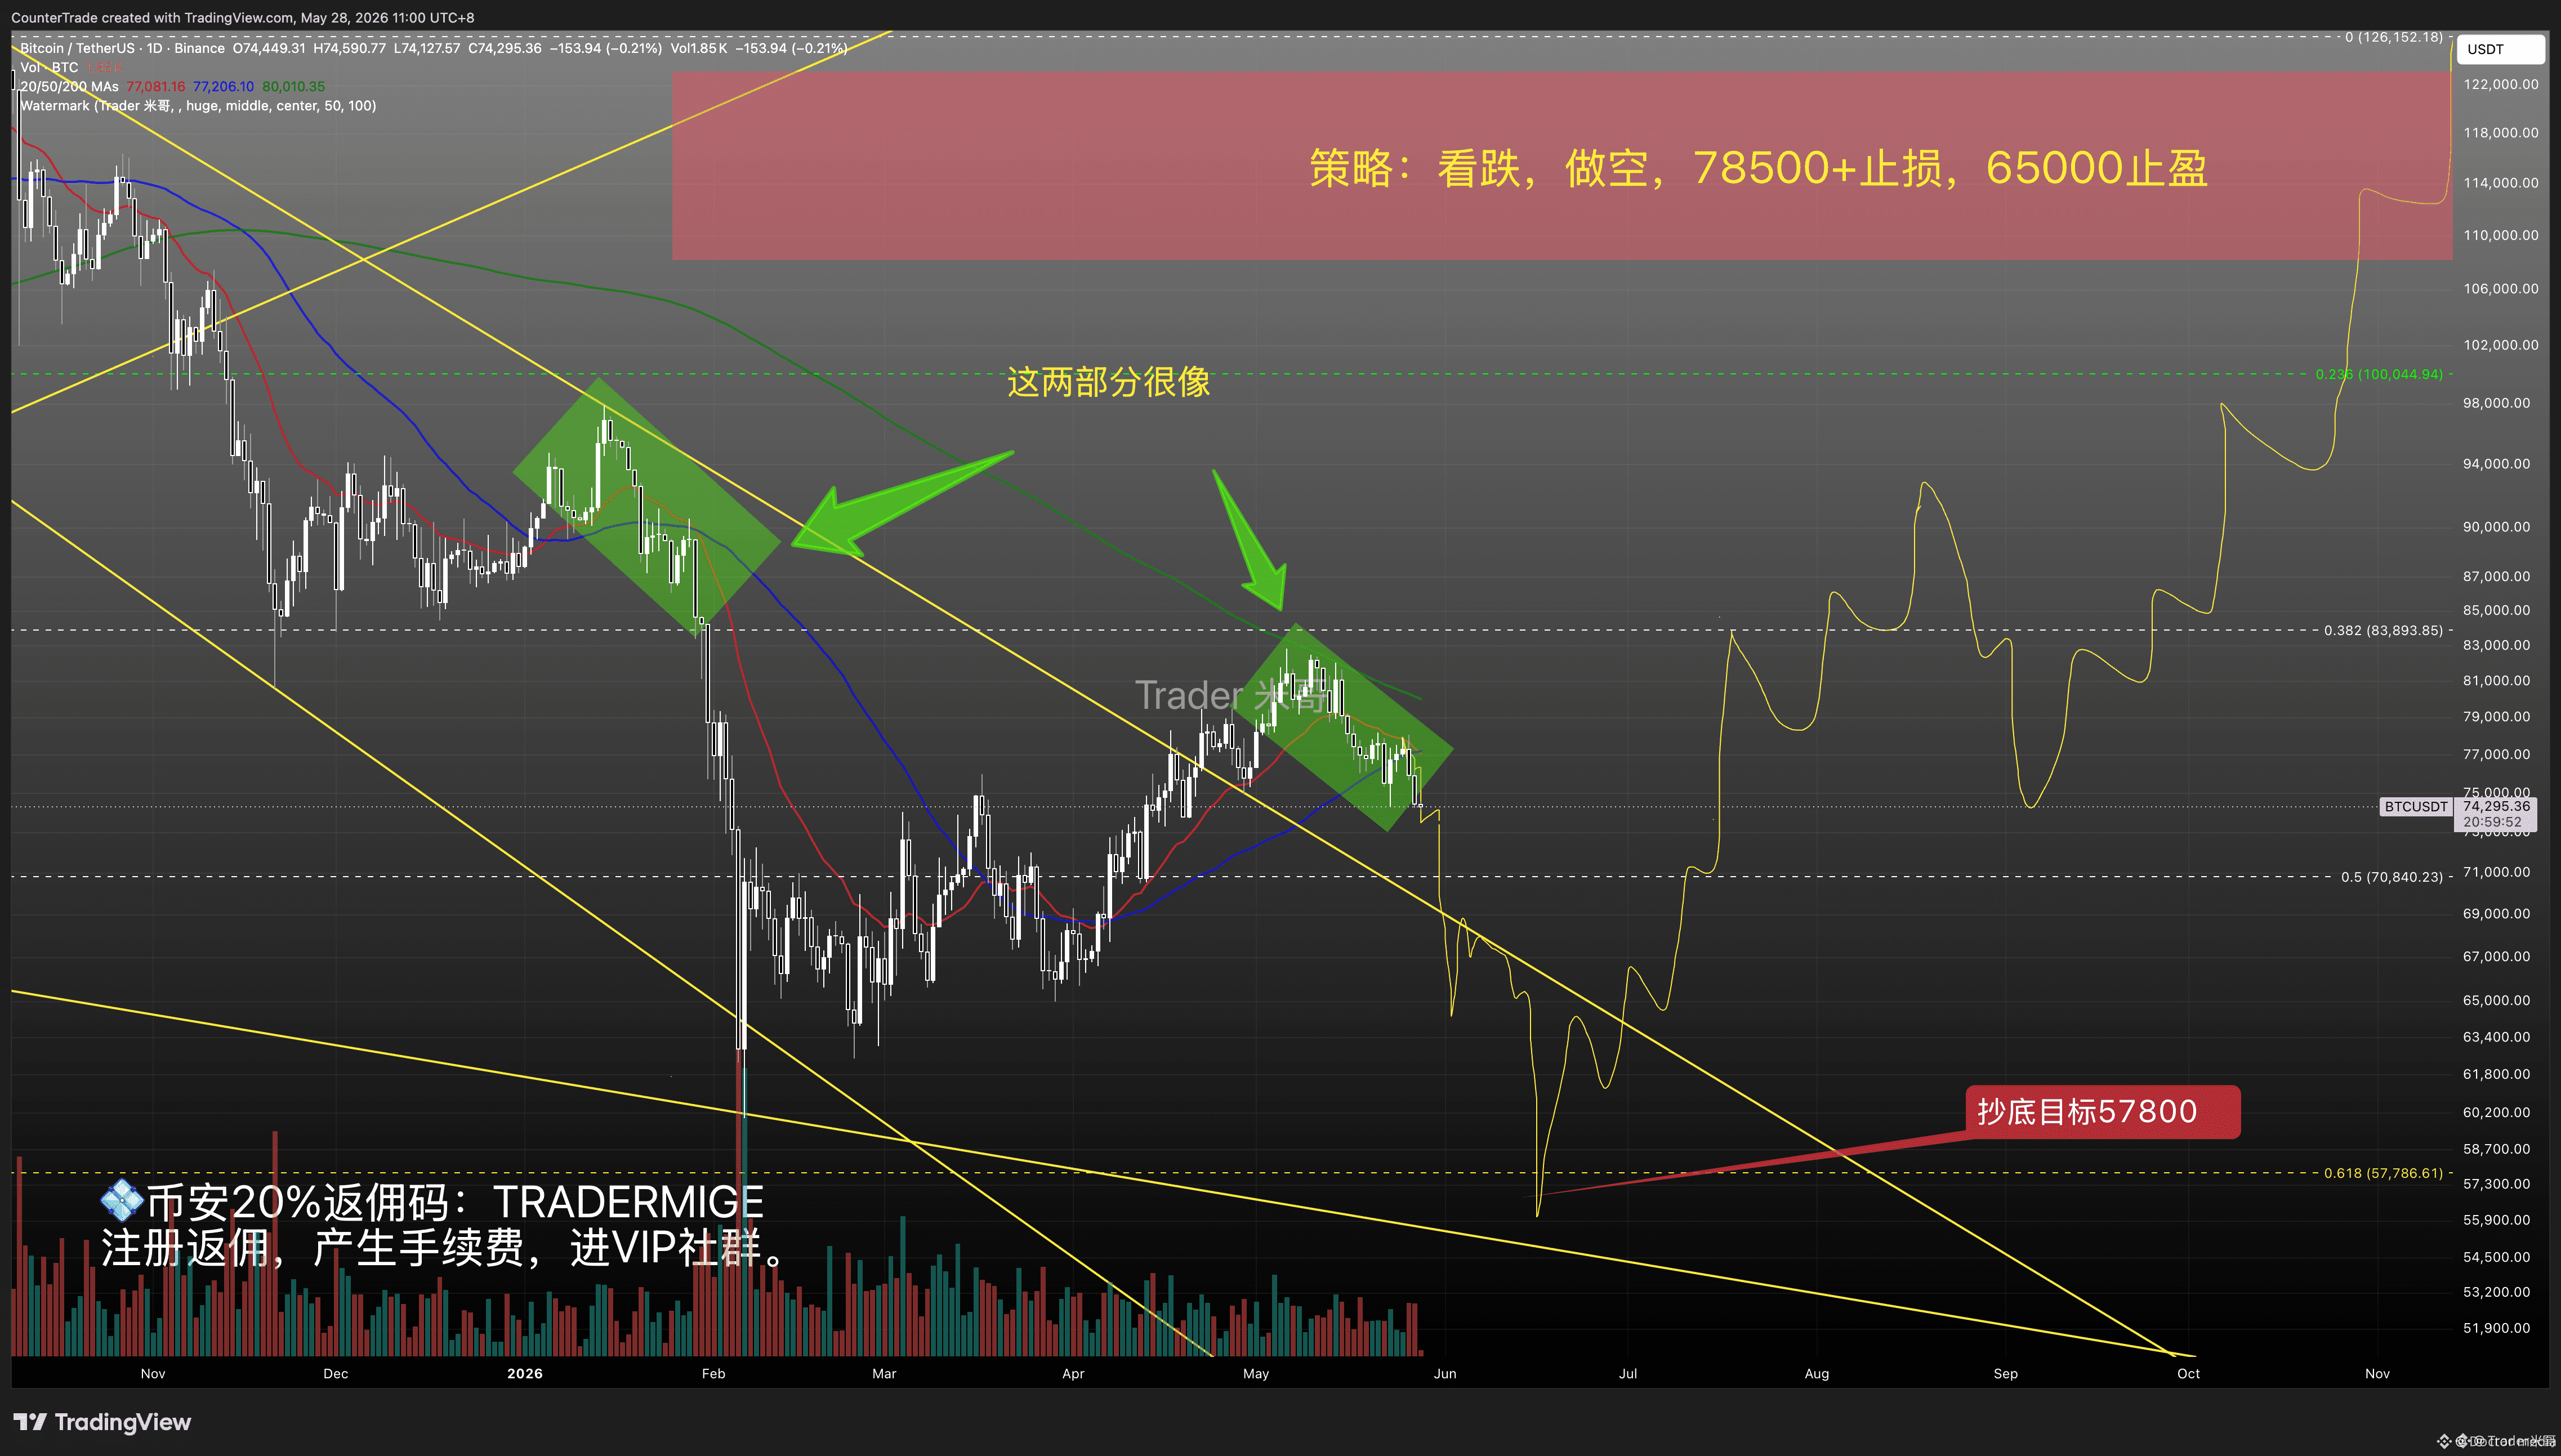
$BTC :The Final Shakeout Before the Parabolic Run? ⚠️🚀
{future}(BTCUSDT)
The next few months are going to be absolute carnage before we see true glory. Bookmark this series—we are about to witness the most critical cycle shift in years.
The Roadmap to the Peak:
The "Graveyard" Phase: We are likely looking at a sharp correction from these levels down to the $57k zone. This is designed to liquidate the over-leveraged and send the bulls to their graves. 📉
The Epic Rally: Once the weak hands are washed out, the real move begins. We are targeting a massive breakout to $135k as the final leg of this cycle. 🌕
The Long Winter: Once we hit that $135k peak, the bull market officially concludes, ushering in a brutal three-year bear cycle. ❄️
The Bottom Line: The "Big One" is coming. Whether you survive the $57k shakeout will determine if you’re around for the $135k pay-day.
Are you holding through the volatility or moving to cash to wait for the $57k entry? Let’s hear your thoughts below. 👇
#BTC #Bitcoin #CryptoMarket #TradingStrategy #BullRun #MarketCycle
$GUA
{future}(GUAUSDT)
$ALLO
{future}(ALLOUSDT)
$BTC :The Final Shakeout Before the Parabolic Run? ⚠️🚀
The next few months are going to be absolute carnage before we see true glory. Bookmark this series—we are about to witness the most critical cycle shift in years.
The Roadmap to the Peak:
The "Graveyard" Phase: We are likely looking at a sharp correction from these levels down to the $57k zone. This is designed to liquidate the over-leveraged and send the bulls to their graves. 📉
The Epic Rally: Once the weak hands are washed out, the real move begins. We are targeting a massive breakout to $135k as the final leg of this cycle. 🌕
The Long Winter: Once we hit that $135k peak, the bull market officially concludes, ushering in a brutal three-year bear cycle. ❄️
The Bottom Line: The "Big One" is coming. Whether you survive the $57k shakeout will determine if you’re around for the $135k pay-day.
Are you holding through the volatility or moving to cash to wait for the $57k entry? Let’s hear your thoughts below. 👇
#BTC #Bitcoin #CryptoMarket #TradingStrategy #BullRun #MarketCycle
$GUA
$ALLO
The next few months are going to be absolute carnage before we see true glory. Bookmark this series—we are about to witness the most critical cycle shift in years.
The Roadmap to the Peak:
The "Graveyard" Phase: We are likely looking at a sharp correction from these levels down to the $57k zone. This is designed to liquidate the over-leveraged and send the bulls to their graves. 📉
The Epic Rally: Once the weak hands are washed out, the real move begins. We are targeting a massive breakout to $135k as the final leg of this cycle. 🌕
The Long Winter: Once we hit that $135k peak, the bull market officially concludes, ushering in a brutal three-year bear cycle. ❄️
The Bottom Line: The "Big One" is coming. Whether you survive the $57k shakeout will determine if you’re around for the $135k pay-day.
Are you holding through the volatility or moving to cash to wait for the $57k entry? Let’s hear your thoughts below. 👇
#BTC #Bitcoin #CryptoMarket #TradingStrategy #BullRun #MarketCycle
$GUA
$ALLO
267

Is the famous Bitcoin Rainbow Chart officially broken❓
According to CoinDesk, Bitcoin has just dropped into the model’s bottom purple band -the dreaded “Bitcoin Is Dead” zone. This marks only the second time in history that BTC has fallen this low relative to the chart, following a 50% slide from its October 2025 all-time high of $126,000.
Trading right back near its April 2024 halving price of $62,500, the market is completely split. On one side, data-driven analysts argue this signals deep, historical undervaluation. On the other hand, macro traders believe the long-running chart is simply losing its relevance. With institutional ETFs, Wall Street allocators, and broader tech-driven macro forces completely reshaping price discovery, the old retail-driven cycles might just be a thing of the past.
Either way, we are watching a massive test of market structure play out in real time.
$BTC $MUB $FLOKI #CoinVahini #BitcoinRainbowChart #CryptoAnalysis #MarketCycle
Is the famous Bitcoin Rainbow Chart officially broken❓
According to CoinDesk, Bitcoin has just dropped into the model’s bottom purple band -the dreaded “Bitcoin Is Dead” zone. This marks only the second time in history that BTC has fallen this low relative to the chart, following a 50% slide from its October 2025 all-time high of $126,000.
Trading right back near its April 2024 halving price of $62,500, the market is completely split. On one side, data-driven analysts argue this signals deep, historical undervaluation. On the other hand, macro traders believe the long-running chart is simply losing its relevance. With institutional ETFs, Wall Street allocators, and broader tech-driven macro forces completely reshaping price discovery, the old retail-driven cycles might just be a thing of the past.
Either way, we are watching a massive test of market structure play out in real time.
$BTC $MUB $FLOKI #CoinVahini #BitcoinRainbowChart #CryptoAnalysis #MarketCycle
According to CoinDesk, Bitcoin has just dropped into the model’s bottom purple band -the dreaded “Bitcoin Is Dead” zone. This marks only the second time in history that BTC has fallen this low relative to the chart, following a 50% slide from its October 2025 all-time high of $126,000.
Trading right back near its April 2024 halving price of $62,500, the market is completely split. On one side, data-driven analysts argue this signals deep, historical undervaluation. On the other hand, macro traders believe the long-running chart is simply losing its relevance. With institutional ETFs, Wall Street allocators, and broader tech-driven macro forces completely reshaping price discovery, the old retail-driven cycles might just be a thing of the past.
Either way, we are watching a massive test of market structure play out in real time.
$BTC $MUB $FLOKI #CoinVahini #BitcoinRainbowChart #CryptoAnalysis #MarketCycle
24

·
--
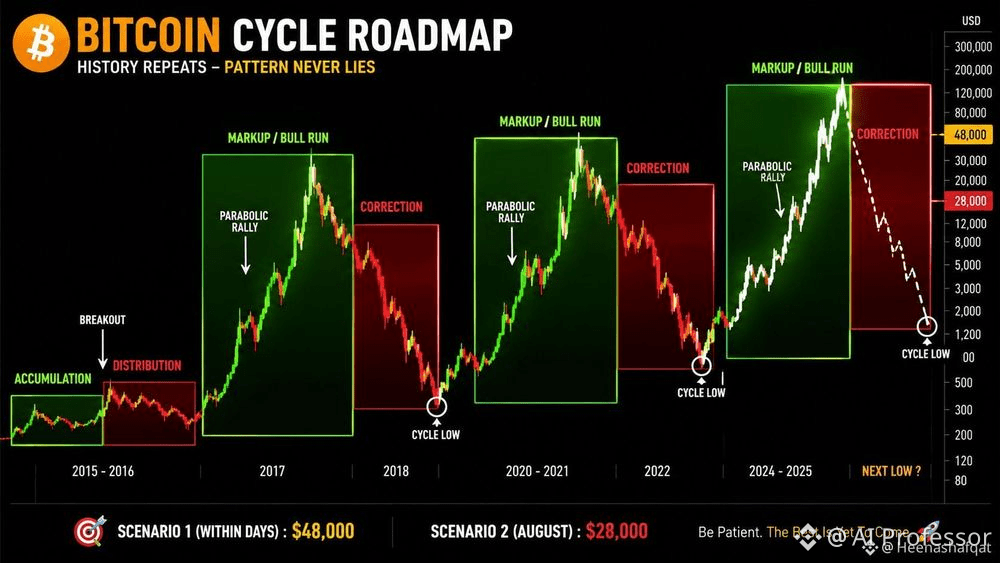
🚨 The pattern looks familiar.
Bitcoin is starting to mirror the behavior seen during the 2017 and 2021 cycles, and the market structure continues to follow the path I've been tracking.
While many investors remain convinced that the rally has plenty of room left, I believe we may be approaching the final stages of this phase.
📉 Scenario 1 (Near Term): BTC retreats toward $48,000
📉 Scenario 2 (August Outlook): BTC revisits the $28,000 region
Markets often move against the crowd. When most participants become comfortable with one direction, a sharp move the other way can catch everyone off guard.
⚠️ Right now, the focus is on higher prices, but I'm paying close attention to the downside risk that many seem to be ignoring.
💭 What if the next major move isn't another breakout... but a significant correction before the next bull leg begins?
$BTC $XRP
🔥 Do you have a plan if the market takes an unexpected turn?
#Bitcoin #BTC #Crypto #MarketCycle #Bearish #Trading #CryptoMarket
🚨 The pattern looks familiar.
Bitcoin is starting to mirror the behavior seen during the 2017 and 2021 cycles, and the market structure continues to follow the path I've been tracking.
While many investors remain convinced that the rally has plenty of room left, I believe we may be approaching the final stages of this phase.
📉 Scenario 1 (Near Term): BTC retreats toward $48,000
📉 Scenario 2 (August Outlook): BTC revisits the $28,000 region
Markets often move against the crowd. When most participants become comfortable with one direction, a sharp move the other way can catch everyone off guard.
⚠️ Right now, the focus is on higher prices, but I'm paying close attention to the downside risk that many seem to be ignoring.
💭 What if the next major move isn't another breakout... but a significant correction before the next bull leg begins?
$BTC $XRP
🔥 Do you have a plan if the market takes an unexpected turn?
#Bitcoin #BTC #Crypto #MarketCycle #Bearish #Trading #CryptoMarket
Bitcoin is starting to mirror the behavior seen during the 2017 and 2021 cycles, and the market structure continues to follow the path I've been tracking.
While many investors remain convinced that the rally has plenty of room left, I believe we may be approaching the final stages of this phase.
📉 Scenario 1 (Near Term): BTC retreats toward $48,000
📉 Scenario 2 (August Outlook): BTC revisits the $28,000 region
Markets often move against the crowd. When most participants become comfortable with one direction, a sharp move the other way can catch everyone off guard.
⚠️ Right now, the focus is on higher prices, but I'm paying close attention to the downside risk that many seem to be ignoring.
💭 What if the next major move isn't another breakout... but a significant correction before the next bull leg begins?
$BTC $XRP
🔥 Do you have a plan if the market takes an unexpected turn?
#Bitcoin #BTC #Crypto #MarketCycle #Bearish #Trading #CryptoMarket
230

·
--
WHEN $BTC STRENGTHENS, ALTCOINS FOLLOW 🔥
Capital rotation from Bitcoin into altcoins is a recurring market pattern. History shows that by the time social media catches up with breakout stories, the biggest moves have already happened. Smart money builds positions during quiet accumulation phases, not after prices have surged.
Liquidity flows where attention hasn't yet peaked. The next alt season may not mirror past cycles, but the structural setup remains the same — patience and preparation typically outperform chasing hype. Are you positioning before the crowd arrives or waiting for confirmation?
Not financial advice. Always manage your risk.
#BTC #AltSeason #MarketCycle #Crypto
🔥
WHEN $BTC STRENGTHENS, ALTCOINS FOLLOW 🔥
Capital rotation from Bitcoin into altcoins is a recurring market pattern. History shows that by the time social media catches up with breakout stories, the biggest moves have already happened. Smart money builds positions during quiet accumulation phases, not after prices have surged.
Liquidity flows where attention hasn't yet peaked. The next alt season may not mirror past cycles, but the structural setup remains the same — patience and preparation typically outperform chasing hype. Are you positioning before the crowd arrives or waiting for confirmation?
Not financial advice. Always manage your risk.
#BTC #AltSeason #MarketCycle #Crypto
🔥
Capital rotation from Bitcoin into altcoins is a recurring market pattern. History shows that by the time social media catches up with breakout stories, the biggest moves have already happened. Smart money builds positions during quiet accumulation phases, not after prices have surged.
Liquidity flows where attention hasn't yet peaked. The next alt season may not mirror past cycles, but the structural setup remains the same — patience and preparation typically outperform chasing hype. Are you positioning before the crowd arrives or waiting for confirmation?
Not financial advice. Always manage your risk.
#BTC #AltSeason #MarketCycle #Crypto
🔥
29

·
--
🚨 Bitcoin Is Following the Same Cycle Structure as 2017 & 2021
$BITCOIN is now mirroring the patterns seen in previous market cycles. The price action continues to follow the roadmap I’ve been tracking, and so far, the structure remains intact.
📉 The bull trap appears to be complete, and the next major move could be a deep correction before a new bull market begins.
🔍 Possible Scenarios:
📌 Scenario 1: → $BTC drops to $48,000 within the coming days.
📌 Scenario 2: → BTC continues lower and reaches $28,000 by August, creating the ultimate capitulation event before the next major rally.
History doesn’t repeat exactly, but it often rhymes. If this cycle continues to follow the same pattern, the biggest opportunities may come when fear is at its highest.
⚠️ Are you actually prepared if Bitcoin drops to $28,000? #Bitcoin #BTC #Crypto #Trading #MarketCycle
🚨 Bitcoin Is Following the Same Cycle Structure as 2017 & 2021
$BITCOIN is now mirroring the patterns seen in previous market cycles. The price action continues to follow the roadmap I’ve been tracking, and so far, the structure remains intact.
📉 The bull trap appears to be complete, and the next major move could be a deep correction before a new bull market begins.
🔍 Possible Scenarios:
📌 Scenario 1: → $BTC drops to $48,000 within the coming days.
📌 Scenario 2: → BTC continues lower and reaches $28,000 by August, creating the ultimate capitulation event before the next major rally.
History doesn’t repeat exactly, but it often rhymes. If this cycle continues to follow the same pattern, the biggest opportunities may come when fear is at its highest.
⚠️ Are you actually prepared if Bitcoin drops to $28,000? #Bitcoin #BTC #Crypto #Trading #MarketCycle
$BITCOIN is now mirroring the patterns seen in previous market cycles. The price action continues to follow the roadmap I’ve been tracking, and so far, the structure remains intact.
📉 The bull trap appears to be complete, and the next major move could be a deep correction before a new bull market begins.
🔍 Possible Scenarios:
📌 Scenario 1: → $BTC drops to $48,000 within the coming days.
📌 Scenario 2: → BTC continues lower and reaches $28,000 by August, creating the ultimate capitulation event before the next major rally.
History doesn’t repeat exactly, but it often rhymes. If this cycle continues to follow the same pattern, the biggest opportunities may come when fear is at its highest.
⚠️ Are you actually prepared if Bitcoin drops to $28,000? #Bitcoin #BTC #Crypto #Trading #MarketCycle
136

·
--
Рост
🧑💻🧑💻🤷♂️
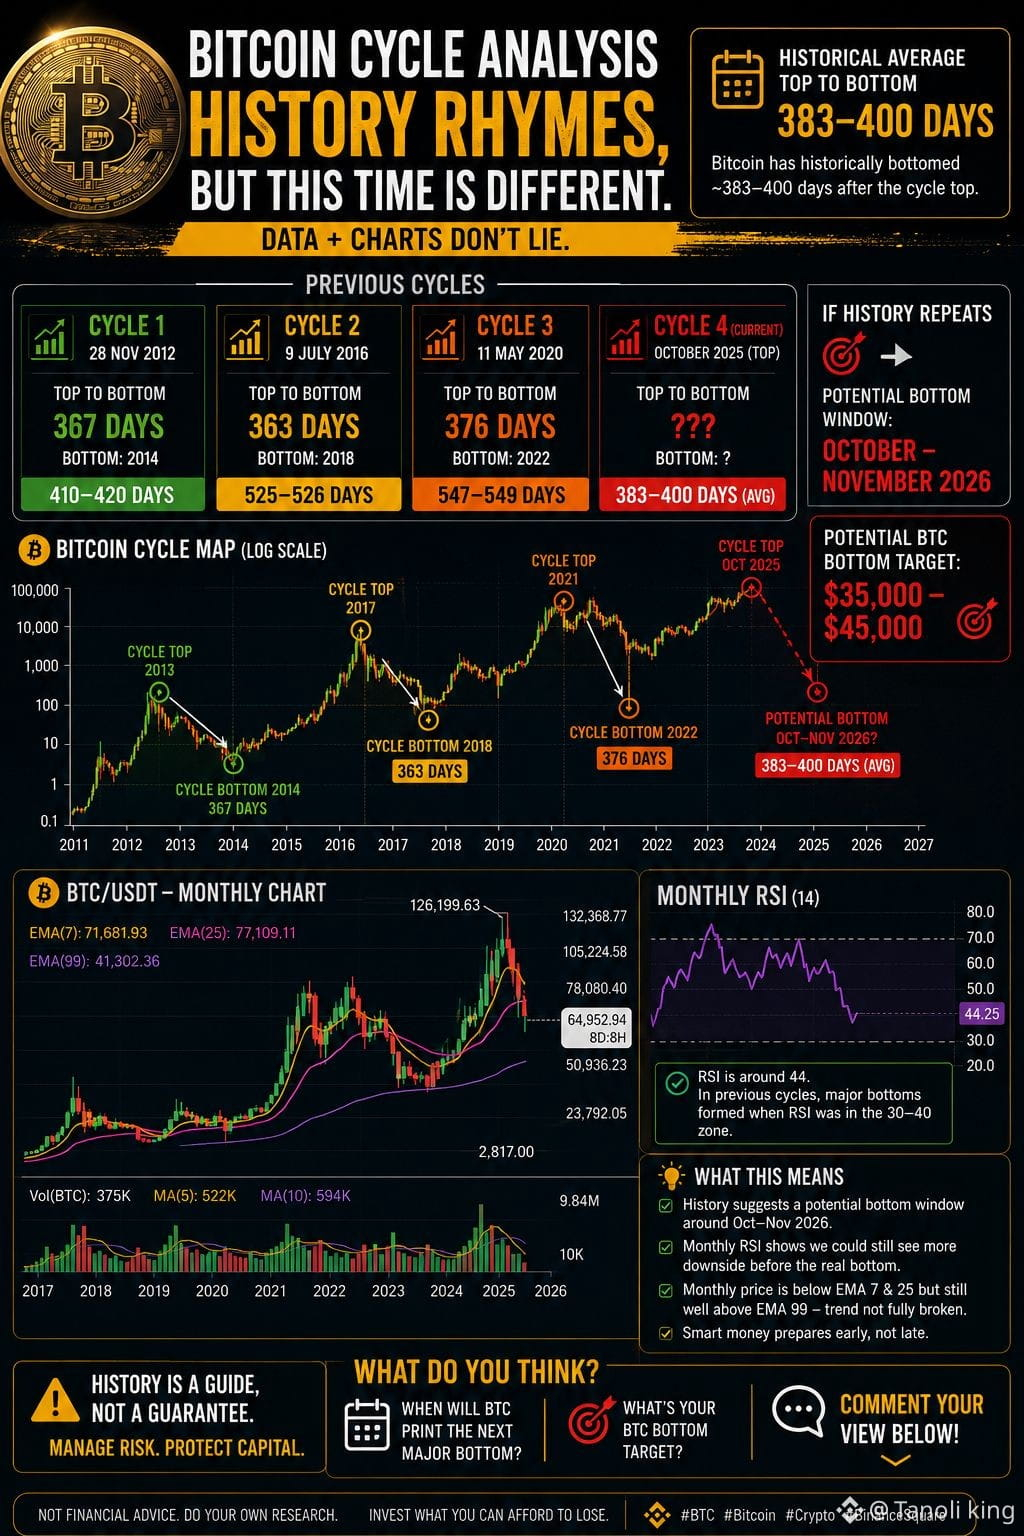
📊 History Doesn't Predict the Future… But It Leaves Clues.
Every Bitcoin cycle has looked different, yet one thing keeps repeating: major corrections create the biggest long-term opportunities.
Based on previous market cycles, #btc has$ historically formed its cycle bottom around 383–400 days after the cycle top. If that pattern holds, the next major bottom could appear sometime in late 2026.
But this cycle isn't like the others.
🚀 Spot Bitcoin ETFs
🏦 Institutional capital
🌍 Global adoption
💰 Growing long-term demand
These factors could shorten the correction, reduce the downside, or even shift the timeline completely.
That's why I'm not trying to catch the exact bottom—I’m preparing for every scenario. Smart investors don't chase hype; they build positions when fear is at its highest.
⚠️ History is a guide, not a guarantee. Risk management will always be more important than any prediction.
Now it's your turn: 📅 When do you think Bitcoin will print its next major bottom? 💵 What's your BTC bottom target?
Let's hear your thoughts in the comments! 👇
#BinanceSquar #CryptoMarke #MarketCycle #DCA #Investing $BTC $LINK $NVDAB
{spot}(BTCUSDT)
🧑💻🧑💻🤷♂️
📊 History Doesn't Predict the Future… But It Leaves Clues.
Every Bitcoin cycle has looked different, yet one thing keeps repeating: major corrections create the biggest long-term opportunities.
Based on previous market cycles, #btc has$ historically formed its cycle bottom around 383–400 days after the cycle top. If that pattern holds, the next major bottom could appear sometime in late 2026.
But this cycle isn't like the others.
🚀 Spot Bitcoin ETFs
🏦 Institutional capital
🌍 Global adoption
💰 Growing long-term demand
These factors could shorten the correction, reduce the downside, or even shift the timeline completely.
That's why I'm not trying to catch the exact bottom—I’m preparing for every scenario. Smart investors don't chase hype; they build positions when fear is at its highest.
⚠️ History is a guide, not a guarantee. Risk management will always be more important than any prediction.
Now it's your turn: 📅 When do you think Bitcoin will print its next major bottom? 💵 What's your BTC bottom target?
Let's hear your thoughts in the comments! 👇
#BinanceSquar #CryptoMarke #MarketCycle #DCA #Investing $BTC $LINK $NVDAB
📊 History Doesn't Predict the Future… But It Leaves Clues.
Every Bitcoin cycle has looked different, yet one thing keeps repeating: major corrections create the biggest long-term opportunities.
Based on previous market cycles, #btc has$ historically formed its cycle bottom around 383–400 days after the cycle top. If that pattern holds, the next major bottom could appear sometime in late 2026.
But this cycle isn't like the others.
🚀 Spot Bitcoin ETFs
🏦 Institutional capital
🌍 Global adoption
💰 Growing long-term demand
These factors could shorten the correction, reduce the downside, or even shift the timeline completely.
That's why I'm not trying to catch the exact bottom—I’m preparing for every scenario. Smart investors don't chase hype; they build positions when fear is at its highest.
⚠️ History is a guide, not a guarantee. Risk management will always be more important than any prediction.
Now it's your turn: 📅 When do you think Bitcoin will print its next major bottom? 💵 What's your BTC bottom target?
Let's hear your thoughts in the comments! 👇
#BinanceSquar #CryptoMarke #MarketCycle #DCA #Investing $BTC $LINK $NVDAB
98
·
--
BTC Dominance Is the Cycle Clock Most Traders Ignore
Bitcoin dominance — BTC's share of total crypto market cap — is one of the most underrated macro signals in this space. When dominance is rising, capital is consolidating into $BTC: a defensive posture, often signaling uncertainty or early cycle accumulation. When dominance peaks and rolls over, it historically marks the start of broad capital rotation into $ETH, large-cap altcoins, and eventually smaller caps.
The mistake most traders make is waiting for confirmation before rotating. By the time dominance has visibly broken down, the early Ethereum and large-cap altcoin moves are already 20-30% in.
Right now, the pattern is familiar: Bitcoin has led the recovery, dominance has climbed, but the rate of change is flattening. ETH/BTC is showing early signs of compression relief. $SOL is absorbing steady inflows without breaking its accumulation range.
This doesn't mean the rotation is imminent — timing is always the hardest part. But the structure is setting up. The smart approach: keep a BTC core, build selective exposure in high-quality L1s with real usage metrics, and watch ETH/BTC as your leading indicator rather than price alone.
Dominance doesn't lie. Learn to read the clock.
$BTC $ETH $SOL
#Bitcoin #CryptoMarket #MarketCycle #AltcoinSeason #BinanceSquare
BTC Dominance Is the Cycle Clock Most Traders Ignore
Bitcoin dominance — BTC's share of total crypto market cap — is one of the most underrated macro signals in this space. When dominance is rising, capital is consolidating into $BTC : a defensive posture, often signaling uncertainty or early cycle accumulation. When dominance peaks and rolls over, it historically marks the start of broad capital rotation into $ETH , large-cap altcoins, and eventually smaller caps.
The mistake most traders make is waiting for confirmation before rotating. By the time dominance has visibly broken down, the early Ethereum and large-cap altcoin moves are already 20-30% in.
Right now, the pattern is familiar: Bitcoin has led the recovery, dominance has climbed, but the rate of change is flattening. ETH/BTC is showing early signs of compression relief. $SOL is absorbing steady inflows without breaking its accumulation range.
This doesn't mean the rotation is imminent — timing is always the hardest part. But the structure is setting up. The smart approach: keep a BTC core, build selective exposure in high-quality L1s with real usage metrics, and watch ETH/BTC as your leading indicator rather than price alone.
Dominance doesn't lie. Learn to read the clock.
$BTC $ETH $SOL
#Bitcoin #CryptoMarket #MarketCycle #AltcoinSeason #BinanceSquare
Bitcoin dominance — BTC's share of total crypto market cap — is one of the most underrated macro signals in this space. When dominance is rising, capital is consolidating into $BTC : a defensive posture, often signaling uncertainty or early cycle accumulation. When dominance peaks and rolls over, it historically marks the start of broad capital rotation into $ETH , large-cap altcoins, and eventually smaller caps.
The mistake most traders make is waiting for confirmation before rotating. By the time dominance has visibly broken down, the early Ethereum and large-cap altcoin moves are already 20-30% in.
Right now, the pattern is familiar: Bitcoin has led the recovery, dominance has climbed, but the rate of change is flattening. ETH/BTC is showing early signs of compression relief. $SOL is absorbing steady inflows without breaking its accumulation range.
This doesn't mean the rotation is imminent — timing is always the hardest part. But the structure is setting up. The smart approach: keep a BTC core, build selective exposure in high-quality L1s with real usage metrics, and watch ETH/BTC as your leading indicator rather than price alone.
Dominance doesn't lie. Learn to read the clock.
$BTC $ETH $SOL
#Bitcoin #CryptoMarket #MarketCycle #AltcoinSeason #BinanceSquare
45
·
--
BTC Dominance Is the Market Cycle Clock Nobody Checks Closely Enough
Bitcoin dominance — the share of total crypto market cap held by $BTC — is one of the most overlooked macro signals in the space. Yet history keeps proving it reliable.
Here is the pattern: early in a bull cycle, capital flows into BTC first. Dominance rises. Newcomers pile in through the asset they recognize. Liquidity concentrates. This phase often lasts longer than anyone expects — and impatient altcoin holders get wrecked waiting for their tokens to move.
Then something shifts. BTC dominance peaks and starts a multi-month decline. Capital doesn’t leave crypto — it rotates. $ETH typically catches the first wave, given its role as the foundational layer for most DeFi and NFT activity. Then large-caps like $SOL absorb the next tranche, driven by ecosystem narratives and developer momentum. Smaller alts follow last — if at all.
What to watch right now:
– BTC dominance stalling at or below a prior cycle high is a soft rotation signal
– ETH/BTC ratio trend reversal often precedes broader altcoin expansion
– Stablecoin supply growth (new dry powder entering the market) confirms the move is real, not just reshuffling
The mistake most make is chasing alts before dominance peaks. The market cycle clock tells you when to rotate — not just whether to.
Patience plus timing beats conviction plus noise.
$BTC $ETH $SOL
#Bitcoin #MarketCycle #CryptoStrategy #BTCDominance #AltcoinSeason
BTC Dominance Is the Market Cycle Clock Nobody Checks Closely Enough
Bitcoin dominance — the share of total crypto market cap held by $BTC — is one of the most overlooked macro signals in the space. Yet history keeps proving it reliable.
Here is the pattern: early in a bull cycle, capital flows into BTC first. Dominance rises. Newcomers pile in through the asset they recognize. Liquidity concentrates. This phase often lasts longer than anyone expects — and impatient altcoin holders get wrecked waiting for their tokens to move.
Then something shifts. BTC dominance peaks and starts a multi-month decline. Capital doesn’t leave crypto — it rotates. $ETH typically catches the first wave, given its role as the foundational layer for most DeFi and NFT activity. Then large-caps like $SOL absorb the next tranche, driven by ecosystem narratives and developer momentum. Smaller alts follow last — if at all.
What to watch right now:
– BTC dominance stalling at or below a prior cycle high is a soft rotation signal
– ETH/BTC ratio trend reversal often precedes broader altcoin expansion
– Stablecoin supply growth (new dry powder entering the market) confirms the move is real, not just reshuffling
The mistake most make is chasing alts before dominance peaks. The market cycle clock tells you when to rotate — not just whether to.
Patience plus timing beats conviction plus noise.
$BTC $ETH $SOL
#Bitcoin #MarketCycle #CryptoStrategy #BTCDominance #AltcoinSeason
Bitcoin dominance — the share of total crypto market cap held by $BTC — is one of the most overlooked macro signals in the space. Yet history keeps proving it reliable.
Here is the pattern: early in a bull cycle, capital flows into BTC first. Dominance rises. Newcomers pile in through the asset they recognize. Liquidity concentrates. This phase often lasts longer than anyone expects — and impatient altcoin holders get wrecked waiting for their tokens to move.
Then something shifts. BTC dominance peaks and starts a multi-month decline. Capital doesn’t leave crypto — it rotates. $ETH typically catches the first wave, given its role as the foundational layer for most DeFi and NFT activity. Then large-caps like $SOL absorb the next tranche, driven by ecosystem narratives and developer momentum. Smaller alts follow last — if at all.
What to watch right now:
– BTC dominance stalling at or below a prior cycle high is a soft rotation signal
– ETH/BTC ratio trend reversal often precedes broader altcoin expansion
– Stablecoin supply growth (new dry powder entering the market) confirms the move is real, not just reshuffling
The mistake most make is chasing alts before dominance peaks. The market cycle clock tells you when to rotate — not just whether to.
Patience plus timing beats conviction plus noise.
$BTC $ETH $SOL
#Bitcoin #MarketCycle #CryptoStrategy #BTCDominance #AltcoinSeason
1
54
·
--
The Shrinking Amplitude Problem
Every crypto cycle, the same narrative appears: "This time is different." But there is one pattern nobody talks about — the amplitude is dying.
Cycle 1 (2011-2013): $BTC went from ~$0.30 to $1,100. A 3,600x move.
Cycle 2 (2013-2017): ~$100 to $19,000. Roughly 190x.
Cycle 3 (2017-2021): ~$3,000 to $69,000. Roughly 23x.
Cycle 4 (2022-2025): ~$15,000 to $109,000. Roughly 7x.
Each cycle compresses. The percentage gains shrink because the base grows, but also because participants front-run the pattern. When everyone knows the halving playbook, the halving stops working the way it used to.
This is not bearish. It is maturation. $BTC is transitioning from venture-scale returns to commodity-scale returns. Every asset does this as it scales — gold went through the same phase transition between the 1970s and 2000s.
The implication for altcoin investors is sharper. If the base asset compresses, altcoin beta to that asset compresses too — but the variance does not. You get the same volatility with less upside. That is a worse risk-reward, not a better one.
$ETH and $SOL are not going to replicate their previous cycle multiples. The question shifts from "which coin does 50x?" to "which protocol captures real revenue while everyone else chases multiples that no longer exist?"
The next cycle winners will not be projects promising 100x. They will be the ones building cash flows that make 3-5x feel inevitable.
#MarketCycle #Bitcoin #CryptoMarket #Investing #Web3
The Shrinking Amplitude Problem
Every crypto cycle, the same narrative appears: "This time is different." But there is one pattern nobody talks about — the amplitude is dying.
Cycle 1 (2011-2013): $BTC went from ~$0.30 to $1,100. A 3,600x move.
Cycle 2 (2013-2017): ~$100 to $19,000. Roughly 190x.
Cycle 3 (2017-2021): ~$3,000 to $69,000. Roughly 23x.
Cycle 4 (2022-2025): ~$15,000 to $109,000. Roughly 7x.
Each cycle compresses. The percentage gains shrink because the base grows, but also because participants front-run the pattern. When everyone knows the halving playbook, the halving stops working the way it used to.
This is not bearish. It is maturation. $BTC is transitioning from venture-scale returns to commodity-scale returns. Every asset does this as it scales — gold went through the same phase transition between the 1970s and 2000s.
The implication for altcoin investors is sharper. If the base asset compresses, altcoin beta to that asset compresses too — but the variance does not. You get the same volatility with less upside. That is a worse risk-reward, not a better one.
$ETH and $SOL are not going to replicate their previous cycle multiples. The question shifts from "which coin does 50x?" to "which protocol captures real revenue while everyone else chases multiples that no longer exist?"
The next cycle winners will not be projects promising 100x. They will be the ones building cash flows that make 3-5x feel inevitable.
#MarketCycle #Bitcoin #CryptoMarket #Investing #Web3
Every crypto cycle, the same narrative appears: "This time is different." But there is one pattern nobody talks about — the amplitude is dying.
Cycle 1 (2011-2013): $BTC went from ~$0.30 to $1,100. A 3,600x move.
Cycle 2 (2013-2017): ~$100 to $19,000. Roughly 190x.
Cycle 3 (2017-2021): ~$3,000 to $69,000. Roughly 23x.
Cycle 4 (2022-2025): ~$15,000 to $109,000. Roughly 7x.
Each cycle compresses. The percentage gains shrink because the base grows, but also because participants front-run the pattern. When everyone knows the halving playbook, the halving stops working the way it used to.
This is not bearish. It is maturation. $BTC is transitioning from venture-scale returns to commodity-scale returns. Every asset does this as it scales — gold went through the same phase transition between the 1970s and 2000s.
The implication for altcoin investors is sharper. If the base asset compresses, altcoin beta to that asset compresses too — but the variance does not. You get the same volatility with less upside. That is a worse risk-reward, not a better one.
$ETH and $SOL are not going to replicate their previous cycle multiples. The question shifts from "which coin does 50x?" to "which protocol captures real revenue while everyone else chases multiples that no longer exist?"
The next cycle winners will not be projects promising 100x. They will be the ones building cash flows that make 3-5x feel inevitable.
#MarketCycle #Bitcoin #CryptoMarket #Investing #Web3
109
Войдите, чтобы посмотреть больше материала
Присоединяйтесь к пользователям криптовалют по всему миру на Binance Square
⚡️ Получайте новейшую и полезную информацию о криптоактивах.
💬 Нам доверяет крупнейшая в мире криптобиржа.
👍 Получите достоверные аналитические данные от верифицированных создателей контента.
Эл. почта/номер телефона
В тренде
1
#BinanceReopensWithdrawalsForHYPE&APT
Просмотров: 92,819
994 обсуждают
2
#SouthKoreaDraftLawTargets15To20%ShareholderCap
Просмотров: 90,768
660 обсуждают
3
#TradFiForBeginners
Просмотров: 185,267
1,862 обсуждают
4
#KeplrAdvisesSocialLoginUsersToTransferAssets
Просмотров: 48,006
526 обсуждают
5
#TetherPlans€28.8MForJuventusCapitalIncrease
Просмотров: 35,816
406 обсуждают
6
#JobsReportRaisesHikeOdds
Просмотров: 873,696
4,459 обсуждают
7
#CPITestsDecemberRateOutlook
Просмотров: 358,863
1,896 обсуждают
8
#US Data Center Rules May Constrain AI Expansion
Просмотров: 131,822
260 обсуждают
9
#ARKPlans14ThematicETFsCoveringAIAndTokenizedMarkets
Просмотров: 9,688
90 обсуждают
10
#WillAnthropicListOnTime
Просмотров: 274,940
1,885 обсуждают