
#bitcoinclosesabove50weekmafor7thstraightweek
bitcoinclosesabove50weekmafor7thstraightweek
Просмотров: 24,411
215 обсуждают
Популярные
Новые

·
--
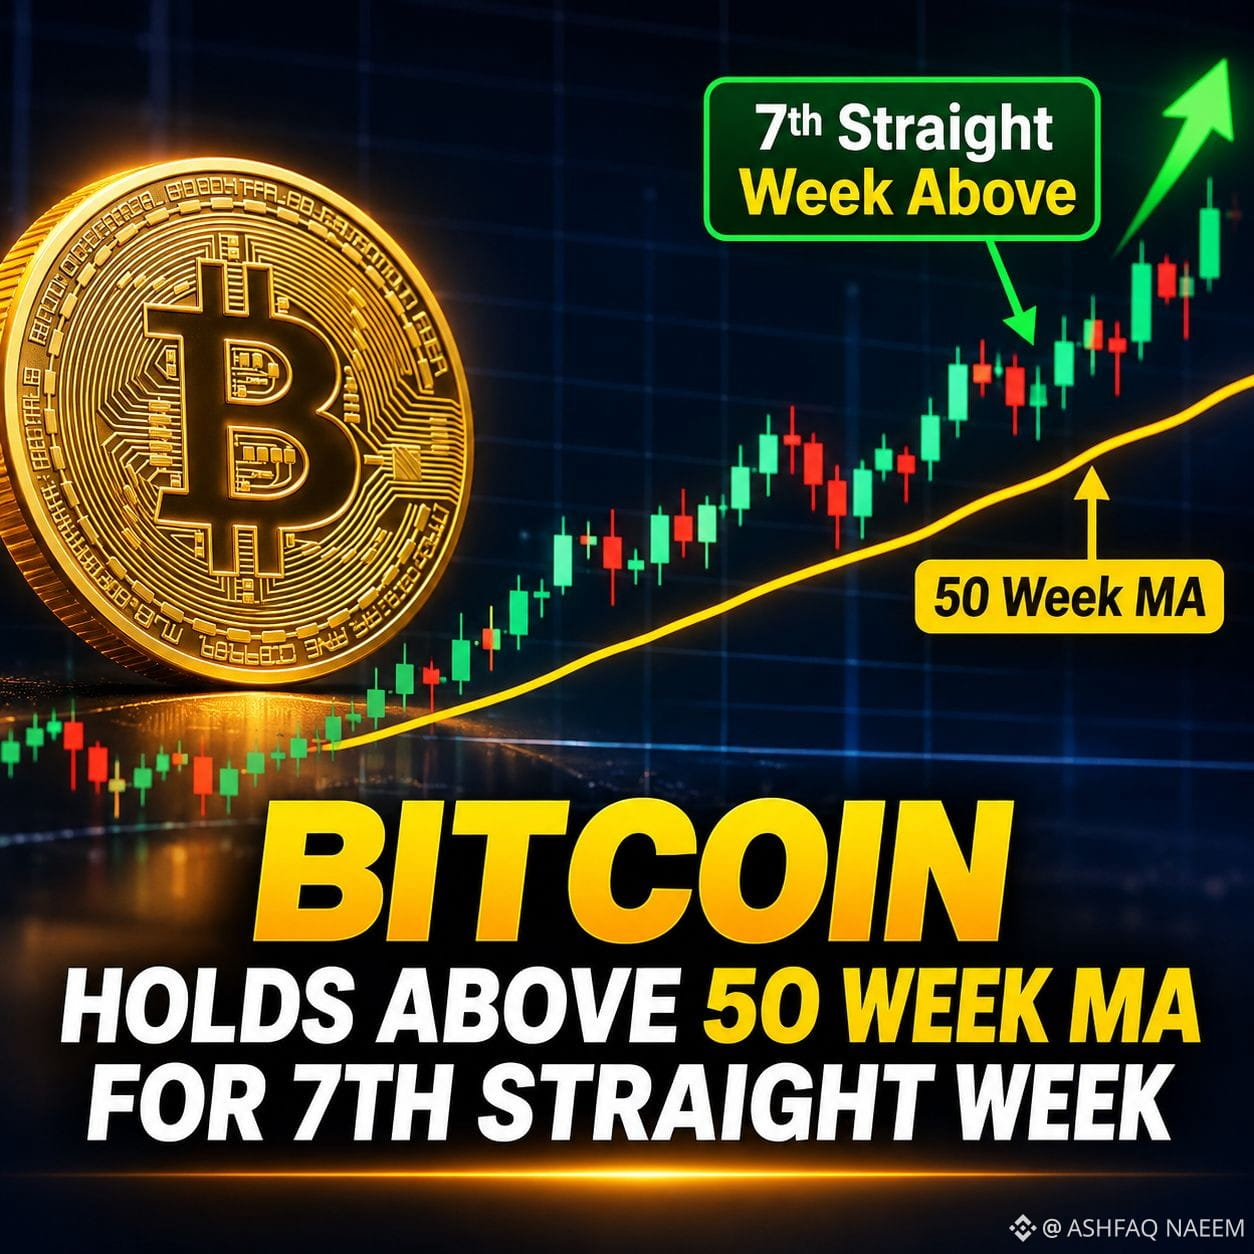
The key technical signal is Bitcoin’s ability to hold above its 50-week moving average (50W MA) for seven consecutive weekly closes.
The 50-week MA is a long-term trend indicator that helps traders assess whether Bitcoin’s broader market structure is bullish or bearish. It is often watched as a dynamic support level during market pullbacks.
Why the 7-week streak matters:
Bullish signal: BTC has consistently closed above its long-term trend benchmark, suggesting buyers are defending the recovery.
Support confirmation: The moving average may be shifting from
resistance into support.
Key risk: A weekly close below the 50W MA could weaken the bullish structure and increase the risk of another correction.
The important distinction is that seven consecutive closes above the average show sustained strength, but they do not guarantee a new bull market. Traders should also monitor higher lows, trading volume, and whether Bitcoin can hold the average during a pullback.
#bitcoinclosesabove50weekmafor7thstraightweek $BTC
{spot}(BTCUSDT)
The key technical signal is Bitcoin’s ability to hold above its 50-week moving average (50W MA) for seven consecutive weekly closes.
The 50-week MA is a long-term trend indicator that helps traders assess whether Bitcoin’s broader market structure is bullish or bearish. It is often watched as a dynamic support level during market pullbacks.
Why the 7-week streak matters:
Bullish signal: BTC has consistently closed above its long-term trend benchmark, suggesting buyers are defending the recovery.
Support confirmation: The moving average may be shifting from
resistance into support.
Key risk: A weekly close below the 50W MA could weaken the bullish structure and increase the risk of another correction.
The important distinction is that seven consecutive closes above the average show sustained strength, but they do not guarantee a new bull market. Traders should also monitor higher lows, trading volume, and whether Bitcoin can hold the average during a pullback.
#bitcoinclosesabove50weekmafor7thstraightweek $BTC
The 50-week MA is a long-term trend indicator that helps traders assess whether Bitcoin’s broader market structure is bullish or bearish. It is often watched as a dynamic support level during market pullbacks.
Why the 7-week streak matters:
Bullish signal: BTC has consistently closed above its long-term trend benchmark, suggesting buyers are defending the recovery.
Support confirmation: The moving average may be shifting from
resistance into support.
Key risk: A weekly close below the 50W MA could weaken the bullish structure and increase the risk of another correction.
The important distinction is that seven consecutive closes above the average show sustained strength, but they do not guarantee a new bull market. Traders should also monitor higher lows, trading volume, and whether Bitcoin can hold the average during a pullback.
#bitcoinclosesabove50weekmafor7thstraightweek $BTC
Phương linh BTC:
BTC cho thấy đáy rồi giờ loanh qoanh mốc này vài tháng rồi từ từ lên ath mới vào 2029 là 350k
1
1
2.8k

·
--
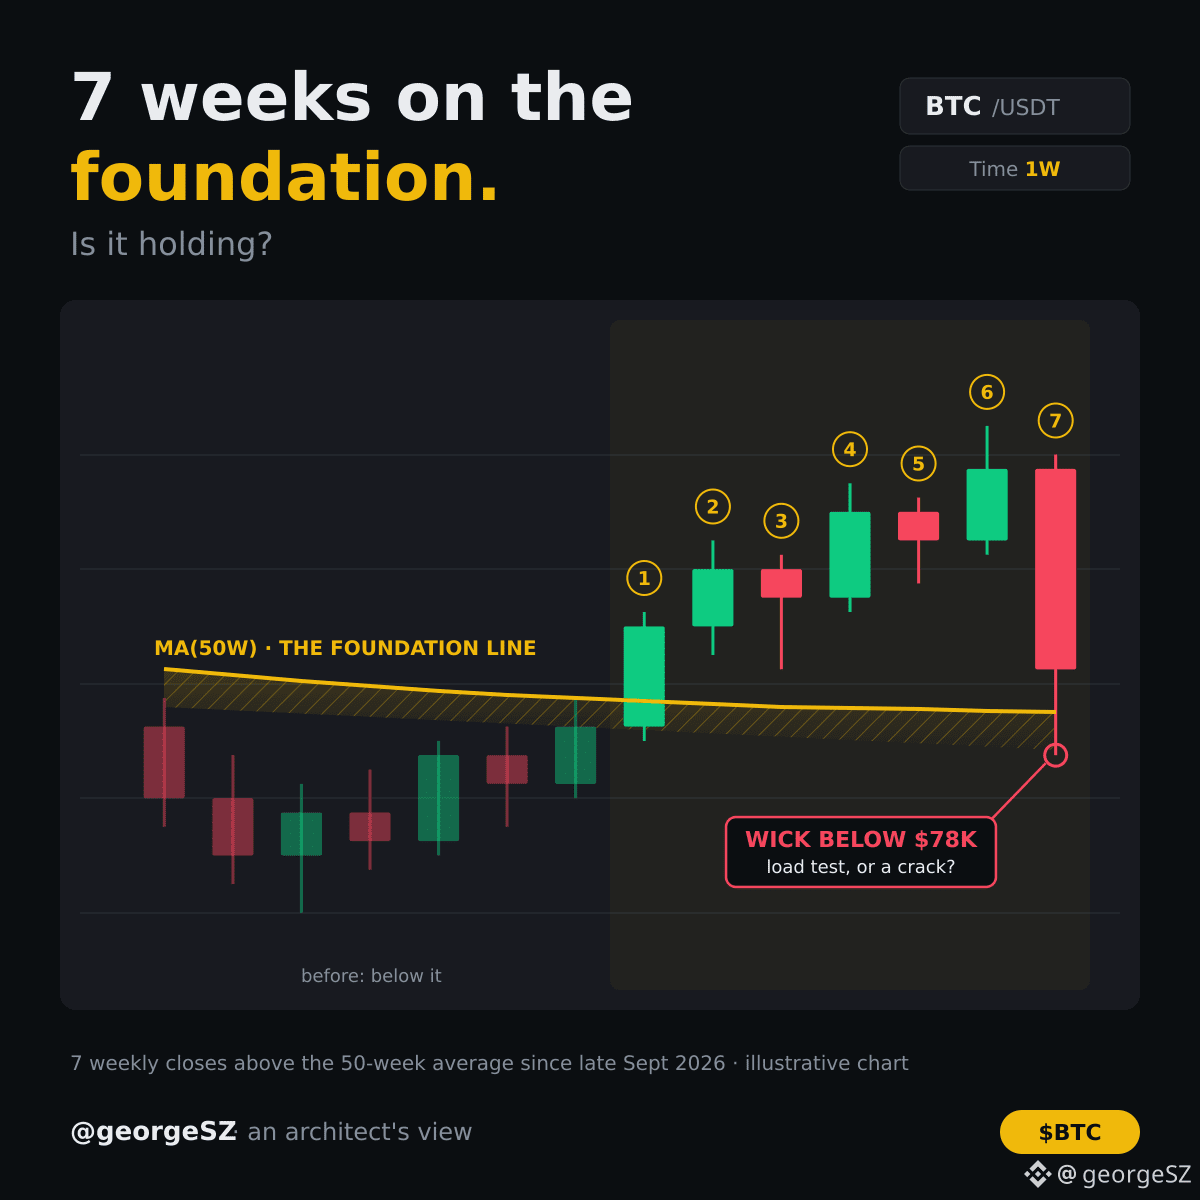
#bitcoinclosesabove50weekmafor7thstraightweek Bitcoin just closed above its 50-week average for the 7th week in a row. In the same week, it dropped below $78K. So which one matters? In construction, we don't judge a foundation by one bad day. We judge it by how it settles over time. The 50-week average is roughly Bitcoin's foundation line: the average weekly close of the past year. BTC reclaimed it in late September for the first time since November 2025, and has held above it every week since. A dip below $78K tests the building. It doesn't prove it's cracking. A weekly close below the foundation line would. So be honest: is this 7-week hold a new floor, or are we sitting on a line that's about to give way? $BTC #Write2Earn #bitcoin #
#bitcoinclosesabove50weekmafor7thstraightweek Bitcoin just closed above its 50-week average for the 7th week in a row. In the same week, it dropped below $78K. So which one matters? In construction, we don't judge a foundation by one bad day. We judge it by how it settles over time. The 50-week average is roughly Bitcoin's foundation line: the average weekly close of the past year. BTC reclaimed it in late September for the first time since November 2025, and has held above it every week since. A dip below $78K tests the building. It doesn't prove it's cracking. A weekly close below the foundation line would. So be honest: is this 7-week hold a new floor, or are we sitting on a line that's about to give way? $BTC #Write2Earn #bitcoin #
3
5.4k

·
--
Рост
🚨 A red October. A hack. ETF outflows.
Bitcoin closed its seventh consecutive week above its 50-week moving average.
Is it showing more resilience than market sentiment suggests?
THE MARKET FILE — SEVEN WEEKS AGAINST FEAR
November 2, 2026
📊 THE DATA
On Binance BTC/USDT:
• Weekly close: $78,354.
• 50-week simple moving average: approximately $75,775.
• Distance above the average: roughly 3.4%.
After last week’s shock, that long-term reference remains intact.
🏦 DEMAND NEEDS TO RESPOND
On Friday, October 30, U.S. spot Bitcoin ETFs recorded approximately $643 million in net outflows.
Holding this technical level while capital leaves is constructive. To strengthen the recovery, I want to see demand return.
₿ MY READ
I remain bullish on Bitcoin and interested in accumulating gradually.
These seven weeks support my recovery thesis. The market took a serious hit and still holds above this technical reference.
👀 WHAT I’M WATCHING
• Reclaiming and holding $80,000.
• ETF flows as November begins.
• The weekly close relative to the 50-week moving average.
A close below it would weaken my outlook. Regaining ground alongside capital inflows would strengthen it.
Tomorrow brings the midterms: another test for a market already carrying plenty of headlines.
💬 Would you accumulate while BTC holds this structure, or wait for it to reclaim $80,000?
$BTC
{future}(BTCUSDT)
#BitcoinClosesAbove50WeekMAFor7thStraightWeek #bitcoin #BTCanalysis
🚨 A red October. A hack. ETF outflows.
Bitcoin closed its seventh consecutive week above its 50-week moving average.
Is it showing more resilience than market sentiment suggests?
THE MARKET FILE — SEVEN WEEKS AGAINST FEAR
November 2, 2026
📊 THE DATA
On Binance BTC/USDT:
• Weekly close: $78,354.
• 50-week simple moving average: approximately $75,775.
• Distance above the average: roughly 3.4%.
After last week’s shock, that long-term reference remains intact.
🏦 DEMAND NEEDS TO RESPOND
On Friday, October 30, U.S. spot Bitcoin ETFs recorded approximately $643 million in net outflows.
Holding this technical level while capital leaves is constructive. To strengthen the recovery, I want to see demand return.
₿ MY READ
I remain bullish on Bitcoin and interested in accumulating gradually.
These seven weeks support my recovery thesis. The market took a serious hit and still holds above this technical reference.
👀 WHAT I’M WATCHING
• Reclaiming and holding $80,000.
• ETF flows as November begins.
• The weekly close relative to the 50-week moving average.
A close below it would weaken my outlook. Regaining ground alongside capital inflows would strengthen it.
Tomorrow brings the midterms: another test for a market already carrying plenty of headlines.
💬 Would you accumulate while BTC holds this structure, or wait for it to reclaim $80,000?
$BTC
#BitcoinClosesAbove50WeekMAFor7thStraightWeek #bitcoin #BTCanalysis
Bitcoin closed its seventh consecutive week above its 50-week moving average.
Is it showing more resilience than market sentiment suggests?
THE MARKET FILE — SEVEN WEEKS AGAINST FEAR
November 2, 2026
📊 THE DATA
On Binance BTC/USDT:
• Weekly close: $78,354.
• 50-week simple moving average: approximately $75,775.
• Distance above the average: roughly 3.4%.
After last week’s shock, that long-term reference remains intact.
🏦 DEMAND NEEDS TO RESPOND
On Friday, October 30, U.S. spot Bitcoin ETFs recorded approximately $643 million in net outflows.
Holding this technical level while capital leaves is constructive. To strengthen the recovery, I want to see demand return.
₿ MY READ
I remain bullish on Bitcoin and interested in accumulating gradually.
These seven weeks support my recovery thesis. The market took a serious hit and still holds above this technical reference.
👀 WHAT I’M WATCHING
• Reclaiming and holding $80,000.
• ETF flows as November begins.
• The weekly close relative to the 50-week moving average.
A close below it would weaken my outlook. Regaining ground alongside capital inflows would strengthen it.
Tomorrow brings the midterms: another test for a market already carrying plenty of headlines.
💬 Would you accumulate while BTC holds this structure, or wait for it to reclaim $80,000?
$BTC
#BitcoinClosesAbove50WeekMAFor7thStraightWeek #bitcoin #BTCanalysis

457

·
--
#bitcoinclosesabove50weekmafor7thstraightweek
Bitcoin’s Bullish Streak: Technical Breakthrough Confirmed with 7th Weekly Close Above 50-Week MA
The Bitcoin market has delivered a definitive bullish signal, solidifying its long-term recovery trajectory. Following the most recent weekly market close, Bitcoin (BTC) has successfully settled above its critical 50-week Moving Average (MA) for the seventh consecutive week. This extended consolidation and hold above a paramount multi-year indicator provides robust confirmation that the market has transitioned out of the prolonged bear phase and is firmly established in a new bullish trend.
Historically, the 50-week MA serves as a crucial line of demarcation for asset managers and long-term institutional investors. Consistently trading above this level significantly shifts the risk-reward profile, encouraging fresh capital inflows from conservative participants who sit on the sidelines during bear markets. The seven-week duration of this breakout filters out potential 'fakeout' signals, establishing the 50-week MA as rock-solid foundational support for subsequent price discovery.
$BTC
Bitcoin closing above its 50-week Moving Average for 7 weeks in a row confirms a strong bullish trend. Here is how to trade it:
Entry Zones (Where to Buy)
Pullback Buy: Buy between $64,000 and $68,000 if the price dips back down to strong support.
Breakout Buy: Buy if the price closes clearly above $72,500.
Target Levels (Where to Take Profit)
Target 1: $74,000 – $76,000
Target 2: $88,000 – $92,000
Target 3: $100,000+
Risk Management (Stop-Loss)
Stop-Loss: Close the trade if Bitcoin drops and closes below $61,000.
Risk/Reward Ratio: Buying at $66,000 with a $61,000 stop-loss and a $90,000 target gives a great 1:5 Risk/Reward ratio (risking $5k to make $24k).
{spot}(BTCUSDT)
#bitcoin #crypto #TechnicalAnalysis #bullish
#bitcoinclosesabove50weekmafor7thstraightweek
Bitcoin’s Bullish Streak: Technical Breakthrough Confirmed with 7th Weekly Close Above 50-Week MA
The Bitcoin market has delivered a definitive bullish signal, solidifying its long-term recovery trajectory. Following the most recent weekly market close, Bitcoin (BTC) has successfully settled above its critical 50-week Moving Average (MA) for the seventh consecutive week. This extended consolidation and hold above a paramount multi-year indicator provides robust confirmation that the market has transitioned out of the prolonged bear phase and is firmly established in a new bullish trend.
Historically, the 50-week MA serves as a crucial line of demarcation for asset managers and long-term institutional investors. Consistently trading above this level significantly shifts the risk-reward profile, encouraging fresh capital inflows from conservative participants who sit on the sidelines during bear markets. The seven-week duration of this breakout filters out potential 'fakeout' signals, establishing the 50-week MA as rock-solid foundational support for subsequent price discovery.
$BTC
Bitcoin closing above its 50-week Moving Average for 7 weeks in a row confirms a strong bullish trend. Here is how to trade it:
Entry Zones (Where to Buy)
Pullback Buy: Buy between $64,000 and $68,000 if the price dips back down to strong support.
Breakout Buy: Buy if the price closes clearly above $72,500.
Target Levels (Where to Take Profit)
Target 1: $74,000 – $76,000
Target 2: $88,000 – $92,000
Target 3: $100,000+
Risk Management (Stop-Loss)
Stop-Loss: Close the trade if Bitcoin drops and closes below $61,000.
Risk/Reward Ratio: Buying at $66,000 with a $61,000 stop-loss and a $90,000 target gives a great 1:5 Risk/Reward ratio (risking $5k to make $24k).
#bitcoin #crypto #TechnicalAnalysis #bullish
Bitcoin’s Bullish Streak: Technical Breakthrough Confirmed with 7th Weekly Close Above 50-Week MA
The Bitcoin market has delivered a definitive bullish signal, solidifying its long-term recovery trajectory. Following the most recent weekly market close, Bitcoin (BTC) has successfully settled above its critical 50-week Moving Average (MA) for the seventh consecutive week. This extended consolidation and hold above a paramount multi-year indicator provides robust confirmation that the market has transitioned out of the prolonged bear phase and is firmly established in a new bullish trend.
Historically, the 50-week MA serves as a crucial line of demarcation for asset managers and long-term institutional investors. Consistently trading above this level significantly shifts the risk-reward profile, encouraging fresh capital inflows from conservative participants who sit on the sidelines during bear markets. The seven-week duration of this breakout filters out potential 'fakeout' signals, establishing the 50-week MA as rock-solid foundational support for subsequent price discovery.
$BTC
Bitcoin closing above its 50-week Moving Average for 7 weeks in a row confirms a strong bullish trend. Here is how to trade it:
Entry Zones (Where to Buy)
Pullback Buy: Buy between $64,000 and $68,000 if the price dips back down to strong support.
Breakout Buy: Buy if the price closes clearly above $72,500.
Target Levels (Where to Take Profit)
Target 1: $74,000 – $76,000
Target 2: $88,000 – $92,000
Target 3: $100,000+
Risk Management (Stop-Loss)
Stop-Loss: Close the trade if Bitcoin drops and closes below $61,000.
Risk/Reward Ratio: Buying at $66,000 with a $61,000 stop-loss and a $90,000 target gives a great 1:5 Risk/Reward ratio (risking $5k to make $24k).
#bitcoin #crypto #TechnicalAnalysis #bullish
2k

·
--
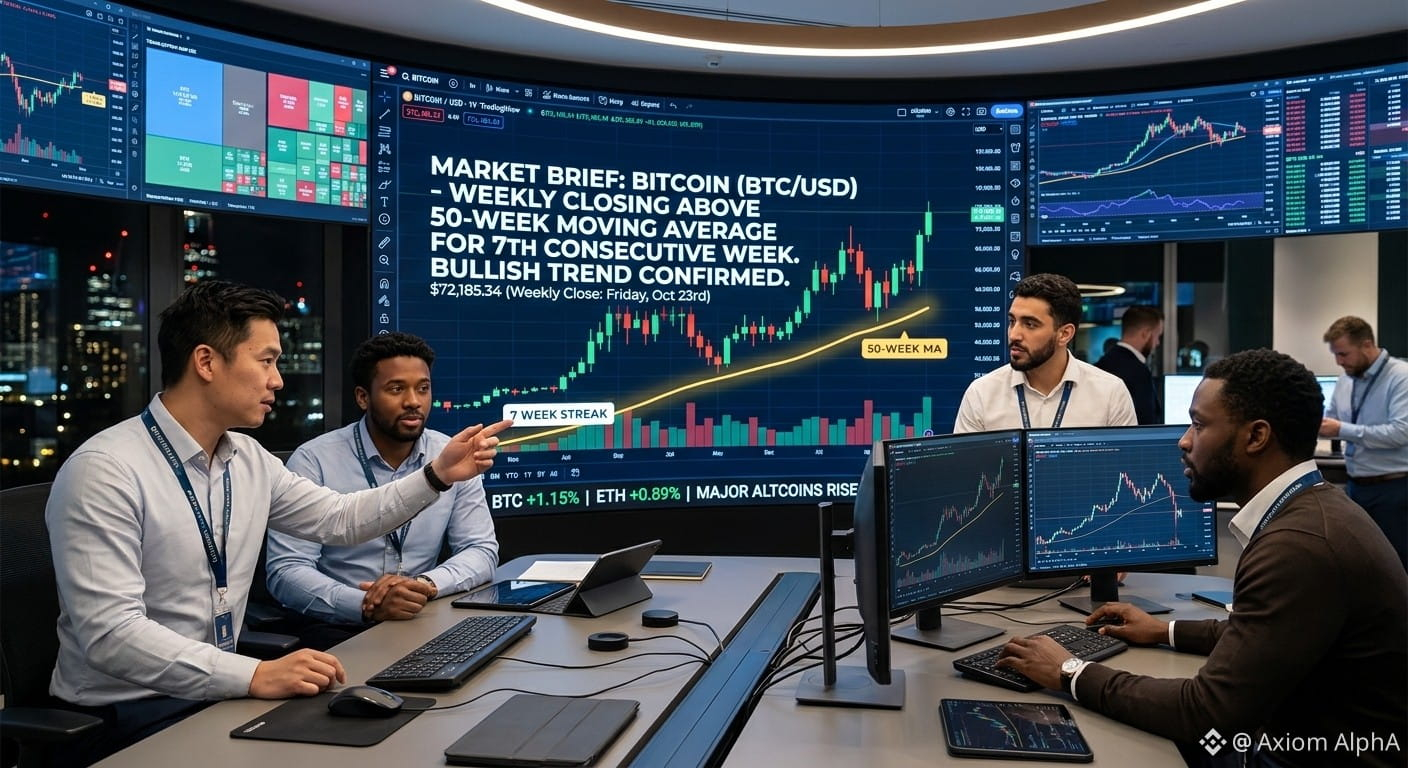
$BTC | Square is trending Bitcoin's seventh straight weekly close above its 50-week moving average. On the desk we never sized off one MA cross, and SatoshiMacro built that discipline into a model. The SatoshiMacro Model's Valuation tier, 25 percent of the composite, tracks the slower 200-Week MA distance alongside Mayer Multiple and Power Law deviation, one of 48 live signals. A streak like this says momentum holds, not where the cycle sits. My read: the composite printed 34.8, Neutral, on 2 November, well under the 85.1 reading at the November 2021 top. It is a classifier, not a forecaster. The ASIC 2 to 1 crypto CFD cap still applies to any AU trader sizing off it.
https://satoshimacro.com/tools/crypto/satoshimacro-model/?utm_source=binance_square&utm_medium=social&utm_campaign=autopilot_trend
#SatoshiMacro #BitcoinClosesAbove50WeekMAFor7thStraightWeek #CycleAnalysis #Bitcoin
$BTC | Square is trending Bitcoin's seventh straight weekly close above its 50-week moving average. On the desk we never sized off one MA cross, and SatoshiMacro built that discipline into a model. The SatoshiMacro Model's Valuation tier, 25 percent of the composite, tracks the slower 200-Week MA distance alongside Mayer Multiple and Power Law deviation, one of 48 live signals. A streak like this says momentum holds, not where the cycle sits. My read: the composite printed 34.8, Neutral, on 2 November, well under the 85.1 reading at the November 2021 top. It is a classifier, not a forecaster. The ASIC 2 to 1 crypto CFD cap still applies to any AU trader sizing off it.
https://satoshimacro.com/tools/crypto/satoshimacro-model/?utm_source=binance_square&utm_medium=social&utm_campaign=autopilot_trend
#SatoshiMacro #BitcoinClosesAbove50WeekMAFor7thStraightWeek #CycleAnalysis #Bitcoin
https://satoshimacro.com/tools/crypto/satoshimacro-model/?utm_source=binance_square&utm_medium=social&utm_campaign=autopilot_trend
#SatoshiMacro #BitcoinClosesAbove50WeekMAFor7thStraightWeek #CycleAnalysis #Bitcoin
60

·
--
$BTC has closed above its 50-week moving average for 7 straight weeks 📈
Traders watch the 50-week MA as a long-term trend line. Holding above it for this long shows the higher-timeframe trend is holding up.
Remember: one indicator is never a guarantee. Combine it with volume and your own risk plan.
Do you use moving averages? Which one? 👇
#BitcoinClosesAbove50WeekMAFor7thStraightWeek #BTC #Bitcoin #BinanceSquare
$BTC has closed above its 50-week moving average for 7 straight weeks 📈
Traders watch the 50-week MA as a long-term trend line. Holding above it for this long shows the higher-timeframe trend is holding up.
Remember: one indicator is never a guarantee. Combine it with volume and your own risk plan.
Do you use moving averages? Which one? 👇
#BitcoinClosesAbove50WeekMAFor7thStraightWeek #BTC #Bitcoin #BinanceSquare
Traders watch the 50-week MA as a long-term trend line. Holding above it for this long shows the higher-timeframe trend is holding up.
Remember: one indicator is never a guarantee. Combine it with volume and your own risk plan.
Do you use moving averages? Which one? 👇
#BitcoinClosesAbove50WeekMAFor7thStraightWeek #BTC #Bitcoin #BinanceSquare
14

·
--
#BitcoinClosesAbove50WeekMAFor7thStraightWeek
📈 Bitcoin Holds Its 50-Week Average for a 7th Week
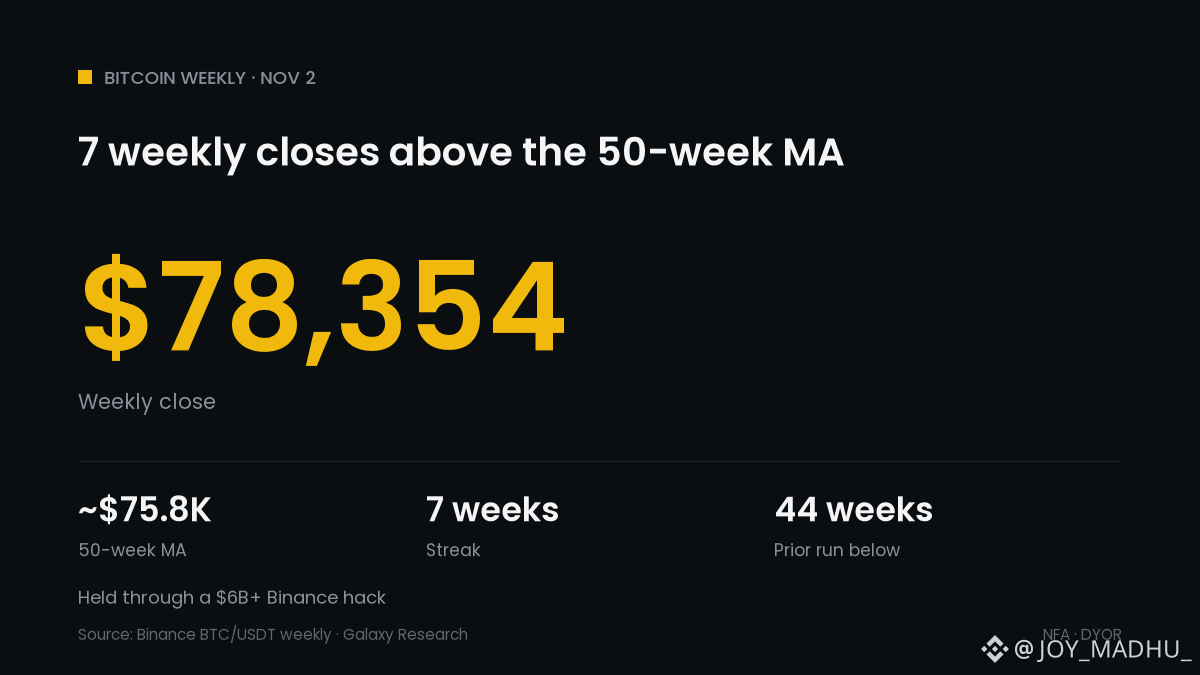
BTC logged a 7th straight weekly close above its 50-week moving average, per Galaxy Research's Alex Thorn.
📅 Week ending Nov 1 closed near $78.2K (Binance BTC/USDT: $78,354)
📊 50-week average sits around $75.8K on Binance weekly data
⚠️ The streak held through a $6B+ hack at Binance
📉 The run began after 44 weeks below the line, per Galaxy's earlier analysis
🔍 Now near $78K, so the cushion is only about 3%
What it means for Bitcoin: the medium-term trend line held under real stress. A weekly close back under that line would end the streak, so this week's close matters.
Does the 50-week line hold again this week? 👇
$BTC
#CryptoNews #Bitcoin #BitcoinClosesAbove50WeekMAFor7thStraightWeek
#BitcoinClosesAbove50WeekMAFor7thStraightWeek
📈 Bitcoin Holds Its 50-Week Average for a 7th Week
BTC logged a 7th straight weekly close above its 50-week moving average, per Galaxy Research's Alex Thorn.
📅 Week ending Nov 1 closed near $78.2K (Binance BTC/USDT: $78,354)
📊 50-week average sits around $75.8K on Binance weekly data
⚠️ The streak held through a $6B+ hack at Binance
📉 The run began after 44 weeks below the line, per Galaxy's earlier analysis
🔍 Now near $78K, so the cushion is only about 3%
What it means for Bitcoin: the medium-term trend line held under real stress. A weekly close back under that line would end the streak, so this week's close matters.
Does the 50-week line hold again this week? 👇
$BTC
#CryptoNews #Bitcoin #BitcoinClosesAbove50WeekMAFor7thStraightWeek
📈 Bitcoin Holds Its 50-Week Average for a 7th Week
BTC logged a 7th straight weekly close above its 50-week moving average, per Galaxy Research's Alex Thorn.
📅 Week ending Nov 1 closed near $78.2K (Binance BTC/USDT: $78,354)
📊 50-week average sits around $75.8K on Binance weekly data
⚠️ The streak held through a $6B+ hack at Binance
📉 The run began after 44 weeks below the line, per Galaxy's earlier analysis
🔍 Now near $78K, so the cushion is only about 3%
What it means for Bitcoin: the medium-term trend line held under real stress. A weekly close back under that line would end the streak, so this week's close matters.
Does the 50-week line hold again this week? 👇
$BTC
#CryptoNews #Bitcoin #BitcoinClosesAbove50WeekMAFor7thStraightWeek
6

·
--
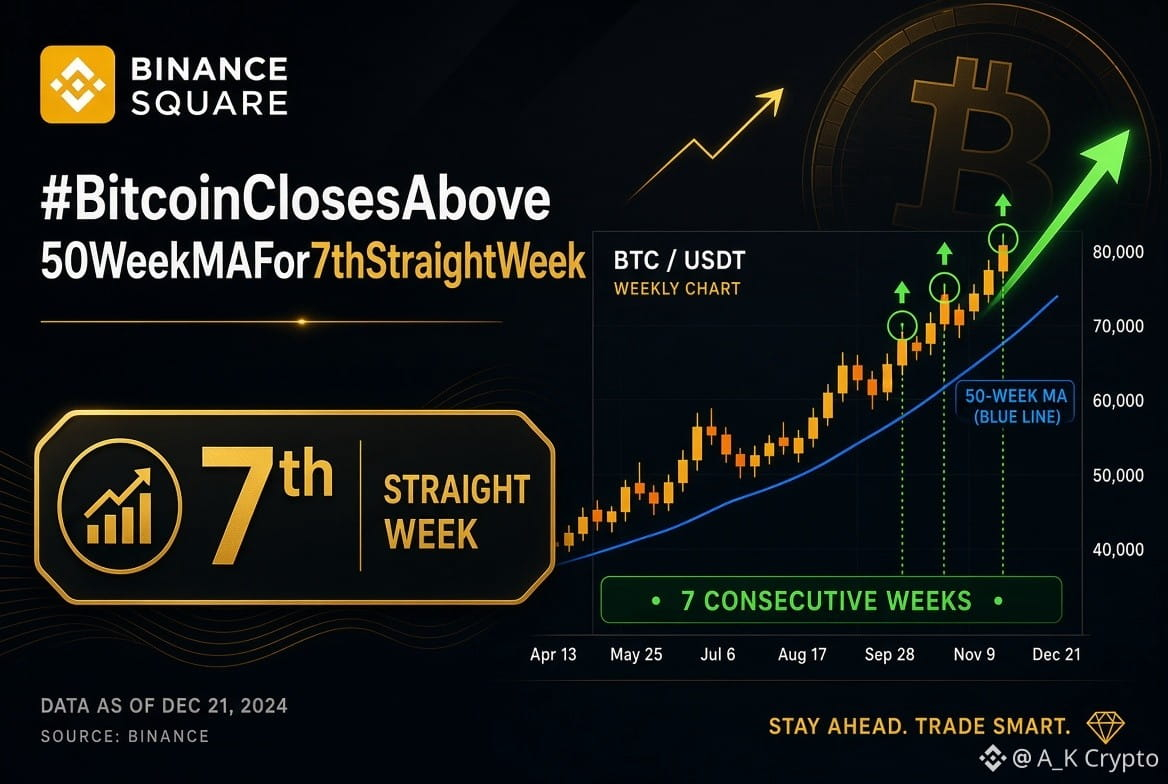
#BitcoinClosesAbove50WeekMAFor7thStraightWeek $BTC has closed above its 50-week moving average for the seventh consecutive week, a rare display of sustained technical strength.
This multi-week hold above a key long-term trend indicator points to resilient buyer conviction and reduced downside pressure. Historically, such sequences have often preceded extended bullish phases as institutional flows and on-chain accumulation remain supportive. Discipline and risk management remain essential as volatility can return quickly.
$BTC
#bitcoin #BTC #Closes #MAF
{spot}(BTCUSDT)
#BitcoinClosesAbove50WeekMAFor7thStraightWeek $BTC has closed above its 50-week moving average for the seventh consecutive week, a rare display of sustained technical strength.
This multi-week hold above a key long-term trend indicator points to resilient buyer conviction and reduced downside pressure. Historically, such sequences have often preceded extended bullish phases as institutional flows and on-chain accumulation remain supportive. Discipline and risk management remain essential as volatility can return quickly.
$BTC
#bitcoin #BTC #Closes #MAF
This multi-week hold above a key long-term trend indicator points to resilient buyer conviction and reduced downside pressure. Historically, such sequences have often preceded extended bullish phases as institutional flows and on-chain accumulation remain supportive. Discipline and risk management remain essential as volatility can return quickly.
$BTC
#bitcoin #BTC #Closes #MAF
71

·
--
Рост
#BitcoinClosesAbove50WeekMAFor7thStraightWeek
Bitcoin has closed above its 50-week Moving Average (MA) for the 7th consecutive week.
This is a positive sign for the market because it shows that Bitcoin is maintaining strength above its long-term average price.
Why is it important?
Shows continued buying strength.
Suggests a positive market trend.
Traders are watching this level for future price movements.
Latest Market Update (November 2, 2026):
Bitcoin closed the week at approximately $78,229, while its 50-week moving average stood near $75,728. This means $BTC is still holding above this important technical level. COINOTAG +1
Conclusion: Bitcoin is showing resilience, but traders should watch whether it can maintain this level. This is a positive technical signal, not a guarantee of further price increases.$NVDAB
#Bitcoin #BTC #cryptouniverseofficial #bitcoin
{spot}(TSMBUSDT)
{spot}(ETHUSDT)
{spot}(CRWDBUSDT)
#BitcoinClosesAbove50WeekMAFor7thStraightWeek
Bitcoin has closed above its 50-week Moving Average (MA) for the 7th consecutive week.
This is a positive sign for the market because it shows that Bitcoin is maintaining strength above its long-term average price.
Why is it important?
Shows continued buying strength.
Suggests a positive market trend.
Traders are watching this level for future price movements.
Latest Market Update (November 2, 2026):
Bitcoin closed the week at approximately $78,229, while its 50-week moving average stood near $75,728. This means $BTC is still holding above this important technical level. COINOTAG +1
Conclusion: Bitcoin is showing resilience, but traders should watch whether it can maintain this level. This is a positive technical signal, not a guarantee of further price increases.$NVDAB
#Bitcoin #BTC #cryptouniverseofficial #bitcoin
Bitcoin has closed above its 50-week Moving Average (MA) for the 7th consecutive week.
This is a positive sign for the market because it shows that Bitcoin is maintaining strength above its long-term average price.
Why is it important?
Shows continued buying strength.
Suggests a positive market trend.
Traders are watching this level for future price movements.
Latest Market Update (November 2, 2026):
Bitcoin closed the week at approximately $78,229, while its 50-week moving average stood near $75,728. This means $BTC is still holding above this important technical level. COINOTAG +1
Conclusion: Bitcoin is showing resilience, but traders should watch whether it can maintain this level. This is a positive technical signal, not a guarantee of further price increases.$NVDAB
#Bitcoin #BTC #cryptouniverseofficial #bitcoin

67


·
--
#BitcoinClosesAbove50WeekMAFor7thStraightWeek
Bitcoin Holds Above Its 50-Week Moving Average for 7 Straight Weeks : Is the Bullish Structure Still Intact?
Bitcoin has maintained an important long-term technical level for seven consecutive weeks, even as recent market volatility tested investor confidence.
According to Galaxy Research's Alex Thorn, BTC closed the November 1 weekly candle near $78,229, approximately 3.3% above its 50-week moving average at $75,728.
But the short-term picture needs attention.
Key Market Levels:
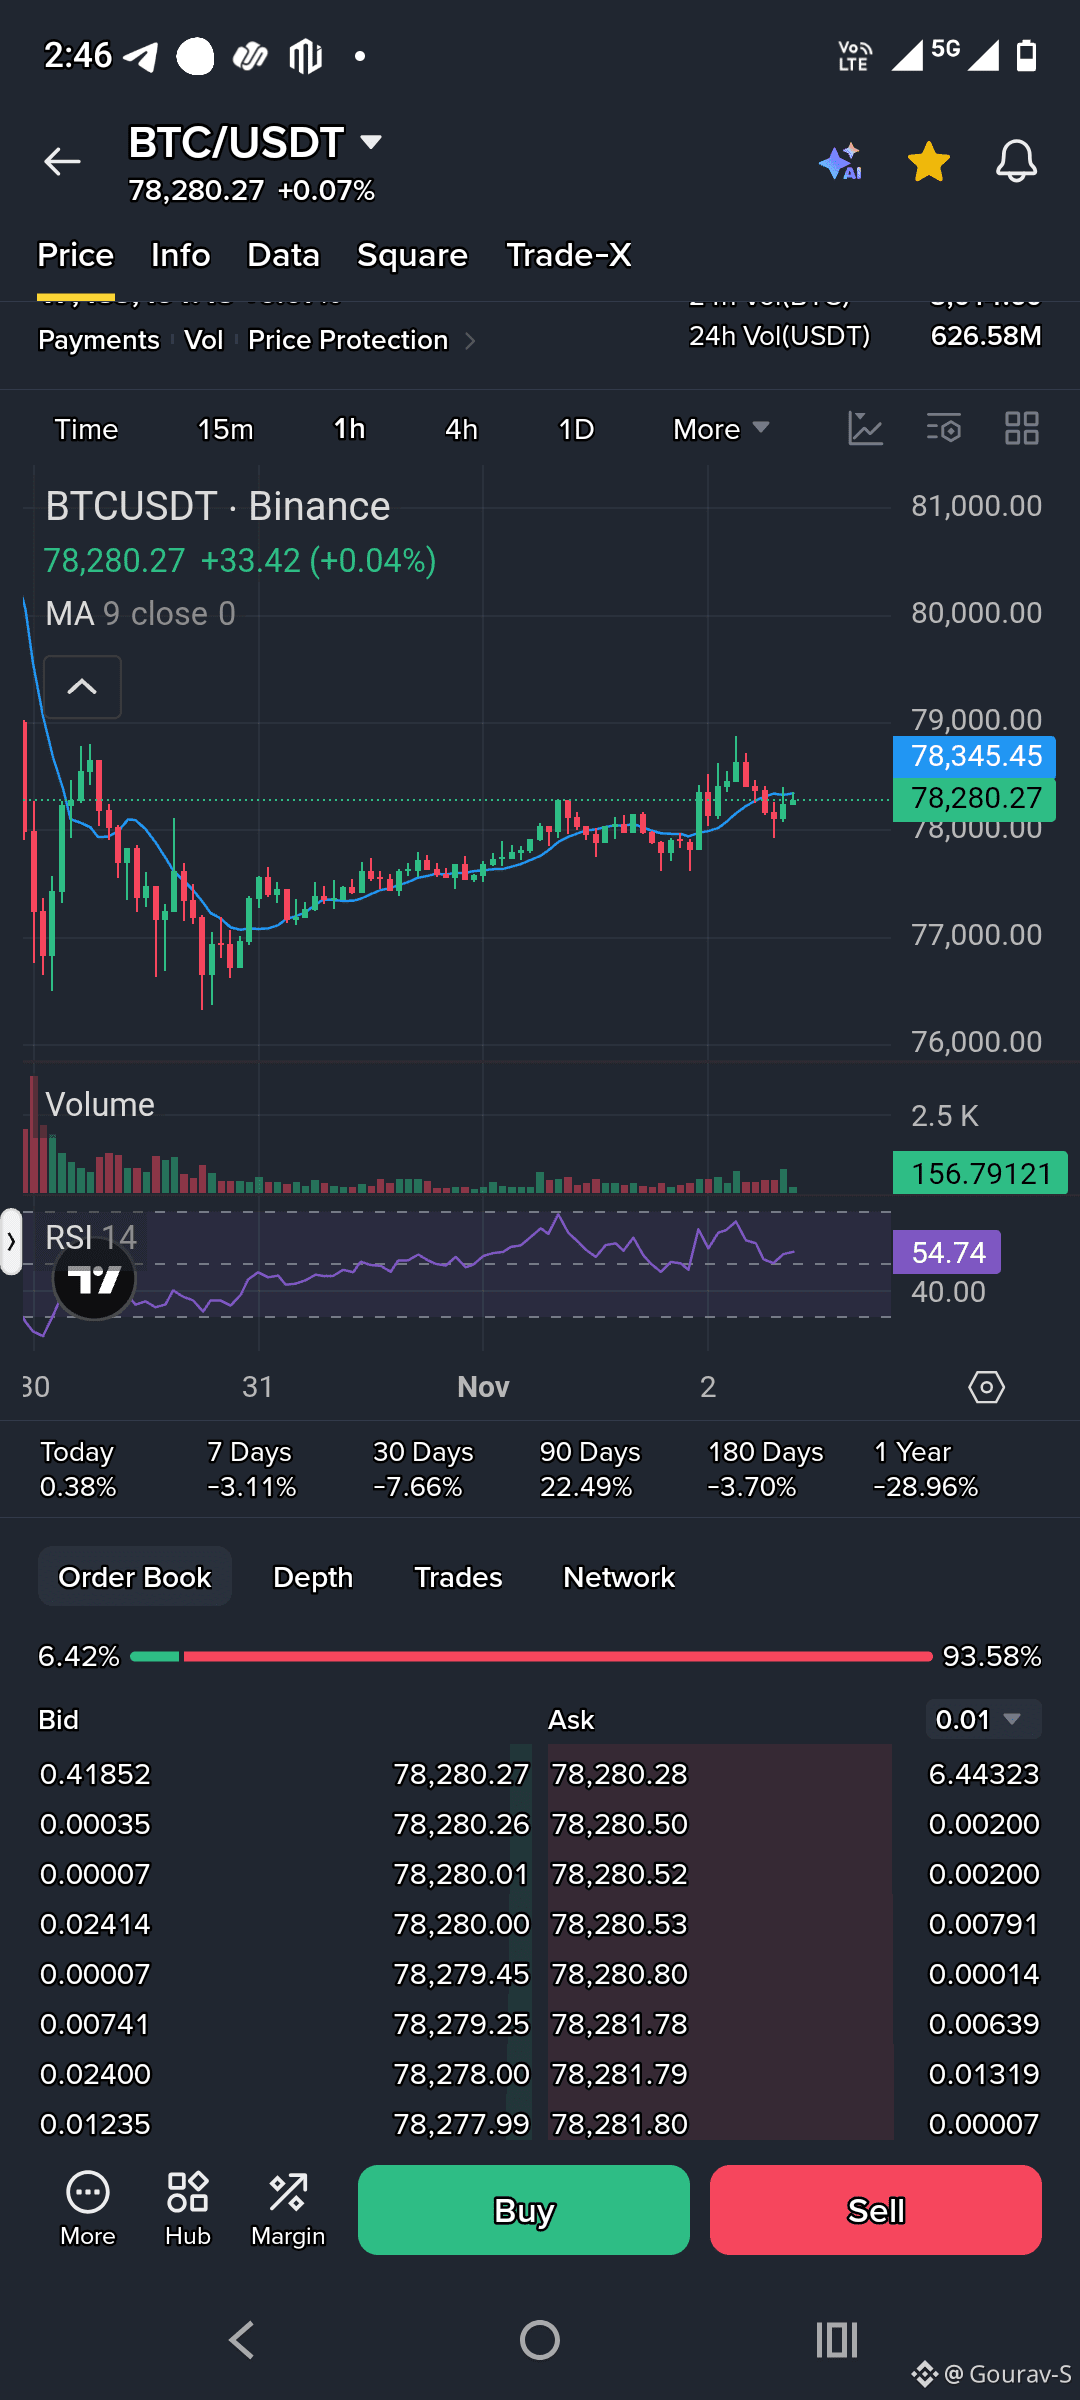
- Current price: Around $78,100
- Resistance: $78,800–$80,100
- Support: $77,000–$76,500
- 1H trend: Sideways, with mixed momentum
My take: Holding above the 50-week MA for seven weeks is constructive for Bitcoin's broader market structure. However, I wouldn't call it confirmed bull-market territory yet. The price still needs to reclaim the $79K–$80K resistance zone and sustain buying pressure.
A weekly close below the 50-week MA would also weaken this recovery narrative.
For now, I'm watching two things: whether buyers can defend support and whether BTC can turn $80K into support rather than another rejection zone.
What comes first: a breakout above $80K or a retest of $75K?
#BTC #BitcoinAnalysis #CryptoMarket #TechnicalAnalysis
{spot}(BTCUSDT)
#BitcoinClosesAbove50WeekMAFor7thStraightWeek
Bitcoin Holds Above Its 50-Week Moving Average for 7 Straight Weeks : Is the Bullish Structure Still Intact?
Bitcoin has maintained an important long-term technical level for seven consecutive weeks, even as recent market volatility tested investor confidence.
According to Galaxy Research's Alex Thorn, BTC closed the November 1 weekly candle near $78,229, approximately 3.3% above its 50-week moving average at $75,728.
But the short-term picture needs attention.
Key Market Levels:
- Current price: Around $78,100
- Resistance: $78,800–$80,100
- Support: $77,000–$76,500
- 1H trend: Sideways, with mixed momentum
My take: Holding above the 50-week MA for seven weeks is constructive for Bitcoin's broader market structure. However, I wouldn't call it confirmed bull-market territory yet. The price still needs to reclaim the $79K–$80K resistance zone and sustain buying pressure.
A weekly close below the 50-week MA would also weaken this recovery narrative.
For now, I'm watching two things: whether buyers can defend support and whether BTC can turn $80K into support rather than another rejection zone.
What comes first: a breakout above $80K or a retest of $75K?
#BTC #BitcoinAnalysis #CryptoMarket #TechnicalAnalysis
Bitcoin Holds Above Its 50-Week Moving Average for 7 Straight Weeks : Is the Bullish Structure Still Intact?
Bitcoin has maintained an important long-term technical level for seven consecutive weeks, even as recent market volatility tested investor confidence.
According to Galaxy Research's Alex Thorn, BTC closed the November 1 weekly candle near $78,229, approximately 3.3% above its 50-week moving average at $75,728.
But the short-term picture needs attention.
Key Market Levels:
- Current price: Around $78,100
- Resistance: $78,800–$80,100
- Support: $77,000–$76,500
- 1H trend: Sideways, with mixed momentum
My take: Holding above the 50-week MA for seven weeks is constructive for Bitcoin's broader market structure. However, I wouldn't call it confirmed bull-market territory yet. The price still needs to reclaim the $79K–$80K resistance zone and sustain buying pressure.
A weekly close below the 50-week MA would also weaken this recovery narrative.
For now, I'm watching two things: whether buyers can defend support and whether BTC can turn $80K into support rather than another rejection zone.
What comes first: a breakout above $80K or a retest of $75K?
#BTC #BitcoinAnalysis #CryptoMarket #TechnicalAnalysis
1
88

·
--
#BitcoinClosesAbove50WeekMAFor7thStraightWeek
#BitcoinClosesAbove50WeekMAFor7thStraightWeek
Bitcoin has officially logged its 7th consecutive weekly close above the 50-week moving average! 🚀
Historically, the 50-week MA serves as the defining line between bear market consolidation and macro bull trends. Holding above this key level for nearly two months solidifies strong structural support and suggests that long-term momentum is firmly shifting back in favor of the bulls.#BinanceSquareFamily
#BTC☀
#Bitcoin❗
#BullMarket📈
#BitcoinClosesAbove50WeekMAFor7thStraightWeek
#BitcoinClosesAbove50WeekMAFor7thStraightWeek
Bitcoin has officially logged its 7th consecutive weekly close above the 50-week moving average! 🚀
Historically, the 50-week MA serves as the defining line between bear market consolidation and macro bull trends. Holding above this key level for nearly two months solidifies strong structural support and suggests that long-term momentum is firmly shifting back in favor of the bulls.#BinanceSquareFamily
#BTC☀
#Bitcoin❗
#BullMarket📈
#BitcoinClosesAbove50WeekMAFor7thStraightWeek
Bitcoin has officially logged its 7th consecutive weekly close above the 50-week moving average! 🚀
Historically, the 50-week MA serves as the defining line between bear market consolidation and macro bull trends. Holding above this key level for nearly two months solidifies strong structural support and suggests that long-term momentum is firmly shifting back in favor of the bulls.#BinanceSquareFamily
#BTC☀
#Bitcoin❗
#BullMarket📈
80
#BitcoinClosesAbove50WeekMAFor7thStraightWeek
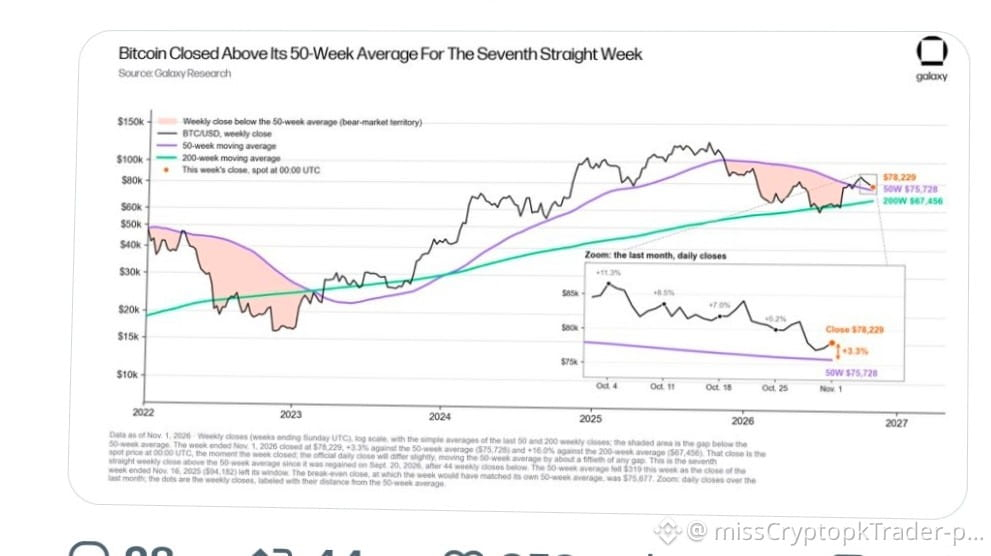
Bitcoin closes above 50W MA for 7th straight week despite $6B+ exchange hack.
$78,229 weekly close (+3.3% above 50WMA $75,728)
Resilience = structure intact.
#Bitcoin #BTC
#BitcoinClosesAbove50WeekMAFor7thStraightWeek
Bitcoin closes above 50W MA for 7th straight week despite $6B+ exchange hack.
$78,229 weekly close (+3.3% above 50WMA $75,728)
Resilience = structure intact.
#Bitcoin #BTC
Bitcoin closes above 50W MA for 7th straight week despite $6B+ exchange hack.
$78,229 weekly close (+3.3% above 50WMA $75,728)
Resilience = structure intact.
#Bitcoin #BTC
1
76

·
--
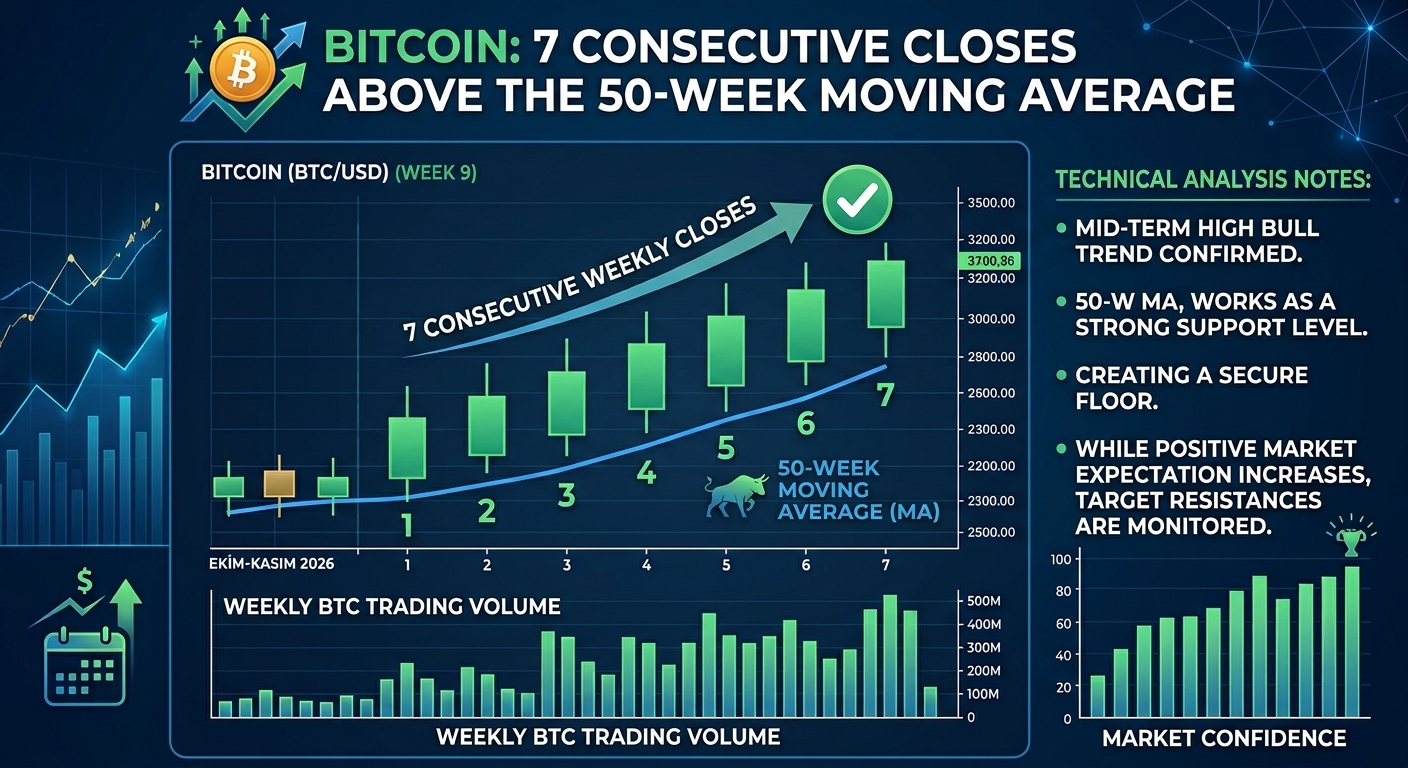
#bitcoinclosesabove50weekmafor7thstraightweek
Bitcoin, son dönemdeki tüm piyasa sarsıntılarına ve borsalarda yaşanan büyük hack olaylarına rağmen gücünü korumaya devam ediyor.
📉📈 Piyasa Özeti ve Emojili Anlatım:
⏱️ Güçlü Teknik Duruş: Bitcoin (BTC), 50 haftalık hareketli ortalamanın (MA) üzerinde art arda 7. haftalık kapanışını gerçekleştirdi. Bu durum, piyasa yapısının ve orta-uzun vadeli yükseliş trendinin ne kadar dirençli olduğunu gösteriyor.
🛡️ Piyasa Direnci: Küresel çapta yankı uyandıran büyük borsa hack olaylarına ve yüksek volatiliteye rağmen BTC'nin bu kritik teknik seviyenin üzerinde kalması yatırımcılara moral aşıladı.
🚀 Boğa Piyasası Sinyalleri: Uzmanlar ve analistler (Galaxy Research vb.), bu ardışık kapanışların piyasada olumlu havayı desteklediğini ve güçlü bir taban oluşturduğunu vurguluyor.
$BTC $TRUMP $EVAA
{future}(EVAAUSDT)
{future}(TRUMPUSDT)
{future}(BTCUSDT)
#bitcoinclosesabove50weekmafor7thstraightweek
Bitcoin, son dönemdeki tüm piyasa sarsıntılarına ve borsalarda yaşanan büyük hack olaylarına rağmen gücünü korumaya devam ediyor.
📉📈 Piyasa Özeti ve Emojili Anlatım:
⏱️ Güçlü Teknik Duruş: Bitcoin (BTC), 50 haftalık hareketli ortalamanın (MA) üzerinde art arda 7. haftalık kapanışını gerçekleştirdi. Bu durum, piyasa yapısının ve orta-uzun vadeli yükseliş trendinin ne kadar dirençli olduğunu gösteriyor.
🛡️ Piyasa Direnci: Küresel çapta yankı uyandıran büyük borsa hack olaylarına ve yüksek volatiliteye rağmen BTC'nin bu kritik teknik seviyenin üzerinde kalması yatırımcılara moral aşıladı.
🚀 Boğa Piyasası Sinyalleri: Uzmanlar ve analistler (Galaxy Research vb.), bu ardışık kapanışların piyasada olumlu havayı desteklediğini ve güçlü bir taban oluşturduğunu vurguluyor.
$BTC $TRUMP $EVAA
Bitcoin, son dönemdeki tüm piyasa sarsıntılarına ve borsalarda yaşanan büyük hack olaylarına rağmen gücünü korumaya devam ediyor.
📉📈 Piyasa Özeti ve Emojili Anlatım:
⏱️ Güçlü Teknik Duruş: Bitcoin (BTC), 50 haftalık hareketli ortalamanın (MA) üzerinde art arda 7. haftalık kapanışını gerçekleştirdi. Bu durum, piyasa yapısının ve orta-uzun vadeli yükseliş trendinin ne kadar dirençli olduğunu gösteriyor.
🛡️ Piyasa Direnci: Küresel çapta yankı uyandıran büyük borsa hack olaylarına ve yüksek volatiliteye rağmen BTC'nin bu kritik teknik seviyenin üzerinde kalması yatırımcılara moral aşıladı.
🚀 Boğa Piyasası Sinyalleri: Uzmanlar ve analistler (Galaxy Research vb.), bu ardışık kapanışların piyasada olumlu havayı desteklediğini ve güçlü bir taban oluşturduğunu vurguluyor.
$BTC $TRUMP $EVAA
1
5.9k

·
--
Статья
BTC连续第七周站上50周均线:结构还在,但不是追涨信号BTC连续第七周站上50周均线:结构还在,但不是追涨信号
Binance Square 当前可见话题 `#BitcoinClosesAbove50WeekMAFor7thStraightWeek` 约有 201 次浏览、12 人讨论。这个话题值得看的不是“七周”这个数字,而是一个更具体的问题:在近期安全事件与大额提现冲击之后,BTC 的周线结构有没有被真正破坏?
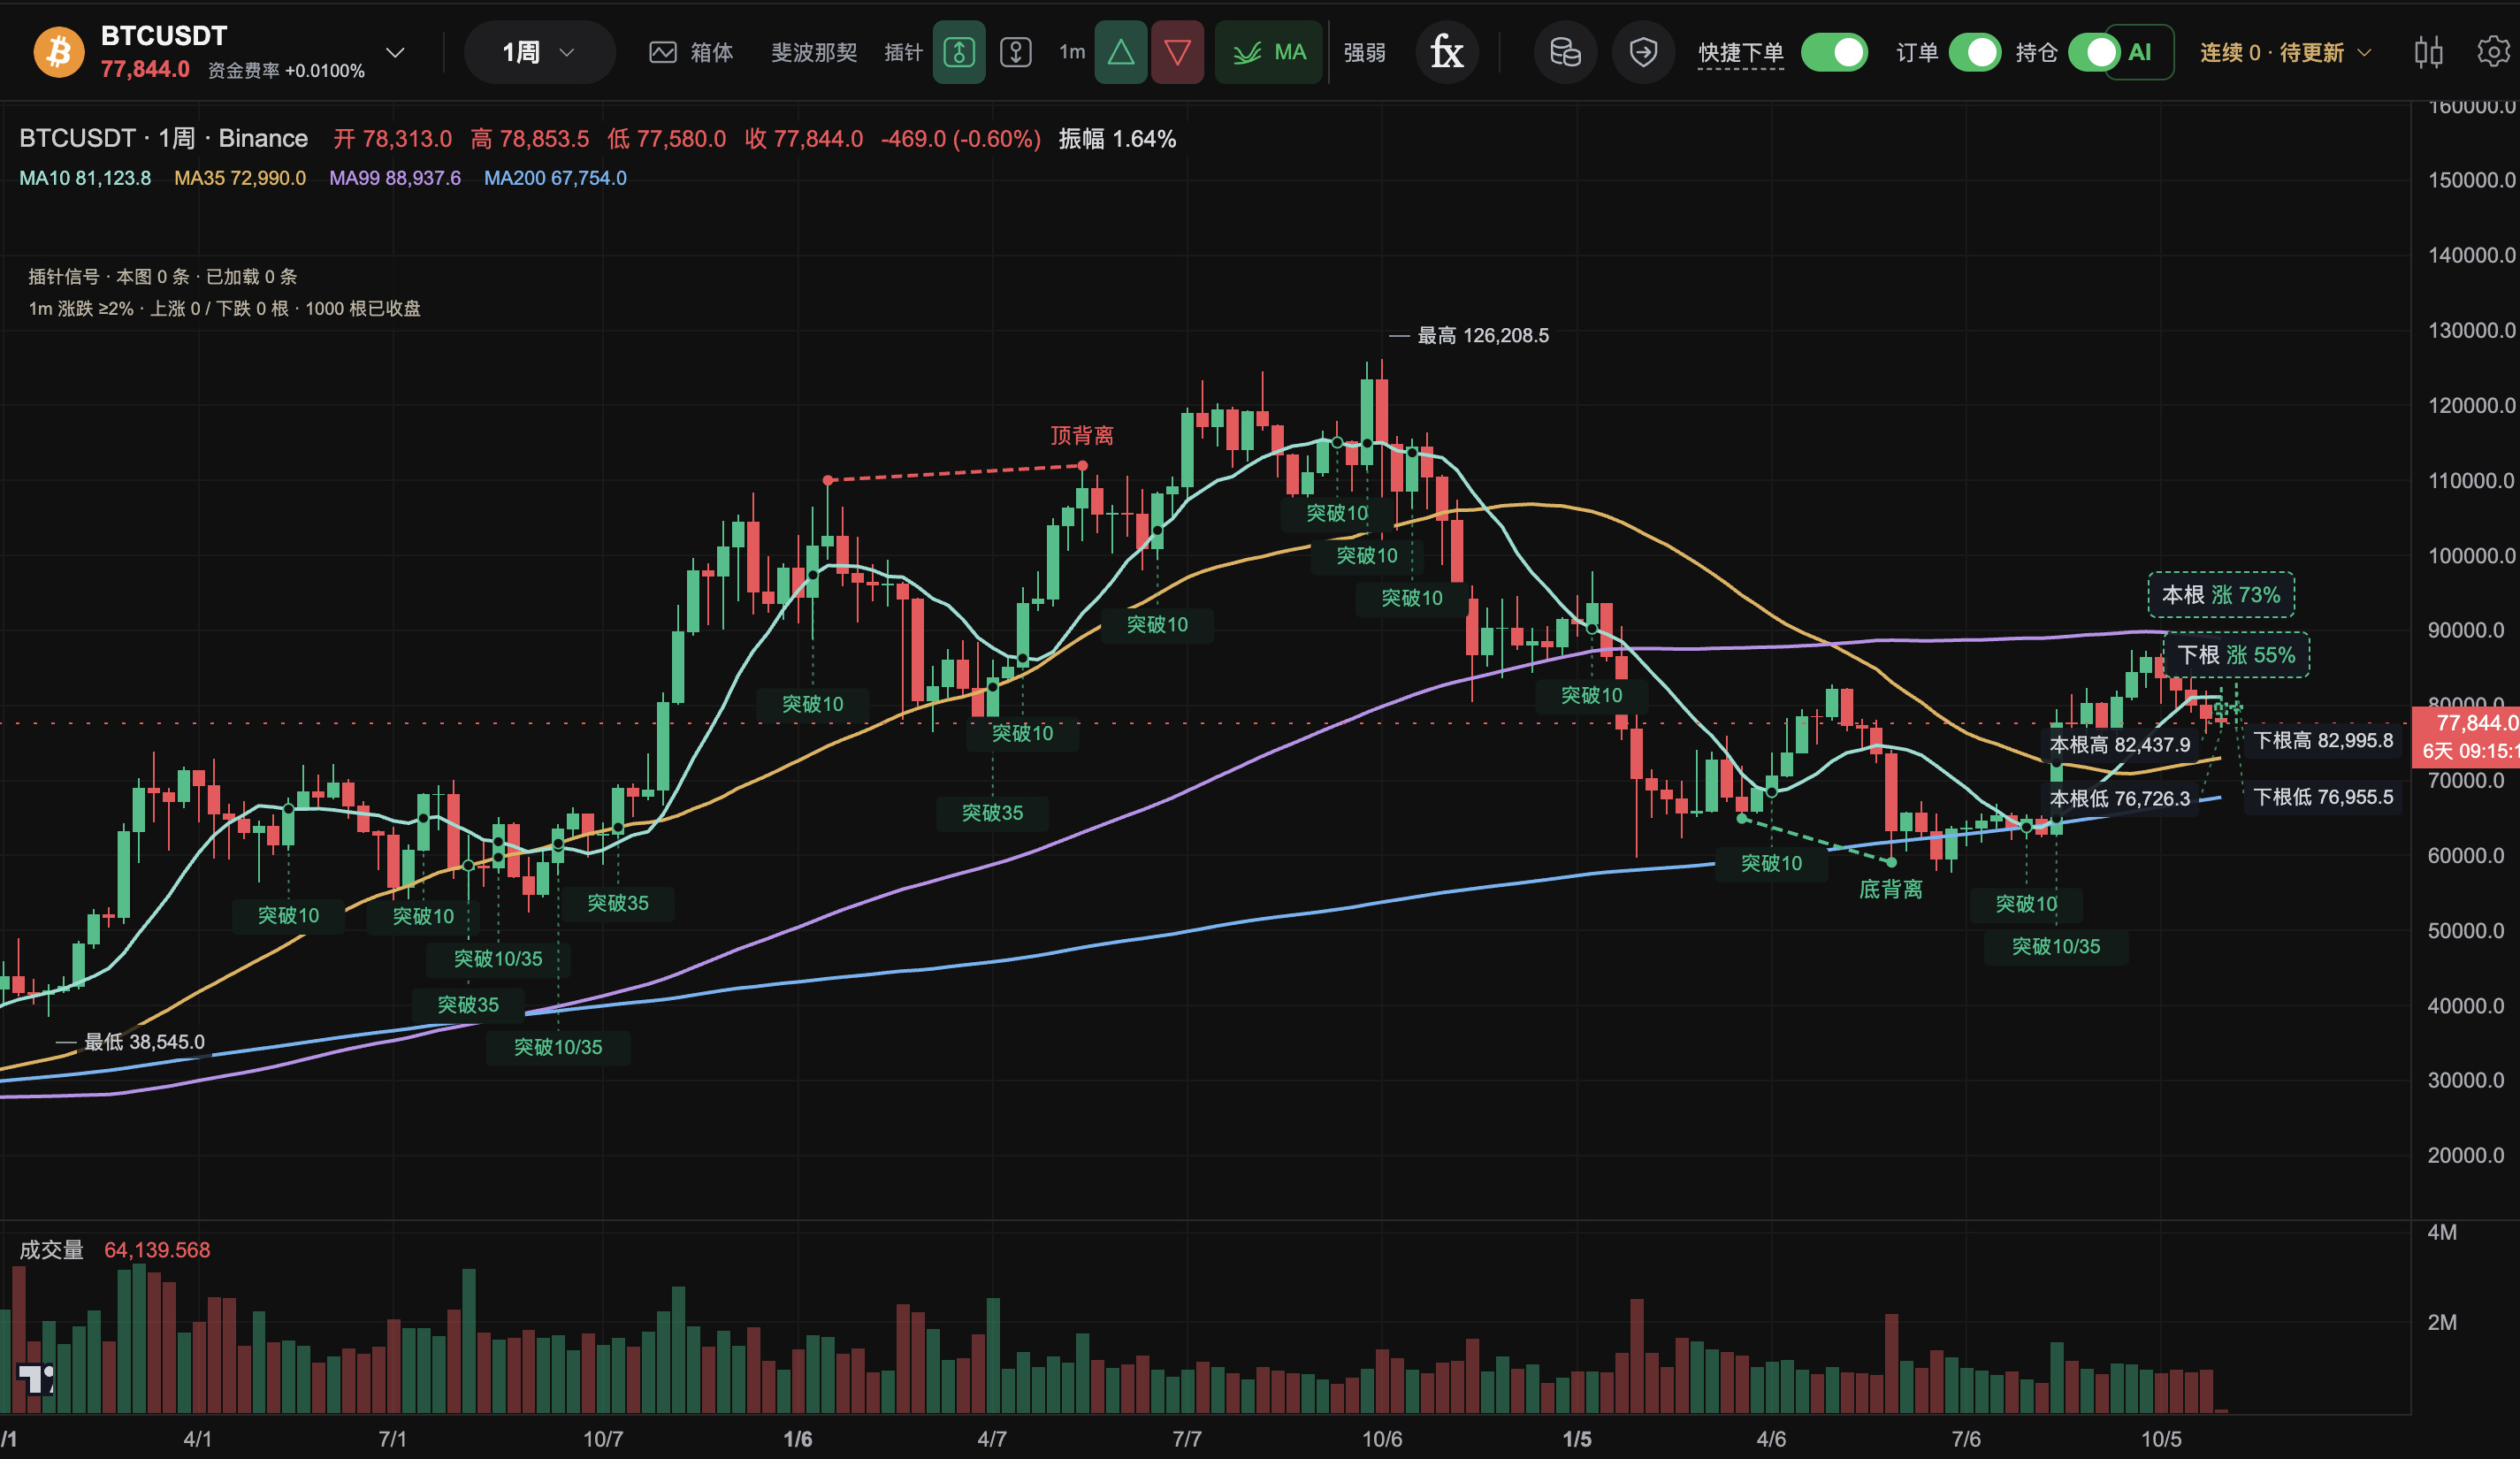
先看已收盘数据。Binance 现货最近一根完整周线在北京时间 11 月 2 日上午已经结束,对应 UTC 11 月 1 日 23:59 收盘:开盘 80,154.09 美元,最高 81,971.00,最低 76,325.98,收盘 78,354.00。用最近 50 根已收盘周线收盘价计算,50 周均线约为 75,774.84 美元,周收盘仍高出约 3.40%。从 9 月 20 日结束的那一周开始,BTC 已连续 7 根完整周线收在各自 50 周均线上方。
如果你要查看主角币种,BTC/USDT 现货入口:
https://www.binance.com/en/trade/BTC_USDT
我的判断是:这是“中期结构尚未失效”,不是“下一根 K 线必涨”。50 周均线本身是滞后指标,能够说明价格仍处在过去一年的中期成本线上方,却不能单独证明新的上升趋势已经确认。周线收盘站上均线和盘中价格跌破均线,也不是同一件事;前者更适合判断结构,后者更多反映短期流动性与情绪。
再看 22:45 左右的实时截面:BTC 现货约 77,899.85 美元,24 小时跌 0.213%,报价成交额约 7.456 亿 USDT;BTCUSDT 永续约 77,825.30 美元,标记价约 77,869.00,持仓量约 96,457.033 BTC,资金费率为正的 0.0100%/8 小时,永续 24 小时报价成交额约 65.91 亿 USDT。现货入口是上面的 BTC/USDT 现货;BTC/USDT 永续入口:
https://www.binance.com/en/futures/BTCUSDT
这里需要把现货和永续分开看。现货价格略高于永续最新价,但永续资金费率为正,说明多头为持仓支付资金成本;这不是单独的看空信号,却意味着如果价格继续横盘或回落,杠杆多头的持有成本会先累积。当前更重要的验证不是再找一个更小周期的“突破”,而是观察下一次周线收盘能否继续留在 50 周均线之上,同时现货成交是否能跟上,而不是只靠永续持仓推动。
对接下来一周,我会看三件事:第一,完整周线是否跌破当周 50 周均线;第二,反弹时现货成交额是否同步改善;第三,永续持仓量上升时,价格能否形成新的周线高点。如果价格上涨但现货承接变弱、持仓继续上升,结构表面仍强,交易脆弱性却可能在增加。
如果后续完整周线收盘跌破 50 周均线,或者连续两周无法重新站回,那么“中期结构仍在”的判断就应当下调;如果只是盘中短暂下探、周线重新收回,不能把一次影线直接等同于趋势反转。本文只做市场观察,不构成投资建议。
数据来源:Binance 现货周线与 24 小时行情接口、Binance Futures 24 小时行情/标记价格/持仓量接口,观察时间为 2026 年 11 月 2 日 22:44—22:45(北京时间)。话题来源:
https://www.binance.com/en/square/hashtag/bitcoinclosesabove50weekmafor7thstraightweek
#Bitcoin #BitcoinClosesAbove50WeekMAFor7thStraightWeek
$BTC
BTC连续第七周站上50周均线:结构还在,但不是追涨信号
BTC连续第七周站上50周均线:结构还在,但不是追涨信号
Binance Square 当前可见话题 `#BitcoinClosesAbove50WeekMAFor7thStraightWeek` 约有 201 次浏览、12 人讨论。这个话题值得看的不是“七周”这个数字,而是一个更具体的问题:在近期安全事件与大额提现冲击之后,BTC 的周线结构有没有被真正破坏?
先看已收盘数据。Binance 现货最近一根完整周线在北京时间 11 月 2 日上午已经结束,对应 UTC 11 月 1 日 23:59 收盘:开盘 80,154.09 美元,最高 81,971.00,最低 76,325.98,收盘 78,354.00。用最近 50 根已收盘周线收盘价计算,50 周均线约为 75,774.84 美元,周收盘仍高出约 3.40%。从 9 月 20 日结束的那一周开始,BTC 已连续 7 根完整周线收在各自 50 周均线上方。
如果你要查看主角币种,BTC/USDT 现货入口:
https://www.binance.com/en/trade/BTC_USDT
我的判断是:这是“中期结构尚未失效”,不是“下一根 K 线必涨”。50 周均线本身是滞后指标,能够说明价格仍处在过去一年的中期成本线上方,却不能单独证明新的上升趋势已经确认。周线收盘站上均线和盘中价格跌破均线,也不是同一件事;前者更适合判断结构,后者更多反映短期流动性与情绪。
再看 22:45 左右的实时截面:BTC 现货约 77,899.85 美元,24 小时跌 0.213%,报价成交额约 7.456 亿 USDT;BTCUSDT 永续约 77,825.30 美元,标记价约 77,869.00,持仓量约 96,457.033 BTC,资金费率为正的 0.0100%/8 小时,永续 24 小时报价成交额约 65.91 亿 USDT。现货入口是上面的 BTC/USDT 现货;BTC/USDT 永续入口:
https://www.binance.com/en/futures/BTCUSDT
这里需要把现货和永续分开看。现货价格略高于永续最新价,但永续资金费率为正,说明多头为持仓支付资金成本;这不是单独的看空信号,却意味着如果价格继续横盘或回落,杠杆多头的持有成本会先累积。当前更重要的验证不是再找一个更小周期的“突破”,而是观察下一次周线收盘能否继续留在 50 周均线之上,同时现货成交是否能跟上,而不是只靠永续持仓推动。
对接下来一周,我会看三件事:第一,完整周线是否跌破当周 50 周均线;第二,反弹时现货成交额是否同步改善;第三,永续持仓量上升时,价格能否形成新的周线高点。如果价格上涨但现货承接变弱、持仓继续上升,结构表面仍强,交易脆弱性却可能在增加。
如果后续完整周线收盘跌破 50 周均线,或者连续两周无法重新站回,那么“中期结构仍在”的判断就应当下调;如果只是盘中短暂下探、周线重新收回,不能把一次影线直接等同于趋势反转。本文只做市场观察,不构成投资建议。
数据来源:Binance 现货周线与 24 小时行情接口、Binance Futures 24 小时行情/标记价格/持仓量接口,观察时间为 2026 年 11 月 2 日 22:44—22:45(北京时间)。话题来源:
https://www.binance.com/en/square/hashtag/bitcoinclosesabove50weekmafor7thstraightweek
#Bitcoin #BitcoinClosesAbove50WeekMAFor7thStraightWeek
$BTC
Binance Square 当前可见话题 `#BitcoinClosesAbove50WeekMAFor7thStraightWeek` 约有 201 次浏览、12 人讨论。这个话题值得看的不是“七周”这个数字,而是一个更具体的问题:在近期安全事件与大额提现冲击之后,BTC 的周线结构有没有被真正破坏?
先看已收盘数据。Binance 现货最近一根完整周线在北京时间 11 月 2 日上午已经结束,对应 UTC 11 月 1 日 23:59 收盘:开盘 80,154.09 美元,最高 81,971.00,最低 76,325.98,收盘 78,354.00。用最近 50 根已收盘周线收盘价计算,50 周均线约为 75,774.84 美元,周收盘仍高出约 3.40%。从 9 月 20 日结束的那一周开始,BTC 已连续 7 根完整周线收在各自 50 周均线上方。
如果你要查看主角币种,BTC/USDT 现货入口:
https://www.binance.com/en/trade/BTC_USDT
我的判断是:这是“中期结构尚未失效”,不是“下一根 K 线必涨”。50 周均线本身是滞后指标,能够说明价格仍处在过去一年的中期成本线上方,却不能单独证明新的上升趋势已经确认。周线收盘站上均线和盘中价格跌破均线,也不是同一件事;前者更适合判断结构,后者更多反映短期流动性与情绪。
再看 22:45 左右的实时截面:BTC 现货约 77,899.85 美元,24 小时跌 0.213%,报价成交额约 7.456 亿 USDT;BTCUSDT 永续约 77,825.30 美元,标记价约 77,869.00,持仓量约 96,457.033 BTC,资金费率为正的 0.0100%/8 小时,永续 24 小时报价成交额约 65.91 亿 USDT。现货入口是上面的 BTC/USDT 现货;BTC/USDT 永续入口:
https://www.binance.com/en/futures/BTCUSDT
这里需要把现货和永续分开看。现货价格略高于永续最新价,但永续资金费率为正,说明多头为持仓支付资金成本;这不是单独的看空信号,却意味着如果价格继续横盘或回落,杠杆多头的持有成本会先累积。当前更重要的验证不是再找一个更小周期的“突破”,而是观察下一次周线收盘能否继续留在 50 周均线之上,同时现货成交是否能跟上,而不是只靠永续持仓推动。
对接下来一周,我会看三件事:第一,完整周线是否跌破当周 50 周均线;第二,反弹时现货成交额是否同步改善;第三,永续持仓量上升时,价格能否形成新的周线高点。如果价格上涨但现货承接变弱、持仓继续上升,结构表面仍强,交易脆弱性却可能在增加。
如果后续完整周线收盘跌破 50 周均线,或者连续两周无法重新站回,那么“中期结构仍在”的判断就应当下调;如果只是盘中短暂下探、周线重新收回,不能把一次影线直接等同于趋势反转。本文只做市场观察,不构成投资建议。
数据来源:Binance 现货周线与 24 小时行情接口、Binance Futures 24 小时行情/标记价格/持仓量接口,观察时间为 2026 年 11 月 2 日 22:44—22:45(北京时间)。话题来源:
https://www.binance.com/en/square/hashtag/bitcoinclosesabove50weekmafor7thstraightweek
#Bitcoin #BitcoinClosesAbove50WeekMAFor7thStraightWeek
$BTC
191

·
--
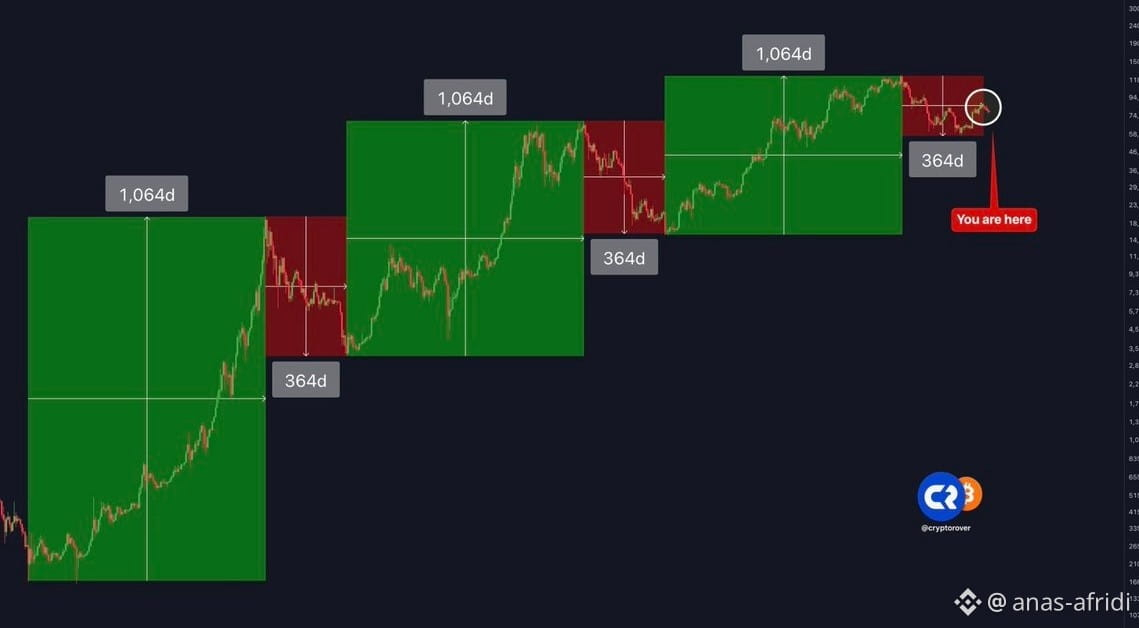
#BitcoinClosesAbove50WeekMAFor7thStraightWeek NEW: BTC closes above its 50-week MA after missing the EMA, eyeing $78,600 and $80,000 next.$BTC
{future}(BTCUSDT)
#BitcoinClosesAbove50WeekMAFor7thStraightWeek NEW: BTC closes above its 50-week MA after missing the EMA, eyeing $78,600 and $80,000 next.$BTC
1
44

·
--
Проверено

Статья
🔥 RIPPLE CEO: $XRP COULD BECOME THE GOLD STANDARD FOR INSTITUTIONAL CRYPTO PAYMENTS !Ripple CEO Brad Garlinghouse believes $XRP will remain a leading choice for institutional grade crypto payments over the next five years. 👀
But there's more happening behind the scenes than just XRP.
🏦 What's changing at Ripple?
Ripple is expanding beyond traditional payment services into enterprise treasury management and prime brokerage, with XRP serving as one of the key technologies in its ecosystem.
$RLUSD is also gaining attention.
Garlinghouse revealed that approximately 50% of RLUSD's issuance is on the XRP Ledger, potentially supporting network liquidity and transaction activity.
🔍 The bigger picture:
Ripple isn't positioning XRP as the solution for every transaction. Some use cases may be better served by traditional fiat currencies or RLUSD.
Meanwhile, Ripple board member David Schwartz sees a future where blockchain becomes as widely used as the internet for payments, investments, lending and everyday financial services.
📊 WHAT WE'RE WATCHING:
XRP adoption by financial institutionsRLUSD supply and growth on the XRP LedgerReal-world payment activity and network usageExpansion of Ripple's institutional services
🧠 BANTEEX TAKE:
This is a long-term adoption narrative, not an immediate trading signal. The real opportunity to watch is whether institutional interest translates into measurable network usage and sustained demand.
🔥 The question is no longer just about XRP's price it's about how much of the global financial system blockchain can actually capture.
What do you think? Can XRP become a major institutional payment standard over the next five years?
#BitcoinClosesAbove50WeekMAFor7thStraightWeek #RippleUpdate #xrp #RLUSD
{future}(XRPUSDT)
🔥 RIPPLE CEO: $XRP COULD BECOME THE GOLD STANDARD FOR INSTITUTIONAL CRYPTO PAYMENTS !
Ripple CEO Brad Garlinghouse believes $XRP will remain a leading choice for institutional grade crypto payments over the next five years. 👀
But there's more happening behind the scenes than just XRP.
🏦 What's changing at Ripple?
Ripple is expanding beyond traditional payment services into enterprise treasury management and prime brokerage, with XRP serving as one of the key technologies in its ecosystem.
$RLUSD is also gaining attention.
Garlinghouse revealed that approximately 50% of RLUSD's issuance is on the XRP Ledger, potentially supporting network liquidity and transaction activity.
🔍 The bigger picture:
Ripple isn't positioning XRP as the solution for every transaction. Some use cases may be better served by traditional fiat currencies or RLUSD.
Meanwhile, Ripple board member David Schwartz sees a future where blockchain becomes as widely used as the internet for payments, investments, lending and everyday financial services.
📊 WHAT WE'RE WATCHING:
XRP adoption by financial institutionsRLUSD supply and growth on the XRP LedgerReal-world payment activity and network usageExpansion of Ripple's institutional services
🧠 BANTEEX TAKE:
This is a long-term adoption narrative, not an immediate trading signal. The real opportunity to watch is whether institutional interest translates into measurable network usage and sustained demand.
🔥 The question is no longer just about XRP's price it's about how much of the global financial system blockchain can actually capture.
What do you think? Can XRP become a major institutional payment standard over the next five years?
#BitcoinClosesAbove50WeekMAFor7thStraightWeek #RippleUpdate #xrp #RLUSD
But there's more happening behind the scenes than just XRP.
🏦 What's changing at Ripple?
Ripple is expanding beyond traditional payment services into enterprise treasury management and prime brokerage, with XRP serving as one of the key technologies in its ecosystem.
$RLUSD is also gaining attention.
Garlinghouse revealed that approximately 50% of RLUSD's issuance is on the XRP Ledger, potentially supporting network liquidity and transaction activity.
🔍 The bigger picture:
Ripple isn't positioning XRP as the solution for every transaction. Some use cases may be better served by traditional fiat currencies or RLUSD.
Meanwhile, Ripple board member David Schwartz sees a future where blockchain becomes as widely used as the internet for payments, investments, lending and everyday financial services.
📊 WHAT WE'RE WATCHING:
XRP adoption by financial institutionsRLUSD supply and growth on the XRP LedgerReal-world payment activity and network usageExpansion of Ripple's institutional services
🧠 BANTEEX TAKE:
This is a long-term adoption narrative, not an immediate trading signal. The real opportunity to watch is whether institutional interest translates into measurable network usage and sustained demand.
🔥 The question is no longer just about XRP's price it's about how much of the global financial system blockchain can actually capture.
What do you think? Can XRP become a major institutional payment standard over the next five years?
#BitcoinClosesAbove50WeekMAFor7thStraightWeek #RippleUpdate #xrp #RLUSD
1
1k

·
--
* Asset: $LUNC
{spot}(LUNCUSDT)
#BitcoinClosesAbove50WeekMAFor7thStraightWeek (Terra Classic / Legacy Algorithmic PoS Blockchain)
* Valuation Zone: $0.000041 – $0.000046 (~$230M – $255M circulating market cap based on ~5.51T–5.52T circulating supply out of a ~6.44T total supply; active 24h combined spot and derivative volume turnover tracking between $5M to $12M+ across primary venues including Binance, Gate.io, KuCoin, Bybit, and MEXC)
* Core Operator / Driver: Legacy Cosmos-SDK/Tendermint Proof-of-Stake blockchain maintained by open-source community developer groups (LUNC DAO, Terra Rebels); driven primarily by on-chain token burn proposals, parameter-tuned tax burns, validator delegation incentives, and speculative community meme governance.
* Verdict: Ultra-high-beta legacy narrative asset consolidating near macro bottom accumulation levels following prolonged multi-month token burn distribution; monitor volume-backed support retention near the $0.000032 – $0.000036 demand floor and watch for a confirmed daily close over primary overhead technical resistance at $0.000065 – $0.000078 to signal a momentum expansion back toward upper price discovery tiers.
* Asset: $LUNC
#BitcoinClosesAbove50WeekMAFor7thStraightWeek (Terra Classic / Legacy Algorithmic PoS Blockchain)
* Valuation Zone: $0.000041 – $0.000046 (~$230M – $255M circulating market cap based on ~5.51T–5.52T circulating supply out of a ~6.44T total supply; active 24h combined spot and derivative volume turnover tracking between $5M to $12M+ across primary venues including Binance, Gate.io, KuCoin, Bybit, and MEXC)
* Core Operator / Driver: Legacy Cosmos-SDK/Tendermint Proof-of-Stake blockchain maintained by open-source community developer groups (LUNC DAO, Terra Rebels); driven primarily by on-chain token burn proposals, parameter-tuned tax burns, validator delegation incentives, and speculative community meme governance.
* Verdict: Ultra-high-beta legacy narrative asset consolidating near macro bottom accumulation levels following prolonged multi-month token burn distribution; monitor volume-backed support retention near the $0.000032 – $0.000036 demand floor and watch for a confirmed daily close over primary overhead technical resistance at $0.000065 – $0.000078 to signal a momentum expansion back toward upper price discovery tiers.
#BitcoinClosesAbove50WeekMAFor7thStraightWeek (Terra Classic / Legacy Algorithmic PoS Blockchain)
* Valuation Zone: $0.000041 – $0.000046 (~$230M – $255M circulating market cap based on ~5.51T–5.52T circulating supply out of a ~6.44T total supply; active 24h combined spot and derivative volume turnover tracking between $5M to $12M+ across primary venues including Binance, Gate.io, KuCoin, Bybit, and MEXC)
* Core Operator / Driver: Legacy Cosmos-SDK/Tendermint Proof-of-Stake blockchain maintained by open-source community developer groups (LUNC DAO, Terra Rebels); driven primarily by on-chain token burn proposals, parameter-tuned tax burns, validator delegation incentives, and speculative community meme governance.
* Verdict: Ultra-high-beta legacy narrative asset consolidating near macro bottom accumulation levels following prolonged multi-month token burn distribution; monitor volume-backed support retention near the $0.000032 – $0.000036 demand floor and watch for a confirmed daily close over primary overhead technical resistance at $0.000065 – $0.000078 to signal a momentum expansion back toward upper price discovery tiers.
2
428

·
--
Рост
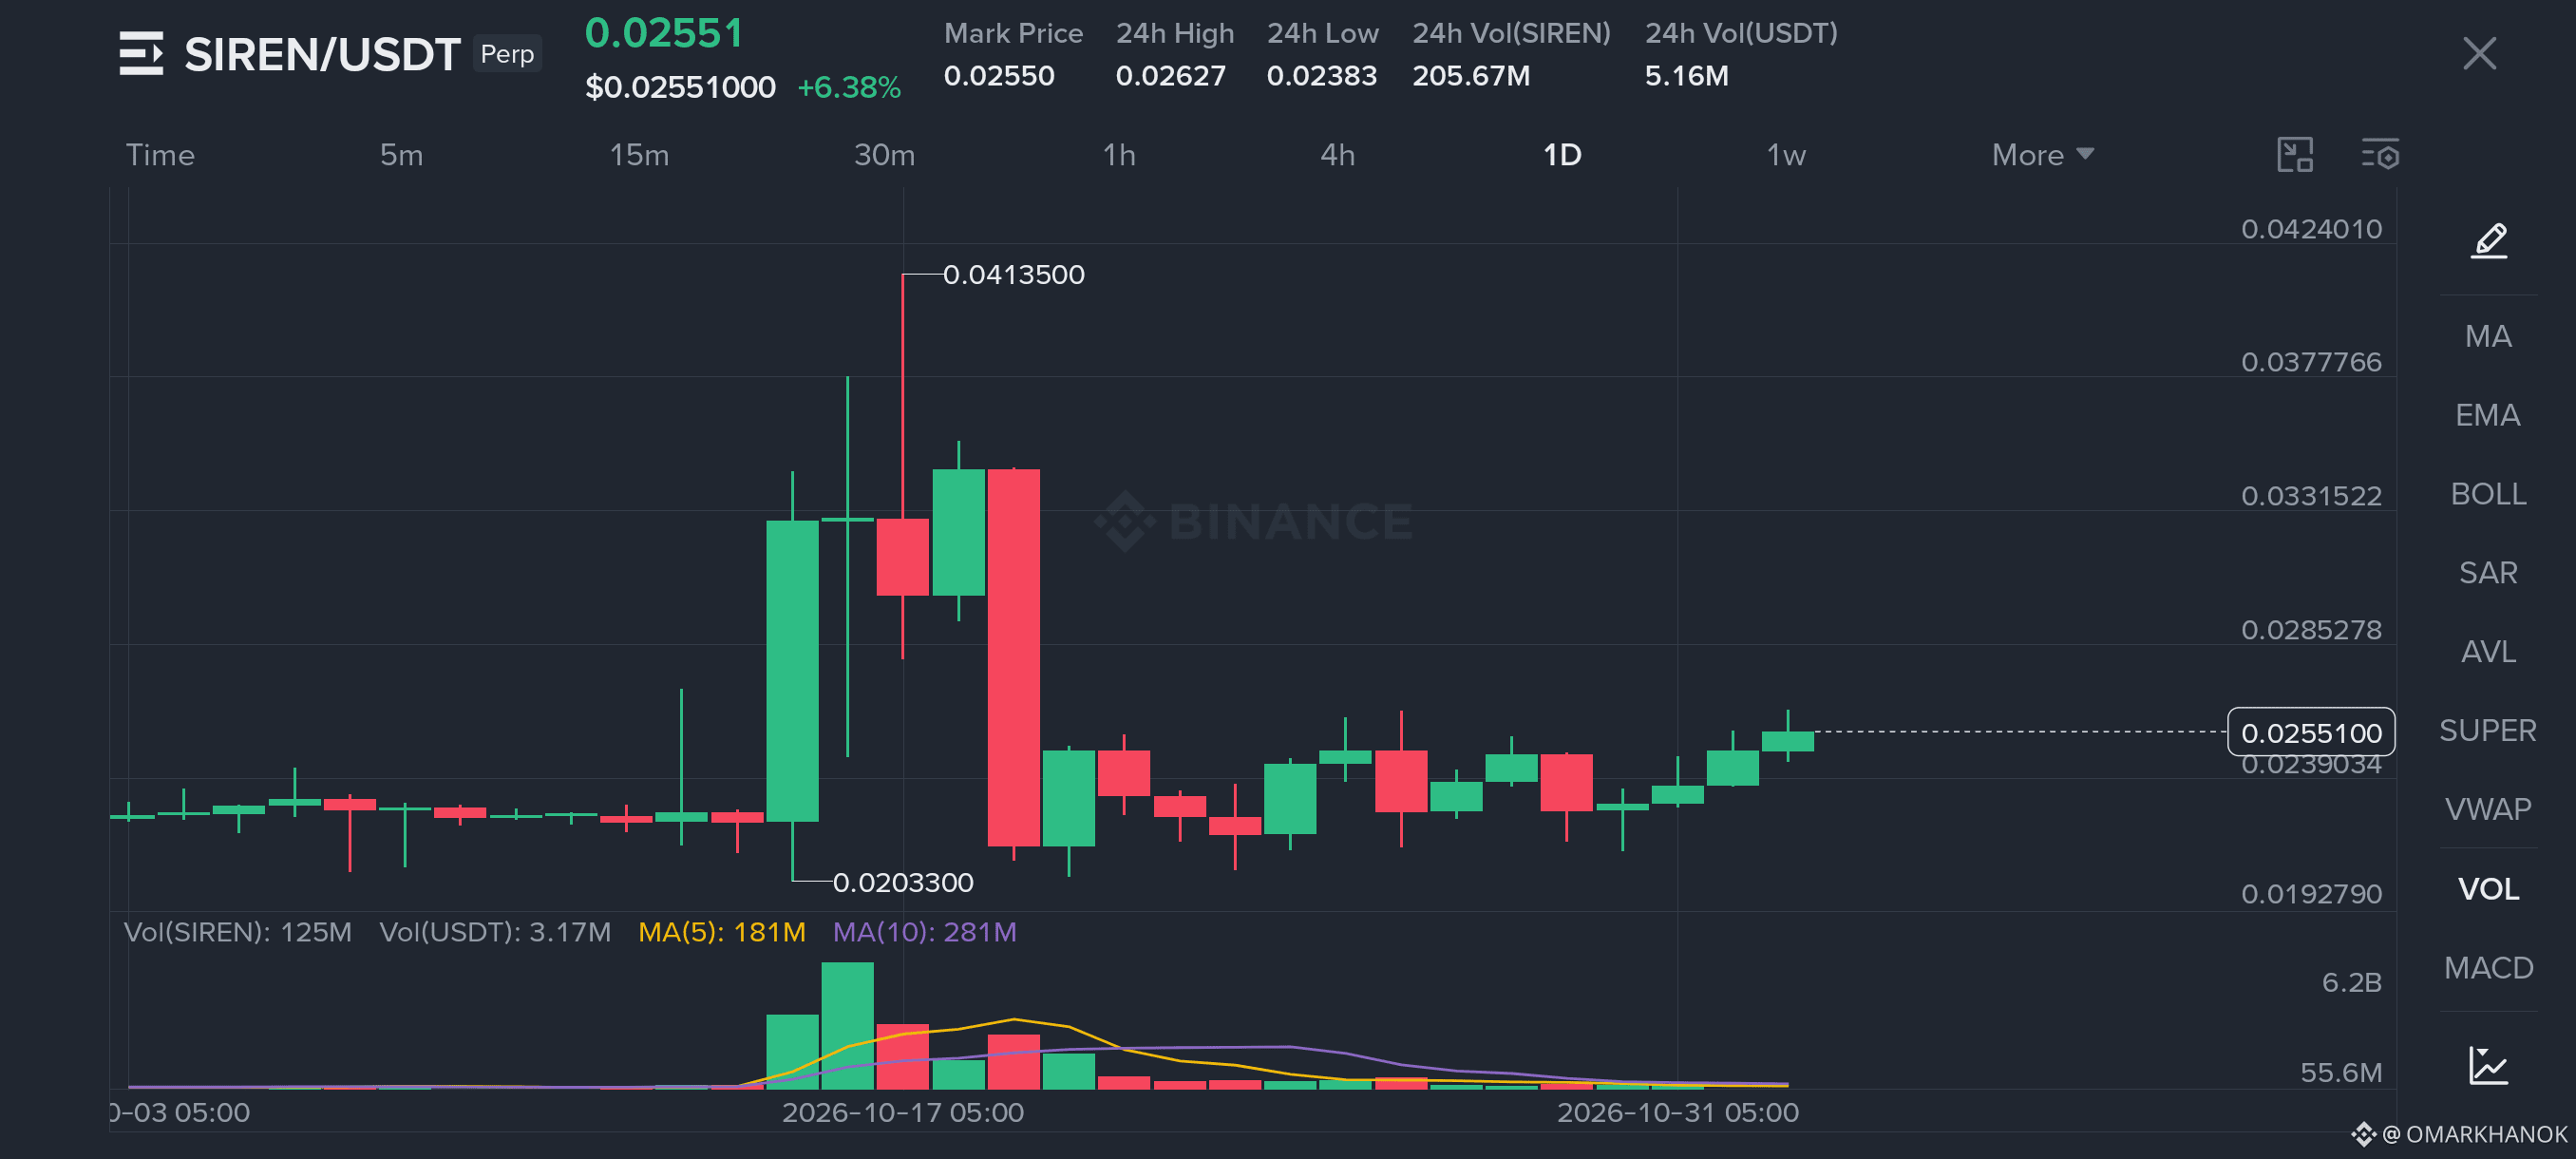
🚀 $SIREN BUYERS ARE TARGETING HIGHER LEVELS!
$SIREN /USDT — LONG TRADE SIGNAL
Entry Zone: 0.02540 – 0.02580
Take Profit Targets:
TP1: 0.02630
TP2: 0.02680
Final TP: 0.02750
Stop Loss: 0.02490
TRADE MANAGEMENT PLAN:
TP1: Move SL to breakeven.
TP2: Secure partial profits and move SL to TP1.
Final TP: Close the trade and secure profits.
Share your thoughts in the comments.
To trade, click here👇
{future}(SIRENUSDT)
#SİREN #TradingSignals #trading #BinanceRestores28FiatWithdrawals #BitcoinClosesAbove50WeekMAFor7thStraightWeek
🚀 $SIREN BUYERS ARE TARGETING HIGHER LEVELS!
$SIREN /USDT — LONG TRADE SIGNAL
Entry Zone: 0.02540 – 0.02580
Take Profit Targets:
TP1: 0.02630
TP2: 0.02680
Final TP: 0.02750
Stop Loss: 0.02490
TRADE MANAGEMENT PLAN:
TP1: Move SL to breakeven.
TP2: Secure partial profits and move SL to TP1.
Final TP: Close the trade and secure profits.
Share your thoughts in the comments.
To trade, click here👇
#SİREN #TradingSignals #trading #BinanceRestores28FiatWithdrawals #BitcoinClosesAbove50WeekMAFor7thStraightWeek
$SIREN /USDT — LONG TRADE SIGNAL
Entry Zone: 0.02540 – 0.02580
Take Profit Targets:
TP1: 0.02630
TP2: 0.02680
Final TP: 0.02750
Stop Loss: 0.02490
TRADE MANAGEMENT PLAN:
TP1: Move SL to breakeven.
TP2: Secure partial profits and move SL to TP1.
Final TP: Close the trade and secure profits.
Share your thoughts in the comments.
To trade, click here👇
#SİREN #TradingSignals #trading #BinanceRestores28FiatWithdrawals #BitcoinClosesAbove50WeekMAFor7thStraightWeek
1
450

·
--
Падение
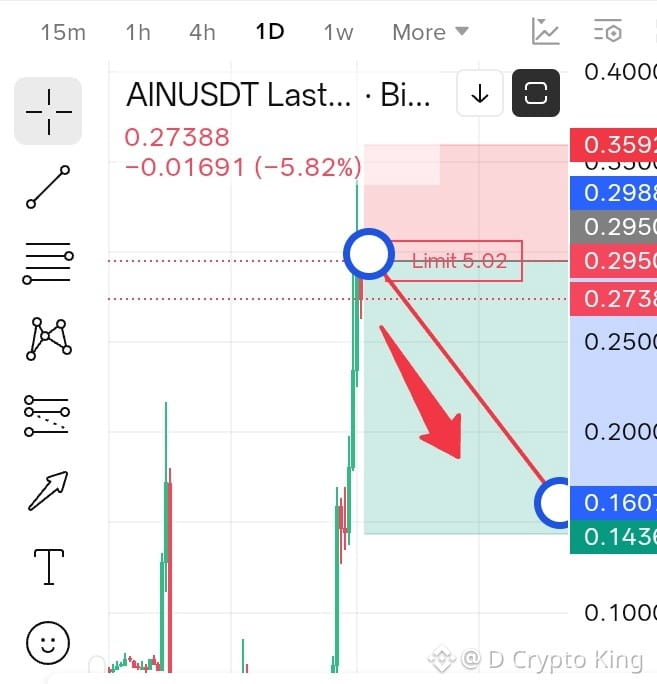
$AIN USDT — #SHORT📉 SETUP 📉
Price is showing rejection after a massive upward pump.
Entry Zone: 0.2900 – 0.3000
Take Profit Targets 🎯
TP1: 0.2500
TP2: 0.2000
TP3: 0.1600
TP4: 0.1436
#like_comment_follow
#BinanceRestores28FiatWithdrawals #BitcoinClosesAbove50WeekMAFor7thStraightWeek #IndiaRBIAndFIUReviewOverseasCryptoCards
$EVAA $BTW
$AIN USDT — #SHORT📉 SETUP 📉
Price is showing rejection after a massive upward pump.
Entry Zone: 0.2900 – 0.3000
Take Profit Targets 🎯
TP1: 0.2500
TP2: 0.2000
TP3: 0.1600
TP4: 0.1436
#like_comment_follow
#BinanceRestores28FiatWithdrawals #BitcoinClosesAbove50WeekMAFor7thStraightWeek #IndiaRBIAndFIUReviewOverseasCryptoCards
$EVAA $BTW
Price is showing rejection after a massive upward pump.
Entry Zone: 0.2900 – 0.3000
Take Profit Targets 🎯
TP1: 0.2500
TP2: 0.2000
TP3: 0.1600
TP4: 0.1436
#like_comment_follow
#BinanceRestores28FiatWithdrawals #BitcoinClosesAbove50WeekMAFor7thStraightWeek #IndiaRBIAndFIUReviewOverseasCryptoCards
$EVAA $BTW
1.1k

·
--
Рост
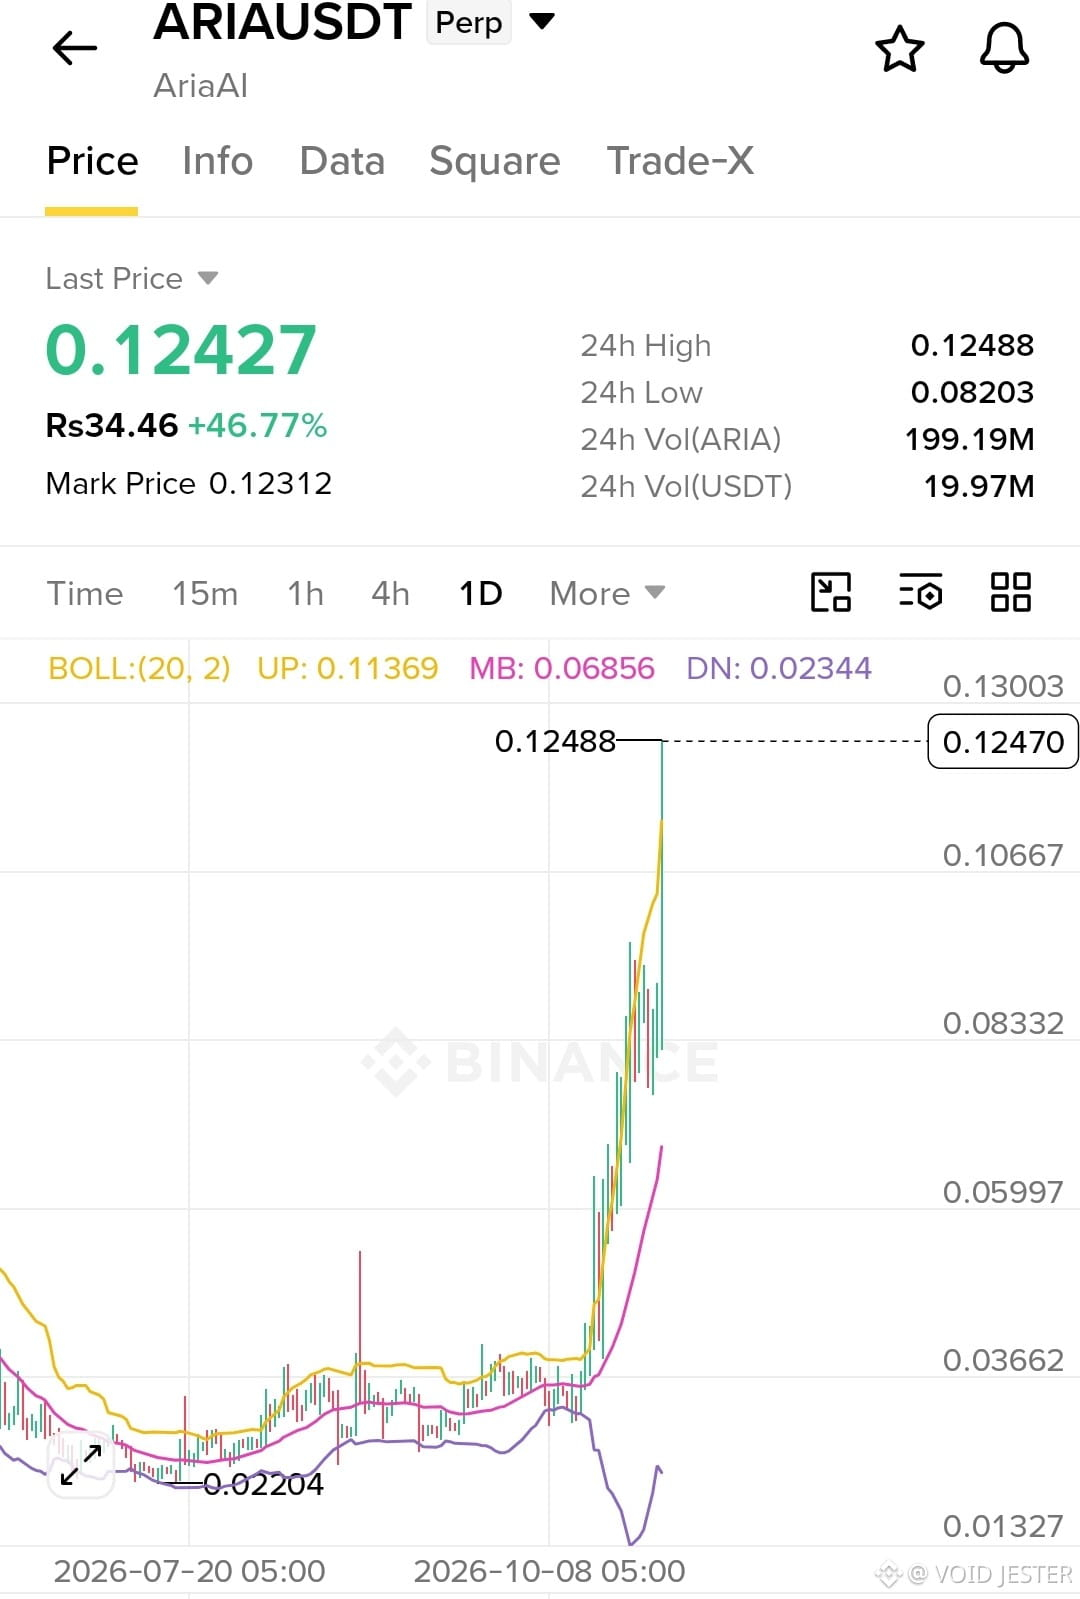
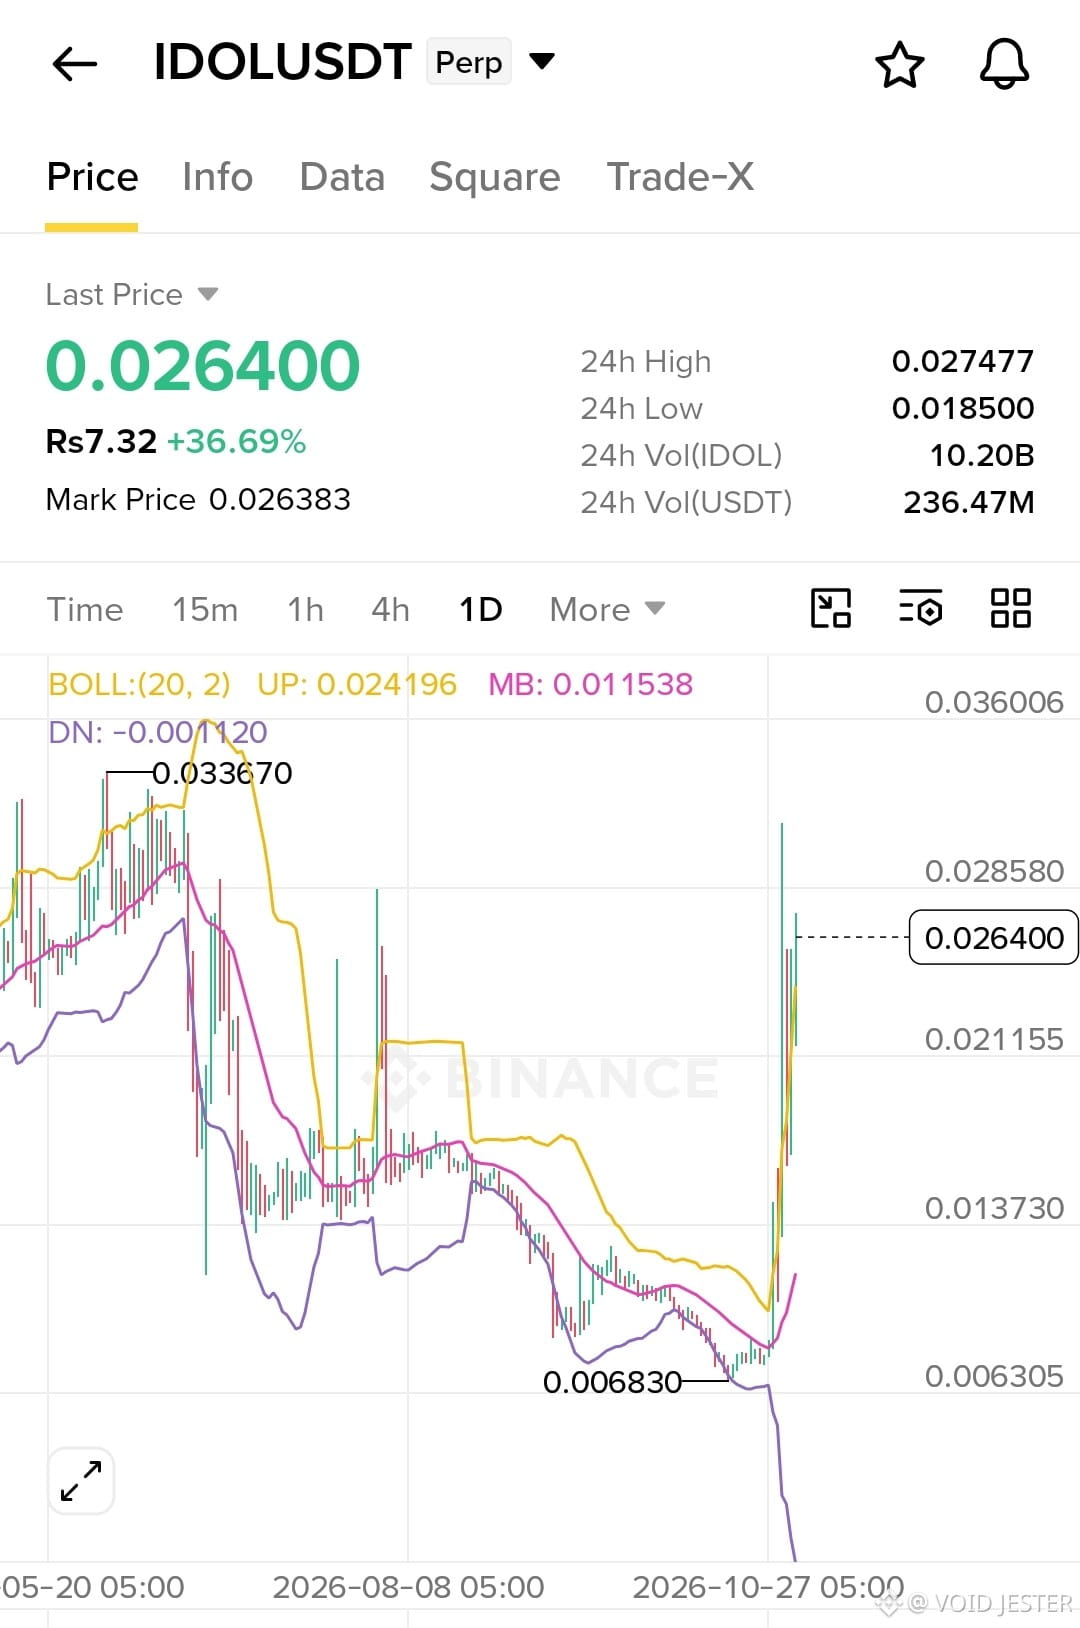
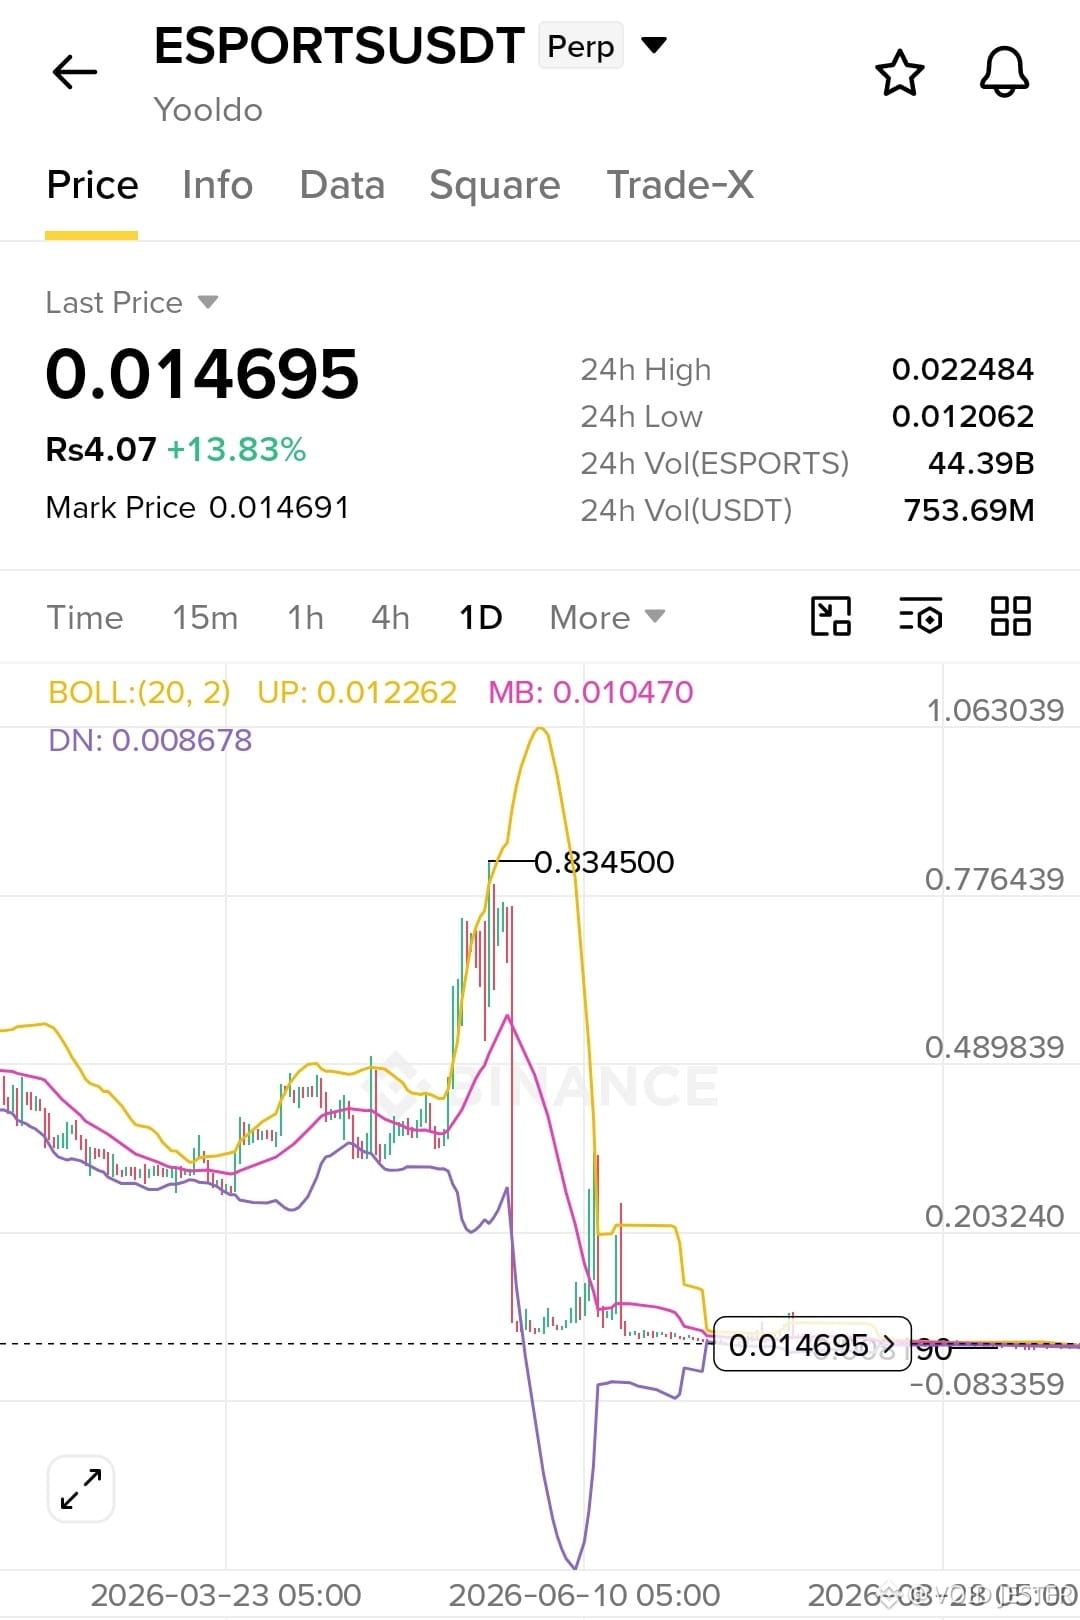
🚀 Three altcoins are catching attention today! $ARIA leads with a 46.77% gain at $0.12427, nearing its $0.12488 daily high. $IDOL follows, up 36.69% to $0.02640, with $236.47M in 24-hour volume. $ESPORTS is gaining 13.83% at $0.014695, backed by $753.69M volume. 📊 All three show strong momentum after sharp daily-chart moves, but volatility remains high, especially after such rapid price increases. Watch key resistance, volume, and support before entering; sudden pullbacks are possible. Trade carefully and manage risk. DYOR! 🔥
#BinanceRestores28FiatWithdrawals #BitcoinClosesAbove50WeekMAFor7thStraightWeek #SolanaMobileRemovesMaliciousSKRClaimApp #BrazilVirtualAssetLicenseDeadlineDrawsAbout40Firms #BTCPayServerUrgesOperatorsToShutDownInstances
{future}(ARIAUSDT)
{future}(IDOLUSDT)
{future}(ESPORTSUSDT)
🚀 Three altcoins are catching attention today! $ARIA leads with a 46.77% gain at $0.12427, nearing its $0.12488 daily high. $IDOL follows, up 36.69% to $0.02640, with $236.47M in 24-hour volume. $ESPORTS is gaining 13.83% at $0.014695, backed by $753.69M volume. 📊 All three show strong momentum after sharp daily-chart moves, but volatility remains high, especially after such rapid price increases. Watch key resistance, volume, and support before entering; sudden pullbacks are possible. Trade carefully and manage risk. DYOR! 🔥
#BinanceRestores28FiatWithdrawals #BitcoinClosesAbove50WeekMAFor7thStraightWeek #SolanaMobileRemovesMaliciousSKRClaimApp #BrazilVirtualAssetLicenseDeadlineDrawsAbout40Firms #BTCPayServerUrgesOperatorsToShutDownInstances
#BinanceRestores28FiatWithdrawals #BitcoinClosesAbove50WeekMAFor7thStraightWeek #SolanaMobileRemovesMaliciousSKRClaimApp #BrazilVirtualAssetLicenseDeadlineDrawsAbout40Firms #BTCPayServerUrgesOperatorsToShutDownInstances
1
831
Войдите, чтобы посмотреть больше материала
Присоединяйтесь к пользователям криптовалют по всему миру на Binance Square
⚡️ Получайте новейшую и полезную информацию о криптоактивах.
💬 Нам доверяет крупнейшая в мире криптобиржа.
👍 Получите достоверные аналитические данные от верифицированных создателей контента.
Эл. почта/номер телефона
В тренде
1
#BinanceWithdrawalScamWarning
Просмотров: 35,380
618 обсуждают
2
#USMidtermElections
Просмотров: 598,152
3,187 обсуждают
3
#USOctoberNFP-AreRateCutsStillPossible
Просмотров: 42,856
505 обсуждают
4
#AppleEarningsAhead-CanStockHitNewHigh
Просмотров: 17,021
364 обсуждают
5
#Verify1to1BinanceReserves
Просмотров: 36,332
396 обсуждают
6
#BinanceRestores28FiatWithdrawals
Просмотров: 148,174
1,026 обсуждают
7
#StrategyRepurchases$208MSTRCAdds811Bitcoin
Просмотров: 7,096
17 обсуждают
8
#FATFLaunchesReviewOfCryptoHubsMoneyLaunderingControls
Просмотров: 643
14 обсуждают
9
#BinanceProcesses$4.65BWithdrawals
Просмотров: 115,351
368 обсуждают
10
#HKMALaunchesSAGEAgenticFinanceProject
Просмотров: 3,970
179 обсуждают