
CryptoT 1
47 Публикации

CryptoT 1
Отправить жалобу
Заблокировать пользователя
Technical Analysis Specialists
0 подписок(и/а)
0 подписчиков(а)
0 понравилось
Посты
·
--
См. перевод
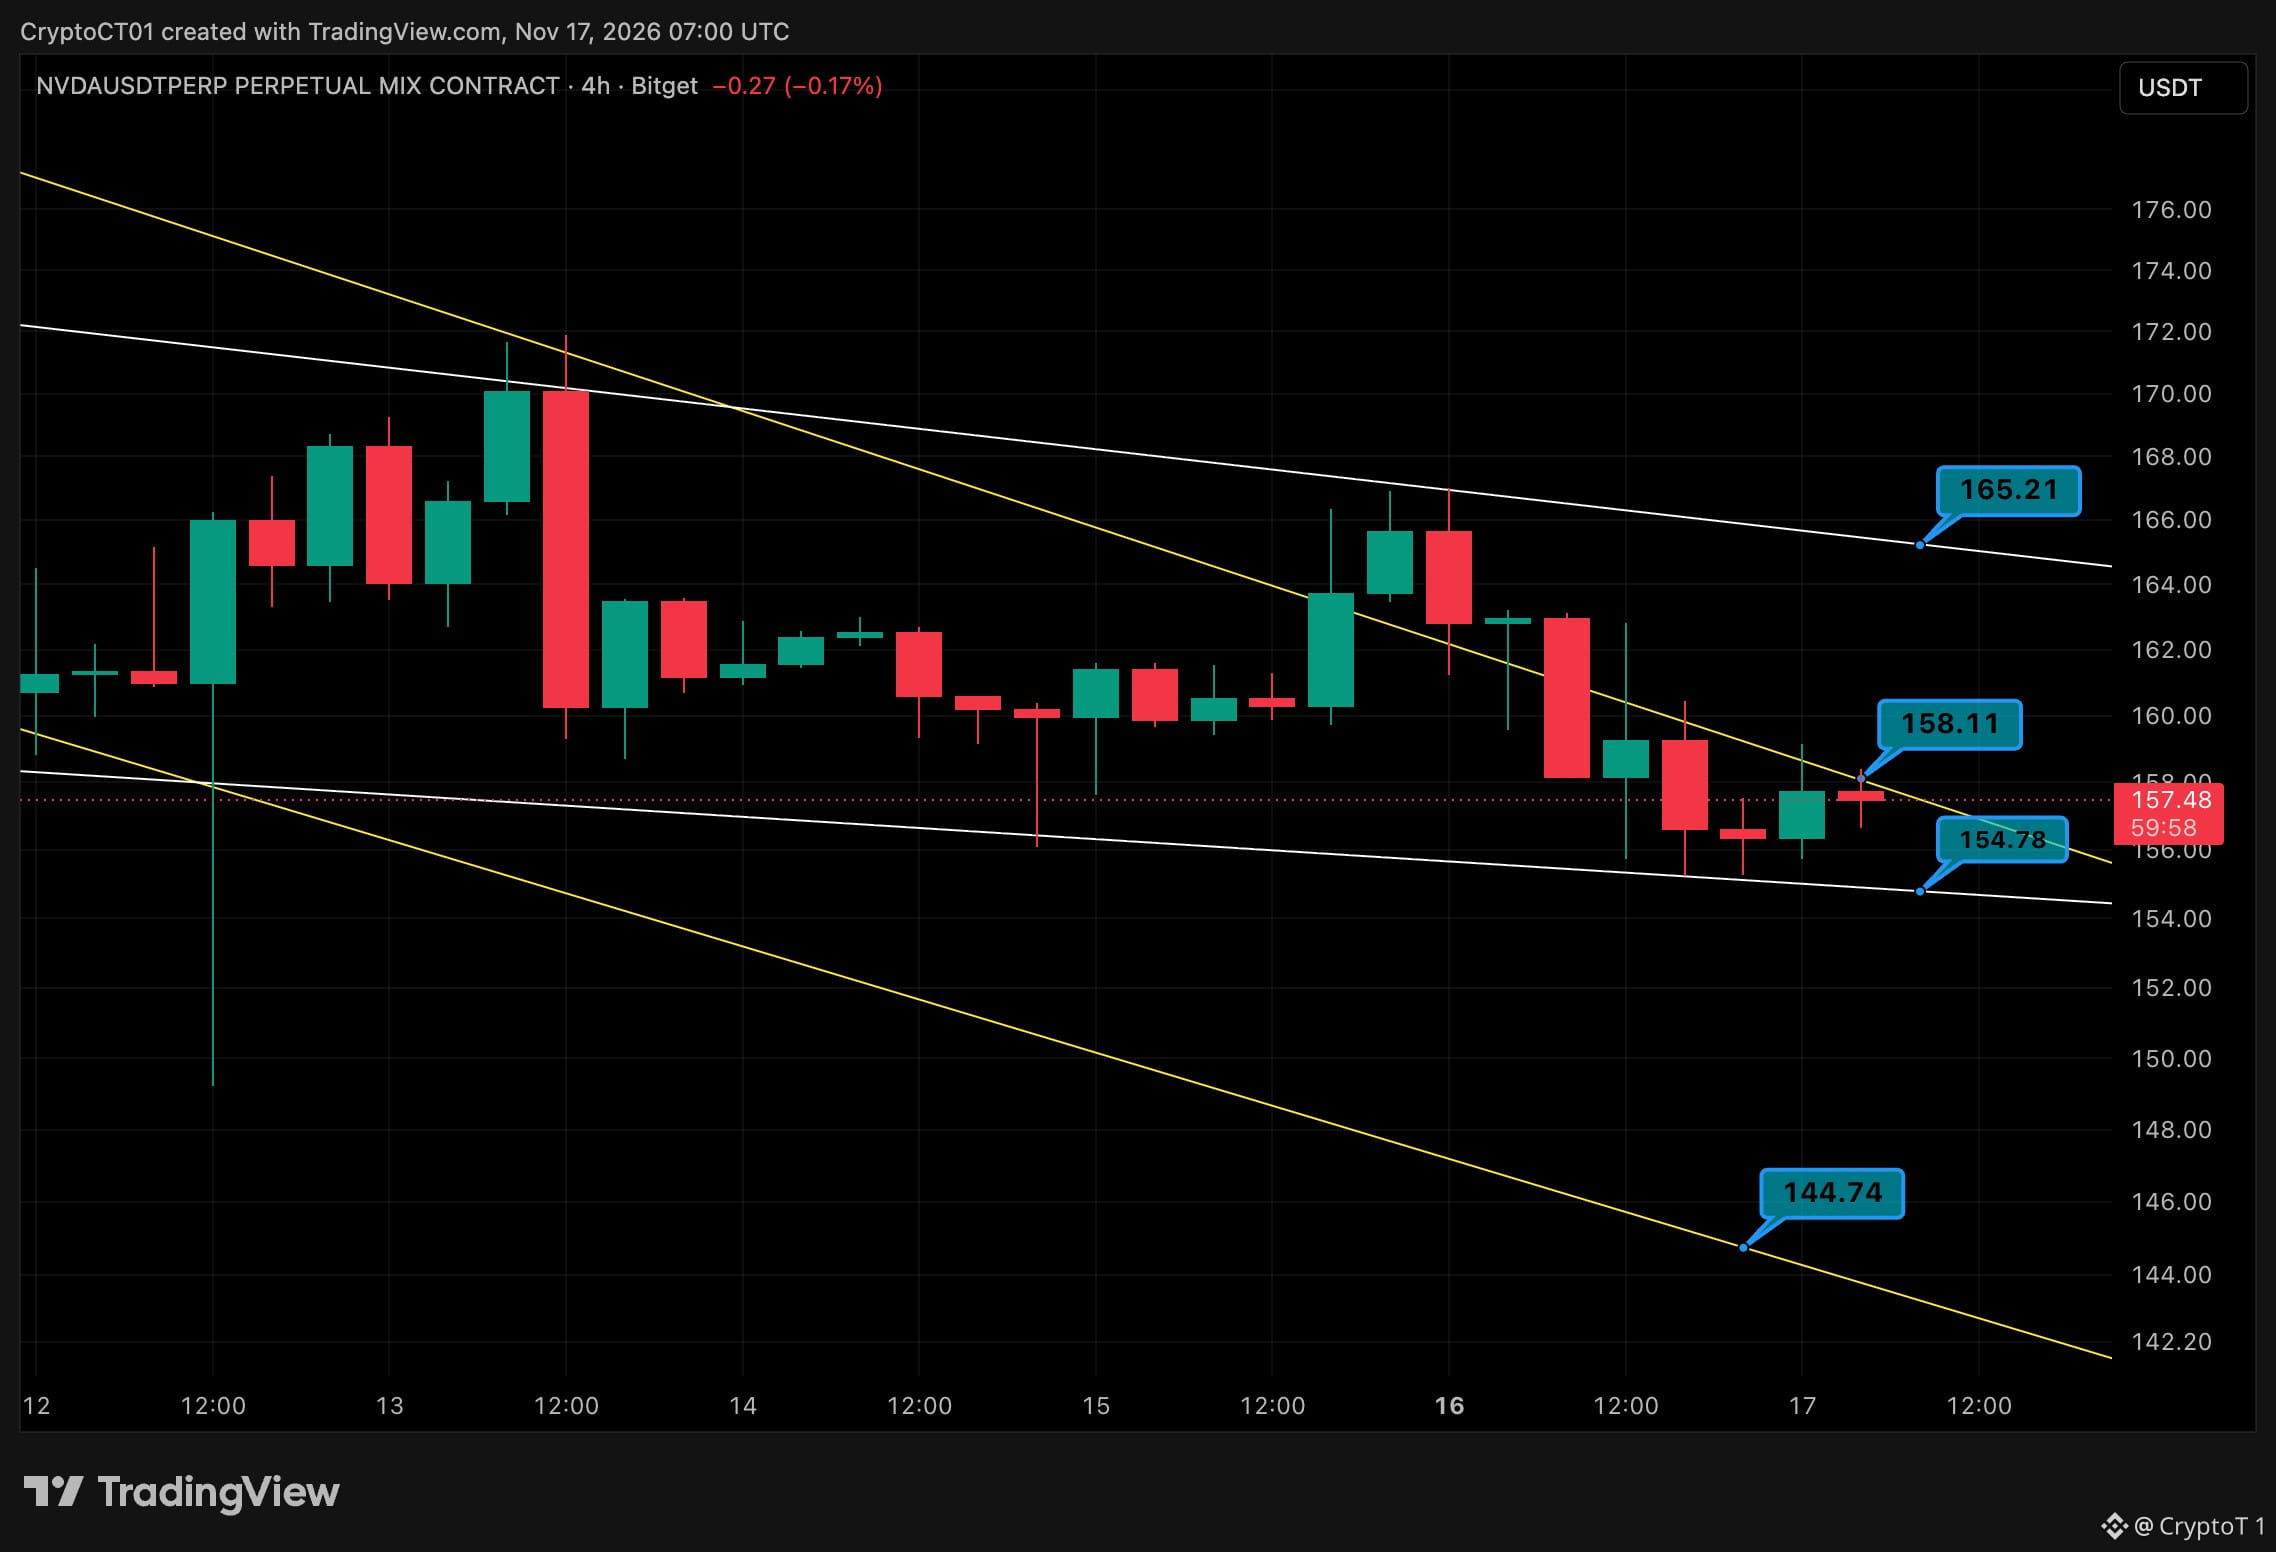
$NVDA Earnings Tonight: Squeezed Between Two Lines 🧨 Nvidia reports after the US close, around 9:20pm UK. The 4h chart is coiling right into it. 🔴 158.11 (falling trendline, testing now) 🔴 165.21 (top of the channel) 🟢 154.78 (channel floor) 🟢 144.74 (lower trendline) Context: NVDA has been making lower highs inside a falling channel since the 13th. Price is around 157.5, stuck between the trendline above and the channel floor below. My read: a 4h close above 158 opens a run at 165, and a strong beat could do that in one candle. Until then the trend is still down. I'm not guessing the print, I'm waiting for the reaction. The risk: earnings gaps ignore levels. Lose 154.78 and there's air down to 144.74. Size small or wait. Beat and rip to 165, or sell the news to 145? 👇 #NVDA #Nvidia
$NVDA Earnings Tonight: Squeezed Between Two Lines 🧨 Nvidia reports after the US close, around 9:20pm UK. The 4h chart is coiling right into it. 🔴 158.11 (falling trendline, testing now) 🔴 165.21 (top of the channel) 🟢 154.78 (channel floor) 🟢 144.74 (lower trendline) Context: NVDA has been making lower highs inside a falling channel since the 13th. Price is around 157.5, stuck between the trendline above and the channel floor below. My read: a 4h close above 158 opens a run at 165, and a strong beat could do that in one candle. Until then the trend is still down. I'm not guessing the print, I'm waiting for the reaction. The risk: earnings gaps ignore levels. Lose 154.78 and there's air down to 144.74. Size small or wait. Beat and rip to 165, or sell the news to 145? 👇 #NVDA #Nvidia
·
--
См. перевод
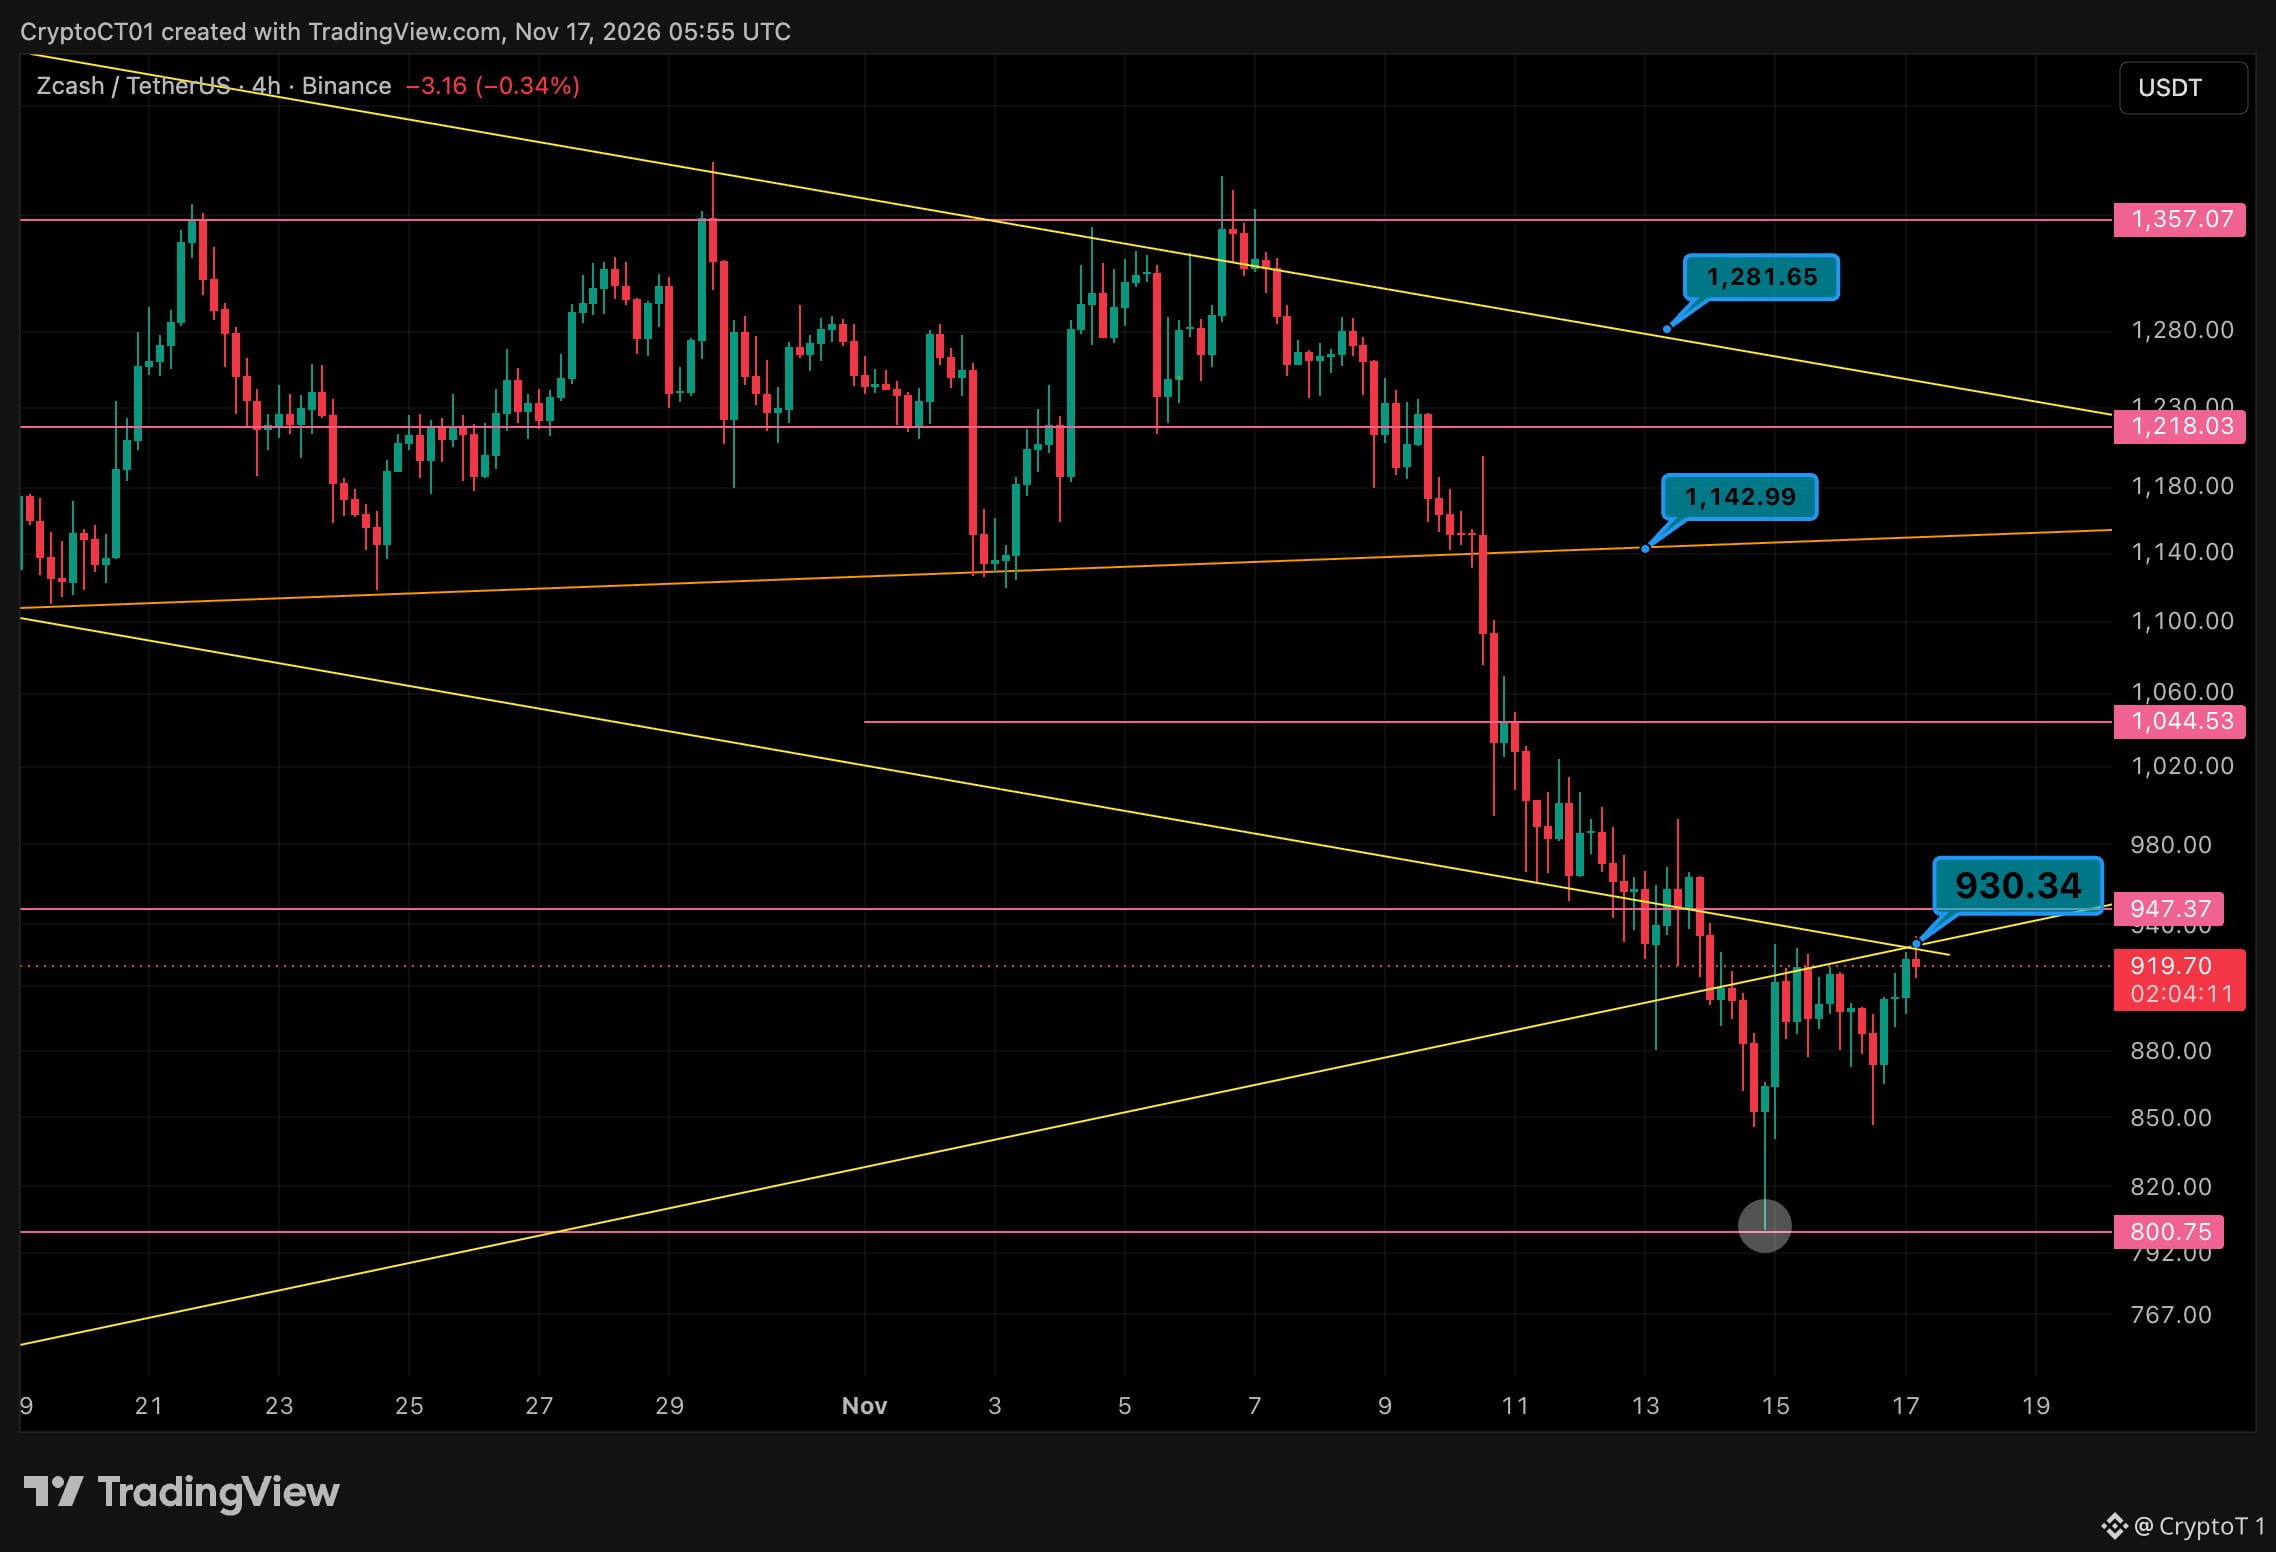
$ZEC Bounced Off 800 And Is Back At The Trendline 🎯 Yesterday I said 800 was the last real buyer. It held. Price printed a higher low and is now pressing into the trendline at 930. 🔴 930 (trendline, testing now) 🔴 947 (the level that broke last week) 🟢 800 (the wick low) Context: ZEC is still making lower highs since early November, but buyers stepped in at 800 and again higher up. Price is back around 920. My read: a clean 4h close above 947 flips this into a proper relief move toward 1,044. Until then it's a bounce into resistance, so I'm not chasing. Let price come to you. The risk: another rejection at the trendline and 800 gets retested. Lose it and there's no clear support below. Breakout above 947 or another trip to 800? 👇 #ZEC #Zcash
$ZEC Bounced Off 800 And Is Back At The Trendline 🎯 Yesterday I said 800 was the last real buyer. It held. Price printed a higher low and is now pressing into the trendline at 930. 🔴 930 (trendline, testing now) 🔴 947 (the level that broke last week) 🟢 800 (the wick low) Context: ZEC is still making lower highs since early November, but buyers stepped in at 800 and again higher up. Price is back around 920. My read: a clean 4h close above 947 flips this into a proper relief move toward 1,044. Until then it's a bounce into resistance, so I'm not chasing. Let price come to you. The risk: another rejection at the trendline and 800 gets retested. Lose it and there's no clear support below. Breakout above 947 or another trip to 800? 👇 #ZEC #Zcash
·
--
См. перевод
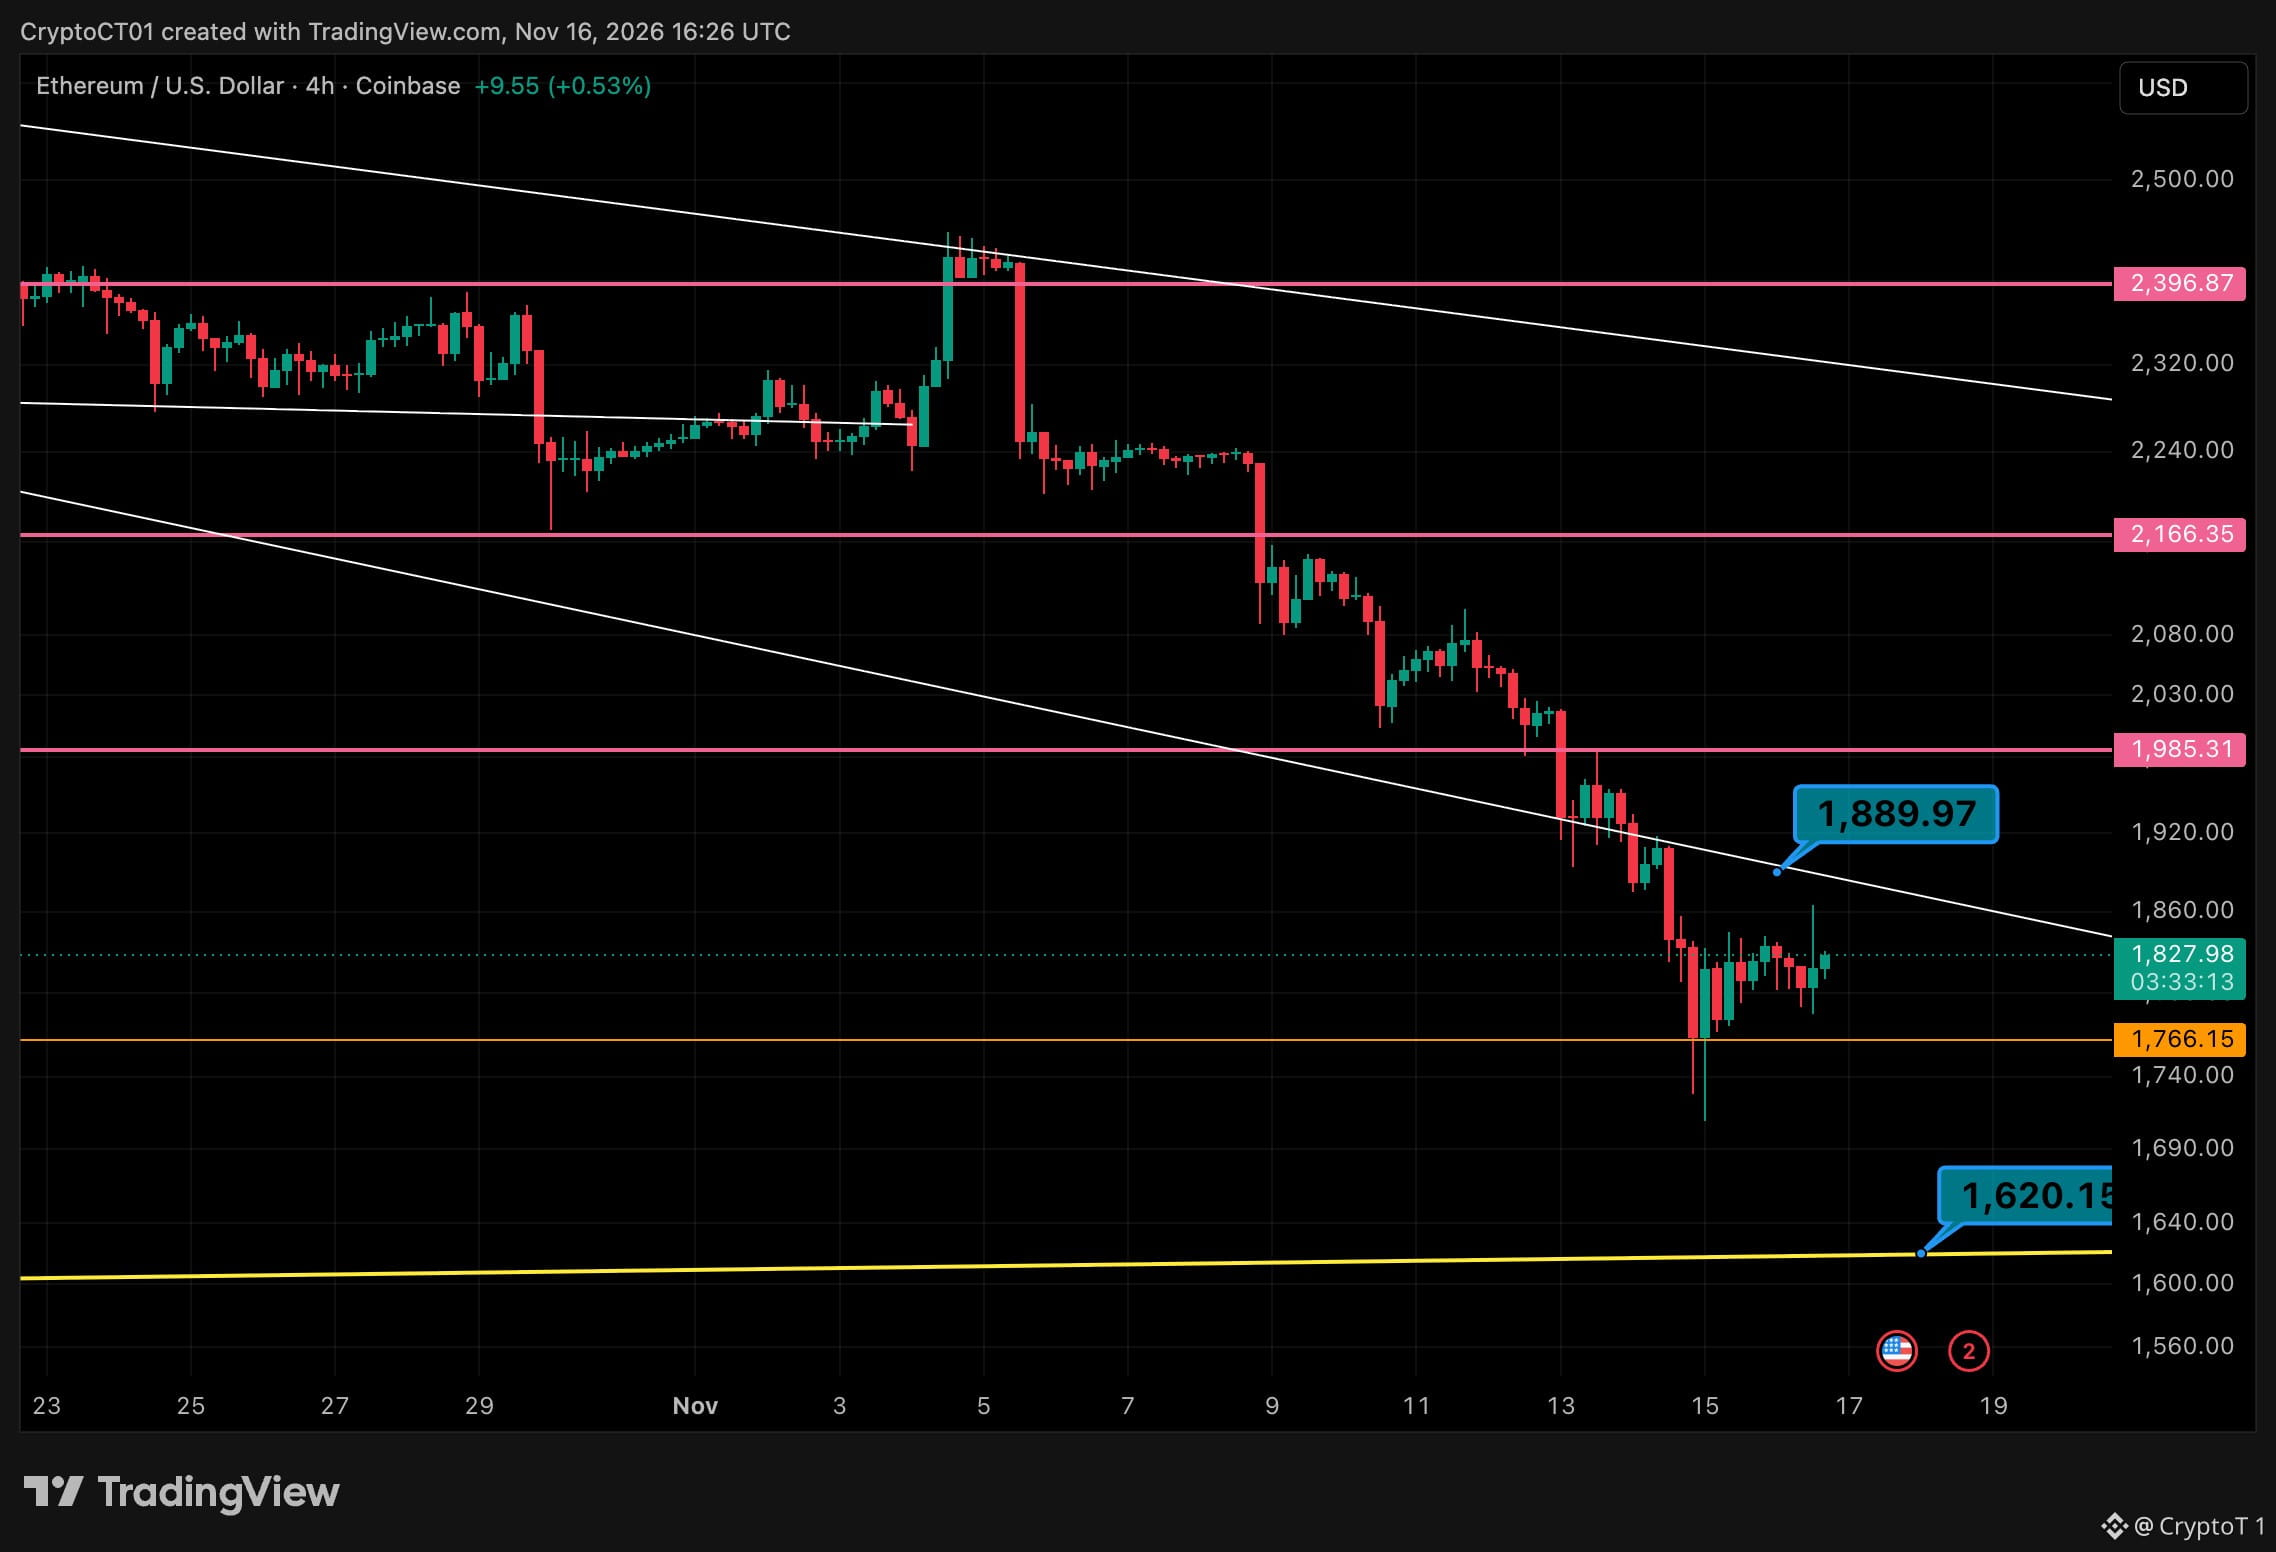
$ETH 4H: Squeezed Into The Trendline And Rejected 🧭 🔴 1,889.97 (falling trendline) 🔴 1,985.31 🟢 1,766.15 🟢 1,620.15 (long-term rising line) Context: ETH has been making lower highs since early Nov. Today's US open squeeze tapped near the trendline and faded straight back to 1,828. My read: until it closes a 4H candle above the trendline, every bounce is a lower high. 1,766 is the floor bulls have to defend. The risk: lose 1,766 and there's not much support until the 1,620 line. Trendline break or 1,620 retest first? 👇 #ETH #Crypto
$ETH 4H: Squeezed Into The Trendline And Rejected 🧭 🔴 1,889.97 (falling trendline) 🔴 1,985.31 🟢 1,766.15 🟢 1,620.15 (long-term rising line) Context: ETH has been making lower highs since early Nov. Today's US open squeeze tapped near the trendline and faded straight back to 1,828. My read: until it closes a 4H candle above the trendline, every bounce is a lower high. 1,766 is the floor bulls have to defend. The risk: lose 1,766 and there's not much support until the 1,620 line. Trendline break or 1,620 retest first? 👇 #ETH #Crypto
7
·
--
См. перевод
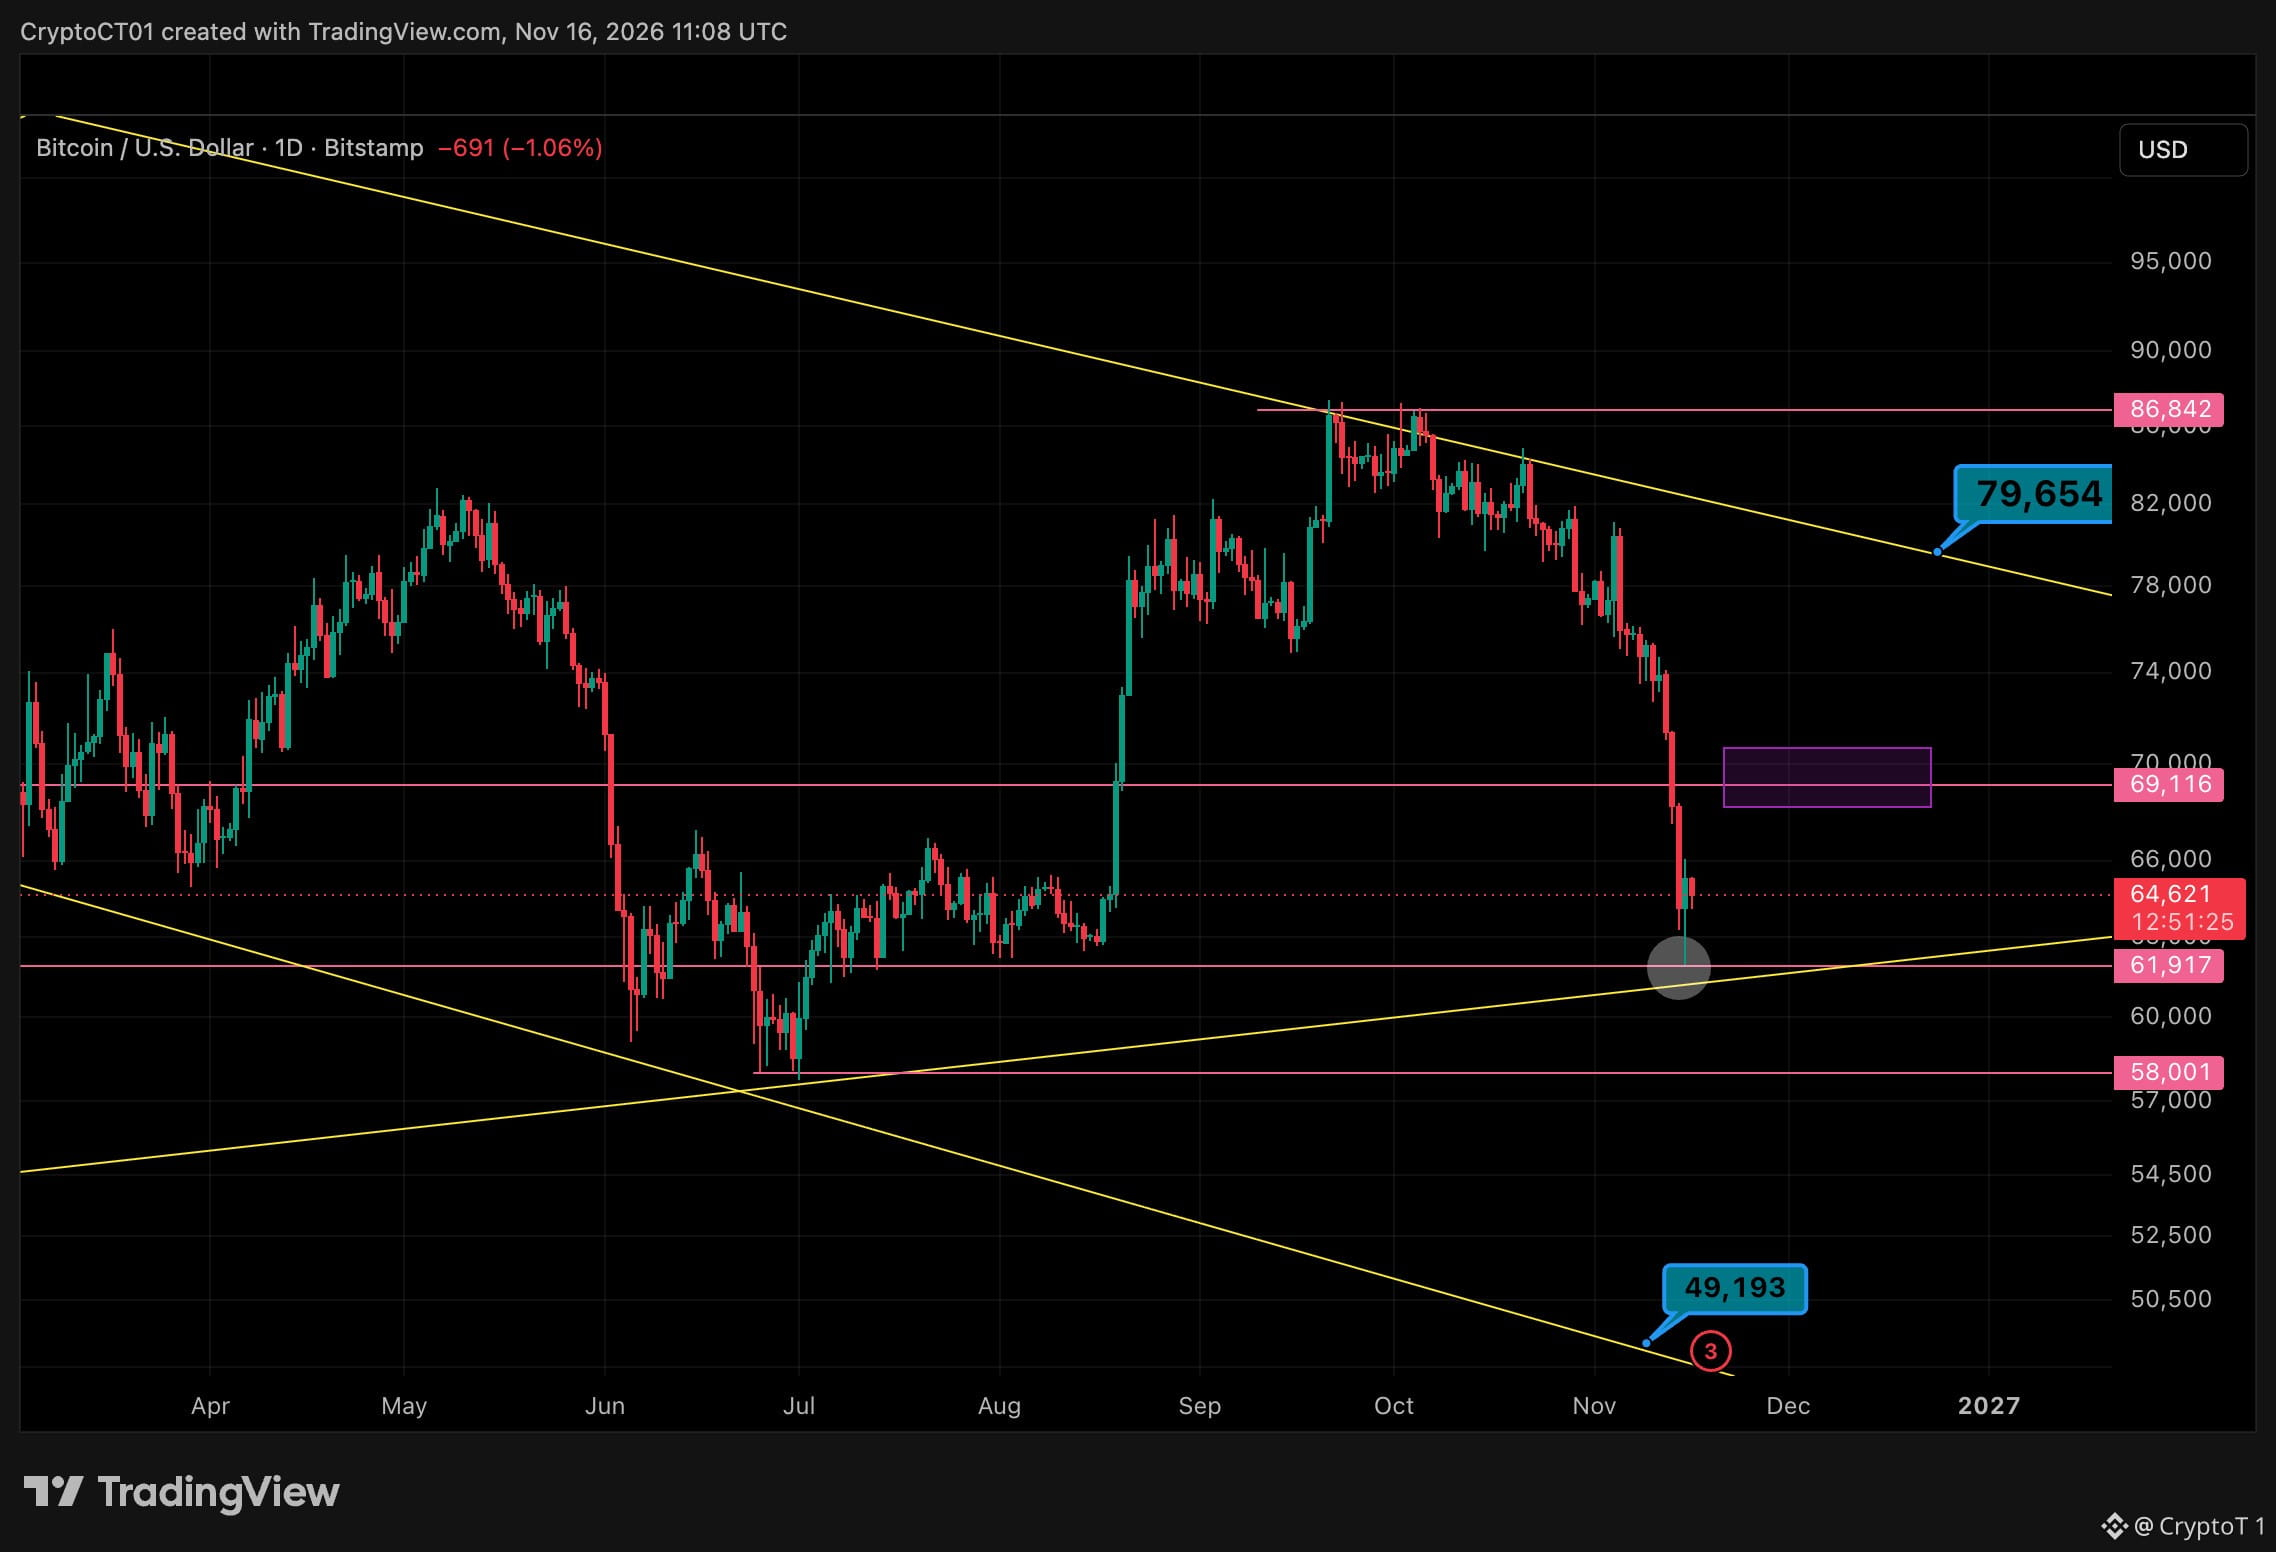
$BTC Higher Timeframe: Sitting On The Last Line Before 58K 🧭 Daily chart, weekly as confirmation. Six red weeks and price just tagged the rising trendline at 62K. 🔴 69,116 (old support, now resistance) 🔴 79,654 (falling trendline from the highs) 🟢 61,917 (rising trendline, the line that has to hold) 🟢 58,001 (summer lows) Context: BTC dropped from 86.8K straight through 69K and wicked into 62K. The weekly is still printing lower highs under the falling trendline. My read: 62K is the line that matters this week. If it holds, a relief bounce into 69K is on the table. That's where I'd expect sellers to step back in. The risk: lose 62K on a daily close and 58K is next. Below that, the channel floor points at 49K. Bounce to 69K or 58K first? 👇 #Bitcoin #BTC
$BTC Higher Timeframe: Sitting On The Last Line Before 58K 🧭 Daily chart, weekly as confirmation. Six red weeks and price just tagged the rising trendline at 62K. 🔴 69,116 (old support, now resistance) 🔴 79,654 (falling trendline from the highs) 🟢 61,917 (rising trendline, the line that has to hold) 🟢 58,001 (summer lows) Context: BTC dropped from 86.8K straight through 69K and wicked into 62K. The weekly is still printing lower highs under the falling trendline. My read: 62K is the line that matters this week. If it holds, a relief bounce into 69K is on the table. That's where I'd expect sellers to step back in. The risk: lose 62K on a daily close and 58K is next. Below that, the channel floor points at 49K. Bounce to 69K or 58K first? 👇 #Bitcoin #BTC
53
·
--
См. перевод
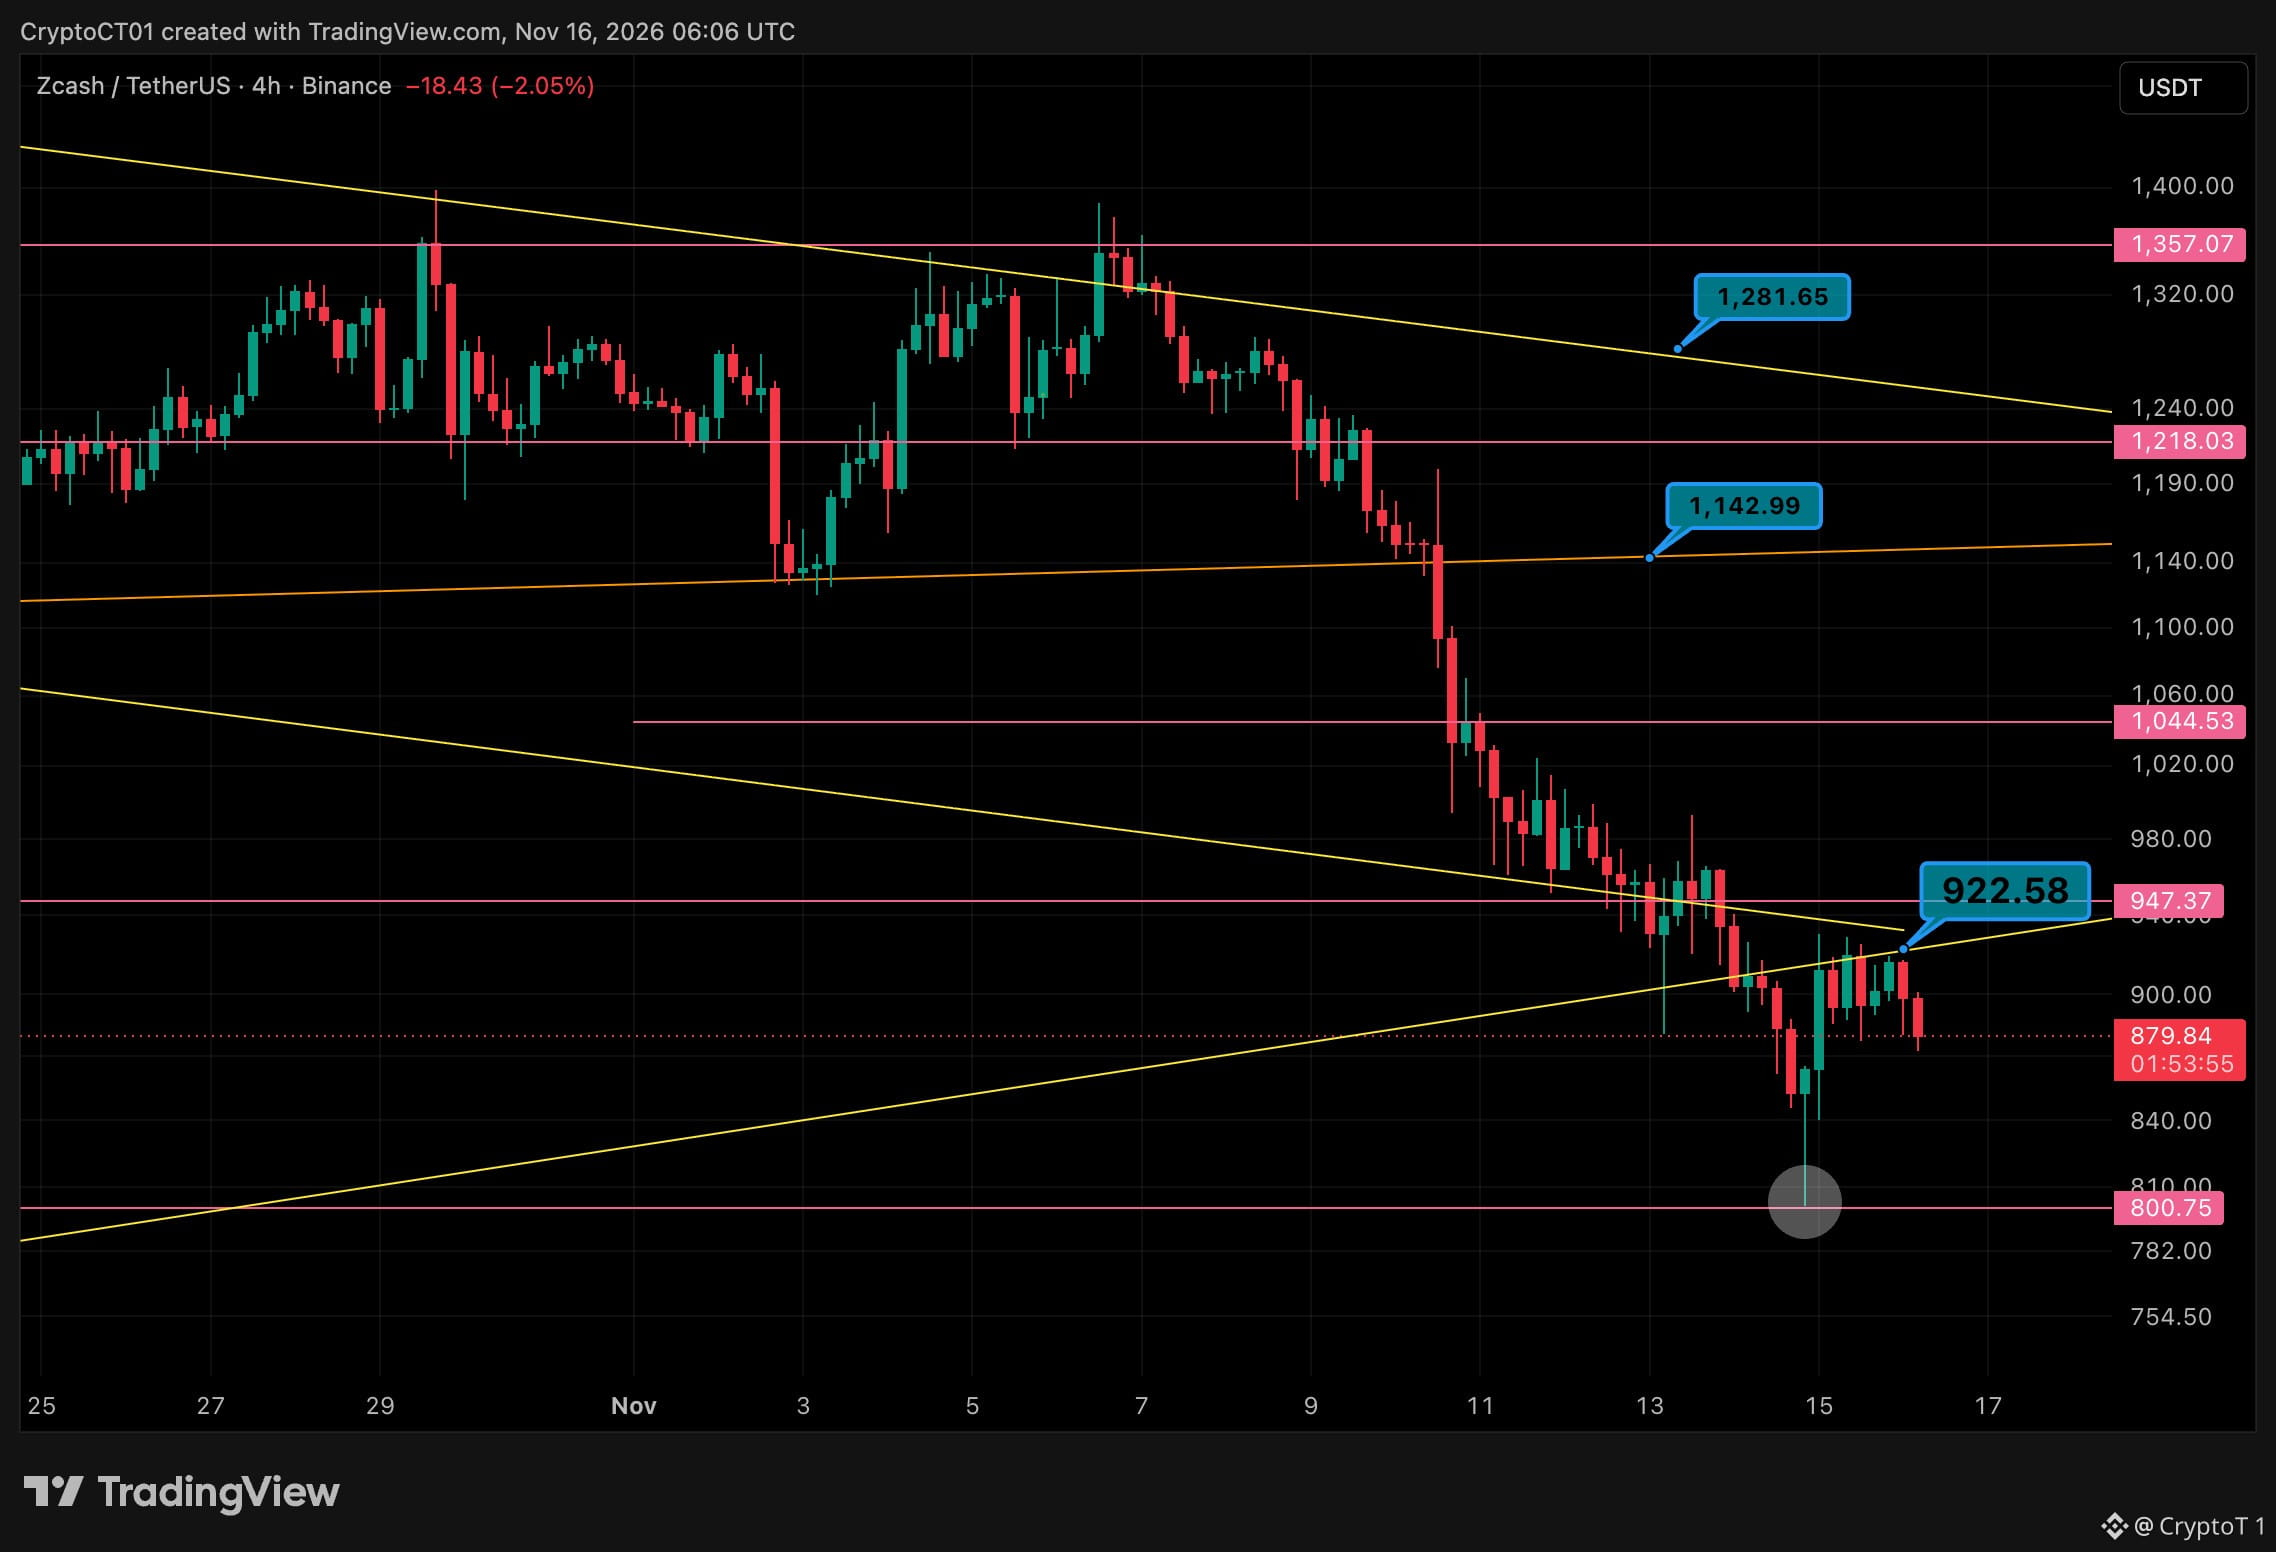
$ZEC Lost The 900 Zone. Retest Got Rejected 📉 Last week it bounced off 900 into 946. That bounce failed: 947 gave way, price wicked to 800 and the retest of the broken trendline got rejected at 922. 🔴 947 🔴 922 (broken trendline, now resistance) 🟢 800 (the wick low) Context: ZEC has been printing lower highs since early November and every bounce is getting sold at the falling trendline. Now trading around 880. My read: under 922 this is still a downtrend. A clean 4h close back above it and 947 is next. Until then I'm not chasing longs, let price come to you. The risk: lose 800 and there's no clear support under it, that wick was the last real buyer. Bounce from here or one more trip to 800? 👇 #ZEC #Zcash
$ZEC Lost The 900 Zone. Retest Got Rejected 📉 Last week it bounced off 900 into 946. That bounce failed: 947 gave way, price wicked to 800 and the retest of the broken trendline got rejected at 922. 🔴 947 🔴 922 (broken trendline, now resistance) 🟢 800 (the wick low) Context: ZEC has been printing lower highs since early November and every bounce is getting sold at the falling trendline. Now trading around 880. My read: under 922 this is still a downtrend. A clean 4h close back above it and 947 is next. Until then I'm not chasing longs, let price come to you. The risk: lose 800 and there's no clear support under it, that wick was the last real buyer. Bounce from here or one more trip to 800? 👇 #ZEC #Zcash
60
·
--
См. перевод
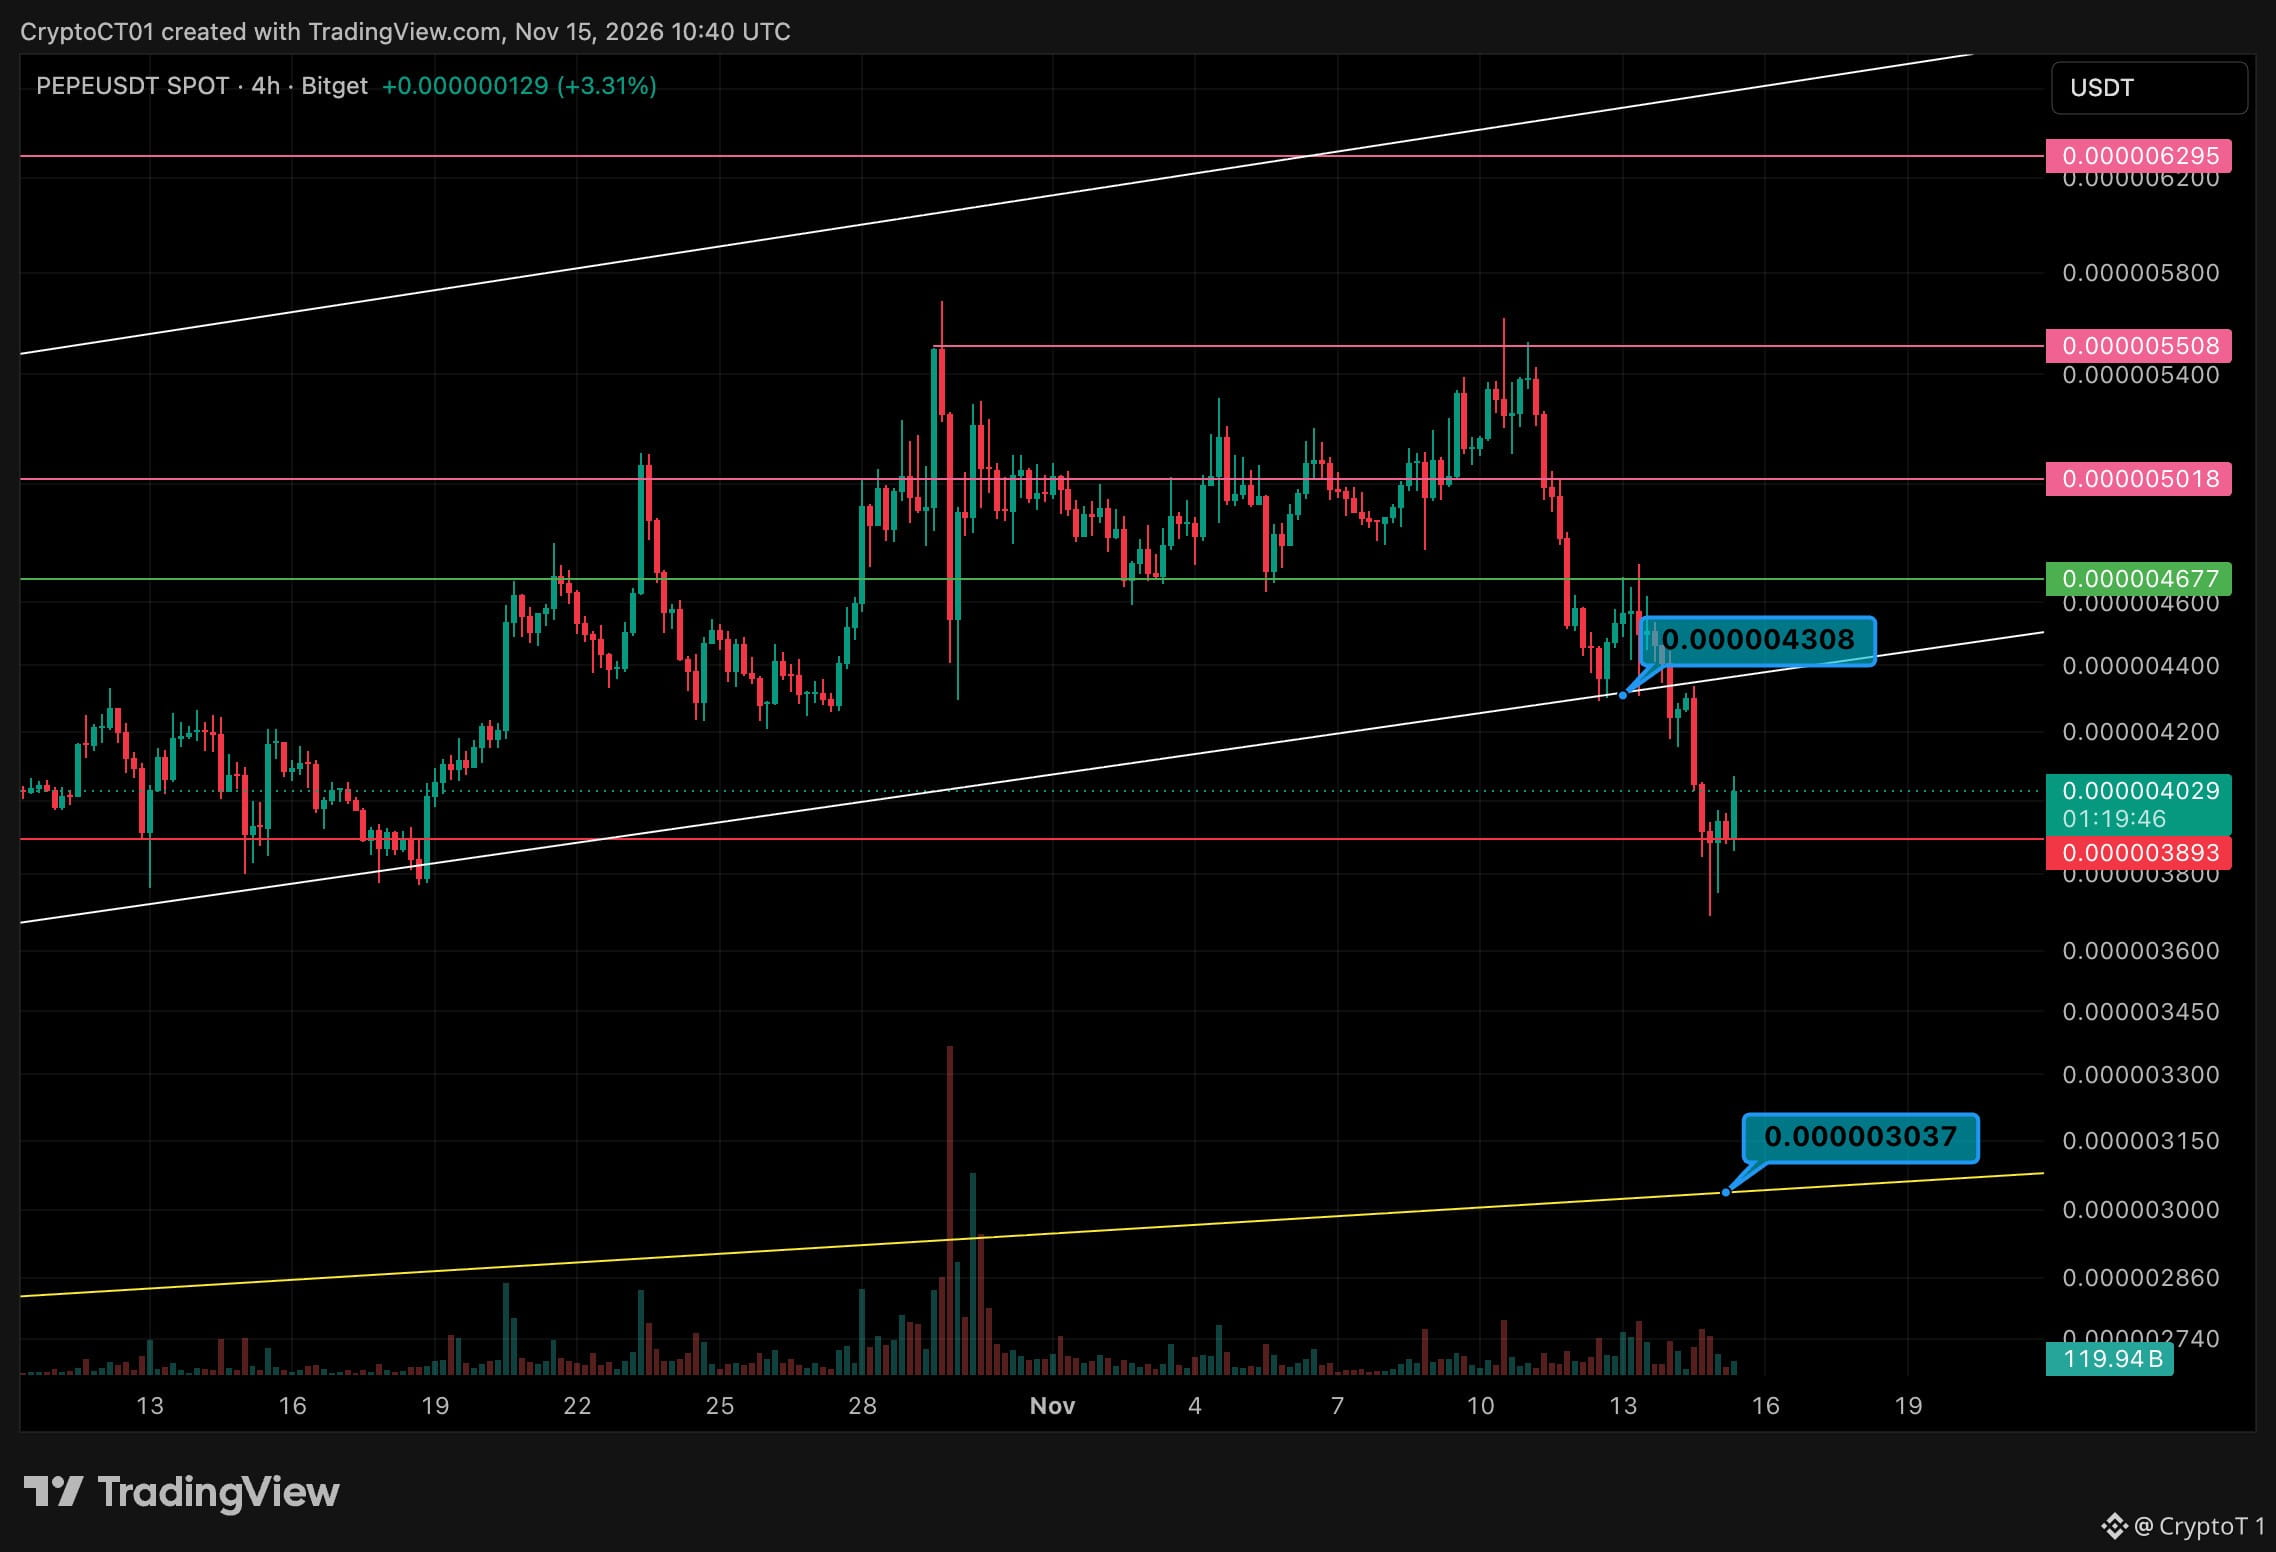
$PEPE Lost The Channel. Now It's Testing The Floor 🐸📉 🔴 0.000004677 🔴 0.000004381 (old channel support, now resistance) 🟢 0.000003893 🟢 0.000003037 (long-term trendline) Context: PEPE ranged for weeks, then broke down hard on the 13th and lost the rising channel it had held since October. It wicked under 0.0000039 and buyers stepped in. My read: 0.0000039 is the line in the sand. If it holds, I'm watching for a retest of the broken channel at 0.0000043. Reclaim that and 0.0000046 opens up. The risk: Lose 0.0000039 on a 4h close and there isn't much until the long-term trendline near 0.0000030. That's about 25% lower. Are you buying this dip or waiting for lower? 👇 #PEPE #Memecoins
$PEPE Lost The Channel. Now It's Testing The Floor 🐸📉 🔴 0.000004677 🔴 0.000004381 (old channel support, now resistance) 🟢 0.000003893 🟢 0.000003037 (long-term trendline) Context: PEPE ranged for weeks, then broke down hard on the 13th and lost the rising channel it had held since October. It wicked under 0.0000039 and buyers stepped in. My read: 0.0000039 is the line in the sand. If it holds, I'm watching for a retest of the broken channel at 0.0000043. Reclaim that and 0.0000046 opens up. The risk: Lose 0.0000039 on a 4h close and there isn't much until the long-term trendline near 0.0000030. That's about 25% lower. Are you buying this dip or waiting for lower? 👇 #PEPE #Memecoins
58
·
--
См. перевод
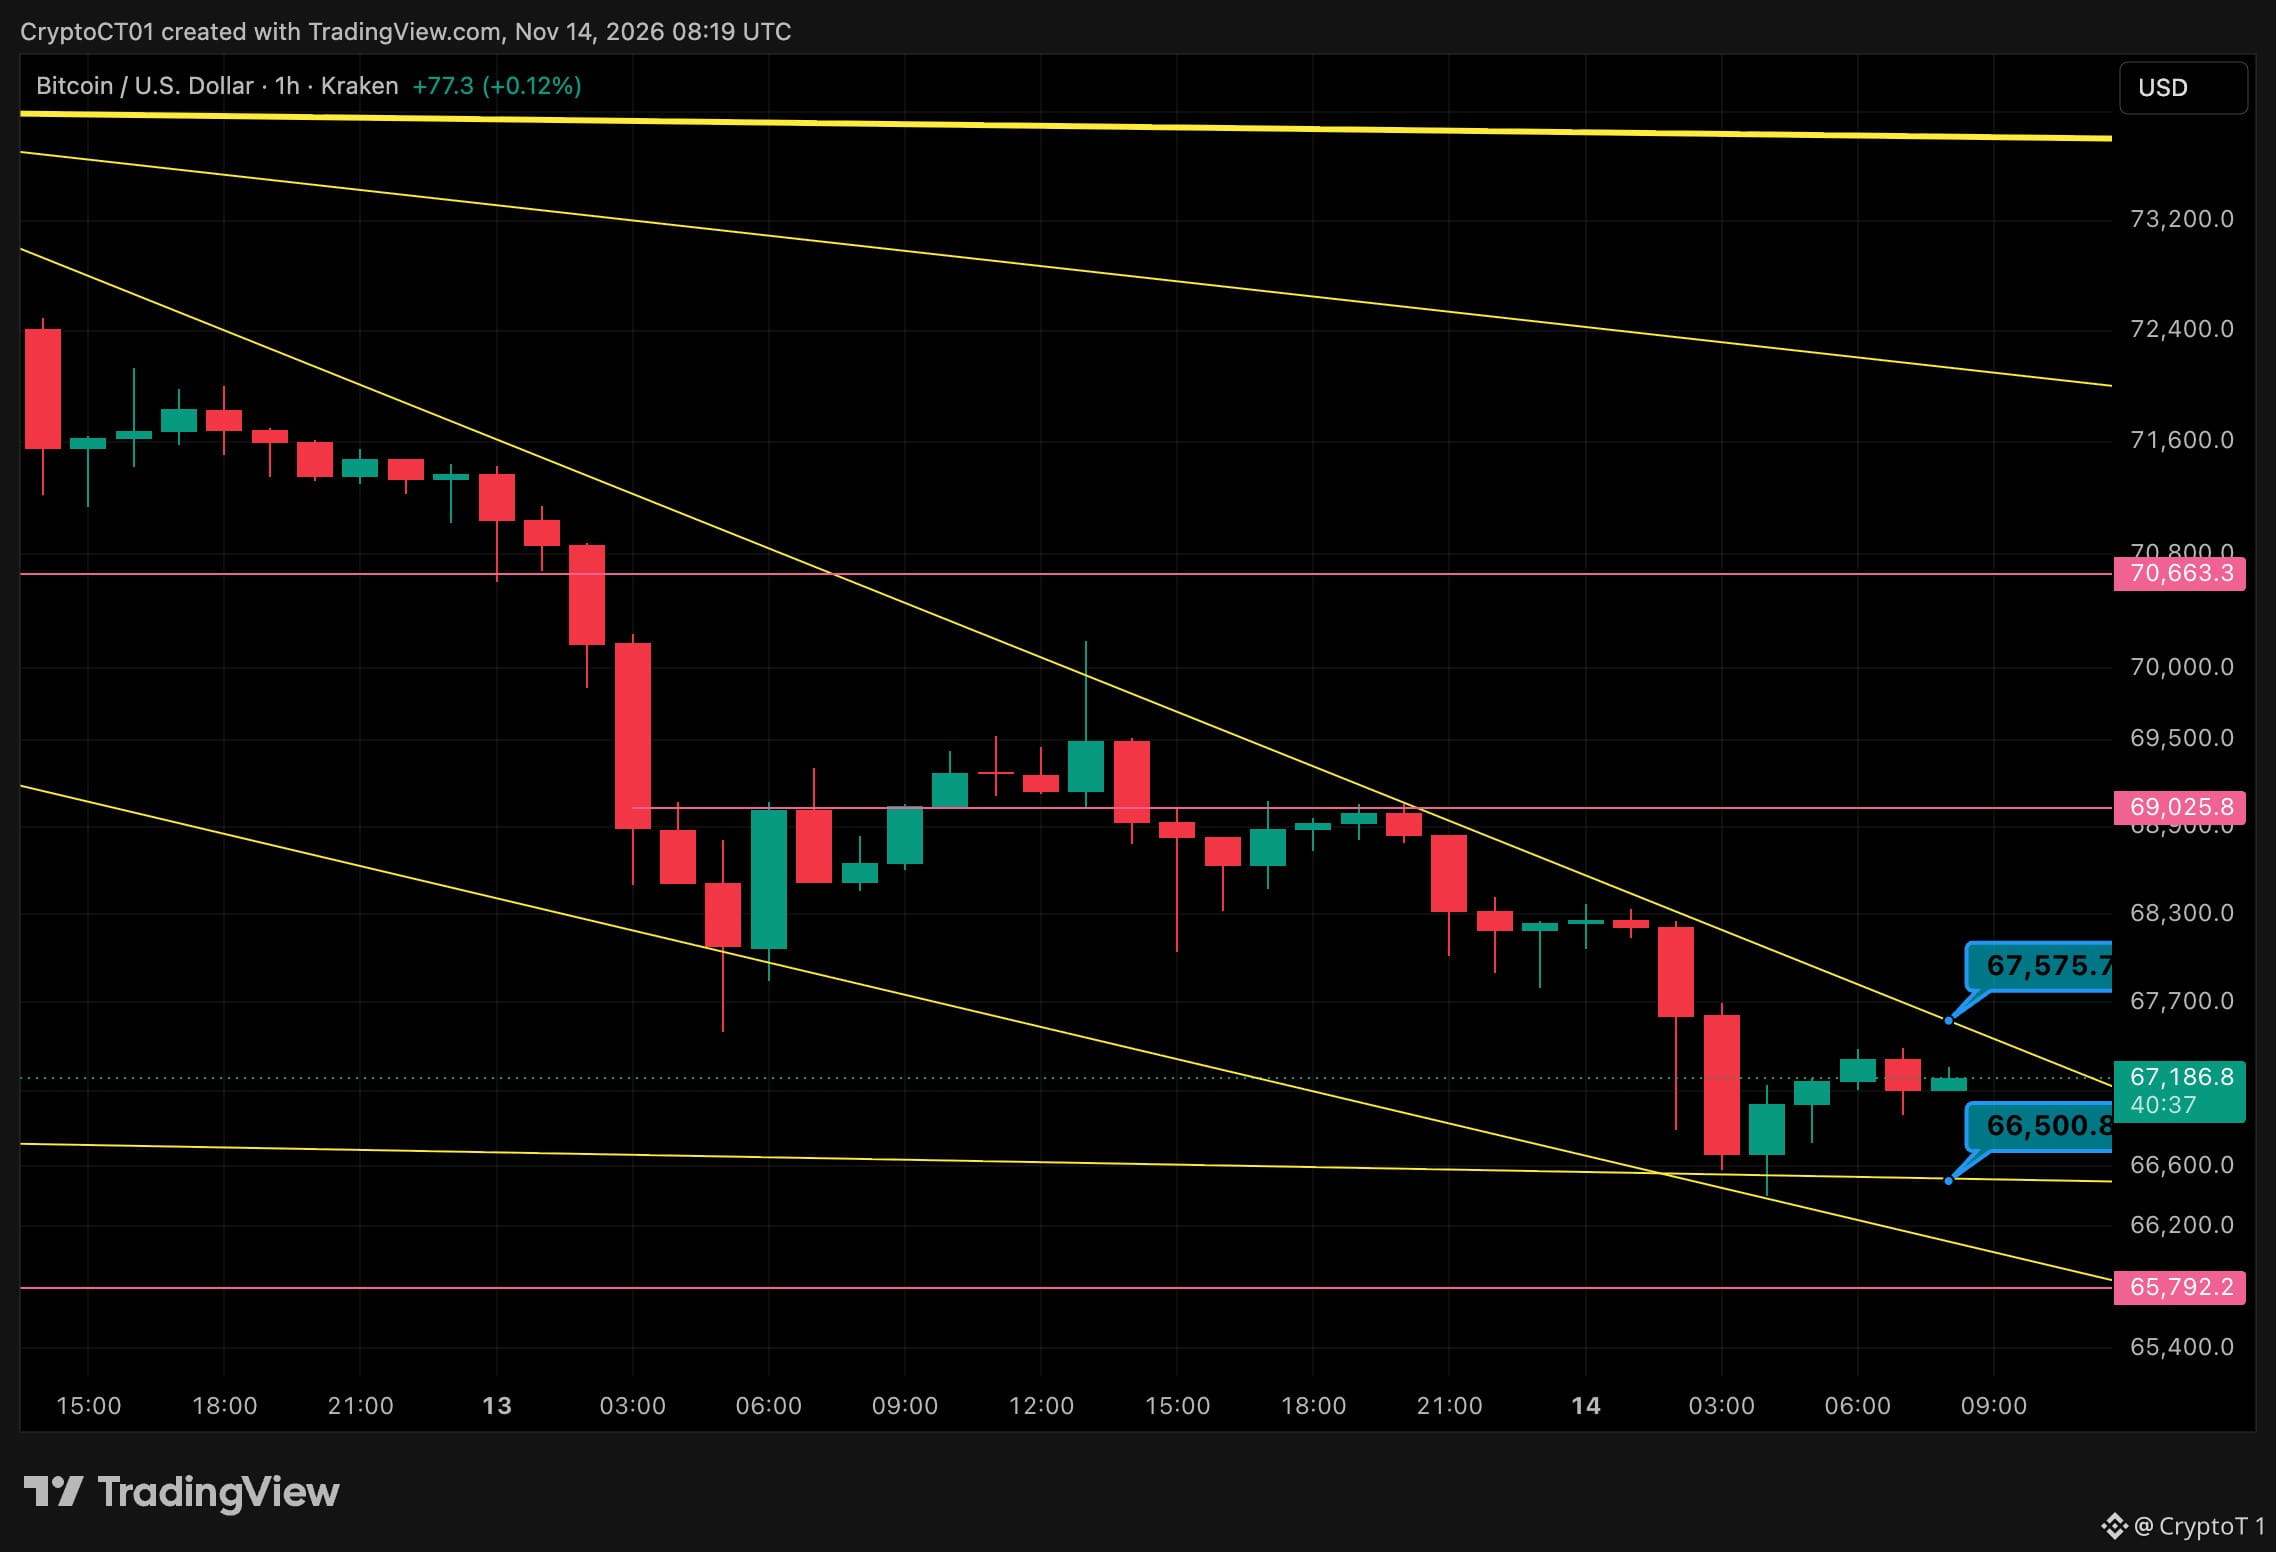
$BTC Stuck Under The Downtrend Line 📉👀 🔴 69,025 🔴 67,575 (downtrend line) ⚪ Now: 67,186 🟢 66,500 🟢 65,792 Context: Bitcoin is officially in a bear market, more than 20% off the September high. On the 1h chart we got an overnight flush into the 66.4K zone, and every bounce since then has been sold at the falling trendline. My read: the 66.5K floor has held so far. If we get a clean 1h close above 67.6K, the trendline breaks and 69K is the next magnet. Until then it's a bounce inside a downtrend, so I'm not chasing it. Let price come to you. The risk: lose 66.5K and 65.8K is next. Weekend liquidity is thin, so expect wicks both ways. Break up or one more flush first? 👇 #Bitcoin #BTC
$BTC Stuck Under The Downtrend Line 📉👀 🔴 69,025 🔴 67,575 (downtrend line) ⚪ Now: 67,186 🟢 66,500 🟢 65,792 Context: Bitcoin is officially in a bear market, more than 20% off the September high. On the 1h chart we got an overnight flush into the 66.4K zone, and every bounce since then has been sold at the falling trendline. My read: the 66.5K floor has held so far. If we get a clean 1h close above 67.6K, the trendline breaks and 69K is the next magnet. Until then it's a bounce inside a downtrend, so I'm not chasing it. Let price come to you. The risk: lose 66.5K and 65.8K is next. Weekend liquidity is thin, so expect wicks both ways. Break up or one more flush first? 👇 #Bitcoin #BTC
68
·
--
См. перевод
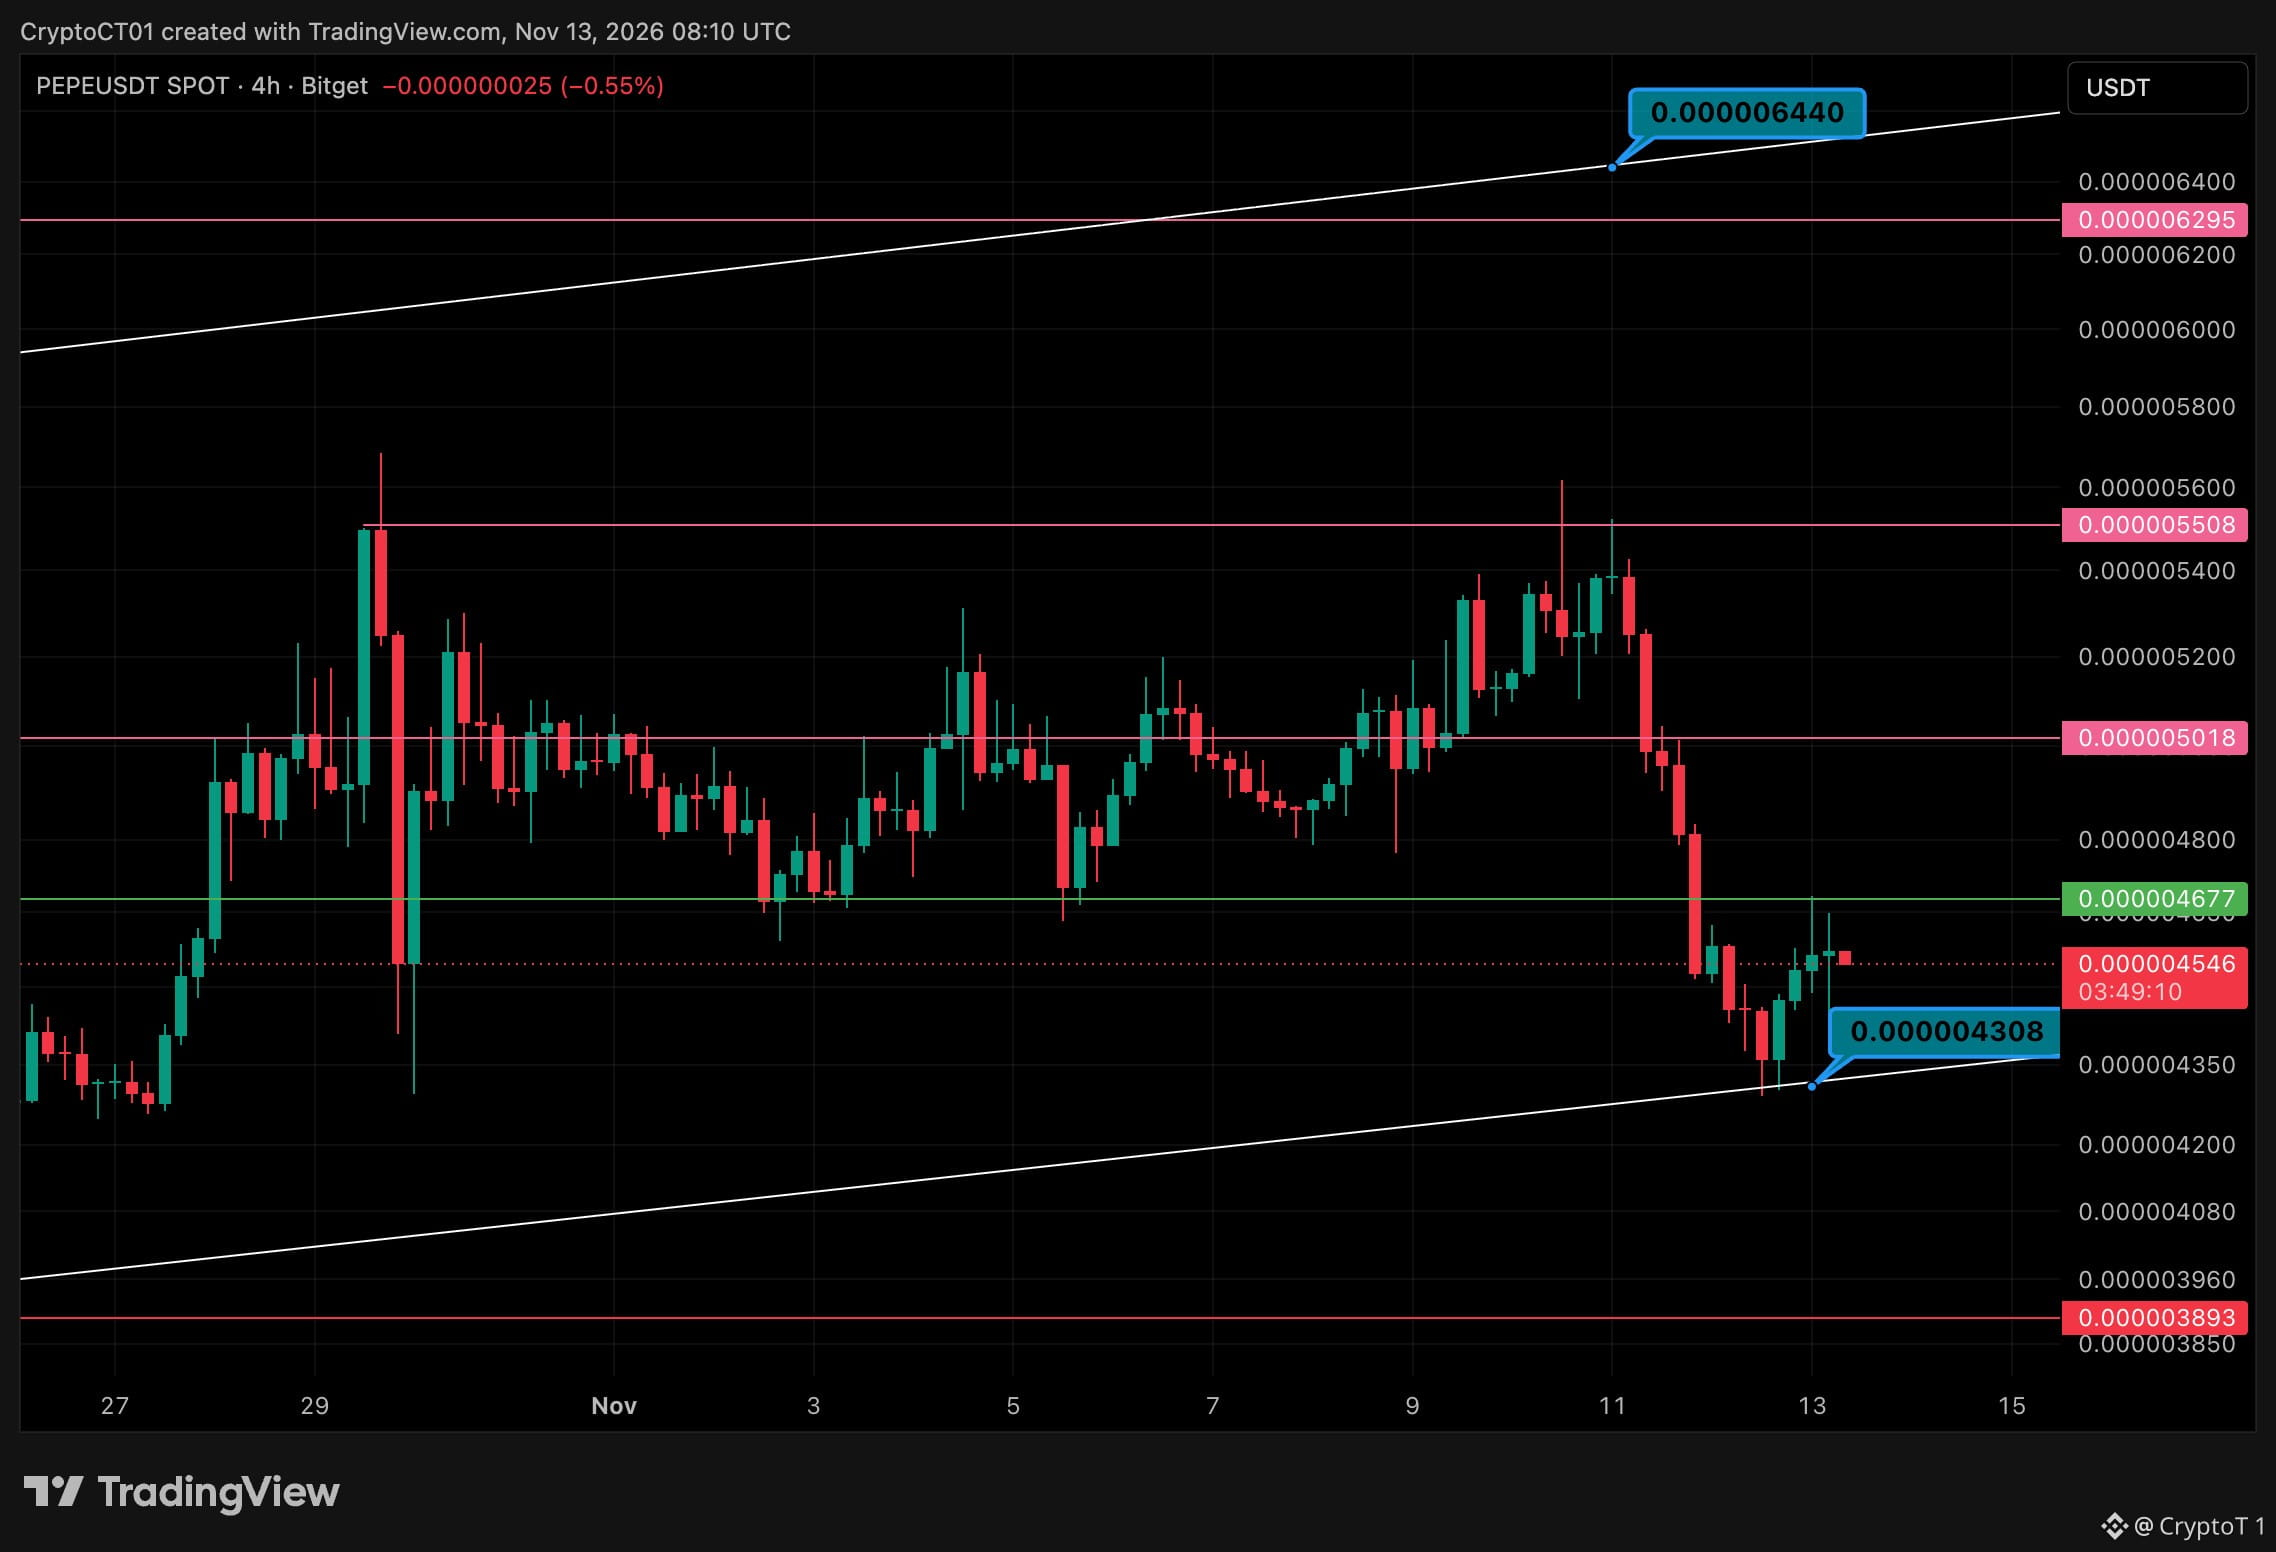
$PEPE Bounced Off The Channel Floor 🐸 🔴 0.000005018 (old range floor) 🔴 0.000004677 (first lid, testing now) 🟢 0.000004308 (rising channel support) 🟢 0.000003893 (last line) Context: PEPE lost its range on 11 Nov, flushed straight into the rising channel support and bounced. It's at 0.000004546 now, sitting right under 0.000004677. My read: A 4h close above 0.000004677 opens a move back to 0.000005018. Lose 0.000004308 and the channel breaks, putting 0.000003893 in play. The risk: BTC is under 70K. If BTC slides again, PEPE gets dragged with it and memes bleed first. Channel bounce or dead cat? 👇 #PEPE #Memecoins
$PEPE Bounced Off The Channel Floor 🐸 🔴 0.000005018 (old range floor) 🔴 0.000004677 (first lid, testing now) 🟢 0.000004308 (rising channel support) 🟢 0.000003893 (last line) Context: PEPE lost its range on 11 Nov, flushed straight into the rising channel support and bounced. It's at 0.000004546 now, sitting right under 0.000004677. My read: A 4h close above 0.000004677 opens a move back to 0.000005018. Lose 0.000004308 and the channel breaks, putting 0.000003893 in play. The risk: BTC is under 70K. If BTC slides again, PEPE gets dragged with it and memes bleed first. Channel bounce or dead cat? 👇 #PEPE #Memecoins
80
·
--
См. перевод
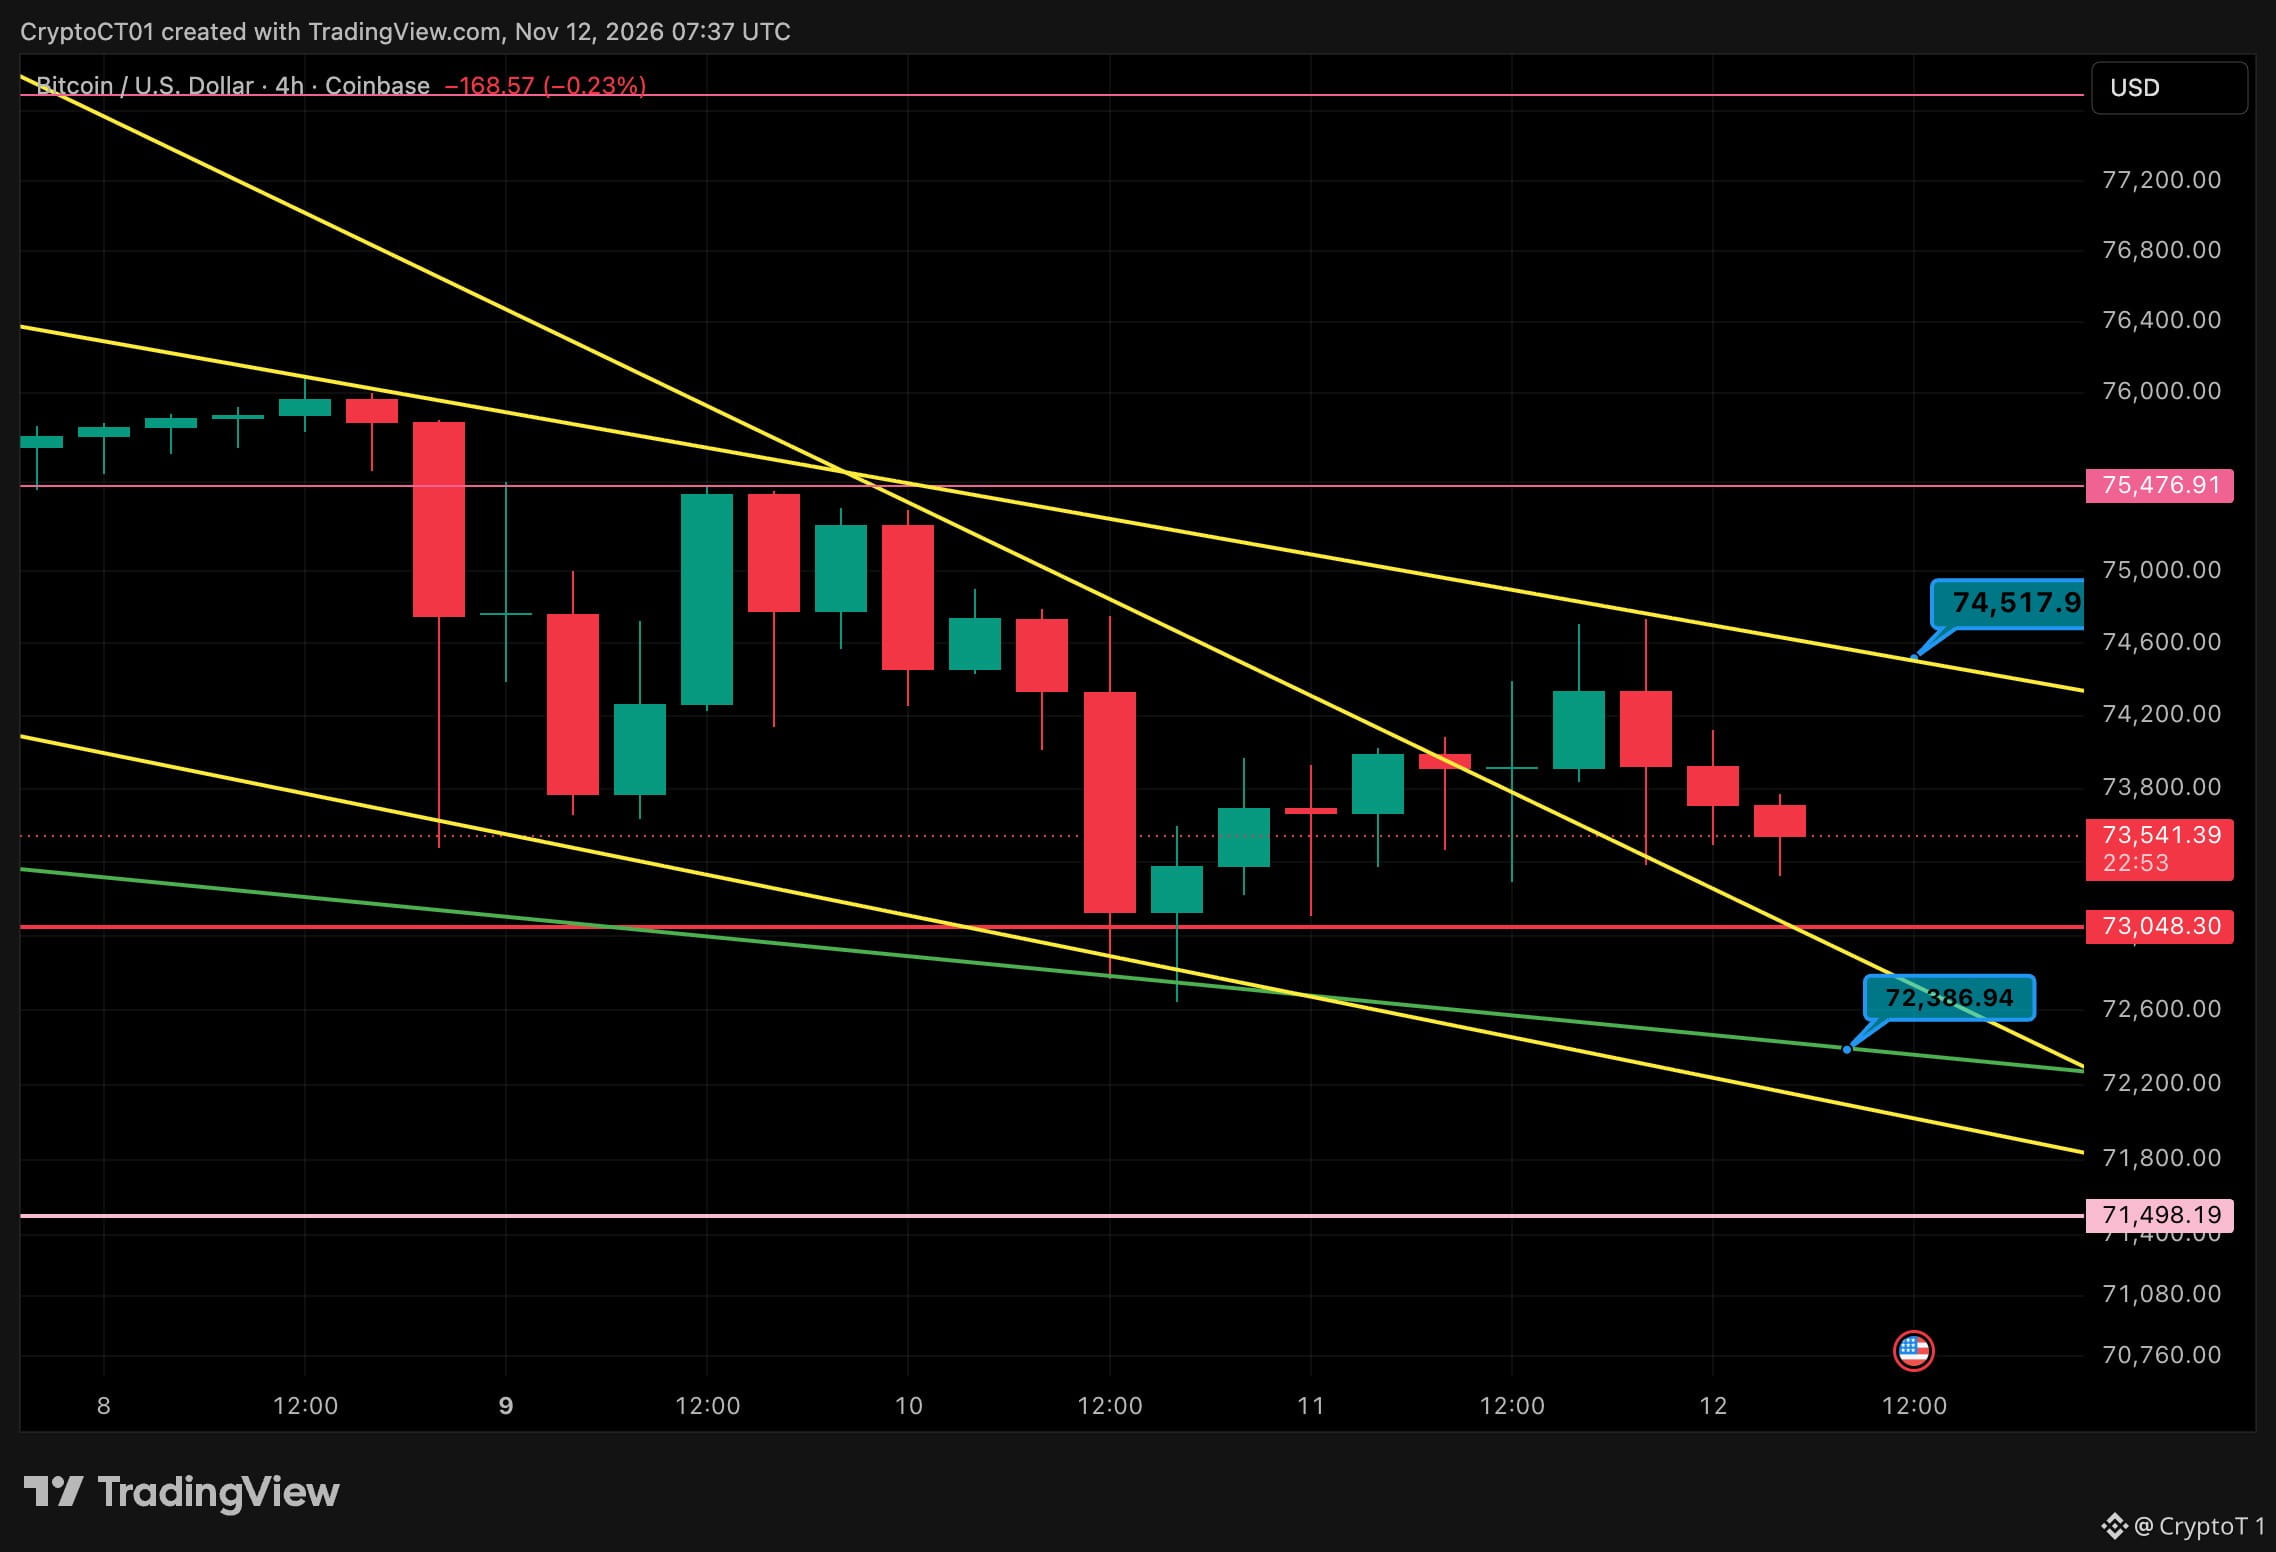
$BTC Stuck Between The Lines 📐 4h chart. Price is at 73.5K, squeezed between the top of the wedge and the steep trendline it broke above yesterday. 🔴 Resistance: 74,517 (wedge top), then 75,477 🟢 Support: 73,048, then 72,387, then 71,498 Context: Five straight days of ETF outflows, MSCI dropping $MSTR , and $BTC has barely moved. It's still holding just above the 200-day average around 73.2K. My read: No chase from here. 74.5K has rejected it twice, so I want a 4h close above it before I lean bullish. That opens 75.5K. Lose 73K and the green trendline at 72.4K is the next real test. Below that I'm watching 71.5K. The risk: This is a squeeze. When it breaks, it moves fast. Let price pick a side first. Break above 74.5K or a flush to 72.4K first? 👇 #BTC #Bitcoin
$BTC Stuck Between The Lines 📐 4h chart. Price is at 73.5K, squeezed between the top of the wedge and the steep trendline it broke above yesterday. 🔴 Resistance: 74,517 (wedge top), then 75,477 🟢 Support: 73,048, then 72,387, then 71,498 Context: Five straight days of ETF outflows, MSCI dropping $MSTR , and $BTC has barely moved. It's still holding just above the 200-day average around 73.2K. My read: No chase from here. 74.5K has rejected it twice, so I want a 4h close above it before I lean bullish. That opens 75.5K. Lose 73K and the green trendline at 72.4K is the next real test. Below that I'm watching 71.5K. The risk: This is a squeeze. When it breaks, it moves fast. Let price pick a side first. Break above 74.5K or a flush to 72.4K first? 👇 #BTC #Bitcoin
63
·
--
См. перевод
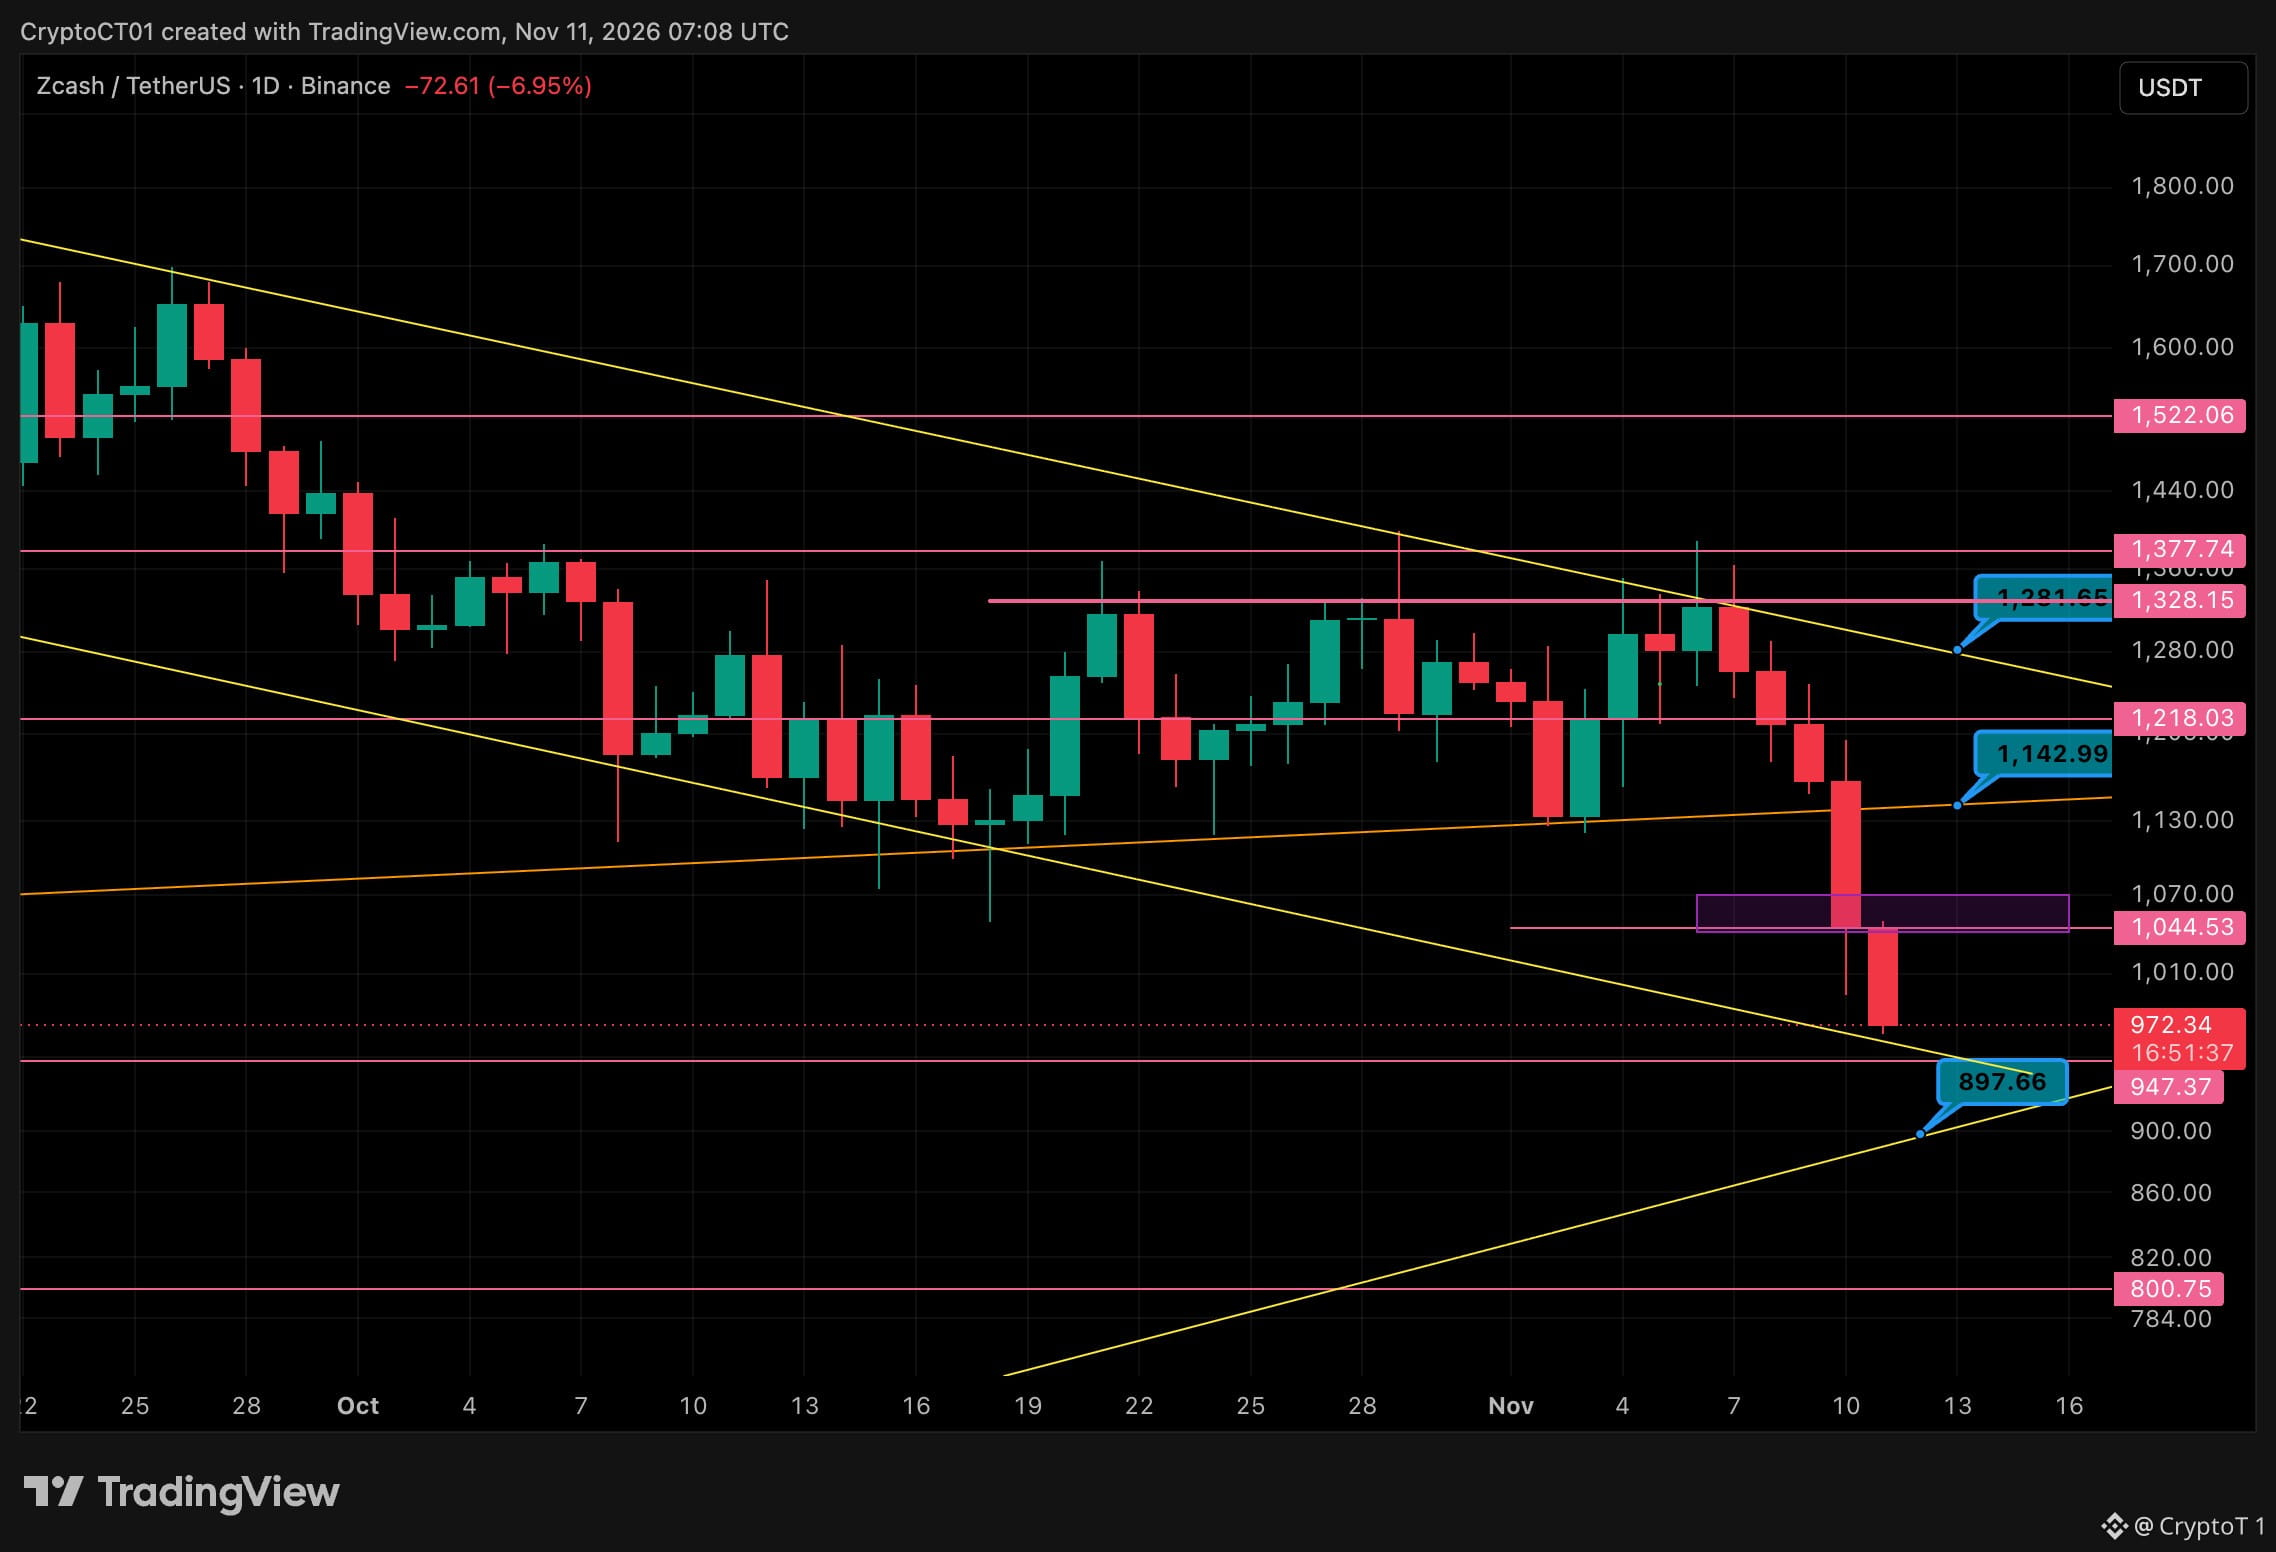
$ZEC Lost The Trendline, Now Below 1K 📉 Yesterday 1,143 was the line to hold. Daily candle sliced straight through it and the 1,044 - 1,070 demand zone, now trading around 972. 🔴 1,143 (broken trendline) 🔴 1,044 (old demand, now resistance) 🟢 947 support 🟢 ~900 where the falling and rising trendlines meet 🟢 800 if that gives way My read: no catching knives here. I want to see 947 or the 900 confluence hold with a reaction before looking long. A daily reclaim of 1,044 flips it back. The risk: lose 900 and there's not much until 800. Where does $ZEC find a floor? 👇 NFA #ZEC #Zcash #Crypto
$ZEC Lost The Trendline, Now Below 1K 📉 Yesterday 1,143 was the line to hold. Daily candle sliced straight through it and the 1,044 - 1,070 demand zone, now trading around 972. 🔴 1,143 (broken trendline) 🔴 1,044 (old demand, now resistance) 🟢 947 support 🟢 ~900 where the falling and rising trendlines meet 🟢 800 if that gives way My read: no catching knives here. I want to see 947 or the 900 confluence hold with a reaction before looking long. A daily reclaim of 1,044 flips it back. The risk: lose 900 and there's not much until 800. Where does $ZEC find a floor? 👇 NFA #ZEC #Zcash #Crypto
43
·
--
См. перевод
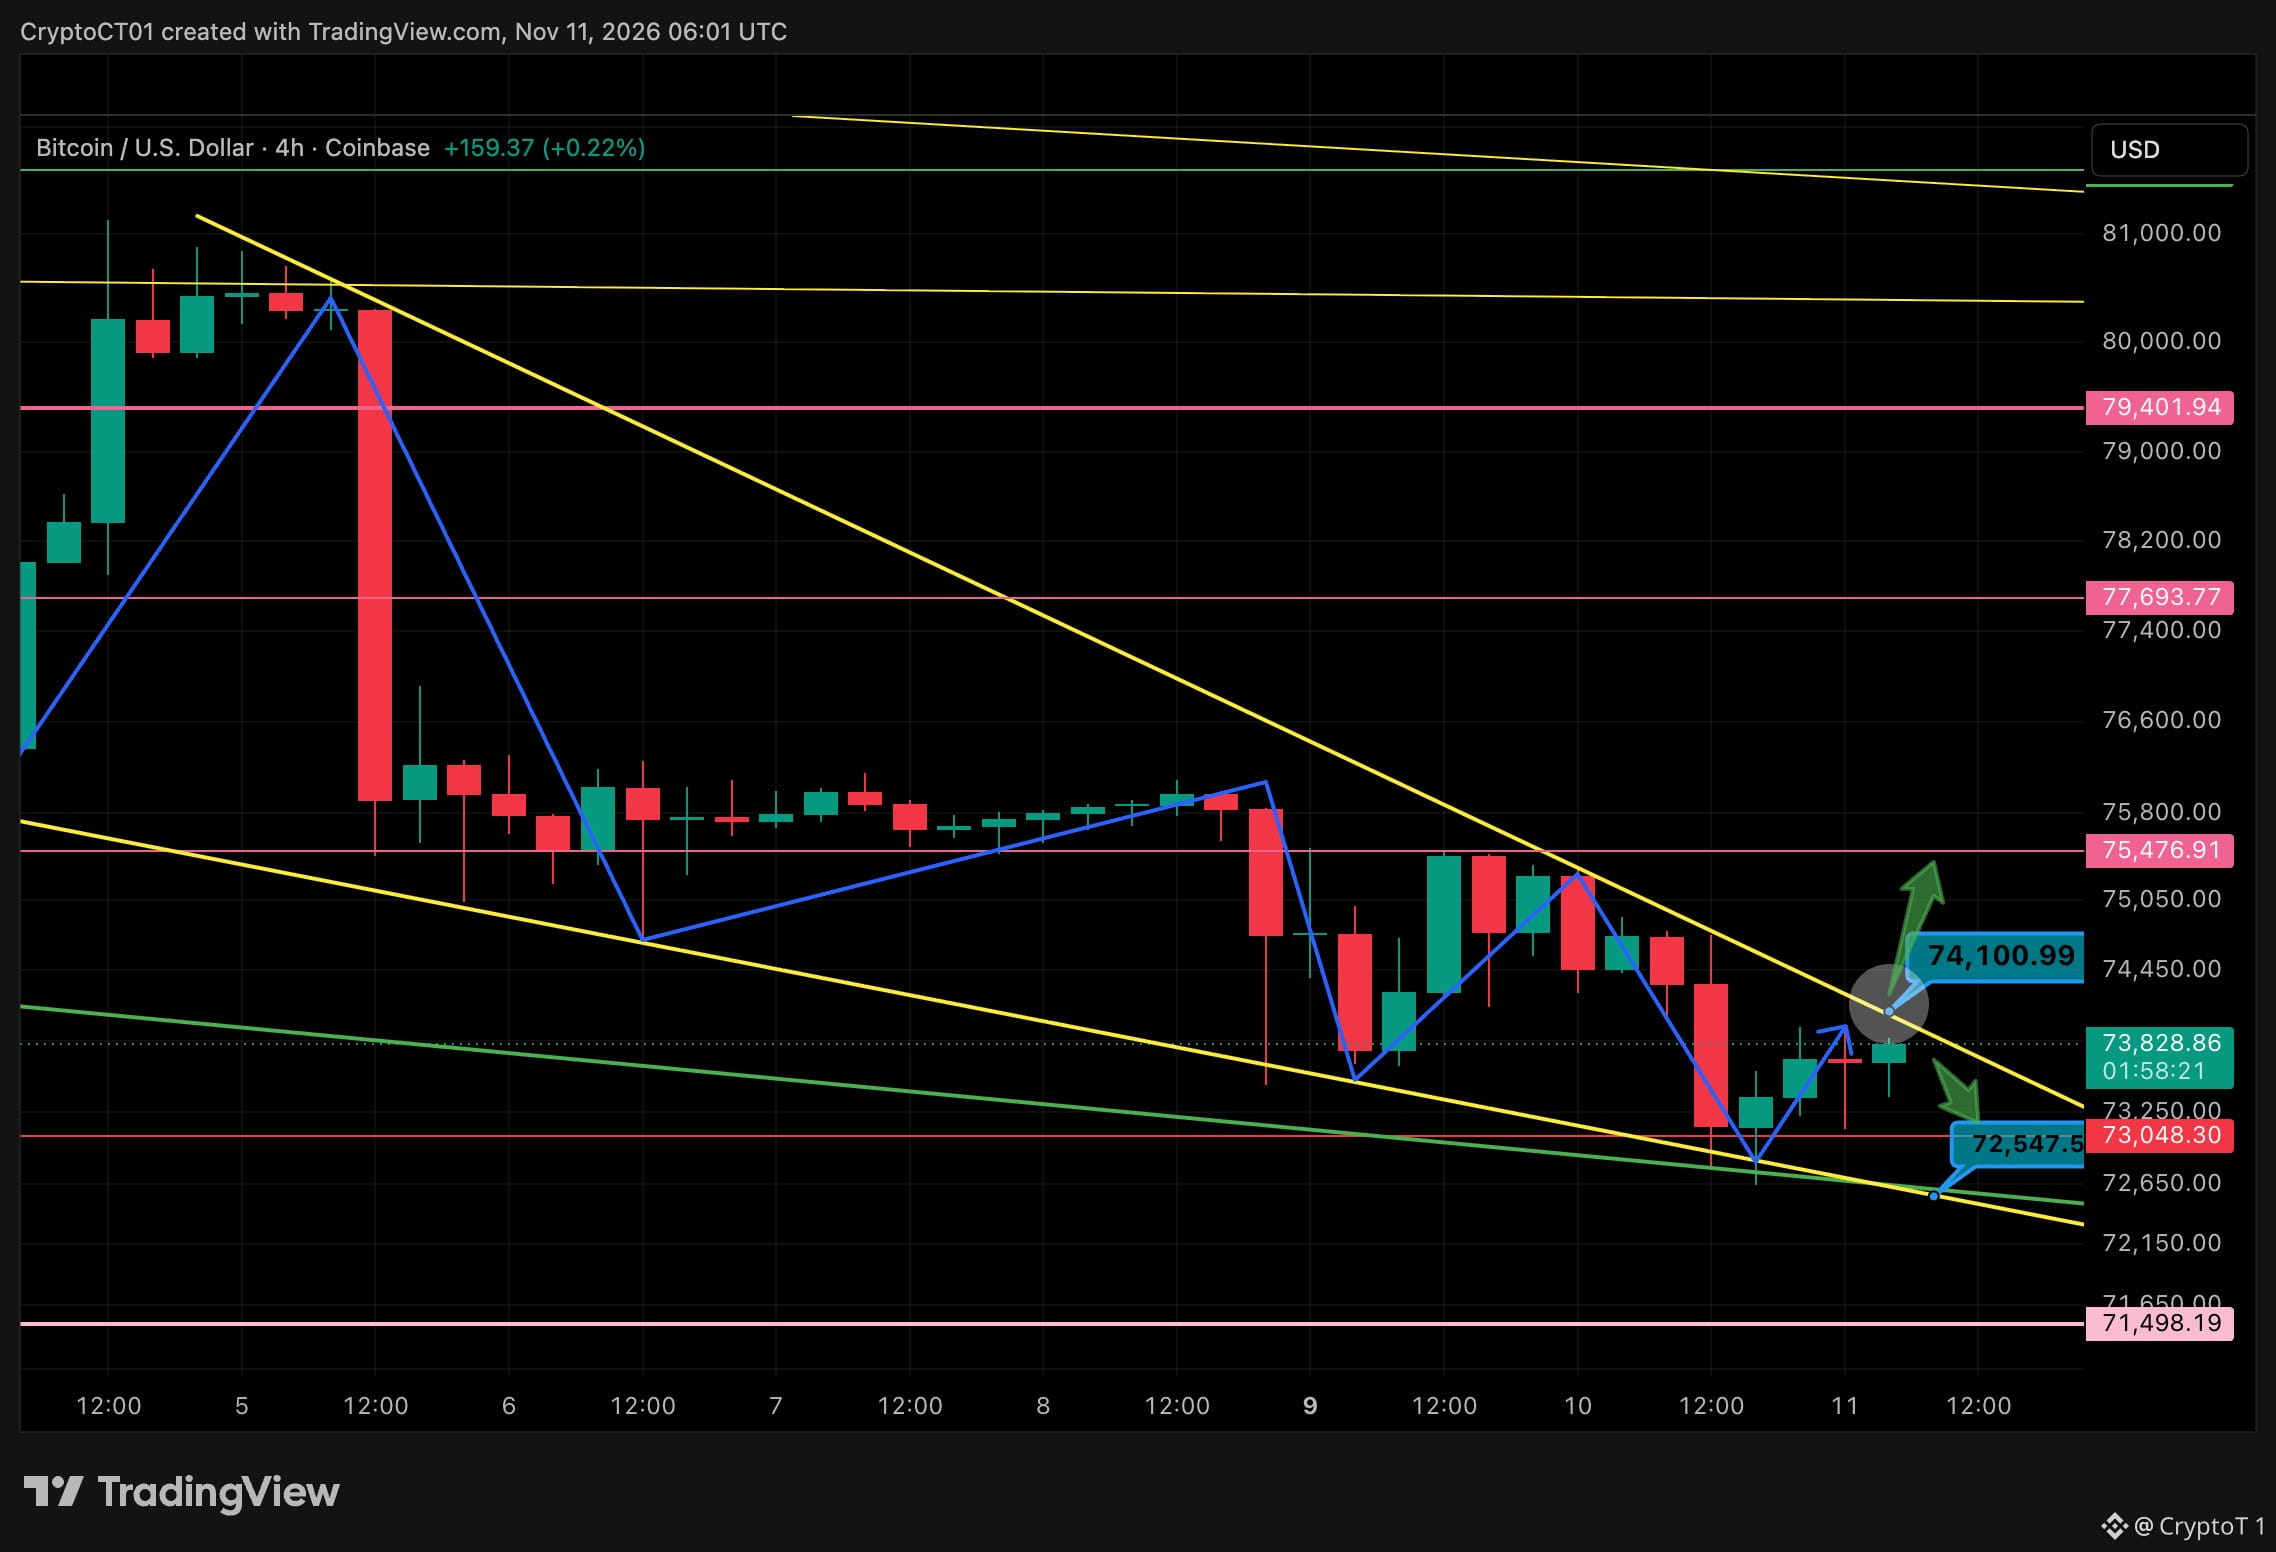
$BTC Pressing The Top Of The Wedge 📐 4h chart. Price has been squeezing inside a falling wedge since the 80K rejection, and it's now sitting right under the upper trendline around 74.1K. 🟢 Break and hold above 74.1K opens 75.5K, then 77.7K 🔴 Support at 73K, then the wedge floor near 72.5K 🔴 Lose that and 71.5K is next My read: CPI wicked us to 72.7K and buyers stepped in at the wedge base. A clean 4h close above the trendline is the trigger I'm watching. No chasing before it. The risk: another rejection here sends it straight back to the bottom of the range. Breakout or one more flush first? 👇 NFA #Bitcoin #BTC #Crypto
$BTC Pressing The Top Of The Wedge 📐 4h chart. Price has been squeezing inside a falling wedge since the 80K rejection, and it's now sitting right under the upper trendline around 74.1K. 🟢 Break and hold above 74.1K opens 75.5K, then 77.7K 🔴 Support at 73K, then the wedge floor near 72.5K 🔴 Lose that and 71.5K is next My read: CPI wicked us to 72.7K and buyers stepped in at the wedge base. A clean 4h close above the trendline is the trigger I'm watching. No chasing before it. The risk: another rejection here sends it straight back to the bottom of the range. Breakout or one more flush first? 👇 NFA #Bitcoin #BTC #Crypto
57
·
--
См. перевод
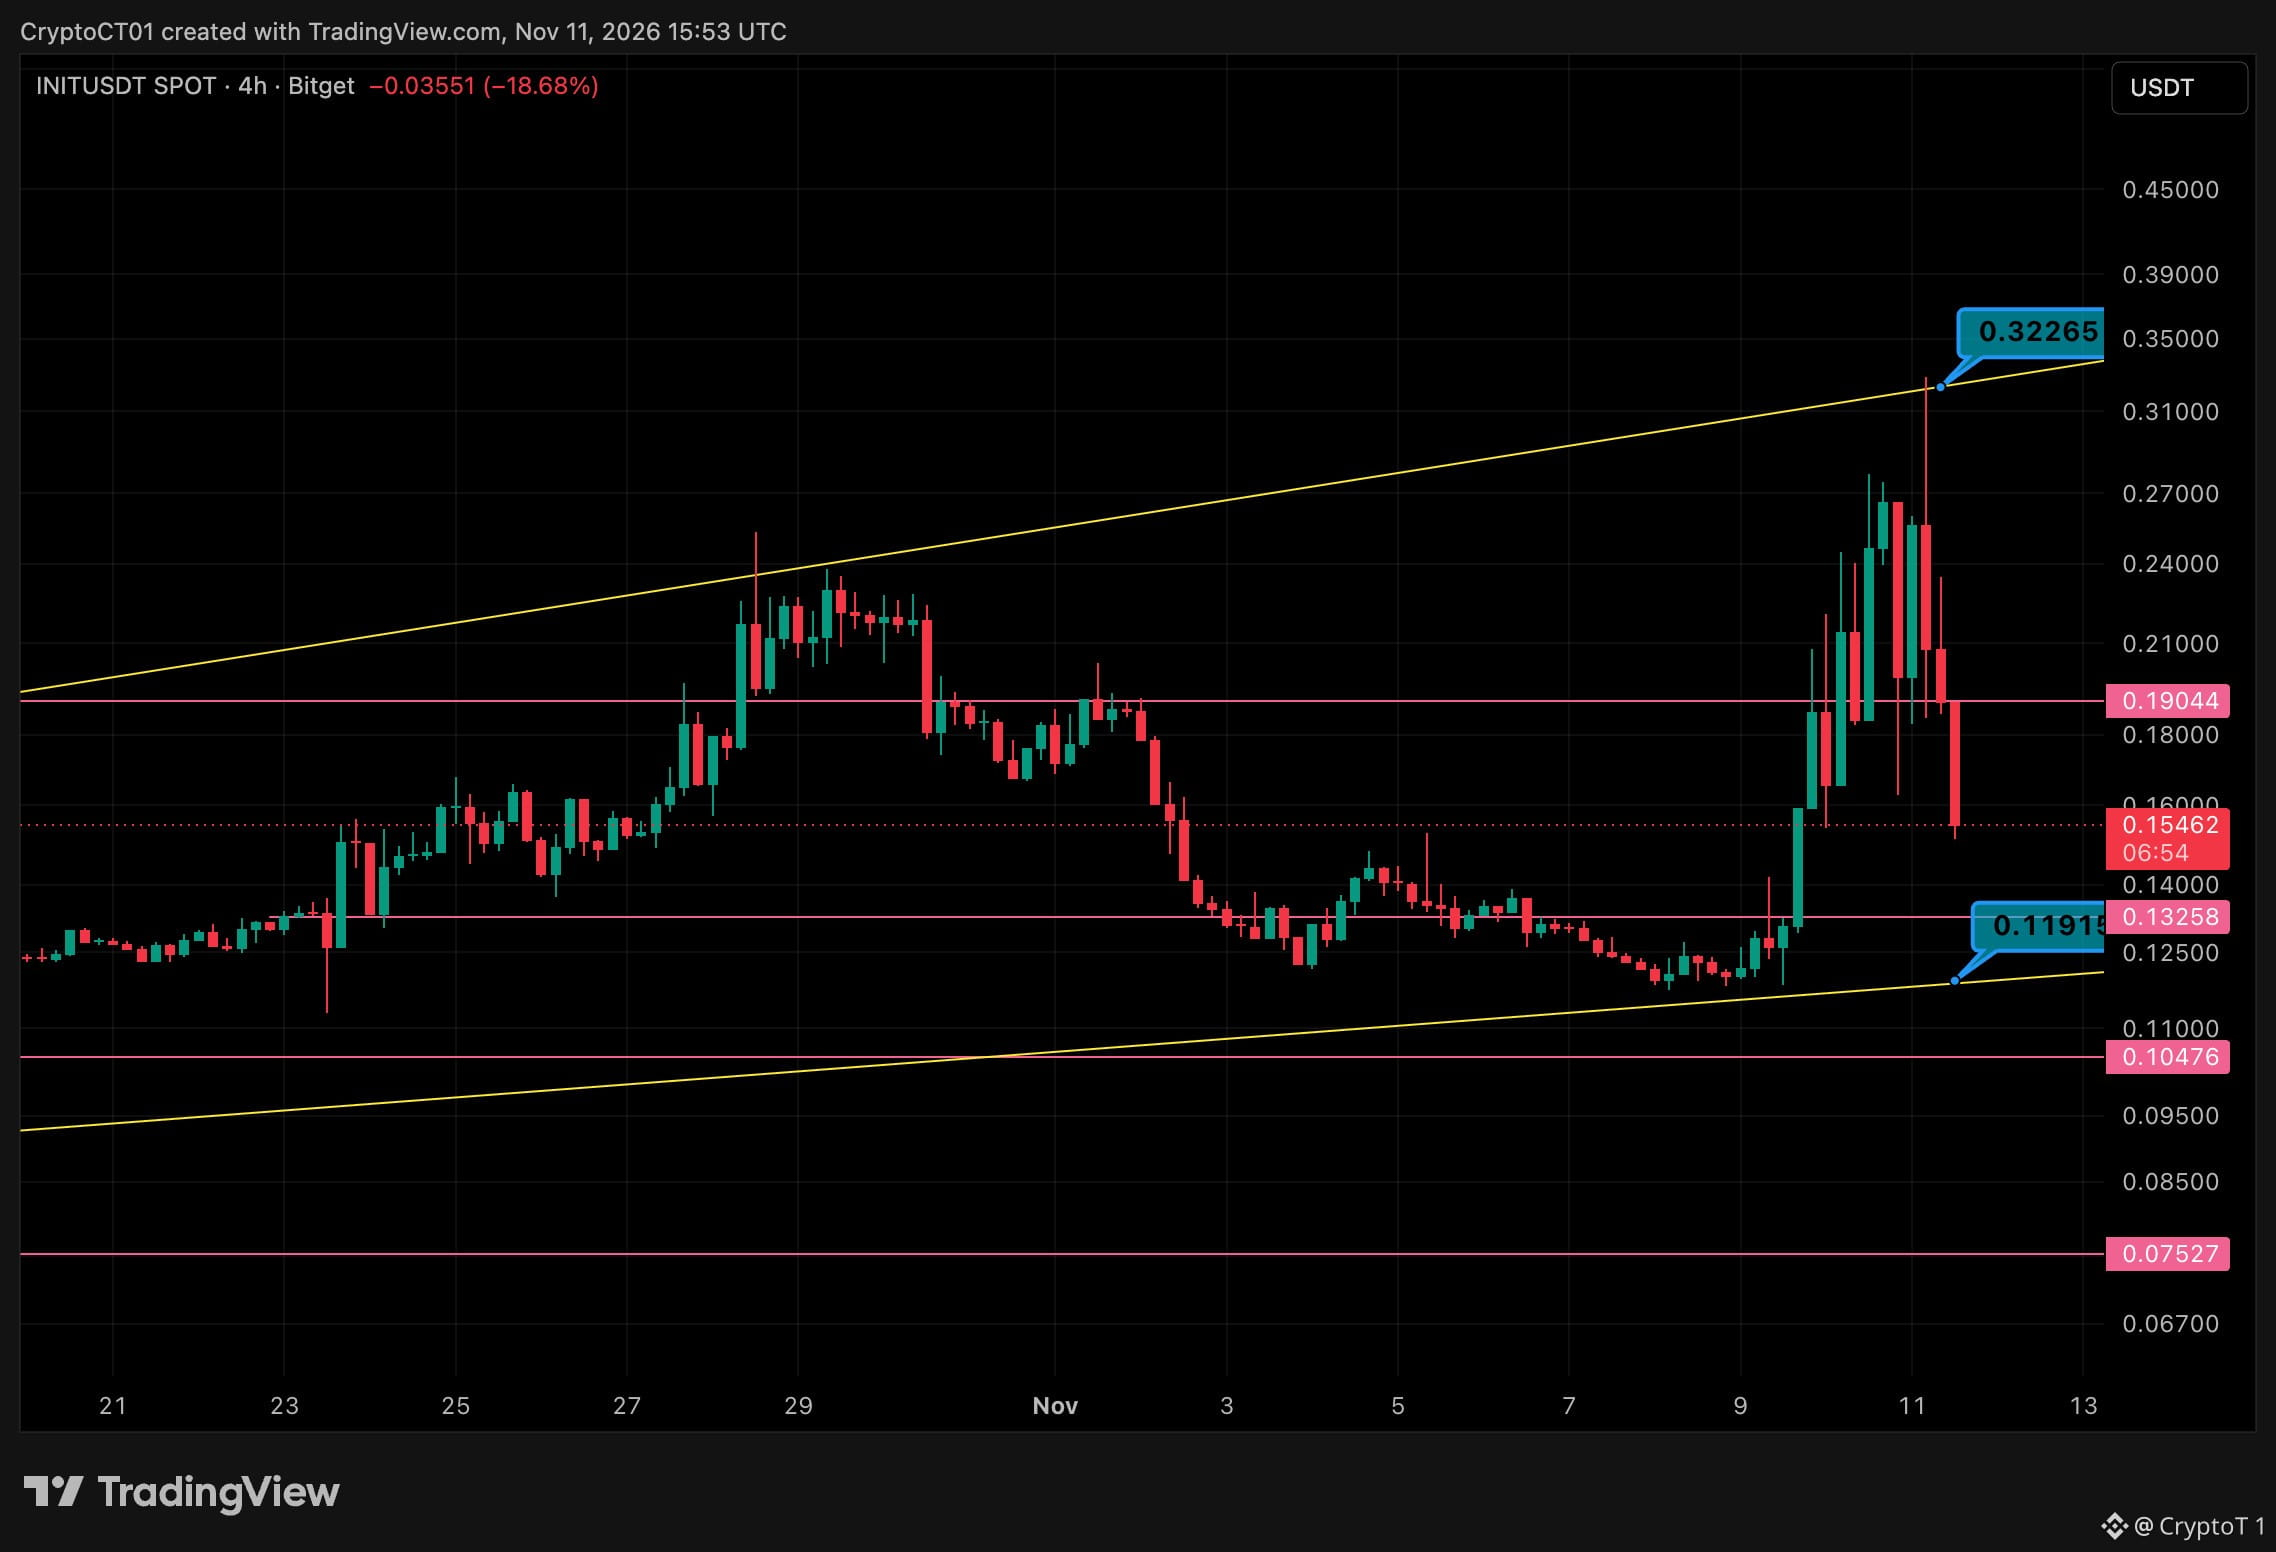
$INIT Rejected At The Top Of The Channel 📉 4h chart. The squeeze wicked straight into the channel top at 0.322 and got slapped back down. Now 0.154, down about 52% from the high. 🔴 Resistance: 0.190, then 0.24 🟢 Support: 0.1326, then 0.119 (channel bottom) Context: Initia halted its L1 on 10 Nov after unauthorized transfers from rollup escrow accounts, about $3.27M in total, and said no INIT was withdrawn. $INIT still squeezed hard into the news, and that whole move is now unwinding. My read: Losing 0.190 flipped it back to resistance. Price is falling back into the old range, and 0.1326 is the first real floor, the base it broke out from. If that cracks, the channel bottom around 0.119 is the bigger level. Below that I've got 0.105, then 0.075. The risk: News-driven unwinds wick both ways. A 4h reclaim of 0.190 flips this back bullish. Is 0.13 the bounce, or does it test the channel bottom first? 👇 #INIT
$INIT Rejected At The Top Of The Channel 📉 4h chart. The squeeze wicked straight into the channel top at 0.322 and got slapped back down. Now 0.154, down about 52% from the high. 🔴 Resistance: 0.190, then 0.24 🟢 Support: 0.1326, then 0.119 (channel bottom) Context: Initia halted its L1 on 10 Nov after unauthorized transfers from rollup escrow accounts, about $3.27M in total, and said no INIT was withdrawn. $INIT still squeezed hard into the news, and that whole move is now unwinding. My read: Losing 0.190 flipped it back to resistance. Price is falling back into the old range, and 0.1326 is the first real floor, the base it broke out from. If that cracks, the channel bottom around 0.119 is the bigger level. Below that I've got 0.105, then 0.075. The risk: News-driven unwinds wick both ways. A 4h reclaim of 0.190 flips this back bullish. Is 0.13 the bounce, or does it test the channel bottom first? 👇 #INIT
70
·
--
$MU Проверка ретеста пробитого уровня 👀 Micron резко отскочила от минимумов на отметке 646. Теперь она движется прямо к пробитой линии тренда, которую потеряла в начале ноября. 🔴 1,056 🔴 1,029 (нисходящая линия тренда) 🔴 910 🔴 748 (ретест пробитой линии тренда) 🟢 724 (сейчас) 🟢 666 (восходящая поддержка) 🟢 646 (ноябрьский минимум) Моя оценка: дневное закрытие выше 748 превратит это в возврат уровня, а 910 станет следующим важным уровнем. Риск: отбой от 748 сделает это классическим ретестом, и тогда снова станут актуальны уровни 666 и 646. Не является финансовой рекомендацией. #Micron #Акции
$MU Проверка ретеста пробитого уровня 👀 Micron резко отскочила от минимумов на отметке 646. Теперь она движется прямо к пробитой линии тренда, которую потеряла в начале ноября. 🔴 1,056 🔴 1,029 (нисходящая линия тренда) 🔴 910 🔴 748 (ретест пробитой линии тренда) 🟢 724 (сейчас) 🟢 666 (восходящая поддержка) 🟢 646 (ноябрьский минимум) Моя оценка: дневное закрытие выше 748 превратит это в возврат уровня, а 910 станет следующим важным уровнем. Риск: отбой от 748 сделает это классическим ретестом, и тогда снова станут актуальны уровни 666 и 646. Не является финансовой рекомендацией. #Micron #Акции
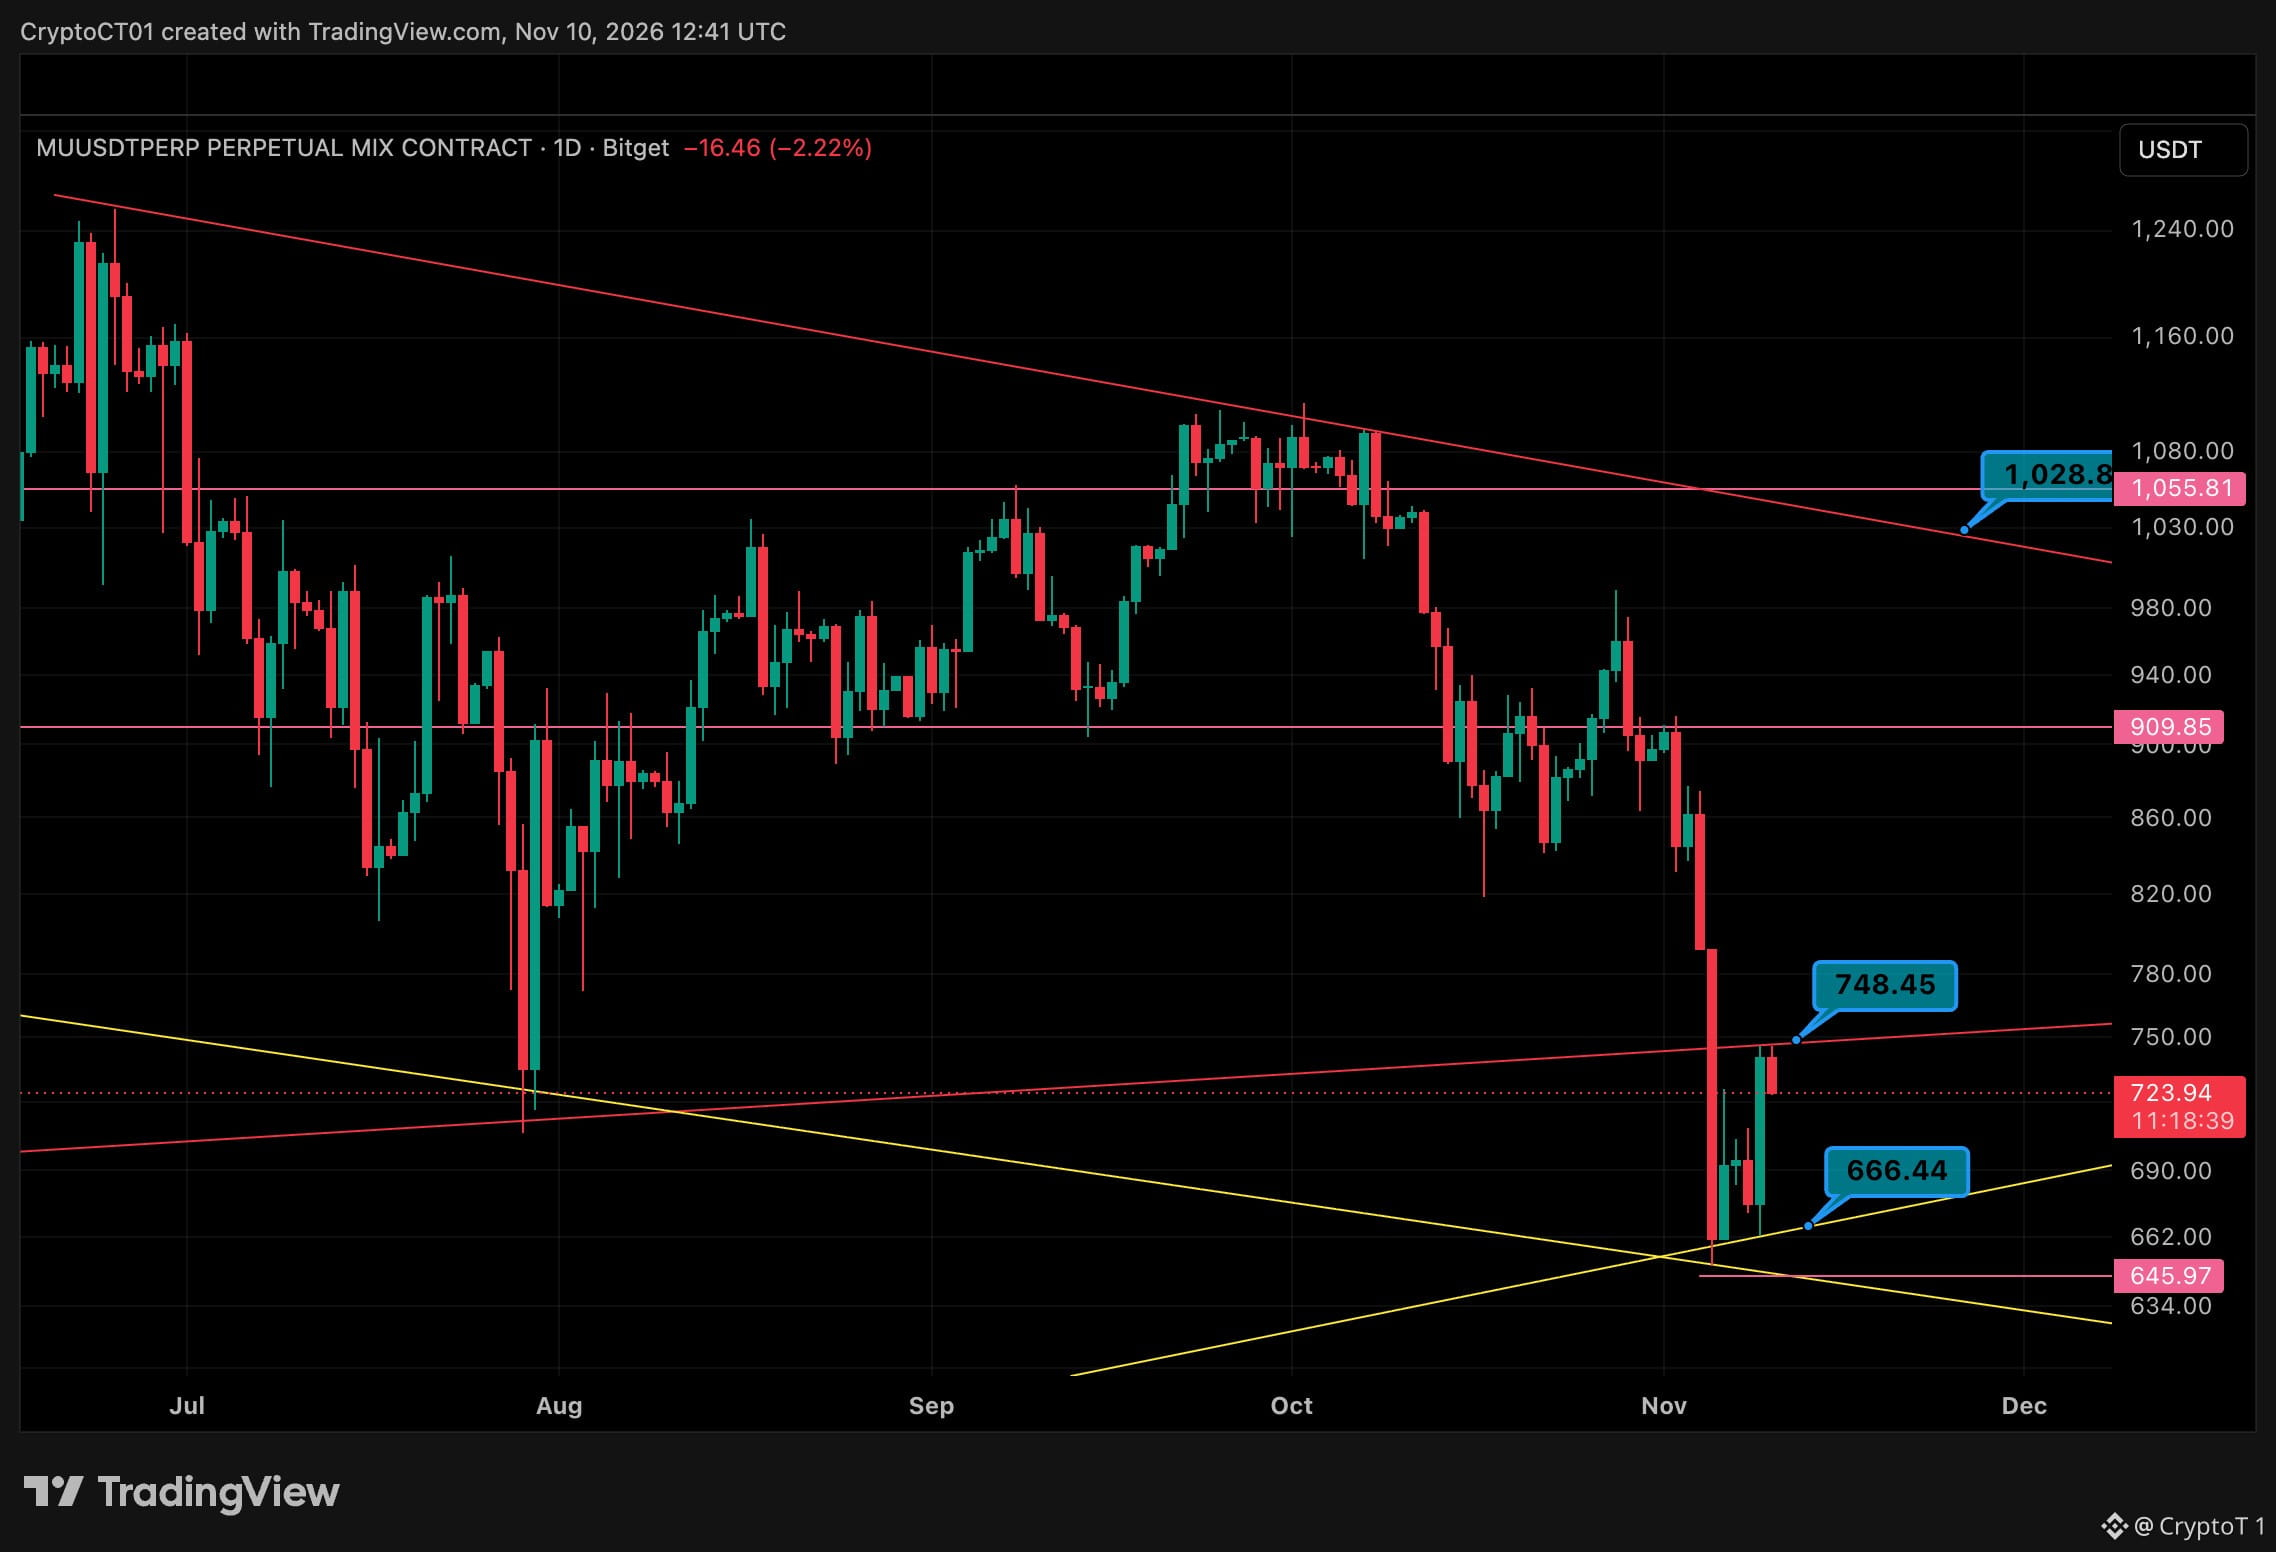
57
·
--
См. перевод
$ZEC Sitting On Trendline Support 👀 Zcash has bled from the 1,377 highs and is now testing the rising trendline that's held since late October. 🔴 1,377 🔴 1,328 🔴 1,281 (descending trendline) 🔴 1,218 🟢 1,147 (now) 🟢 1,143 (rising trendline) 🟢 1,061 - 1,047 demand zone My read: hold the trendline and a bounce into 1,218 is on the cards. That's the first level to reclaim. The risk: a 4h close under 1,143 opens the door to the 1,061 - 1,047 zone. Bounce or breakdown? 👇 NFA #ZEC #Crypto
$ZEC Sitting On Trendline Support 👀 Zcash has bled from the 1,377 highs and is now testing the rising trendline that's held since late October. 🔴 1,377 🔴 1,328 🔴 1,281 (descending trendline) 🔴 1,218 🟢 1,147 (now) 🟢 1,143 (rising trendline) 🟢 1,061 - 1,047 demand zone My read: hold the trendline and a bounce into 1,218 is on the cards. That's the first level to reclaim. The risk: a 4h close under 1,143 opens the door to the 1,061 - 1,047 zone. Bounce or breakdown? 👇 NFA #ZEC #Crypto
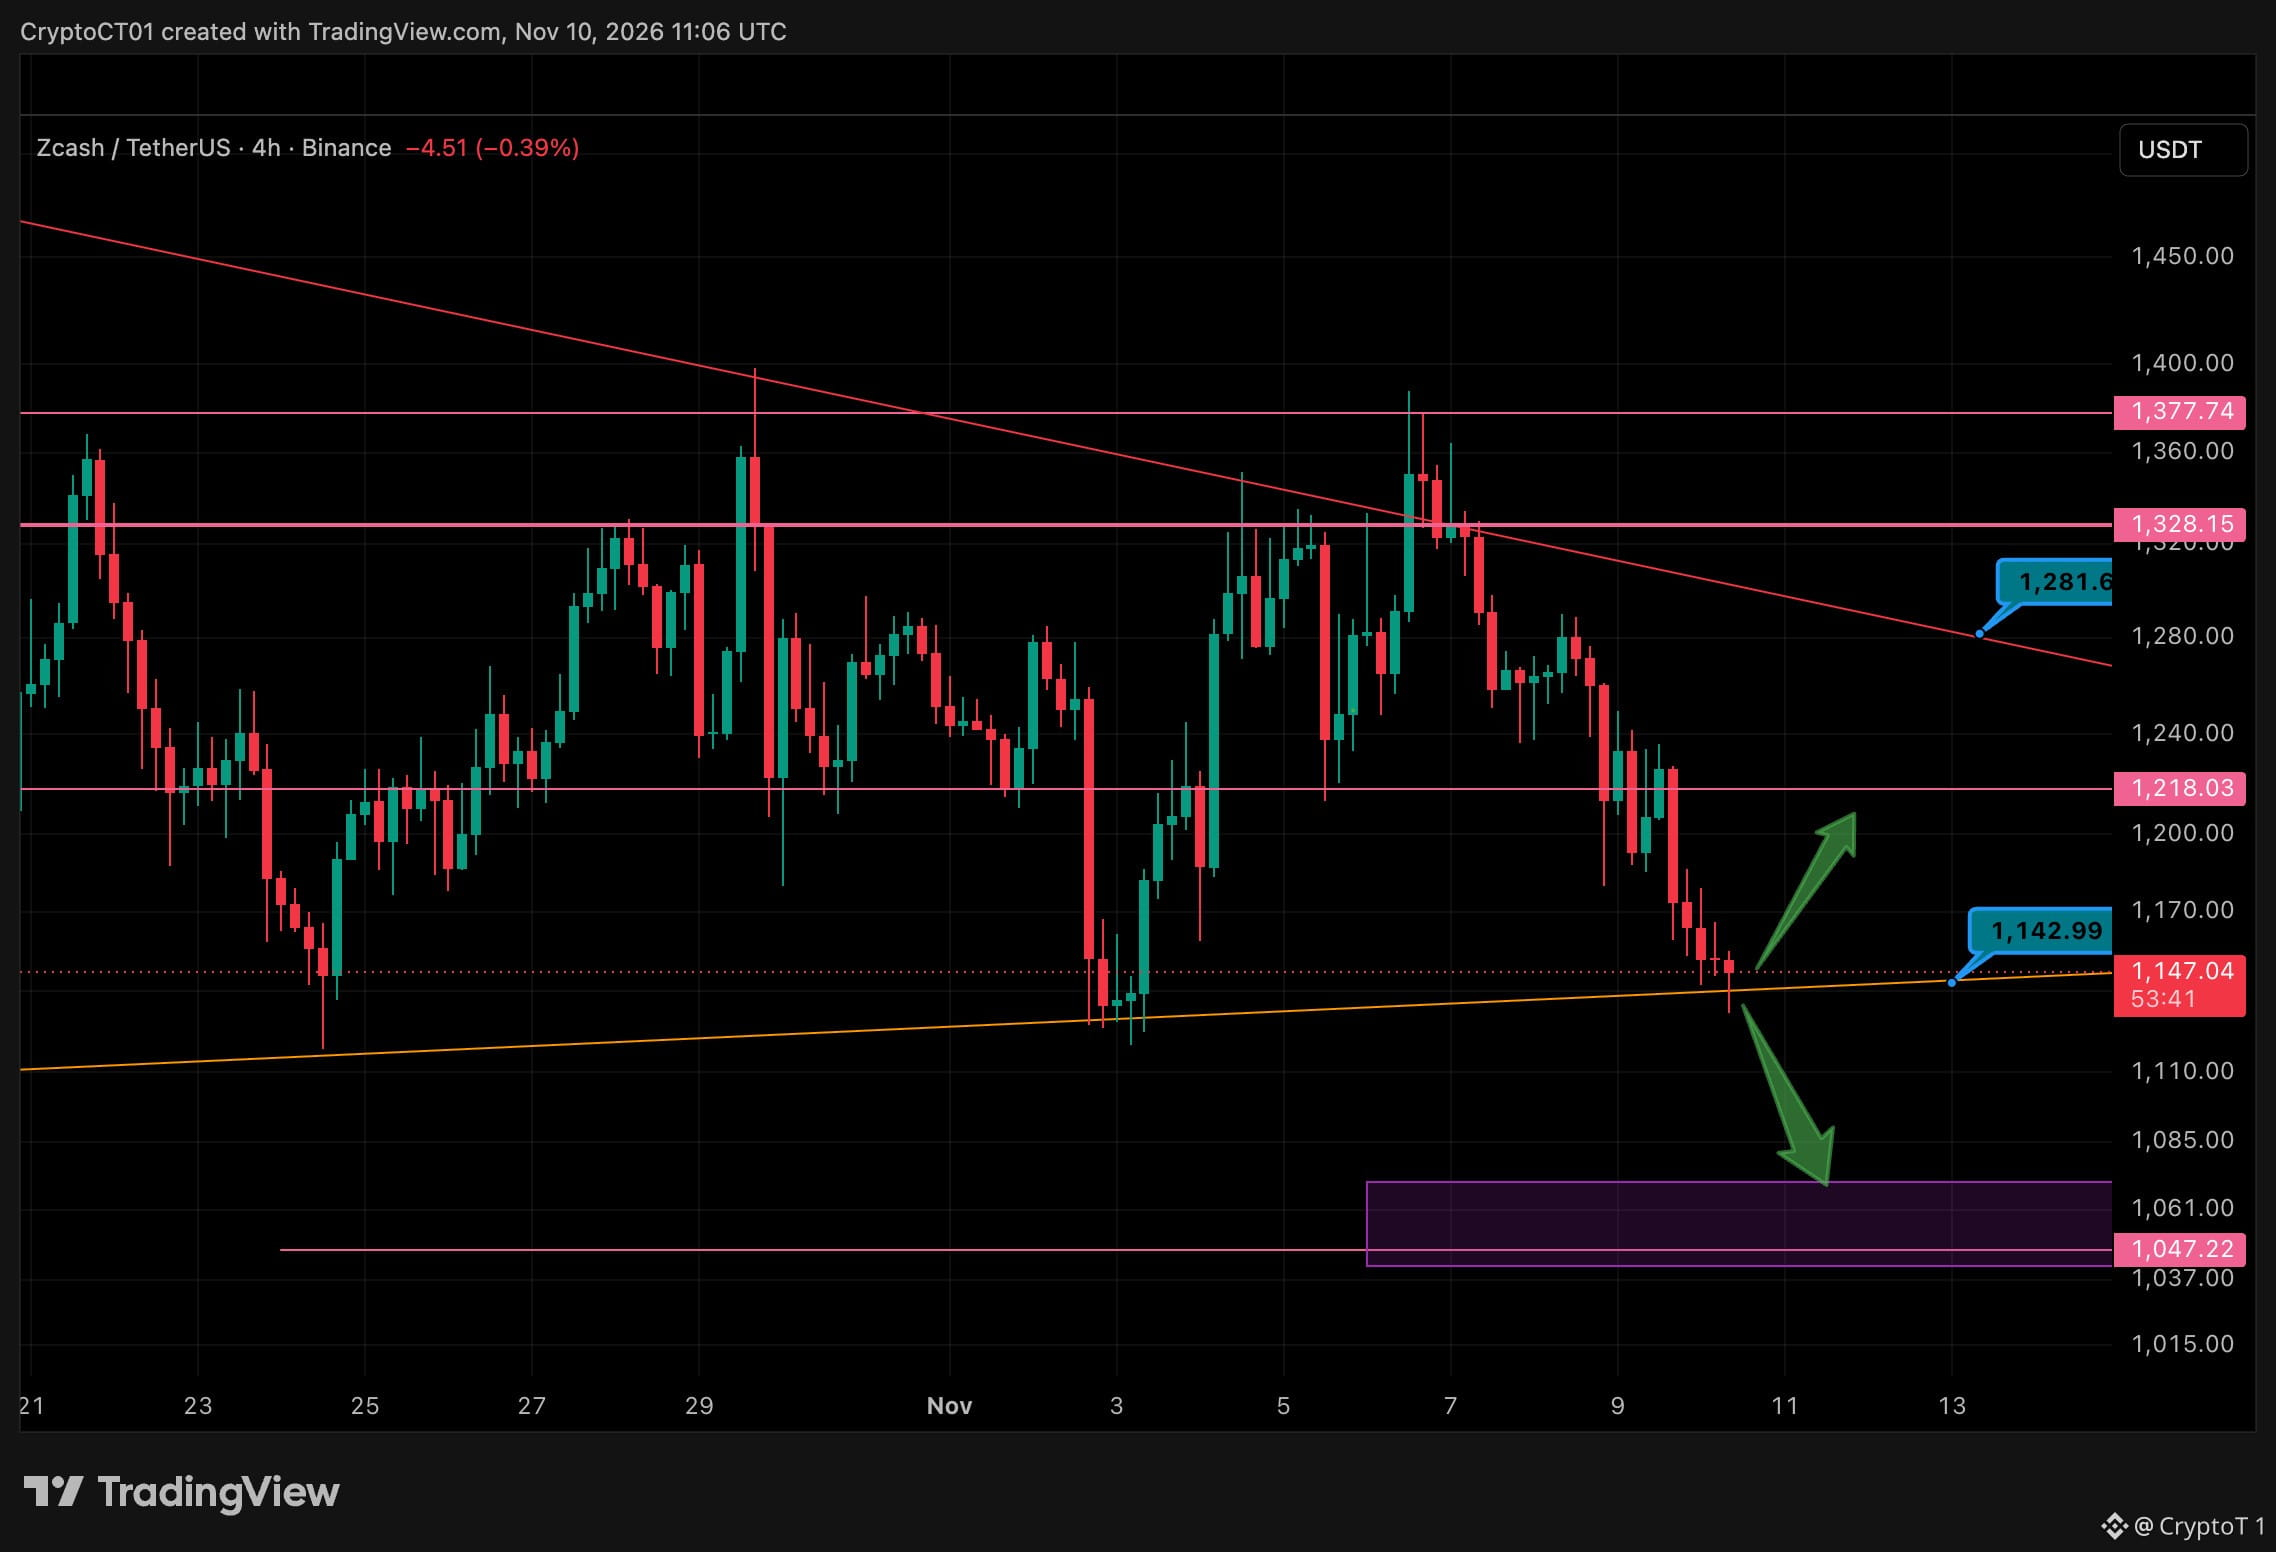
76
·
--
См. перевод
$BTC Sitting On The Trendline Into CPI 📉 Daily chart. Price is resting on the yellow descending support around $74.3K, after Sunday's $1B long flush wicked to $73.4K. 🔴 $86.5K 🔴 $82K channel top 🔴 $81.3K 🔴 $79.4K 🔴 $78.1K 🔴 $76.5K first reclaim 🟢 $74.3K trendline 🟢 $73.4K weekend low Context: Lower highs since October, still inside the downtrend channel. CPI lands tomorrow at 13:30 UK. My read: Holding the trendline into CPI keeps a range-low bounce on the table. A daily close back above $76.5K is the first sign buyers are back in control. The risk: A daily close under $73.4K loses the trendline and the weekend low together, and that opens the door lower. Bounce or breakdown after CPI? 👇 NFA #Bitcoin #BTC
$BTC Sitting On The Trendline Into CPI 📉 Daily chart. Price is resting on the yellow descending support around $74.3K, after Sunday's $1B long flush wicked to $73.4K. 🔴 $86.5K 🔴 $82K channel top 🔴 $81.3K 🔴 $79.4K 🔴 $78.1K 🔴 $76.5K first reclaim 🟢 $74.3K trendline 🟢 $73.4K weekend low Context: Lower highs since October, still inside the downtrend channel. CPI lands tomorrow at 13:30 UK. My read: Holding the trendline into CPI keeps a range-low bounce on the table. A daily close back above $76.5K is the first sign buyers are back in control. The risk: A daily close under $73.4K loses the trendline and the weekend low together, and that opens the door lower. Bounce or breakdown after CPI? 👇 NFA #Bitcoin #BTC
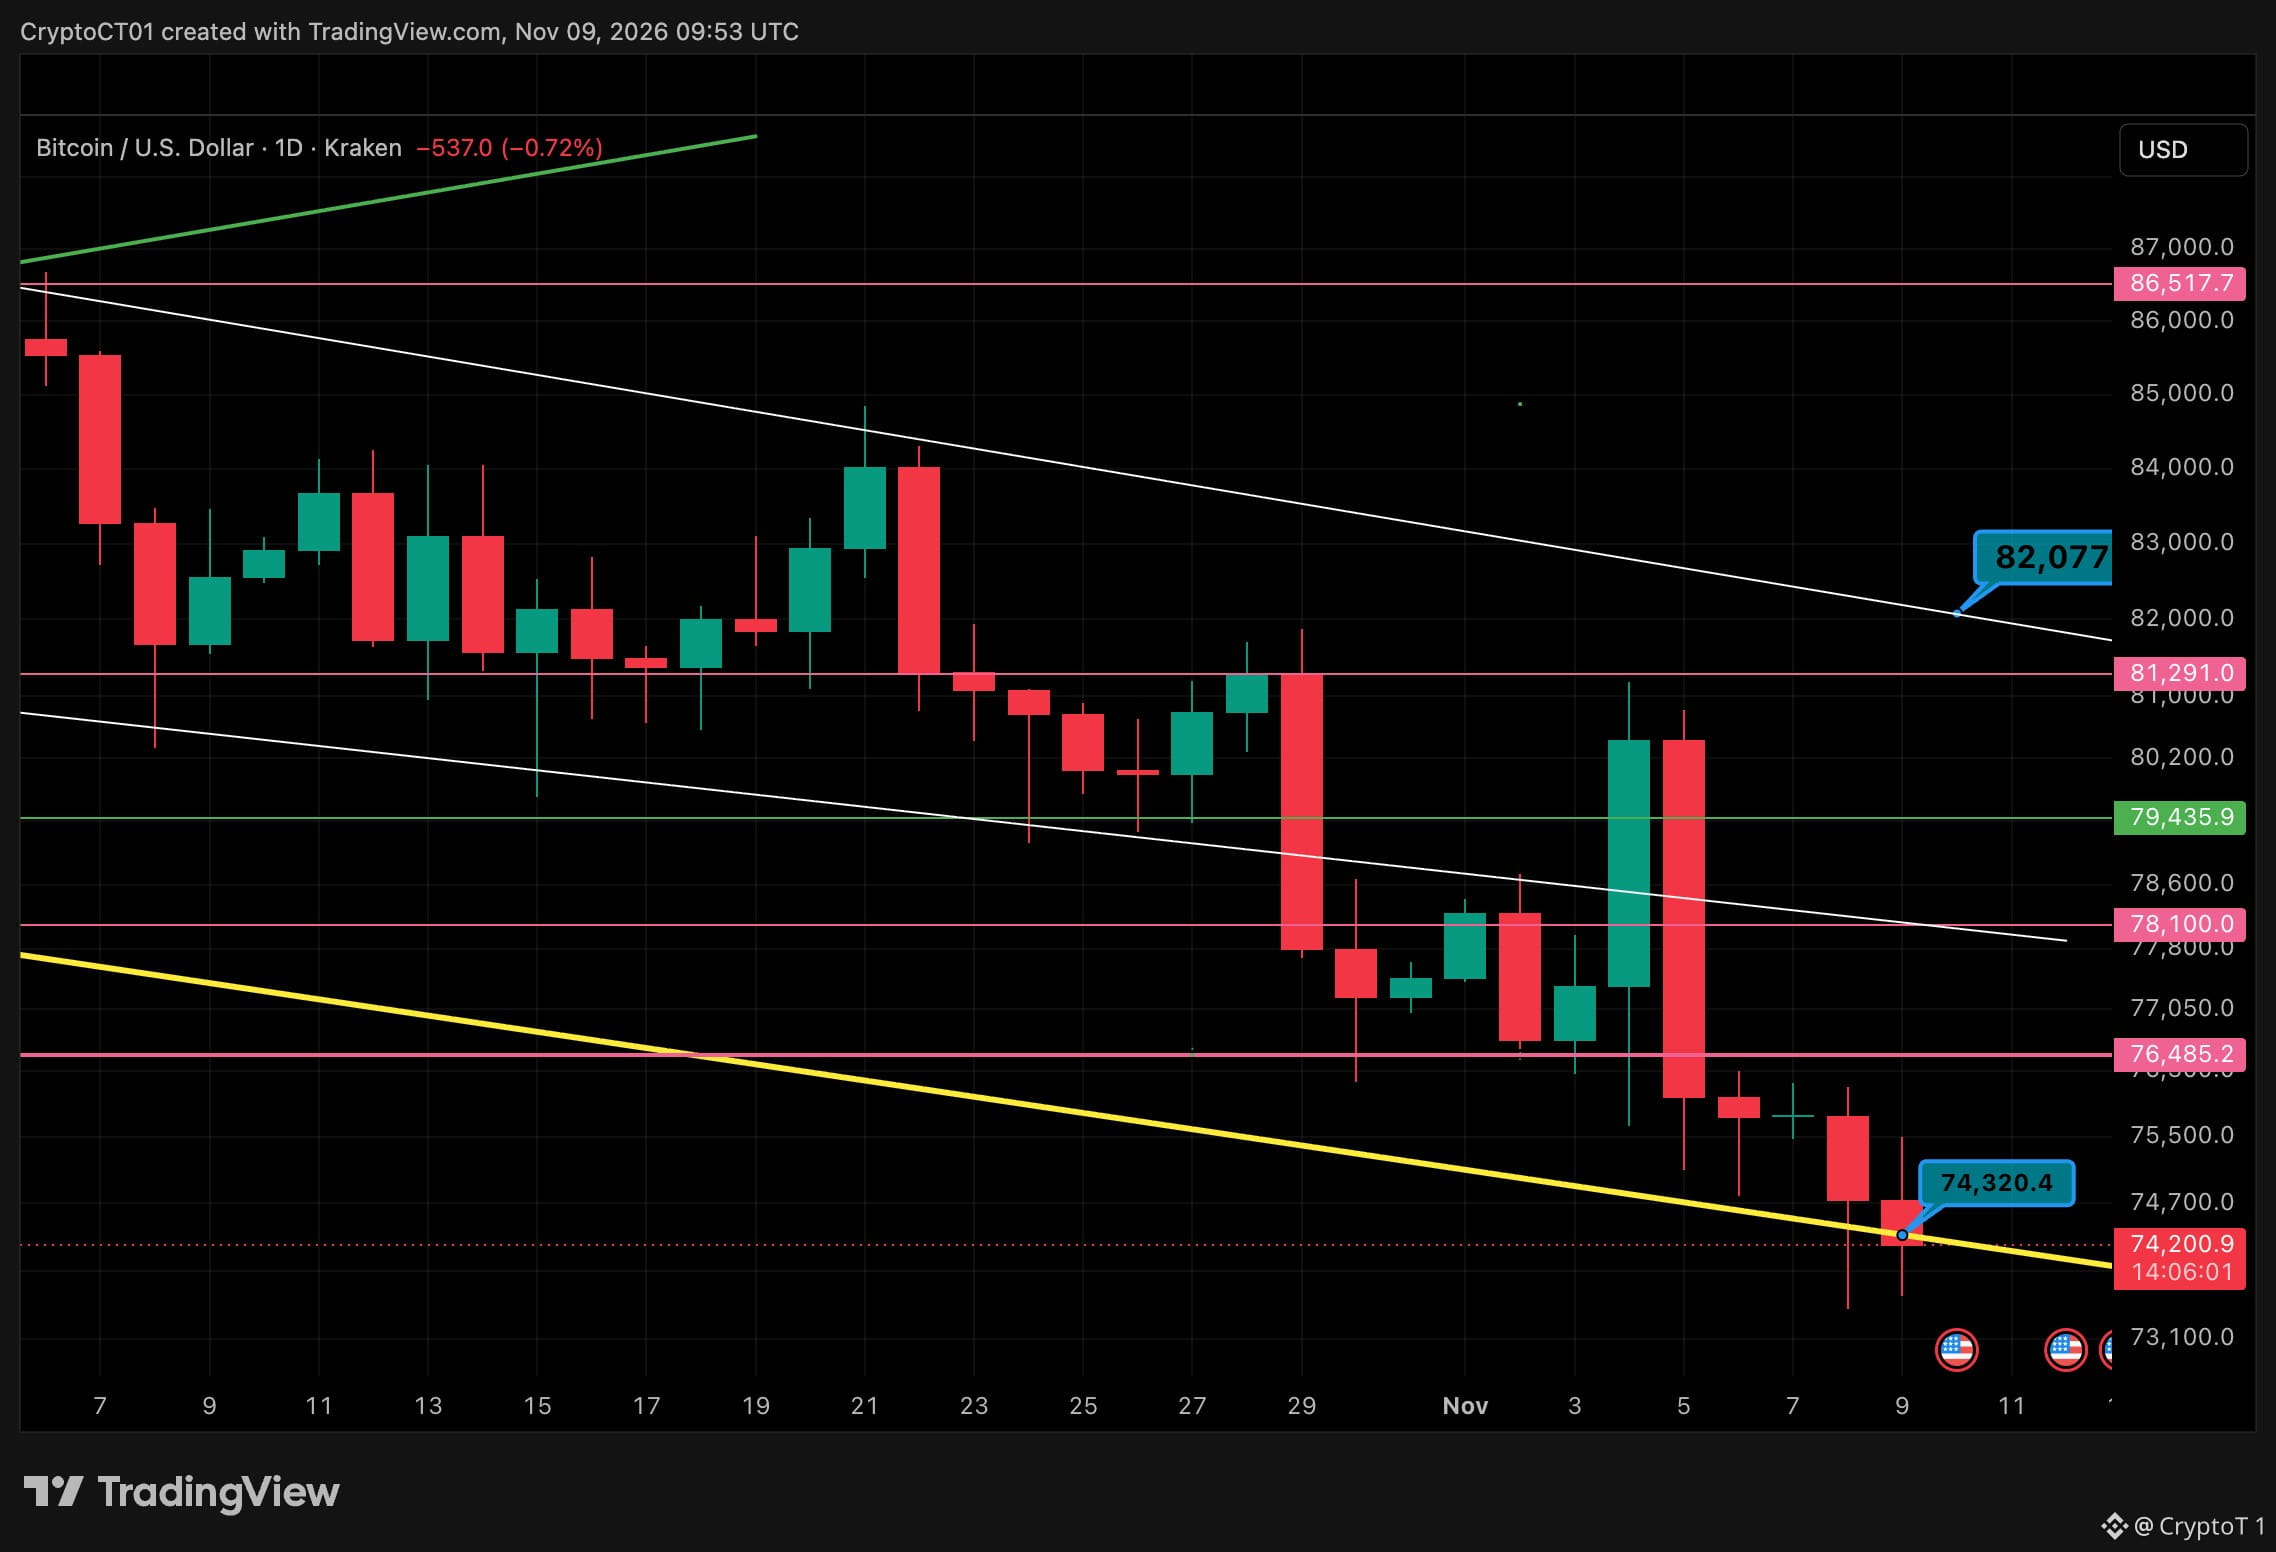
88
·
--
Золото встретило сопротивление на 4 141, первая поддержка — 4 024 🥇 На 4-часовом графике золото прошло весь путь V-образного восстановления до 4 141, но там его резко развернули. После череды красных свечей цена сейчас держится около 4 054. 🔹 Сопротивление: 4 071, затем 4 141 (уровень разворота) 🔹 Первая поддержка: 4 024 на нисходящем канале 🔹 Следующая поддержка: 3 989 — если пробьём её, откроется путь к 3 862 / 3 840 🔹 Сценарий: откат после неудачной попытки пробоя, пока ещё не разворот тренда Сегодня выйдет отчёт NFP. Обычно цена золота движется после публикации данных о занятости. Если уровень 4 024 устоит, это будет здоровый откат. Потеря 3 989 превратит пробой 4 141 в ложный сигнал. Как думаете, на каком уровне золото закрепится после публикации данных? 👇 Не является финансовой рекомендацией. #XAUUSD #Gold #Trading $XAUt
Золото встретило сопротивление на 4 141, первая поддержка — 4 024 🥇 На 4-часовом графике золото прошло весь путь V-образного восстановления до 4 141, но там его резко развернули. После череды красных свечей цена сейчас держится около 4 054. 🔹 Сопротивление: 4 071, затем 4 141 (уровень разворота) 🔹 Первая поддержка: 4 024 на нисходящем канале 🔹 Следующая поддержка: 3 989 — если пробьём её, откроется путь к 3 862 / 3 840 🔹 Сценарий: откат после неудачной попытки пробоя, пока ещё не разворот тренда Сегодня выйдет отчёт NFP. Обычно цена золота движется после публикации данных о занятости. Если уровень 4 024 устоит, это будет здоровый откат. Потеря 3 989 превратит пробой 4 141 в ложный сигнал. Как думаете, на каком уровне золото закрепится после публикации данных? 👇 Не является финансовой рекомендацией. #XAUUSD #Gold #Trading $XAUt
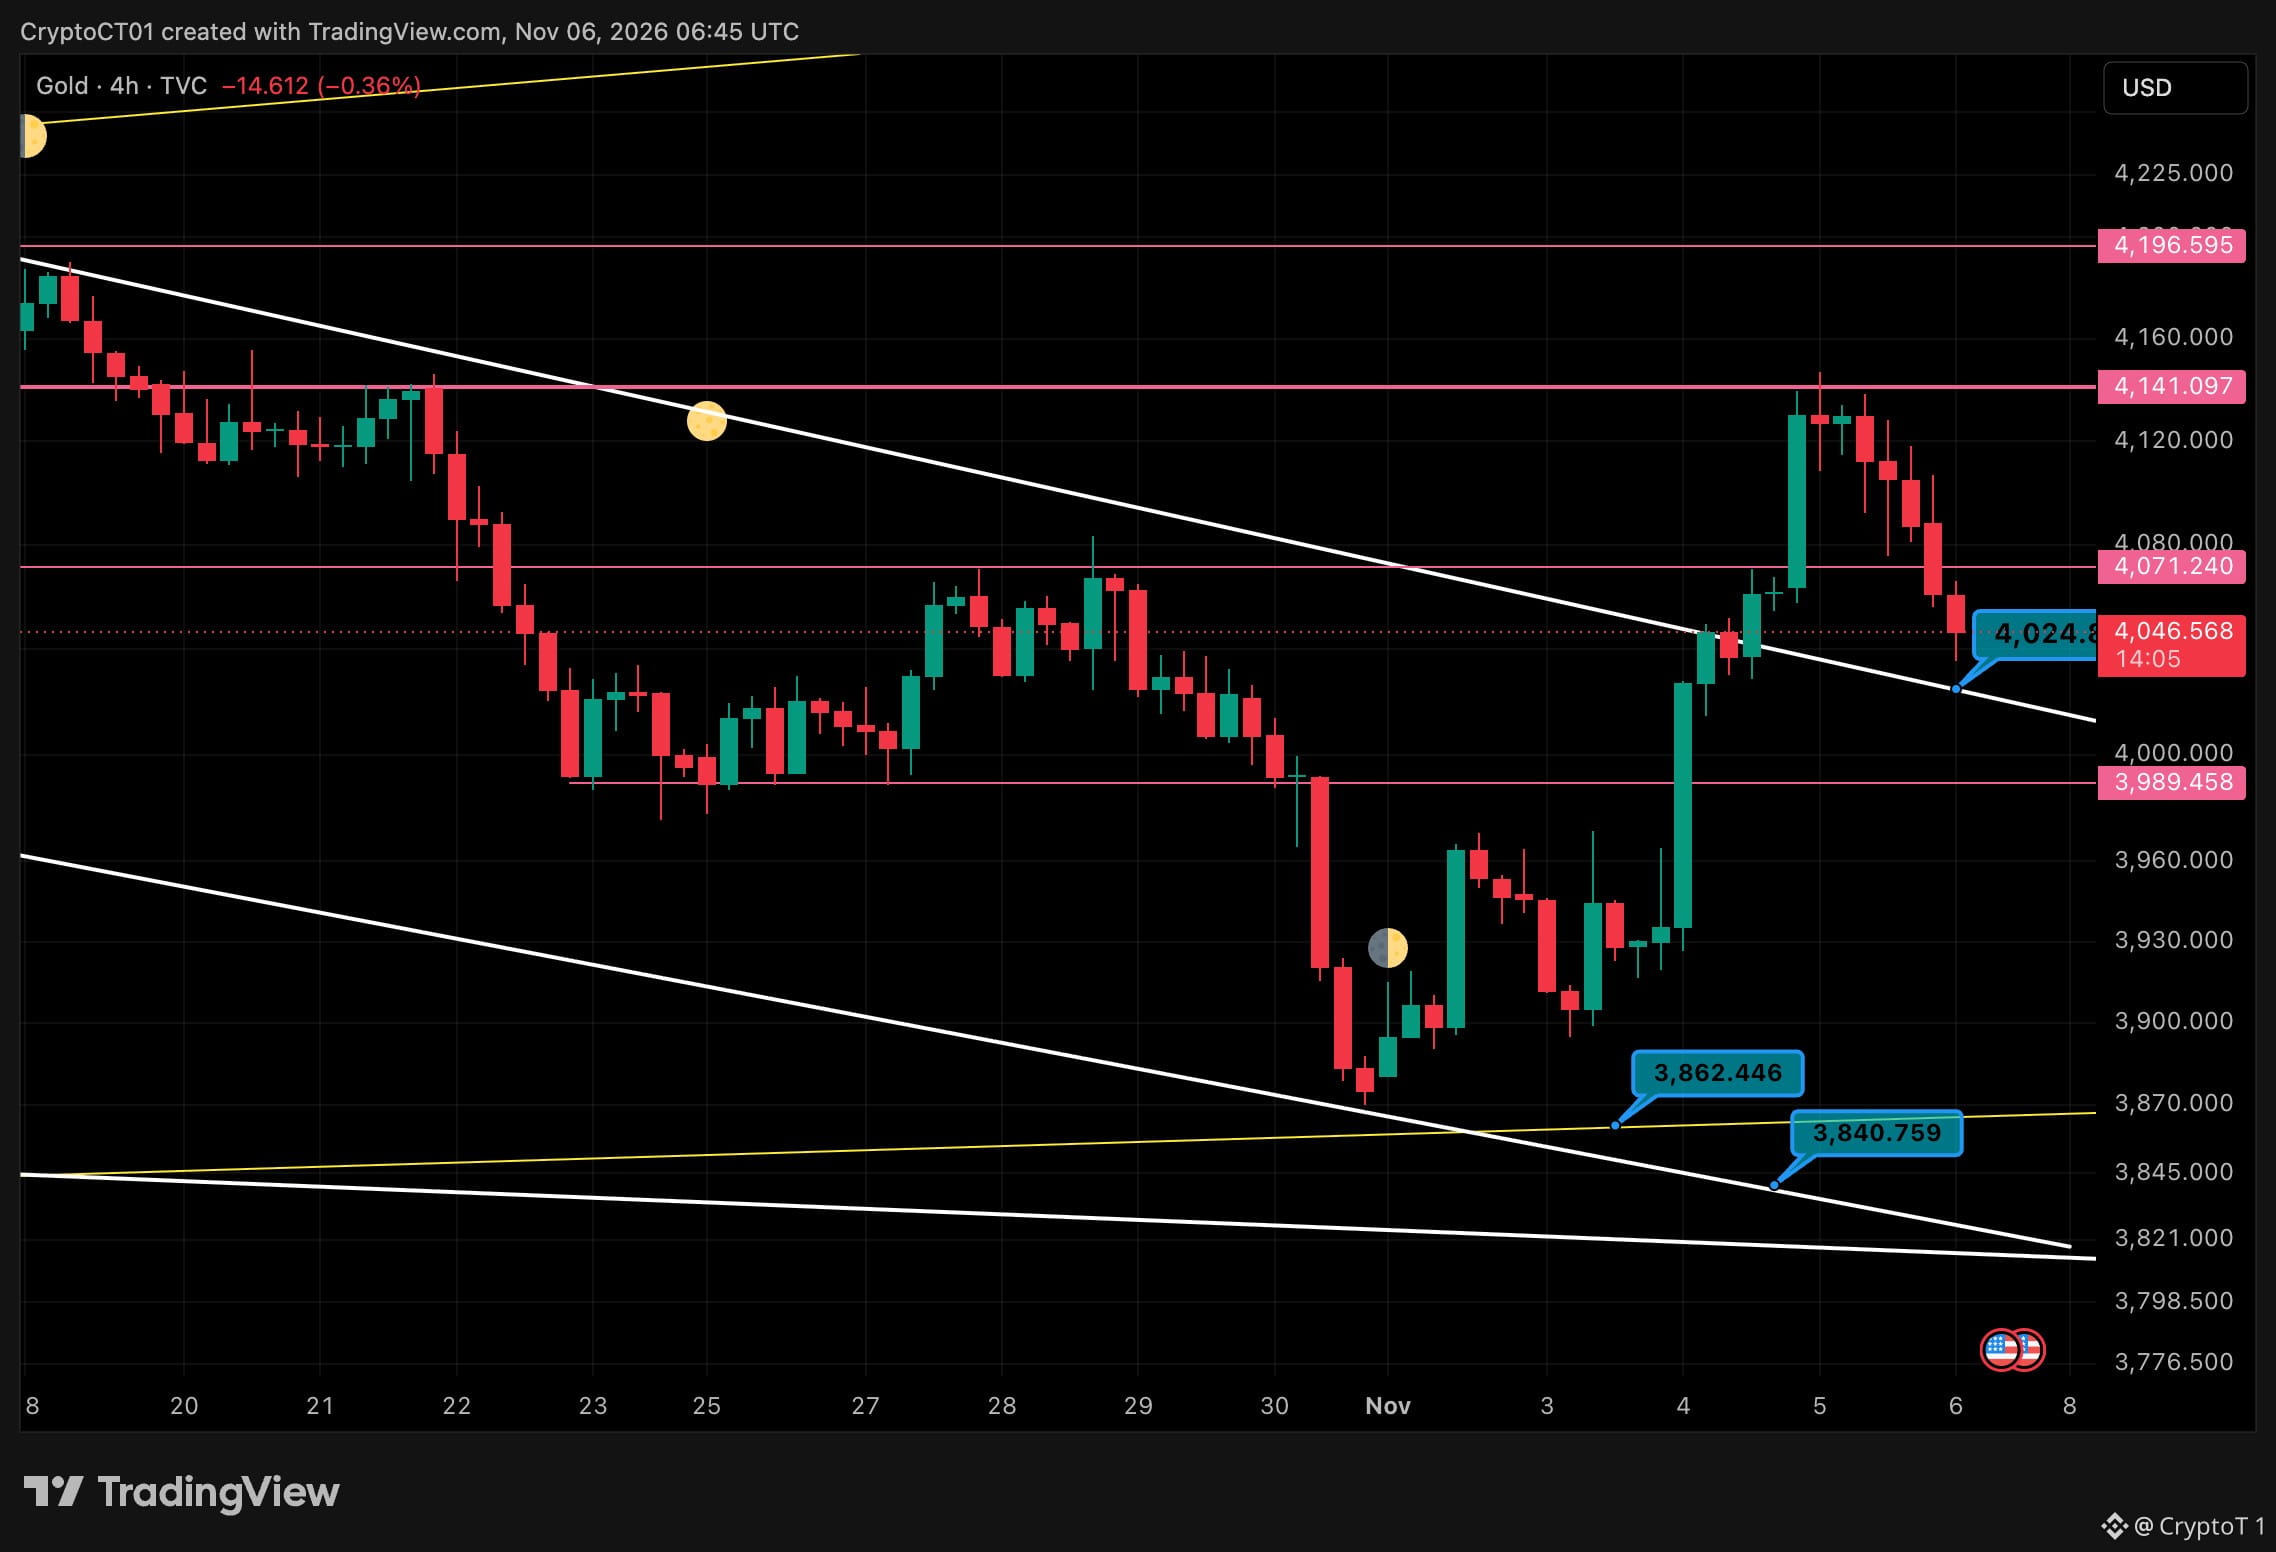
92
·
--
BTC вернул 80K, теперь путь к 81,3K 🚪 $BTC на 4-часовом графике опускался примерно до 75,7K, а затем стремительно вернулся выше границ канала. Сейчас он держится около 80,3K. 🔹 Сопротивление на 81 291. Цена уже отскакивала от этого уровня 🔹 Выше — верхняя граница канала около 82 593 🔹 Поддержка на 79 436, затем старая линия канала около 78 426 🔹 Ниже — 78 100, затем 76 485 🟢 Закрытие 4-часовой свечи выше 81 291 откроет путь к 82,6K, а затем — к 86,5K 🔴 Потеря уровня 79,4K, вероятно, вернёт цену к 78,4K для повторного тестирования пробоя 🎯 Не гонитесь за зелёными свечами. Дайте цене вернуться к уровням Завтрашние данные по занятости могут определить, в какую сторону произойдёт пробой. Пробой или ложный пробой? 👇 Не является финансовой рекомендацией. #Bitcoin #BTC #Crypto #TA
BTC вернул 80K, теперь путь к 81,3K 🚪 $BTC на 4-часовом графике опускался примерно до 75,7K, а затем стремительно вернулся выше границ канала. Сейчас он держится около 80,3K. 🔹 Сопротивление на 81 291. Цена уже отскакивала от этого уровня 🔹 Выше — верхняя граница канала около 82 593 🔹 Поддержка на 79 436, затем старая линия канала около 78 426 🔹 Ниже — 78 100, затем 76 485 🟢 Закрытие 4-часовой свечи выше 81 291 откроет путь к 82,6K, а затем — к 86,5K 🔴 Потеря уровня 79,4K, вероятно, вернёт цену к 78,4K для повторного тестирования пробоя 🎯 Не гонитесь за зелёными свечами. Дайте цене вернуться к уровням Завтрашние данные по занятости могут определить, в какую сторону произойдёт пробой. Пробой или ложный пробой? 👇 Не является финансовой рекомендацией. #Bitcoin #BTC #Crypto #TA
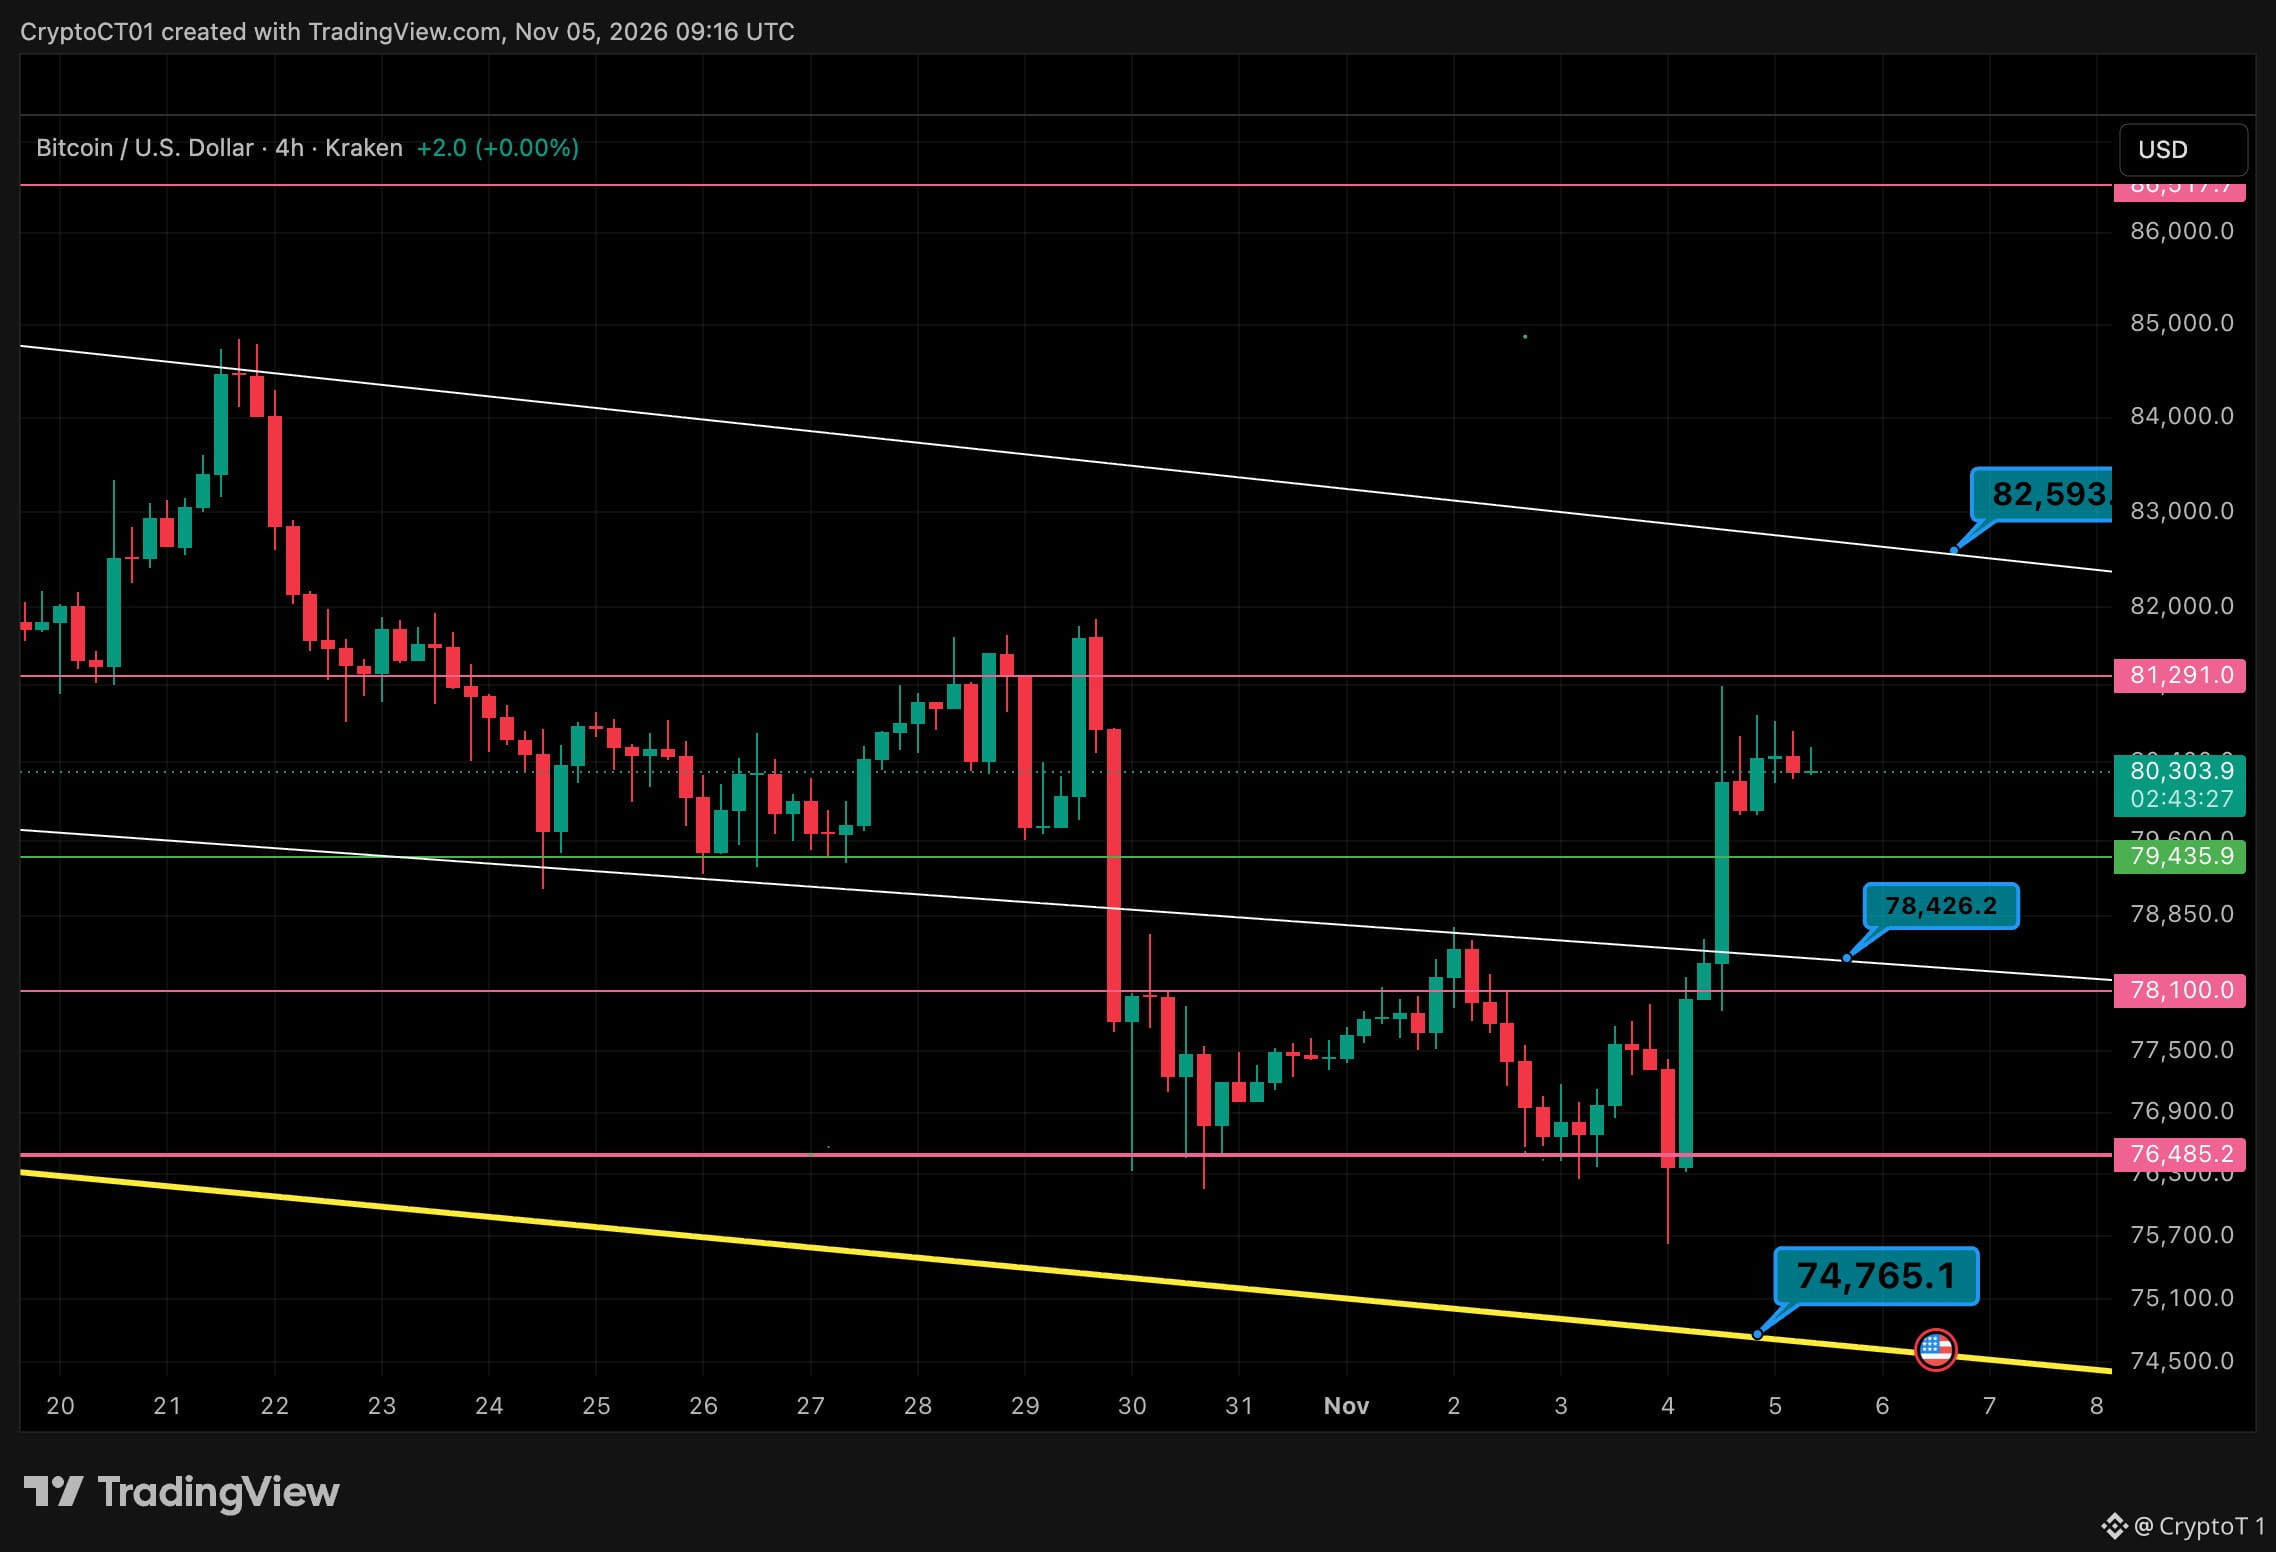
52
·
--
Золото пробило нисходящий тренд, теперь ему нужно преодолеть 4,141 🥇 На 4-часовом графике золото вышло за нисходящую линию тренда, которая с конца октября сдерживала его рост, а затем сразу упёрлось в сопротивление. 🔹 С первой попытки цена не преодолела отметку 4,141 и торгуется около 4,116 🟢 Поддержка: 4,071, затем пробитая линия тренда в районе 4,036 🎯 Закрытие выше 4,141 откроет путь к 4,196, а выше — к 4,321 🔴 Возврат ниже 4,036 вернёт цену в прежний канал, и в игру вступит уровень 3,989 Откат с удержанием у линии тренда — более надёжный вариант для входа в лонг. Покупать прямо перед 4,141 — не лучший вариант. Вы покупаете на просадке или ждёте пробоя? 👇 Не является финансовой рекомендацией. #Золото #XAUUSD #Трейдинг $XAUt
Золото пробило нисходящий тренд, теперь ему нужно преодолеть 4,141 🥇 На 4-часовом графике золото вышло за нисходящую линию тренда, которая с конца октября сдерживала его рост, а затем сразу упёрлось в сопротивление. 🔹 С первой попытки цена не преодолела отметку 4,141 и торгуется около 4,116 🟢 Поддержка: 4,071, затем пробитая линия тренда в районе 4,036 🎯 Закрытие выше 4,141 откроет путь к 4,196, а выше — к 4,321 🔴 Возврат ниже 4,036 вернёт цену в прежний канал, и в игру вступит уровень 3,989 Откат с удержанием у линии тренда — более надёжный вариант для входа в лонг. Покупать прямо перед 4,141 — не лучший вариант. Вы покупаете на просадке или ждёте пробоя? 👇 Не является финансовой рекомендацией. #Золото #XAUUSD #Трейдинг $XAUt
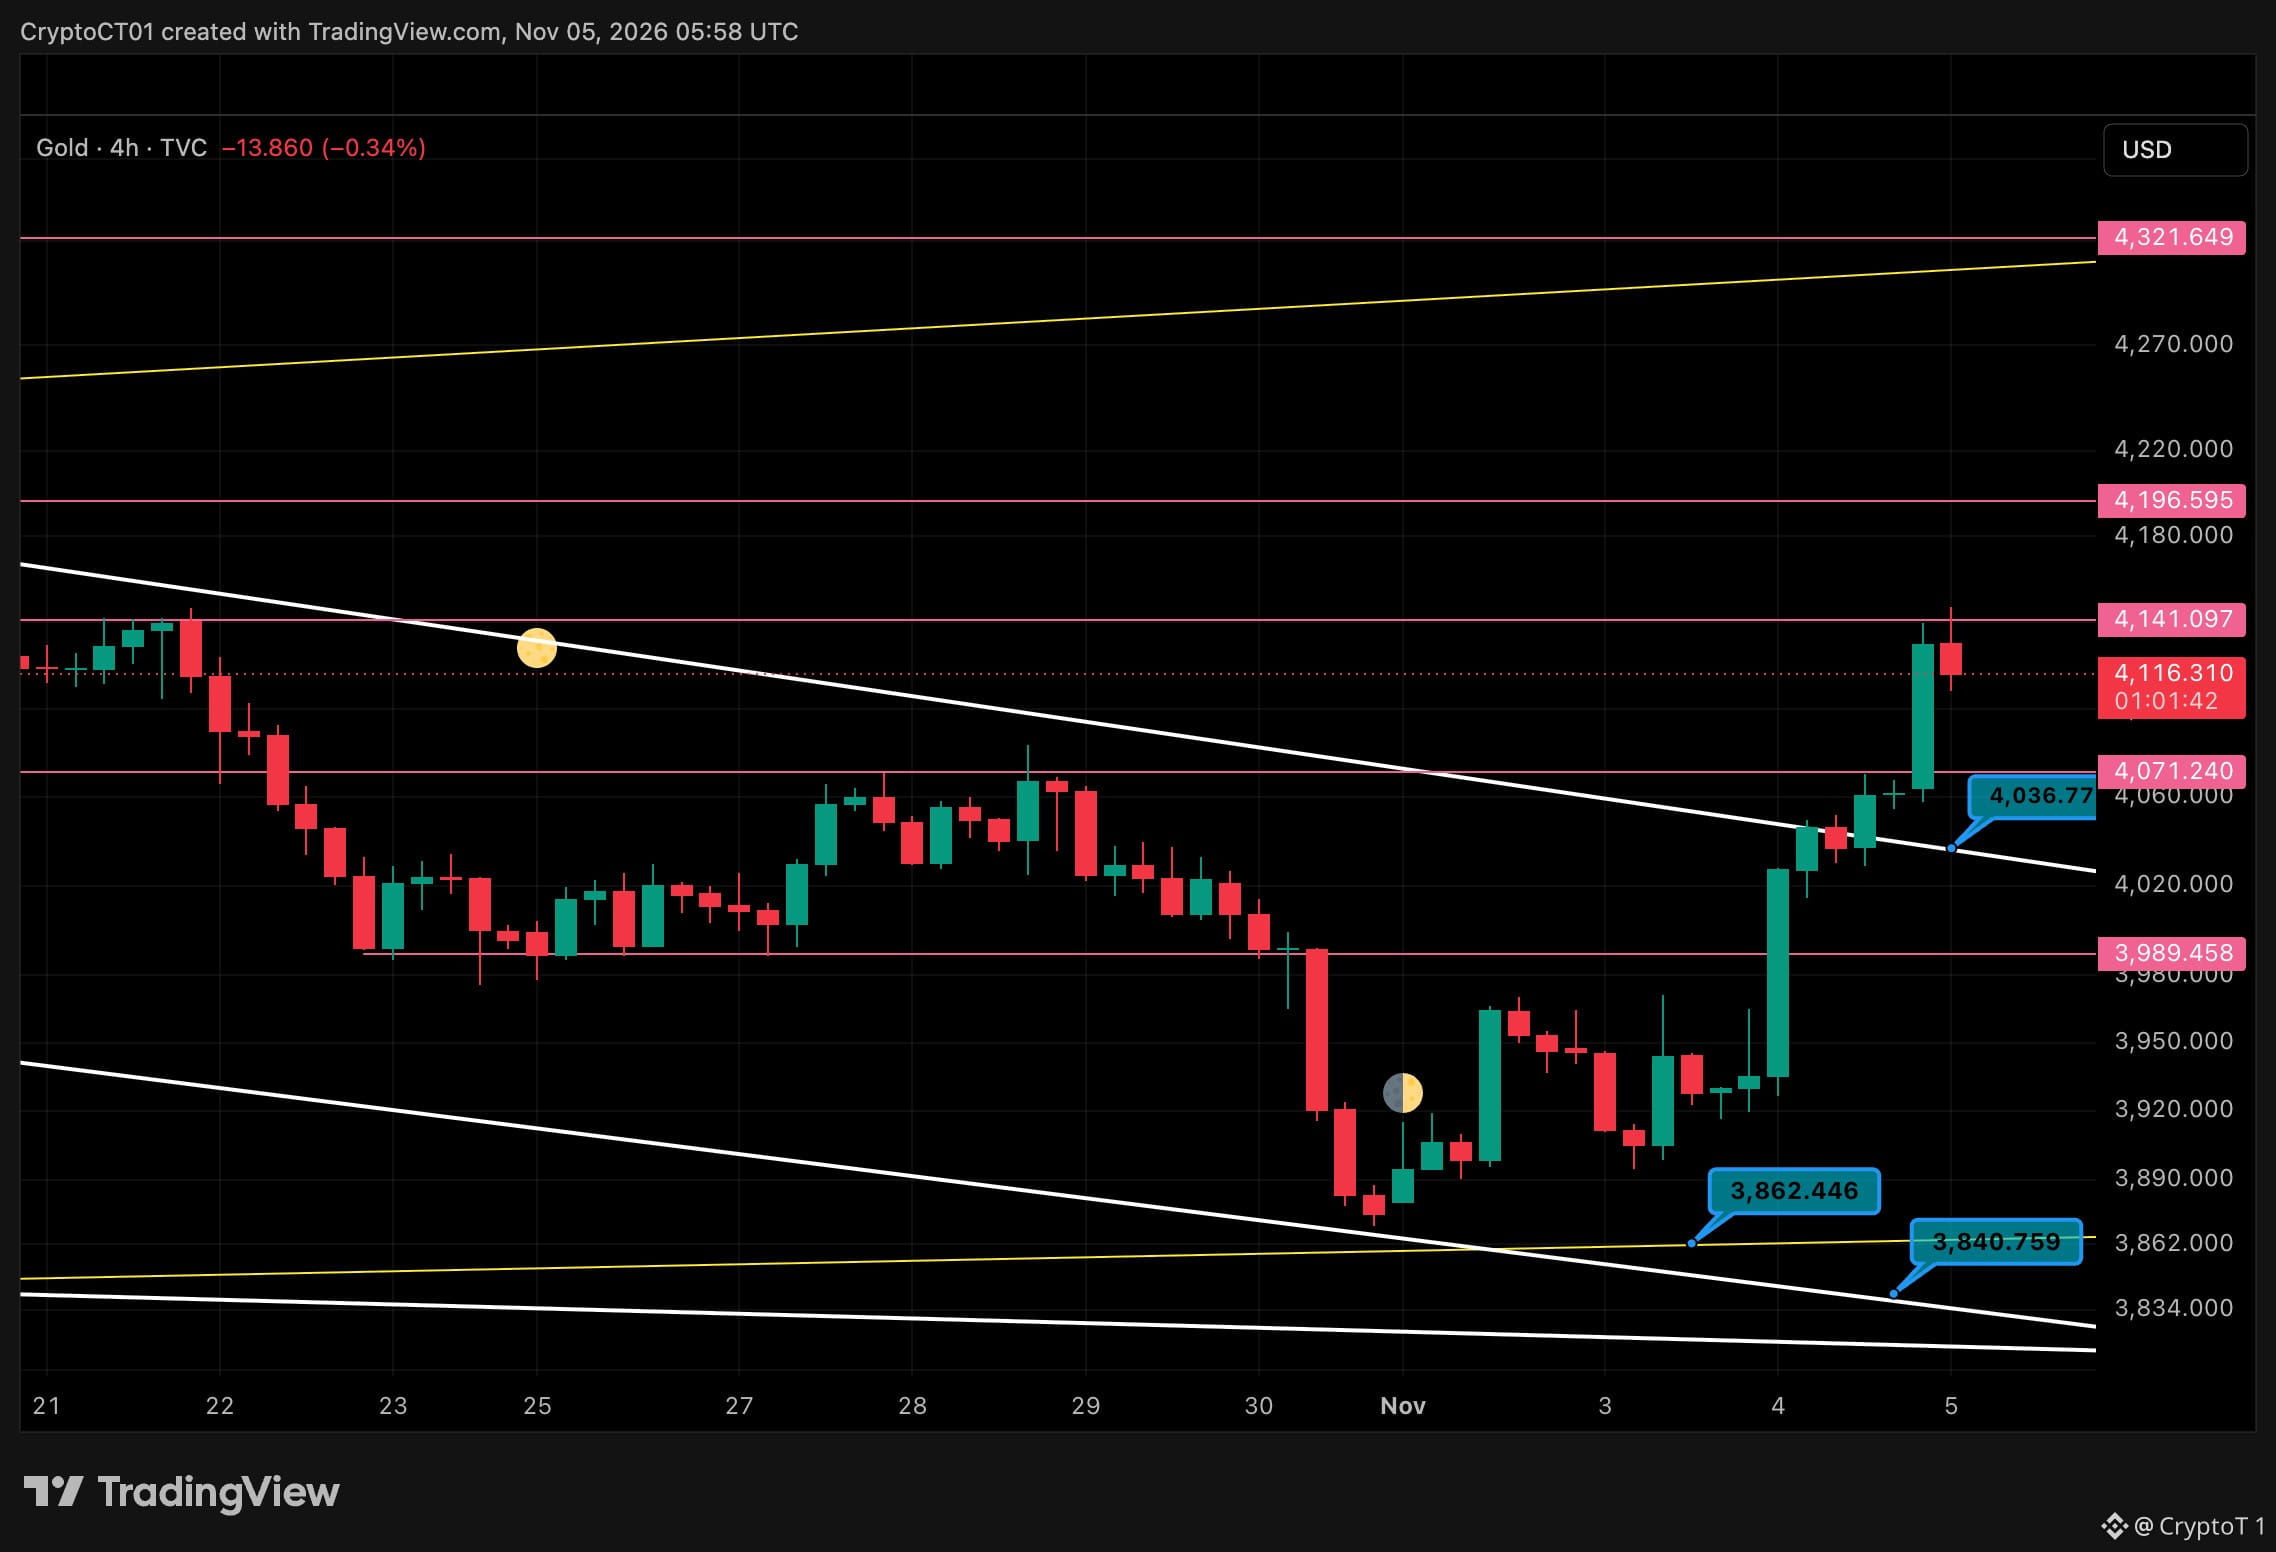
63
·
--
$BTC Дневной график: тестируем потолок 🟢 Вчера цена фитилём опустилась примерно до 75.7K, а закрылась выше 76.5K. Сегодня мы вплотную подошли к 78.1K. 🔹 Поддержка: 76,485, затем нижняя линия тренда около 74.8K 🟢 Тестируемый уровень: 78,100 — цена не может его преодолеть с падения 29 октября 🟢 Выше: 79,436, затем 81,291 🎯 Общая картина: верхняя граница канала около 82.6K Цена по-прежнему внутри нисходящего канала, сформировавшегося в начале октября, поэтому я дождусь дневного закрытия выше 78.1K, прежде чем говорить о развороте. Терпение: пусть цена сама дойдёт до этих уровней. Сегодня пробой или отскок вниз к 76.5K? 👇 Не является финансовой рекомендацией. #Bitcoin #BTC #Crypto
$BTC Дневной график: тестируем потолок 🟢 Вчера цена фитилём опустилась примерно до 75.7K, а закрылась выше 76.5K. Сегодня мы вплотную подошли к 78.1K. 🔹 Поддержка: 76,485, затем нижняя линия тренда около 74.8K 🟢 Тестируемый уровень: 78,100 — цена не может его преодолеть с падения 29 октября 🟢 Выше: 79,436, затем 81,291 🎯 Общая картина: верхняя граница канала около 82.6K Цена по-прежнему внутри нисходящего канала, сформировавшегося в начале октября, поэтому я дождусь дневного закрытия выше 78.1K, прежде чем говорить о развороте. Терпение: пусть цена сама дойдёт до этих уровней. Сегодня пробой или отскок вниз к 76.5K? 👇 Не является финансовой рекомендацией. #Bitcoin #BTC #Crypto
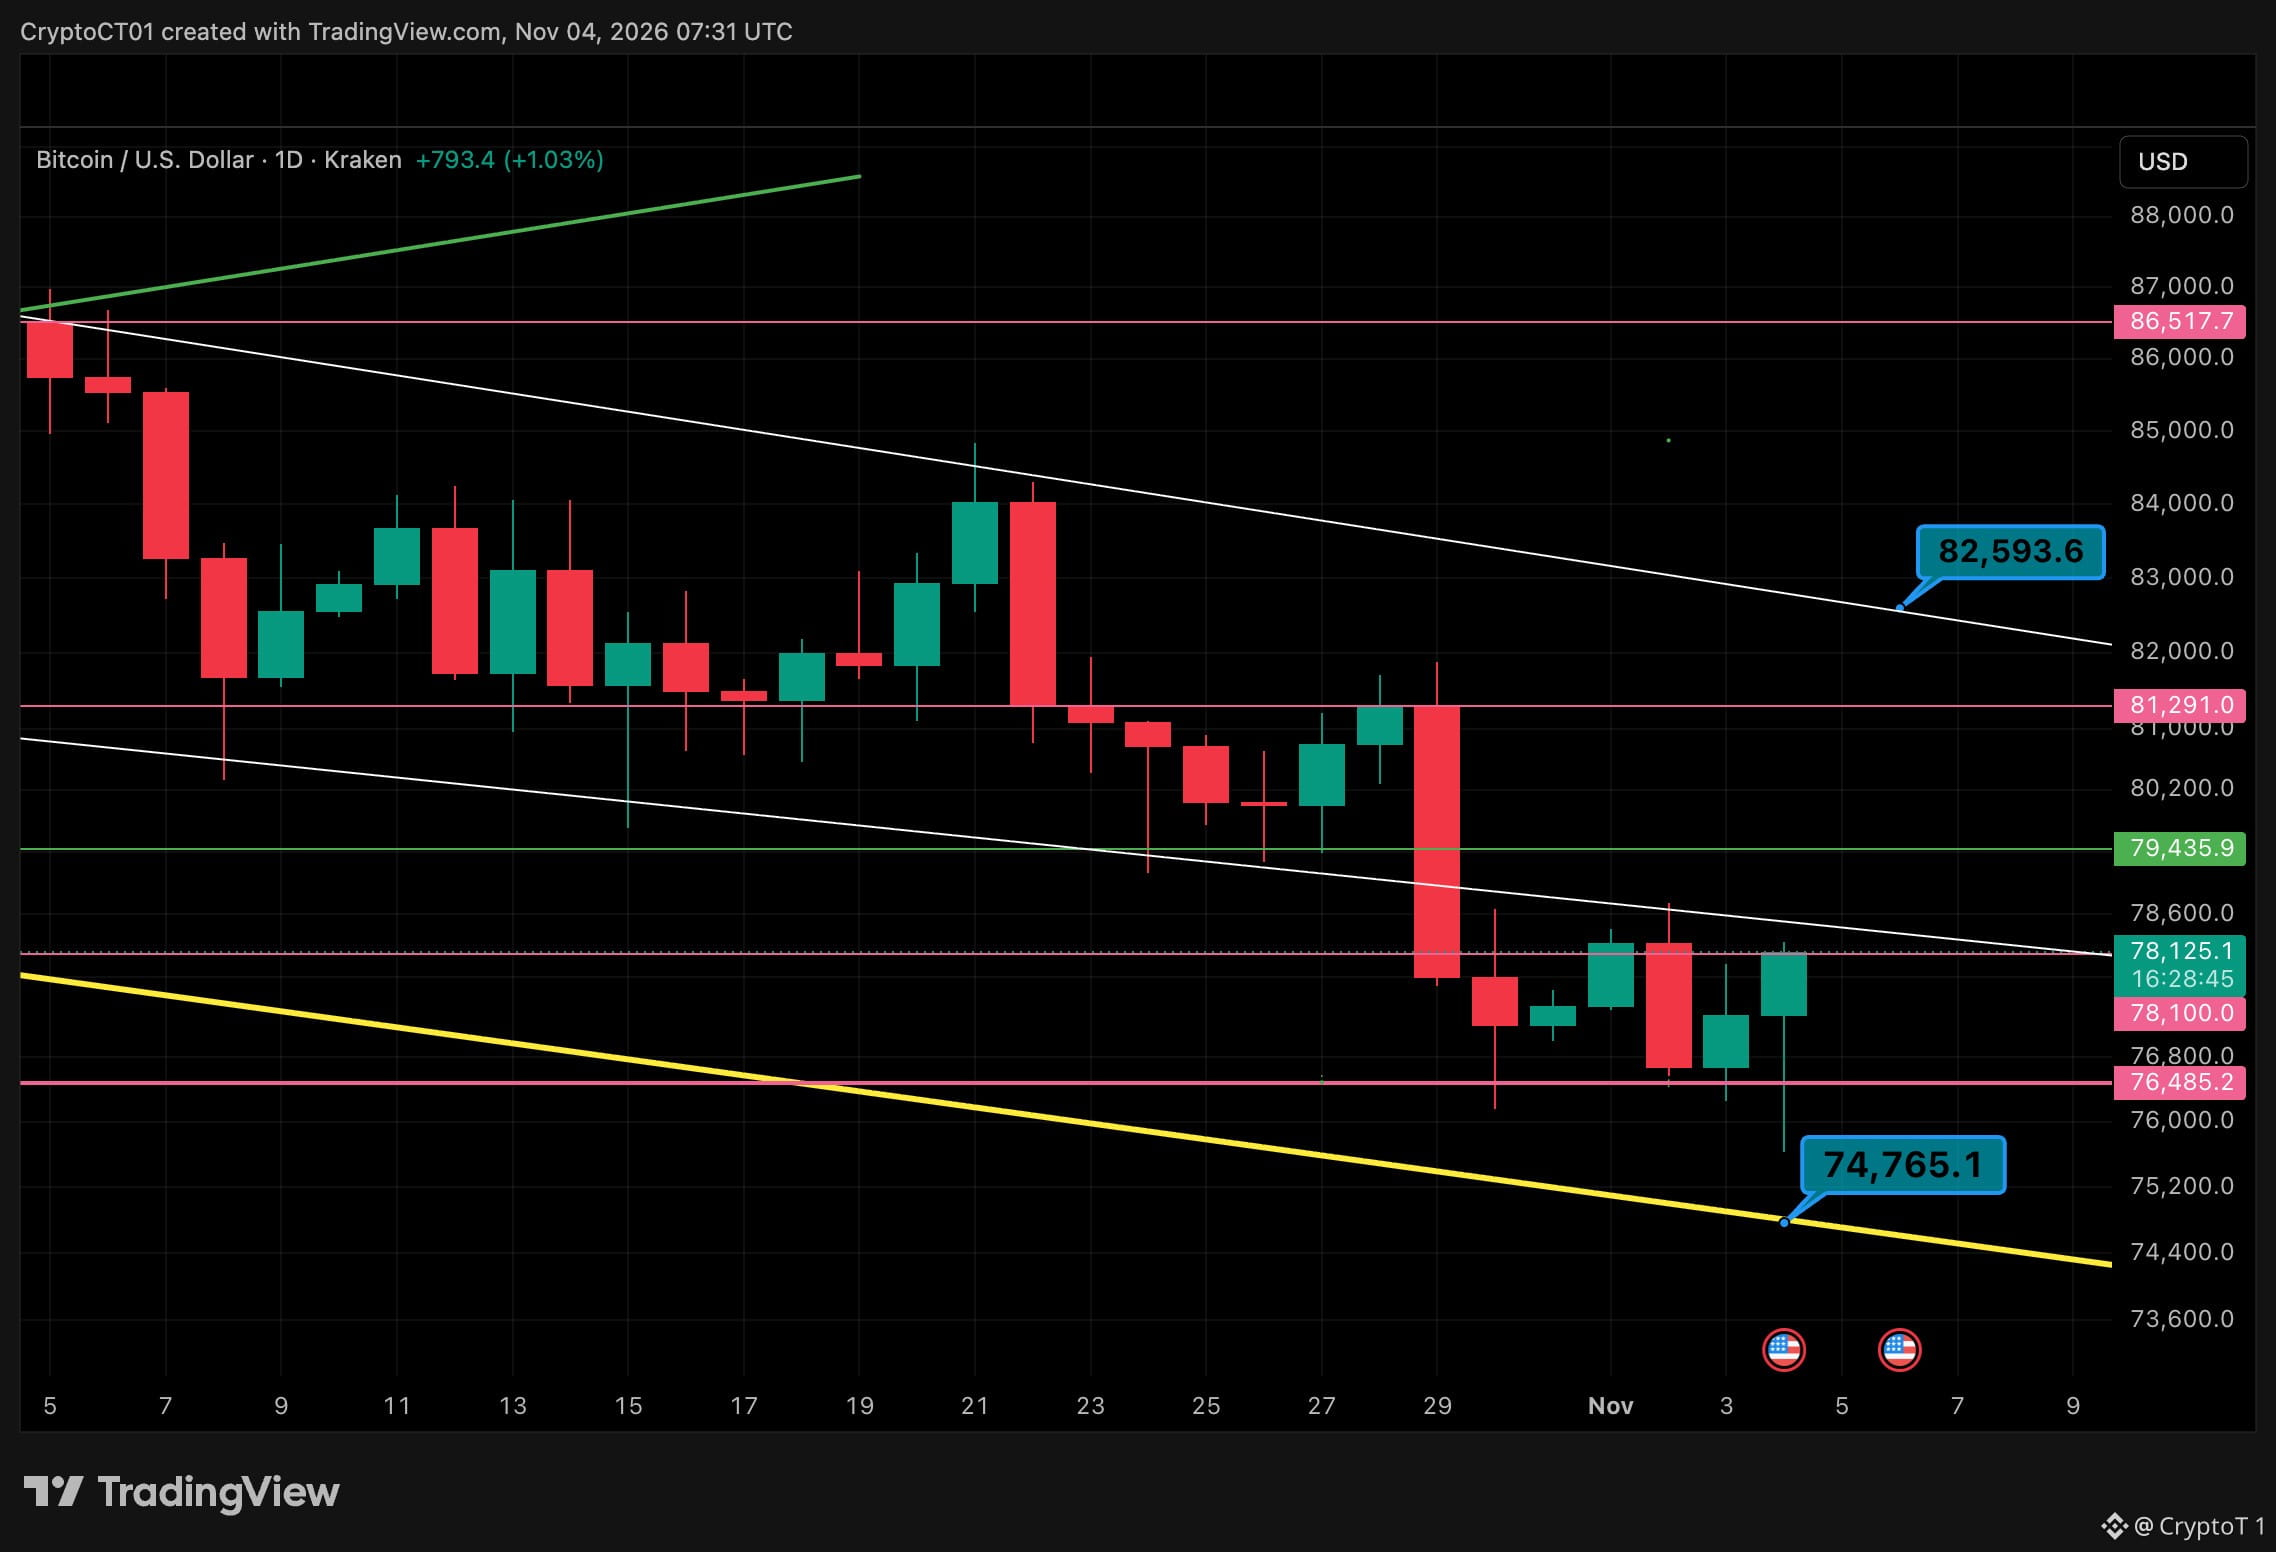
62
·
--
Золото снова выше $4,000 🟡 Сильный импульс на 4-часовом графике: теперь цена снова около 4,015 после пробоя уровня 3,989, за которым я следил. 🔹 3,989 был сопротивлением, теперь этот уровень должен удержаться как поддержка 🟢 Следующая цель — 4,046, где проходит линия нисходящего тренда с середины октября 🟢 Выше — 4,071, уровень пробоя конца октября 🔴 Если цена потеряет 3,989, снова станут актуальны минимумы 3,862 / 3,820 Я не буду гнаться за этой свечой. Лучше дождаться ретеста 3,989 с удержанием уровня или уверенного закрытия 4-часовой свечи выше линии тренда. Пробой или ловушка для быков? 👇 Не является финансовой рекомендацией. #Золото #XAUUSD #Трейдинг $XAUt
Золото снова выше $4,000 🟡 Сильный импульс на 4-часовом графике: теперь цена снова около 4,015 после пробоя уровня 3,989, за которым я следил. 🔹 3,989 был сопротивлением, теперь этот уровень должен удержаться как поддержка 🟢 Следующая цель — 4,046, где проходит линия нисходящего тренда с середины октября 🟢 Выше — 4,071, уровень пробоя конца октября 🔴 Если цена потеряет 3,989, снова станут актуальны минимумы 3,862 / 3,820 Я не буду гнаться за этой свечой. Лучше дождаться ретеста 3,989 с удержанием уровня или уверенного закрытия 4-часовой свечи выше линии тренда. Пробой или ловушка для быков? 👇 Не является финансовой рекомендацией. #Золото #XAUUSD #Трейдинг $XAUt
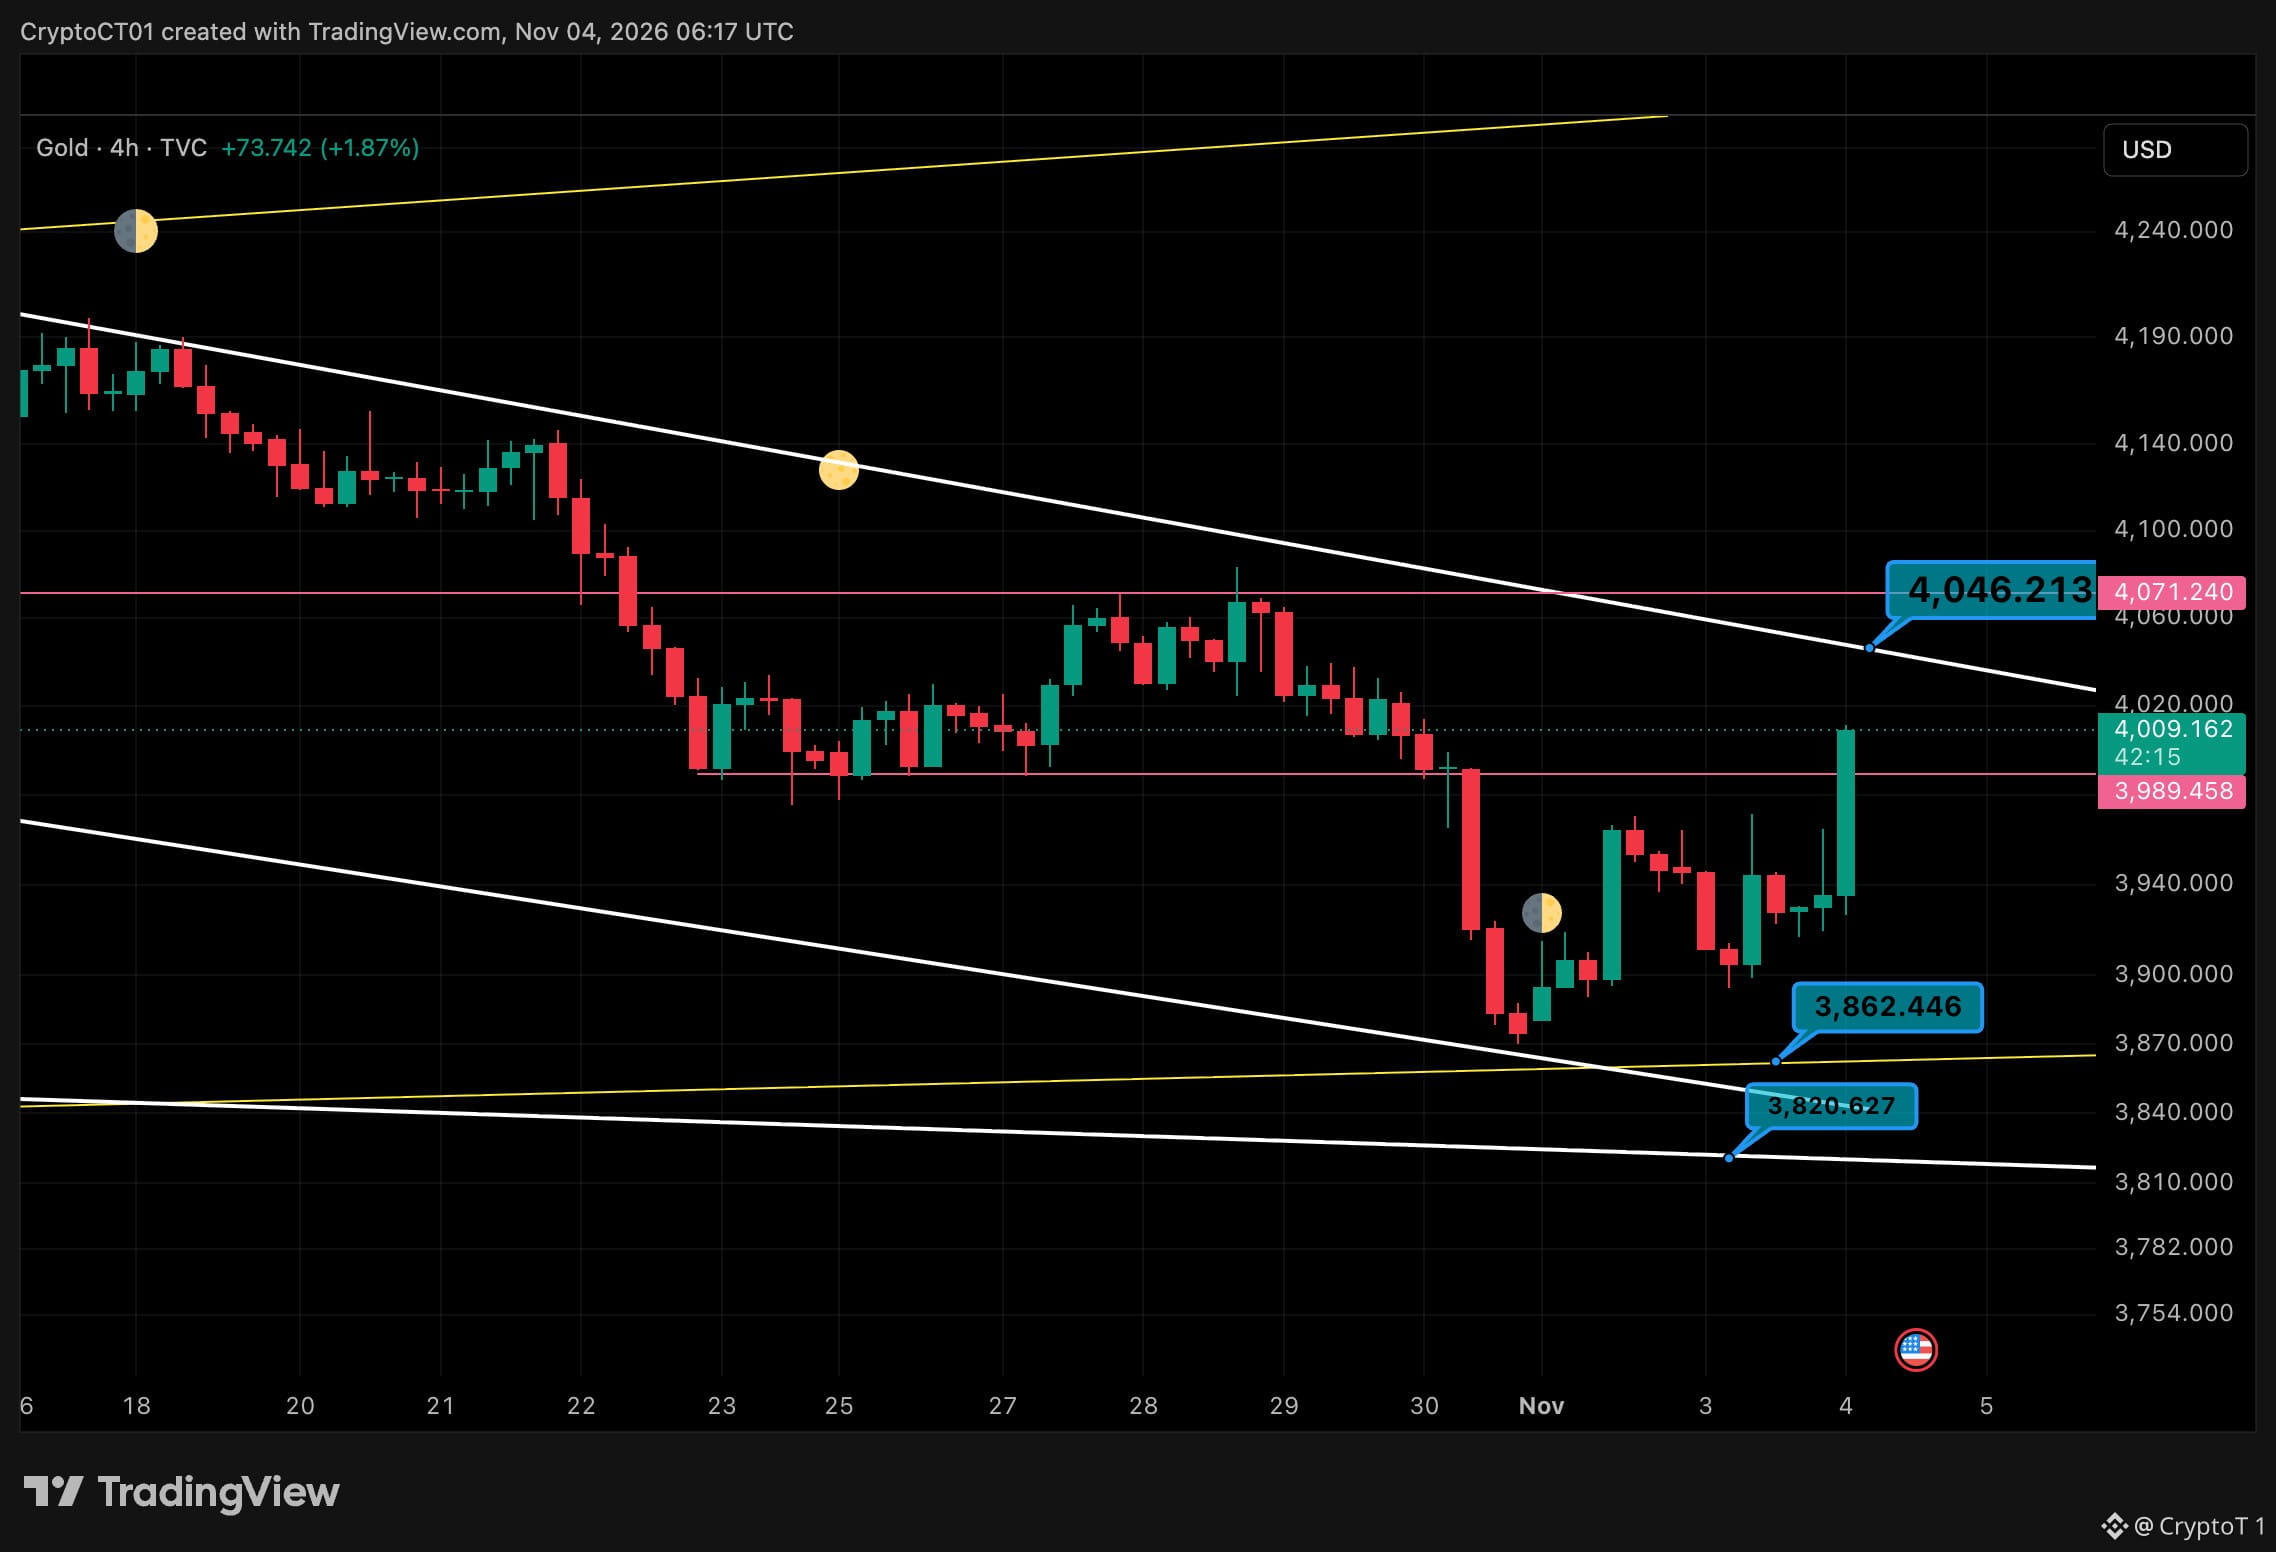
76
Войдите, чтобы посмотреть больше материала
Присоединяйтесь к пользователям криптовалют по всему миру на Binance Square
⚡️ Получайте новейшую и полезную информацию о криптоактивах.
💬 Нам доверяет крупнейшая в мире криптобиржа.
👍 Получите достоверные аналитические данные от верифицированных создателей контента.
Эл. почта/номер телефона
В тренде
NvidiaBeatsEstimatesAICloudStocksRiseAfterHours
Просмотров: 5,616
73 обсуждают
Выручка Nvidia составила 115,8 млрд долларов, превысив прогноз; компания ожидает 130 млрд долларов и добавляет 150 млрд долларов на выкуп акций
Binance News
·Лайков: 8
·Просмотров: 10.7k
A Packed Week of Earnings and Data Tests Markets
Просмотров: 153,499
668 обсуждают
AnthropicIPOTestsInvestorAppetiteForAI
Просмотров: 338,996
2,934 обсуждают