
Joao Wedson
108 Публикации

Joao Wedson
Отправить жалобу
Заблокировать пользователя
💎Founder & CEO of @Alphractal
🏅Verified Author at CoinMarketCap & CryptoQuant
⚙ MSc in Data Science & AI
🦾Engineer in Robotics & Automation
₿itcoin OG
0 подписок(и/а)
4 подписчиков(а)
11 понравилось
Посты
·
--
См. перевод
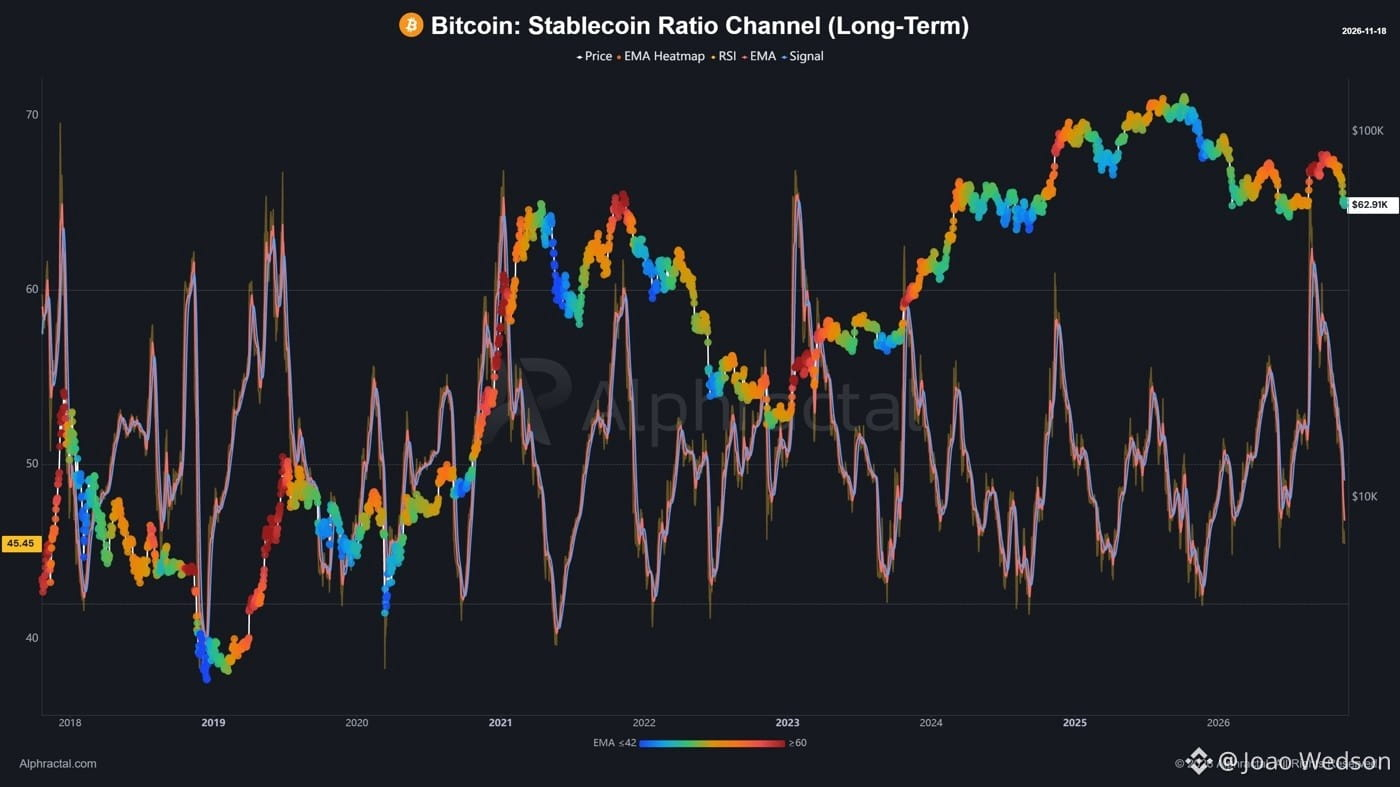
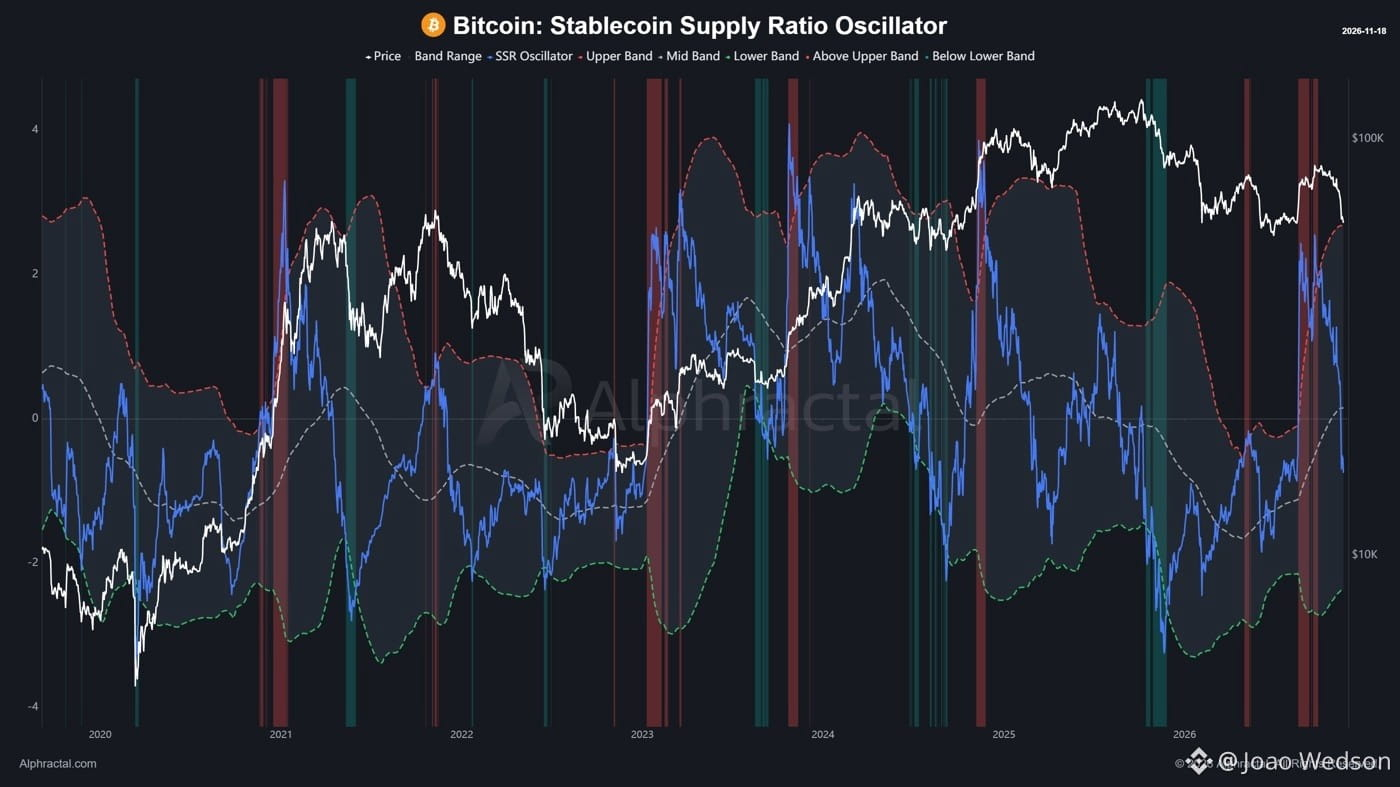
Bitcoin Liquidity: Stablecoins Are a Key Signal to Watch! The Bitcoin Stablecoin Supply Ratio Oscillator is declining, but it has yet to confirm a positive signal. A stronger shift in liquidity conditions may still take time. This metric measures Bitcoin's market capitalization relative to stablecoin supply, helping identify changes in potential buying power and liquidity conditions. Stablecoins play a crucial role in crypto market liquidity, and understanding their relative buying power is essential in the current market environment. At Alphractal, we provide advanced metrics to help you monitor liquidity, identify market shifts, and make data-driven decisions. BLACK FRIDAY STARTS EARLY! Get 70% OFF with coupon BLACK70. Explore Alphractal's extensive range of metrics and start your analysis today. 🚀alphractal.com
Bitcoin Liquidity: Stablecoins Are a Key Signal to Watch! The Bitcoin Stablecoin Supply Ratio Oscillator is declining, but it has yet to confirm a positive signal. A stronger shift in liquidity conditions may still take time. This metric measures Bitcoin's market capitalization relative to stablecoin supply, helping identify changes in potential buying power and liquidity conditions. Stablecoins play a crucial role in crypto market liquidity, and understanding their relative buying power is essential in the current market environment. At Alphractal, we provide advanced metrics to help you monitor liquidity, identify market shifts, and make data-driven decisions. BLACK FRIDAY STARTS EARLY! Get 70% OFF with coupon BLACK70. Explore Alphractal's extensive range of metrics and start your analysis today. 🚀alphractal.com
59
·
--
См. перевод
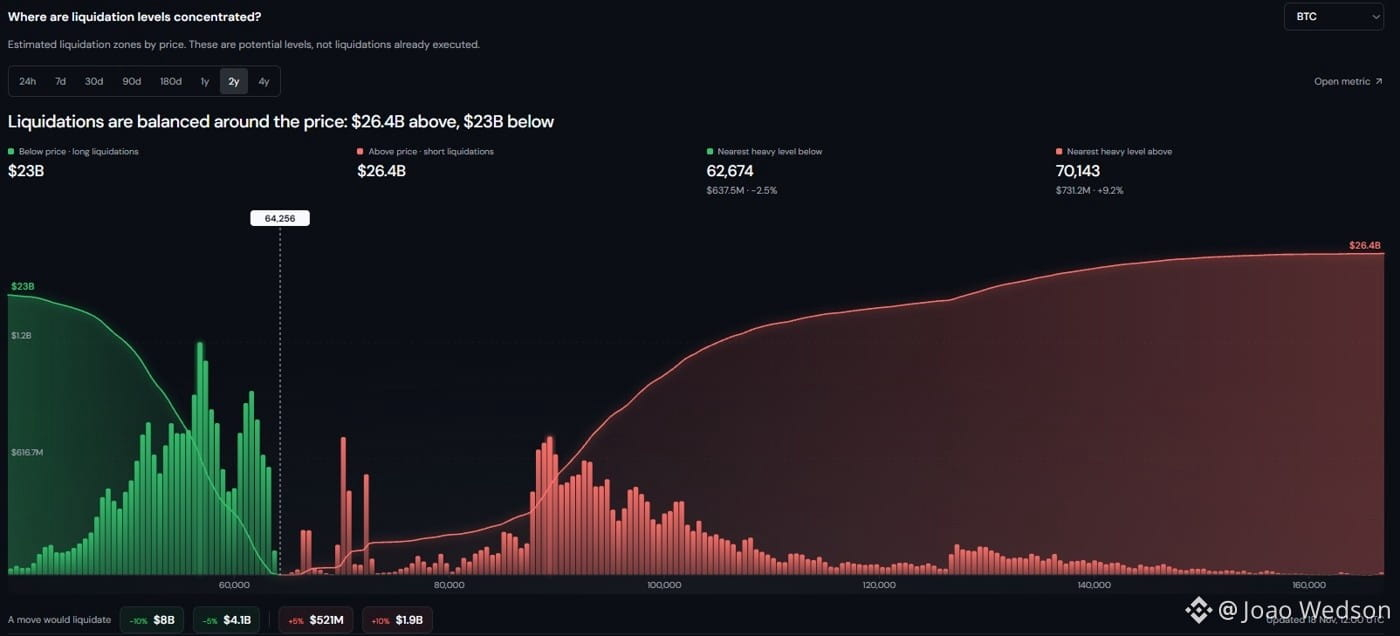
🚨 BITCOIN: WHERE ARE LEVERAGED TRADERS MOST VULNERABLE? Over the past 2 years, an estimated $49.4 billion in potential BTC liquidations have accumulated across the market. However, the real imbalance becomes clear when we analyze liquidation exposure near the current price. 📉 A 5% drop: $4.1B in potential long liquidations. 📈 A 5% rally: Just $521M in potential short liquidations. That's nearly 8x more liquidation exposure to the downside! 🔍 Key Liquidation Levels: 🟢 $62,674: Nearest major long liquidation cluster. 🟢 $57,000: The largest concentration of potential long liquidations, making it a critical downside liquidity zone. 🔴 $70,143: Nearest major short liquidation cluster. Despite relatively balanced total liquidation exposure, leveraged longs are significantly more vulnerable to a short-term decline. These are estimated liquidation levels, not guaranteed outcomes. The data speaks for itself. 🔥 ALPHRACTAL BLACK FRIDAY: 70% OFF! See what most traders can't. Explore advanced Liquidation Levels, real-time market intelligence, and over 2,000 market metrics with Alphractal. 🎟 Use code: BLACK70 🌐alphractal.com
🚨 BITCOIN: WHERE ARE LEVERAGED TRADERS MOST VULNERABLE? Over the past 2 years, an estimated $49.4 billion in potential BTC liquidations have accumulated across the market. However, the real imbalance becomes clear when we analyze liquidation exposure near the current price. 📉 A 5% drop: $4.1B in potential long liquidations. 📈 A 5% rally: Just $521M in potential short liquidations. That's nearly 8x more liquidation exposure to the downside! 🔍 Key Liquidation Levels: 🟢 $62,674: Nearest major long liquidation cluster. 🟢 $57,000: The largest concentration of potential long liquidations, making it a critical downside liquidity zone. 🔴 $70,143: Nearest major short liquidation cluster. Despite relatively balanced total liquidation exposure, leveraged longs are significantly more vulnerable to a short-term decline. These are estimated liquidation levels, not guaranteed outcomes. The data speaks for itself. 🔥 ALPHRACTAL BLACK FRIDAY: 70% OFF! See what most traders can't. Explore advanced Liquidation Levels, real-time market intelligence, and over 2,000 market metrics with Alphractal. 🎟 Use code: BLACK70 🌐alphractal.com
66
·
--
См. перевод
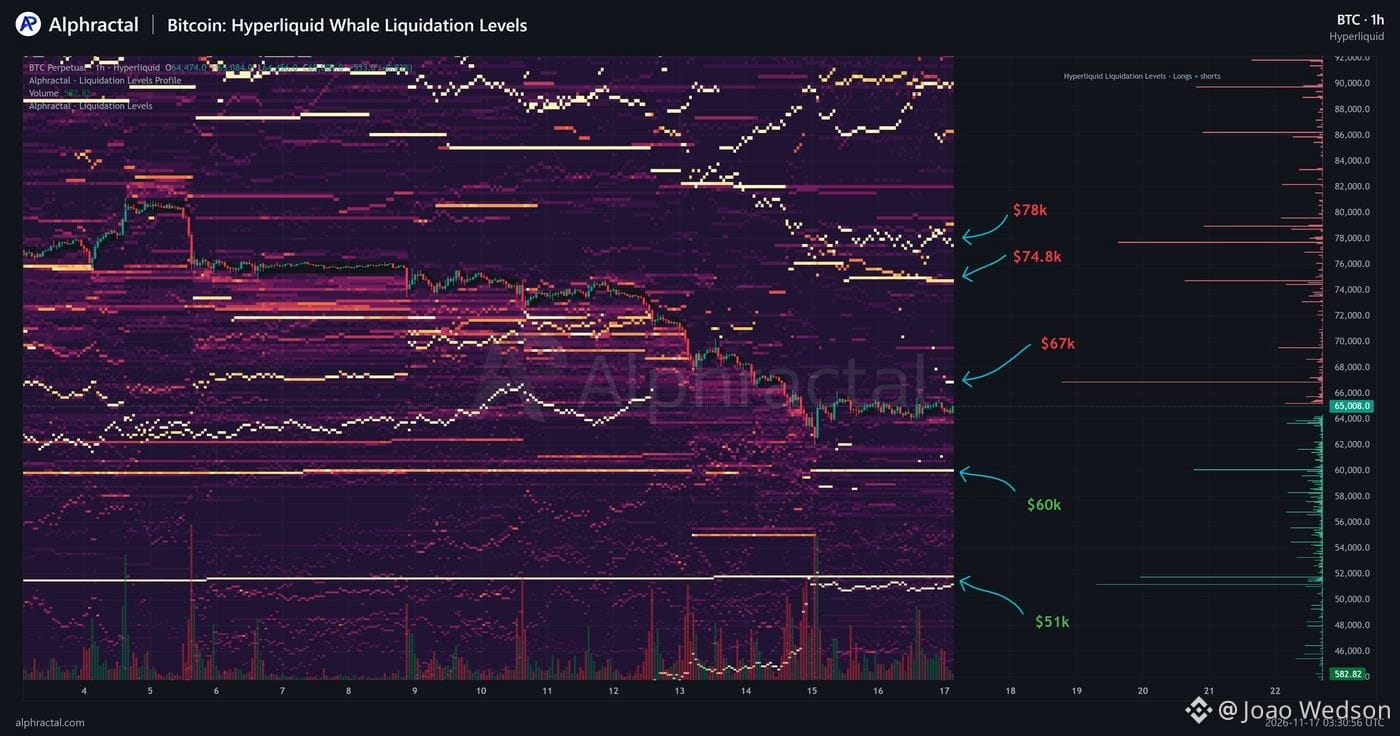
Bitcoin: Where Will Hyperliquid Whales Get Liquidated? 🔴 SHORTS: $67K | $74.8K | $78K 🟢 LONGS: $60K | $51K The key liquidation zones are right on the map. Now, play your cards. This is the level of detail Alphractal Next-Gen will put at your fingertips. I can't wait to share everything we've been building! Data > Narratives. Don't miss our biggest Black Friday deal yet! Check out the post below and use code BLACK70 for 70% OFF.
Bitcoin: Where Will Hyperliquid Whales Get Liquidated? 🔴 SHORTS: $67K | $74.8K | $78K 🟢 LONGS: $60K | $51K The key liquidation zones are right on the map. Now, play your cards. This is the level of detail Alphractal Next-Gen will put at your fingertips. I can't wait to share everything we've been building! Data > Narratives. Don't miss our biggest Black Friday deal yet! Check out the post below and use code BLACK70 for 70% OFF.
5
·
--
См. перевод
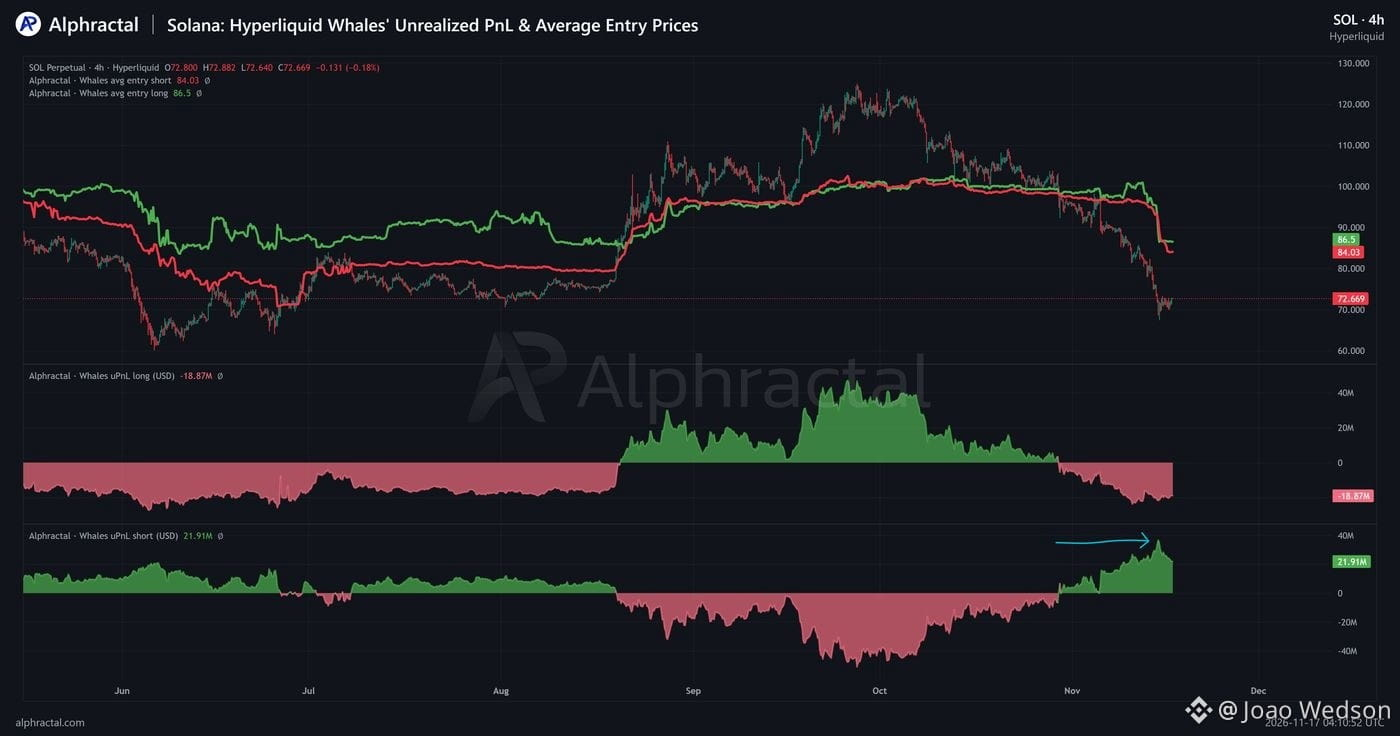
Solana: Hyperliquid Whales Hit Record Short Profits in 2026! SOL whales on Hyperliquid recently reached their highest unrealized profits from Short positions this year. 🟢 SHORTS - Average Entry Price: $84.03 - Unrealized PnL: +$21.91M 🔴 LONGS - Average Entry Price: $86.50 - Unrealized PnL: -$18.87M With SOL trading around $72.67, Short whales are sitting on massive profits. Meanwhile, other whales are betting against the trend, holding significant unrealized losses on their Long positions. Same market. Opposite bets. Very different outcomes. All tracked by Alphractal. Data > Narratives.
Solana: Hyperliquid Whales Hit Record Short Profits in 2026! SOL whales on Hyperliquid recently reached their highest unrealized profits from Short positions this year. 🟢 SHORTS - Average Entry Price: $84.03 - Unrealized PnL: +$21.91M 🔴 LONGS - Average Entry Price: $86.50 - Unrealized PnL: -$18.87M With SOL trading around $72.67, Short whales are sitting on massive profits. Meanwhile, other whales are betting against the trend, holding significant unrealized losses on their Long positions. Same market. Opposite bets. Very different outcomes. All tracked by Alphractal. Data > Narratives.
3
·
--
Solana: киты Hyperliquid получили рекордную прибыль на шортах в 2026 году!
Недавно нереализованная прибыль китов SOL на Hyperliquid по коротким позициям достигла максимума в этом году.
🟢 ШОРТЫ
- Средняя цена входа: $84.03
- Нереализованный PnL: +$21.91M
🔴 ЛОНГИ
- Средняя цена входа: $86.50
- Нереализованный PnL: -$18.87M
При цене SOL около $72.67 киты, открывшие шорты, фиксируют огромную прибыль.
Тем временем другие киты ставят против тренда и несут значительные нереализованные убытки по длинным позициям.
Один рынок. Противоположные ставки. Совершенно разные результаты.
Все данные отслеживает Alphractal.
Данные > нарративы.
Solana: киты Hyperliquid получили рекордную прибыль на шортах в 2026 году!
Недавно нереализованная прибыль китов SOL на Hyperliquid по коротким позициям достигла максимума в этом году.
🟢 ШОРТЫ
- Средняя цена входа: $84.03
- Нереализованный PnL: +$21.91M
🔴 ЛОНГИ
- Средняя цена входа: $86.50
- Нереализованный PnL: -$18.87M
При цене SOL около $72.67 киты, открывшие шорты, фиксируют огромную прибыль.
Тем временем другие киты ставят против тренда и несут значительные нереализованные убытки по длинным позициям.
Один рынок. Противоположные ставки. Совершенно разные результаты.
Все данные отслеживает Alphractal.
Данные > нарративы.
Недавно нереализованная прибыль китов SOL на Hyperliquid по коротким позициям достигла максимума в этом году.
🟢 ШОРТЫ
- Средняя цена входа: $84.03
- Нереализованный PnL: +$21.91M
🔴 ЛОНГИ
- Средняя цена входа: $86.50
- Нереализованный PnL: -$18.87M
При цене SOL около $72.67 киты, открывшие шорты, фиксируют огромную прибыль.
Тем временем другие киты ставят против тренда и несут значительные нереализованные убытки по длинным позициям.
Один рынок. Противоположные ставки. Совершенно разные результаты.
Все данные отслеживает Alphractal.
Данные > нарративы.
4
·
--
См. перевод
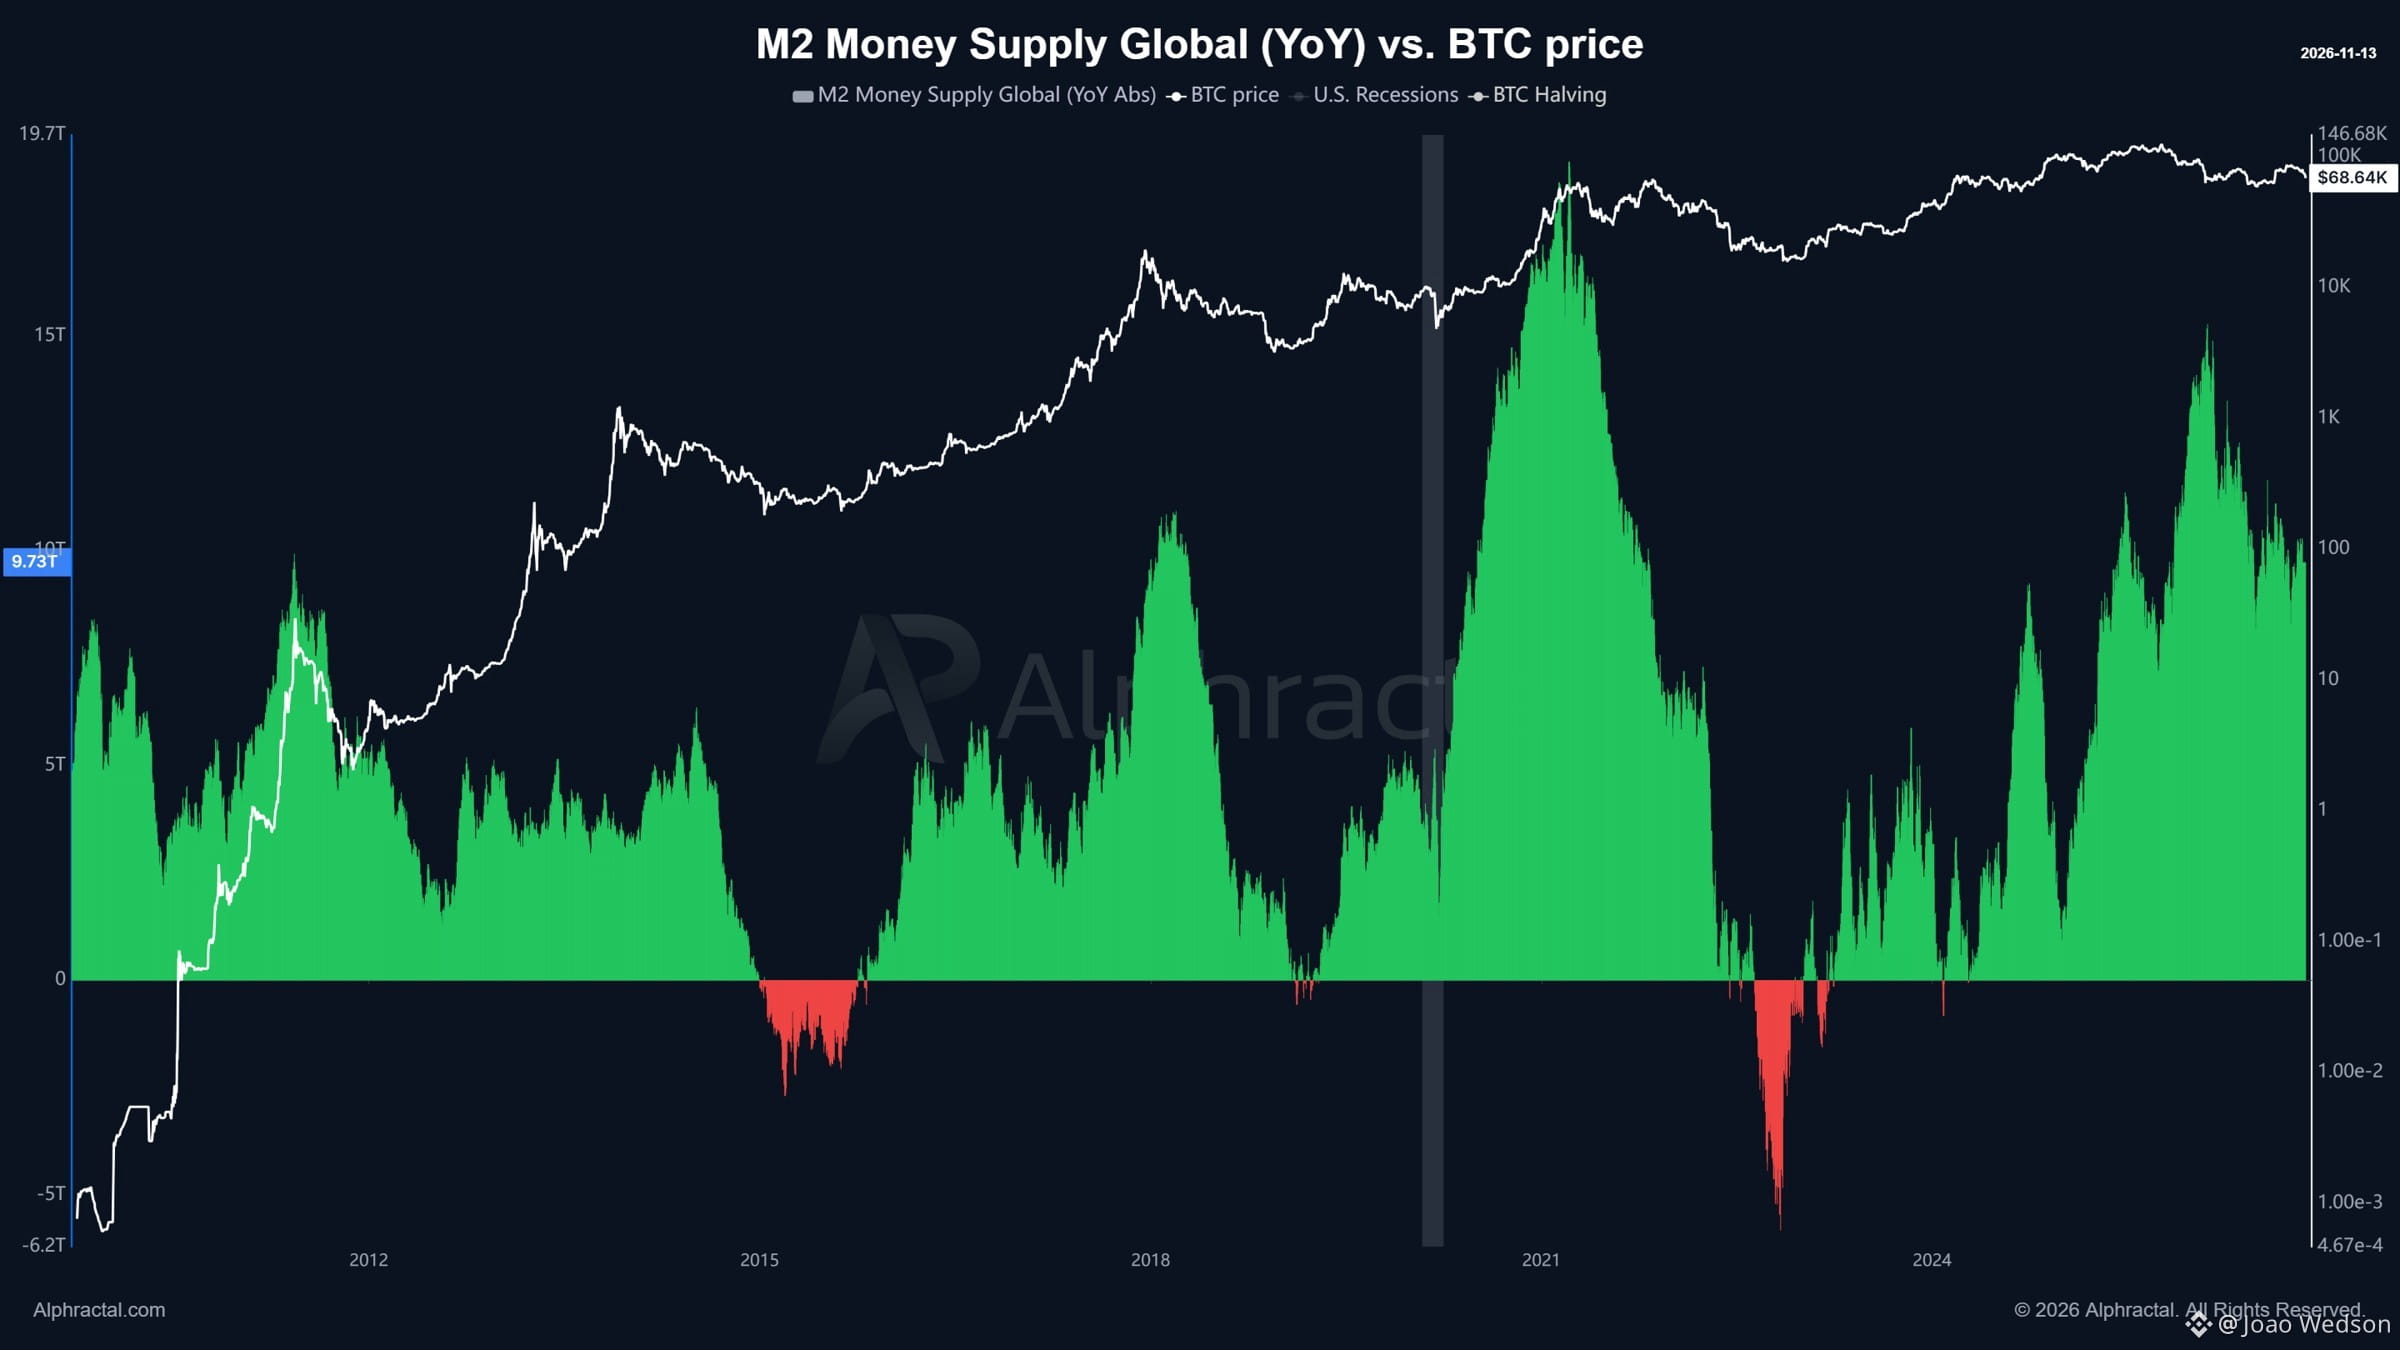
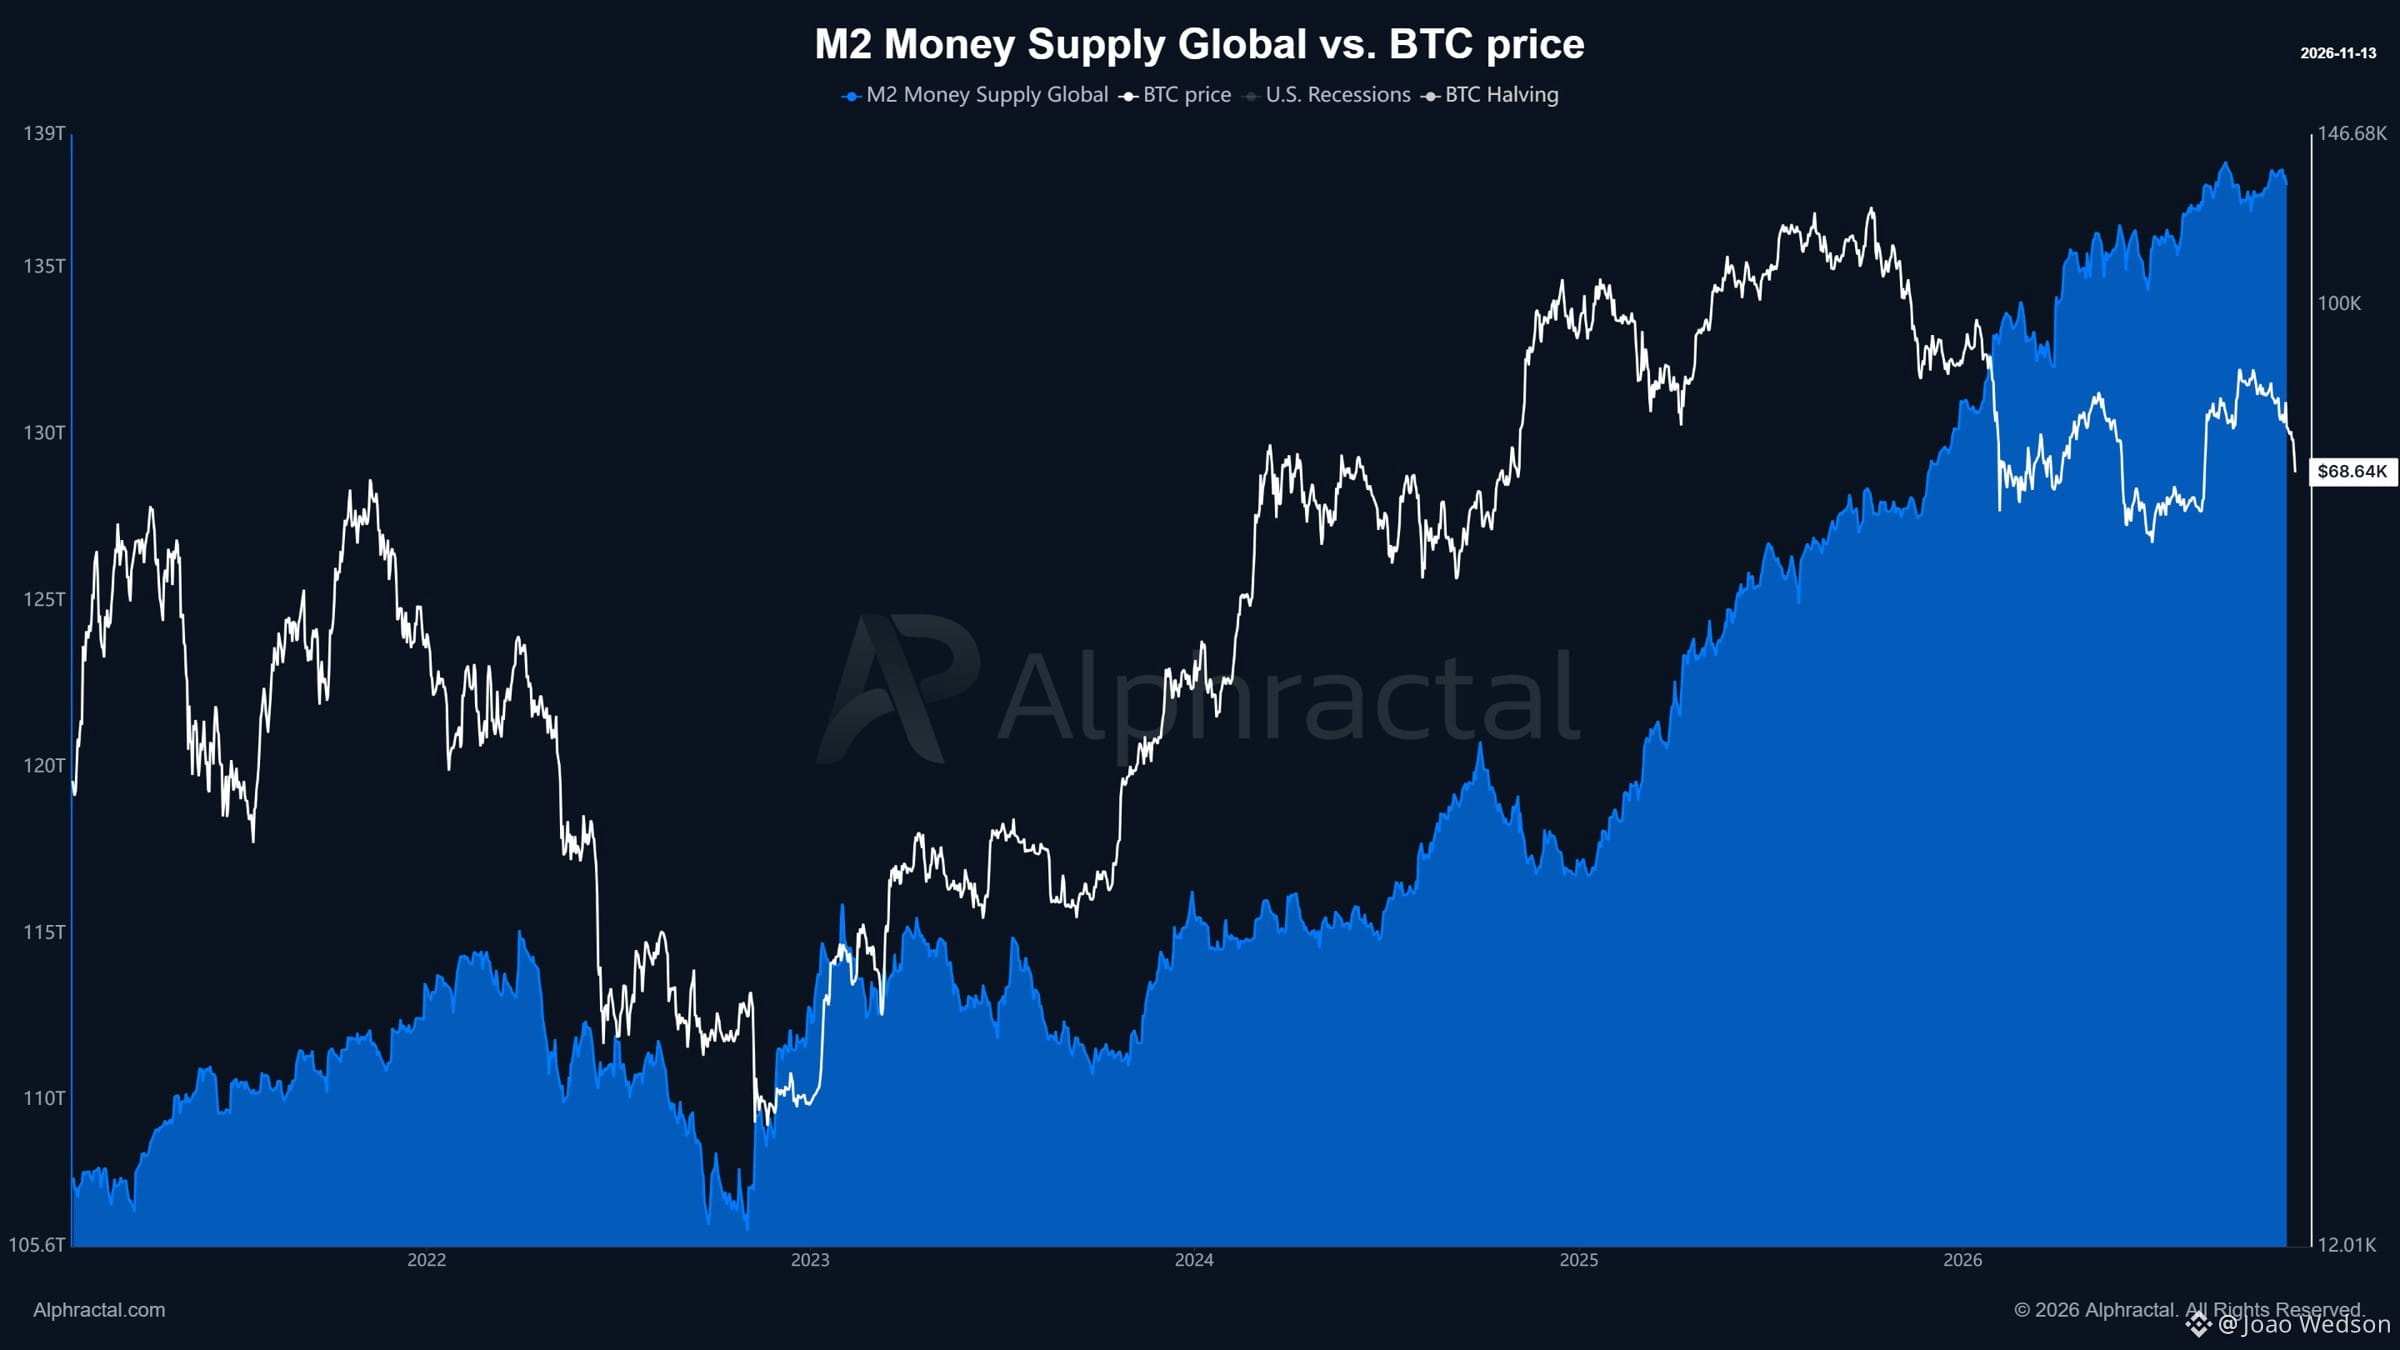
🚨 GLOBAL M2 HAS STOPPED RISING! After a strong expansion through 2025 and early 2026, Global M2 Money Supply is now moving sideways near its highs, around $138T. The bigger signal is in the yearly change: Global M2 YoY has been falling since February 2026 and is now at $9.73T. Historically, every time the YoY variation turned negative, it lined up with major Bitcoin bottoms: 🔴 2015 🔴 2018 🔴 2022 The variation is still positive, so this is not a bottom signal yet. But liquidity is losing momentum, and that has historically been a headwind for BTC. Source: Alphractal
🚨 GLOBAL M2 HAS STOPPED RISING! After a strong expansion through 2025 and early 2026, Global M2 Money Supply is now moving sideways near its highs, around $138T. The bigger signal is in the yearly change: Global M2 YoY has been falling since February 2026 and is now at $9.73T. Historically, every time the YoY variation turned negative, it lined up with major Bitcoin bottoms: 🔴 2015 🔴 2018 🔴 2022 The variation is still positive, so this is not a bottom signal yet. But liquidity is losing momentum, and that has historically been a headwind for BTC. Source: Alphractal
33
·
--
См. перевод
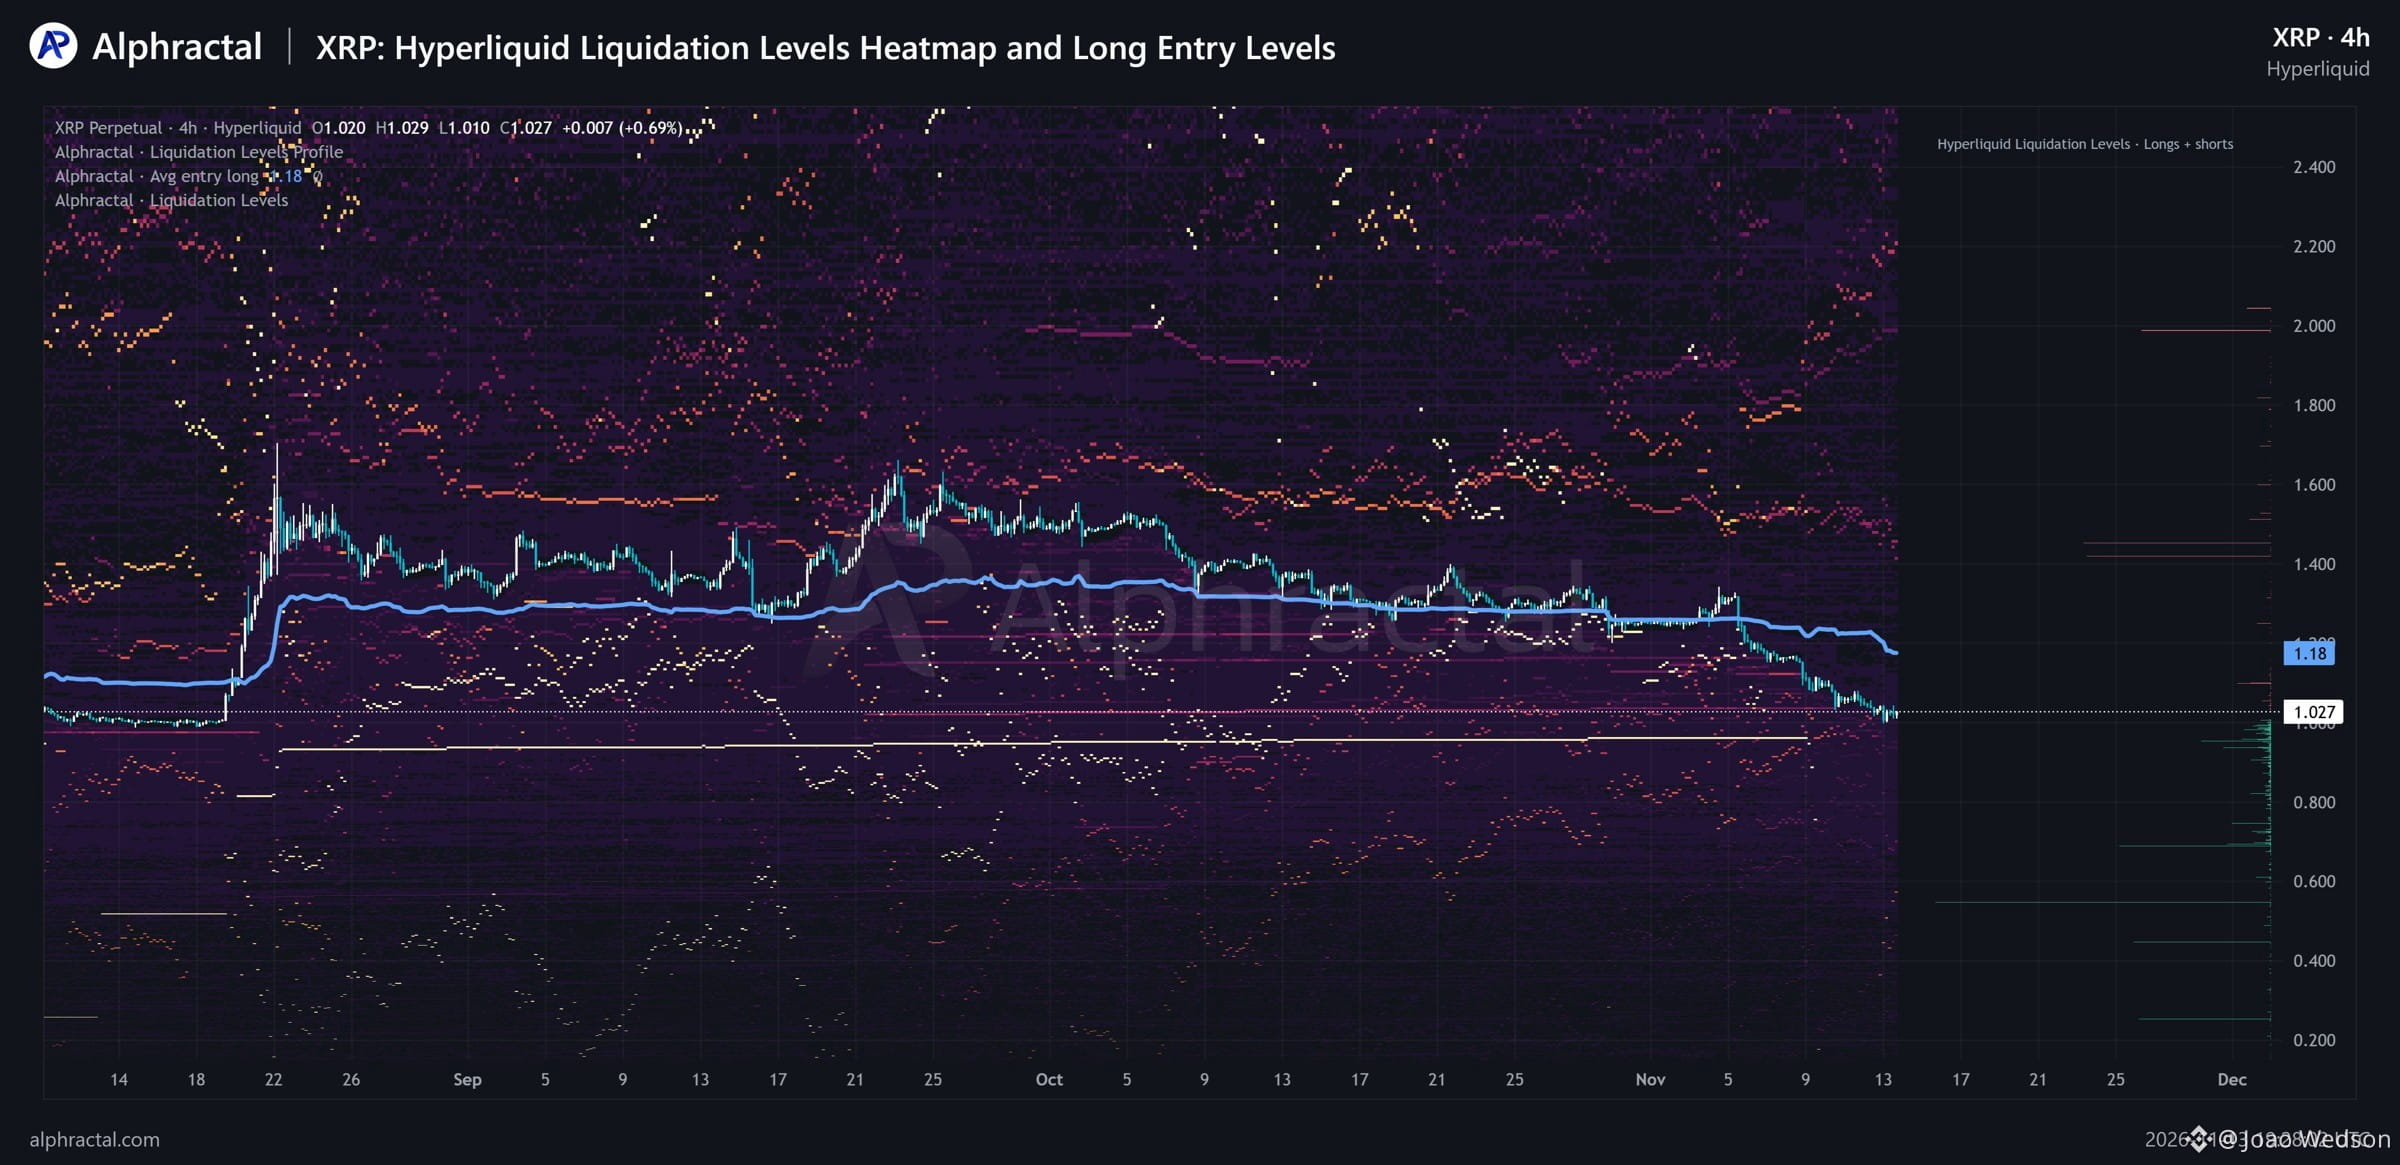
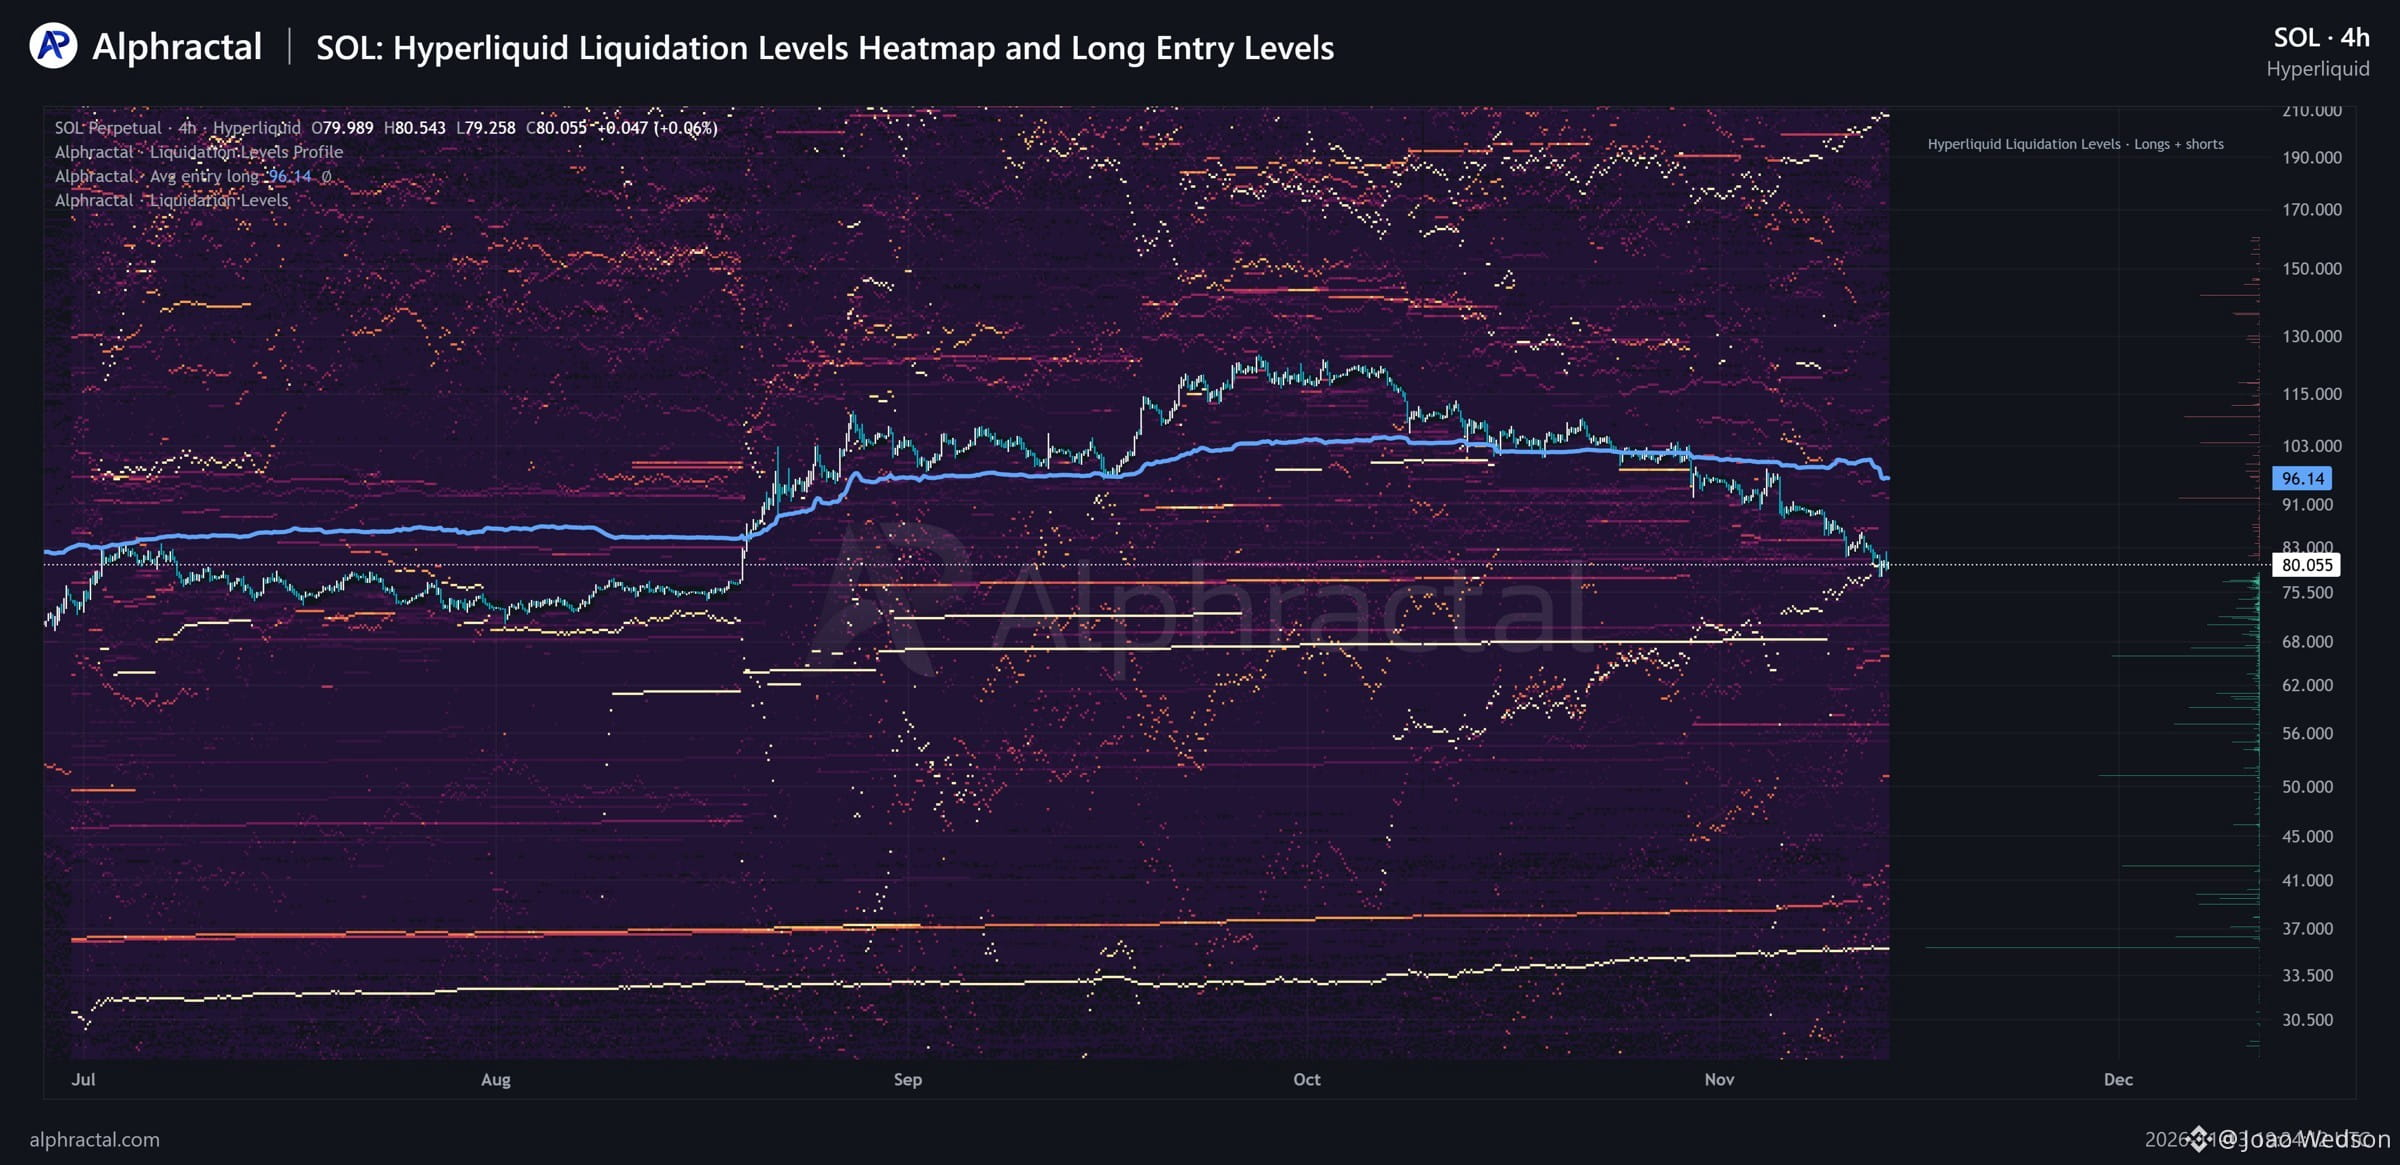
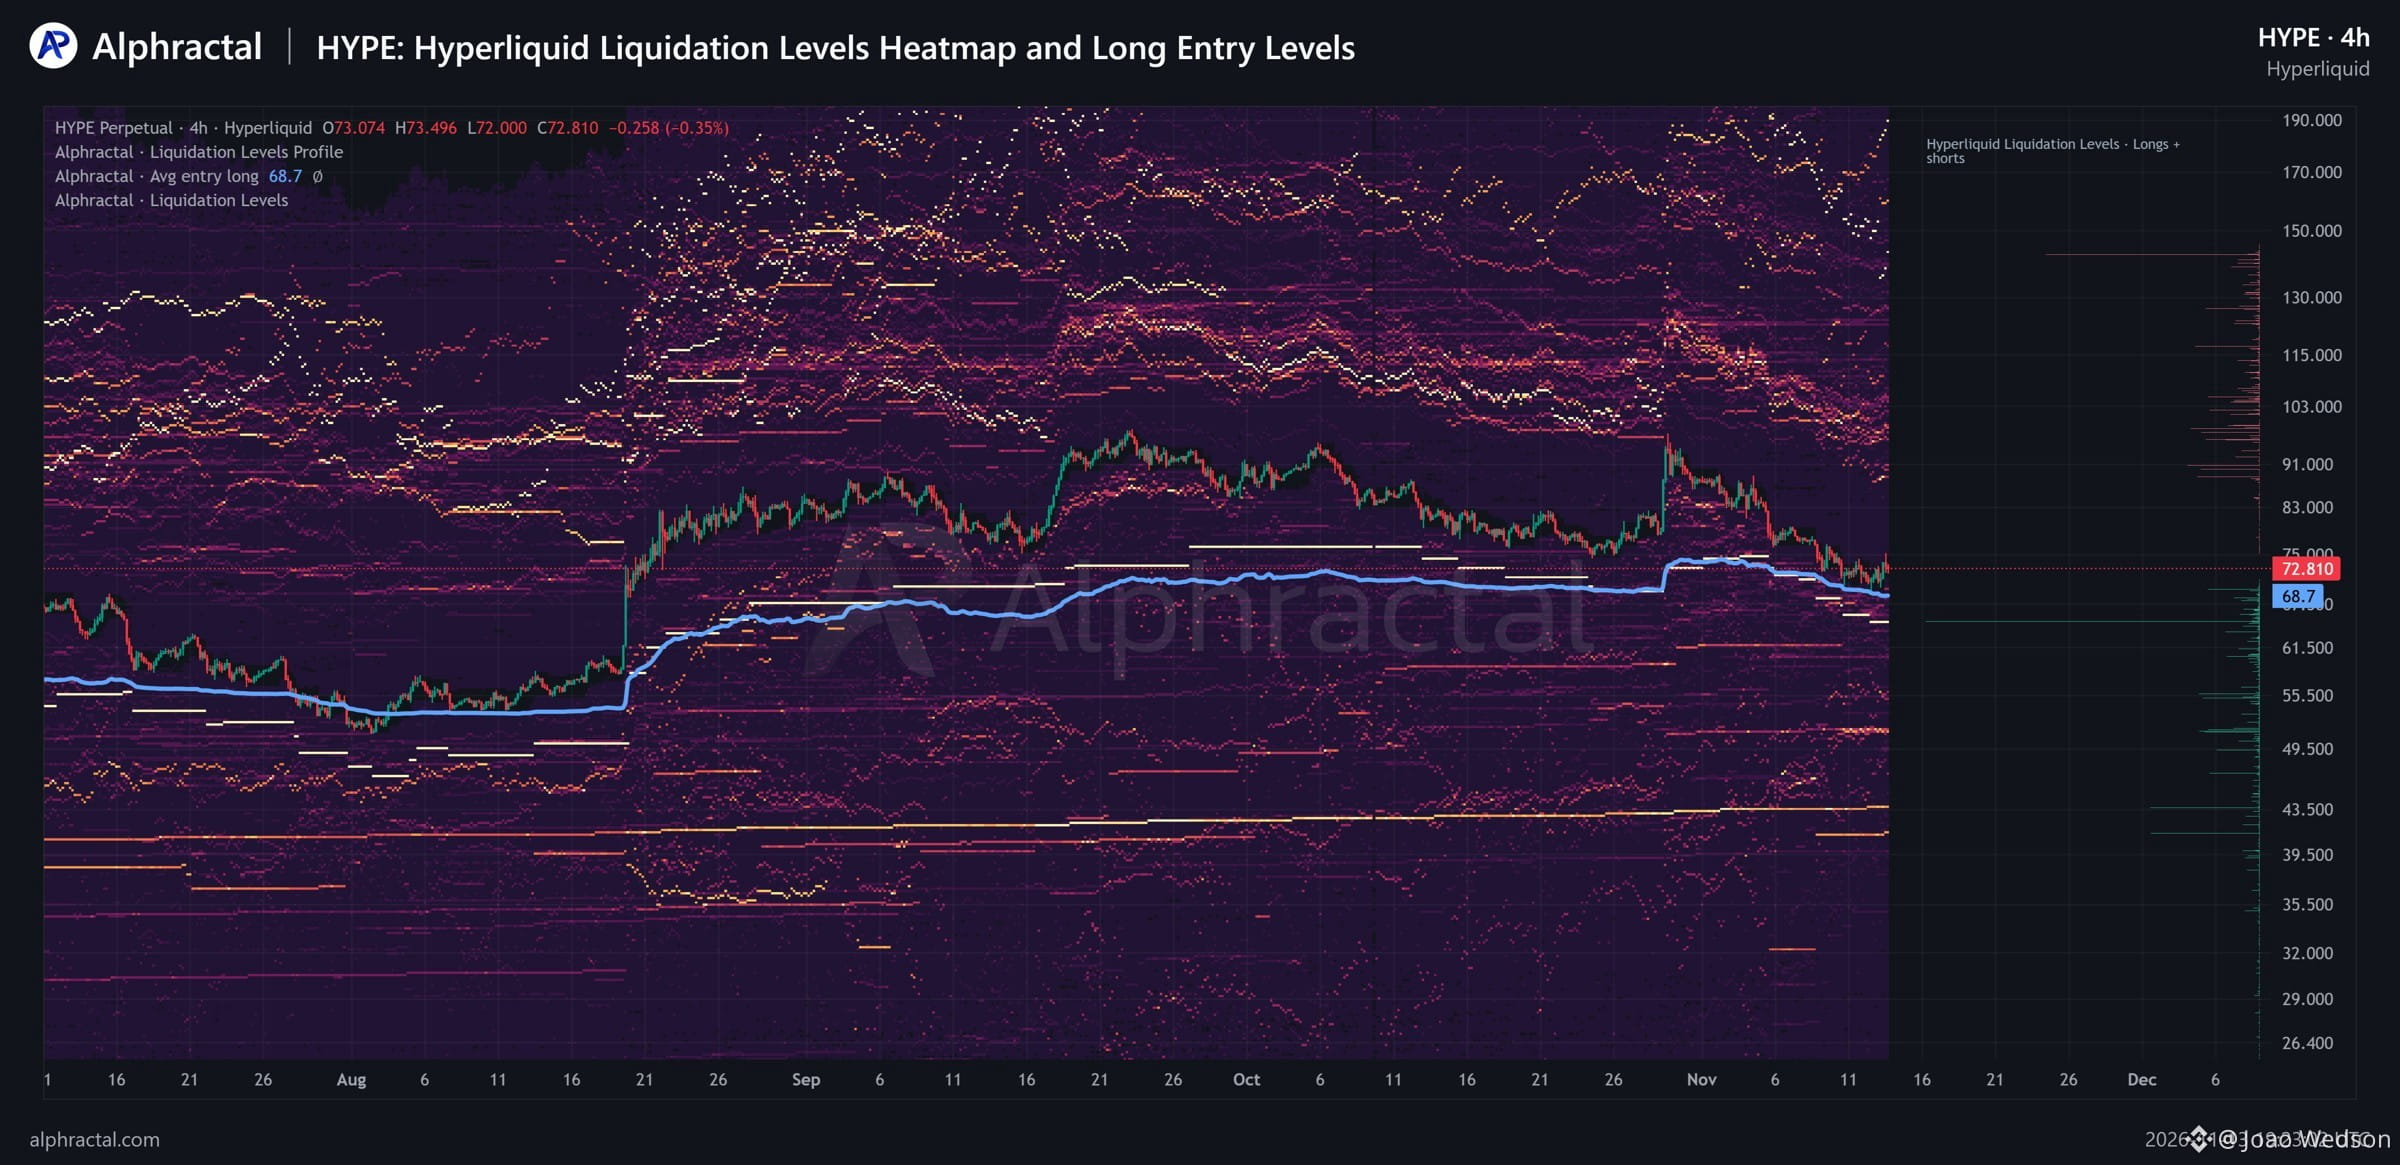
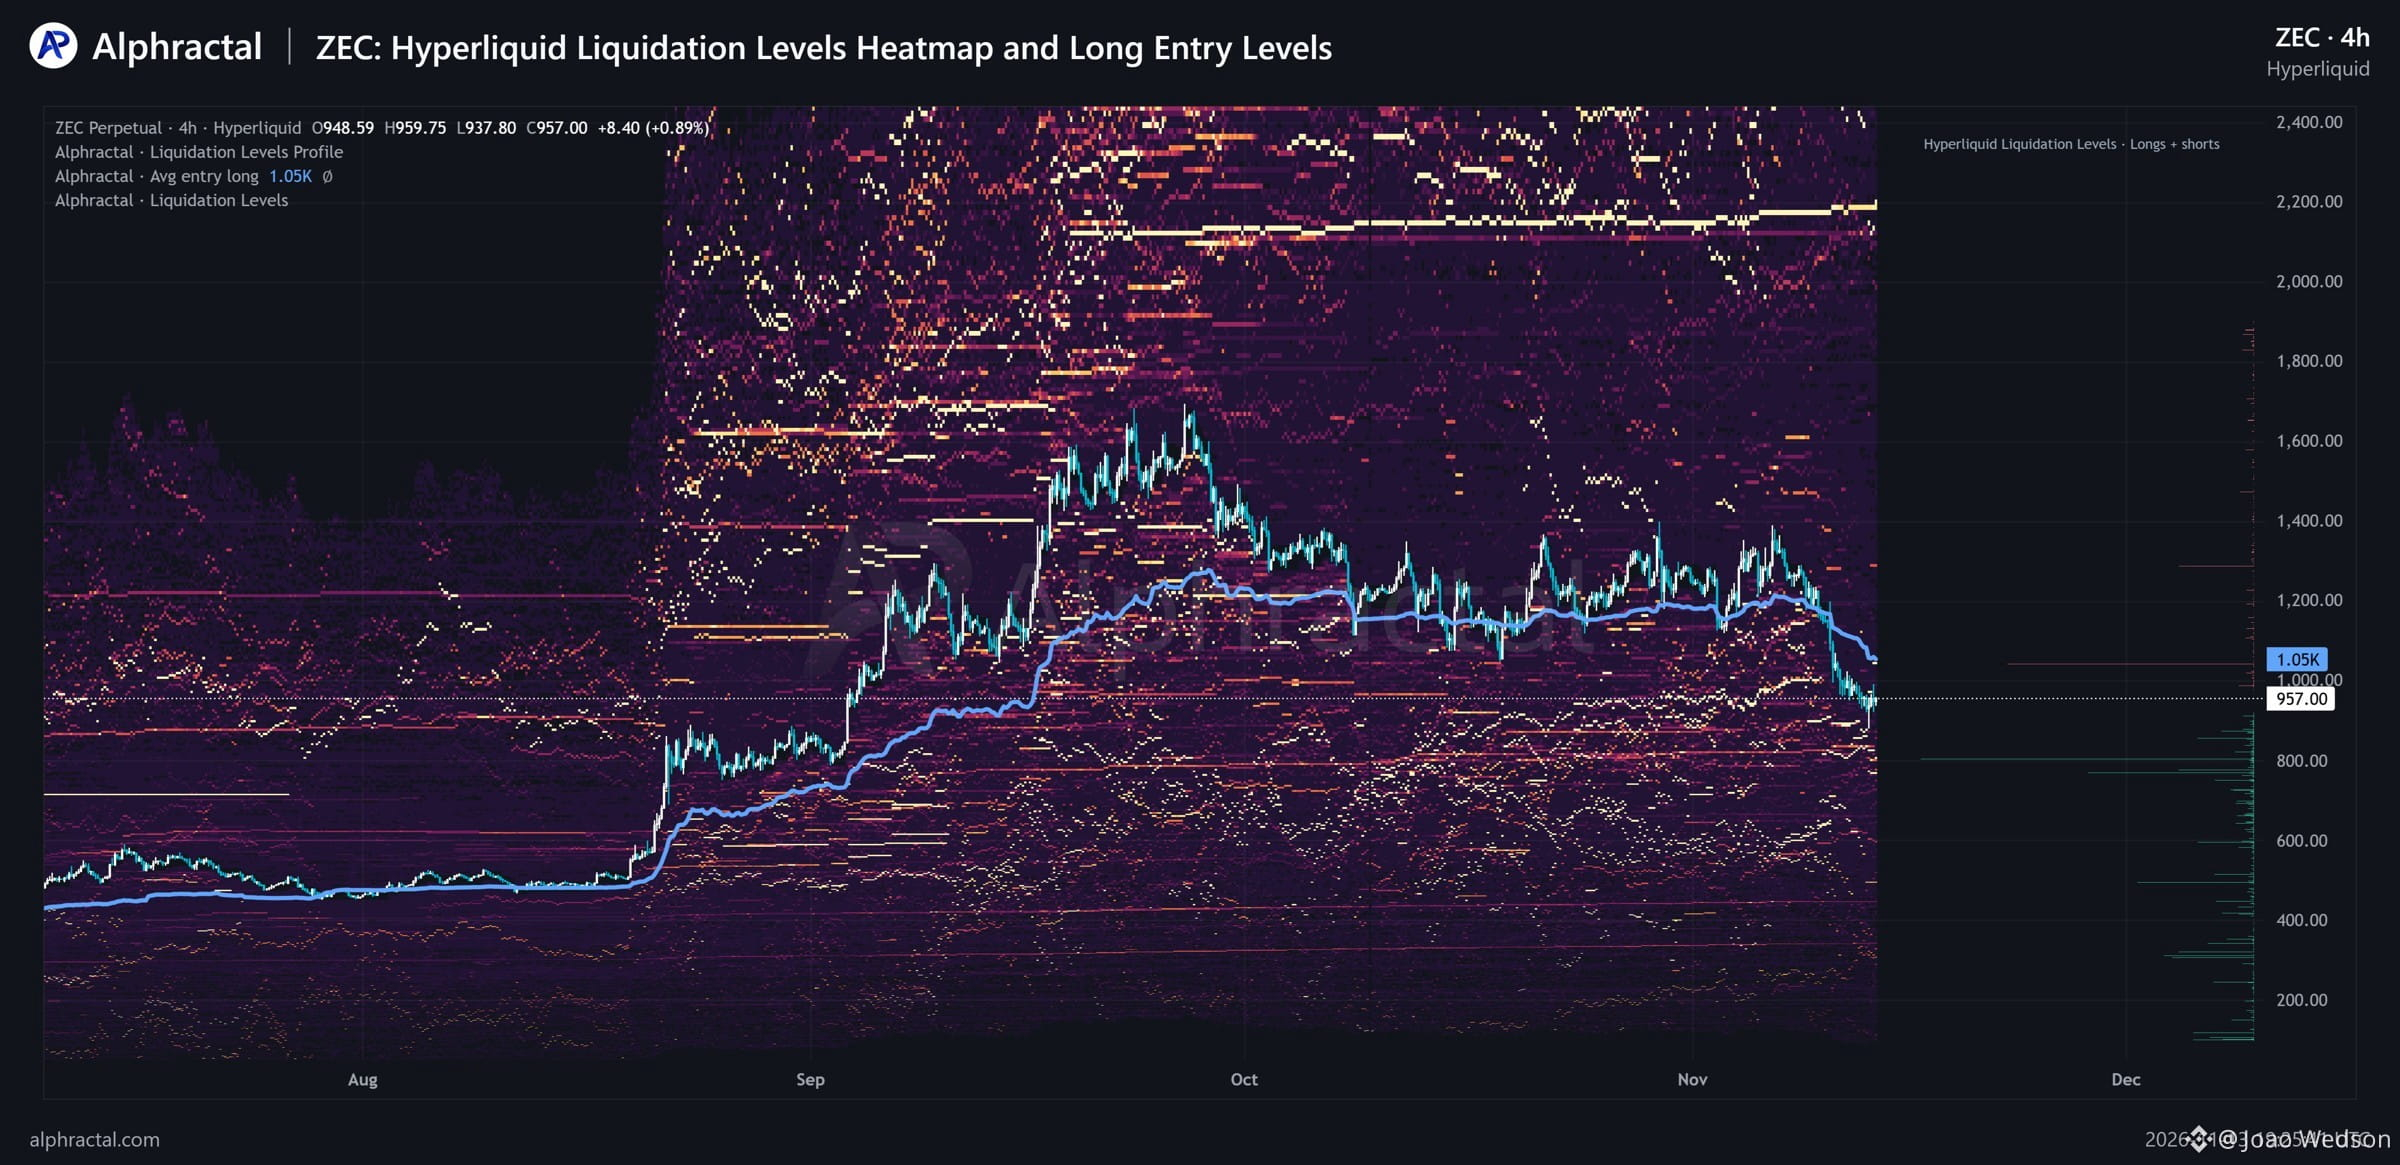
🚨 LONGS DOMINATE ACROSS 12 CRYPTO ASSETS ON HYPERLIQUID! (3/3) - $XRP: $1.18 (14.90% above) - $ZEC: $1,050 (9.72% above) - $SOL: $96.14 (20.09% above) - $HYPE: $68.70 (5.64% below) Currently, 10 out of these 12 assets are trading below their Average Long Entry Prices! Only HYPE and LIT remain above theirs. This suggests that Long positioning remains heavily exposed to downside pressure, despite the market already experiencing significant declines. And here's where things get even more interesting. Our Hyperliquid Liquidation Levels Heatmaps reveal where Long and Short liquidations are concentrated, allowing us to identify potential liquidity zones and understand how leveraged positioning may influence future price movements. These are real exchange-level data, not hypothetical liquidation estimates. The next generation of market analysis is coming to Alphractal. Explore more: Alphractal.com
🚨 LONGS DOMINATE ACROSS 12 CRYPTO ASSETS ON HYPERLIQUID! (3/3) - $XRP: $1.18 (14.90% above) - $ZEC: $1,050 (9.72% above) - $SOL: $96.14 (20.09% above) - $HYPE: $68.70 (5.64% below) Currently, 10 out of these 12 assets are trading below their Average Long Entry Prices! Only HYPE and LIT remain above theirs. This suggests that Long positioning remains heavily exposed to downside pressure, despite the market already experiencing significant declines. And here's where things get even more interesting. Our Hyperliquid Liquidation Levels Heatmaps reveal where Long and Short liquidations are concentrated, allowing us to identify potential liquidity zones and understand how leveraged positioning may influence future price movements. These are real exchange-level data, not hypothetical liquidation estimates. The next generation of market analysis is coming to Alphractal. Explore more: Alphractal.com
39
·
--
См. перевод
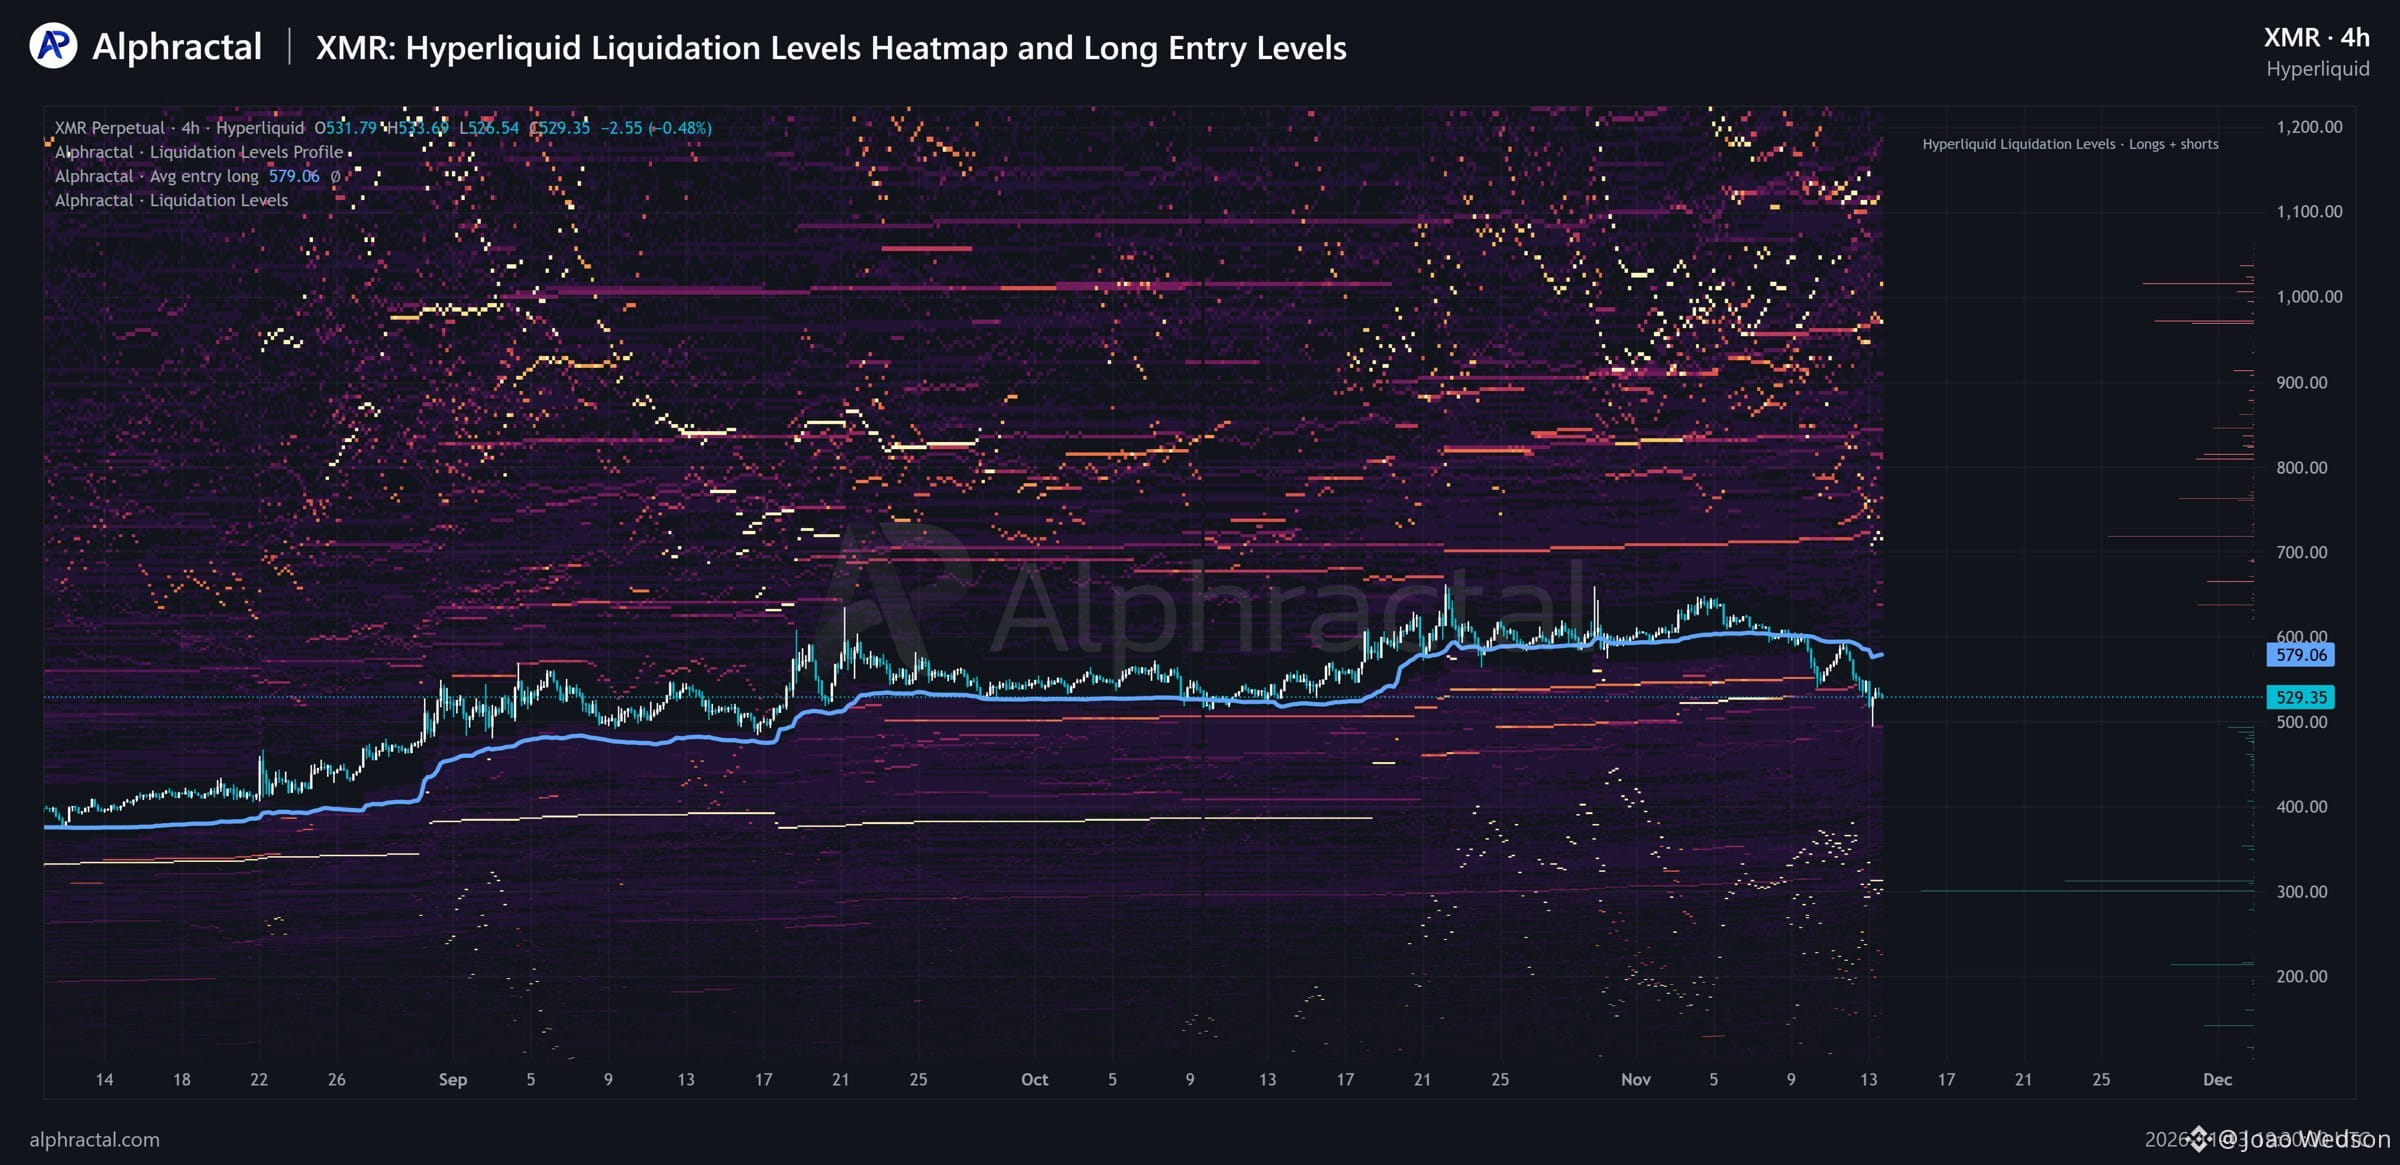
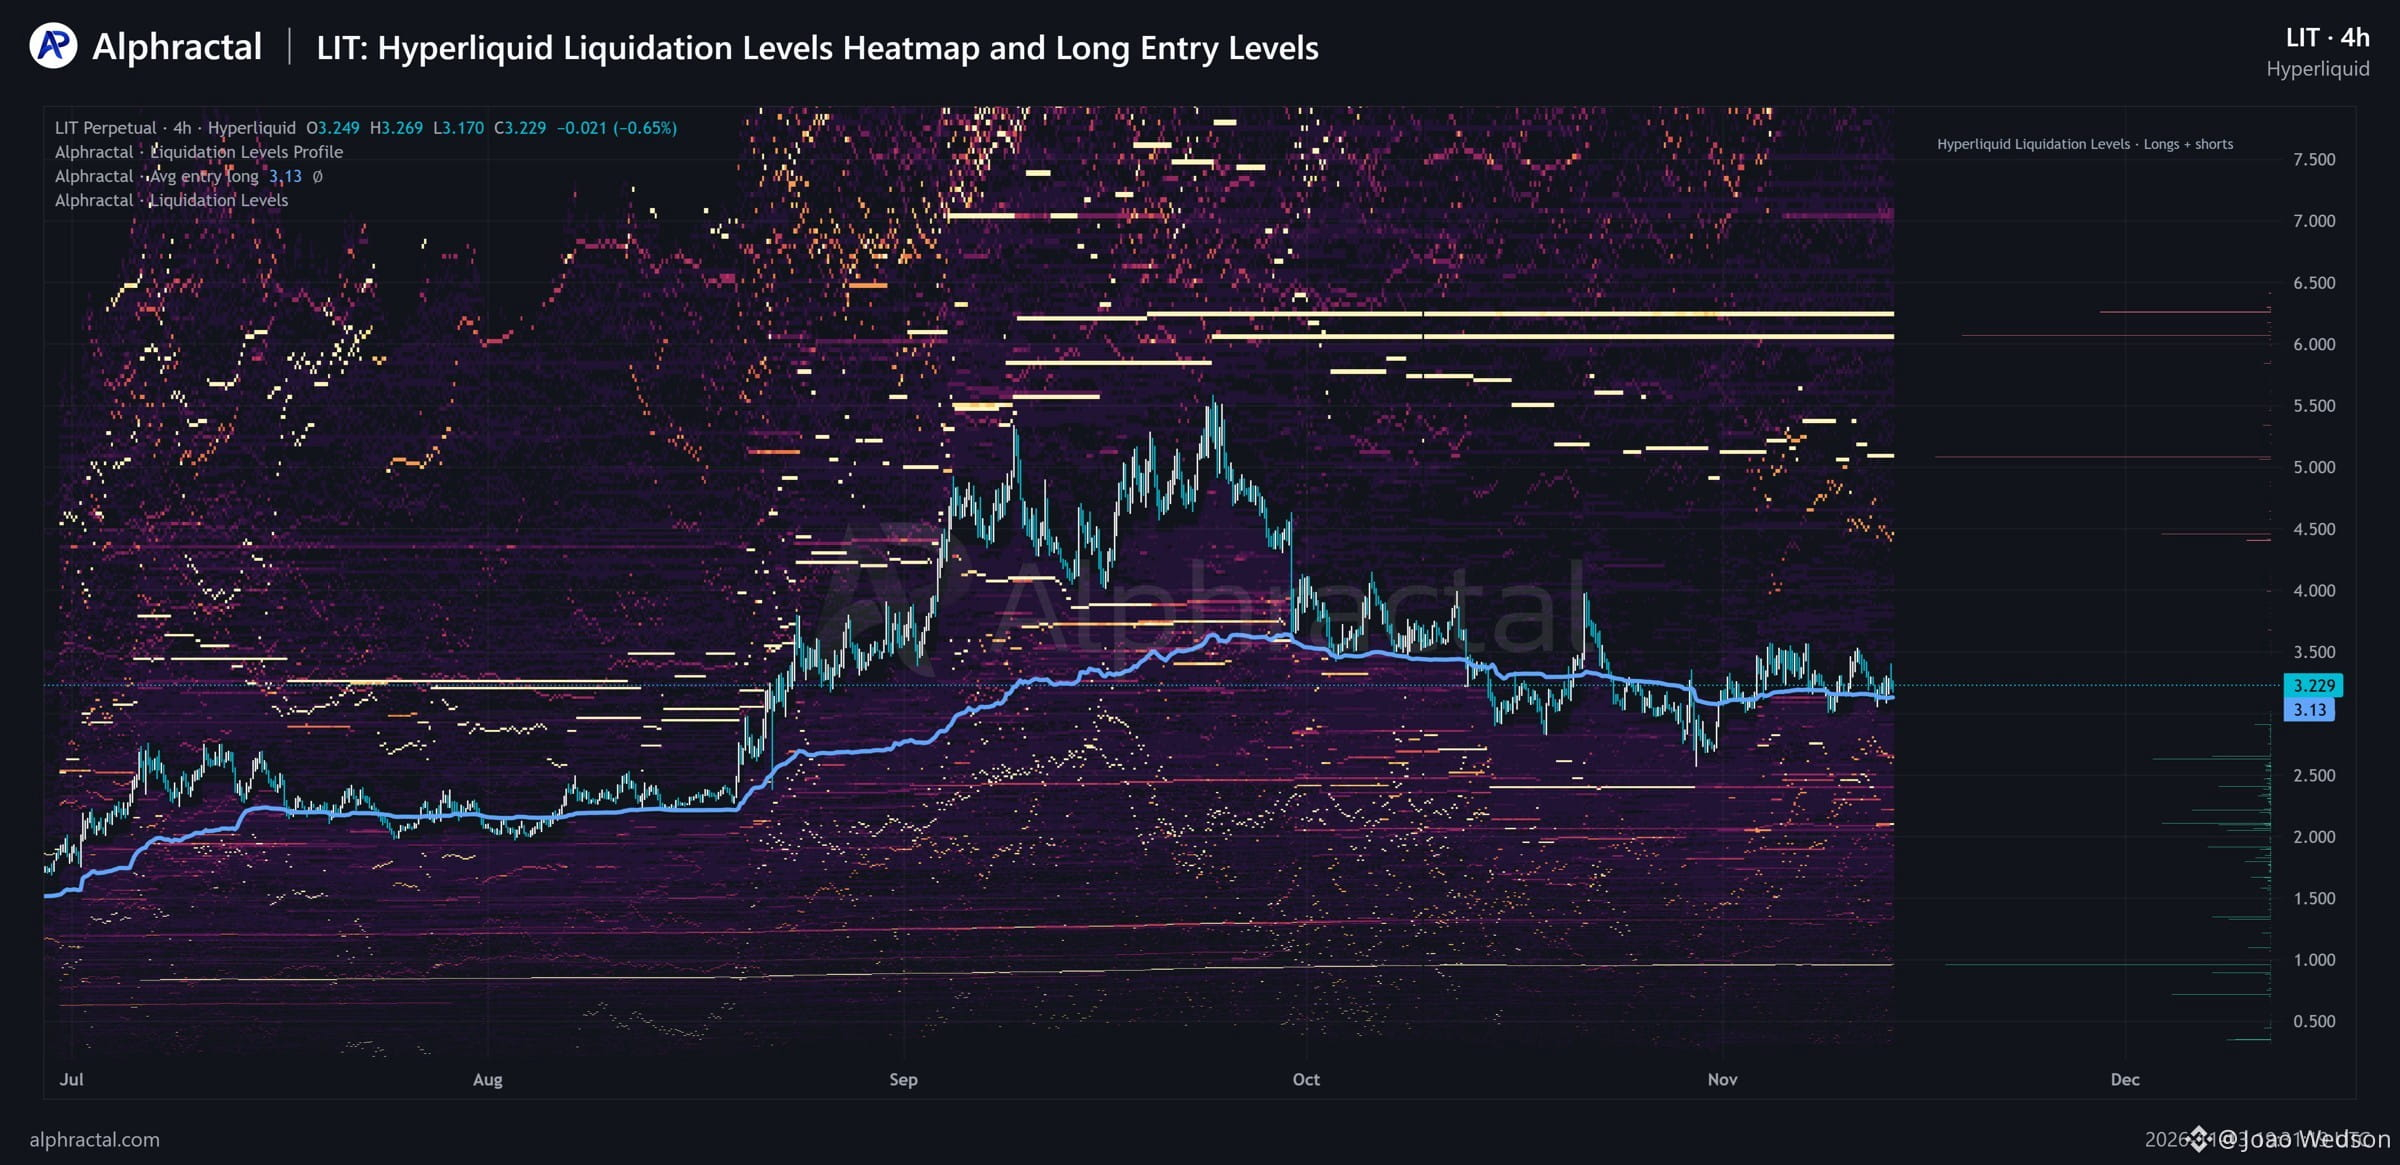
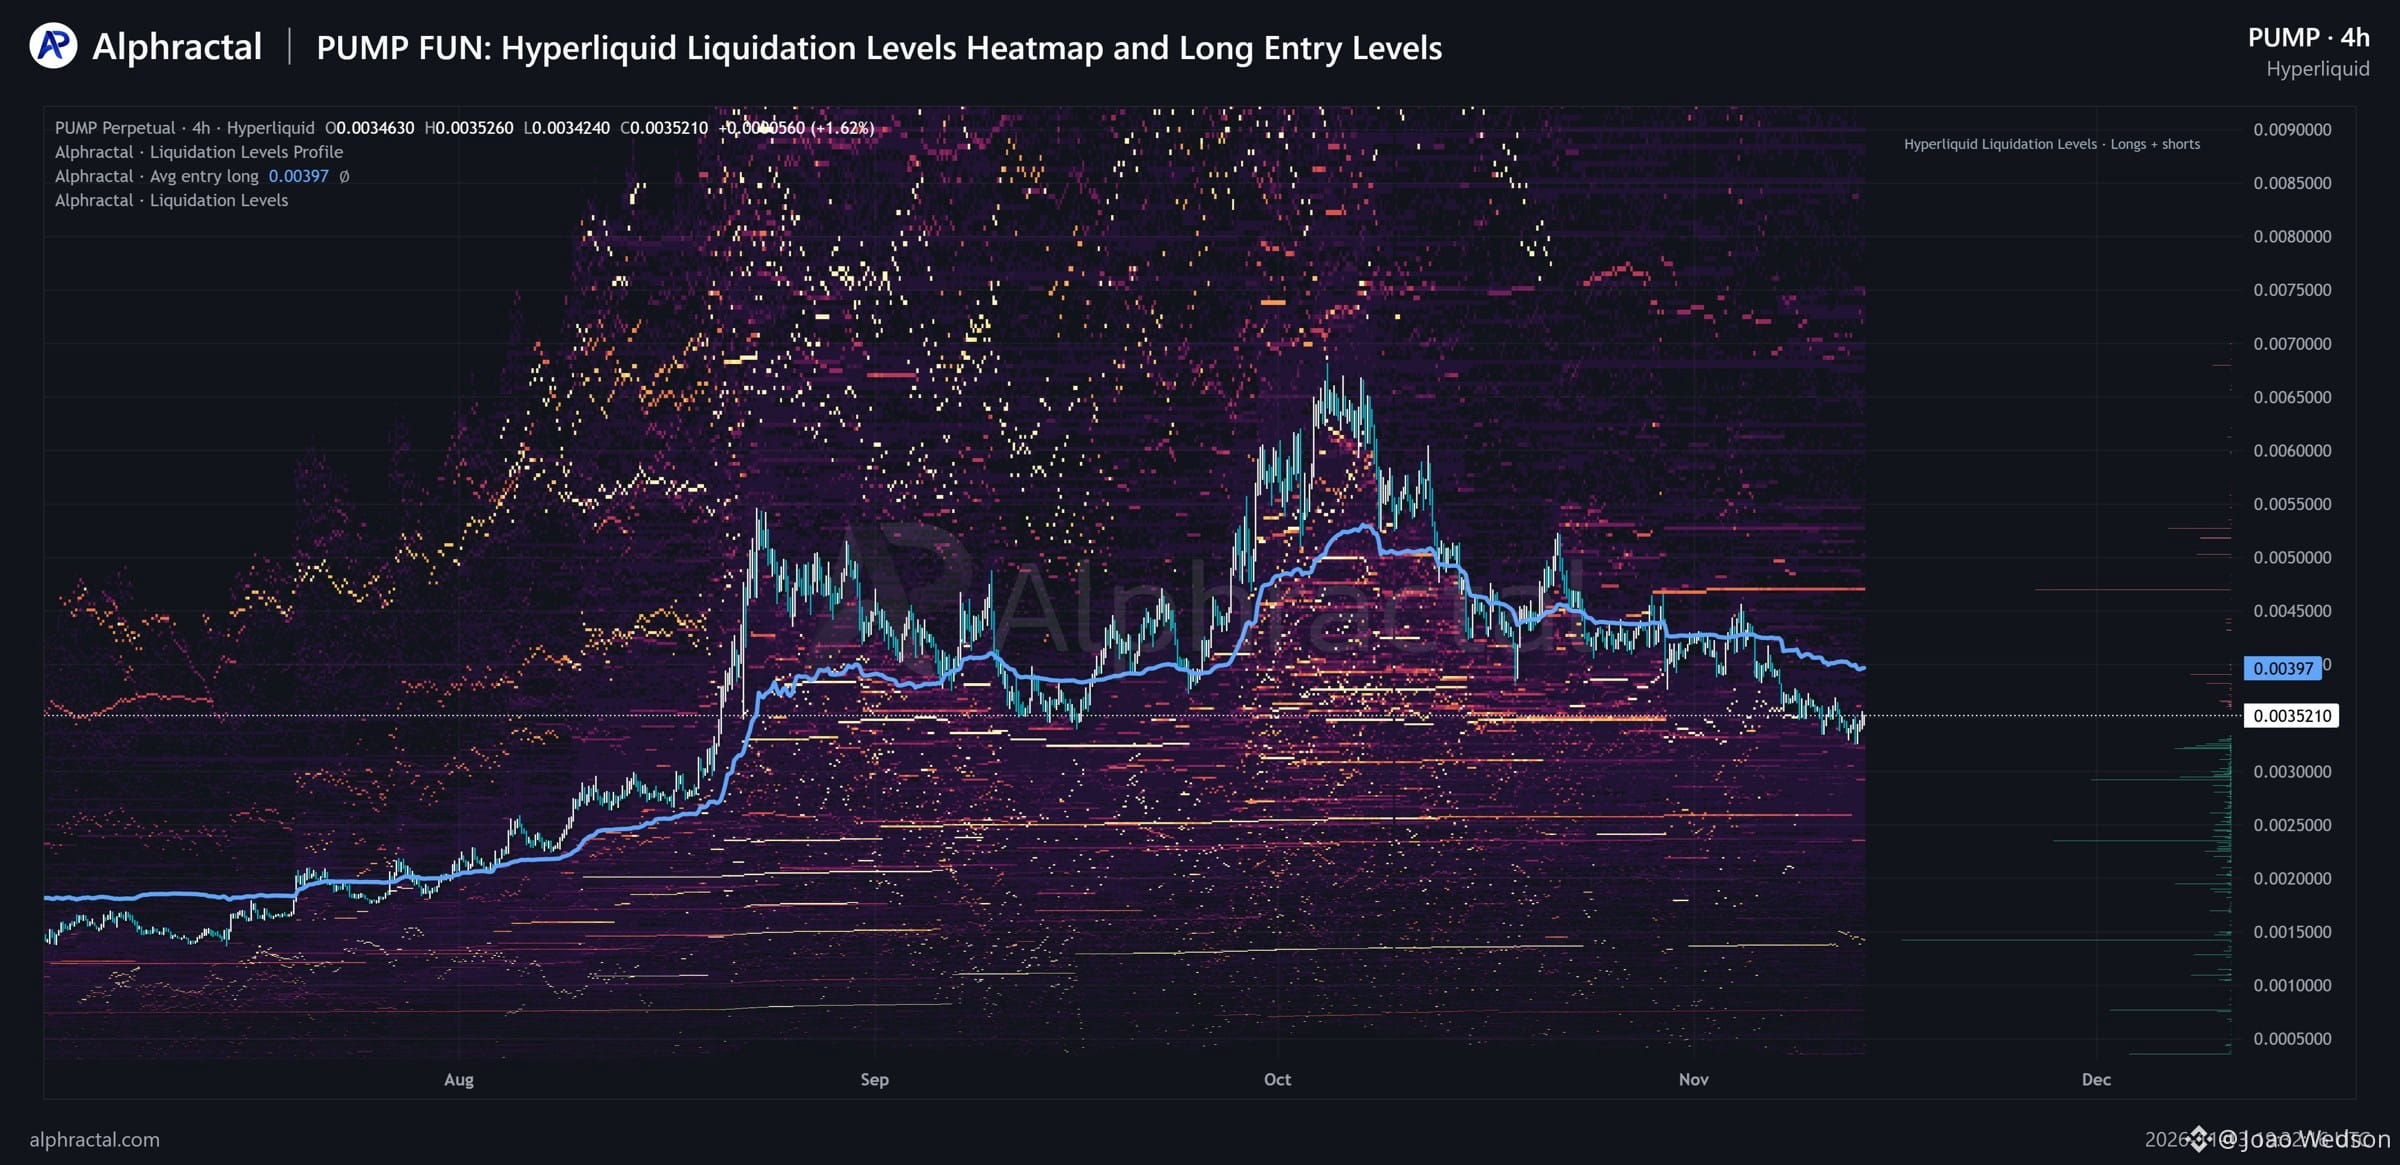
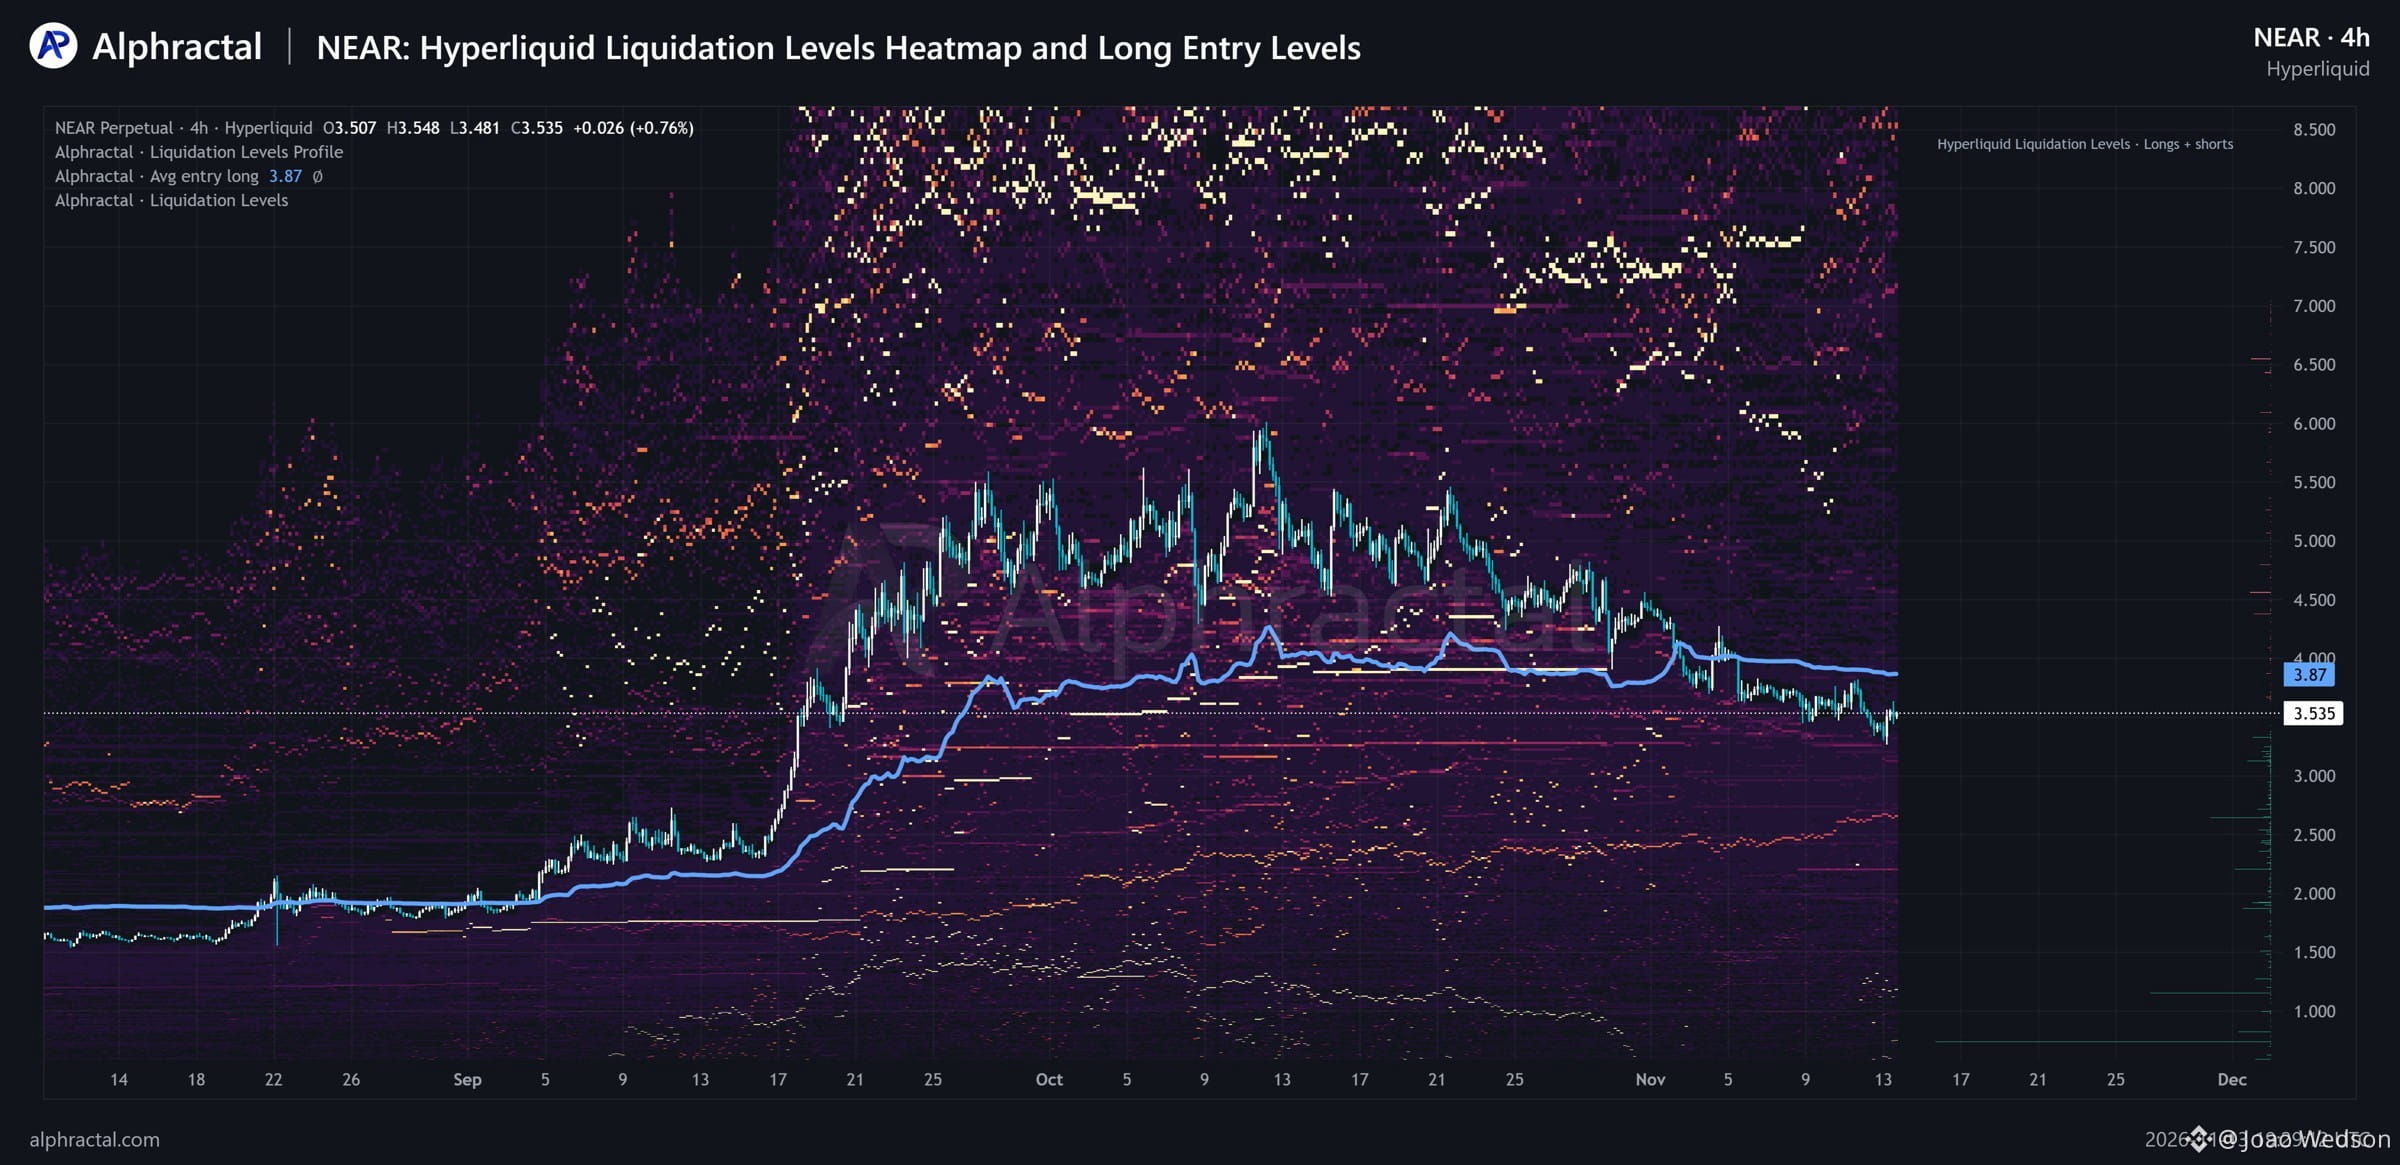
🚨 LONGS DOMINATE ACROSS 12 CRYPTO ASSETS ON HYPERLIQUID! (2/3) Average Long Entry Prices vs current market prices: - $PUMP: $0.00397 (12.75% above) - $LIT: $3.13 (3.07% below) - $XMR: $579.06 (9.39% above) - $NEAR: $3.87 (9.48% above) Why does this matter? The Average Long Entry Price is an important level to monitor because it can act as dynamic support or resistance. When prices trade above this level, it can serve as potential support. When prices fall below it, the same level can become resistance as underwater Long traders look for opportunities to exit near breakeven.
🚨 LONGS DOMINATE ACROSS 12 CRYPTO ASSETS ON HYPERLIQUID! (2/3) Average Long Entry Prices vs current market prices: - $PUMP: $0.00397 (12.75% above) - $LIT: $3.13 (3.07% below) - $XMR: $579.06 (9.39% above) - $NEAR: $3.87 (9.48% above) Why does this matter? The Average Long Entry Price is an important level to monitor because it can act as dynamic support or resistance. When prices trade above this level, it can serve as potential support. When prices fall below it, the same level can become resistance as underwater Long traders look for opportunities to exit near breakeven.
59
·
--
См. перевод
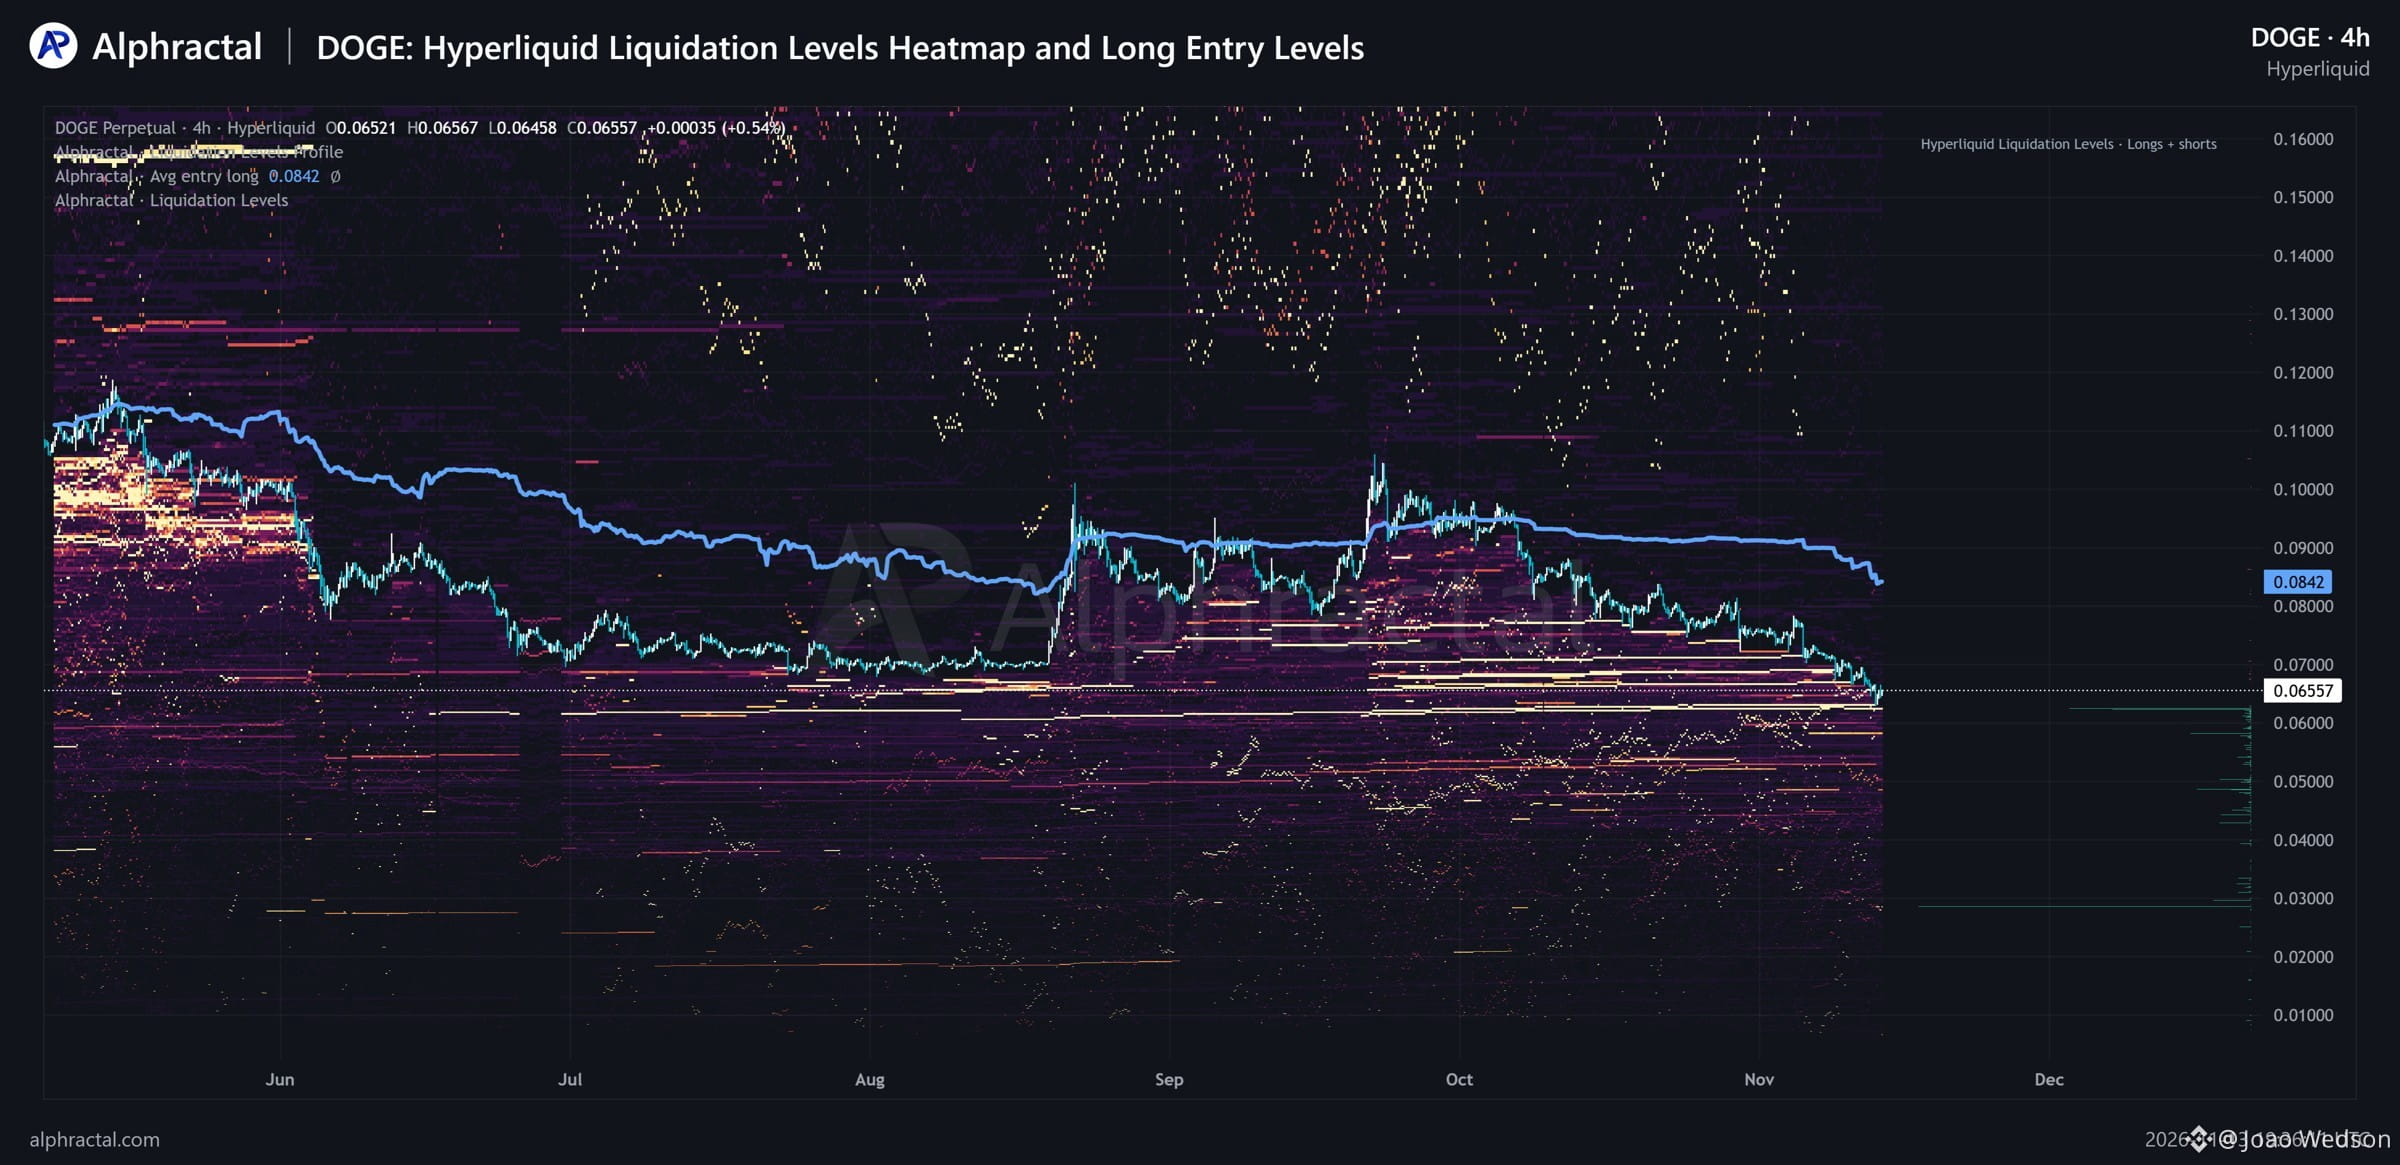
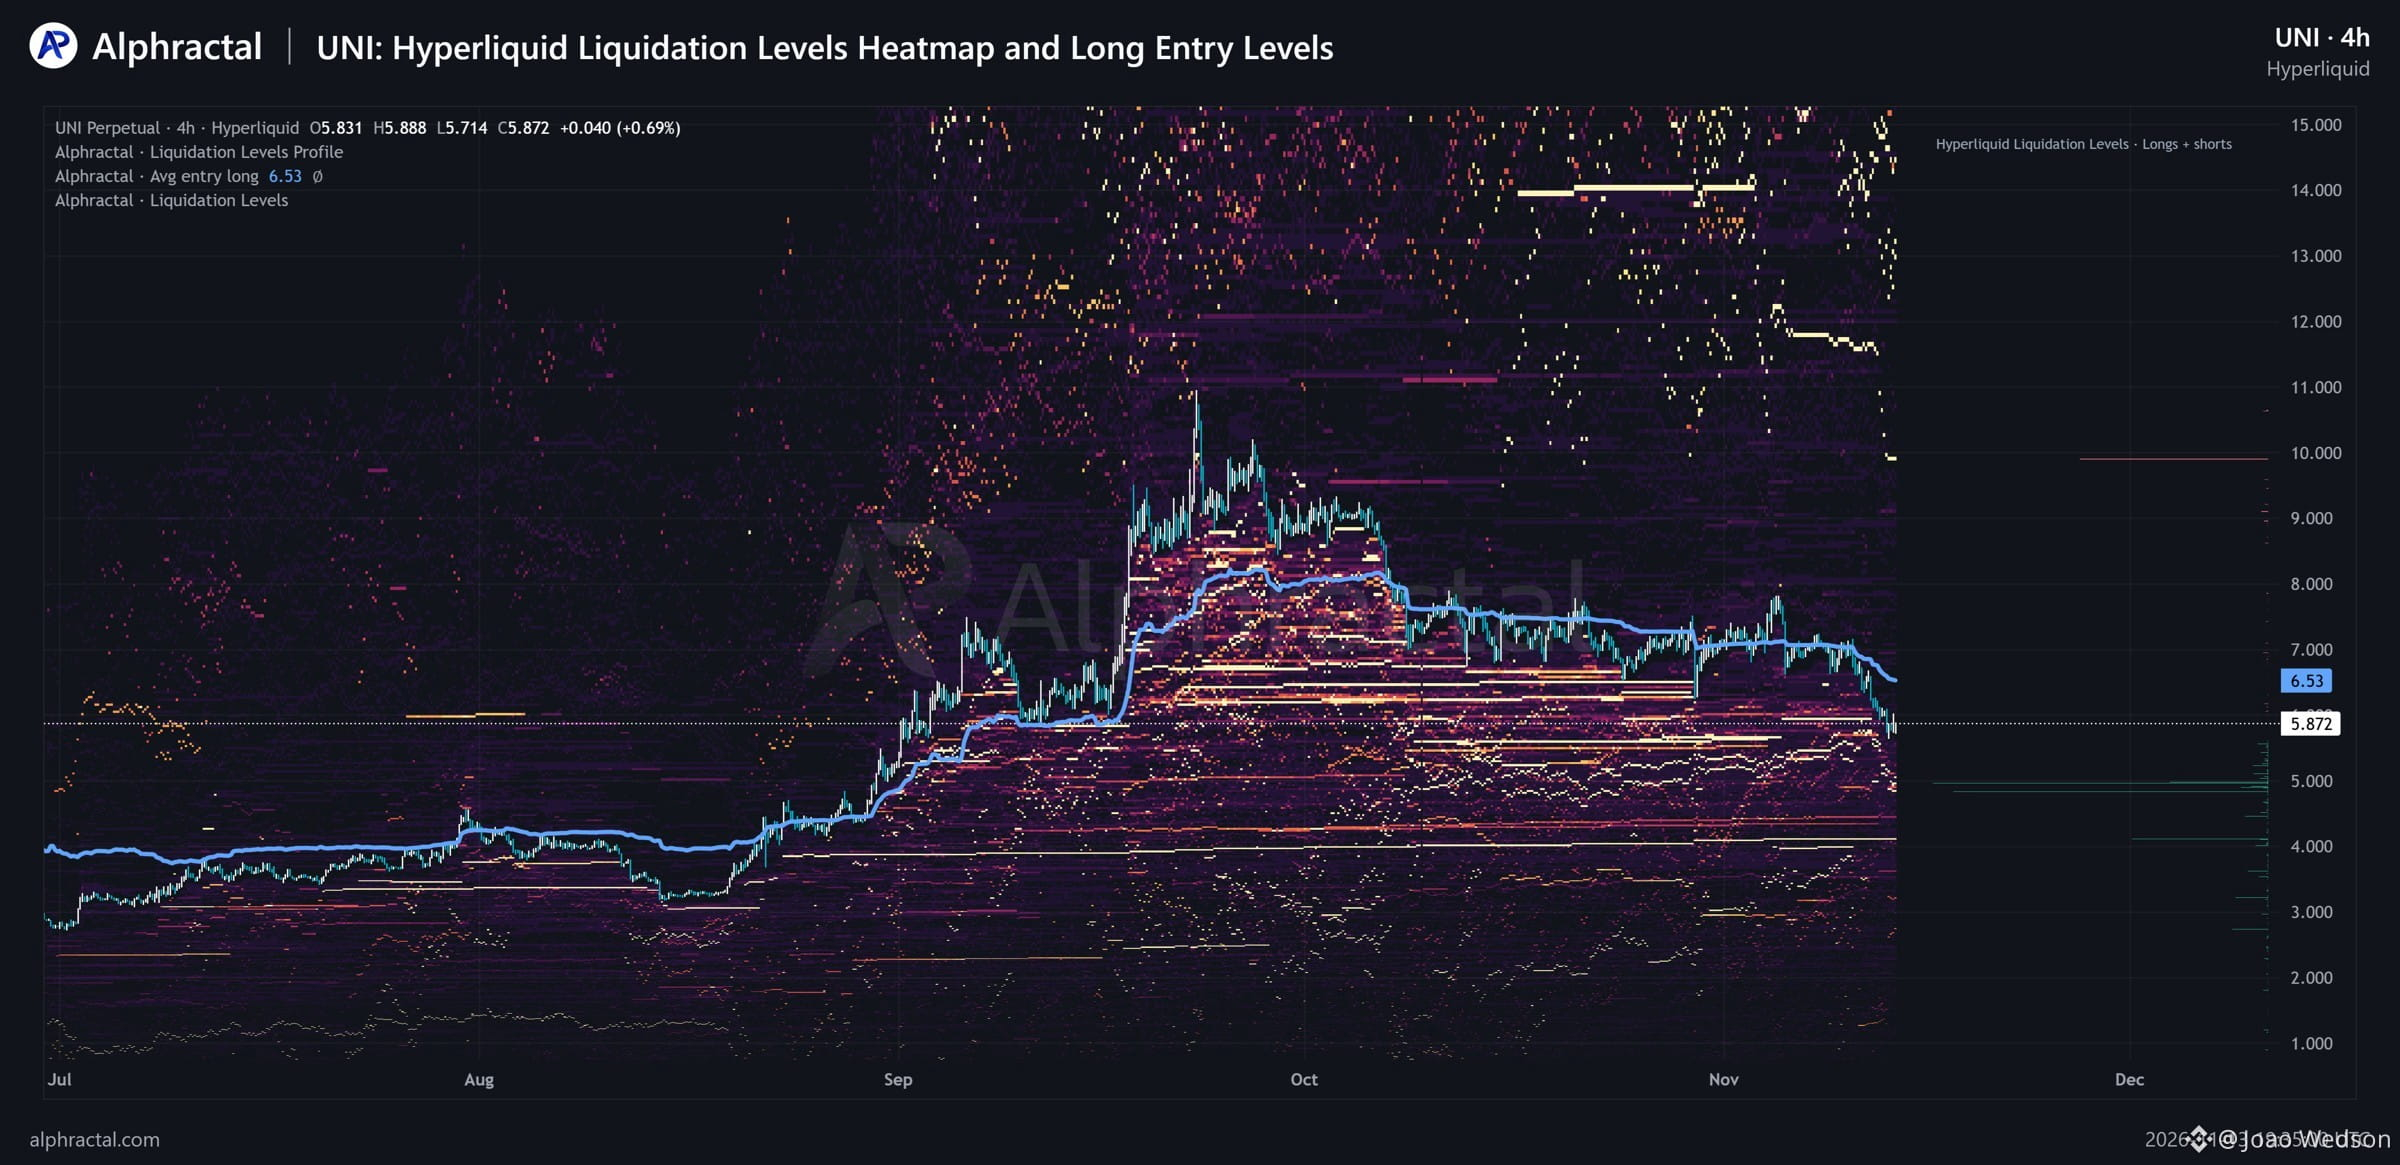
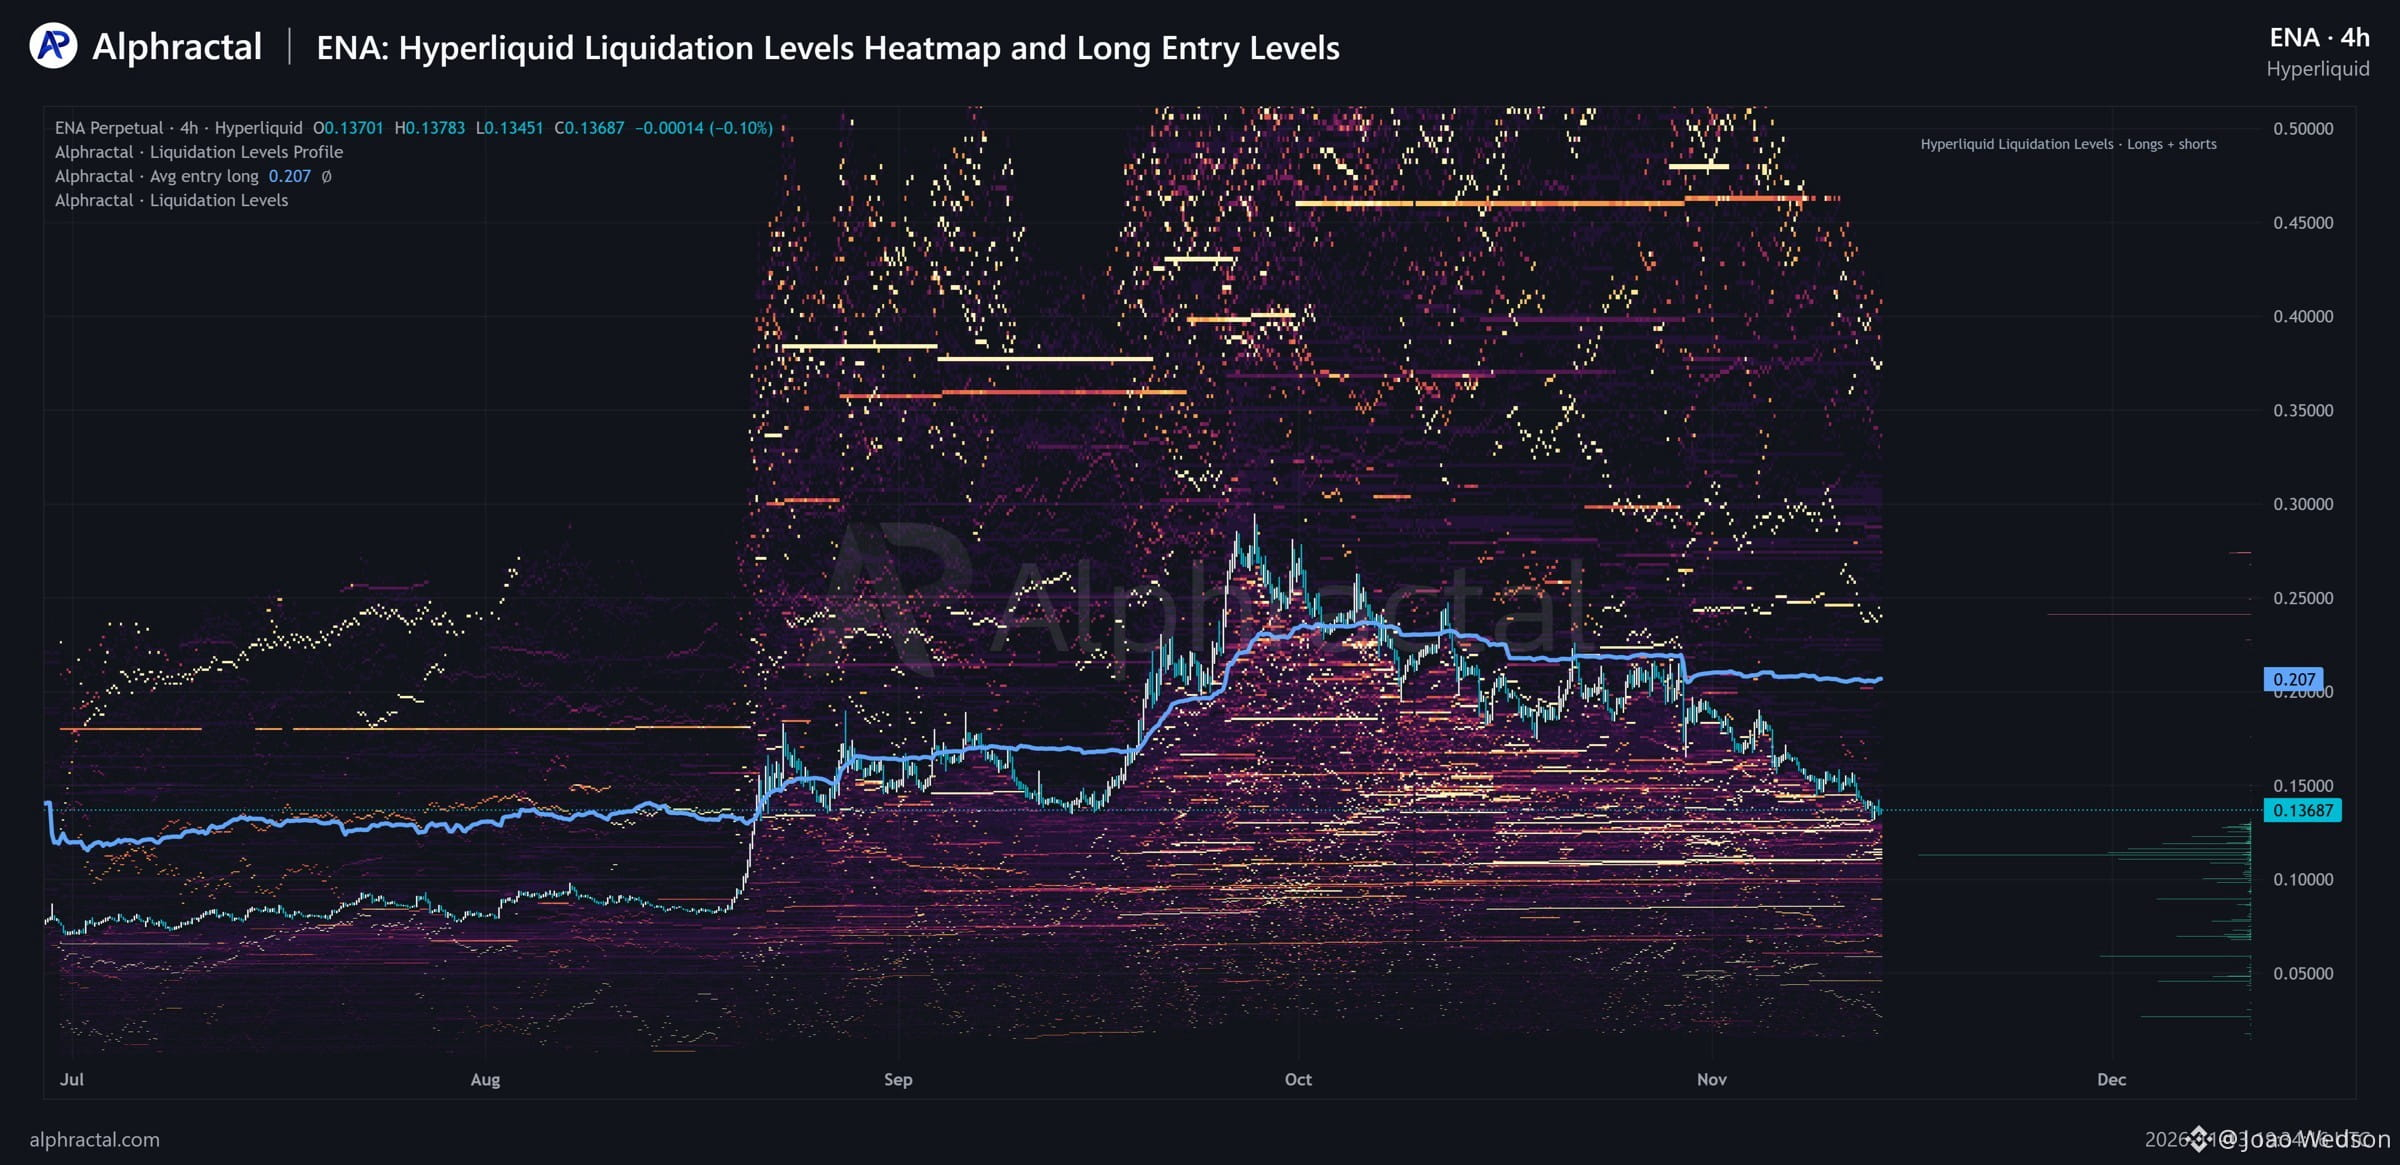
🚨 LONGS DOMINATE ACROSS 12 CRYPTO ASSETS ON HYPERLIQUID! (1/3) Something interesting is happening in the derivatives market. Our latest Alphractal data shows that Long positions dominate across these 12 assets on Hyperliquid, even as prices continue to decline. Here are the Average Long Entry Prices, including their percentage difference from current market prices: - $DOGE: $0.0842 (28.41% above current price) - $UNI: $6.53 (11.21% above) - $ENA: $0.207 (51.24% above) - $PEPE: $0.00477 (6.97% above, kPEPE contract)
🚨 LONGS DOMINATE ACROSS 12 CRYPTO ASSETS ON HYPERLIQUID! (1/3) Something interesting is happening in the derivatives market. Our latest Alphractal data shows that Long positions dominate across these 12 assets on Hyperliquid, even as prices continue to decline. Here are the Average Long Entry Prices, including their percentage difference from current market prices: - $DOGE: $0.0842 (28.41% above current price) - $UNI: $6.53 (11.21% above) - $ENA: $0.207 (51.24% above) - $PEPE: $0.00477 (6.97% above, kPEPE contract)
80
·
--
См. перевод
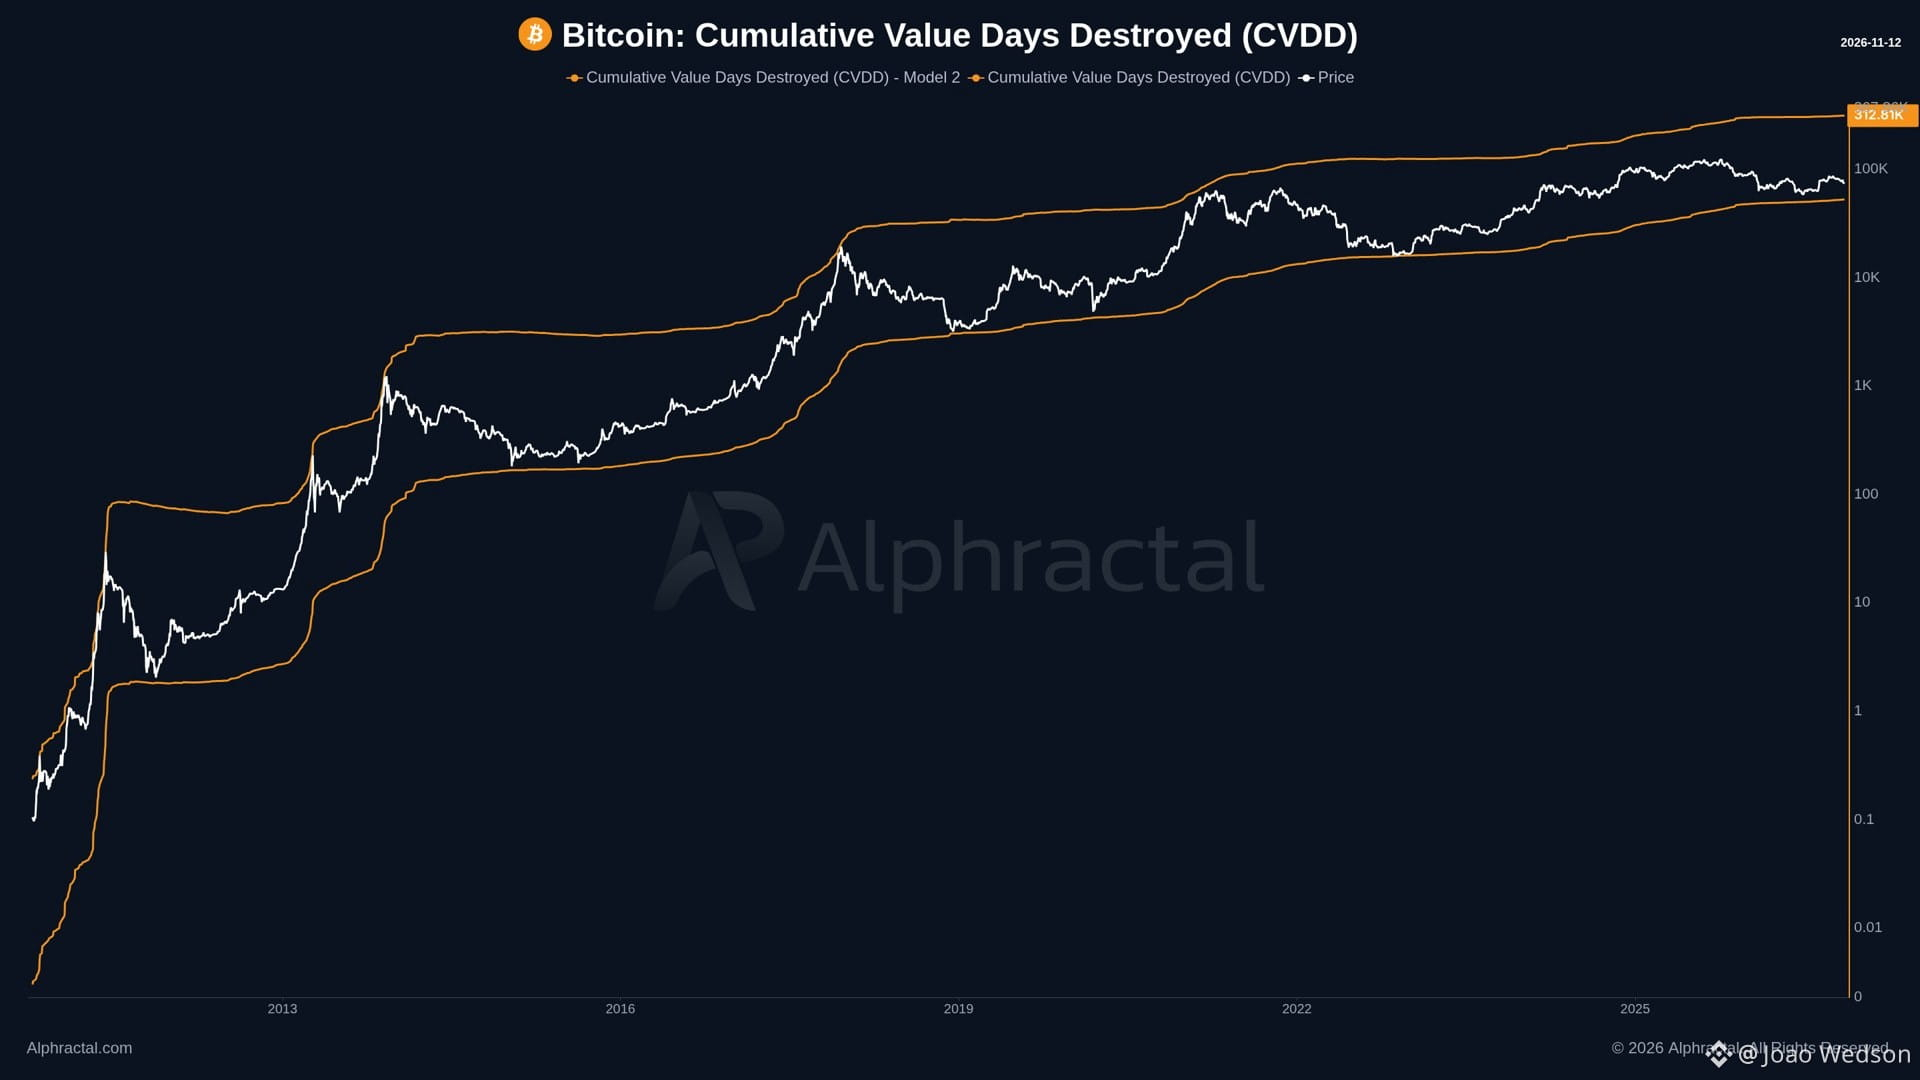
CVDD, historically the most accurate Bitcoin bottom metric, is sitting at $52.7K right now! Alphractal's Cumulative Value Days Destroyed shows BTC ($72.5K) still 37.7% above it. A full retest would mean a ~27% drop from here. Every major bottom met it: 🔴 Jan 2015: low $152 vs CVDD $168 (~9% below) 🔴 Dec 2018: low $3,122 vs CVDD $3,060 (~2% above) 🔴 Mar 2020: low $3,850 vs CVDD $4,280 (~10% below) 🔴 Nov 2022: low $15,479 vs CVDD $15,900 (~3% below) So is this time different, or is it just a matter of time? Keep in mind CVDD isn't a fixed line. It's dynamic and moves every day with on-chain activity, as old coins change hands. The longer the market drifts, the higher it climbs toward price. Follow the data, not the narrative.
CVDD, historically the most accurate Bitcoin bottom metric, is sitting at $52.7K right now! Alphractal's Cumulative Value Days Destroyed shows BTC ($72.5K) still 37.7% above it. A full retest would mean a ~27% drop from here. Every major bottom met it: 🔴 Jan 2015: low $152 vs CVDD $168 (~9% below) 🔴 Dec 2018: low $3,122 vs CVDD $3,060 (~2% above) 🔴 Mar 2020: low $3,850 vs CVDD $4,280 (~10% below) 🔴 Nov 2022: low $15,479 vs CVDD $15,900 (~3% below) So is this time different, or is it just a matter of time? Keep in mind CVDD isn't a fixed line. It's dynamic and moves every day with on-chain activity, as old coins change hands. The longer the market drifts, the higher it climbs toward price. Follow the data, not the narrative.
29
·
--
См. перевод
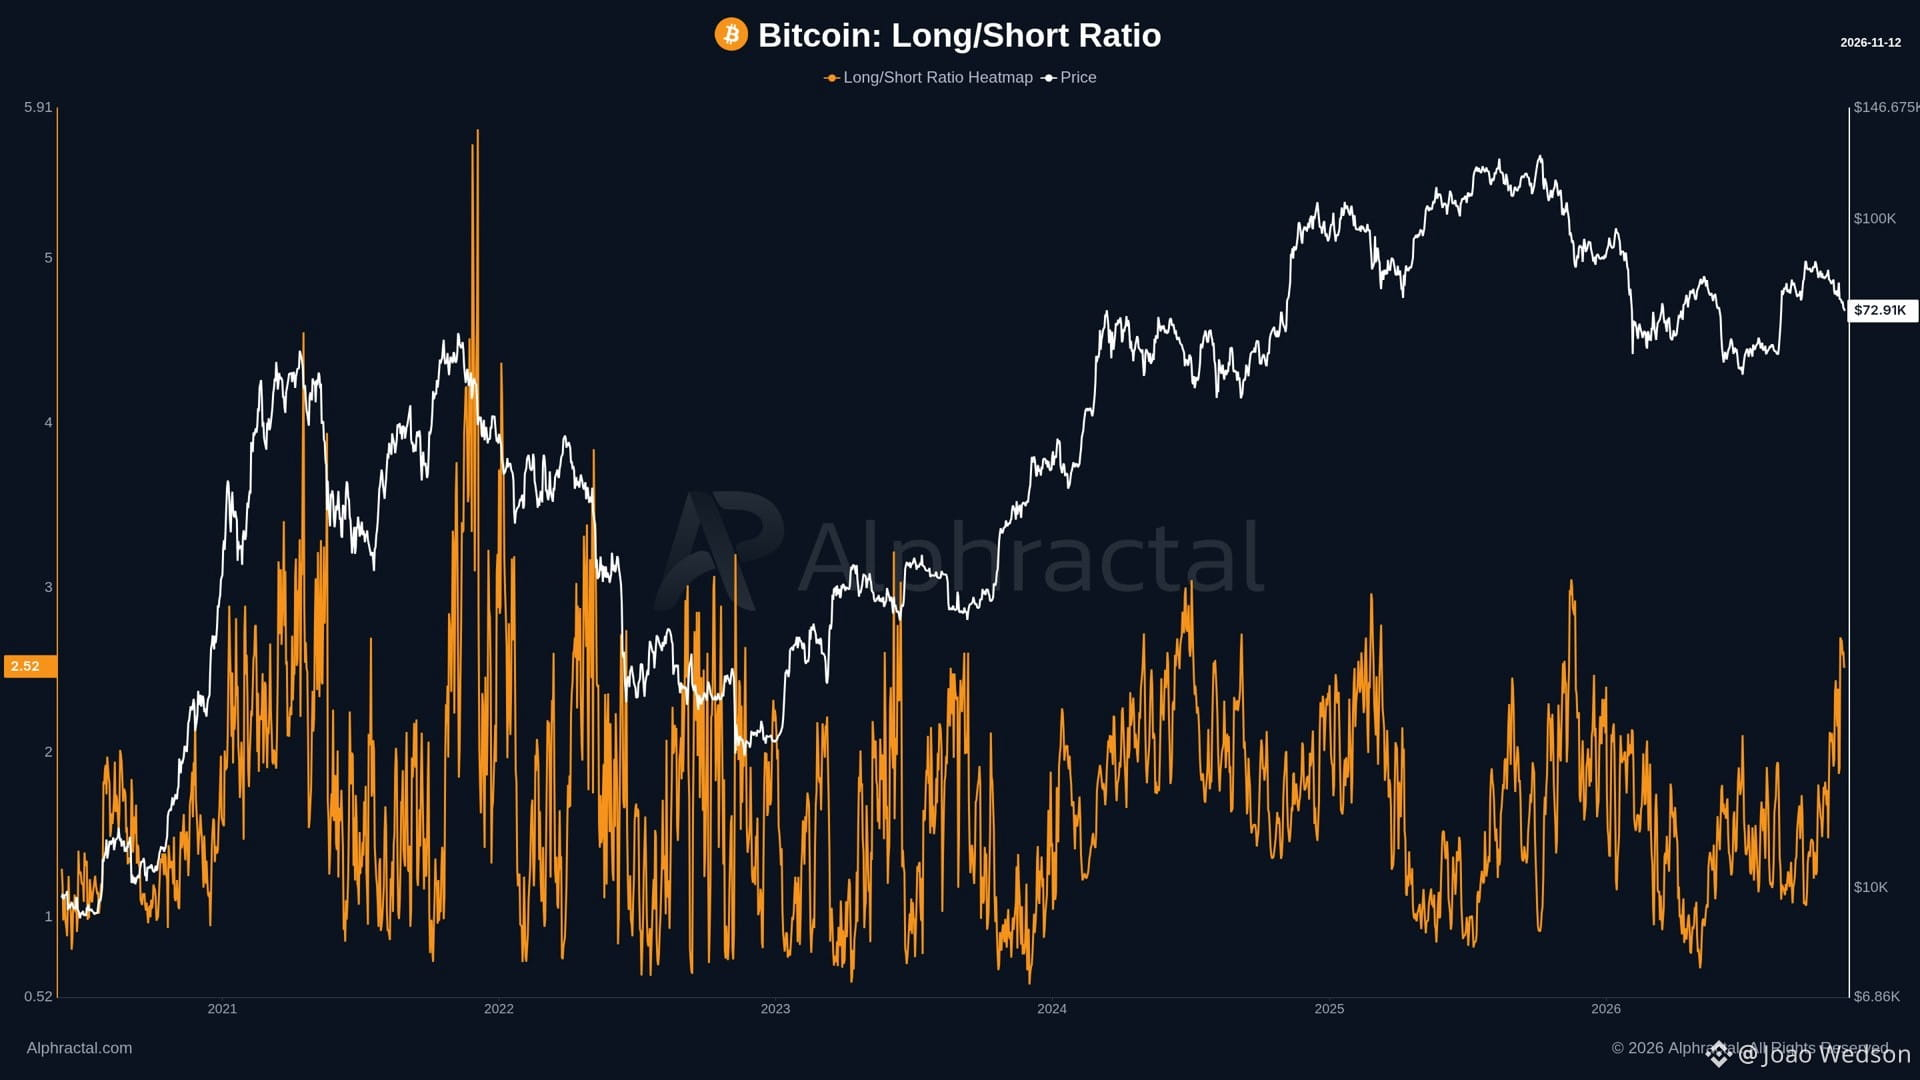
Everyone on X is talking about "record shorts." The data says the opposite! Alphractal's Bitcoin Long/Short Ratio just hit 2.52, up 32% in 7 days, near the top of its 2024–2026 range. 🟢 Long/Short Ratio: 2.52 (+32% 7d) 🔴 BTC: $72.9K, down from $74.8K on Nov 8 • Funding rate: still positive • Open Interest: $43.37B (−2.4% 7d) Price is falling while traders keep adding longs. That's not capitulation, it's dip-buying with leverage. Historically, spikes in this ratio during drawdowns have left the market vulnerable to long squeezes before a real bottom forms. That said, a high ratio isn't a timing signal on its own. If BTC holds the $72K–$74K zone, these longs can become fuel for a bounce. Follow the data, not the narrative.
Everyone on X is talking about "record shorts." The data says the opposite! Alphractal's Bitcoin Long/Short Ratio just hit 2.52, up 32% in 7 days, near the top of its 2024–2026 range. 🟢 Long/Short Ratio: 2.52 (+32% 7d) 🔴 BTC: $72.9K, down from $74.8K on Nov 8 • Funding rate: still positive • Open Interest: $43.37B (−2.4% 7d) Price is falling while traders keep adding longs. That's not capitulation, it's dip-buying with leverage. Historically, spikes in this ratio during drawdowns have left the market vulnerable to long squeezes before a real bottom forms. That said, a high ratio isn't a timing signal on its own. If BTC holds the $72K–$74K zone, these longs can become fuel for a bounce. Follow the data, not the narrative.
39
·
--
См. перевод
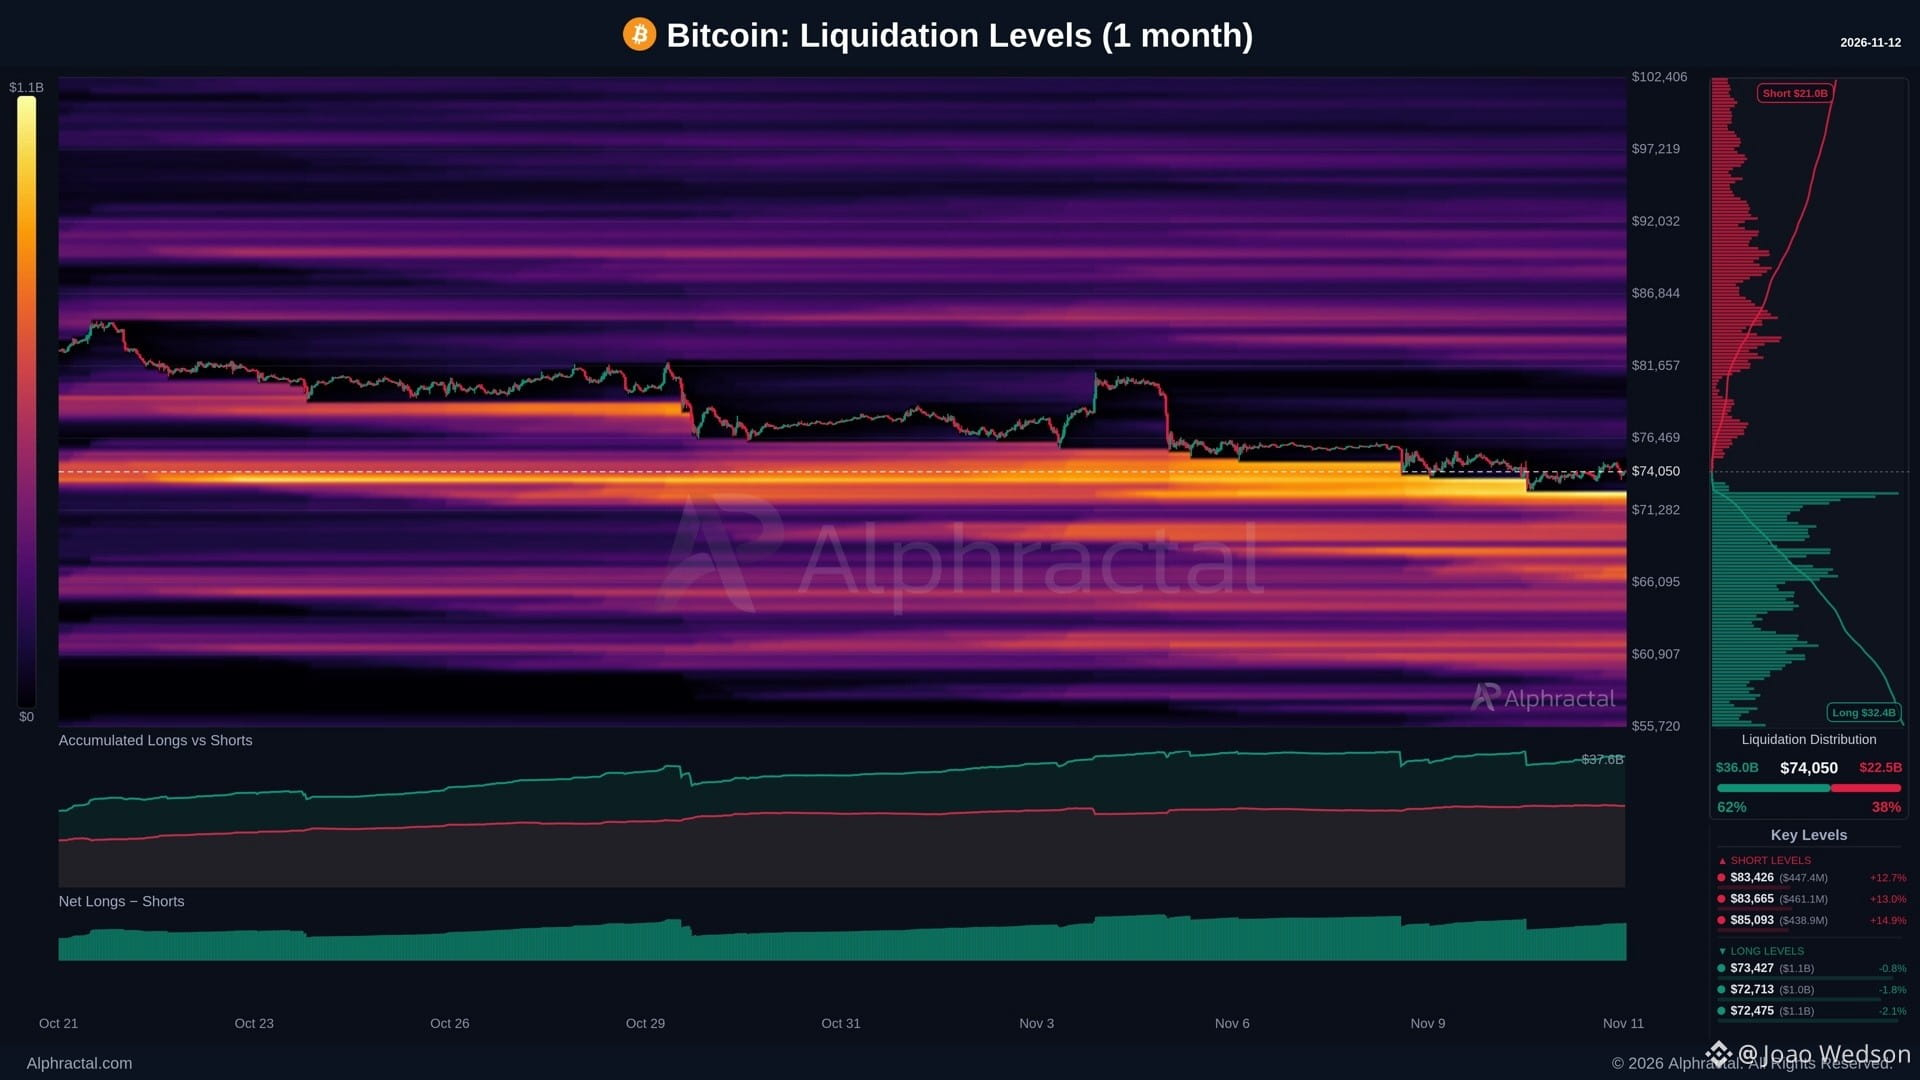
Bitcoin is sitting right on top of a long liquidation wall! Alphractal's Liquidation Levels show the market is clearly long-heavy: 🟢 Longs at risk: $36.0B (62%) 🔴 Shorts at risk: $22.5B (38%) The densest clusters are just below price ($74,050): • $73,427, about $1.1B (−0.8%) • $72,713, about $1.0B (−1.8%) • $72,475, about $1.1B (−2.1%) On the other side, the first meaningful short clusters only appear around $83.4K–$85.1K, 12–15% away. When this much leverage piles up this close to price, liquidity tends to be hunted first. A clean break below $72.5K could trigger a cascade of more than $1B in long liquidations. That said, liquidation maps show where the fuel is, not where price must go. Follow the data, not the narrative.
Bitcoin is sitting right on top of a long liquidation wall! Alphractal's Liquidation Levels show the market is clearly long-heavy: 🟢 Longs at risk: $36.0B (62%) 🔴 Shorts at risk: $22.5B (38%) The densest clusters are just below price ($74,050): • $73,427, about $1.1B (−0.8%) • $72,713, about $1.0B (−1.8%) • $72,475, about $1.1B (−2.1%) On the other side, the first meaningful short clusters only appear around $83.4K–$85.1K, 12–15% away. When this much leverage piles up this close to price, liquidity tends to be hunted first. A clean break below $72.5K could trigger a cascade of more than $1B in long liquidations. That said, liquidation maps show where the fuel is, not where price must go. Follow the data, not the narrative.
73
·
--
См. перевод
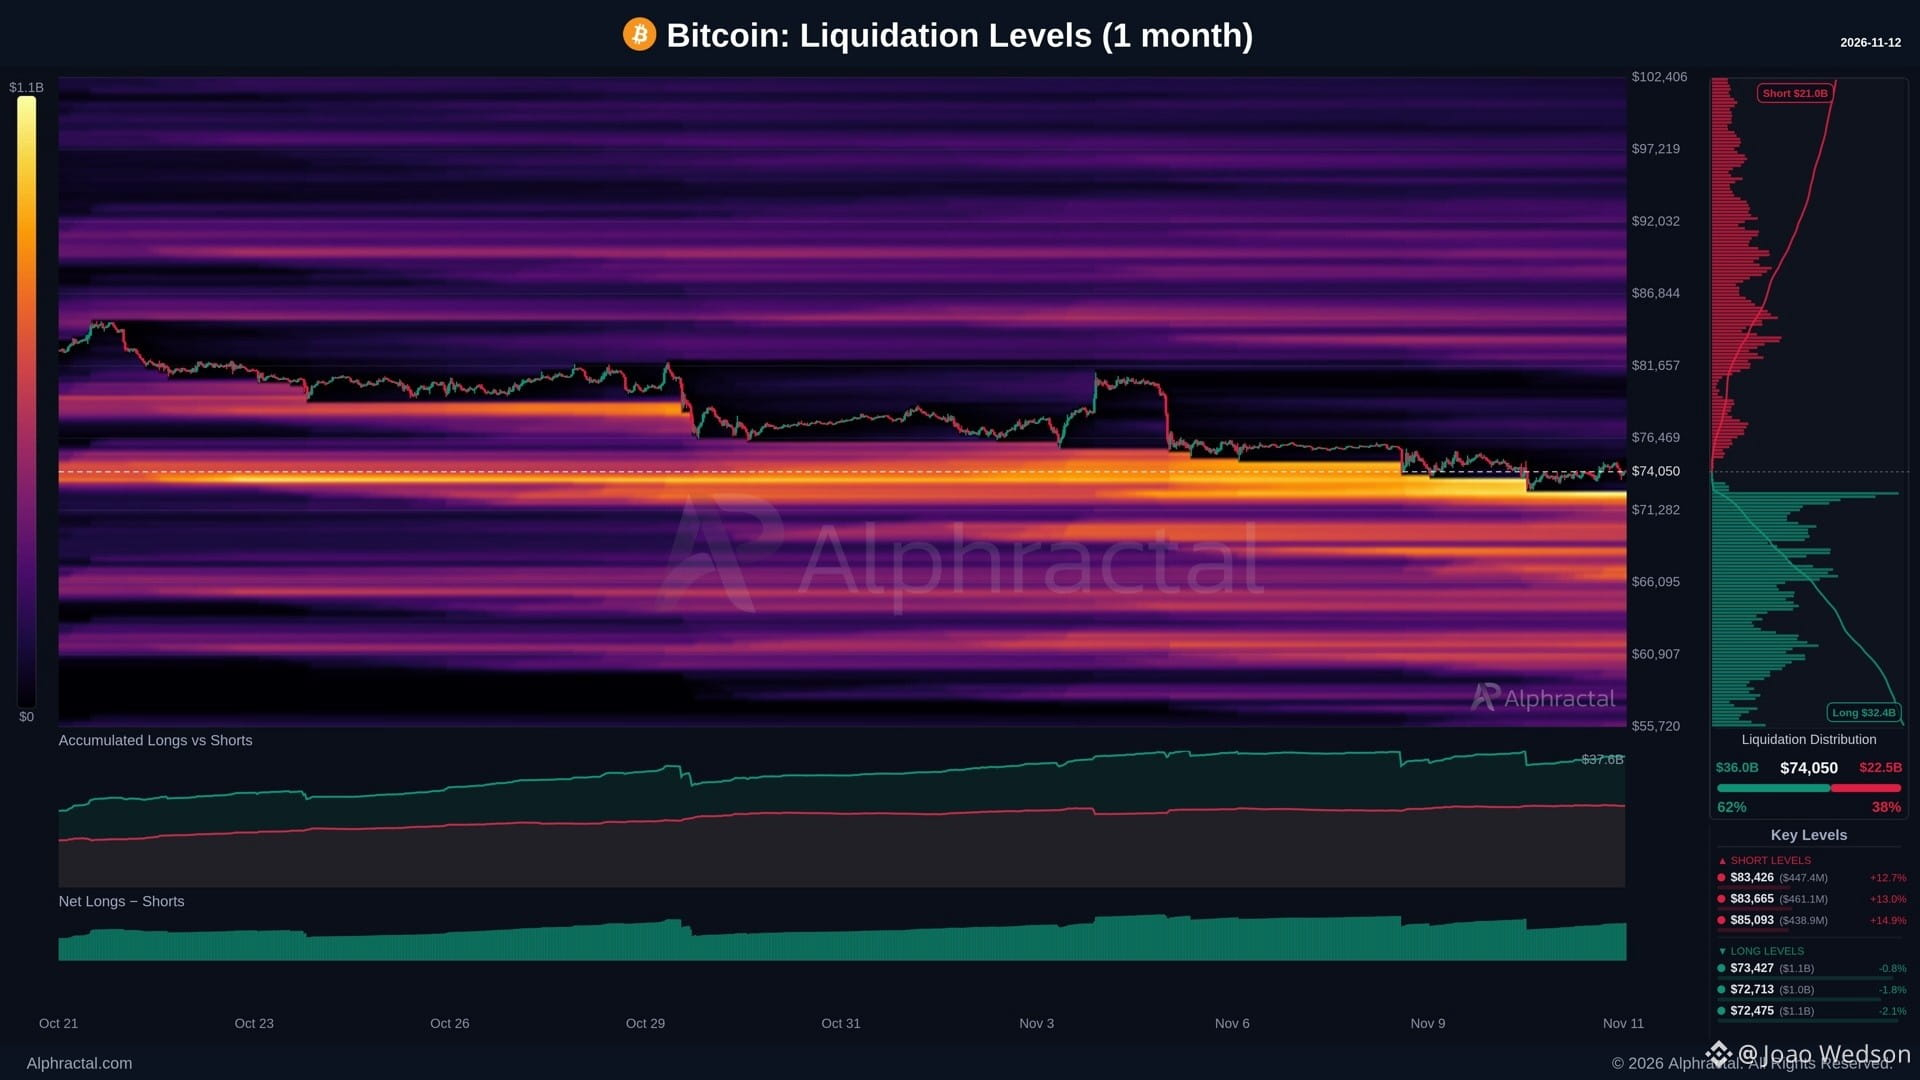
Bitcoin is sitting right on top of a long liquidation wall!
Alphractal's Liquidation Levels show the market is clearly long-heavy:
🟢 Longs at risk: $36.0B (62%)
🔴 Shorts at risk: $22.5B (38%)
The densest clusters are just below price ($74,050):
• $73,427, about $1.1B (−0.8%)
• $72,713, about $1.0B (−1.8%)
• $72,475, about $1.1B (−2.1%)
On the other side, the first meaningful short clusters only appear around $83.4K–$85.1K, 12–15% away.
When this much leverage piles up this close to price, liquidity tends to be hunted first. A clean break below $72.5K could trigger a cascade of more than $1B in long liquidations.
That said, liquidation maps show where the fuel is, not where price must go.
Follow the data, not the narrative.
Bitcoin is sitting right on top of a long liquidation wall!
Alphractal's Liquidation Levels show the market is clearly long-heavy:
🟢 Longs at risk: $36.0B (62%)
🔴 Shorts at risk: $22.5B (38%)
The densest clusters are just below price ($74,050):
• $73,427, about $1.1B (−0.8%)
• $72,713, about $1.0B (−1.8%)
• $72,475, about $1.1B (−2.1%)
On the other side, the first meaningful short clusters only appear around $83.4K–$85.1K, 12–15% away.
When this much leverage piles up this close to price, liquidity tends to be hunted first. A clean break below $72.5K could trigger a cascade of more than $1B in long liquidations.
That said, liquidation maps show where the fuel is, not where price must go.
Follow the data, not the narrative.
Alphractal's Liquidation Levels show the market is clearly long-heavy:
🟢 Longs at risk: $36.0B (62%)
🔴 Shorts at risk: $22.5B (38%)
The densest clusters are just below price ($74,050):
• $73,427, about $1.1B (−0.8%)
• $72,713, about $1.0B (−1.8%)
• $72,475, about $1.1B (−2.1%)
On the other side, the first meaningful short clusters only appear around $83.4K–$85.1K, 12–15% away.
When this much leverage piles up this close to price, liquidity tends to be hunted first. A clean break below $72.5K could trigger a cascade of more than $1B in long liquidations.
That said, liquidation maps show where the fuel is, not where price must go.
Follow the data, not the narrative.
75
·
--
См. перевод
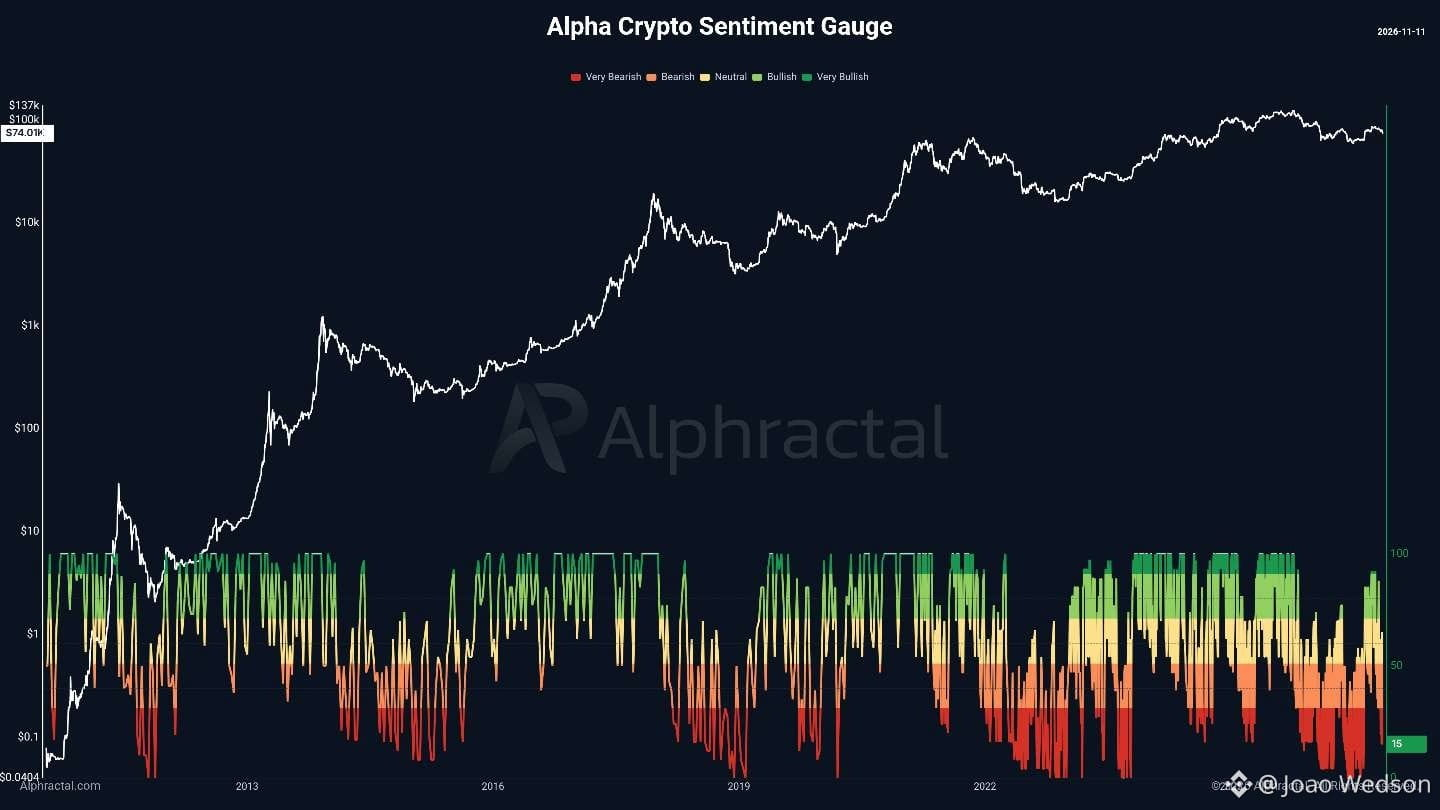
Let's talk about crypto market sentiment.
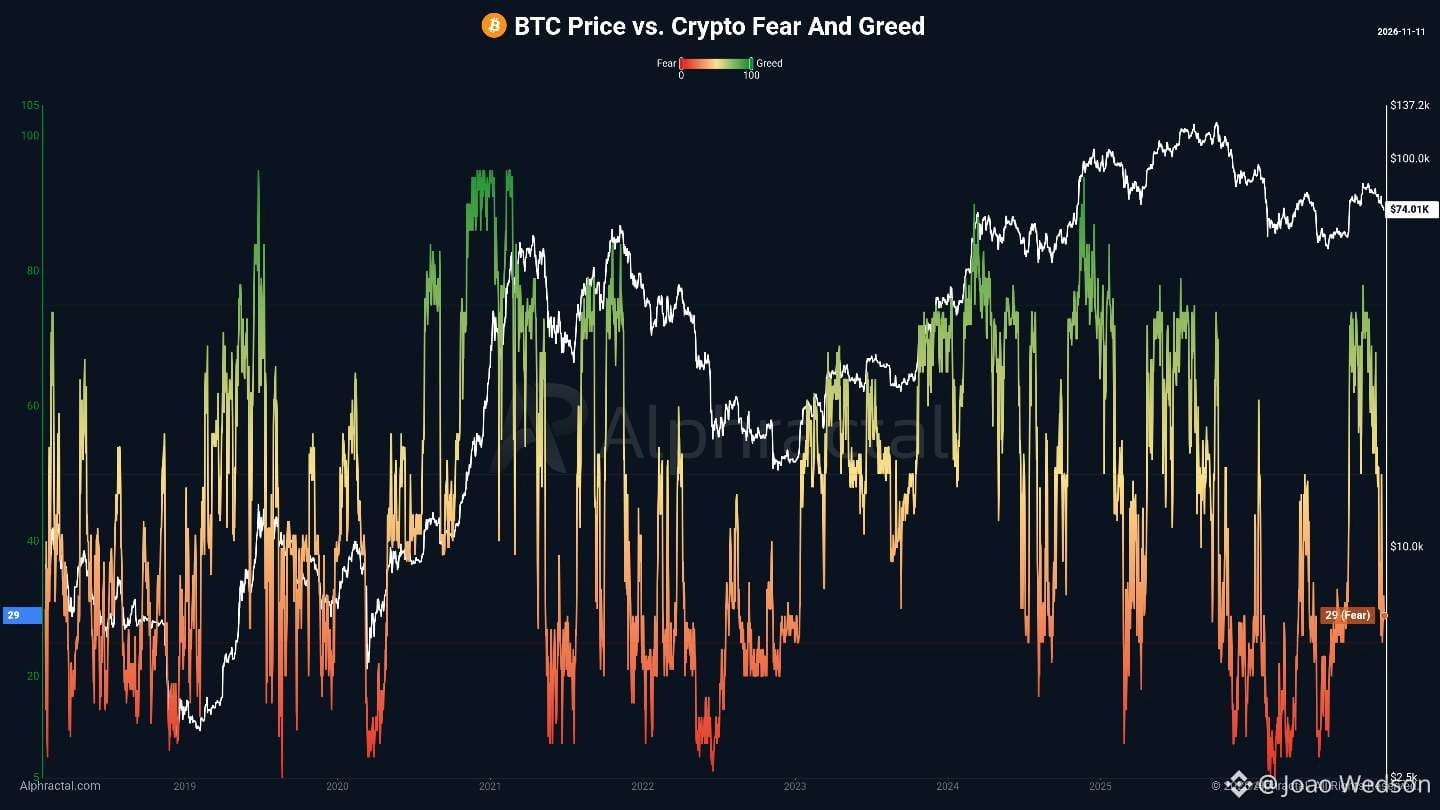
• Crypto Fear & Greed: 29 (Fear).
• Alphractal's Alpha Crypto Sentiment Gauge: 15 (Very Bearish), reflecting news and social media sentiment.
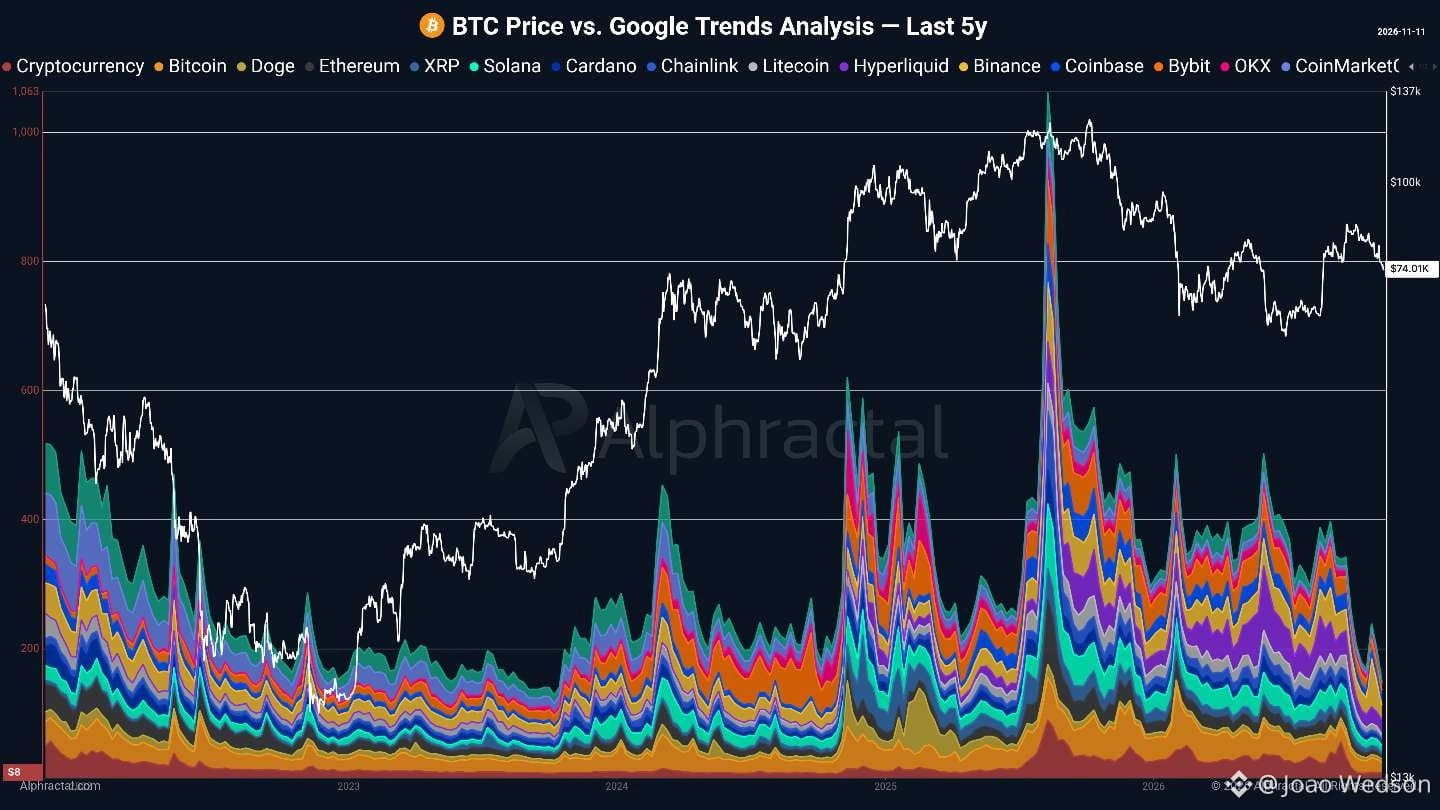
• Google searches for crypto topics are at levels not seen since 2023.
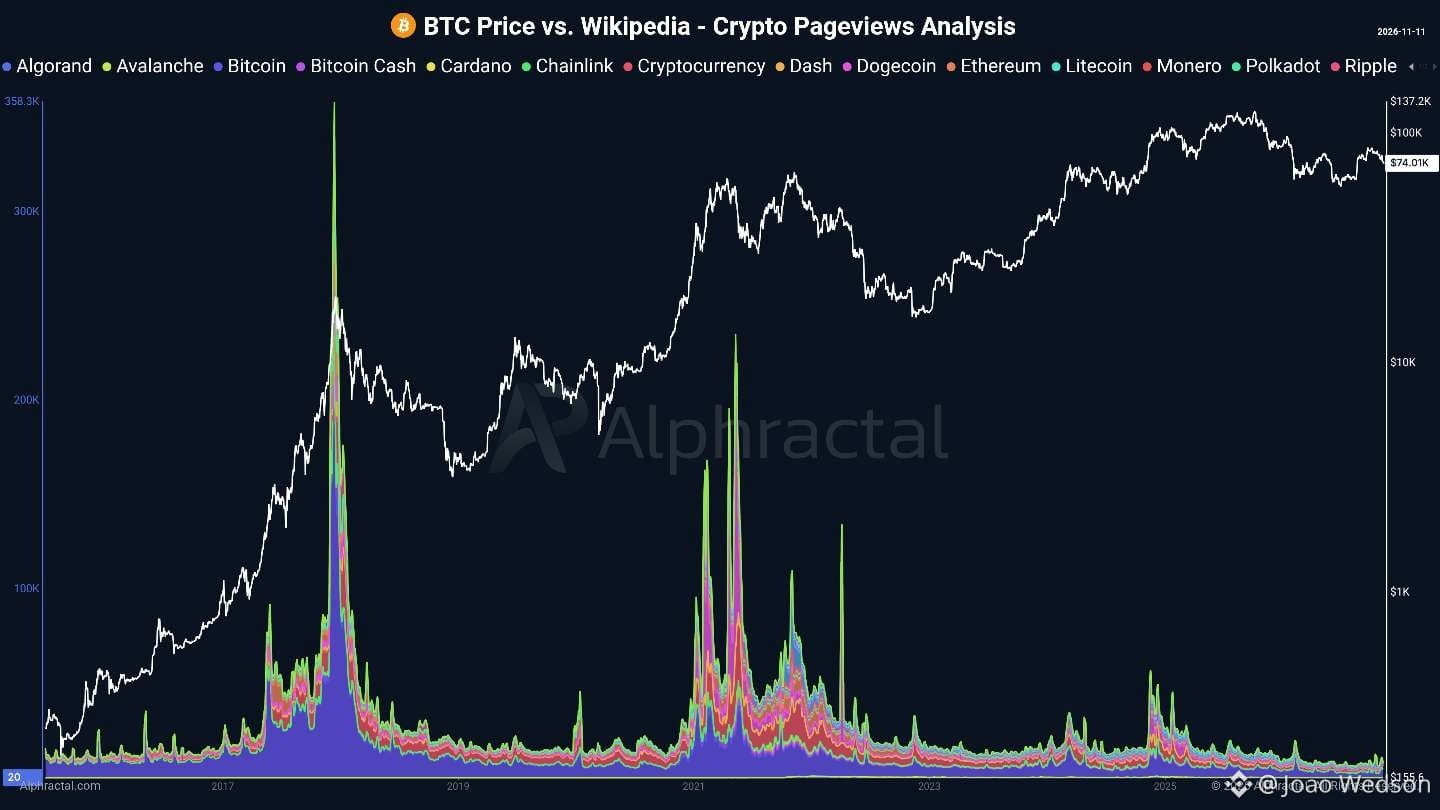
• Crypto Wikipedia pageviews are near historic lows, although LLMs have changed how people seek information.
Apathy is taking over.
This looks like the boring accumulation phase: altcoins weaken, investors leave, and analysts keep calling for reversals based on technical signals that fail to hold.
Strong fundamentals alone do not guarantee higher prices. Sustainable rallies require real demand, spot buying and on-chain accumulation. Yet derivatives increasingly drive short-term price movements, a significant shift from the greater influence of Spot and OTC markets before 2020.
Weak interest also pressures exchanges to cut jobs, operations and marketing. Some former market leaders have lost relevance or disappeared.
Still, I see light at the end of the tunnel.
Historically, prolonged apathy has often preceded renewed retail enthusiasm one or two years later. By 2028, fresh narratives could bring investors back, but many might only start accumulating when OGs are distributing.
I made a similar interpretation in 2022, when many doubted BTC could fall below $20K. The ensuing apathy created opportunities for patient investors.
Yes, LLMs have changed search behavior, so these attention metrics need context. But together, they still tell a compelling story.
I build in crypto and believe in its long-term future. That does not mean ignoring bearish data or confusing personal conviction with market reality.
Now is the time for resilience, patience and intelligent accumulation.
The biggest opportunities often form when almost nobody is paying attention.
Charts: Alphractal
Many are free.
Let's talk about crypto market sentiment.
• Crypto Fear & Greed: 29 (Fear).
• Alphractal's Alpha Crypto Sentiment Gauge: 15 (Very Bearish), reflecting news and social media sentiment.
• Google searches for crypto topics are at levels not seen since 2023.
• Crypto Wikipedia pageviews are near historic lows, although LLMs have changed how people seek information.
Apathy is taking over.
This looks like the boring accumulation phase: altcoins weaken, investors leave, and analysts keep calling for reversals based on technical signals that fail to hold.
Strong fundamentals alone do not guarantee higher prices. Sustainable rallies require real demand, spot buying and on-chain accumulation. Yet derivatives increasingly drive short-term price movements, a significant shift from the greater influence of Spot and OTC markets before 2020.
Weak interest also pressures exchanges to cut jobs, operations and marketing. Some former market leaders have lost relevance or disappeared.
Still, I see light at the end of the tunnel.
Historically, prolonged apathy has often preceded renewed retail enthusiasm one or two years later. By 2028, fresh narratives could bring investors back, but many might only start accumulating when OGs are distributing.
I made a similar interpretation in 2022, when many doubted BTC could fall below $20K. The ensuing apathy created opportunities for patient investors.
Yes, LLMs have changed search behavior, so these attention metrics need context. But together, they still tell a compelling story.
I build in crypto and believe in its long-term future. That does not mean ignoring bearish data or confusing personal conviction with market reality.
Now is the time for resilience, patience and intelligent accumulation.
The biggest opportunities often form when almost nobody is paying attention.
Charts: Alphractal
Many are free.
• Crypto Fear & Greed: 29 (Fear).
• Alphractal's Alpha Crypto Sentiment Gauge: 15 (Very Bearish), reflecting news and social media sentiment.
• Google searches for crypto topics are at levels not seen since 2023.
• Crypto Wikipedia pageviews are near historic lows, although LLMs have changed how people seek information.
Apathy is taking over.
This looks like the boring accumulation phase: altcoins weaken, investors leave, and analysts keep calling for reversals based on technical signals that fail to hold.
Strong fundamentals alone do not guarantee higher prices. Sustainable rallies require real demand, spot buying and on-chain accumulation. Yet derivatives increasingly drive short-term price movements, a significant shift from the greater influence of Spot and OTC markets before 2020.
Weak interest also pressures exchanges to cut jobs, operations and marketing. Some former market leaders have lost relevance or disappeared.
Still, I see light at the end of the tunnel.
Historically, prolonged apathy has often preceded renewed retail enthusiasm one or two years later. By 2028, fresh narratives could bring investors back, but many might only start accumulating when OGs are distributing.
I made a similar interpretation in 2022, when many doubted BTC could fall below $20K. The ensuing apathy created opportunities for patient investors.
Yes, LLMs have changed search behavior, so these attention metrics need context. But together, they still tell a compelling story.
I build in crypto and believe in its long-term future. That does not mean ignoring bearish data or confusing personal conviction with market reality.
Now is the time for resilience, patience and intelligent accumulation.
The biggest opportunities often form when almost nobody is paying attention.
Charts: Alphractal
Many are free.
80
·
--
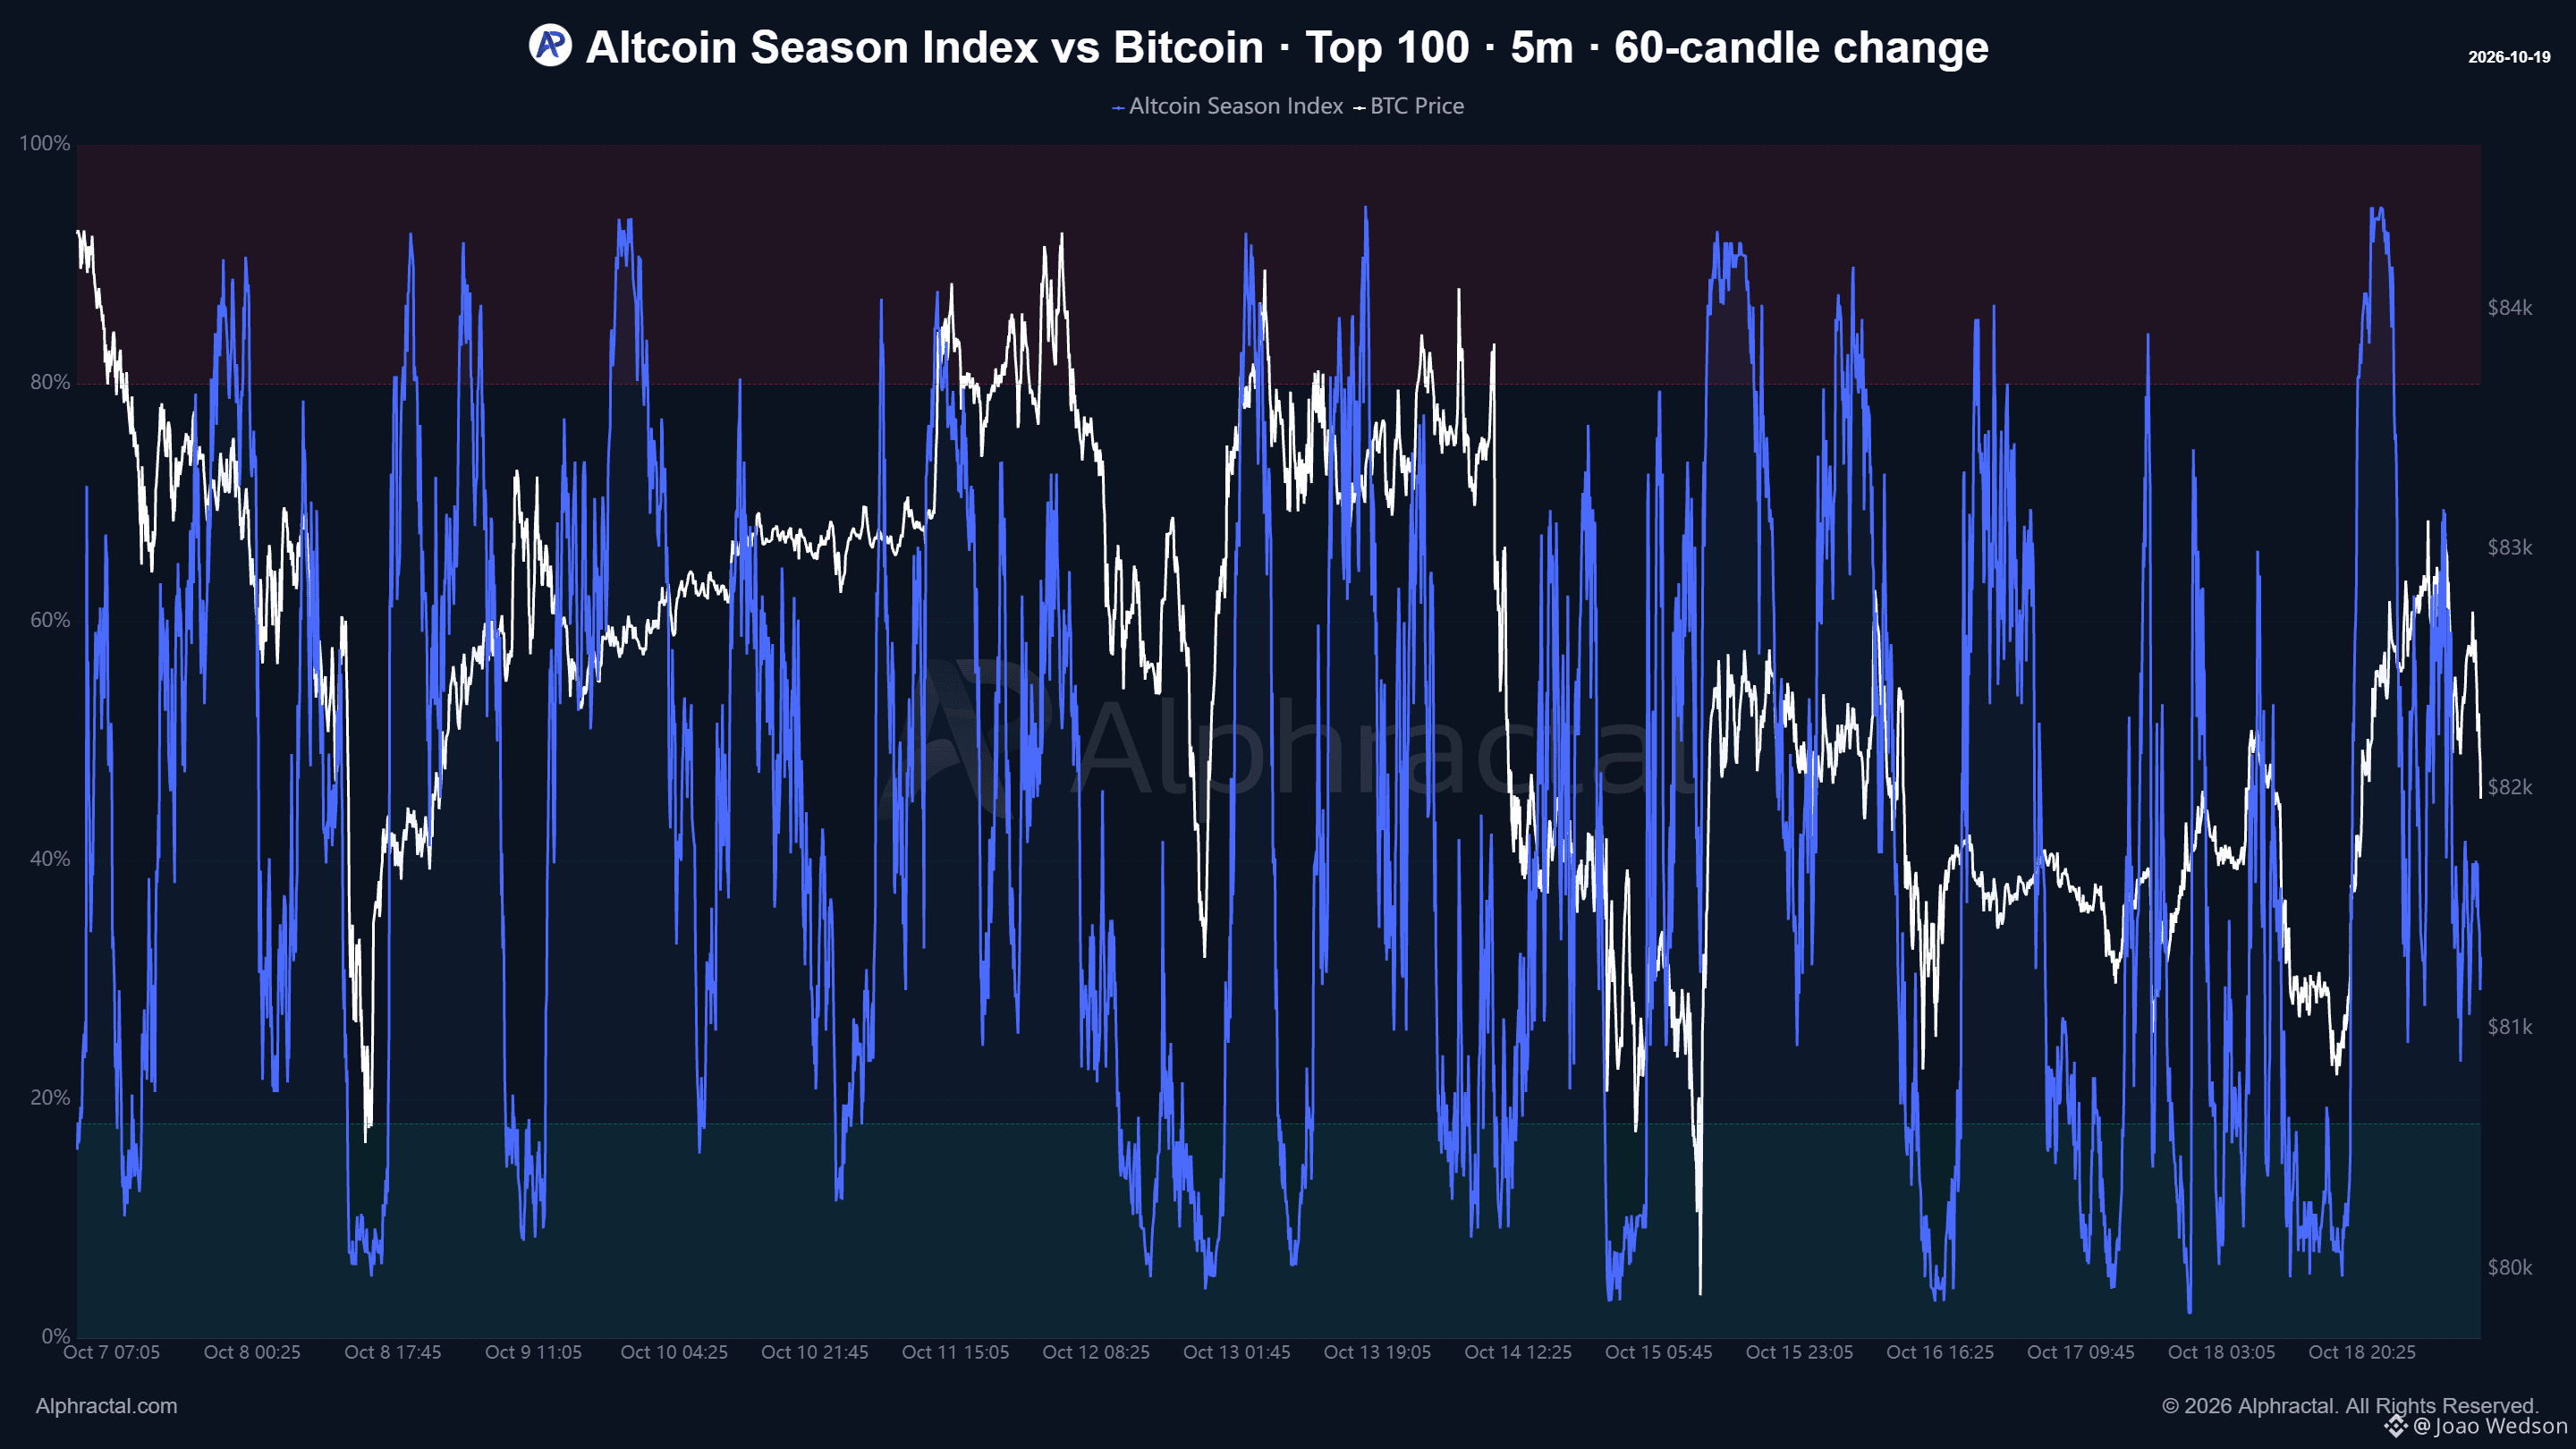
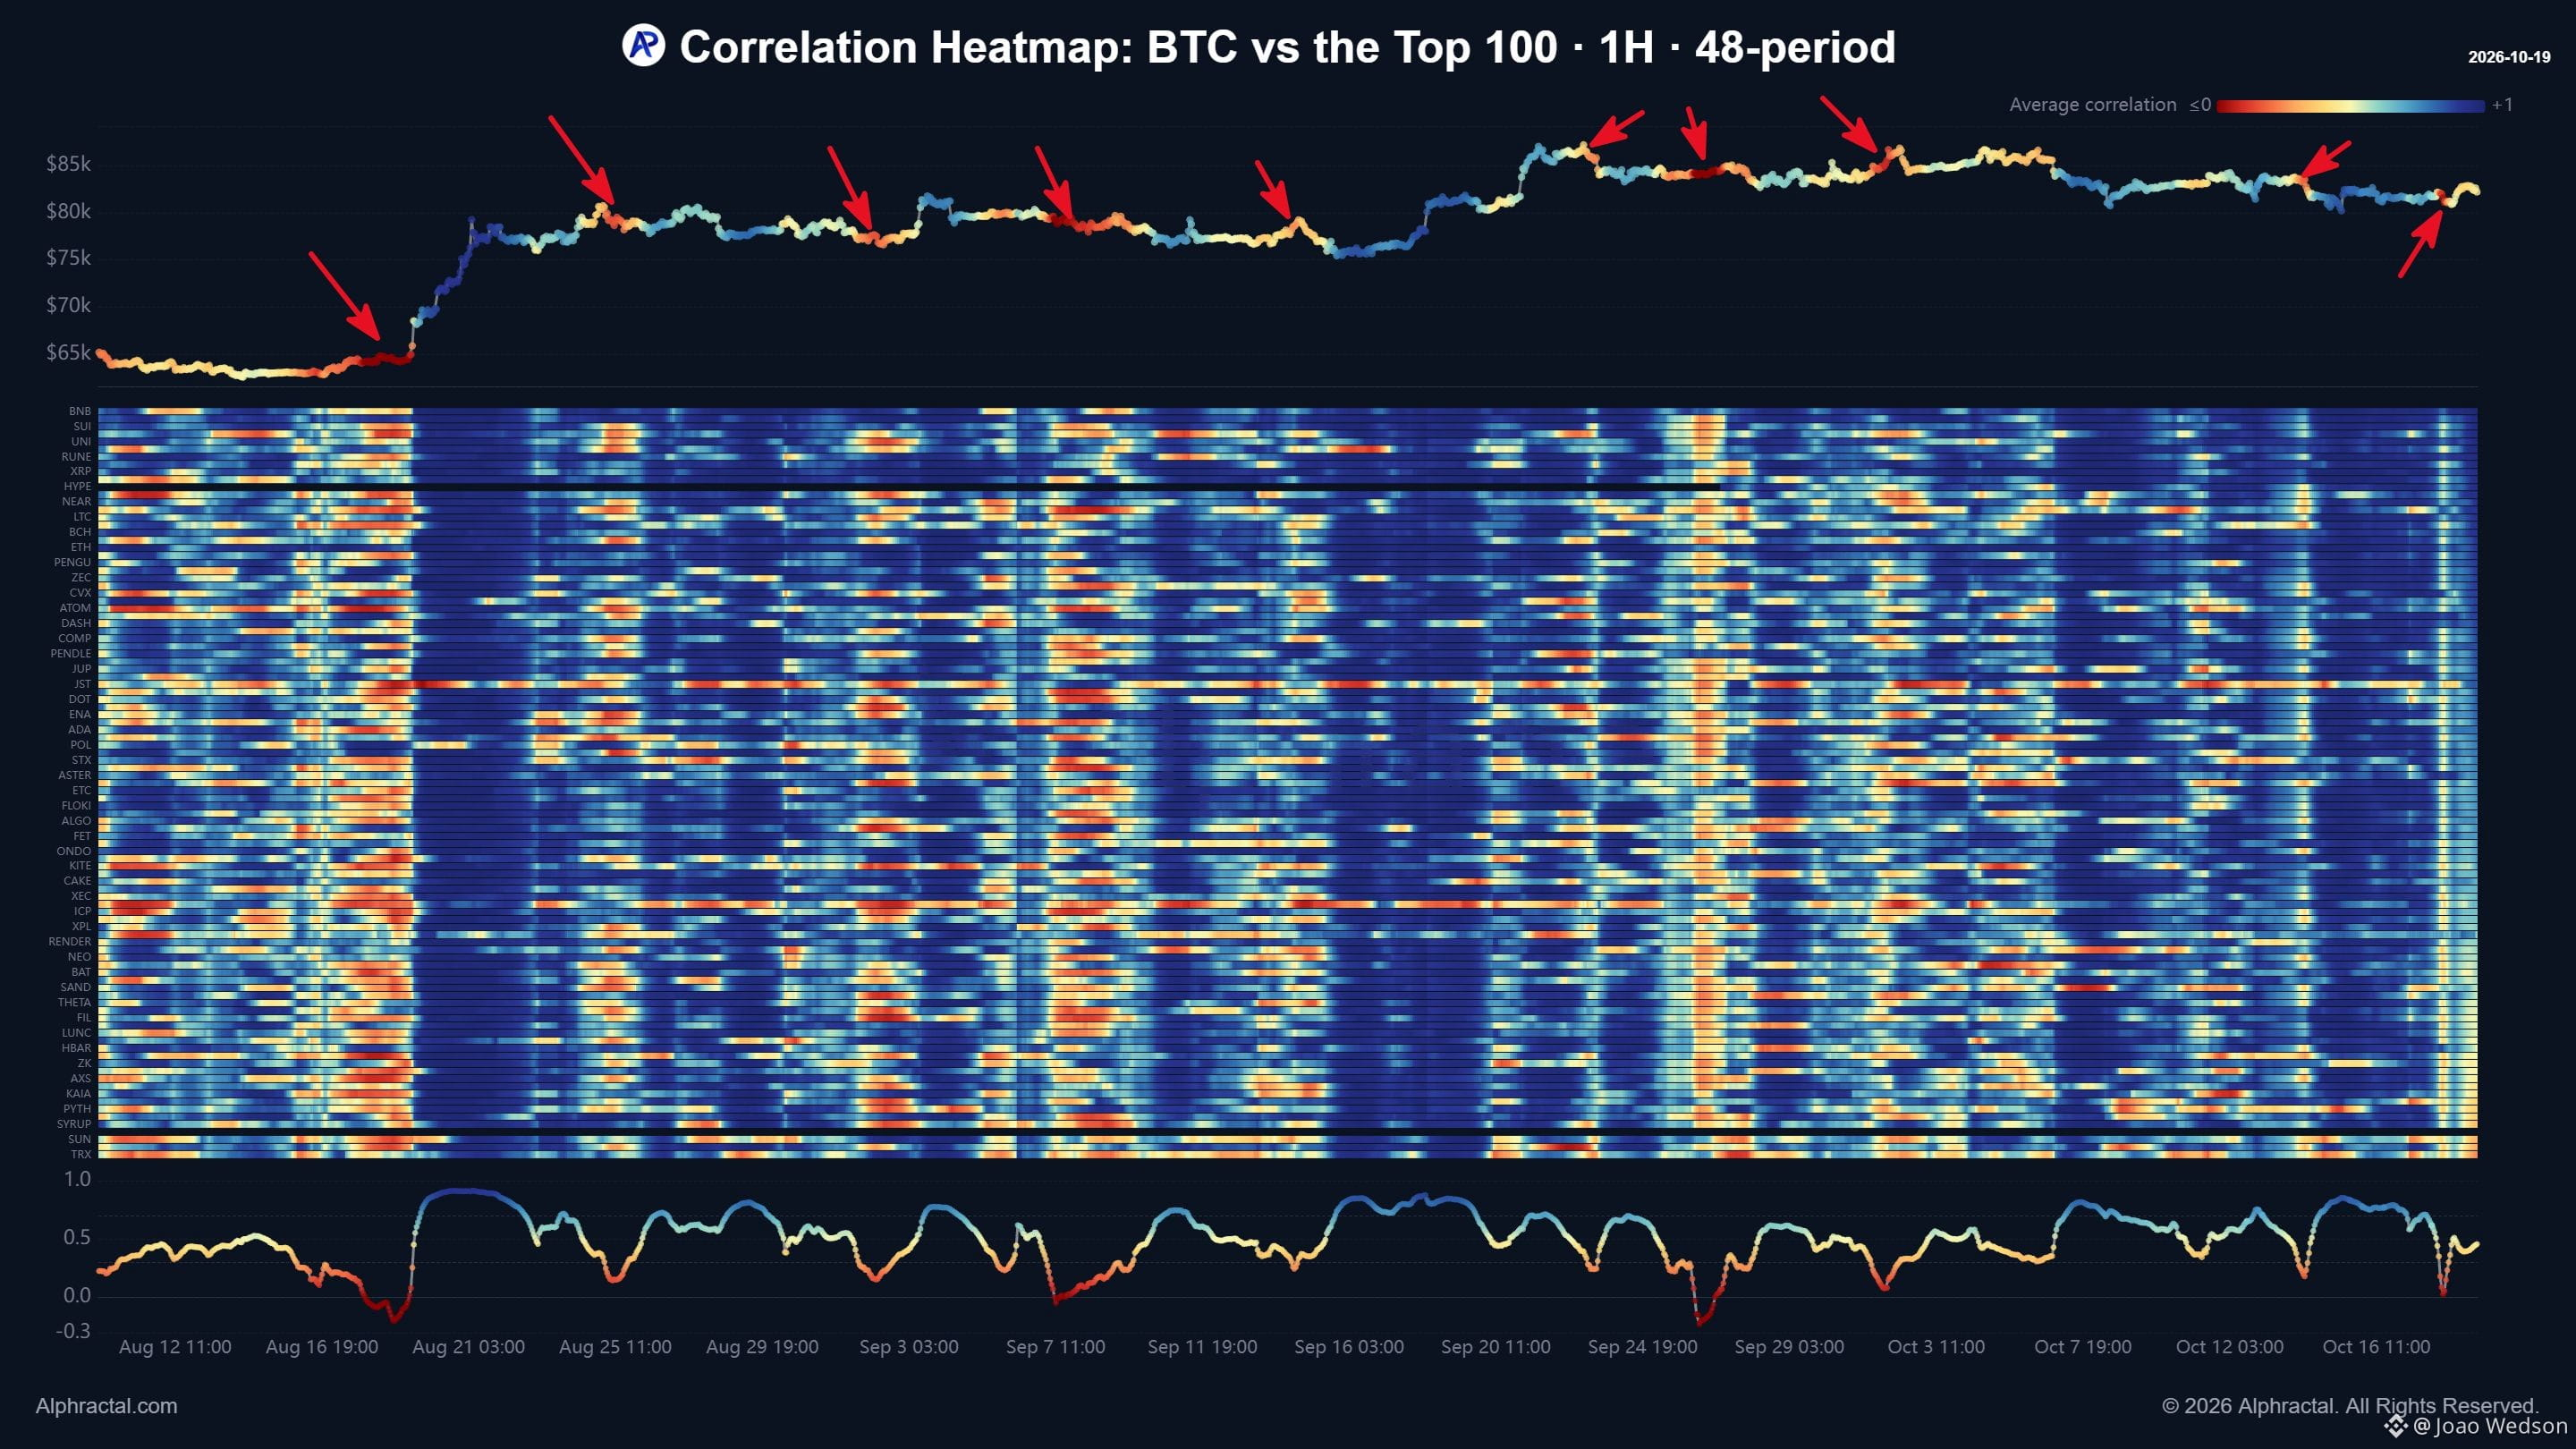
Один из способов предугадать сильную волатильность на крипторынке — проанализировать корреляцию биткоина с крупнейшими альткоинами. Посмотрите, что происходит, когда альткоины перестают следовать за движением цены биткоина, и как вскоре после этого реагирует рынок! Такие моменты случаются довольно редко. В данном случае я использовал часовой таймфрейм и скользящее окно корреляции в 48 часов, чтобы измерить взаимосвязь за последние два дня. Обычно это происходит, когда альткоины падают, а биткоин растёт, или когда альткоины растут, а биткоин падает. Такие расхождения часто служат предупреждением о масштабных ликвидациях! Alphractal теперь — одна из немногих платформ, где можно изучать подобные графики на любых таймфреймах, начиная с одной минуты, а также пользоваться такими индикаторами, как индекс сезона альткоинов! #Bitcoin $BTC
Один из способов предугадать сильную волатильность на крипторынке — проанализировать корреляцию биткоина с крупнейшими альткоинами. Посмотрите, что происходит, когда альткоины перестают следовать за движением цены биткоина, и как вскоре после этого реагирует рынок! Такие моменты случаются довольно редко. В данном случае я использовал часовой таймфрейм и скользящее окно корреляции в 48 часов, чтобы измерить взаимосвязь за последние два дня. Обычно это происходит, когда альткоины падают, а биткоин растёт, или когда альткоины растут, а биткоин падает. Такие расхождения часто служат предупреждением о масштабных ликвидациях! Alphractal теперь — одна из немногих платформ, где можно изучать подобные графики на любых таймфреймах, начиная с одной минуты, а также пользоваться такими индикаторами, как индекс сезона альткоинов! #Bitcoin $BTC
74
·
--
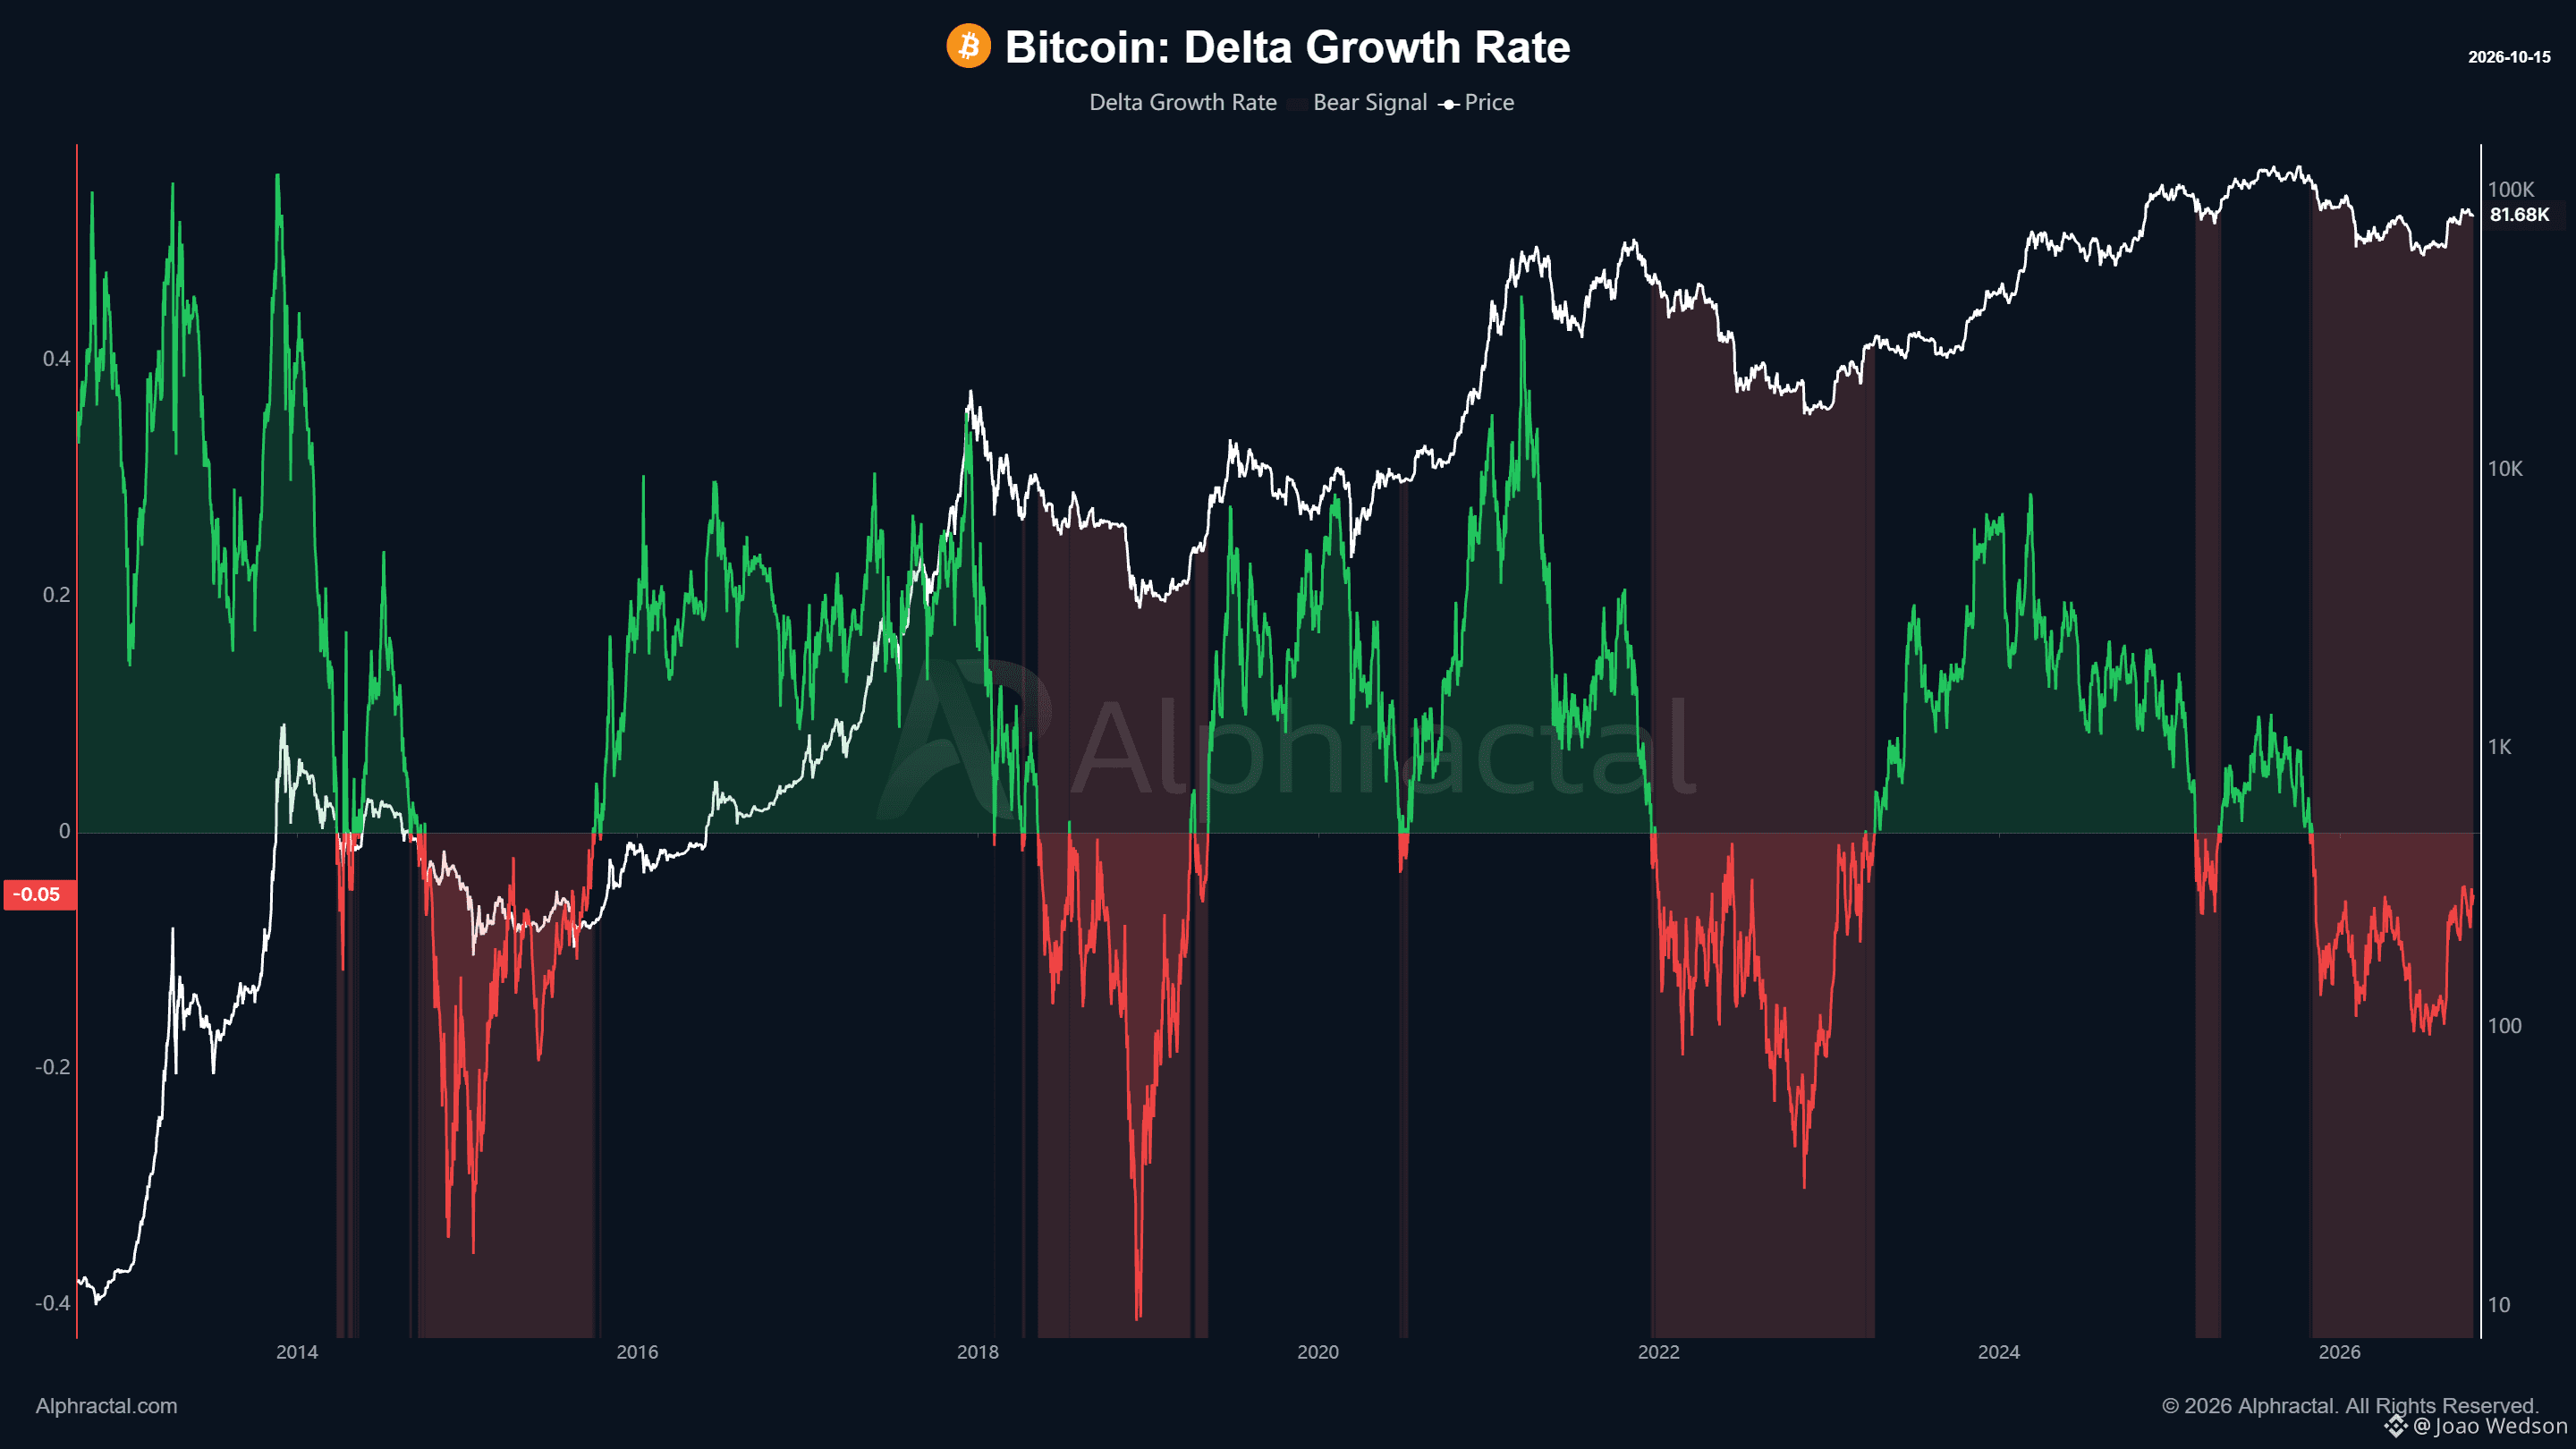
Биткоин: темп роста дельты демонстрирует признаки восстановления! Темп роста дельты — это показатель, объединяющий рост рыночной капитализации и реализованной капитализации. Он помогает выявлять расхождения между ростом цены биткоина и накоплением ончейн-ценности. Исторически отрицательные значения были связаны с периодами снижения спекулятивной активности, накопления и потенциальной недооценённости. **Сейчас показатель остаётся в отрицательной зоне, но с июля 2026 года восстанавливается!** Это движение указывает на постепенное улучшение рыночной динамики, хотя его пока недостаточно, чтобы подтвердить структурный разворот тренда. Главный вопрос сейчас: будет ли это восстановление достаточно сильным, чтобы вернуть темп роста дельты в положительную зону? Изучите этот и другие показатели на Alphractal $BTC #Bitcoin
Биткоин: темп роста дельты демонстрирует признаки восстановления! Темп роста дельты — это показатель, объединяющий рост рыночной капитализации и реализованной капитализации. Он помогает выявлять расхождения между ростом цены биткоина и накоплением ончейн-ценности. Исторически отрицательные значения были связаны с периодами снижения спекулятивной активности, накопления и потенциальной недооценённости. **Сейчас показатель остаётся в отрицательной зоне, но с июля 2026 года восстанавливается!** Это движение указывает на постепенное улучшение рыночной динамики, хотя его пока недостаточно, чтобы подтвердить структурный разворот тренда. Главный вопрос сейчас: будет ли это восстановление достаточно сильным, чтобы вернуть темп роста дельты в положительную зону? Изучите этот и другие показатели на Alphractal $BTC #Bitcoin
71
·
--
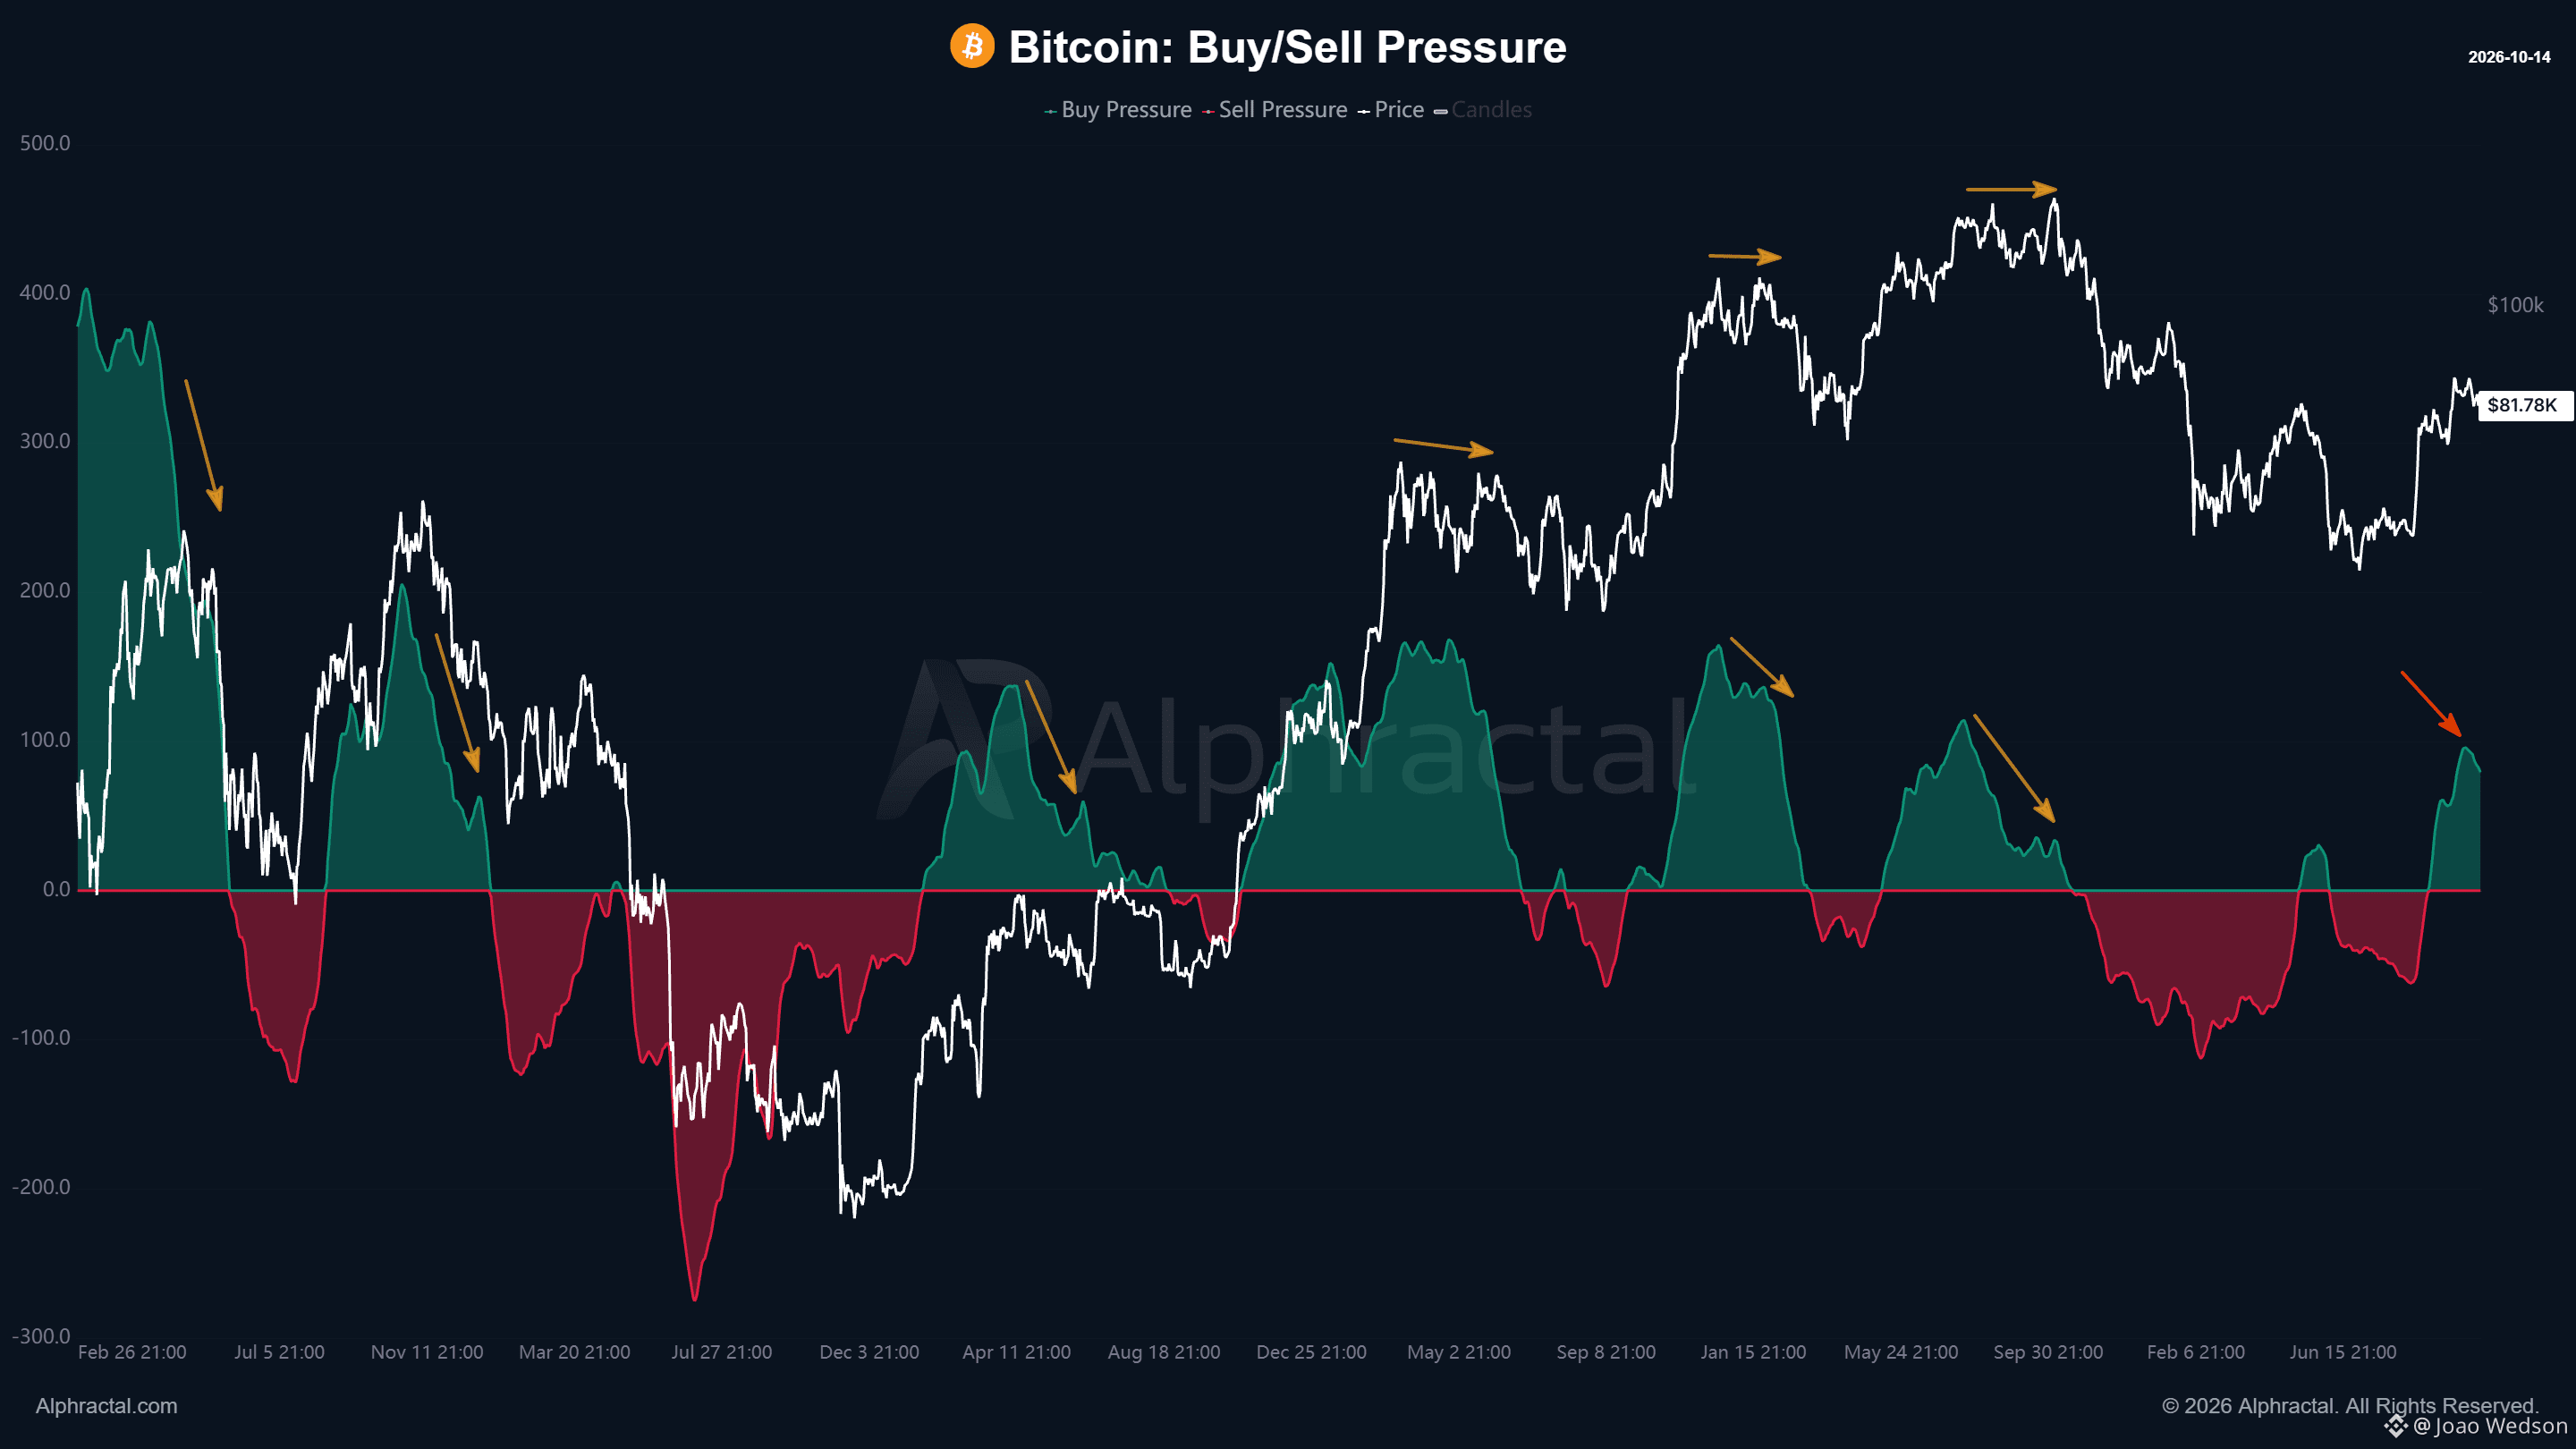
Дельта давления покупателей/продавцов Bitcoin показывает небольшое снижение давления покупателей! В медвежьем сценарии этот показатель обычно продолжает снижаться в течение нескольких дней и в итоге уходит в отрицательную зону. Интересно, что исторические данные показывают две повторяющиеся закономерности, когда дельта давления покупателей/продавцов перестаёт расти: 1. Цена Bitcoin начинает снижаться. 2. Bitcoin входит в фазу консолидации, формируя причинно-следственную структуру, которая в итоге может привести к более значительному падению цены. Это делает дельту давления покупателей/продавцов отличным индикатором для отслеживания бычьего импульса покупателей и определения момента, когда медведи начинают перехватывать контроль над рынком. Сейчас небольшое снижение давления покупателей не обязательно должно вызывать беспокойство. Однако крайне важно внимательно следить за этим показателем, особенно если давление продавцов начнёт усиливаться. Главный вопрос: быки просто теряют импульс или медведи готовятся перехватить контроль? Не ждите следующего движения рынка! Перейдите на платформу Alphractal и настройте оповещение, чтобы получать уведомления об усилении давления продавцов. Вы также можете использовать ChatGPT или Claude через нашу интеграцию MCP, чтобы настроить автоматический мониторинг и получать уведомления при появлении таких условий. Будьте на шаг впереди рынка. Доверьтесь данным. Alphractal $BTC
Дельта давления покупателей/продавцов Bitcoin показывает небольшое снижение давления покупателей! В медвежьем сценарии этот показатель обычно продолжает снижаться в течение нескольких дней и в итоге уходит в отрицательную зону. Интересно, что исторические данные показывают две повторяющиеся закономерности, когда дельта давления покупателей/продавцов перестаёт расти: 1. Цена Bitcoin начинает снижаться. 2. Bitcoin входит в фазу консолидации, формируя причинно-следственную структуру, которая в итоге может привести к более значительному падению цены. Это делает дельту давления покупателей/продавцов отличным индикатором для отслеживания бычьего импульса покупателей и определения момента, когда медведи начинают перехватывать контроль над рынком. Сейчас небольшое снижение давления покупателей не обязательно должно вызывать беспокойство. Однако крайне важно внимательно следить за этим показателем, особенно если давление продавцов начнёт усиливаться. Главный вопрос: быки просто теряют импульс или медведи готовятся перехватить контроль? Не ждите следующего движения рынка! Перейдите на платформу Alphractal и настройте оповещение, чтобы получать уведомления об усилении давления продавцов. Вы также можете использовать ChatGPT или Claude через нашу интеграцию MCP, чтобы настроить автоматический мониторинг и получать уведомления при появлении таких условий. Будьте на шаг впереди рынка. Доверьтесь данным. Alphractal $BTC
72
·
--
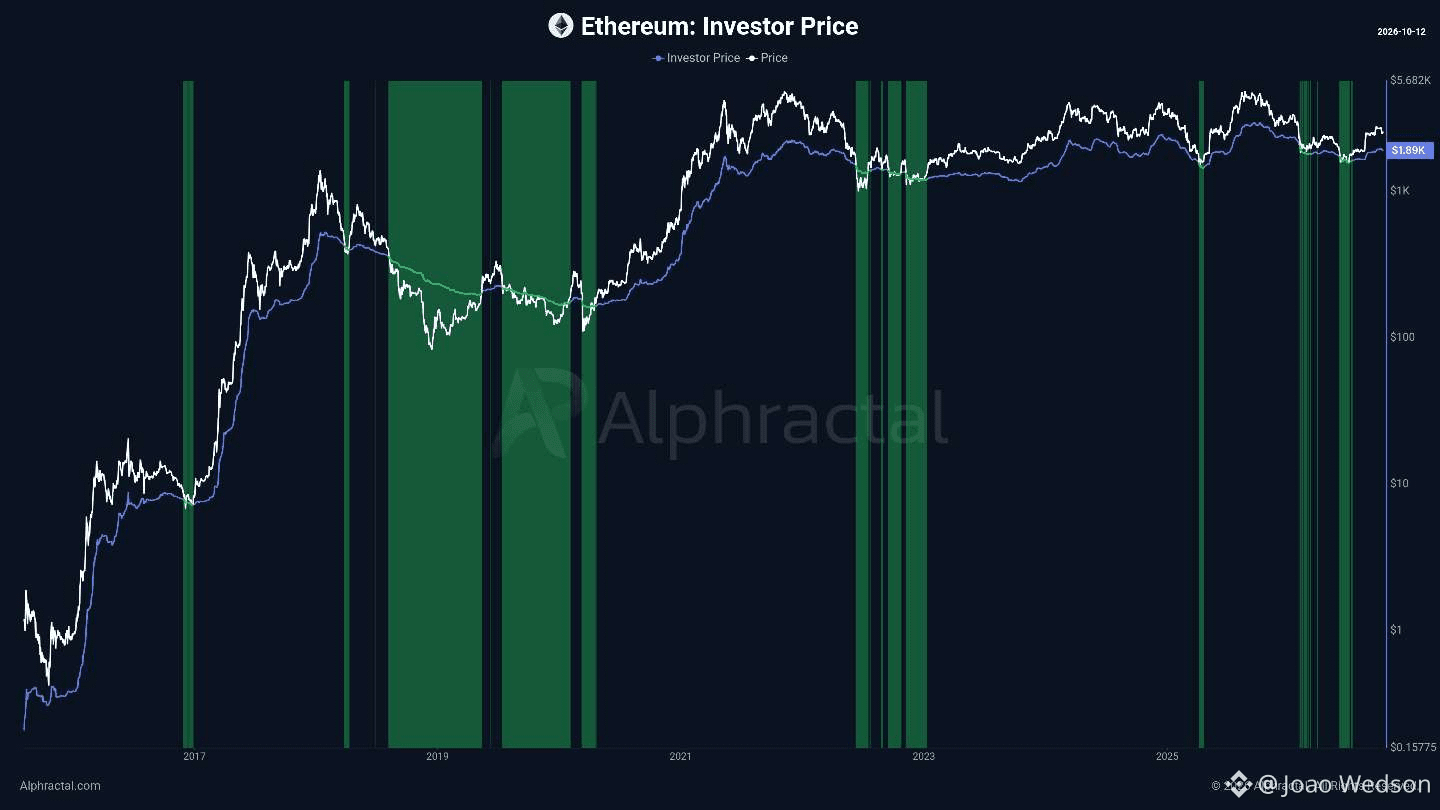
Ethereum (ETH): важный ончейн-уровень, за которым стоит следить!
Если вы ещё не покупали Ethereum, внимательно следите за ончейн-метриками, такими как цена инвестора.
Если ETH подвергнется очередной коррекции, эта метрика поможет определить потенциальную зону накопления и важный долгосрочный уровень поддержки.
Что такое цена инвестора?
Это средняя цена приобретения экономически циркулирующих ETH, за исключением монет, которые считаются безвозвратно утраченными.
Эта метрика рассчитывается путём деления капитализации инвесторов на скорректированное предложение и даёт более точное представление о совокупной себестоимости активов на рынке, уменьшая искажения, присущие традиционным моделям реализованной цены.
Хотя ни одна метрика не гарантирует, что рынок достиг дна, цена инвестора может дать ценную информацию при оценке потенциальных возможностей для покупки.
Установите ценовые оповещения и позвольте данным направлять ваши решения.
Узнайте больше на Alphractal. com
Ethereum (ETH): важный ончейн-уровень, за которым стоит следить!
Если вы ещё не покупали Ethereum, внимательно следите за ончейн-метриками, такими как цена инвестора.
Если ETH подвергнется очередной коррекции, эта метрика поможет определить потенциальную зону накопления и важный долгосрочный уровень поддержки.
Что такое цена инвестора?
Это средняя цена приобретения экономически циркулирующих ETH, за исключением монет, которые считаются безвозвратно утраченными.
Эта метрика рассчитывается путём деления капитализации инвесторов на скорректированное предложение и даёт более точное представление о совокупной себестоимости активов на рынке, уменьшая искажения, присущие традиционным моделям реализованной цены.
Хотя ни одна метрика не гарантирует, что рынок достиг дна, цена инвестора может дать ценную информацию при оценке потенциальных возможностей для покупки.
Установите ценовые оповещения и позвольте данным направлять ваши решения.
Узнайте больше на Alphractal. com
Если вы ещё не покупали Ethereum, внимательно следите за ончейн-метриками, такими как цена инвестора.
Если ETH подвергнется очередной коррекции, эта метрика поможет определить потенциальную зону накопления и важный долгосрочный уровень поддержки.
Что такое цена инвестора?
Это средняя цена приобретения экономически циркулирующих ETH, за исключением монет, которые считаются безвозвратно утраченными.
Эта метрика рассчитывается путём деления капитализации инвесторов на скорректированное предложение и даёт более точное представление о совокупной себестоимости активов на рынке, уменьшая искажения, присущие традиционным моделям реализованной цены.
Хотя ни одна метрика не гарантирует, что рынок достиг дна, цена инвестора может дать ценную информацию при оценке потенциальных возможностей для покупки.
Установите ценовые оповещения и позвольте данным направлять ваши решения.
Узнайте больше на Alphractal. com
73
·
--
Чистый поток биткоинов на биржи, рассчитанный по 30-дневной скользящей средней, остаётся глубоко отрицательным. Это указывает на то, что в последнее время с бирж выводят больше BTC, чем туда переводят. Отрицательный чистый поток не следует считать прямым сигналом роста цены. Однако устойчивый отток с бирж — важный фундаментальный показатель. Он говорит о том, что значительное количество биткоинов выводится с бирж, возможно, для самостоятельного хранения или долгосрочного владения, из-за чего объём BTC, непосредственно доступных для торговли, сокращается. Даже после значительной волатильности рынка инвесторы продолжают выводить биткоины с бирж. Это не определяет краткосрочное направление цены, но остаётся важным признаком долгосрочной уверенности в биткоине. $BTC
Чистый поток биткоинов на биржи, рассчитанный по 30-дневной скользящей средней, остаётся глубоко отрицательным. Это указывает на то, что в последнее время с бирж выводят больше BTC, чем туда переводят. Отрицательный чистый поток не следует считать прямым сигналом роста цены. Однако устойчивый отток с бирж — важный фундаментальный показатель. Он говорит о том, что значительное количество биткоинов выводится с бирж, возможно, для самостоятельного хранения или долгосрочного владения, из-за чего объём BTC, непосредственно доступных для торговли, сокращается. Даже после значительной волатильности рынка инвесторы продолжают выводить биткоины с бирж. Это не определяет краткосрочное направление цены, но остаётся важным признаком долгосрочной уверенности в биткоине. $BTC
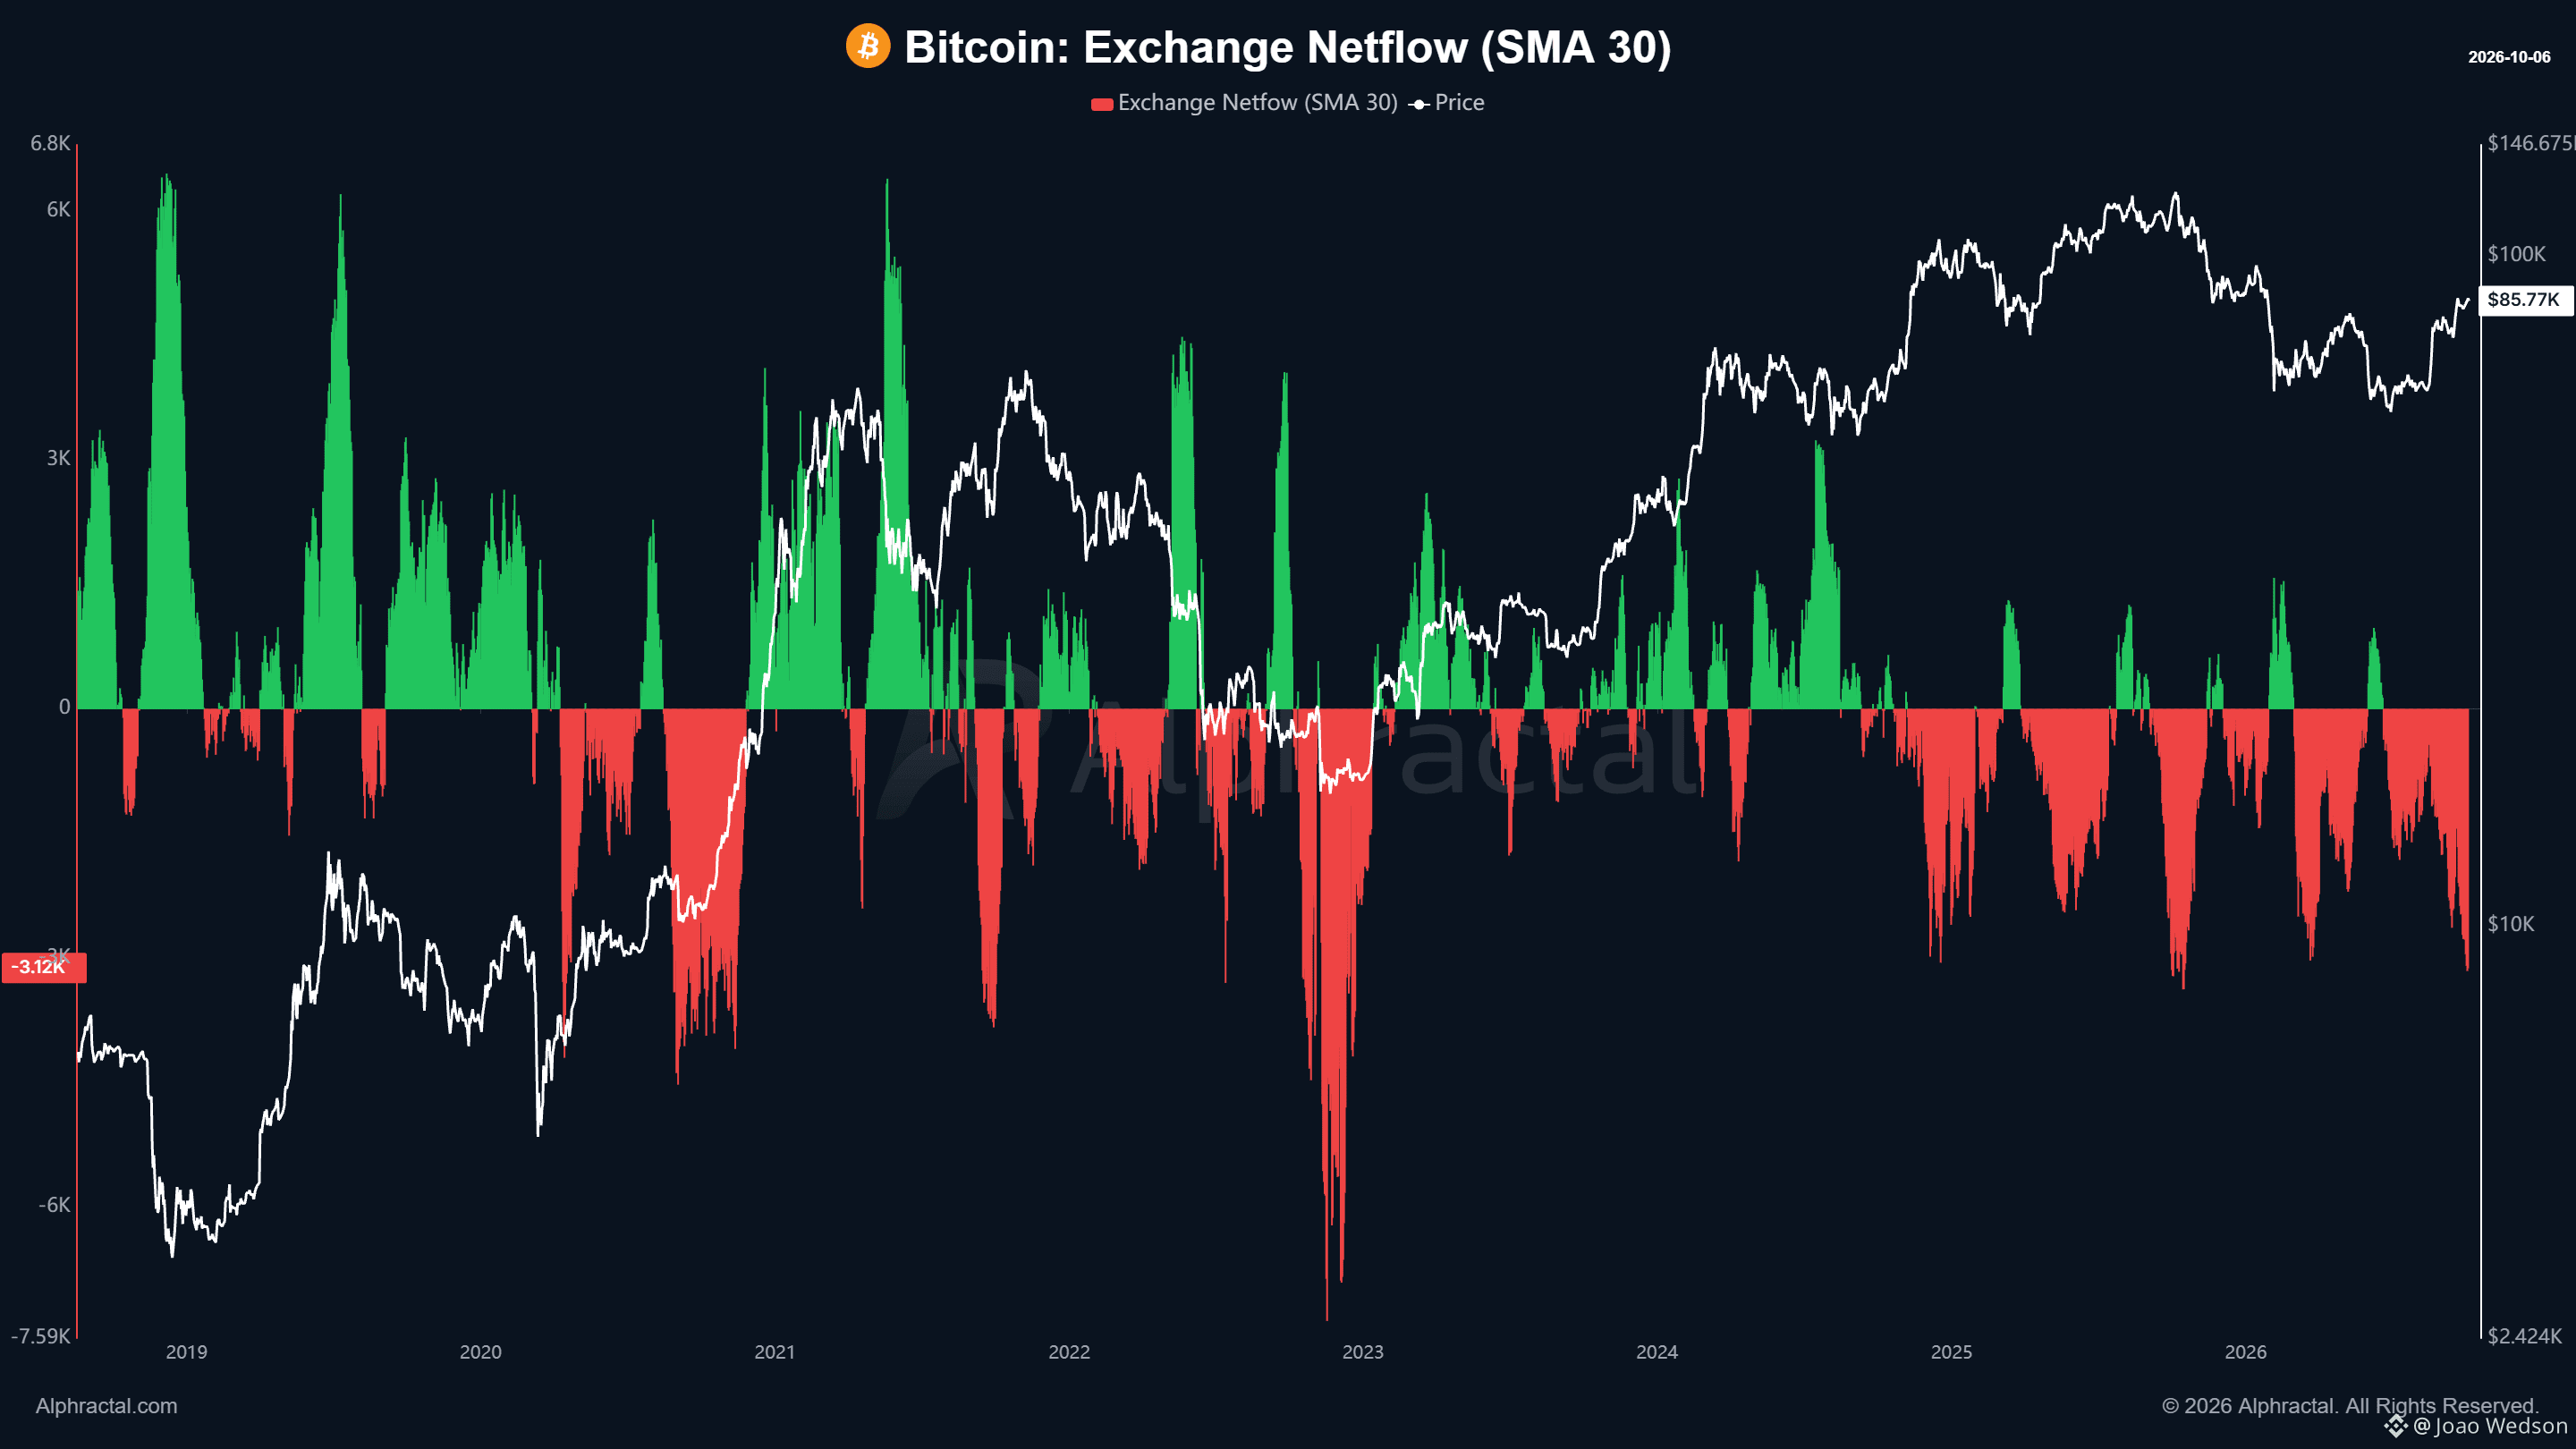
68
·
--
⚠️Интерес к криптовалютам в поиске Google упал до самого низкого уровня с 2024 года.
Это отражает более широкий спад внимания розничных инвесторов по всему рынку. Снижение интереса также заметно на YouTube, X, в криптовалютных СМИ, на биржах, агрегаторах вроде CoinMarketCap и CoinGecko, а также на аналитических платформах, таких как TradingView.
Для авторов контента такая ситуация обычно означает снижение охватов и вовлечённости. Для платформ и бирж — меньше пользователей, которые активно ищут информацию, торгуют и изучают рынок.
Такие периоды — настоящее испытание на устойчивость розничных инвесторов.
Когда внимание всего мира угасает, оставаться активным становится сложнее. Но исторически рынок интересен не только тогда, когда цены растут, а вовлечённость высока.
Порой самые важные периоды — именно те, когда внимание привлекает меньше людей.
Воспользуйтесь купоном Alphractal со скидкой 50%
Источник: Alphractal
$BTC $ETH $XRP $SOL $HYPE
⚠️Интерес к криптовалютам в поиске Google упал до самого низкого уровня с 2024 года.
Это отражает более широкий спад внимания розничных инвесторов по всему рынку. Снижение интереса также заметно на YouTube, X, в криптовалютных СМИ, на биржах, агрегаторах вроде CoinMarketCap и CoinGecko, а также на аналитических платформах, таких как TradingView.
Для авторов контента такая ситуация обычно означает снижение охватов и вовлечённости. Для платформ и бирж — меньше пользователей, которые активно ищут информацию, торгуют и изучают рынок.
Такие периоды — настоящее испытание на устойчивость розничных инвесторов.
Когда внимание всего мира угасает, оставаться активным становится сложнее. Но исторически рынок интересен не только тогда, когда цены растут, а вовлечённость высока.
Порой самые важные периоды — именно те, когда внимание привлекает меньше людей.
Воспользуйтесь купоном Alphractal со скидкой 50%
Источник: Alphractal
$BTC $ETH $XRP $SOL $HYPE
Это отражает более широкий спад внимания розничных инвесторов по всему рынку. Снижение интереса также заметно на YouTube, X, в криптовалютных СМИ, на биржах, агрегаторах вроде CoinMarketCap и CoinGecko, а также на аналитических платформах, таких как TradingView.
Для авторов контента такая ситуация обычно означает снижение охватов и вовлечённости. Для платформ и бирж — меньше пользователей, которые активно ищут информацию, торгуют и изучают рынок.
Такие периоды — настоящее испытание на устойчивость розничных инвесторов.
Когда внимание всего мира угасает, оставаться активным становится сложнее. Но исторически рынок интересен не только тогда, когда цены растут, а вовлечённость высока.
Порой самые важные периоды — именно те, когда внимание привлекает меньше людей.
Воспользуйтесь купоном Alphractal со скидкой 50%
Источник: Alphractal
$BTC $ETH $XRP $SOL $HYPE
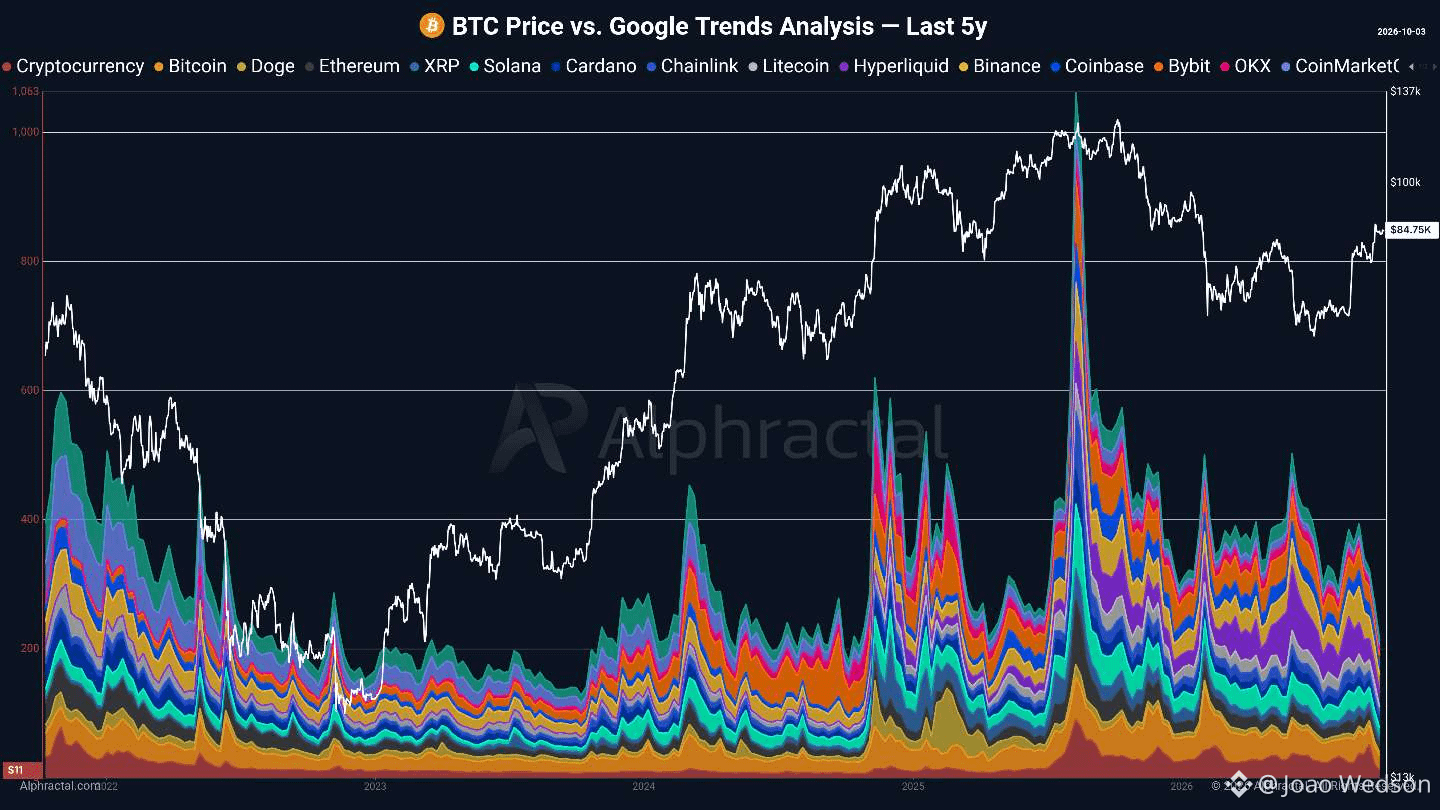
75
Войдите, чтобы посмотреть больше материала
Присоединяйтесь к пользователям криптовалют по всему миру на Binance Square
⚡️ Получайте новейшую и полезную информацию о криптоактивах.
💬 Нам доверяет крупнейшая в мире криптобиржа.
👍 Получите достоверные аналитические данные от верифицированных создателей контента.
Эл. почта/номер телефона
В тренде
IsAnthropic’s$1.5TMarketCapJustified?
Просмотров: 62,775
325 обсуждают
Акции Anthropic откроются по 105 долларов в рекордном дебюте на Nasdaq
Binance News
·Лайков: 16
·Просмотров: 18.8k
BTCBelow$62KAmidHikeFearsAndShiftToAnthropic
Просмотров: 20,381
122 обсуждают
TradFiForBeginners
Просмотров: 946,825
5,078 обсуждают