

Zerionix
471 Публикации

Zerionix
Отправить жалобу
Заблокировать пользователя
Crypto Researcher • Market Structure • Data > Hype • Daily updates → NFA
0 подписок(и/а)
12 подписчиков(а)
65 понравилось
Посты
·
--
См. перевод
Zcash is making a serious comeback, but the interesting part isn't just the price.
$ZEC has pushed above $1,650, while 21Shares has launched Europe's first physically backed Zcash ETP on Euronext Amsterdam and Paris, giving traditional brokerage investors direct exposure without holding ZEC themselves.
At the same time, roughly 29% of ZEC supply is now sitting in shielded pools, according to current network data.
That creates an interesting three-part narrative:
Price momentum + regulated access + increasing shielded supply.
The ETP matters because privacy assets have historically faced a much narrower distribution channel than BTC or ETH. A physically backed European product gives traditional investors another route into ZEC.
But the shielded supply statistic might be even more interesting.
If more ZEC moves into shielded pools, more of the circulating supply becomes less transparent onchain. That doesn't automatically mean those coins are permanently unavailable, but it does change the liquidity picture.
And that's where this rally gets interesting.
Zcash isn't just being repriced as an old privacy coin.
The market is increasingly testing whether privacy itself can become an institutional investment thesis.
The next question is whether this demand can sustain the move after the initial ETP launch excitement fades.
$ZEC #BTC Price Analysis# #BNBChain# #BNBChain#
Zcash is making a serious comeback, but the interesting part isn't just the price.
$ZEC has pushed above $1,650, while 21Shares has launched Europe's first physically backed Zcash ETP on Euronext Amsterdam and Paris, giving traditional brokerage investors direct exposure without holding ZEC themselves.
At the same time, roughly 29% of ZEC supply is now sitting in shielded pools, according to current network data.
That creates an interesting three-part narrative:
Price momentum + regulated access + increasing shielded supply.
The ETP matters because privacy assets have historically faced a much narrower distribution channel than BTC or ETH. A physically backed European product gives traditional investors another route into ZEC.
But the shielded supply statistic might be even more interesting.
If more ZEC moves into shielded pools, more of the circulating supply becomes less transparent onchain. That doesn't automatically mean those coins are permanently unavailable, but it does change the liquidity picture.
And that's where this rally gets interesting.
Zcash isn't just being repriced as an old privacy coin.
The market is increasingly testing whether privacy itself can become an institutional investment thesis.
The next question is whether this demand can sustain the move after the initial ETP launch excitement fades.
$ZEC #BTC Price Analysis# #BNBChain# #BNBChain#
$ZEC has pushed above $1,650, while 21Shares has launched Europe's first physically backed Zcash ETP on Euronext Amsterdam and Paris, giving traditional brokerage investors direct exposure without holding ZEC themselves.
At the same time, roughly 29% of ZEC supply is now sitting in shielded pools, according to current network data.
That creates an interesting three-part narrative:
Price momentum + regulated access + increasing shielded supply.
The ETP matters because privacy assets have historically faced a much narrower distribution channel than BTC or ETH. A physically backed European product gives traditional investors another route into ZEC.
But the shielded supply statistic might be even more interesting.
If more ZEC moves into shielded pools, more of the circulating supply becomes less transparent onchain. That doesn't automatically mean those coins are permanently unavailable, but it does change the liquidity picture.
And that's where this rally gets interesting.
Zcash isn't just being repriced as an old privacy coin.
The market is increasingly testing whether privacy itself can become an institutional investment thesis.
The next question is whether this demand can sustain the move after the initial ETP launch excitement fades.
$ZEC #BTC Price Analysis# #BNBChain# #BNBChain#
21
·
--
См. перевод
Forward Industries is putting another $25M behind its Solana treasury strategy.
The Nasdaq listed company agreed to sell 3.125M shares at $8 each to an institutional investor, with the gross proceeds expected to reach roughly $25M. The net proceeds are earmarked for buying more SOL.
The interesting part is the metric Forward is emphasizing.
It doesn't just want to increase the number of SOL it holds. It says the transaction is intended to increase SOL per fully diluted share.
That's important because issuing new shares normally creates dilution. The strategy only makes sense for existing shareholders if the additional SOL acquired offsets that dilution on a per share basis.
And Forward is already operating at significant scale.
As of September 21, it reported approximately 8.16M SOL and SOL equivalents, representing about 1.39% of Solana's circulating supply.
So this isn't simply another company buying a little SOL for its balance sheet.
It's becoming a capital markets strategy:
raise equity → buy SOL → increase treasury → stake it → measure SOL per share.
The bigger question is whether public markets continue providing Forward with capital at terms that make that loop accretive.
Because once a company starts measuring itself in SOL per share instead of dollars per share, the entire treasury strategy starts looking very different.
#Macro Insights# #BTC Price Analysis# #Meme Alpha# $SOL
Forward Industries is putting another $25M behind its Solana treasury strategy.
The Nasdaq listed company agreed to sell 3.125M shares at $8 each to an institutional investor, with the gross proceeds expected to reach roughly $25M. The net proceeds are earmarked for buying more SOL.
The interesting part is the metric Forward is emphasizing.
It doesn't just want to increase the number of SOL it holds. It says the transaction is intended to increase SOL per fully diluted share.
That's important because issuing new shares normally creates dilution. The strategy only makes sense for existing shareholders if the additional SOL acquired offsets that dilution on a per share basis.
And Forward is already operating at significant scale.
As of September 21, it reported approximately 8.16M SOL and SOL equivalents, representing about 1.39% of Solana's circulating supply.
So this isn't simply another company buying a little SOL for its balance sheet.
It's becoming a capital markets strategy:
raise equity → buy SOL → increase treasury → stake it → measure SOL per share.
The bigger question is whether public markets continue providing Forward with capital at terms that make that loop accretive.
Because once a company starts measuring itself in SOL per share instead of dollars per share, the entire treasury strategy starts looking very different.
#Macro Insights# #BTC Price Analysis# #Meme Alpha# $SOL
The Nasdaq listed company agreed to sell 3.125M shares at $8 each to an institutional investor, with the gross proceeds expected to reach roughly $25M. The net proceeds are earmarked for buying more SOL.
The interesting part is the metric Forward is emphasizing.
It doesn't just want to increase the number of SOL it holds. It says the transaction is intended to increase SOL per fully diluted share.
That's important because issuing new shares normally creates dilution. The strategy only makes sense for existing shareholders if the additional SOL acquired offsets that dilution on a per share basis.
And Forward is already operating at significant scale.
As of September 21, it reported approximately 8.16M SOL and SOL equivalents, representing about 1.39% of Solana's circulating supply.
So this isn't simply another company buying a little SOL for its balance sheet.
It's becoming a capital markets strategy:
raise equity → buy SOL → increase treasury → stake it → measure SOL per share.
The bigger question is whether public markets continue providing Forward with capital at terms that make that loop accretive.
Because once a company starts measuring itself in SOL per share instead of dollars per share, the entire treasury strategy starts looking very different.
#Macro Insights# #BTC Price Analysis# #Meme Alpha# $SOL

38
·
--
См. перевод
Uniswap is quietly having a serious month.
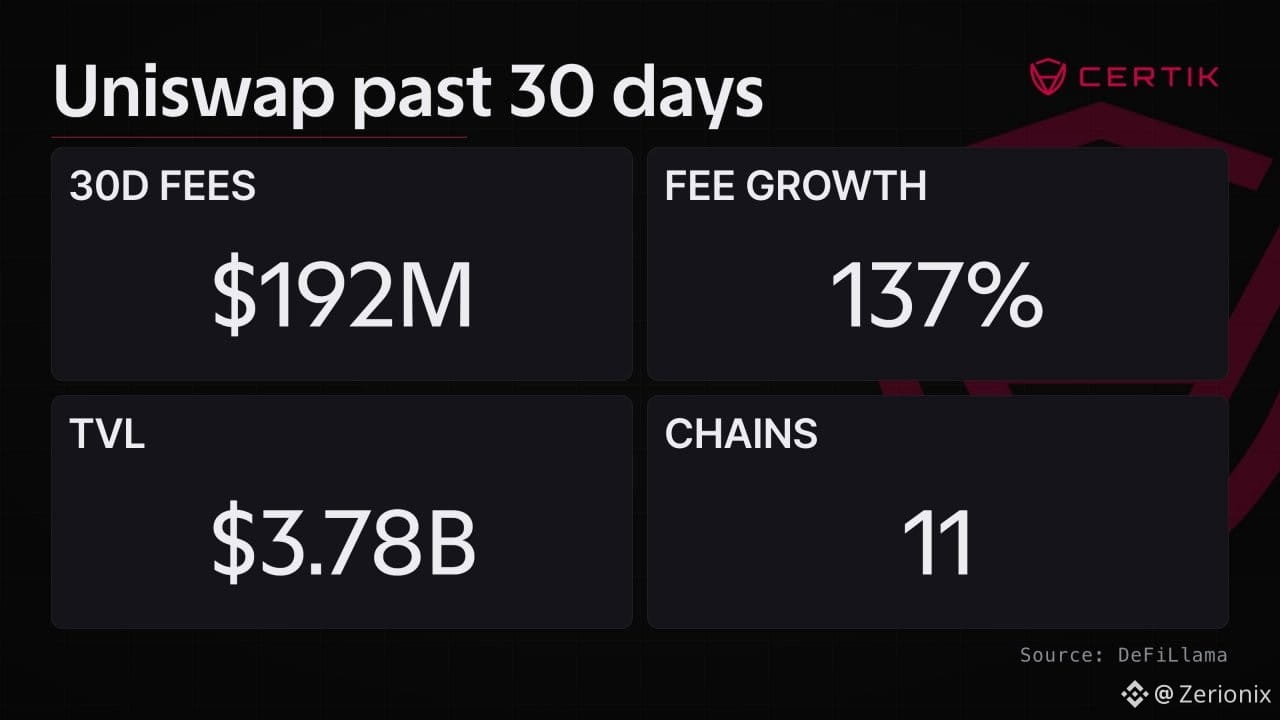
Uniswap generated roughly $192M in fees over the past 30 days, while TVL climbed around 15% to approximately $3.78B, according to the figures being reported from CertiK.
That combination is what caught my attention.
Fees rising this sharply while TVL is also expanding suggests this isn't simply idle capital sitting inside pools. There's meaningful trading activity happening across the protocol.
And Uniswap is no longer just an Ethereum story.
The protocol now operates across dozens of chains, with Ethereum still holding the largest share of liquidity. Recent expansion into networks like Robinhood Chain and Arc is also widening its potential addressable market.
Personally, I think the bigger story is what happens to this activity from here.
Uniswap has been pushing deeper into tokenized assets, permissioned pools, launch infrastructure and new fee mechanisms. If those products actually bring more trading volume onto the protocol, the current fee growth could become more than a temporary spike.
But there is a catch.
Fees are not the same as protocol revenue.
Current DeFiLlama data puts Uniswap's 30 day fees around $194M, but protocol revenue is much lower at roughly $15.9M.
So I'm less interested in the $192M headline by itself.
I want to see whether Uniswap can turn this massive trading activity into sustainable protocol revenue and stronger value capture for $UNI.
The liquidity is growing.
The activity is clearly there.
Now the question is whether the economics finally start flowing through to the token.
$UNI #BTC Price Analysis# $BTC #Altcoin Season#
Uniswap is quietly having a serious month.
Uniswap generated roughly $192M in fees over the past 30 days, while TVL climbed around 15% to approximately $3.78B, according to the figures being reported from CertiK.
That combination is what caught my attention.
Fees rising this sharply while TVL is also expanding suggests this isn't simply idle capital sitting inside pools. There's meaningful trading activity happening across the protocol.
And Uniswap is no longer just an Ethereum story.
The protocol now operates across dozens of chains, with Ethereum still holding the largest share of liquidity. Recent expansion into networks like Robinhood Chain and Arc is also widening its potential addressable market.
Personally, I think the bigger story is what happens to this activity from here.
Uniswap has been pushing deeper into tokenized assets, permissioned pools, launch infrastructure and new fee mechanisms. If those products actually bring more trading volume onto the protocol, the current fee growth could become more than a temporary spike.
But there is a catch.
Fees are not the same as protocol revenue.
Current DeFiLlama data puts Uniswap's 30 day fees around $194M, but protocol revenue is much lower at roughly $15.9M.
So I'm less interested in the $192M headline by itself.
I want to see whether Uniswap can turn this massive trading activity into sustainable protocol revenue and stronger value capture for $UNI.
The liquidity is growing.
The activity is clearly there.
Now the question is whether the economics finally start flowing through to the token.
$UNI #BTC Price Analysis# $BTC #Altcoin Season#
Uniswap generated roughly $192M in fees over the past 30 days, while TVL climbed around 15% to approximately $3.78B, according to the figures being reported from CertiK.
That combination is what caught my attention.
Fees rising this sharply while TVL is also expanding suggests this isn't simply idle capital sitting inside pools. There's meaningful trading activity happening across the protocol.
And Uniswap is no longer just an Ethereum story.
The protocol now operates across dozens of chains, with Ethereum still holding the largest share of liquidity. Recent expansion into networks like Robinhood Chain and Arc is also widening its potential addressable market.
Personally, I think the bigger story is what happens to this activity from here.
Uniswap has been pushing deeper into tokenized assets, permissioned pools, launch infrastructure and new fee mechanisms. If those products actually bring more trading volume onto the protocol, the current fee growth could become more than a temporary spike.
But there is a catch.
Fees are not the same as protocol revenue.
Current DeFiLlama data puts Uniswap's 30 day fees around $194M, but protocol revenue is much lower at roughly $15.9M.
So I'm less interested in the $192M headline by itself.
I want to see whether Uniswap can turn this massive trading activity into sustainable protocol revenue and stronger value capture for $UNI.
The liquidity is growing.
The activity is clearly there.
Now the question is whether the economics finally start flowing through to the token.
$UNI #BTC Price Analysis# $BTC #Altcoin Season#
59
·
--
См. перевод
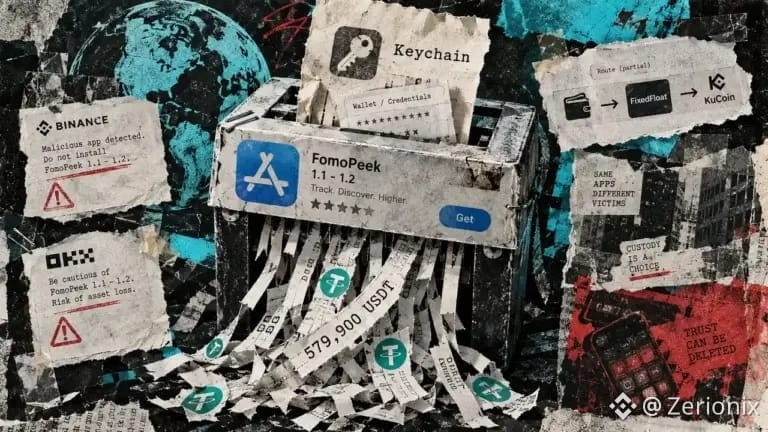
Amalicious iOS app just turned “read only” into a $580K crypto theft.
SlowMist says malicious versions of FomoPeek, an app distributed through Apple’s App Store, have been linked to roughly $580,000 in stolen USDT.
The scary part isn't that the app was pretending to be a wallet.
It was reportedly marketed as a read only crypto tracking tool.
Researchers found kernel exploits that could escape iOS's app sandbox and access sensitive data belonging to other apps, including Keychain data, private keys and seed phrases.
Versions 1.1 and 1.2, released September 9 and 12, contained the malicious components. Version 1.3, released September 17, removed them.
Personally, this is a good reminder that crypto security isn't just about what you sign.
Sometimes the biggest risk is what you install.
And the App Store label doesn't automatically mean an app is safe.
If someone installed an affected version, simply deleting the app shouldn't be treated as enough. If private keys or seed phrases were exposed, those credentials should be considered compromised and assets moved to a newly generated wallet from a clean device.
Crypto users spend so much time worrying about fake links and malicious transactions.
Meanwhile, the attack surface can literally be sitting inside your phone.
The wallet might be secure. The device running it is another story.
$BTC #BTC Price Analysis# #Altcoin Season# $SOL
Amalicious iOS app just turned “read only” into a $580K crypto theft.
SlowMist says malicious versions of FomoPeek, an app distributed through Apple’s App Store, have been linked to roughly $580,000 in stolen USDT.
The scary part isn't that the app was pretending to be a wallet.
It was reportedly marketed as a read only crypto tracking tool.
Researchers found kernel exploits that could escape iOS's app sandbox and access sensitive data belonging to other apps, including Keychain data, private keys and seed phrases.
Versions 1.1 and 1.2, released September 9 and 12, contained the malicious components. Version 1.3, released September 17, removed them.
Personally, this is a good reminder that crypto security isn't just about what you sign.
Sometimes the biggest risk is what you install.
And the App Store label doesn't automatically mean an app is safe.
If someone installed an affected version, simply deleting the app shouldn't be treated as enough. If private keys or seed phrases were exposed, those credentials should be considered compromised and assets moved to a newly generated wallet from a clean device.
Crypto users spend so much time worrying about fake links and malicious transactions.
Meanwhile, the attack surface can literally be sitting inside your phone.
The wallet might be secure. The device running it is another story.
$BTC #BTC Price Analysis# #Altcoin Season# $SOL
SlowMist says malicious versions of FomoPeek, an app distributed through Apple’s App Store, have been linked to roughly $580,000 in stolen USDT.
The scary part isn't that the app was pretending to be a wallet.
It was reportedly marketed as a read only crypto tracking tool.
Researchers found kernel exploits that could escape iOS's app sandbox and access sensitive data belonging to other apps, including Keychain data, private keys and seed phrases.
Versions 1.1 and 1.2, released September 9 and 12, contained the malicious components. Version 1.3, released September 17, removed them.
Personally, this is a good reminder that crypto security isn't just about what you sign.
Sometimes the biggest risk is what you install.
And the App Store label doesn't automatically mean an app is safe.
If someone installed an affected version, simply deleting the app shouldn't be treated as enough. If private keys or seed phrases were exposed, those credentials should be considered compromised and assets moved to a newly generated wallet from a clean device.
Crypto users spend so much time worrying about fake links and malicious transactions.
Meanwhile, the attack surface can literally be sitting inside your phone.
The wallet might be secure. The device running it is another story.
$BTC #BTC Price Analysis# #Altcoin Season# $SOL
70
·
--
См. перевод
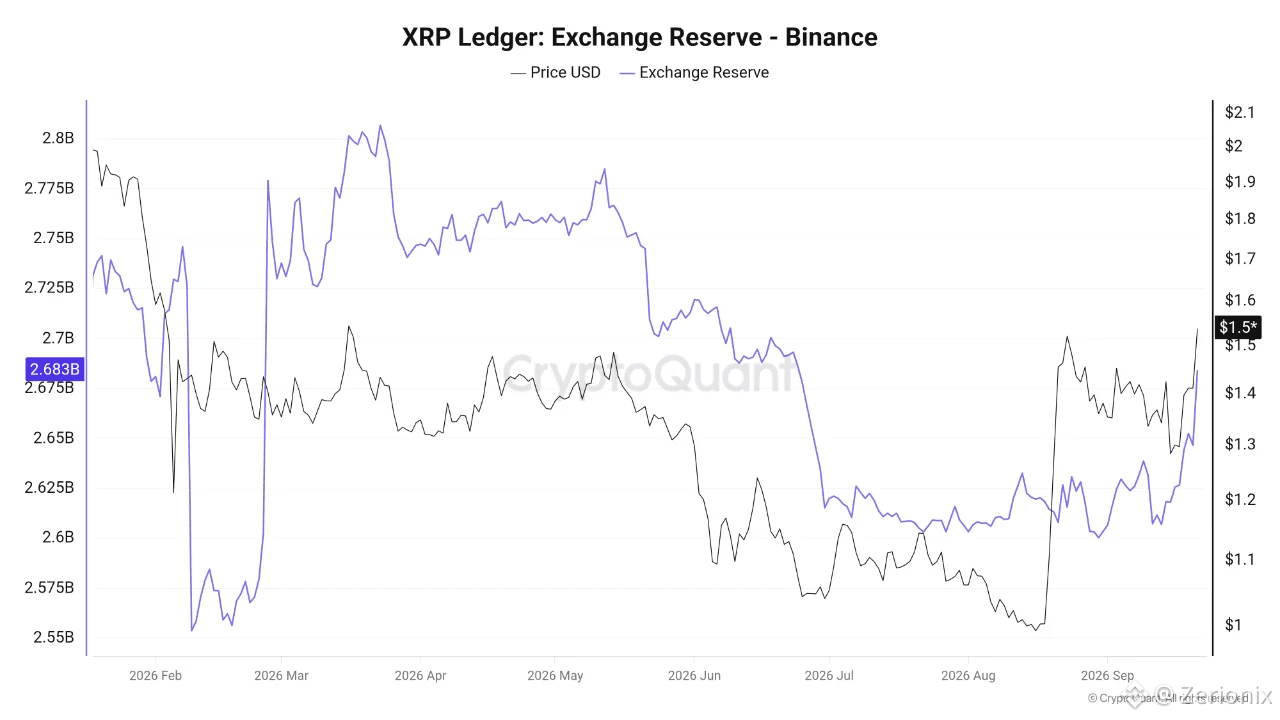
XRP exchange supply is quietly making a comeback. $XRP reserves on Binance have reportedly climbed to around 2.68 billion XRP, the highest level in roughly three months, while XRP trades near $1.50. That is a notable reversal. Binance reserves had been declining for months before gradually recovering, meaning more XRP is now sitting directly on the exchange and available for trading. But I wouldn't immediately translate that into “whales are dumping.” Exchange reserves can rise for several reasons. Traders can move coins in to prepare for spot activity, market makers can rebalance inventory, or holders can simply reposition liquidity. The important part is what happens next. If Binance reserves keep climbing while exchange inflows increase and spot volume starts expanding, the extra supply could become a source of short term selling pressure. But if reserves rise while XRP continues holding around $1.50 and demand remains strong, the market may simply be absorbing the additional liquidity. Personally, I'm more interested in the combination than the reserve number alone. XRP reserves + netflows + spot volume + price action. That's the data I want to see together. Because 2.68B XRP sitting on Binance isn't automatically bearish. What matters is what those coins eventually do. #BTC Price Analysis# #Altcoin Season# #BNBChain#
XRP exchange supply is quietly making a comeback. $XRP reserves on Binance have reportedly climbed to around 2.68 billion XRP, the highest level in roughly three months, while XRP trades near $1.50. That is a notable reversal. Binance reserves had been declining for months before gradually recovering, meaning more XRP is now sitting directly on the exchange and available for trading. But I wouldn't immediately translate that into “whales are dumping.” Exchange reserves can rise for several reasons. Traders can move coins in to prepare for spot activity, market makers can rebalance inventory, or holders can simply reposition liquidity. The important part is what happens next. If Binance reserves keep climbing while exchange inflows increase and spot volume starts expanding, the extra supply could become a source of short term selling pressure. But if reserves rise while XRP continues holding around $1.50 and demand remains strong, the market may simply be absorbing the additional liquidity. Personally, I'm more interested in the combination than the reserve number alone. XRP reserves + netflows + spot volume + price action. That's the data I want to see together. Because 2.68B XRP sitting on Binance isn't automatically bearish. What matters is what those coins eventually do. #BTC Price Analysis# #Altcoin Season# #BNBChain#
39
·
--
См. перевод
I used to think about a DeFi trade as a pretty simple action. You choose what you want to sell, choose what you want to receive, check the rate and hit swap. But the deeper I get into DeFi infrastructure, the more I realize the swap itself is only part of the story. The interesting part is what happens when an application starts treating the order as an object with its own lifecycle. Instead of everything being reduced to “quote, execute, done,” an order can exist independently and then move through different stages of execution. That sounds like a small technical change, but it creates a lot more flexibility underneath the user experience. An order can have execution progress. It can be fulfilled through one or more executions. Settlement can follow different paths depending on the type of trade. And suddenly, “I made a swap” doesn't describe everything that actually happened. This is one reason I've been paying more attention to the direction Omniston is taking. The newer architecture makes orders and executions first class parts of the protocol , rather than treating them as temporary steps around a swap. For users, that complexity should ideally stay invisible. But for builders, it matters. Because once an order has a proper lifecycle, applications can build more sophisticated execution experiences without having to reinvent the underlying settlement logic every time. To me, that's an important shift in DeFi infrastructure. The future isn't necessarily about making the swap button more complicated. It's about making everything happening **behind that button** more capable. That's the part I'm watching. Explore Omniston →https://ston.fi/omniston #BTC Price Analysis# $BTC #Macro Insights# #Meme Alpha# $ETH
I used to think about a DeFi trade as a pretty simple action. You choose what you want to sell, choose what you want to receive, check the rate and hit swap. But the deeper I get into DeFi infrastructure, the more I realize the swap itself is only part of the story. The interesting part is what happens when an application starts treating the order as an object with its own lifecycle. Instead of everything being reduced to “quote, execute, done,” an order can exist independently and then move through different stages of execution. That sounds like a small technical change, but it creates a lot more flexibility underneath the user experience. An order can have execution progress. It can be fulfilled through one or more executions. Settlement can follow different paths depending on the type of trade. And suddenly, “I made a swap” doesn't describe everything that actually happened. This is one reason I've been paying more attention to the direction Omniston is taking. The newer architecture makes orders and executions first class parts of the protocol , rather than treating them as temporary steps around a swap. For users, that complexity should ideally stay invisible. But for builders, it matters. Because once an order has a proper lifecycle, applications can build more sophisticated execution experiences without having to reinvent the underlying settlement logic every time. To me, that's an important shift in DeFi infrastructure. The future isn't necessarily about making the swap button more complicated. It's about making everything happening **behind that button** more capable. That's the part I'm watching. Explore Omniston →https://ston.fi/omniston #BTC Price Analysis# $BTC #Macro Insights# #Meme Alpha# $ETH
30
·
--
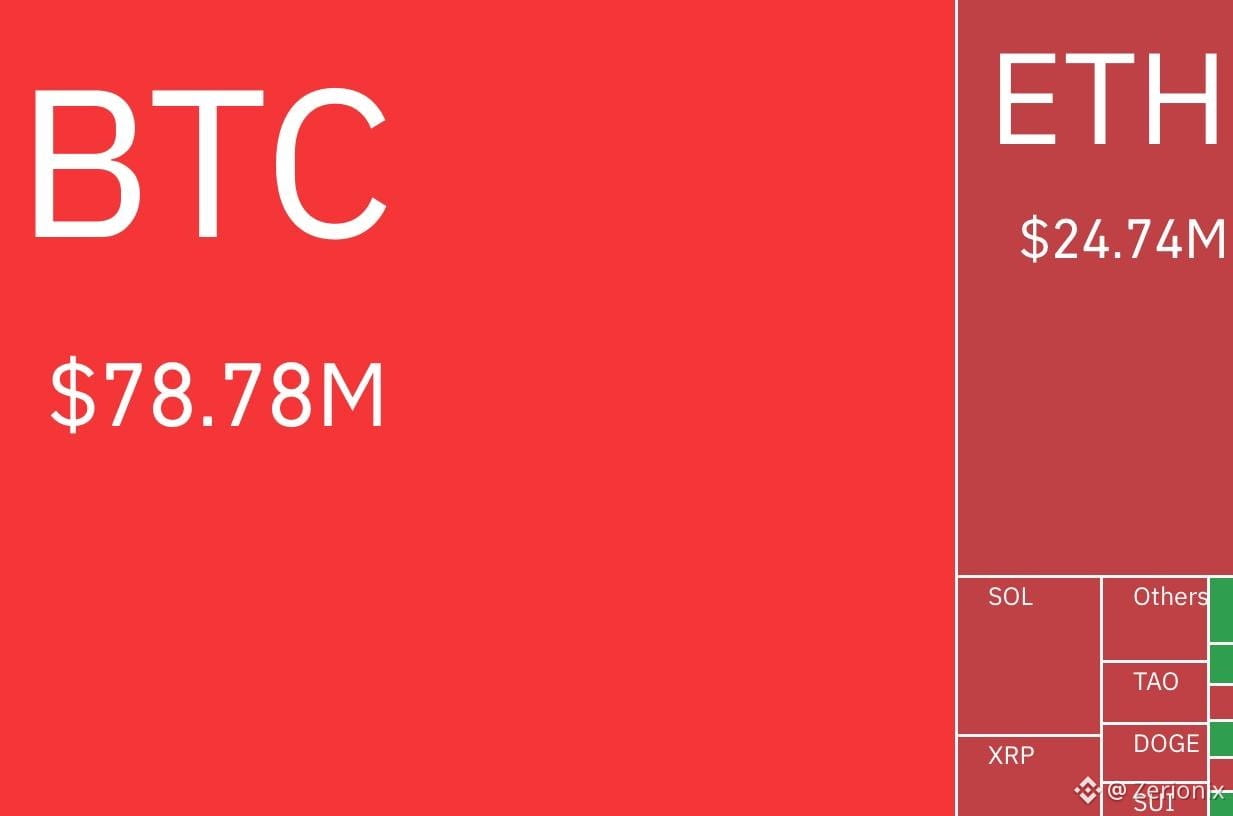
Биткоин вернулся выше $87K, и шорты сильно выдавливают.
BTC пробился в район $87K, пока ралли ускоряется: по всему рынку ликвидируются крипто-шорты на сотни миллионов долларов. Недавние данные CoinGlass показали примерно $648M ликвидаций по шортам за 24 часа, при этом сам Bitcoin занял большую долю.
То, что бросается мне в глаза, — это не только движение цены.
Это позиционирование.
Когда шорты начинают так агрессивно вытеснять, эти ликвидации превращаются в рыночные покупки и могут ускорить рост. Именно так восстановление может очень быстро превратиться в «сжатие».
Но есть нюанс.
Открытый интерес по фьючерсам на биткоин тоже растёт, что указывает: трейдеры уже наращивают плечо в ходе движения, а не просто отходят в сторону.
Лично я бы следил за тем, сможет ли BTC удержаться выше $85K после того, как «сжатие» шортов остынет.
Если сможет, движение будет выглядеть менее как результат вынужденных ликвидаций и больше — как реальный спрос.
Но если плечо продолжит накапливаться, а спрос на споте не последует, тогда мы можем просто заново собрать условия для очередного резкого «сброса».
$87K — впечатляет. Удержать пробой, не перезагружая избыточное плечо сразу же, — вот реальный тест.
$BTC #BTC Price Analysis# $SOL #Altcoin Season#
Биткоин вернулся выше $87K, и шорты сильно выдавливают.
BTC пробился в район $87K, пока ралли ускоряется: по всему рынку ликвидируются крипто-шорты на сотни миллионов долларов. Недавние данные CoinGlass показали примерно $648M ликвидаций по шортам за 24 часа, при этом сам Bitcoin занял большую долю.
То, что бросается мне в глаза, — это не только движение цены.
Это позиционирование.
Когда шорты начинают так агрессивно вытеснять, эти ликвидации превращаются в рыночные покупки и могут ускорить рост. Именно так восстановление может очень быстро превратиться в «сжатие».
Но есть нюанс.
Открытый интерес по фьючерсам на биткоин тоже растёт, что указывает: трейдеры уже наращивают плечо в ходе движения, а не просто отходят в сторону.
Лично я бы следил за тем, сможет ли BTC удержаться выше $85K после того, как «сжатие» шортов остынет.
Если сможет, движение будет выглядеть менее как результат вынужденных ликвидаций и больше — как реальный спрос.
Но если плечо продолжит накапливаться, а спрос на споте не последует, тогда мы можем просто заново собрать условия для очередного резкого «сброса».
$87K — впечатляет. Удержать пробой, не перезагружая избыточное плечо сразу же, — вот реальный тест.
$BTC #BTC Price Analysis# $SOL #Altcoin Season#
BTC пробился в район $87K, пока ралли ускоряется: по всему рынку ликвидируются крипто-шорты на сотни миллионов долларов. Недавние данные CoinGlass показали примерно $648M ликвидаций по шортам за 24 часа, при этом сам Bitcoin занял большую долю.
То, что бросается мне в глаза, — это не только движение цены.
Это позиционирование.
Когда шорты начинают так агрессивно вытеснять, эти ликвидации превращаются в рыночные покупки и могут ускорить рост. Именно так восстановление может очень быстро превратиться в «сжатие».
Но есть нюанс.
Открытый интерес по фьючерсам на биткоин тоже растёт, что указывает: трейдеры уже наращивают плечо в ходе движения, а не просто отходят в сторону.
Лично я бы следил за тем, сможет ли BTC удержаться выше $85K после того, как «сжатие» шортов остынет.
Если сможет, движение будет выглядеть менее как результат вынужденных ликвидаций и больше — как реальный спрос.
Но если плечо продолжит накапливаться, а спрос на споте не последует, тогда мы можем просто заново собрать условия для очередного резкого «сброса».
$87K — впечатляет. Удержать пробой, не перезагружая избыточное плечо сразу же, — вот реальный тест.
$BTC #BTC Price Analysis# $SOL #Altcoin Season#
2
·
--
См. перевод
Coinbase is moving further away from being “just a crypto exchange.” The company has opened IPO participation to eligible U.S. retail customers, with Oura becoming the first offering. Users can request shares at the IPO price before they begin trading publicly, although allocations can be full, partial or zero depending on demand and available shares. That distinction matters. Coinbase already lets users trade crypto, stocks and ETFs. Now it's stepping into the primary market, giving users access to an asset before it reaches the secondary market. That's the logic behind its “Everything Exchange” strategy. The long term vision is becoming clearer: Issue the asset. Distribute it. Let users trade it. Eventually bring more of the lifecycle onchain. And Coinbase isn't making this move in isolation. The SEC recently introduced a five year exemption framework for certain tokenized securities, potentially making the bridge between traditional equities and blockchain infrastructure even more important. The interesting question isn't whether Coinbase wants to compete with crypto exchanges anymore. It's whether Coinbase is trying to become a financial market in a single interface. Crypto was the entry point. The bigger business may be everything else. $COIN #BTC Price Analysis# $BTC #Meme Alpha#
Coinbase is moving further away from being “just a crypto exchange.” The company has opened IPO participation to eligible U.S. retail customers, with Oura becoming the first offering. Users can request shares at the IPO price before they begin trading publicly, although allocations can be full, partial or zero depending on demand and available shares. That distinction matters. Coinbase already lets users trade crypto, stocks and ETFs. Now it's stepping into the primary market, giving users access to an asset before it reaches the secondary market. That's the logic behind its “Everything Exchange” strategy. The long term vision is becoming clearer: Issue the asset. Distribute it. Let users trade it. Eventually bring more of the lifecycle onchain. And Coinbase isn't making this move in isolation. The SEC recently introduced a five year exemption framework for certain tokenized securities, potentially making the bridge between traditional equities and blockchain infrastructure even more important. The interesting question isn't whether Coinbase wants to compete with crypto exchanges anymore. It's whether Coinbase is trying to become a financial market in a single interface. Crypto was the entry point. The bigger business may be everything else. $COIN #BTC Price Analysis# $BTC #Meme Alpha#


·
--
См. перевод
BitMine is getting dangerously close to owning 5% of Ethereum. The company just added another 27,562 ETH, taking its total holdings to 5,983,940 ETH. That's roughly 4.9% of Ethereum's entire supply. And this isn't just ETH sitting on a balance sheet. BitMine says 5.07 million ETH is already staked, representing about 85% of its holdings and generating projected annualized staking revenue of roughly $357M at its reported yield. So the strategy is becoming pretty clear: Accumulate ETH. Stake it. Generate yield. Accumulate more. The bigger question is what happens when one public company controls an increasingly meaningful share of a major crypto asset. BitMine is now only around 1.6 percentage points away from its stated 5% target. That's a massive concentration of $ETH in one treasury. Whether that becomes a long term source of institutional confidence or introduces new concentration risk is something the market will eventually have to price in. For now, though, BitMine's message is pretty simple: They're still buying. #BTC Price Analysis# #Meme Alpha# #BNBChain#
BitMine is getting dangerously close to owning 5% of Ethereum. The company just added another 27,562 ETH, taking its total holdings to 5,983,940 ETH. That's roughly 4.9% of Ethereum's entire supply. And this isn't just ETH sitting on a balance sheet. BitMine says 5.07 million ETH is already staked, representing about 85% of its holdings and generating projected annualized staking revenue of roughly $357M at its reported yield. So the strategy is becoming pretty clear: Accumulate ETH. Stake it. Generate yield. Accumulate more. The bigger question is what happens when one public company controls an increasingly meaningful share of a major crypto asset. BitMine is now only around 1.6 percentage points away from its stated 5% target. That's a massive concentration of $ETH in one treasury. Whether that becomes a long term source of institutional confidence or introduces new concentration risk is something the market will eventually have to price in. For now, though, BitMine's message is pretty simple: They're still buying. #BTC Price Analysis# #Meme Alpha# #BNBChain#

·
--
Зарегулированные стейблкоины начинают вести себя меньше как отдельные продукты и больше как глобальная платежная инфраструктура. Anchorage Digital выбрала LayerZero, чтобы соединить стейблкоины, включая USA₮, USDPT и USDGO, на более чем 170 блокчейнах. Важна не столько численность сетей. Важно то, что интероперабельность делает для регулируемых долларов. Anchorage предоставляет слой регулируемой эмиссии. Стандарт OFT от LayerZero обеспечивает инфраструктуру, позволяющую одному и тому же активу перемещаться между различными сетями при сохранении единого предложения. Это важно, потому что учреждения не хотят выбирать между каждым блокчейном по отдельности. Им нужны доллары, которые могут попасть туда, где уже есть ликвидность, пользователи и приложения. USDPT уже используется Western Union как регулируемый цифровой доллар в сети Solana, а Anchorage также выпускает USDGO для OSL и USA₮ вместе с Tether. Это более масштабный тренд в RWA и стейблкоинах: регулирование формирует слой доверия. Интероперабельность формирует слой распределения. Если больше регулируемых эмитентов пойдут по тому же пути, стейблкоины могут стать одним из первых продуктов в криптовалюте, где «мультичейн» — не функция. Это просто настройка по умолчанию. $ZRO #Анализ цен BTC# #Макро-выводы#
Зарегулированные стейблкоины начинают вести себя меньше как отдельные продукты и больше как глобальная платежная инфраструктура. Anchorage Digital выбрала LayerZero, чтобы соединить стейблкоины, включая USA₮, USDPT и USDGO, на более чем 170 блокчейнах. Важна не столько численность сетей. Важно то, что интероперабельность делает для регулируемых долларов. Anchorage предоставляет слой регулируемой эмиссии. Стандарт OFT от LayerZero обеспечивает инфраструктуру, позволяющую одному и тому же активу перемещаться между различными сетями при сохранении единого предложения. Это важно, потому что учреждения не хотят выбирать между каждым блокчейном по отдельности. Им нужны доллары, которые могут попасть туда, где уже есть ликвидность, пользователи и приложения. USDPT уже используется Western Union как регулируемый цифровой доллар в сети Solana, а Anchorage также выпускает USDGO для OSL и USA₮ вместе с Tether. Это более масштабный тренд в RWA и стейблкоинах: регулирование формирует слой доверия. Интероперабельность формирует слой распределения. Если больше регулируемых эмитентов пойдут по тому же пути, стейблкоины могут стать одним из первых продуктов в криптовалюте, где «мультичейн» — не функция. Это просто настройка по умолчанию. $ZRO #Анализ цен BTC# #Макро-выводы#


·
--
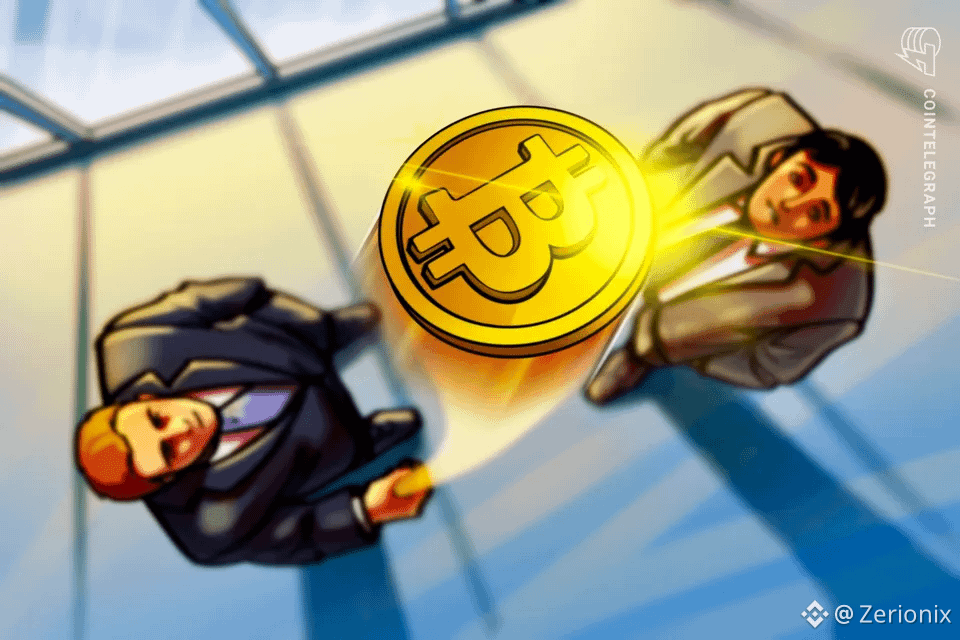
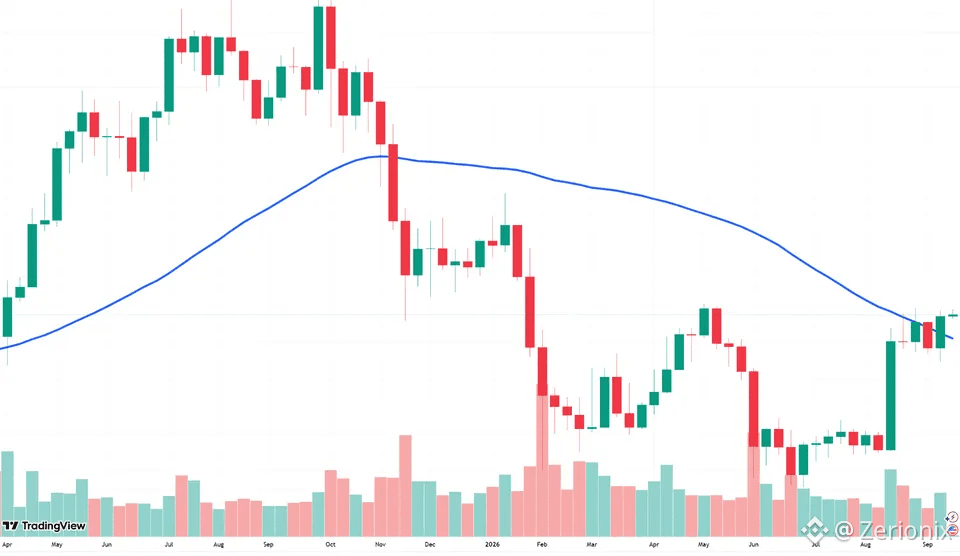
Биткоин вернул себе 50-недельную EMA — индикатор тренда, который исторически отмечал некоторые из самых важных переломов во время крупных просадок BTC. Одной цифрой, привлекающей внимание, является то, что закрытие выше этого уровня в историческом разрезе примерно в 84% наблюдавшихся случаев сопровождалось окончанием bear market. Звучит оптимистично. Но я бы не воспринимал это число как автоматический сигнал «$90K дальше». Более важный вопрос — сможет ли биткоин действительно закрыться выше 50-недельной EMA и затем удерживать ее в качестве поддержки. Мы видели немало технических индикаторов, которые выглядели идеально прямо перед тем, как рынок их опровергал. Если BTC удержит возврат, следующая зона около $90K станет очевидным уровнем, за которым стоит следить. Если цена снова потеряет 50-недельную EMA, весь сигнал станет гораздо менее убедительным. Лично я больше заинтересован в недельном закрытии, чем в внутридневном движении. Одна свеча может создать пробой. Удержание уровня — вот что превращает это в тренд. #BTC Price Analysis# $BTC #Altcoin Season#
Биткоин вернул себе 50-недельную EMA — индикатор тренда, который исторически отмечал некоторые из самых важных переломов во время крупных просадок BTC. Одной цифрой, привлекающей внимание, является то, что закрытие выше этого уровня в историческом разрезе примерно в 84% наблюдавшихся случаев сопровождалось окончанием bear market. Звучит оптимистично. Но я бы не воспринимал это число как автоматический сигнал «$90K дальше». Более важный вопрос — сможет ли биткоин действительно закрыться выше 50-недельной EMA и затем удерживать ее в качестве поддержки. Мы видели немало технических индикаторов, которые выглядели идеально прямо перед тем, как рынок их опровергал. Если BTC удержит возврат, следующая зона около $90K станет очевидным уровнем, за которым стоит следить. Если цена снова потеряет 50-недельную EMA, весь сигнал станет гораздо менее убедительным. Лично я больше заинтересован в недельном закрытии, чем в внутридневном движении. Одна свеча может создать пробой. Удержание уровня — вот что превращает это в тренд. #BTC Price Analysis# $BTC #Altcoin Season#
24
·
--
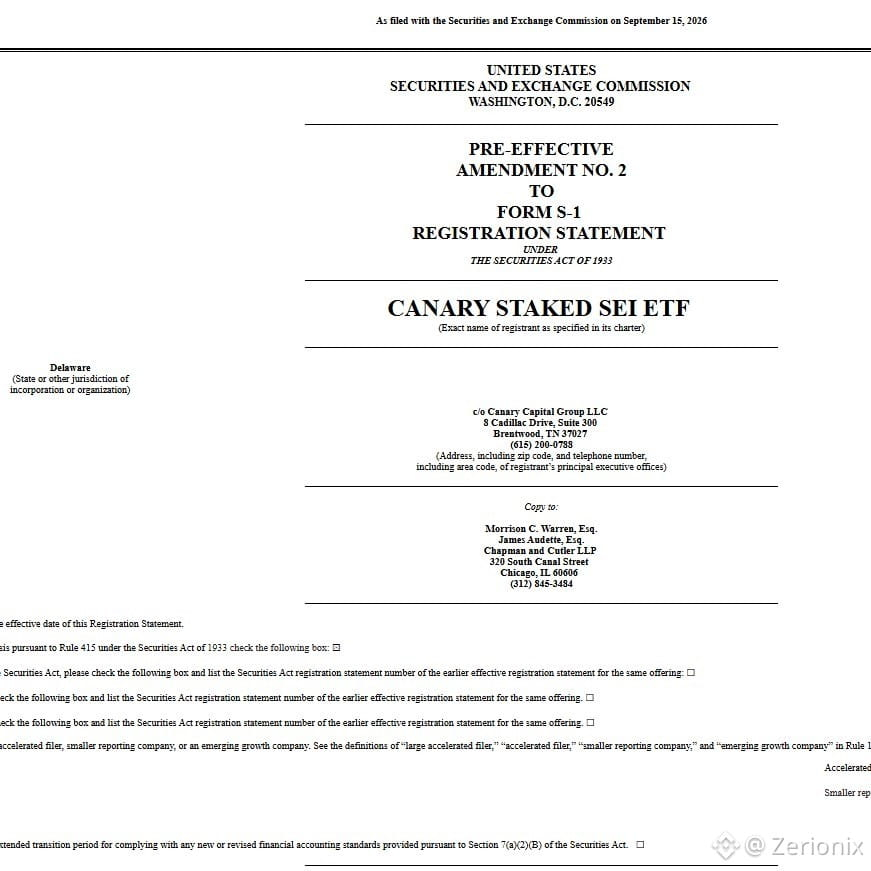
Canary Capital подала вторую поправку к своему предложению по торгуемому на бирже фонду (ETF) Staked SEI.
И эта версия становится еще интереснее.
В документации говорится, что фонд рассчитывает размещать (стейкать) как минимум 90% своих активов SEI при нормальных обстоятельствах, при этом используя BitGo в качестве кастодиана. ETF предлагается к листингу для торговли на Cboe BZX.
То есть инвесторы получат не только спотовую экспозицию к SEI.
Структура также разработана так, чтобы генерировать дополнительный SEI за счет наград сети за proof of stake, при этом эти вознаграждения отражаются в NAV фонда.
Лично для меня это — самая интересная часть.
Спотовый ETF дает традиционным инвесторам доступ к активу. Стейкинг-ETF потенциально добавляет еще один слой, позволяя этому капиталу участвовать в собственной доходности сети.
Но остается серьезное оговорка.
Это подача документа, а не одобрение.
ETF еще не начал торговаться, и SEC все еще должна принять соответствующие регуляторные решения.
Однако если это будет одобрено, инвесторам это даст регулируемый способ получить и ценовую экспозицию к SEI, и экономику стейкинга, не управляя при этом напрямую токеном или инфраструктурой стейкинга.
Для SEI это различие довольно важное.
Теперь вопрос в том, сможет ли Canary превратить подачу в реальный продукт.
$BTC #Altcoin Season# #Macro Insights# $SOL
Canary Capital подала вторую поправку к своему предложению по торгуемому на бирже фонду (ETF) Staked SEI.
И эта версия становится еще интереснее.
В документации говорится, что фонд рассчитывает размещать (стейкать) как минимум 90% своих активов SEI при нормальных обстоятельствах, при этом используя BitGo в качестве кастодиана. ETF предлагается к листингу для торговли на Cboe BZX.
То есть инвесторы получат не только спотовую экспозицию к SEI.
Структура также разработана так, чтобы генерировать дополнительный SEI за счет наград сети за proof of stake, при этом эти вознаграждения отражаются в NAV фонда.
Лично для меня это — самая интересная часть.
Спотовый ETF дает традиционным инвесторам доступ к активу. Стейкинг-ETF потенциально добавляет еще один слой, позволяя этому капиталу участвовать в собственной доходности сети.
Но остается серьезное оговорка.
Это подача документа, а не одобрение.
ETF еще не начал торговаться, и SEC все еще должна принять соответствующие регуляторные решения.
Однако если это будет одобрено, инвесторам это даст регулируемый способ получить и ценовую экспозицию к SEI, и экономику стейкинга, не управляя при этом напрямую токеном или инфраструктурой стейкинга.
Для SEI это различие довольно важное.
Теперь вопрос в том, сможет ли Canary превратить подачу в реальный продукт.
$BTC #Altcoin Season# #Macro Insights# $SOL
И эта версия становится еще интереснее.
В документации говорится, что фонд рассчитывает размещать (стейкать) как минимум 90% своих активов SEI при нормальных обстоятельствах, при этом используя BitGo в качестве кастодиана. ETF предлагается к листингу для торговли на Cboe BZX.
То есть инвесторы получат не только спотовую экспозицию к SEI.
Структура также разработана так, чтобы генерировать дополнительный SEI за счет наград сети за proof of stake, при этом эти вознаграждения отражаются в NAV фонда.
Лично для меня это — самая интересная часть.
Спотовый ETF дает традиционным инвесторам доступ к активу. Стейкинг-ETF потенциально добавляет еще один слой, позволяя этому капиталу участвовать в собственной доходности сети.
Но остается серьезное оговорка.
Это подача документа, а не одобрение.
ETF еще не начал торговаться, и SEC все еще должна принять соответствующие регуляторные решения.
Однако если это будет одобрено, инвесторам это даст регулируемый способ получить и ценовую экспозицию к SEI, и экономику стейкинга, не управляя при этом напрямую токеном или инфраструктурой стейкинга.
Для SEI это различие довольно важное.
Теперь вопрос в том, сможет ли Canary превратить подачу в реальный продукт.
$BTC #Altcoin Season# #Macro Insights# $SOL

25
·
--
Потоки ETF начали рассказывать другую историю по рынку криптовалют.
На прошлой неделе:
BTC: +$6.21M
ETH: -$140M
SOL: +$13.19M
XRP: +$9.56M
Заголовок не в том, что криптовалютные ETF демонстрируют огромные притоки.
Дело в расхождении.
Биткоин едва закончил период в плюсе, тогда как Ethereum столкнулся со значительным оттоком в размере $140M после четырех подряд недель чистых притоков. Тем временем Solana и XRP продолжали привлекать свежий капитал.
Это не означает автоматически, что инвесторы бросают ETH или окончательно переключаются на SOL и XRP. Одна неделя потоков — недостаточно, чтобы это утверждать.
Но это показывает, что спрос на ETF не движется равномерно по всему рынку.
BTC удерживает капитал. SOL и XRP притягивают дополнительный спрос. ETH сейчас — аутсайдер.
Следующие несколько недель важнее, чем этот снимок.
Если оттоки по ETH сохранятся, а SOL и XRP продолжат фиксировать притоки, расхождение станет сложнее списывать на шум.
Интересный вопрос не в том, привлекают ли крипто ETF деньги. А в том, куда именно выбирают направлять эти деньги.
$BTC #BTC Price Analysis# $ETH #Bitcoin Price Prediction: What is Bitcoins next move?#
Потоки ETF начали рассказывать другую историю по рынку криптовалют.
На прошлой неделе:
BTC: +$6.21M
ETH: -$140M
SOL: +$13.19M
XRP: +$9.56M
Заголовок не в том, что криптовалютные ETF демонстрируют огромные притоки.
Дело в расхождении.
Биткоин едва закончил период в плюсе, тогда как Ethereum столкнулся со значительным оттоком в размере $140M после четырех подряд недель чистых притоков. Тем временем Solana и XRP продолжали привлекать свежий капитал.
Это не означает автоматически, что инвесторы бросают ETH или окончательно переключаются на SOL и XRP. Одна неделя потоков — недостаточно, чтобы это утверждать.
Но это показывает, что спрос на ETF не движется равномерно по всему рынку.
BTC удерживает капитал. SOL и XRP притягивают дополнительный спрос. ETH сейчас — аутсайдер.
Следующие несколько недель важнее, чем этот снимок.
Если оттоки по ETH сохранятся, а SOL и XRP продолжат фиксировать притоки, расхождение станет сложнее списывать на шум.
Интересный вопрос не в том, привлекают ли крипто ETF деньги. А в том, куда именно выбирают направлять эти деньги.
$BTC #BTC Price Analysis# $ETH #Bitcoin Price Prediction: What is Bitcoins next move?#
На прошлой неделе:
BTC: +$6.21M
ETH: -$140M
SOL: +$13.19M
XRP: +$9.56M
Заголовок не в том, что криптовалютные ETF демонстрируют огромные притоки.
Дело в расхождении.
Биткоин едва закончил период в плюсе, тогда как Ethereum столкнулся со значительным оттоком в размере $140M после четырех подряд недель чистых притоков. Тем временем Solana и XRP продолжали привлекать свежий капитал.
Это не означает автоматически, что инвесторы бросают ETH или окончательно переключаются на SOL и XRP. Одна неделя потоков — недостаточно, чтобы это утверждать.
Но это показывает, что спрос на ETF не движется равномерно по всему рынку.
BTC удерживает капитал. SOL и XRP притягивают дополнительный спрос. ETH сейчас — аутсайдер.
Следующие несколько недель важнее, чем этот снимок.
Если оттоки по ETH сохранятся, а SOL и XRP продолжат фиксировать притоки, расхождение станет сложнее списывать на шум.
Интересный вопрос не в том, привлекают ли крипто ETF деньги. А в том, куда именно выбирают направлять эти деньги.
$BTC #BTC Price Analysis# $ETH #Bitcoin Price Prediction: What is Bitcoins next move?#
63
·
--
NEARKAT движется БЫСТРО.
Мемкоин набрал примерно 65% за около 25 часов и более 360% за последнюю неделю — согласно цифрам, которые разошлись в CoinGecko.
Но интересно здесь не только цена.
Модель StonkFun от NEARKAT взимает 3% комиссию за перевод и конвертирует наградной пул в NEAR, который затем распределяется между держателями.
Это создаёт довольно необычный эффект обратной связи.
Больше торговой активности → больше комиссий → больше NEAR получает вознаграждение держателям.
И теперь самое интересное — тайминг.
NEAR только что запустила конфиденциальные бессрочные фьючерсы через near .com, при этом Hyperliquid обрабатывает базовое исполнение. Пользователи могут пополнять позиции активами с более чем 30 цепочек, а связь между их действиями по пополнению и торговым аккаунтом сохраняется в тайне.
Так что NEARKAT набирает импульс, пока более широкий экосистемный мир NEAR сам получает свежий сюжет вокруг приватности, кроссчейн-ликвидности и деривативов.
Лично я думаю, что именно поэтому этому шагу стоит уделить внимание.
Но это всё ещё мемкоин.
Движение на 300%+ за неделю может развернуться так же резко, а механизм вознаграждений сильно зависит от продолжения торговой активности. Текущая капитализация NEARKAT уже составляет около $15 млн, а CoinGecko показывает недавний исторический максимум около $0.0166.
Главный вопрос теперь не в том, сможет ли NEARKAT разогнаться.
А в том, сможет ли нарратив про NEAR продолжать привлекать достаточно внимания и объёмов, чтобы поддерживать этот «маховик».
Потому что как только объём исчезает, вместе с ним исчезают и награды.
$NEAR #BTC Price Analysis# $HYPE #Altcoin Season#
NEARKAT движется БЫСТРО.
Мемкоин набрал примерно 65% за около 25 часов и более 360% за последнюю неделю — согласно цифрам, которые разошлись в CoinGecko.
Но интересно здесь не только цена.
Модель StonkFun от NEARKAT взимает 3% комиссию за перевод и конвертирует наградной пул в NEAR, который затем распределяется между держателями.
Это создаёт довольно необычный эффект обратной связи.
Больше торговой активности → больше комиссий → больше NEAR получает вознаграждение держателям.
И теперь самое интересное — тайминг.
NEAR только что запустила конфиденциальные бессрочные фьючерсы через near .com, при этом Hyperliquid обрабатывает базовое исполнение. Пользователи могут пополнять позиции активами с более чем 30 цепочек, а связь между их действиями по пополнению и торговым аккаунтом сохраняется в тайне.
Так что NEARKAT набирает импульс, пока более широкий экосистемный мир NEAR сам получает свежий сюжет вокруг приватности, кроссчейн-ликвидности и деривативов.
Лично я думаю, что именно поэтому этому шагу стоит уделить внимание.
Но это всё ещё мемкоин.
Движение на 300%+ за неделю может развернуться так же резко, а механизм вознаграждений сильно зависит от продолжения торговой активности. Текущая капитализация NEARKAT уже составляет около $15 млн, а CoinGecko показывает недавний исторический максимум около $0.0166.
Главный вопрос теперь не в том, сможет ли NEARKAT разогнаться.
А в том, сможет ли нарратив про NEAR продолжать привлекать достаточно внимания и объёмов, чтобы поддерживать этот «маховик».
Потому что как только объём исчезает, вместе с ним исчезают и награды.
$NEAR #BTC Price Analysis# $HYPE #Altcoin Season#
Мемкоин набрал примерно 65% за около 25 часов и более 360% за последнюю неделю — согласно цифрам, которые разошлись в CoinGecko.
Но интересно здесь не только цена.
Модель StonkFun от NEARKAT взимает 3% комиссию за перевод и конвертирует наградной пул в NEAR, который затем распределяется между держателями.
Это создаёт довольно необычный эффект обратной связи.
Больше торговой активности → больше комиссий → больше NEAR получает вознаграждение держателям.
И теперь самое интересное — тайминг.
NEAR только что запустила конфиденциальные бессрочные фьючерсы через near .com, при этом Hyperliquid обрабатывает базовое исполнение. Пользователи могут пополнять позиции активами с более чем 30 цепочек, а связь между их действиями по пополнению и торговым аккаунтом сохраняется в тайне.
Так что NEARKAT набирает импульс, пока более широкий экосистемный мир NEAR сам получает свежий сюжет вокруг приватности, кроссчейн-ликвидности и деривативов.
Лично я думаю, что именно поэтому этому шагу стоит уделить внимание.
Но это всё ещё мемкоин.
Движение на 300%+ за неделю может развернуться так же резко, а механизм вознаграждений сильно зависит от продолжения торговой активности. Текущая капитализация NEARKAT уже составляет около $15 млн, а CoinGecko показывает недавний исторический максимум около $0.0166.
Главный вопрос теперь не в том, сможет ли NEARKAT разогнаться.
А в том, сможет ли нарратив про NEAR продолжать привлекать достаточно внимания и объёмов, чтобы поддерживать этот «маховик».
Потому что как только объём исчезает, вместе с ним исчезают и награды.
$NEAR #BTC Price Analysis# $HYPE #Altcoin Season#

50
·
--
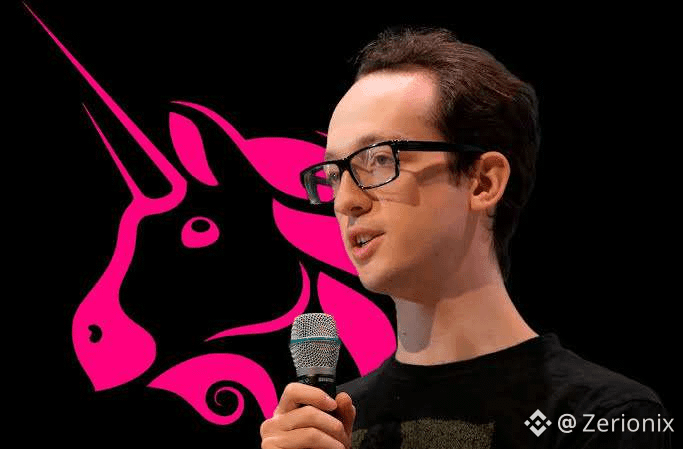
Сообщается, что SBF заплатил семизначную сумму за Uniswap.com… только чтобы в итоге Uniswap получил домен, не заплатив за него. 😂
Хайден Адамс говорит, что первоначальный владелец хотел цену в семь значений за Uniswap.com, но команда Uniswap отказалась платить.
Якобы вместо этого это купил SBF и направил домен на форк Uniswap.
Похоже, ход оказался неудачным.
Uniswap Labs оспорила домен, и в 2021 году панель ВОИС пришла к выводу, что Uniswap.com был зарегистрирован и использовался в недобросовестных целях. Домен обязали передать Uniswap Labs.
Так что домен, который, как утверждают, стоил семизначную сумму, в итоге оказался в руках Uniswap — без того, чтобы они его покупали.
Но здесь есть важная деталь.
В записи ВОИС SBF не указан как покупатель. Эта часть — из рассказа Хайдена Адамса, а в юридическом разбирательстве независимо подтверждаются вывод о недобросовестности и передача.
При этом ирония не ускользает.
Кто-то, якобы, потратил семь значений, пытаясь подпортить бренд Uniswap, а итогом стало то, что Uniswap оказался владельцем ровно того домена, за который они изначально отказались переплачивать.
В криптоиндустрии правда есть способ превращать «понты» в исторические сноски. 😭
И честно говоря, именно поэтому владение доменами и торговыми марками важнее, чем думают люди.
В крипте код можно форкнуть.
Ликвидность может мигрировать.
Но бренд и доверие пользователей — гораздо сложнее «форкнуть».
$UNI #Altcoin Season# #Altcoin Season#
Сообщается, что SBF заплатил семизначную сумму за Uniswap.com… только чтобы в итоге Uniswap получил домен, не заплатив за него. 😂
Хайден Адамс говорит, что первоначальный владелец хотел цену в семь значений за Uniswap.com, но команда Uniswap отказалась платить.
Якобы вместо этого это купил SBF и направил домен на форк Uniswap.
Похоже, ход оказался неудачным.
Uniswap Labs оспорила домен, и в 2021 году панель ВОИС пришла к выводу, что Uniswap.com был зарегистрирован и использовался в недобросовестных целях. Домен обязали передать Uniswap Labs.
Так что домен, который, как утверждают, стоил семизначную сумму, в итоге оказался в руках Uniswap — без того, чтобы они его покупали.
Но здесь есть важная деталь.
В записи ВОИС SBF не указан как покупатель. Эта часть — из рассказа Хайдена Адамса, а в юридическом разбирательстве независимо подтверждаются вывод о недобросовестности и передача.
При этом ирония не ускользает.
Кто-то, якобы, потратил семь значений, пытаясь подпортить бренд Uniswap, а итогом стало то, что Uniswap оказался владельцем ровно того домена, за который они изначально отказались переплачивать.
В криптоиндустрии правда есть способ превращать «понты» в исторические сноски. 😭
И честно говоря, именно поэтому владение доменами и торговыми марками важнее, чем думают люди.
В крипте код можно форкнуть.
Ликвидность может мигрировать.
Но бренд и доверие пользователей — гораздо сложнее «форкнуть».
$UNI #Altcoin Season# #Altcoin Season#
Хайден Адамс говорит, что первоначальный владелец хотел цену в семь значений за Uniswap.com, но команда Uniswap отказалась платить.
Якобы вместо этого это купил SBF и направил домен на форк Uniswap.
Похоже, ход оказался неудачным.
Uniswap Labs оспорила домен, и в 2021 году панель ВОИС пришла к выводу, что Uniswap.com был зарегистрирован и использовался в недобросовестных целях. Домен обязали передать Uniswap Labs.
Так что домен, который, как утверждают, стоил семизначную сумму, в итоге оказался в руках Uniswap — без того, чтобы они его покупали.
Но здесь есть важная деталь.
В записи ВОИС SBF не указан как покупатель. Эта часть — из рассказа Хайдена Адамса, а в юридическом разбирательстве независимо подтверждаются вывод о недобросовестности и передача.
При этом ирония не ускользает.
Кто-то, якобы, потратил семь значений, пытаясь подпортить бренд Uniswap, а итогом стало то, что Uniswap оказался владельцем ровно того домена, за который они изначально отказались переплачивать.
В криптоиндустрии правда есть способ превращать «понты» в исторические сноски. 😭
И честно говоря, именно поэтому владение доменами и торговыми марками важнее, чем думают люди.
В крипте код можно форкнуть.
Ликвидность может мигрировать.
Но бренд и доверие пользователей — гораздо сложнее «форкнуть».
$UNI #Altcoin Season# #Altcoin Season#

63
·
--
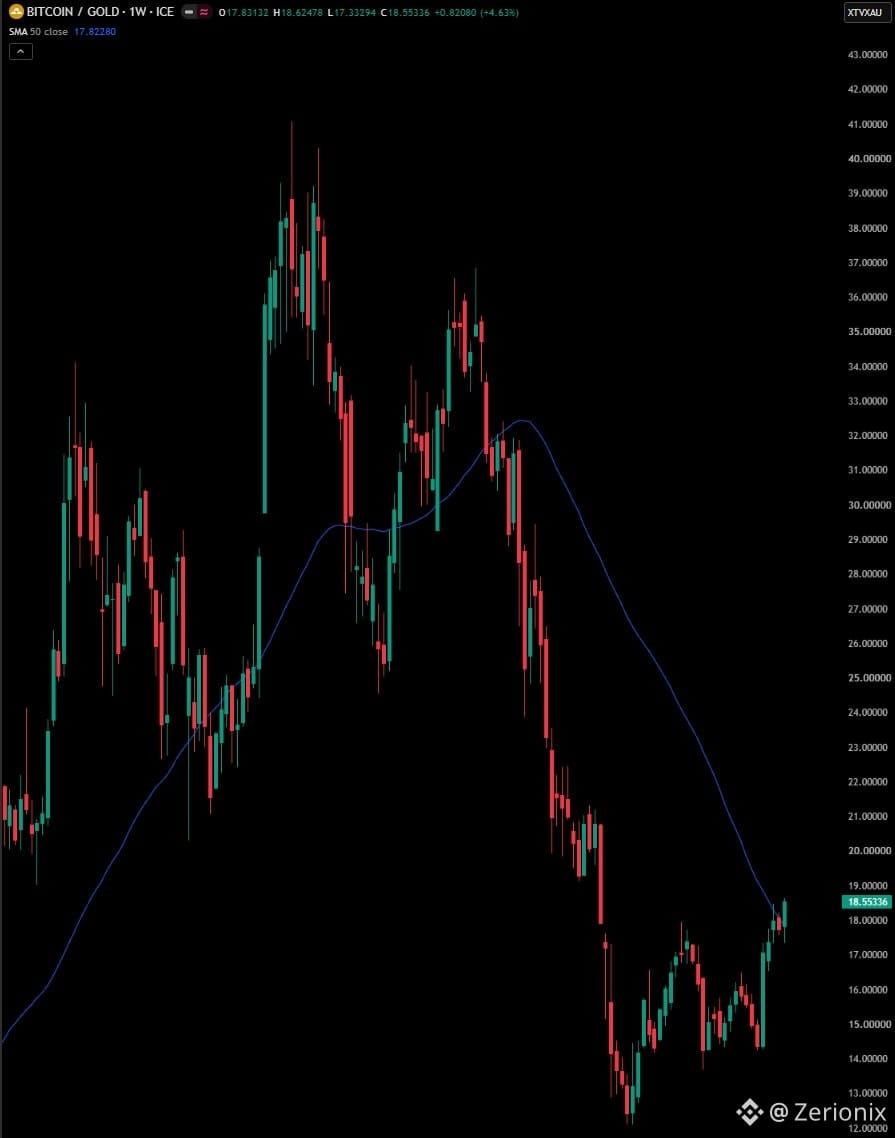
Отношение BTC/золото поднялось до 18,55 унции золота за один биткоин — с примерно 15,3 месяц назад; это рост примерно на 21%. Также это отношение вернуло свою 50-недельную скользящую среднюю.
Но здесь есть важная деталь.
Это не означает, что биткоин внезапно прибавил 21% по отношению к золоту. На самом деле в течение этого периода BTC был относительно стабильным, тогда как золото откатилось от своих недавних максимумов.
Так что часть движения в этом соотношении — сила BTC, а часть — слабость золота.
Тем не менее, я считаю, что за этим соотношением стоит наблюдать.
BTC и золото часто рассматривают как конкурирующие «твердые» активы, поэтому когда биткоин начинает набирать позиции по отношению к золоту, это может сигнализировать о сдвиге в относительном спросе.
Главный тест теперь в том, сможет ли BTC удержаться выше 50-недельной средней и продолжать расширять соотношение.
Потому что вернуть скользящую среднюю — это одно.
Превратить это в устойчивый тренд — другое.
$BTC #BTC Price Analysis# $XAUt
Отношение BTC/золото поднялось до 18,55 унции золота за один биткоин — с примерно 15,3 месяц назад; это рост примерно на 21%. Также это отношение вернуло свою 50-недельную скользящую среднюю.
Но здесь есть важная деталь.
Это не означает, что биткоин внезапно прибавил 21% по отношению к золоту. На самом деле в течение этого периода BTC был относительно стабильным, тогда как золото откатилось от своих недавних максимумов.
Так что часть движения в этом соотношении — сила BTC, а часть — слабость золота.
Тем не менее, я считаю, что за этим соотношением стоит наблюдать.
BTC и золото часто рассматривают как конкурирующие «твердые» активы, поэтому когда биткоин начинает набирать позиции по отношению к золоту, это может сигнализировать о сдвиге в относительном спросе.
Главный тест теперь в том, сможет ли BTC удержаться выше 50-недельной средней и продолжать расширять соотношение.
Потому что вернуть скользящую среднюю — это одно.
Превратить это в устойчивый тренд — другое.
$BTC #BTC Price Analysis# $XAUt
Но здесь есть важная деталь.
Это не означает, что биткоин внезапно прибавил 21% по отношению к золоту. На самом деле в течение этого периода BTC был относительно стабильным, тогда как золото откатилось от своих недавних максимумов.
Так что часть движения в этом соотношении — сила BTC, а часть — слабость золота.
Тем не менее, я считаю, что за этим соотношением стоит наблюдать.
BTC и золото часто рассматривают как конкурирующие «твердые» активы, поэтому когда биткоин начинает набирать позиции по отношению к золоту, это может сигнализировать о сдвиге в относительном спросе.
Главный тест теперь в том, сможет ли BTC удержаться выше 50-недельной средней и продолжать расширять соотношение.
Потому что вернуть скользящую среднюю — это одно.
Превратить это в устойчивый тренд — другое.
$BTC #BTC Price Analysis# $XAUt
98
·
--
HYPE только что получил интересный сигнал спроса.
21Shares купила примерно на $2,4 млн HYPE, а Bitwise добавила еще $1,9 млн за один день.
Меня особенно заинтересовал тайминг.
21Shares почти 20 дней обходилась без притока, прежде чем снова купить, тогда как HYPE отскочил примерно от $76 и пошел к своему предыдущему максимуму около $89,60.
Это делает движение более интересным, чем просто очередной отскок альткоина.
Теперь существует регулируемый инвестиционный маршрут, который напрямую направляет капитал в HYPE, и эти покупки показывают, что спрос через такие инструменты может возвращаться довольно быстро, когда меняются настроения.
Но я бы пока не стал слишком увлекаться.
На прошлой неделе HYPE ETF только что зафиксировали примерно $26 млн совокупных оттоков. Так что одна сильная сессия покупок не стирает недавнюю слабость.
Что мне важно увидеть — это стабильность.
Если 21Shares и Bitwise продолжат накапливать, пока HYPE держится выше зоны $76 и начнет снова бросать вызов своему рекордному максимуму, тогда история об институциональном спросе станет гораздо сложнее игнорировать.
И есть еще один аспект.
HYPE покупают не только потому, что это очередной крипто-токен. Инвесторы получают доступ к бирже, которая стала одной из крупнейших площадок для onchain-производных инструментов, а ее комиссии и механика выкупа создают прямую связь между активностью платформы и самим токеном.
Лично для меня именно это — то, что интереснее, чем ценовой график.
Теперь вопрос простой.
Это разовая институциональная заявка на покупку или начало еще одной устойчивой волны спроса на HYPE?
$HYPE #BTC Price Analysis# #Meme Alpha# #Meme Alpha#
HYPE только что получил интересный сигнал спроса.
21Shares купила примерно на $2,4 млн HYPE, а Bitwise добавила еще $1,9 млн за один день.
Меня особенно заинтересовал тайминг.
21Shares почти 20 дней обходилась без притока, прежде чем снова купить, тогда как HYPE отскочил примерно от $76 и пошел к своему предыдущему максимуму около $89,60.
Это делает движение более интересным, чем просто очередной отскок альткоина.
Теперь существует регулируемый инвестиционный маршрут, который напрямую направляет капитал в HYPE, и эти покупки показывают, что спрос через такие инструменты может возвращаться довольно быстро, когда меняются настроения.
Но я бы пока не стал слишком увлекаться.
На прошлой неделе HYPE ETF только что зафиксировали примерно $26 млн совокупных оттоков. Так что одна сильная сессия покупок не стирает недавнюю слабость.
Что мне важно увидеть — это стабильность.
Если 21Shares и Bitwise продолжат накапливать, пока HYPE держится выше зоны $76 и начнет снова бросать вызов своему рекордному максимуму, тогда история об институциональном спросе станет гораздо сложнее игнорировать.
И есть еще один аспект.
HYPE покупают не только потому, что это очередной крипто-токен. Инвесторы получают доступ к бирже, которая стала одной из крупнейших площадок для onchain-производных инструментов, а ее комиссии и механика выкупа создают прямую связь между активностью платформы и самим токеном.
Лично для меня именно это — то, что интереснее, чем ценовой график.
Теперь вопрос простой.
Это разовая институциональная заявка на покупку или начало еще одной устойчивой волны спроса на HYPE?
$HYPE #BTC Price Analysis# #Meme Alpha# #Meme Alpha#
21Shares купила примерно на $2,4 млн HYPE, а Bitwise добавила еще $1,9 млн за один день.
Меня особенно заинтересовал тайминг.
21Shares почти 20 дней обходилась без притока, прежде чем снова купить, тогда как HYPE отскочил примерно от $76 и пошел к своему предыдущему максимуму около $89,60.
Это делает движение более интересным, чем просто очередной отскок альткоина.
Теперь существует регулируемый инвестиционный маршрут, который напрямую направляет капитал в HYPE, и эти покупки показывают, что спрос через такие инструменты может возвращаться довольно быстро, когда меняются настроения.
Но я бы пока не стал слишком увлекаться.
На прошлой неделе HYPE ETF только что зафиксировали примерно $26 млн совокупных оттоков. Так что одна сильная сессия покупок не стирает недавнюю слабость.
Что мне важно увидеть — это стабильность.
Если 21Shares и Bitwise продолжат накапливать, пока HYPE держится выше зоны $76 и начнет снова бросать вызов своему рекордному максимуму, тогда история об институциональном спросе станет гораздо сложнее игнорировать.
И есть еще один аспект.
HYPE покупают не только потому, что это очередной крипто-токен. Инвесторы получают доступ к бирже, которая стала одной из крупнейших площадок для onchain-производных инструментов, а ее комиссии и механика выкупа создают прямую связь между активностью платформы и самим токеном.
Лично для меня именно это — то, что интереснее, чем ценовой график.
Теперь вопрос простой.
Это разовая институциональная заявка на покупку или начало еще одной устойчивой волны спроса на HYPE?
$HYPE #BTC Price Analysis# #Meme Alpha# #Meme Alpha#

38
·
--
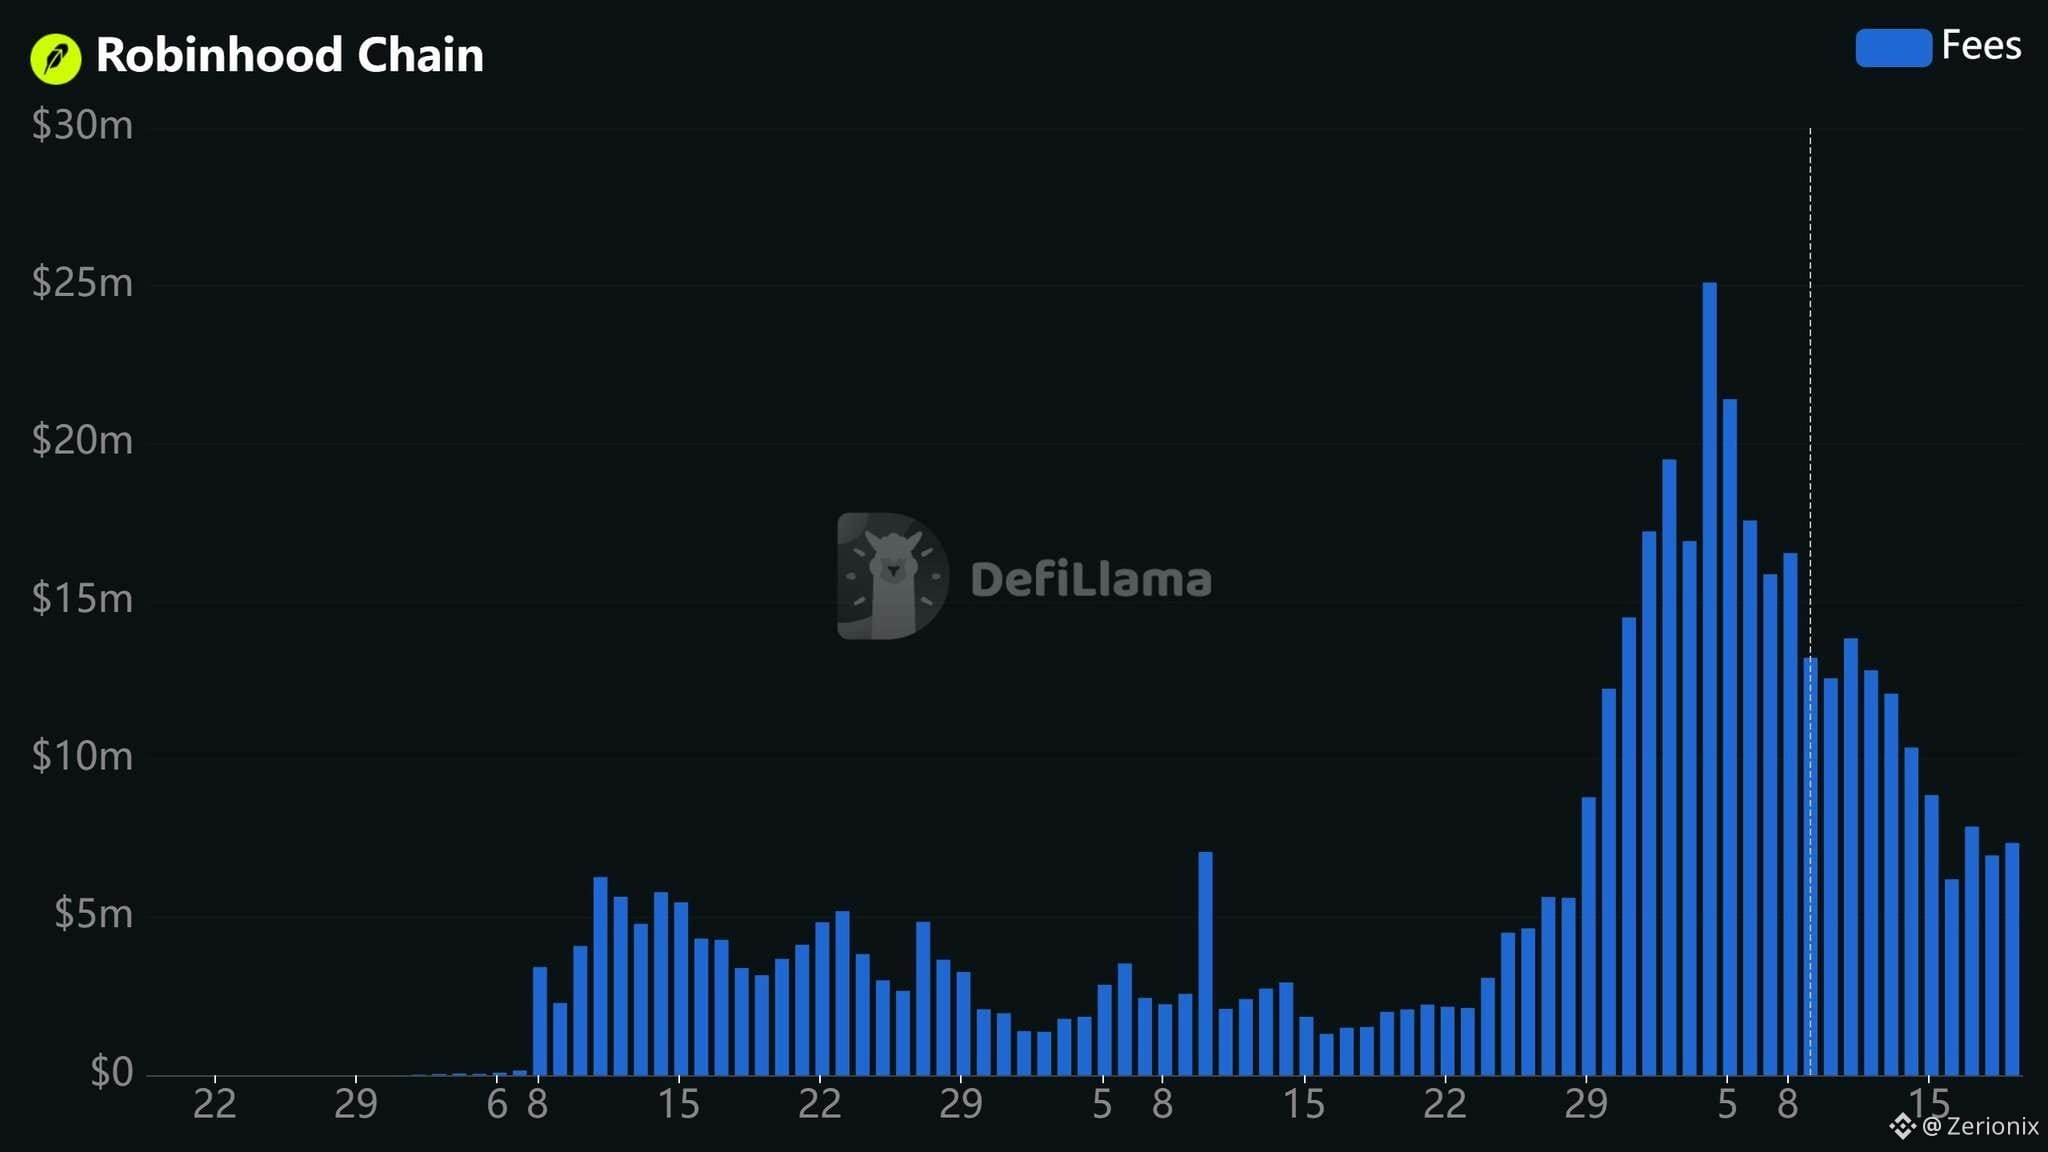
Комиссии в сети Robinhood упали на 97% почти без изменений в количестве транзакций, и именно разрыв между этими цифрами — настоящая история, а не само по себе «обрушение».
На пике в начале сентября сеть привлекала примерно $8 млн дневных комиссий с 13,1 млн транзакций, в среднем по 64 цента за каждую. К 16 сентября дневные комиссии снизились примерно до $230 000 при 8,9 млн транзакций — всего 2,6 цента за транзакцию. Количество транзакций упало на 32% в пересчете на день, но лишь на 6% в среднем за семь дней — гораздо более узкое снижение, чем это выглядит по одной только графике комиссий.
Что выделяется для меня, так это то, что данные по объему активно опровергают прочтение «трейдеры бежали».
DEX’ы Robinhood обработали около $13 млрд за семь дней по 16 сентября — на 5% больше, чем на предыдущей неделе, а предложение стейблкоинов сократилось всего на 1%. Примерно $1,5 млрд по-прежнему ежедневно проходит через сеть. Капитал не ушел — ушла лишь цена его перемещения.
Здесь реальный драйвер — смена структуры активности, а не исход. Pons, мемкоин-лаунчпад, который вызвал ранний всплеск комиссий, увидел падение собственного объема на 37% неделя к неделе — до примерно $616 млн.
Эмиссия и торговля мемкоинами, то есть самой «дорогой» по комиссиям активностью в сети, остыли именно на этом участке, при том что типы транзакций с более низкими комиссиями поддерживали общий уровень пропускной способности близким к максимумам.
Стоит добавить и механическую часть: по сообщениям, Robinhood увеличил газ-лимит сети, чтобы расширить емкость блоков — это осознанный компромисс: более дешевое место в блоке в обмен на масштабирование объема, а не на максимизацию выручки с комиссии на транзакцию. Это реальный стратегический выбор, а не просто органическое охлаждение.
Открытый вопрос — насколько устойчивой будет такая модель комиссий в долгосрочной перспективе. Цепь, которая обрабатывает объем близкий к рекордному при почти нулевых комиссиях, отлично для пользователей и принятия, но в какой-то момент инфраструктуру нужно чем-то финансировать — и вопрос, будет ли это субсидирование, будущий редизайн комиссий или то, что Robinhood возьмет на себя расходы как игру на привлечение клиентов, данным в одиночку не отвечает.
$BTC #Altcoin Season# #Altcoin Season#
Комиссии в сети Robinhood упали на 97% почти без изменений в количестве транзакций, и именно разрыв между этими цифрами — настоящая история, а не само по себе «обрушение».
На пике в начале сентября сеть привлекала примерно $8 млн дневных комиссий с 13,1 млн транзакций, в среднем по 64 цента за каждую. К 16 сентября дневные комиссии снизились примерно до $230 000 при 8,9 млн транзакций — всего 2,6 цента за транзакцию. Количество транзакций упало на 32% в пересчете на день, но лишь на 6% в среднем за семь дней — гораздо более узкое снижение, чем это выглядит по одной только графике комиссий.
Что выделяется для меня, так это то, что данные по объему активно опровергают прочтение «трейдеры бежали».
DEX’ы Robinhood обработали около $13 млрд за семь дней по 16 сентября — на 5% больше, чем на предыдущей неделе, а предложение стейблкоинов сократилось всего на 1%. Примерно $1,5 млрд по-прежнему ежедневно проходит через сеть. Капитал не ушел — ушла лишь цена его перемещения.
Здесь реальный драйвер — смена структуры активности, а не исход. Pons, мемкоин-лаунчпад, который вызвал ранний всплеск комиссий, увидел падение собственного объема на 37% неделя к неделе — до примерно $616 млн.
Эмиссия и торговля мемкоинами, то есть самой «дорогой» по комиссиям активностью в сети, остыли именно на этом участке, при том что типы транзакций с более низкими комиссиями поддерживали общий уровень пропускной способности близким к максимумам.
Стоит добавить и механическую часть: по сообщениям, Robinhood увеличил газ-лимит сети, чтобы расширить емкость блоков — это осознанный компромисс: более дешевое место в блоке в обмен на масштабирование объема, а не на максимизацию выручки с комиссии на транзакцию. Это реальный стратегический выбор, а не просто органическое охлаждение.
Открытый вопрос — насколько устойчивой будет такая модель комиссий в долгосрочной перспективе. Цепь, которая обрабатывает объем близкий к рекордному при почти нулевых комиссиях, отлично для пользователей и принятия, но в какой-то момент инфраструктуру нужно чем-то финансировать — и вопрос, будет ли это субсидирование, будущий редизайн комиссий или то, что Robinhood возьмет на себя расходы как игру на привлечение клиентов, данным в одиночку не отвечает.
$BTC #Altcoin Season# #Altcoin Season#
На пике в начале сентября сеть привлекала примерно $8 млн дневных комиссий с 13,1 млн транзакций, в среднем по 64 цента за каждую. К 16 сентября дневные комиссии снизились примерно до $230 000 при 8,9 млн транзакций — всего 2,6 цента за транзакцию. Количество транзакций упало на 32% в пересчете на день, но лишь на 6% в среднем за семь дней — гораздо более узкое снижение, чем это выглядит по одной только графике комиссий.
Что выделяется для меня, так это то, что данные по объему активно опровергают прочтение «трейдеры бежали».
DEX’ы Robinhood обработали около $13 млрд за семь дней по 16 сентября — на 5% больше, чем на предыдущей неделе, а предложение стейблкоинов сократилось всего на 1%. Примерно $1,5 млрд по-прежнему ежедневно проходит через сеть. Капитал не ушел — ушла лишь цена его перемещения.
Здесь реальный драйвер — смена структуры активности, а не исход. Pons, мемкоин-лаунчпад, который вызвал ранний всплеск комиссий, увидел падение собственного объема на 37% неделя к неделе — до примерно $616 млн.
Эмиссия и торговля мемкоинами, то есть самой «дорогой» по комиссиям активностью в сети, остыли именно на этом участке, при том что типы транзакций с более низкими комиссиями поддерживали общий уровень пропускной способности близким к максимумам.
Стоит добавить и механическую часть: по сообщениям, Robinhood увеличил газ-лимит сети, чтобы расширить емкость блоков — это осознанный компромисс: более дешевое место в блоке в обмен на масштабирование объема, а не на максимизацию выручки с комиссии на транзакцию. Это реальный стратегический выбор, а не просто органическое охлаждение.
Открытый вопрос — насколько устойчивой будет такая модель комиссий в долгосрочной перспективе. Цепь, которая обрабатывает объем близкий к рекордному при почти нулевых комиссиях, отлично для пользователей и принятия, но в какой-то момент инфраструктуру нужно чем-то финансировать — и вопрос, будет ли это субсидирование, будущий редизайн комиссий или то, что Robinhood возьмет на себя расходы как игру на привлечение клиентов, данным в одиночку не отвечает.
$BTC #Altcoin Season# #Altcoin Season#
46
·
--
Обновление Glamsterdam для Ethereum теперь нацелено на четвертый квартал 2026 года: разработчики продлевают тестирование перед запуском в основной сети.
Обновление направлено на одну из крупнейших проблем Ethereum: как обрабатывать больше активности, не делая сеть более сложной или более дорогой в использовании.
Glamsterdam объединяет изменения на уровнях консенсуса и исполнения Ethereum, включая закреплённое разделение proposer builder, списки доступов на уровне блока и новую модель стоимости газа для состояния. Цель — увеличить пропускную способность блоков и лучше использовать каждый 12-секундный слот, сохраняя при этом сеть управляемой для валидаторов.
Лично мне кажется, что интересная часть заключается не просто в том, что «Ethereum становится быстрее».
Важнее то, что Ethereum пытается масштабировать базовый слой, не жертвуя децентрализацией.
Это куда более сложная задача.
Увеличить пропускную способность легко, если согласиться поднять требования к оборудованию. Сложность — нарастить ёмкость при этом всё ещё позволяя обычным операторам участвовать.
И здесь есть риск. Glamsterdam уже был сдвинут ближе к Q4, и обновление требует существенных изменений в кошельках, инфраструктуре и инструментах для разработчиков. Больше тестирования означает больше времени, но это также показывает, насколько сложной стала дорожная карта масштабирования Ethereum.
Если Ethereum сделает всё правильно, выгода будет не только в более дешёвых транзакциях.
Это даст L2 и приложениям более надёжный слой урегулирования снизу.
Главная проверка не в том, запустится ли Glamsterdam. Главный вопрос — сможет ли Ethereum нарастить пропускную способность, не превращая децентрализацию в цену масштабирования.
Коротко: Ethereum готовит очередное крупное обновление масштабирования. Больше скорости, дешевле и больше ёмкости — звучит отлично, но настоящее достижение было бы прийти к этому, не делая сеть сложнее для эксплуатации.
$ETH #BTC Price Analysis# #Meme Alpha# #BTC Price Analysis#
Обновление Glamsterdam для Ethereum теперь нацелено на четвертый квартал 2026 года: разработчики продлевают тестирование перед запуском в основной сети.
Обновление направлено на одну из крупнейших проблем Ethereum: как обрабатывать больше активности, не делая сеть более сложной или более дорогой в использовании.
Glamsterdam объединяет изменения на уровнях консенсуса и исполнения Ethereum, включая закреплённое разделение proposer builder, списки доступов на уровне блока и новую модель стоимости газа для состояния. Цель — увеличить пропускную способность блоков и лучше использовать каждый 12-секундный слот, сохраняя при этом сеть управляемой для валидаторов.
Лично мне кажется, что интересная часть заключается не просто в том, что «Ethereum становится быстрее».
Важнее то, что Ethereum пытается масштабировать базовый слой, не жертвуя децентрализацией.
Это куда более сложная задача.
Увеличить пропускную способность легко, если согласиться поднять требования к оборудованию. Сложность — нарастить ёмкость при этом всё ещё позволяя обычным операторам участвовать.
И здесь есть риск. Glamsterdam уже был сдвинут ближе к Q4, и обновление требует существенных изменений в кошельках, инфраструктуре и инструментах для разработчиков. Больше тестирования означает больше времени, но это также показывает, насколько сложной стала дорожная карта масштабирования Ethereum.
Если Ethereum сделает всё правильно, выгода будет не только в более дешёвых транзакциях.
Это даст L2 и приложениям более надёжный слой урегулирования снизу.
Главная проверка не в том, запустится ли Glamsterdam. Главный вопрос — сможет ли Ethereum нарастить пропускную способность, не превращая децентрализацию в цену масштабирования.
Коротко: Ethereum готовит очередное крупное обновление масштабирования. Больше скорости, дешевле и больше ёмкости — звучит отлично, но настоящее достижение было бы прийти к этому, не делая сеть сложнее для эксплуатации.
$ETH #BTC Price Analysis# #Meme Alpha# #BTC Price Analysis#
Обновление направлено на одну из крупнейших проблем Ethereum: как обрабатывать больше активности, не делая сеть более сложной или более дорогой в использовании.
Glamsterdam объединяет изменения на уровнях консенсуса и исполнения Ethereum, включая закреплённое разделение proposer builder, списки доступов на уровне блока и новую модель стоимости газа для состояния. Цель — увеличить пропускную способность блоков и лучше использовать каждый 12-секундный слот, сохраняя при этом сеть управляемой для валидаторов.
Лично мне кажется, что интересная часть заключается не просто в том, что «Ethereum становится быстрее».
Важнее то, что Ethereum пытается масштабировать базовый слой, не жертвуя децентрализацией.
Это куда более сложная задача.
Увеличить пропускную способность легко, если согласиться поднять требования к оборудованию. Сложность — нарастить ёмкость при этом всё ещё позволяя обычным операторам участвовать.
И здесь есть риск. Glamsterdam уже был сдвинут ближе к Q4, и обновление требует существенных изменений в кошельках, инфраструктуре и инструментах для разработчиков. Больше тестирования означает больше времени, но это также показывает, насколько сложной стала дорожная карта масштабирования Ethereum.
Если Ethereum сделает всё правильно, выгода будет не только в более дешёвых транзакциях.
Это даст L2 и приложениям более надёжный слой урегулирования снизу.
Главная проверка не в том, запустится ли Glamsterdam. Главный вопрос — сможет ли Ethereum нарастить пропускную способность, не превращая децентрализацию в цену масштабирования.
Коротко: Ethereum готовит очередное крупное обновление масштабирования. Больше скорости, дешевле и больше ёмкости — звучит отлично, но настоящее достижение было бы прийти к этому, не делая сеть сложнее для эксплуатации.
$ETH #BTC Price Analysis# #Meme Alpha# #BTC Price Analysis#

51
·
--
Рыночная капитализация стейблкоинов TRON выросла на $4,8 млрд всего за 90 дней — по сообщениям, рост оказался больше, чем совокупный прирост по остальным девяти крупнейшим блокчейнам.
Это довольно серьёзный сигнал о ликвидности.
Сейчас TRON располагает примерно $91,6 млрд в стейблкоинах, при этом на USDT приходится около $87,9 млрд. Также, по сообщениям, именно TRON обеспечивает почти половину всего USDT, размещённого в блокчейнах.
И вот здесь, как мне кажется, цифры становятся особенно интересными.
Рост стейблкоинов — это не то же самое, что активный приток капитала в TRX или DeFi. Но это показывает, что огромный объём долларовой ликвидности продолжает выбирать TRON в качестве расчётного канала.
Это важно, потому что в последние годы самый сильный сценарий использования TRON всё меньше связан со спекулятивным DeFi и всё больше — с недорогой передачей стоимости в долларах через границы.
Лично мне именно это кажется более убедительным.
Сколько угодно можно спорить об экосистеме TRON, но $90 млрд+ в стейблкоинах трудно списать исключительно на нарратив.
Теперь вопрос в том, продолжает ли эта ликвидность превращаться в транзакции, платежи, DeFi-активность и устойчивую сетевую выручку — а не просто лежать там припаркованным USDT.
Потому что $4,8 млрд новой стейблкоин-ликвидности — это впечатляюще.
То, что пользователи реально делают с ней, и есть главный сигнал.
#Meme Alpha# #Meme Alpha# $TRX
Рыночная капитализация стейблкоинов TRON выросла на $4,8 млрд всего за 90 дней — по сообщениям, рост оказался больше, чем совокупный прирост по остальным девяти крупнейшим блокчейнам.
Это довольно серьёзный сигнал о ликвидности.
Сейчас TRON располагает примерно $91,6 млрд в стейблкоинах, при этом на USDT приходится около $87,9 млрд. Также, по сообщениям, именно TRON обеспечивает почти половину всего USDT, размещённого в блокчейнах.
И вот здесь, как мне кажется, цифры становятся особенно интересными.
Рост стейблкоинов — это не то же самое, что активный приток капитала в TRX или DeFi. Но это показывает, что огромный объём долларовой ликвидности продолжает выбирать TRON в качестве расчётного канала.
Это важно, потому что в последние годы самый сильный сценарий использования TRON всё меньше связан со спекулятивным DeFi и всё больше — с недорогой передачей стоимости в долларах через границы.
Лично мне именно это кажется более убедительным.
Сколько угодно можно спорить об экосистеме TRON, но $90 млрд+ в стейблкоинах трудно списать исключительно на нарратив.
Теперь вопрос в том, продолжает ли эта ликвидность превращаться в транзакции, платежи, DeFi-активность и устойчивую сетевую выручку — а не просто лежать там припаркованным USDT.
Потому что $4,8 млрд новой стейблкоин-ликвидности — это впечатляюще.
То, что пользователи реально делают с ней, и есть главный сигнал.
#Meme Alpha# #Meme Alpha# $TRX
Это довольно серьёзный сигнал о ликвидности.
Сейчас TRON располагает примерно $91,6 млрд в стейблкоинах, при этом на USDT приходится около $87,9 млрд. Также, по сообщениям, именно TRON обеспечивает почти половину всего USDT, размещённого в блокчейнах.
И вот здесь, как мне кажется, цифры становятся особенно интересными.
Рост стейблкоинов — это не то же самое, что активный приток капитала в TRX или DeFi. Но это показывает, что огромный объём долларовой ликвидности продолжает выбирать TRON в качестве расчётного канала.
Это важно, потому что в последние годы самый сильный сценарий использования TRON всё меньше связан со спекулятивным DeFi и всё больше — с недорогой передачей стоимости в долларах через границы.
Лично мне именно это кажется более убедительным.
Сколько угодно можно спорить об экосистеме TRON, но $90 млрд+ в стейблкоинах трудно списать исключительно на нарратив.
Теперь вопрос в том, продолжает ли эта ликвидность превращаться в транзакции, платежи, DeFi-активность и устойчивую сетевую выручку — а не просто лежать там припаркованным USDT.
Потому что $4,8 млрд новой стейблкоин-ликвидности — это впечатляюще.
То, что пользователи реально делают с ней, и есть главный сигнал.
#Meme Alpha# #Meme Alpha# $TRX

3
Войдите, чтобы посмотреть больше материала
Присоединяйтесь к пользователям криптовалют по всему миру на Binance Square
⚡️ Получайте новейшую и полезную информацию о криптоактивах.
💬 Нам доверяет крупнейшая в мире криптобиржа.
👍 Получите достоверные аналитические данные от верифицированных создателей контента.
Эл. почта/номер телефона