

TEKT0NIC 1
1.4k Публикации

TEKT0NIC 1
Отправить жалобу
Заблокировать пользователя
Passionate about crypto and blockchain | Crypto Enthusiastic | Technical Analysis | Fundamental News
0 подписок(и/а)
10 подписчиков(а)
39 понравилось
Посты
·
--
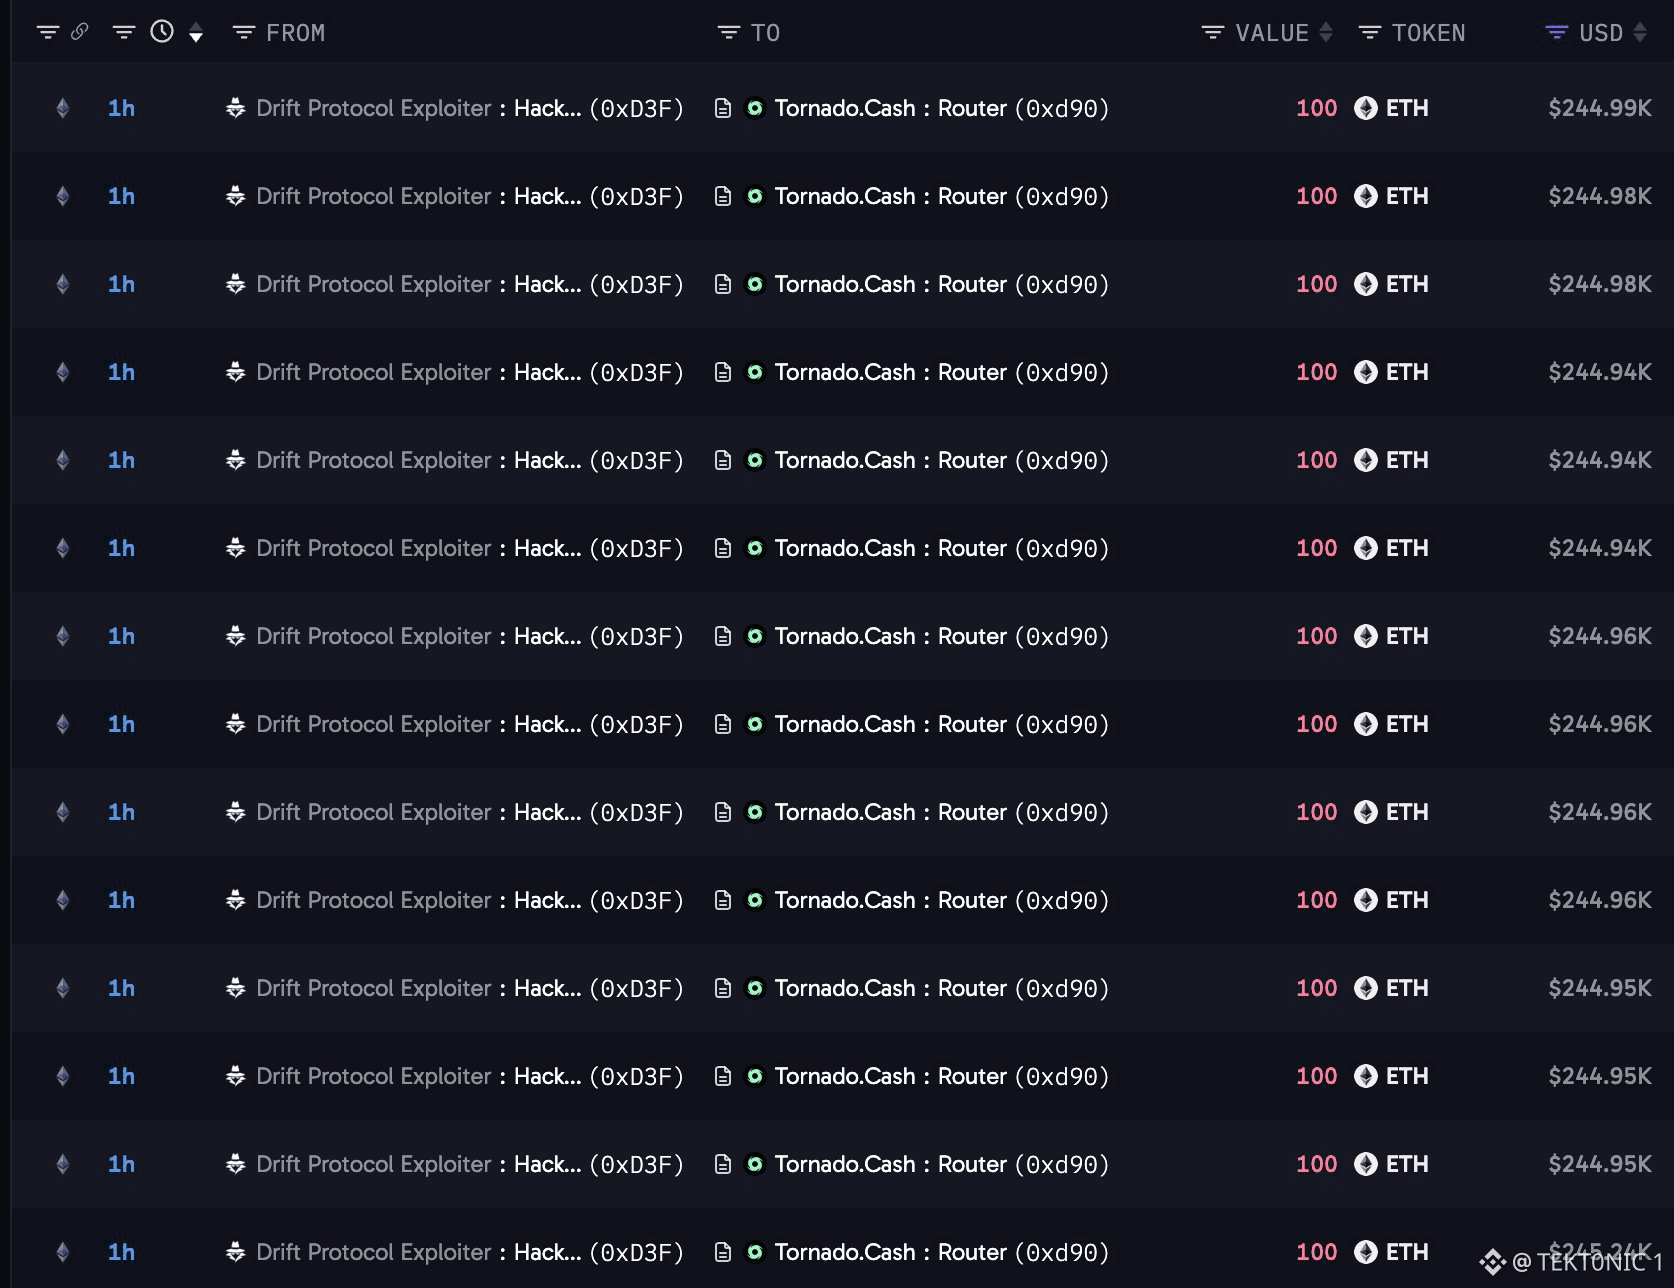
Злоумышленник, воспользовавшийся уязвимостью Drift Protocol, внес в Tornado Cash еще 24,885 $ETH стоимостью около 61,3 млн долларов. Переводы отправлялись повторяющимися партиями по 100 ETH. Lookonchain отследила депозиты и отметила, что на тех же адресах по-прежнему хранится 56,569 ETH стоимостью примерно 139,3 млн долларов. Этому предшествовала первая серия депозитов в Tornado Cash в июле. В результате первоначальной атаки в апреле из Drift Protocol в сети Solana было выведено более 270 млн долларов. Позже большая часть активов была обменена и переведена в Ethereum. Компания по кибербезопасности Mandiant связала атаку с группировкой, имеющей отношение к Северной Корее. Депозиты в Tornado Cash разрывают прямую связь между адресом отправителя и любым последующим выводом средств. Оставшиеся 56,569 $ETH пока не прошли через миксер. В начале октября Drift открыла пул для возмещения потерь, однако первые выплаты составили около одного цента на каждый доллар подтвержденных убытков. Последние депозиты показывают, что злоумышленник продолжает активно перемещать средства. Пока что основная часть баланса остается вне миксера. От того, последуют ли оставшиеся ETH тем же путем, зависит, какая их часть останется отслеживаемой. #Анализ цены BTC# #Прогноз цены Bitcoin: какой будет следующий шаг Bitcoin?# #Ethereum $BTC
Злоумышленник, воспользовавшийся уязвимостью Drift Protocol, внес в Tornado Cash еще 24,885 $ETH стоимостью около 61,3 млн долларов. Переводы отправлялись повторяющимися партиями по 100 ETH. Lookonchain отследила депозиты и отметила, что на тех же адресах по-прежнему хранится 56,569 ETH стоимостью примерно 139,3 млн долларов. Этому предшествовала первая серия депозитов в Tornado Cash в июле. В результате первоначальной атаки в апреле из Drift Protocol в сети Solana было выведено более 270 млн долларов. Позже большая часть активов была обменена и переведена в Ethereum. Компания по кибербезопасности Mandiant связала атаку с группировкой, имеющей отношение к Северной Корее. Депозиты в Tornado Cash разрывают прямую связь между адресом отправителя и любым последующим выводом средств. Оставшиеся 56,569 $ETH пока не прошли через миксер. В начале октября Drift открыла пул для возмещения потерь, однако первые выплаты составили около одного цента на каждый доллар подтвержденных убытков. Последние депозиты показывают, что злоумышленник продолжает активно перемещать средства. Пока что основная часть баланса остается вне миксера. От того, последуют ли оставшиеся ETH тем же путем, зависит, какая их часть останется отслеживаемой. #Анализ цены BTC# #Прогноз цены Bitcoin: какой будет следующий шаг Bitcoin?# #Ethereum $BTC
·
--
Распространение RWA выходит за рамки токенизированных казначейских облигаций. Объём рынка токенизированных активов реального мира достиг $39,3 млрд, но спрос формируется в разных сегментах рынка. Казначейские облигации: $14,7 млрд, или 37% рынка, — крупнейший сегмент. Сырьевые товары: стоимость токенизированных активов в этом году выросла в 2,6 раза — примерно до $8 млрд, главным образом благодаря активам, обеспеченным золотом. Бессрочные фьючерсы: объём торгов RWA в третьем квартале более чем удвоился и достиг $2,57 трлн, поскольку трейдеры получили более широкий доступ к акциям и сырьевым товарам. Токенизированные акции: на них приходится всего 8% стоимости активов, но при этом 93% спотового объёма в ончейне. За последней цифрой стоит следить. Она указывает на то, что токенизированные акции привлекают гораздо больше торговой активности, чем можно было бы ожидать исходя из их доли на всём рынке. Рост RWA теперь связан не только с размещением традиционных активов в ончейне. Важную роль играет и то, как люди торгуют ими, хранят их и используют на крипторынках. #Анализ цены BTC# #Макрообзор# #RWA $BTC $PUMP
Распространение RWA выходит за рамки токенизированных казначейских облигаций. Объём рынка токенизированных активов реального мира достиг $39,3 млрд, но спрос формируется в разных сегментах рынка. Казначейские облигации: $14,7 млрд, или 37% рынка, — крупнейший сегмент. Сырьевые товары: стоимость токенизированных активов в этом году выросла в 2,6 раза — примерно до $8 млрд, главным образом благодаря активам, обеспеченным золотом. Бессрочные фьючерсы: объём торгов RWA в третьем квартале более чем удвоился и достиг $2,57 трлн, поскольку трейдеры получили более широкий доступ к акциям и сырьевым товарам. Токенизированные акции: на них приходится всего 8% стоимости активов, но при этом 93% спотового объёма в ончейне. За последней цифрой стоит следить. Она указывает на то, что токенизированные акции привлекают гораздо больше торговой активности, чем можно было бы ожидать исходя из их доли на всём рынке. Рост RWA теперь связан не только с размещением традиционных активов в ончейне. Важную роль играет и то, как люди торгуют ими, хранят их и используют на крипторынках. #Анализ цены BTC# #Макрообзор# #RWA $BTC $PUMP
29
·
--
См. перевод
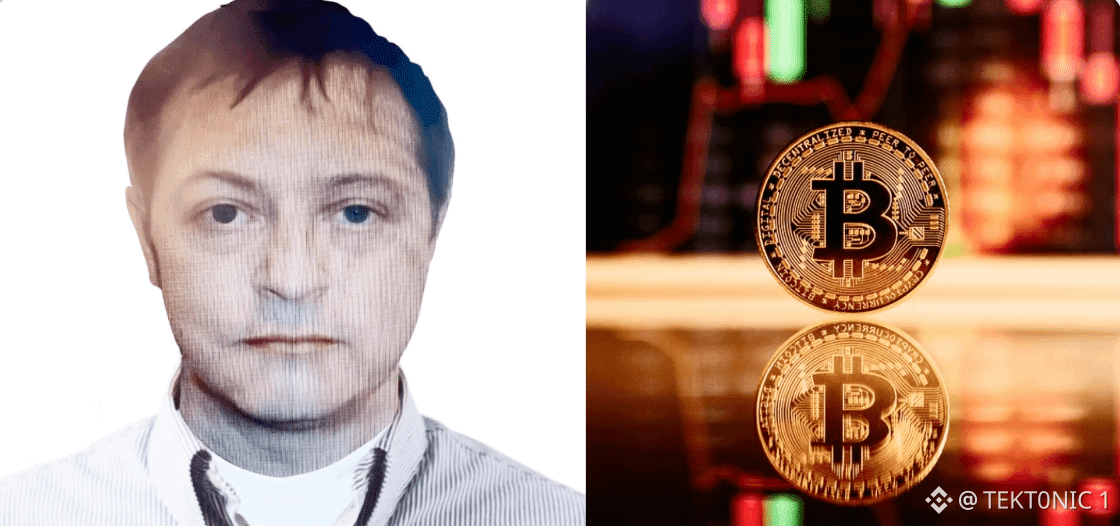
A Bitcoin wallet linked to convicted Irish drug dealer Clifton Collins has moved 500 $BTC to Coinbase Prime after nearly a decade of inactivity. Lookonchain valued the transfer at $41.52 million. The sending address had been dormant for more than ten years. This is the fifth 500 BTC movement from Collins-linked wallets in 2026, bringing the total transferred this year to 2,500 BTC. The latest batch is the third consecutive transfer to the same Coinbase Prime deposit address. Collins reportedly accumulated about 6,000 BTC in 2011 and 2012 and split the coins across 12 wallets of 500 BTC each. Access was thought lost after printed private keys disappeared following his 2017 arrest. Irish authorities, with Europol assistance, have already seized multiple 500 BTC portions this year. the transfer shows coins reaching Coinbase Prime. It does not confirm a sale or identify who authorized the move. Roughly 3,500 $BTC remains in the other addresses linked to the original stash. The pattern of repeated 500 BTC transfers has continued through the year. #BTC Price Analysis# #Bitcoin Price Prediction: What is Bitcoins next move?# $ZEC
A Bitcoin wallet linked to convicted Irish drug dealer Clifton Collins has moved 500 $BTC to Coinbase Prime after nearly a decade of inactivity. Lookonchain valued the transfer at $41.52 million. The sending address had been dormant for more than ten years. This is the fifth 500 BTC movement from Collins-linked wallets in 2026, bringing the total transferred this year to 2,500 BTC. The latest batch is the third consecutive transfer to the same Coinbase Prime deposit address. Collins reportedly accumulated about 6,000 BTC in 2011 and 2012 and split the coins across 12 wallets of 500 BTC each. Access was thought lost after printed private keys disappeared following his 2017 arrest. Irish authorities, with Europol assistance, have already seized multiple 500 BTC portions this year. the transfer shows coins reaching Coinbase Prime. It does not confirm a sale or identify who authorized the move. Roughly 3,500 $BTC remains in the other addresses linked to the original stash. The pattern of repeated 500 BTC transfers has continued through the year. #BTC Price Analysis# #Bitcoin Price Prediction: What is Bitcoins next move?# $ZEC
29
·
--
См. перевод
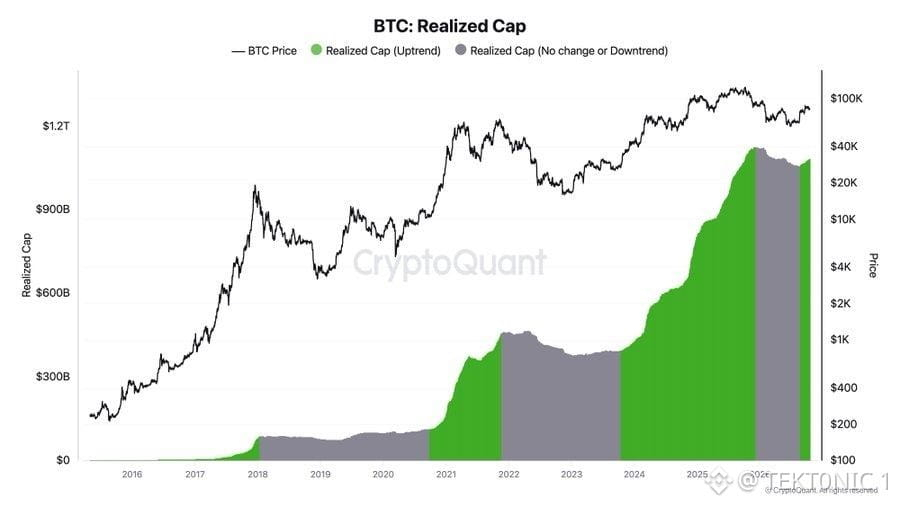
Fresh capital is flowing into Bitcoin, according to CryptoQuant CEO Ki Young Ju. the CryptoQuant chart tracks realized cap, which values each coin at the price it last moved on-chain. Green segments mark periods when realized cap is rising. The latest stretch is green, and the line has climbed back toward $1.1 trillion while $BTC trades near $83,000. realized cap rises when coins change hands at higher prices. That means new money is entering at levels above the previous average cost basis. Ju notes that this pattern has historically appeared during bull markets rather than extended bear phases. the metric does not show the size of daily inflows or whether the buying is coming from ETFs, corporate treasuries, or other holders. It only shows that the network’s aggregate cost basis is moving higher. Price can still pull back while realized cap continues to rise if existing holders are selling into the bid. the current uptrend in realized cap is the signal Ju is highlighting. Whether it continues depends on whether new capital keeps arriving at higher prices. The chart shows the rise. It does not show how long it lasts. #BTC Price Analysis# #Bitcoin Price Prediction: What is Bitcoins next move?# $BTC $ETH
Fresh capital is flowing into Bitcoin, according to CryptoQuant CEO Ki Young Ju. the CryptoQuant chart tracks realized cap, which values each coin at the price it last moved on-chain. Green segments mark periods when realized cap is rising. The latest stretch is green, and the line has climbed back toward $1.1 trillion while $BTC trades near $83,000. realized cap rises when coins change hands at higher prices. That means new money is entering at levels above the previous average cost basis. Ju notes that this pattern has historically appeared during bull markets rather than extended bear phases. the metric does not show the size of daily inflows or whether the buying is coming from ETFs, corporate treasuries, or other holders. It only shows that the network’s aggregate cost basis is moving higher. Price can still pull back while realized cap continues to rise if existing holders are selling into the bid. the current uptrend in realized cap is the signal Ju is highlighting. Whether it continues depends on whether new capital keeps arriving at higher prices. The chart shows the rise. It does not show how long it lasts. #BTC Price Analysis# #Bitcoin Price Prediction: What is Bitcoins next move?# $BTC $ETH
38
·
--
См. перевод
things to do NOW before the next crypto bull run: > preserve your capital: one bad trade shouldn't take you out of the market. > build your network: connect with builders, researchers and people creating real value. > DCA into quality projects: have a plan instead of buying every dip blindly. > learn to take profits: don't let unrealized gains turn into losses because you had no exit plan. > build your watchlist: research projects, tokenomics, unlocks and actual user activity before the hype starts. > keep cash available: you don't need to spend every dollar just because prices are falling. > set entry and exit targets: know what would make you buy, sell or change your mind. > study emerging narratives: understand where capital and user activity are moving before chasing a trend. > manage risk: position sizing, stop-losses and avoiding excessive leverage matter in every market. the goal isn't just to catch the next bull run. it's to enter prepared, protect your capital and know what to do when the market moves. #BTC Price Analysis# #Bitcoin Price Prediction: What is Bitcoins next move?# #Altcoin Season# $BTC $ETH
things to do NOW before the next crypto bull run: > preserve your capital: one bad trade shouldn't take you out of the market. > build your network: connect with builders, researchers and people creating real value. > DCA into quality projects: have a plan instead of buying every dip blindly. > learn to take profits: don't let unrealized gains turn into losses because you had no exit plan. > build your watchlist: research projects, tokenomics, unlocks and actual user activity before the hype starts. > keep cash available: you don't need to spend every dollar just because prices are falling. > set entry and exit targets: know what would make you buy, sell or change your mind. > study emerging narratives: understand where capital and user activity are moving before chasing a trend. > manage risk: position sizing, stop-losses and avoiding excessive leverage matter in every market. the goal isn't just to catch the next bull run. it's to enter prepared, protect your capital and know what to do when the market moves. #BTC Price Analysis# #Bitcoin Price Prediction: What is Bitcoins next move?# #Altcoin Season# $BTC $ETH

61
·
--
См. перевод
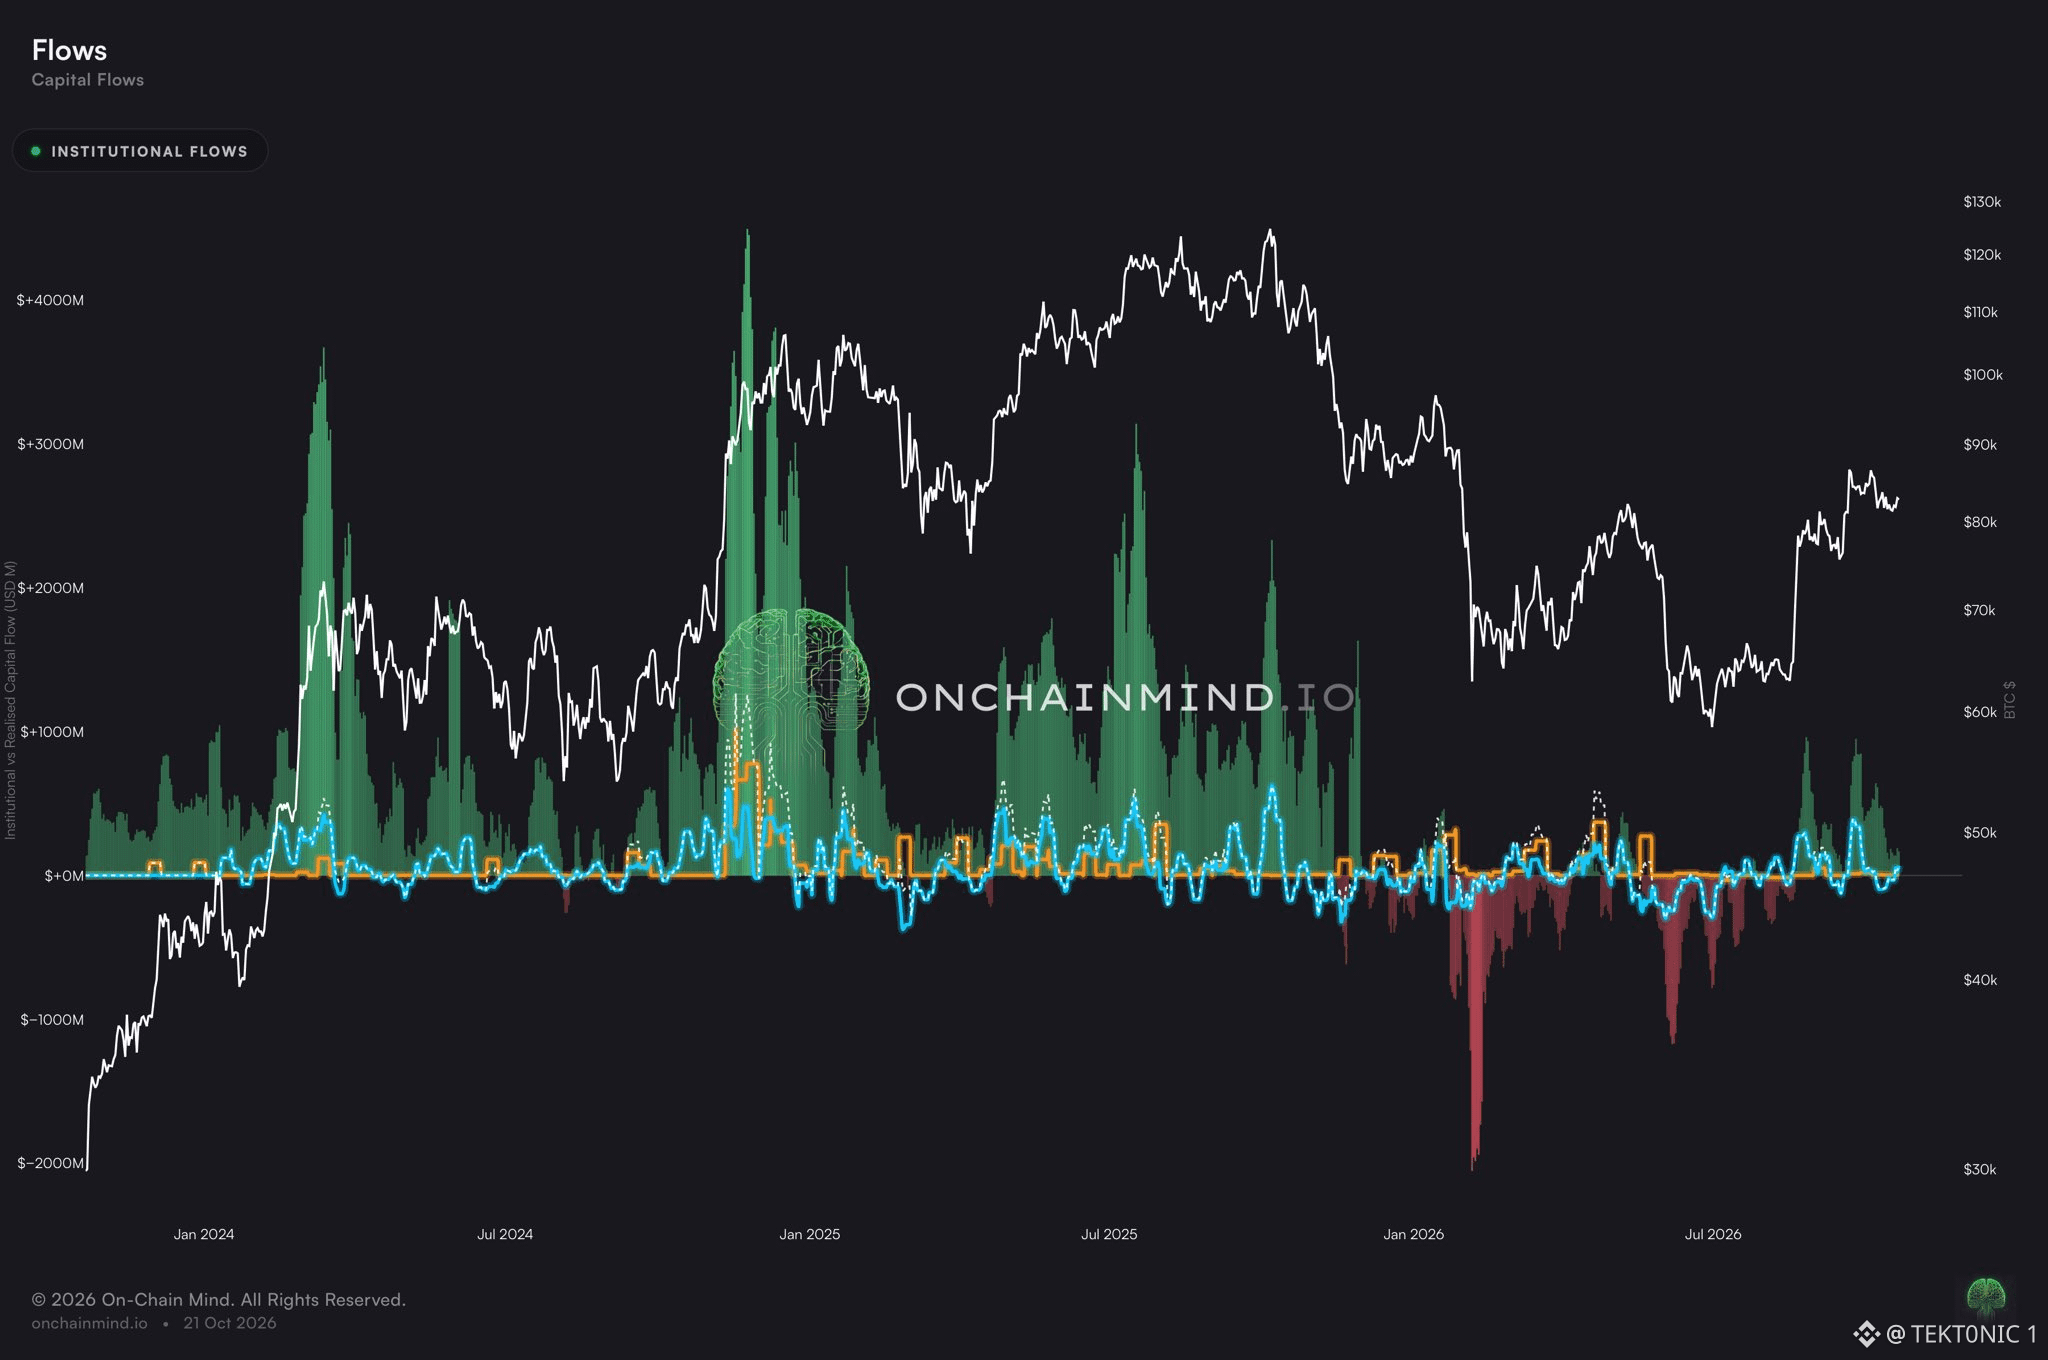
Institutional demand now accounts for 42% of this week’s Bitcoin capital flows. according to On-Chain Mind, spot ETFs contributed $68 million this week while organic demand still leads at $97 million. The chart shows institutional flows (green) as a rising share of total realized capital flow, with the white line tracking Bitcoin’s price across the same period. the 42% figure marks the portion of this week’s net capital inflows that came through traditional finance wrappers rather than direct on-chain or exchange activity. Organic demand remains the larger piece, but the institutional share has grown compared with earlier stretches of the year when green bars were thinner relative to the total. spot ETF flows are creations and redemptions. A positive print means shares were created and the funds bought bitcoin to back them. It is not a single firm selling coins from its own book. The $68 million is still modest next to the $97 million in organic flow, and one week does not set the trend. tradFi wrappers are a larger part of the weekly flow than they were in prior periods on this chart. Whether that share keeps rising depends on whether ETF inflows continue and whether organic demand stays ahead. The current split shows both sources are active. #BTC Price Analysis# #Bitcoin Price Prediction: What is Bitcoins next move?# $BTC $ETH
Institutional demand now accounts for 42% of this week’s Bitcoin capital flows. according to On-Chain Mind, spot ETFs contributed $68 million this week while organic demand still leads at $97 million. The chart shows institutional flows (green) as a rising share of total realized capital flow, with the white line tracking Bitcoin’s price across the same period. the 42% figure marks the portion of this week’s net capital inflows that came through traditional finance wrappers rather than direct on-chain or exchange activity. Organic demand remains the larger piece, but the institutional share has grown compared with earlier stretches of the year when green bars were thinner relative to the total. spot ETF flows are creations and redemptions. A positive print means shares were created and the funds bought bitcoin to back them. It is not a single firm selling coins from its own book. The $68 million is still modest next to the $97 million in organic flow, and one week does not set the trend. tradFi wrappers are a larger part of the weekly flow than they were in prior periods on this chart. Whether that share keeps rising depends on whether ETF inflows continue and whether organic demand stays ahead. The current split shows both sources are active. #BTC Price Analysis# #Bitcoin Price Prediction: What is Bitcoins next move?# $BTC $ETH
72
·
--
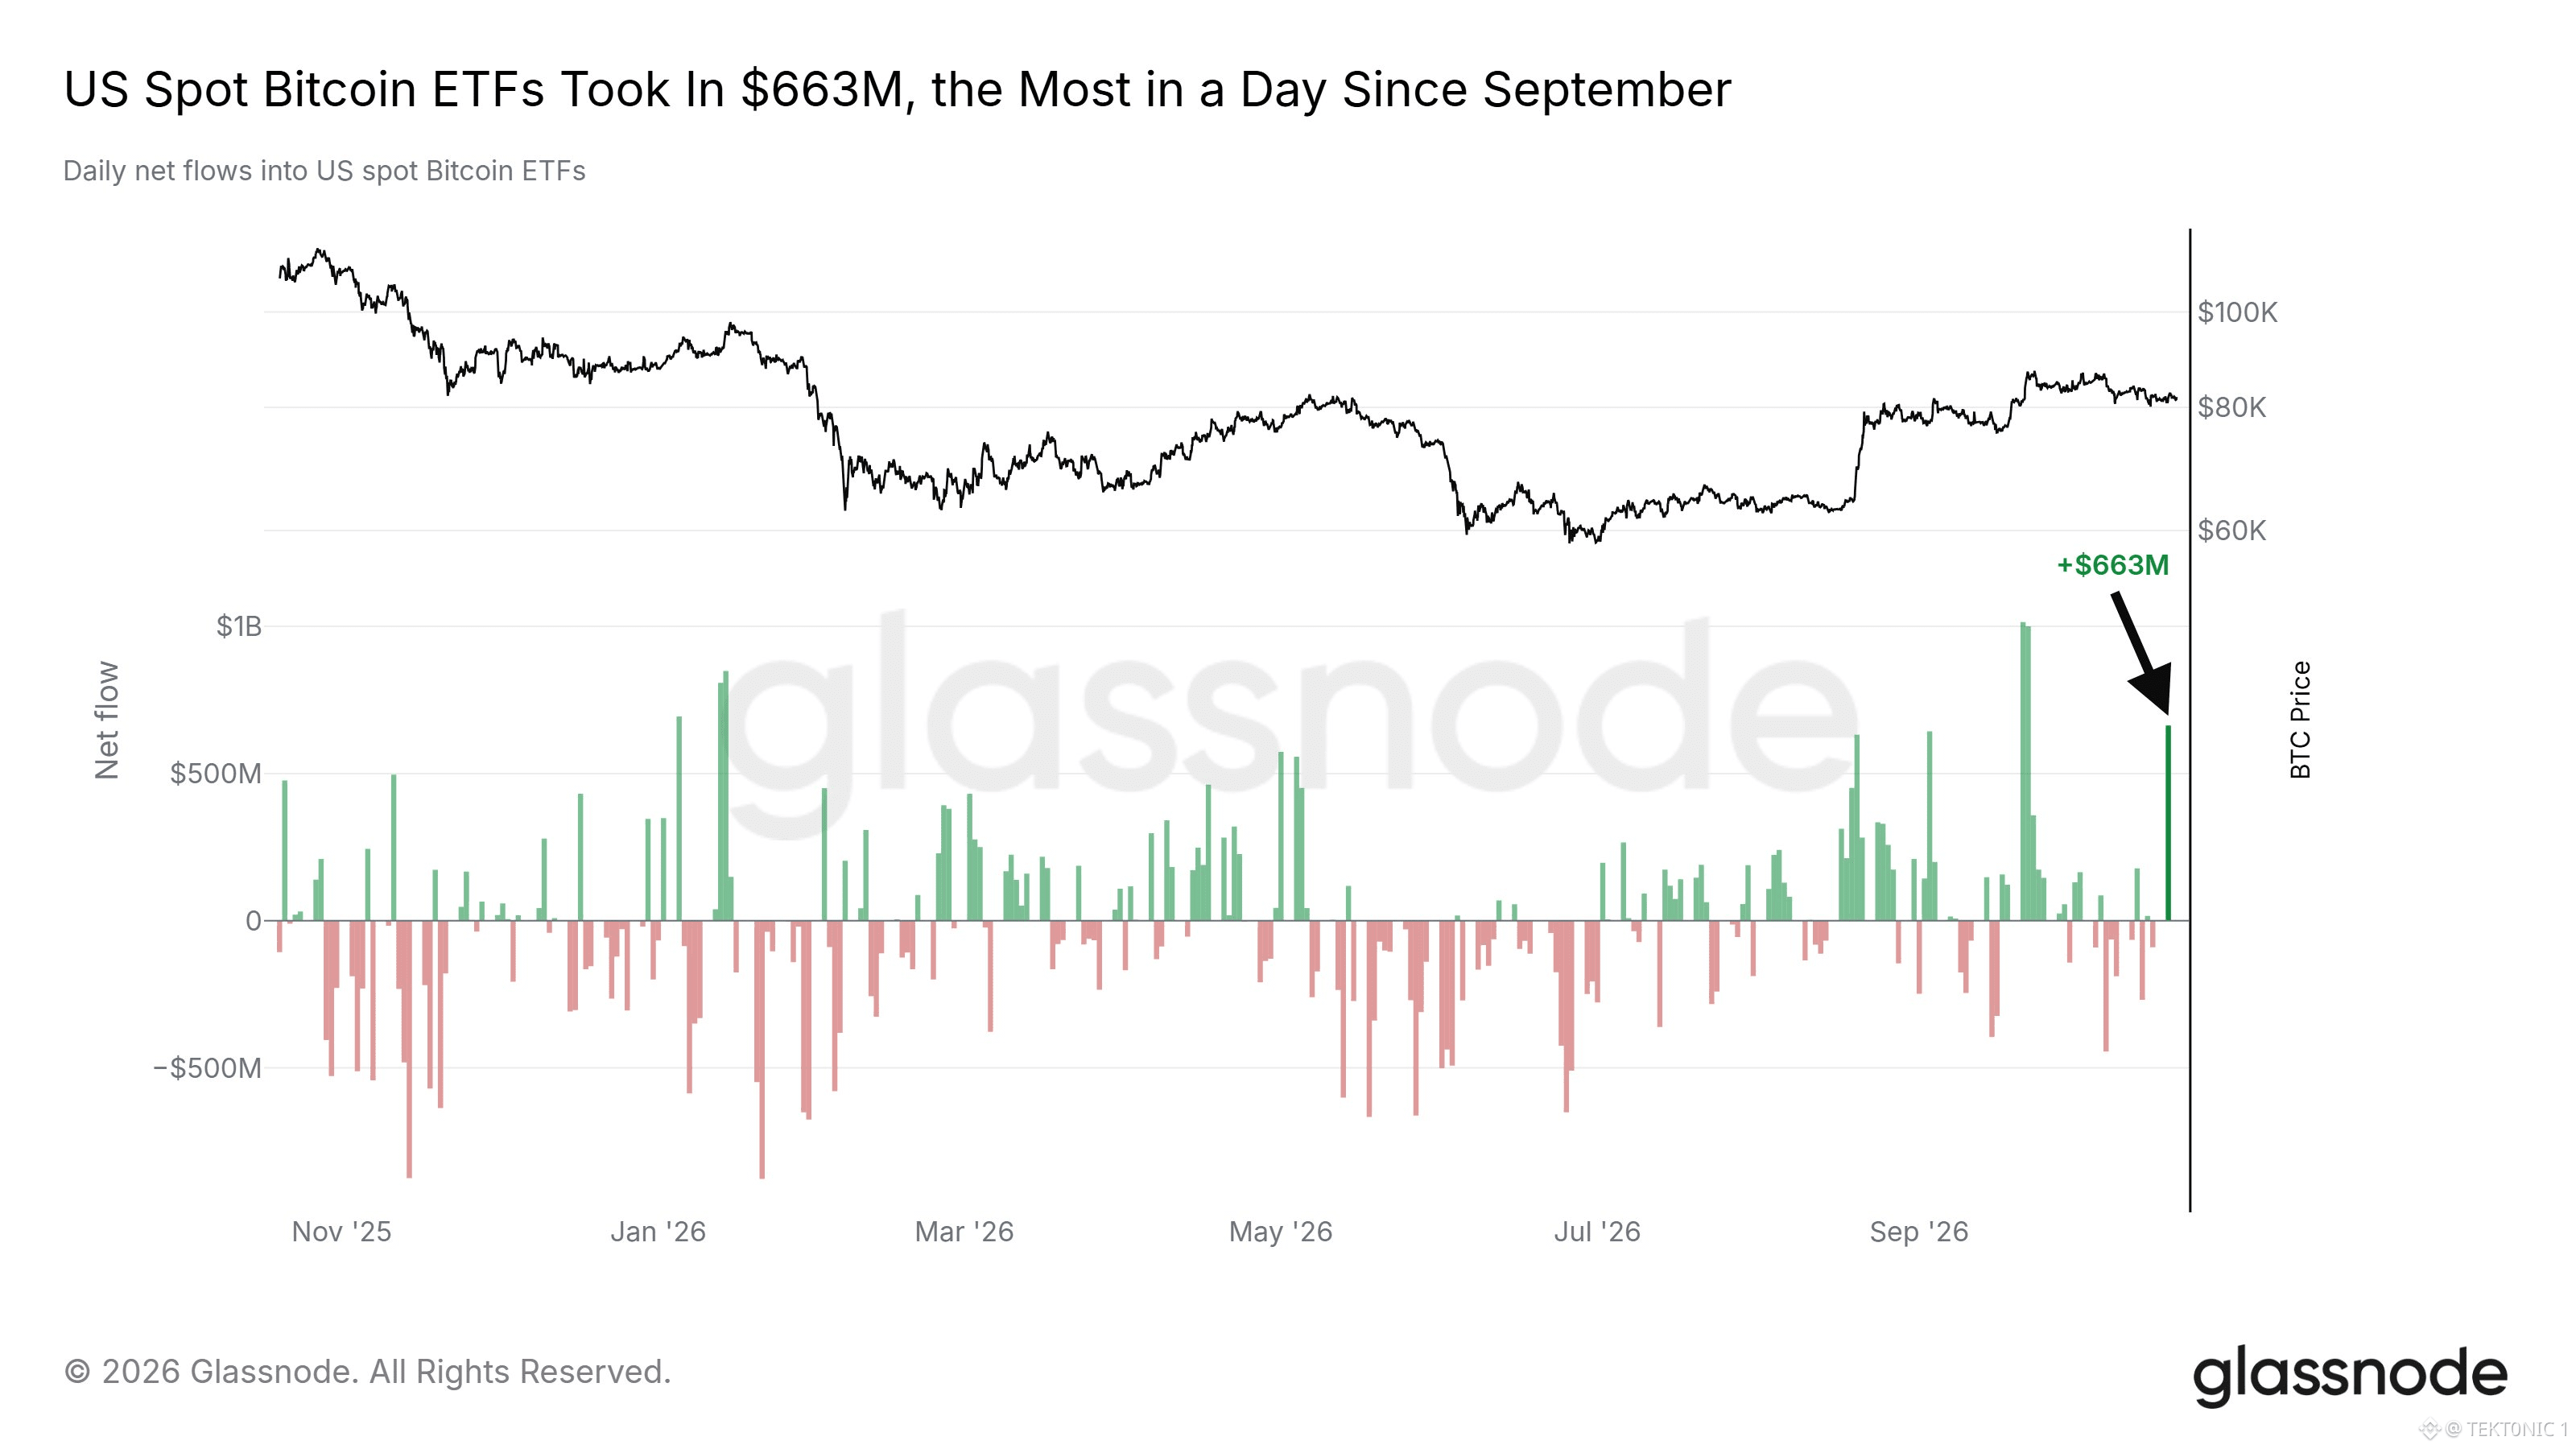
Приток средств в биткоин-ETF составил $663 млн. Институциональный спрос пробуждается? 👀 Спотовые ETF на $BTC в США зафиксировали самый сильный суточный чистый приток средств с сентября: 19 октября в IBIT от BlackRock поступило около $665 млн. Но важна общая картина: из других фондов средства выводили, поэтому чистый приток на весь рынок ETF составил $526,6 млн. Это резкий разворот после нескольких недель давления продаж, однако совокупный приток средств в ETF за октябрь по-прежнему отрицательный. Приток средств в ETF важен, поскольку создание паёв фондов может приносить свежий капитал в продукты, обеспеченные реальными биткоинами, и становиться ещё одним источником спотового спроса. Один сильный день — обнадёживающий сигнал. Несколько дней подряд с чистым притоком стали бы более весомым доказательством возвращения институционального спроса. #Анализ цены BTC# #Прогноз цены Bitcoin: какой будет следующий шаг Bitcoin?# #ETF $BTC $ETH
Приток средств в биткоин-ETF составил $663 млн. Институциональный спрос пробуждается? 👀 Спотовые ETF на $BTC в США зафиксировали самый сильный суточный чистый приток средств с сентября: 19 октября в IBIT от BlackRock поступило около $665 млн. Но важна общая картина: из других фондов средства выводили, поэтому чистый приток на весь рынок ETF составил $526,6 млн. Это резкий разворот после нескольких недель давления продаж, однако совокупный приток средств в ETF за октябрь по-прежнему отрицательный. Приток средств в ETF важен, поскольку создание паёв фондов может приносить свежий капитал в продукты, обеспеченные реальными биткоинами, и становиться ещё одним источником спотового спроса. Один сильный день — обнадёживающий сигнал. Несколько дней подряд с чистым притоком стали бы более весомым доказательством возвращения институционального спроса. #Анализ цены BTC# #Прогноз цены Bitcoin: какой будет следующий шаг Bitcoin?# #ETF $BTC $ETH
28
·
--
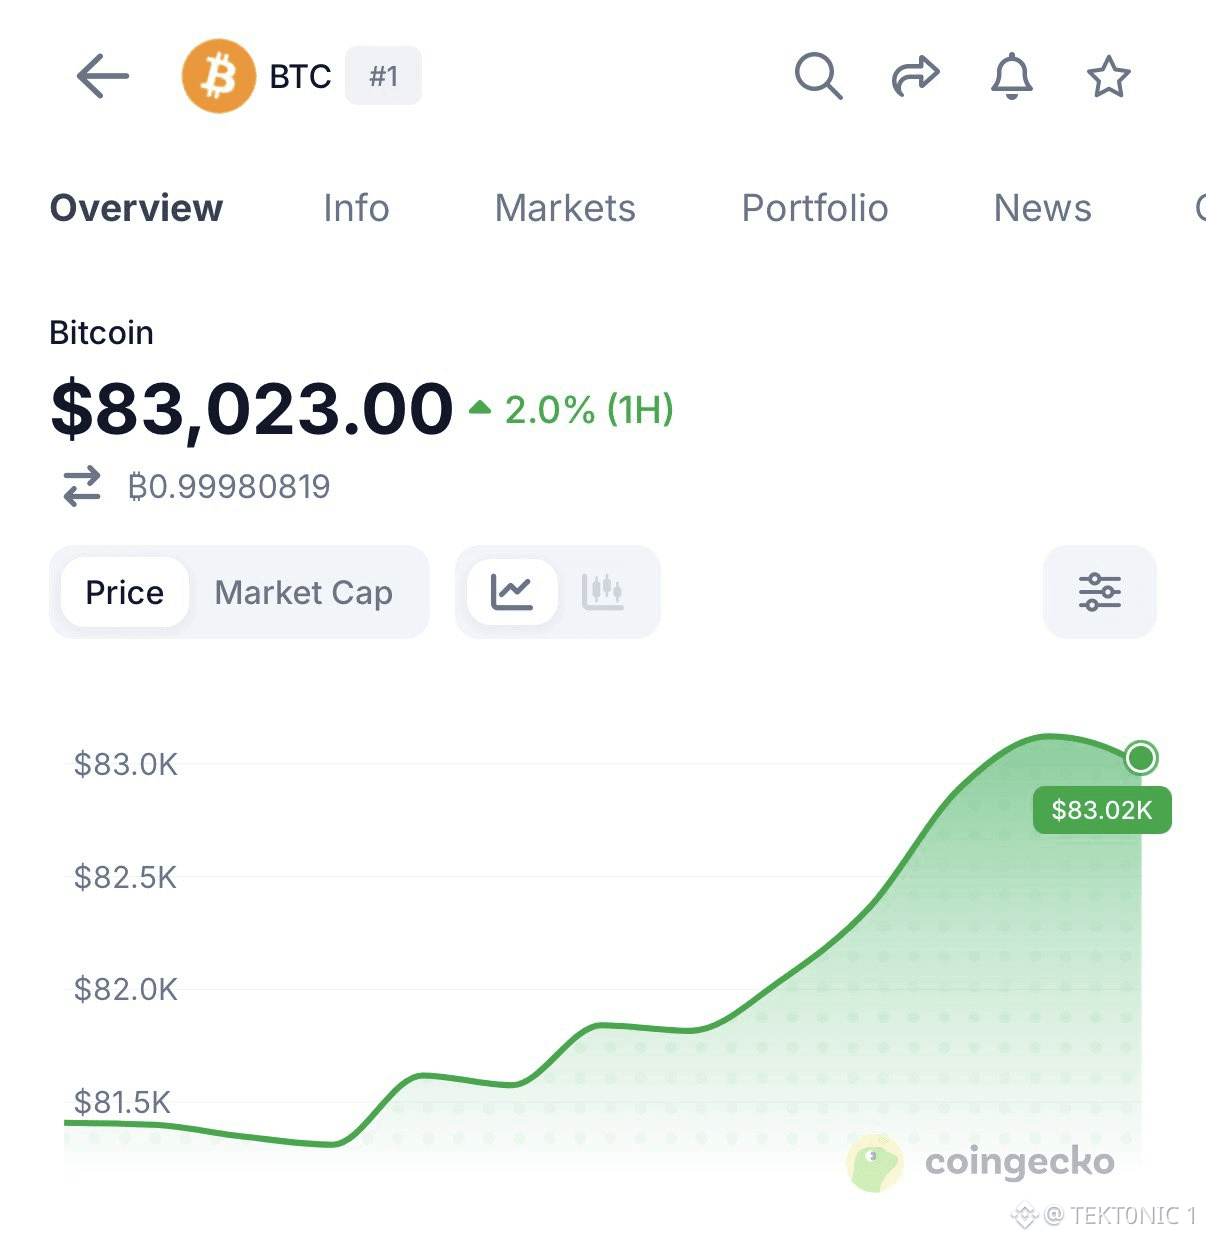
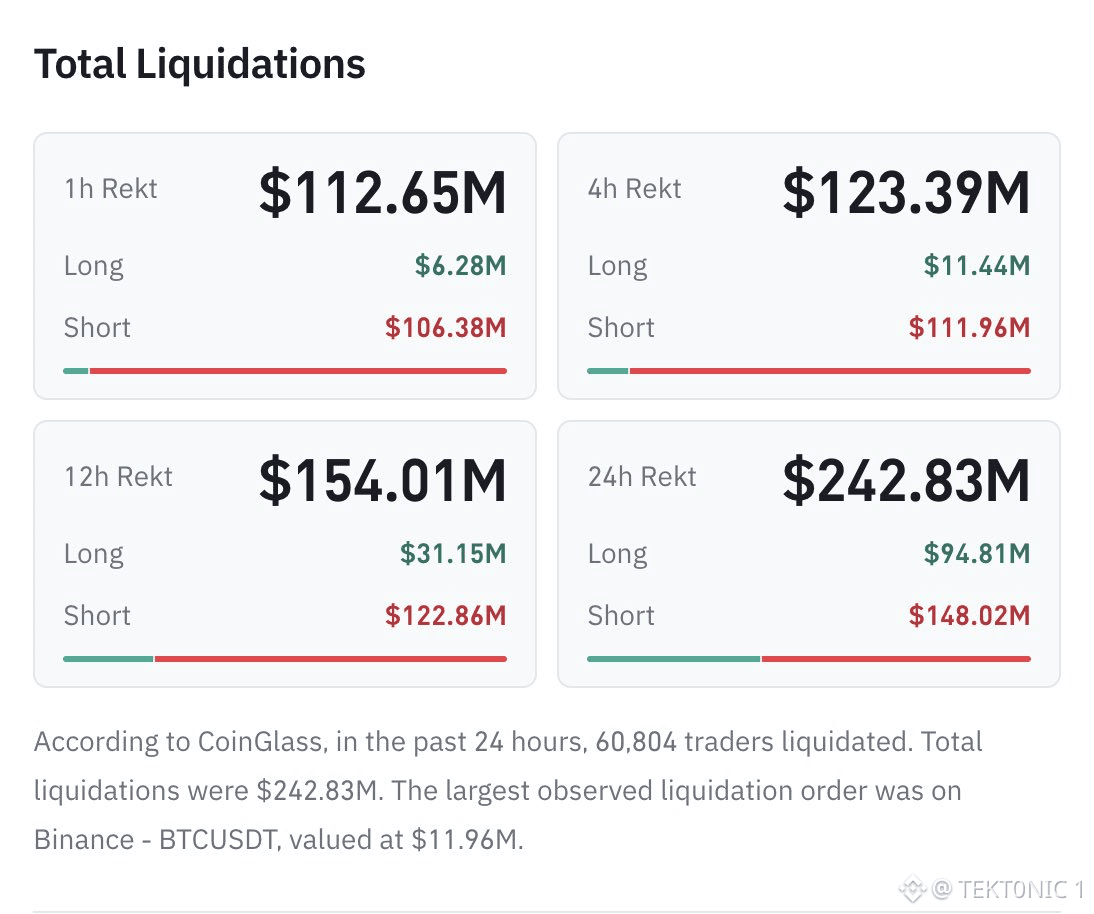
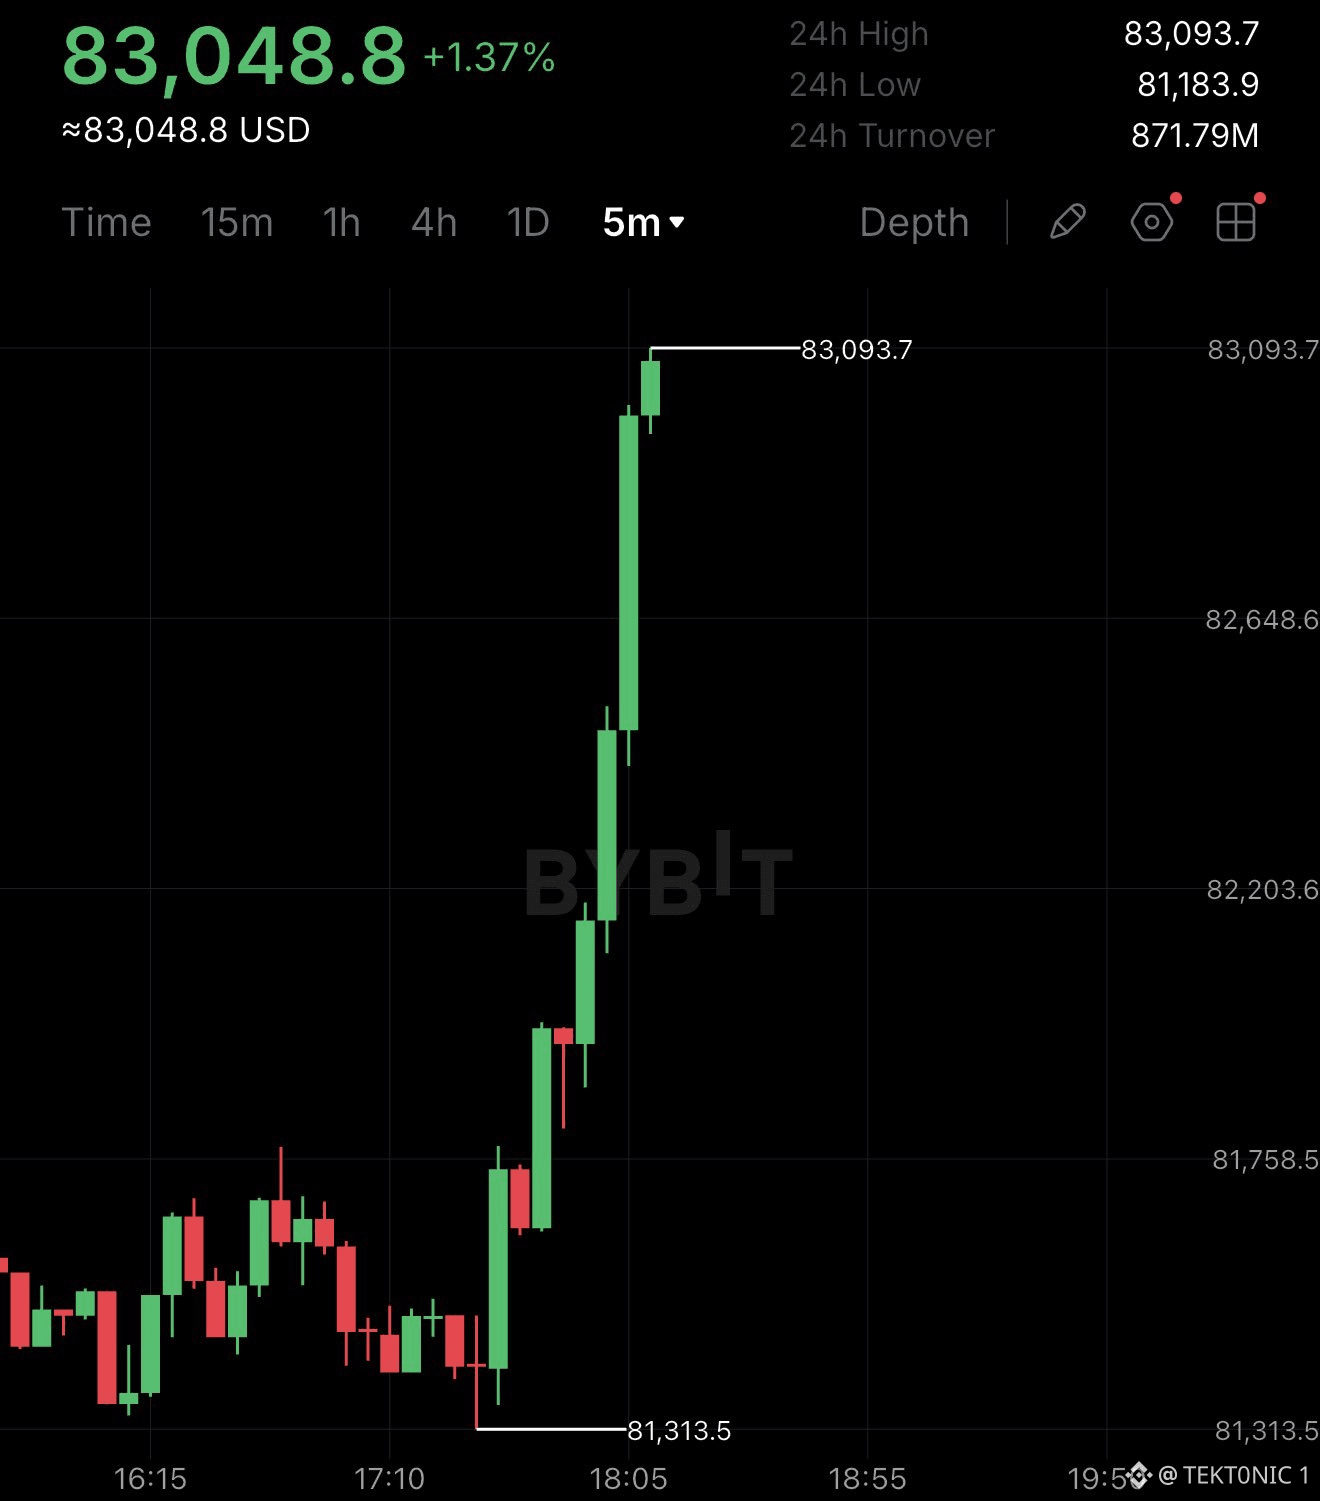
биткоин преодолел отметку $83 000, и за 60 минут были ликвидированы короткие позиции на сумму $106 млн. 💔 Когда $BTC движется против трейдеров, открывших короткие позиции с высоким кредитным плечом, биржи автоматически закрывают позиции, как только нарушаются требования к марже. Такое принудительное закрытие может усилить давление покупателей, подтолкнуть цены вверх и спровоцировать ещё больше ликвидаций. Но вот в чём загвоздка: шорт-сквиз может подстегнуть ралли, но не гарантирует устойчивого разворота тренда. Для $BTC важно, подключатся ли покупатели на спотовом рынке, чтобы поддержать рост после того, как эффект принудительных покупок сойдёт на нет. Для медведей это определённо был болезненный час, но смогут ли быки сохранить импульс? #Анализ цены BTC# #Прогноз цены Bitcoin: куда BTC двинется дальше?# #Обзор макроэкономической ситуации# $ETH
биткоин преодолел отметку $83 000, и за 60 минут были ликвидированы короткие позиции на сумму $106 млн. 💔 Когда $BTC движется против трейдеров, открывших короткие позиции с высоким кредитным плечом, биржи автоматически закрывают позиции, как только нарушаются требования к марже. Такое принудительное закрытие может усилить давление покупателей, подтолкнуть цены вверх и спровоцировать ещё больше ликвидаций. Но вот в чём загвоздка: шорт-сквиз может подстегнуть ралли, но не гарантирует устойчивого разворота тренда. Для $BTC важно, подключатся ли покупатели на спотовом рынке, чтобы поддержать рост после того, как эффект принудительных покупок сойдёт на нет. Для медведей это определённо был болезненный час, но смогут ли быки сохранить импульс? #Анализ цены BTC# #Прогноз цены Bitcoin: куда BTC двинется дальше?# #Обзор макроэкономической ситуации# $ETH
28
·
--
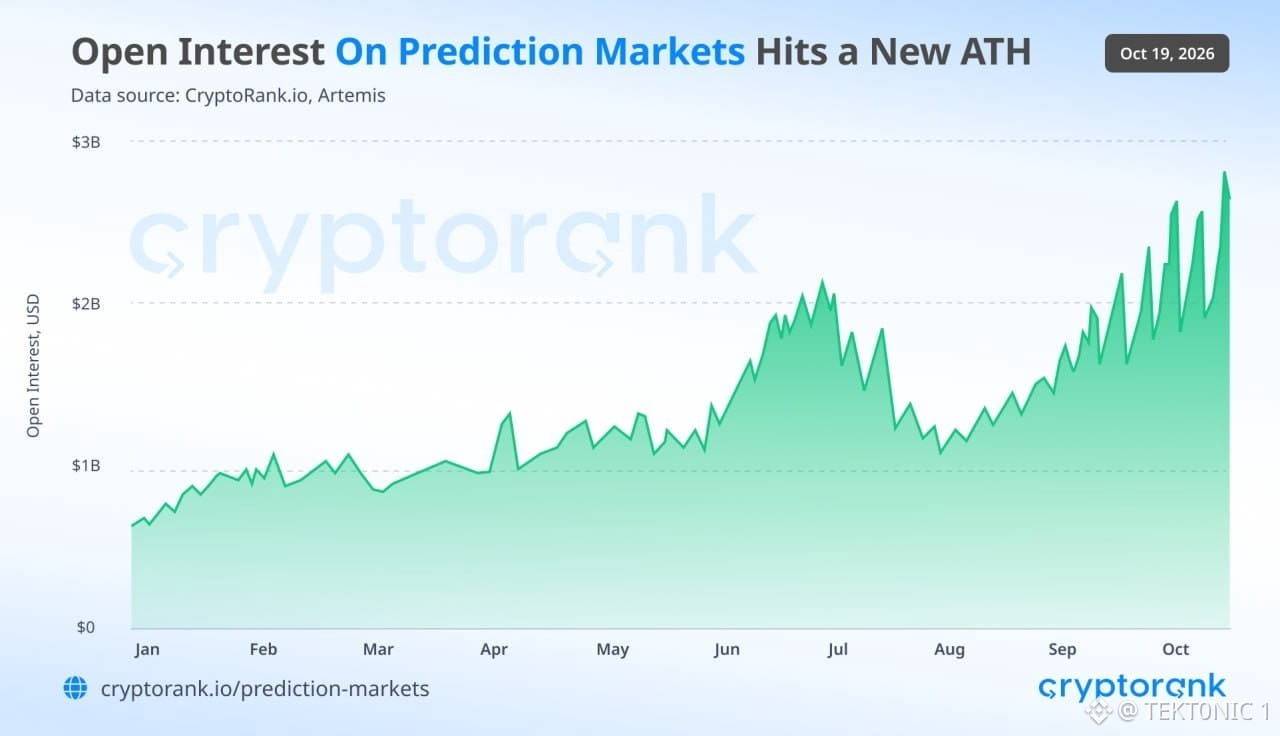
Открытый интерес на рынках прогнозов достиг нового исторического максимума — 2,8 млрд долларов. С августа капитал, вложенный в активные позиции на рынках прогнозов, вырос примерно с 1,1 млрд до 2,8 млрд долларов. Рынок по-прежнему сильно сконцентрирован:
> Kalshi: 71%
> Polymarket: 24%
Вместе на них приходится около 95% общего открытого интереса. Открытый интерес отражает стоимость позиций, которые остаются активными, а не объём торгов за определённый период. Его рост говорит о том, что всё больше капитала вкладывается в прогнозирование реальных событий. Сейчас эти рынки охватывают всё: от выборов и спорта до цен на криптовалюты и решений ФРС. Теперь стоит следить за тем, распространится ли этот рост на другие платформы или рынок останется сосредоточенным на Kalshi и Polymarket.
#Анализ цены BTC#
#Прогноз цены Bitcoin: какой будет следующий шаг Bitcoin?#
$BTC $XRP
Открытый интерес на рынках прогнозов достиг нового исторического максимума — 2,8 млрд долларов. С августа капитал, вложенный в активные позиции на рынках прогнозов, вырос примерно с 1,1 млрд до 2,8 млрд долларов. Рынок по-прежнему сильно сконцентрирован:
> Kalshi: 71%
> Polymarket: 24%
Вместе на них приходится около 95% общего открытого интереса. Открытый интерес отражает стоимость позиций, которые остаются активными, а не объём торгов за определённый период. Его рост говорит о том, что всё больше капитала вкладывается в прогнозирование реальных событий. Сейчас эти рынки охватывают всё: от выборов и спорта до цен на криптовалюты и решений ФРС. Теперь стоит следить за тем, распространится ли этот рост на другие платформы или рынок останется сосредоточенным на Kalshi и Polymarket.
#Анализ цены BTC#
#Прогноз цены Bitcoin: какой будет следующий шаг Bitcoin?#
$BTC $XRP
> Kalshi: 71%
> Polymarket: 24%
Вместе на них приходится около 95% общего открытого интереса. Открытый интерес отражает стоимость позиций, которые остаются активными, а не объём торгов за определённый период. Его рост говорит о том, что всё больше капитала вкладывается в прогнозирование реальных событий. Сейчас эти рынки охватывают всё: от выборов и спорта до цен на криптовалюты и решений ФРС. Теперь стоит следить за тем, распространится ли этот рост на другие платформы или рынок останется сосредоточенным на Kalshi и Polymarket.
#Анализ цены BTC#
#Прогноз цены Bitcoin: какой будет следующий шаг Bitcoin?#
$BTC $XRP
47
·
--
Strive привлекла около 630 млн долларов благодаря IPO привилегированных акций увеличенного объёма. Компания продала 7 млн привилегированных акций SATS с дивидендной ставкой 15% по 90 долларов за штуку. Это больше, чем 5 млн акций, предложенных изначально. Валовая выручка до вычета комиссий составит около 630 млн долларов. Расчёты запланированы на 20 октября. Привилегированные акции предусматривают фиксированный дивиденд в размере 15% от номинала в 100 долларов. При цене 90 долларов это соответствует эффективной доходности около 16,7%. По приоритетности они уступают уже выпущенным привилегированным акциям SATA компании Strive и не размывают доли владельцев обыкновенных акций. Средства планируется направить на общие корпоративные цели, в том числе на покупку биткоина. При текущей цене около 83 000 долларов вся сумма позволит приобрести примерно 7 600 BTC. Сейчас Strive владеет 36 818 $BTC. Это новые средства для казначейских резервов компании. Однако это не гарантирует, что каждый доллар пойдёт напрямую на покупку биткоина. В следующей отчётности будет указано, какая сумма фактически была направлена на эти цели. #Анализ цены BTC# #Прогноз цены биткоина: что будет дальше с биткоином?# #Макроэкономический обзор# $BTC $ETH
Strive привлекла около 630 млн долларов благодаря IPO привилегированных акций увеличенного объёма. Компания продала 7 млн привилегированных акций SATS с дивидендной ставкой 15% по 90 долларов за штуку. Это больше, чем 5 млн акций, предложенных изначально. Валовая выручка до вычета комиссий составит около 630 млн долларов. Расчёты запланированы на 20 октября. Привилегированные акции предусматривают фиксированный дивиденд в размере 15% от номинала в 100 долларов. При цене 90 долларов это соответствует эффективной доходности около 16,7%. По приоритетности они уступают уже выпущенным привилегированным акциям SATA компании Strive и не размывают доли владельцев обыкновенных акций. Средства планируется направить на общие корпоративные цели, в том числе на покупку биткоина. При текущей цене около 83 000 долларов вся сумма позволит приобрести примерно 7 600 BTC. Сейчас Strive владеет 36 818 $BTC. Это новые средства для казначейских резервов компании. Однако это не гарантирует, что каждый доллар пойдёт напрямую на покупку биткоина. В следующей отчётности будет указано, какая сумма фактически была направлена на эти цели. #Анализ цены BTC# #Прогноз цены биткоина: что будет дальше с биткоином?# #Макроэкономический обзор# $BTC $ETH

58
·
--
См. перевод
Bitcoin has moved back above $83,000 as reports emerge that the United States and Iran have given preliminary approval to a peace proposal mediated by Qatar and Pakistan. according to sources cited by Al-Araby Al-Jadeed, both sides have given initial backing to a compromise plan. The reported terms include confidential IAEA inspections of Iranian nuclear sites and a partial release of roughly $6 billion in Iranian funds frozen in Qatar. Neither Washington nor Tehran has issued an official confirmation. the move in $BTC comes as oil prices have eased and risk assets have responded to the latest round of mediation. Bitcoin was trading near $82,000 earlier in the week and has pushed above $83,000 on the reports. Previous statements from both sides have moved markets before, including when the White House ruled out strikes ahead of the midterms. the reports remain preliminary. Details of the proposal and the extent of any agreement are still limited, and past mediation efforts have stalled. The price reaction shows the market is watching the diplomatic track. It does not confirm that a final deal is in place. #BTC Price Analysis# #Bitcoin Price Prediction: What is Bitcoins next move?# $BTC $ETH
Bitcoin has moved back above $83,000 as reports emerge that the United States and Iran have given preliminary approval to a peace proposal mediated by Qatar and Pakistan. according to sources cited by Al-Araby Al-Jadeed, both sides have given initial backing to a compromise plan. The reported terms include confidential IAEA inspections of Iranian nuclear sites and a partial release of roughly $6 billion in Iranian funds frozen in Qatar. Neither Washington nor Tehran has issued an official confirmation. the move in $BTC comes as oil prices have eased and risk assets have responded to the latest round of mediation. Bitcoin was trading near $82,000 earlier in the week and has pushed above $83,000 on the reports. Previous statements from both sides have moved markets before, including when the White House ruled out strikes ahead of the midterms. the reports remain preliminary. Details of the proposal and the extent of any agreement are still limited, and past mediation efforts have stalled. The price reaction shows the market is watching the diplomatic track. It does not confirm that a final deal is in place. #BTC Price Analysis# #Bitcoin Price Prediction: What is Bitcoins next move?# $BTC $ETH
67
·
--
Давайте честно: почему оплата криптовалютой до сих пор сложнее, чем должна быть? Вы можете хранить USDC или USDT в своём кошельке, но использовать эти средства для повседневных покупок не всегда просто. @WalletConnect работает над тем, чтобы это изменить, с помощью WalletConnect Pay — сервиса, который позволяет пользователям платить онлайн или в обычных магазинах напрямую из уже имеющихся у них кошельков. Продавцы могут принимать платежи из разных кошельков и в поддерживаемых активах благодаря одной интеграции — без необходимости создавать отдельную систему для каждого кошелька. Цель WalletConnect — упростить использование платежей в стейблкоинах в повседневной торговле и предоставить продавцам больше способов принимать оплату. Хранить криптовалюту — это одно. Другое дело — иметь возможность расплачиваться ею там, где вы совершаете покупки. #Анализ цены BTC# #Прогноз цены Bitcoin: каким будет следующий шаг Bitcoin?# $BTC $ETH
Давайте честно: почему оплата криптовалютой до сих пор сложнее, чем должна быть? Вы можете хранить USDC или USDT в своём кошельке, но использовать эти средства для повседневных покупок не всегда просто. @WalletConnect работает над тем, чтобы это изменить, с помощью WalletConnect Pay — сервиса, который позволяет пользователям платить онлайн или в обычных магазинах напрямую из уже имеющихся у них кошельков. Продавцы могут принимать платежи из разных кошельков и в поддерживаемых активах благодаря одной интеграции — без необходимости создавать отдельную систему для каждого кошелька. Цель WalletConnect — упростить использование платежей в стейблкоинах в повседневной торговле и предоставить продавцам больше способов принимать оплату. Хранить криптовалюту — это одно. Другое дело — иметь возможность расплачиваться ею там, где вы совершаете покупки. #Анализ цены BTC# #Прогноз цены Bitcoin: каким будет следующий шаг Bitcoin?# $BTC $ETH

27
·
--
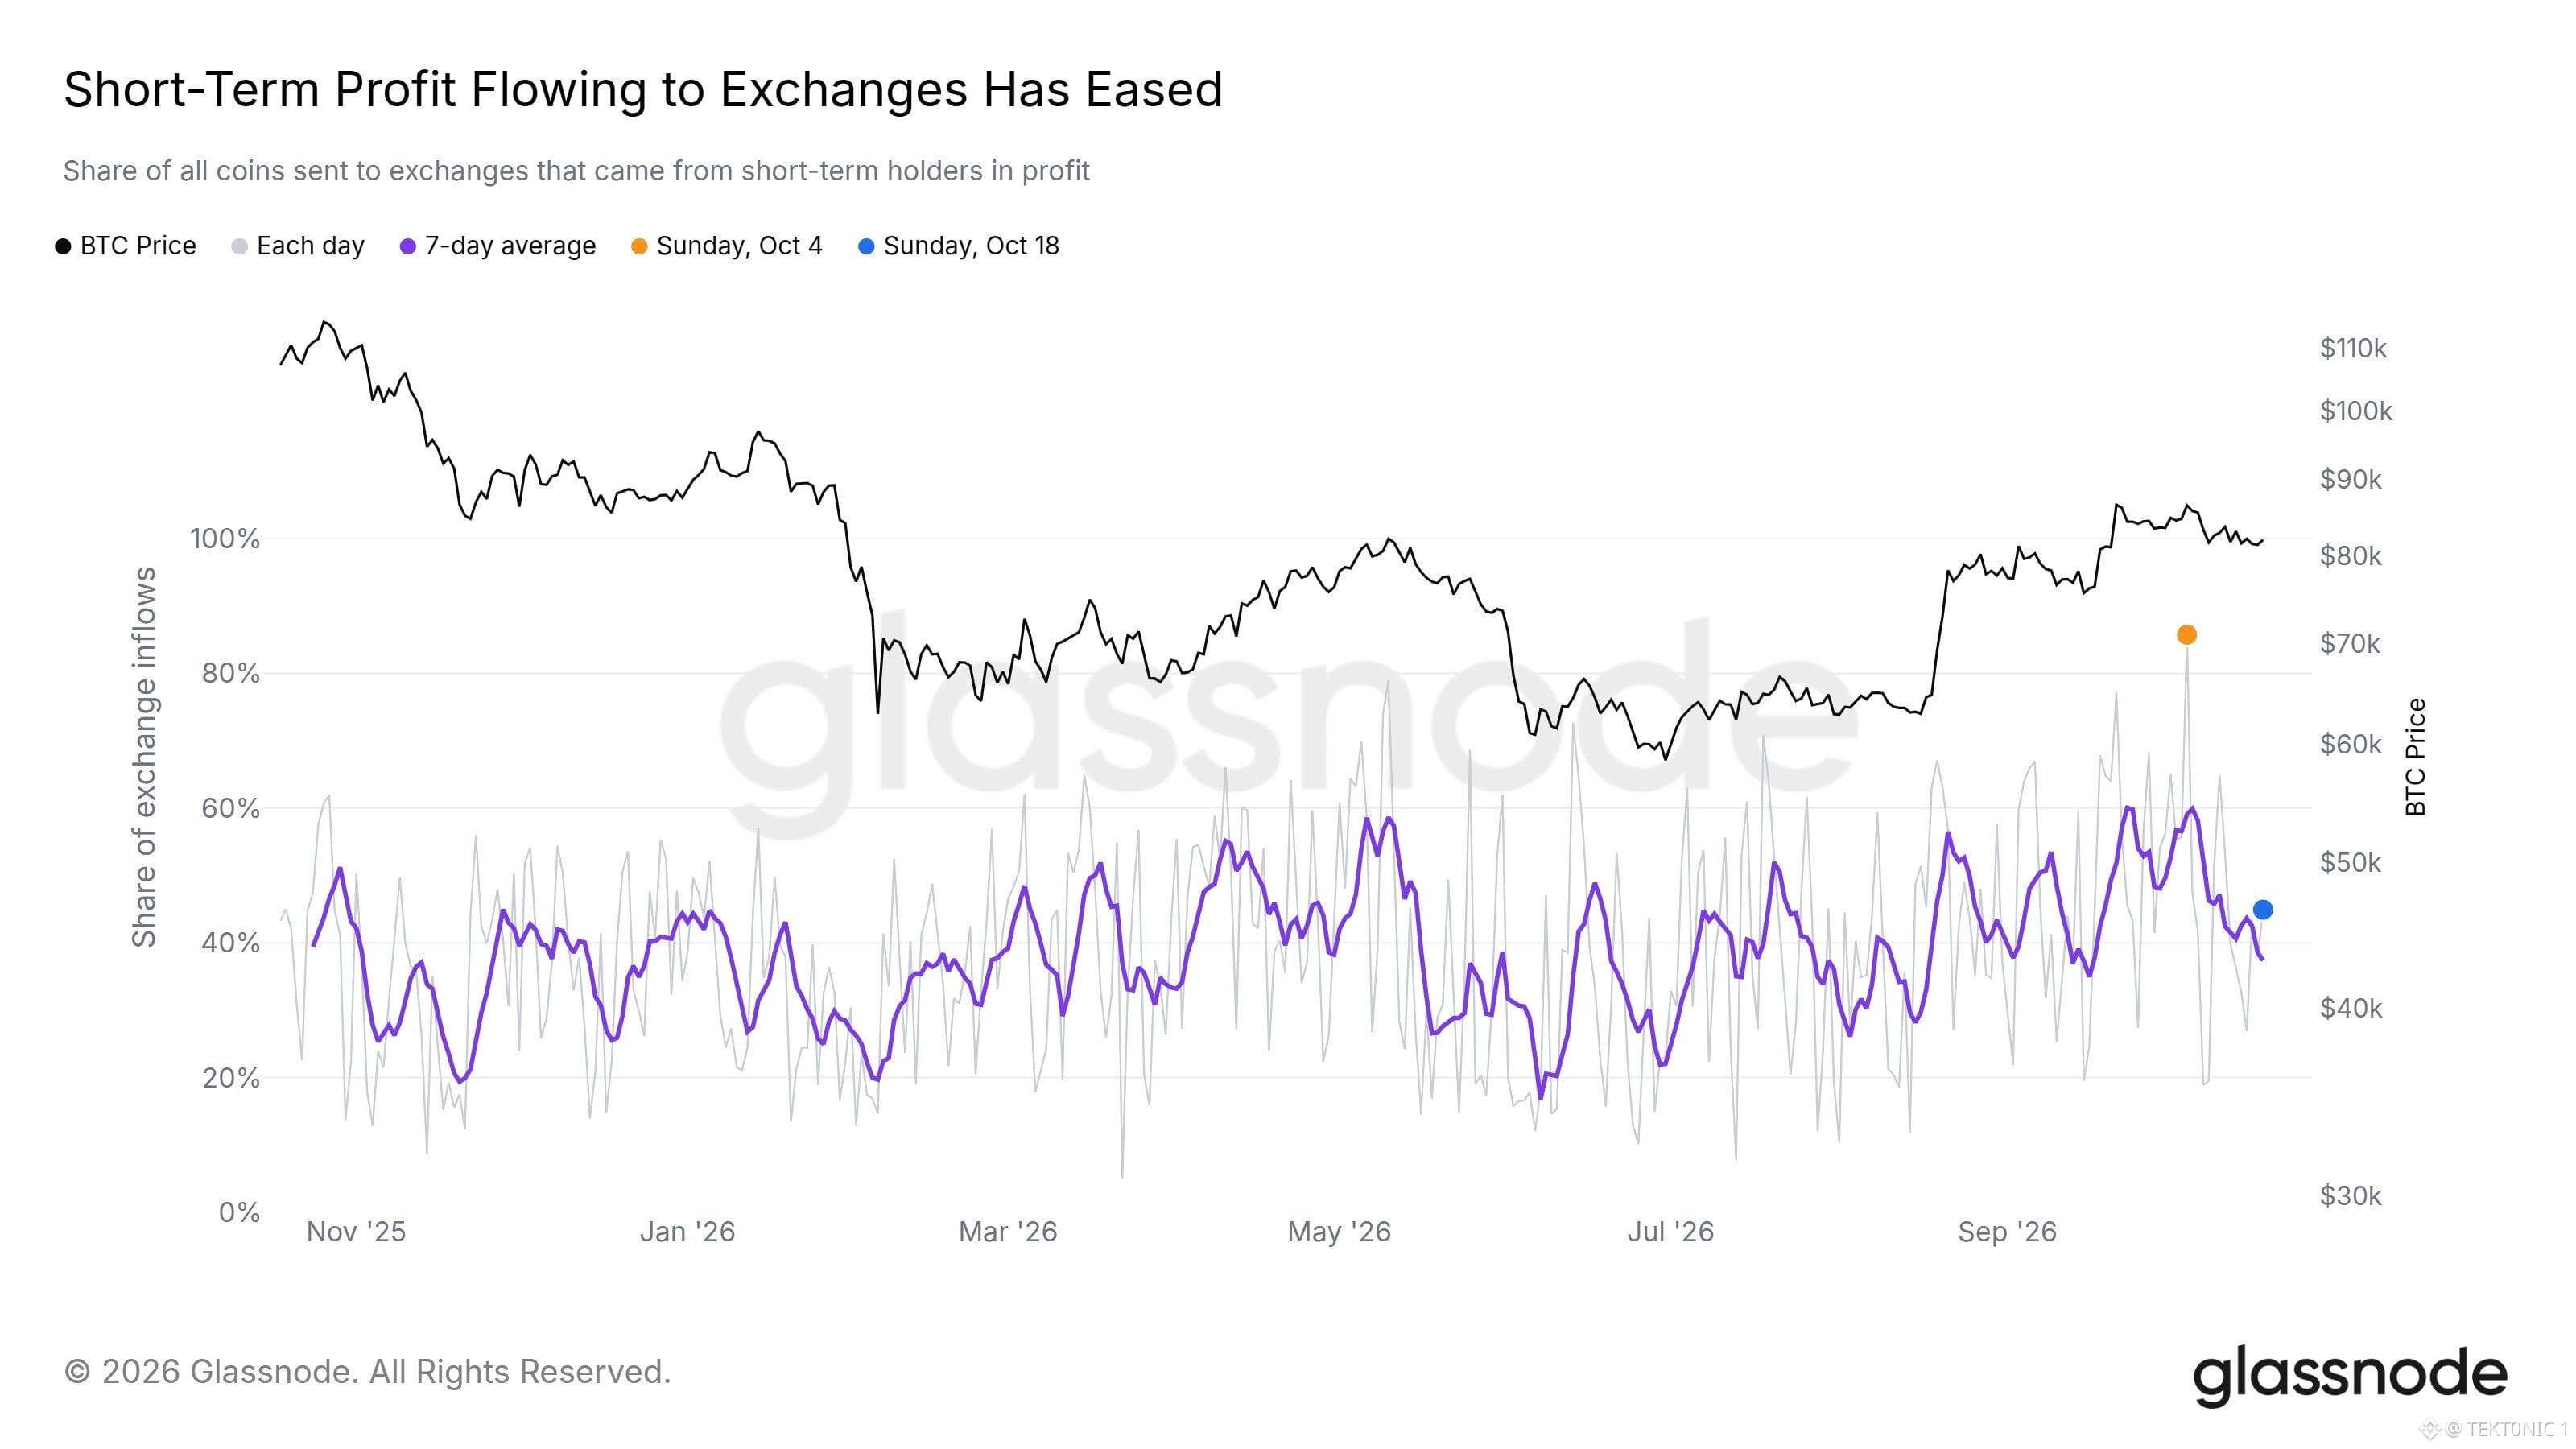
Две недели назад краткосрочные держатели, находившиеся в прибыли, обеспечивали самую большую за год долю притока средств на биржи. По данным Glassnode, доля монет, отправленных на биржи краткосрочными держателями, которые были в прибыли, достигла пика вблизи верхней границы недавнего диапазона 4 октября. В то же время повышенным было и среднее значение за 7 дней. Этот приток совпал с давлением, из-за которого $BTC не смог удержаться на уровне выше $80 000. Теперь этот показатель снизился. Значение за 18 октября находится примерно в середине графика, а среднее за 7 дней вернулось почти к уровню, около которого держалось большую часть прошлого года. Дневные значения по-прежнему колеблются, но период повышенных показателей завершился. Эта доля показывает, какая часть монет, поступивших на биржи, принадлежала краткосрочным держателям, находившимся в прибыли. Чем выше доля, тем больше таких продаж поступает на рынок. Более низкая доля означает, что этот источник предложения ослаб. Показатель не отражает общий приток средств на биржи и не показывает, что делают долгосрочные держатели. Поток продаж со стороны краткосрочных держателей, получавших прибыль, вернулся ближе к своему обычному диапазону. Останется ли он там, зависит от того, вызовет ли следующий рост такое же усиление продаж. #Анализ цены BTC# #Прогноз цены Bitcoin: что будет дальше с Bitcoin?# $BTC $ETH
Две недели назад краткосрочные держатели, находившиеся в прибыли, обеспечивали самую большую за год долю притока средств на биржи. По данным Glassnode, доля монет, отправленных на биржи краткосрочными держателями, которые были в прибыли, достигла пика вблизи верхней границы недавнего диапазона 4 октября. В то же время повышенным было и среднее значение за 7 дней. Этот приток совпал с давлением, из-за которого $BTC не смог удержаться на уровне выше $80 000. Теперь этот показатель снизился. Значение за 18 октября находится примерно в середине графика, а среднее за 7 дней вернулось почти к уровню, около которого держалось большую часть прошлого года. Дневные значения по-прежнему колеблются, но период повышенных показателей завершился. Эта доля показывает, какая часть монет, поступивших на биржи, принадлежала краткосрочным держателям, находившимся в прибыли. Чем выше доля, тем больше таких продаж поступает на рынок. Более низкая доля означает, что этот источник предложения ослаб. Показатель не отражает общий приток средств на биржи и не показывает, что делают долгосрочные держатели. Поток продаж со стороны краткосрочных держателей, получавших прибыль, вернулся ближе к своему обычному диапазону. Останется ли он там, зависит от того, вызовет ли следующий рост такое же усиление продаж. #Анализ цены BTC# #Прогноз цены Bitcoin: что будет дальше с Bitcoin?# $BTC $ETH
39
·
--
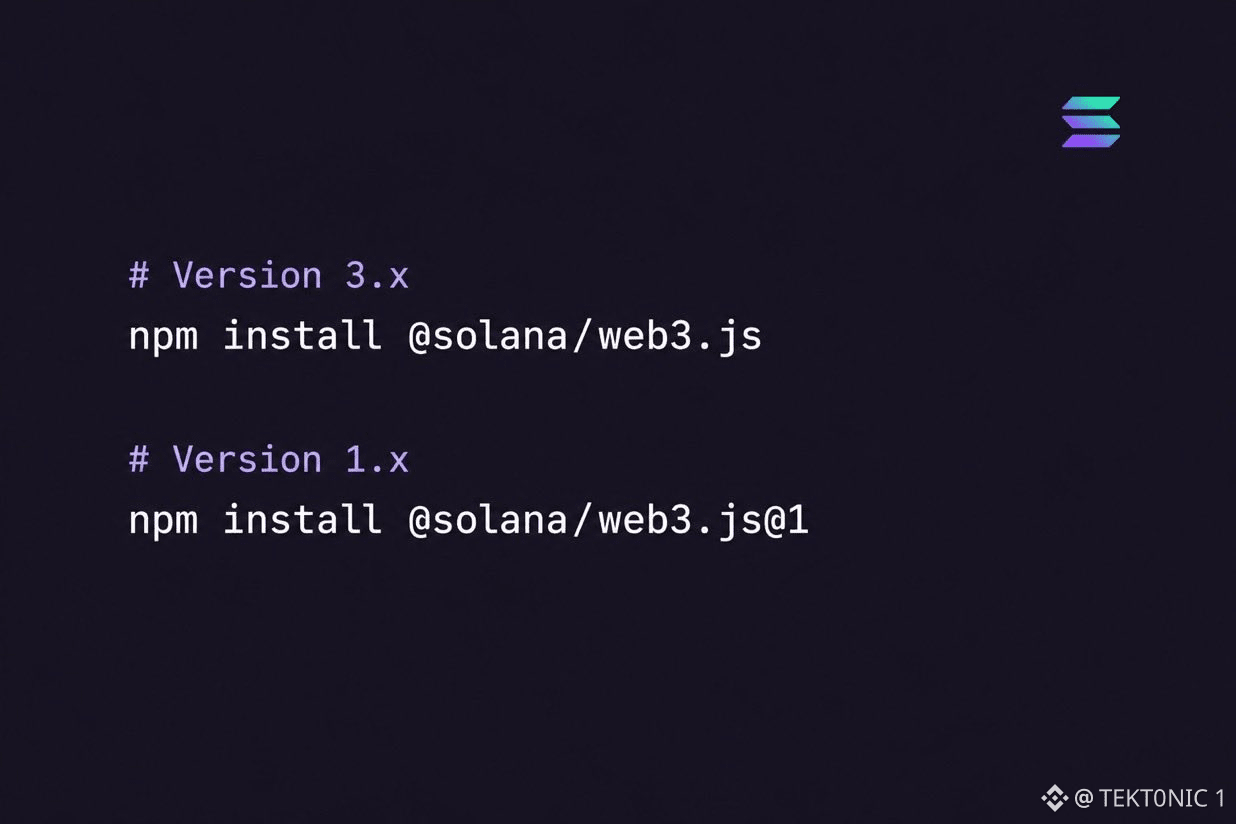
В разработке на Solana произошло важное обновление для разработчиков. Solana выпустила v3 — новую версию популярного JavaScript SDK, созданную на базе Solana Kit. Цель — упростить разработку, объединив общие инструменты и интерфейсы, сократив число ненужных зависимостей и позволив разработчикам создавать приложения с меньшим размером сборки. Почему это важно? Меньший размер сборки означает, что пользователям придётся скачивать меньше кода, а более единообразный SDK упрощает работу разработчиков с кошельками, подписантами и транзакциями. Обновление также даёт разработчикам, уже использующим web3.js, возможность перейти на более новую архитектуру Kit, не отказываясь полностью от привычного API. Улучшенные инструменты могут упростить разработку на Solana, но настоящая проверка — насколько плавно команды перейдут на новую версию. #Анализ цены BTC# #Макроэкономический обзор# #Сезон альткоинов# $BTC $SOL
В разработке на Solana произошло важное обновление для разработчиков. Solana выпустила v3 — новую версию популярного JavaScript SDK, созданную на базе Solana Kit. Цель — упростить разработку, объединив общие инструменты и интерфейсы, сократив число ненужных зависимостей и позволив разработчикам создавать приложения с меньшим размером сборки. Почему это важно? Меньший размер сборки означает, что пользователям придётся скачивать меньше кода, а более единообразный SDK упрощает работу разработчиков с кошельками, подписантами и транзакциями. Обновление также даёт разработчикам, уже использующим web3.js, возможность перейти на более новую архитектуру Kit, не отказываясь полностью от привычного API. Улучшенные инструменты могут упростить разработку на Solana, но настоящая проверка — насколько плавно команды перейдут на новую версию. #Анализ цены BTC# #Макроэкономический обзор# #Сезон альткоинов# $BTC $SOL
56
·
--
Metaplanet намерена получить 93,7% акций котируемой на Nasdaq компании Super League в рамках сделки, предусматривающей передачу 2 100 $BTC и 2,5 млн долларов наличными. Акционеры Super League одобрили сделку 16 октября. Metaplanet получит 44,86 млн обыкновенных акций по 3,00 доллара за штуку, а также привилегированные акции и варранты. После закрытия сделки компания будет переименована в Superplanet, а её акции будут торговаться под тикером SUPA. На обыкновенные акции Metaplanet распространяется пятилетний запрет на продажу. 2 100 BTC составляют менее 5% казначейского резерва Metaplanet, насчитывающего около 44 000 $BTC. Передача позволит сохранить монеты внутри консолидированной группы, а не продавать их. Существующий рекламный и медиабизнес Super League продолжит работать как отдельное подразделение. Это позволит Metaplanet получить торгуемую в США компанию с биткоин-резервом наряду с листингом в Токио. Закрытие сделки всё ещё зависит от выполнения стандартных условий и ожидается в четвёртом квартале. Одобрение снимает вопрос с голосованием акционеров, но не завершает передачу. #Анализ цены BTC# #Прогноз цены биткоина: что будет дальше с биткоином?# #Макроэкономический обзор# $ETH
Metaplanet намерена получить 93,7% акций котируемой на Nasdaq компании Super League в рамках сделки, предусматривающей передачу 2 100 $BTC и 2,5 млн долларов наличными. Акционеры Super League одобрили сделку 16 октября. Metaplanet получит 44,86 млн обыкновенных акций по 3,00 доллара за штуку, а также привилегированные акции и варранты. После закрытия сделки компания будет переименована в Superplanet, а её акции будут торговаться под тикером SUPA. На обыкновенные акции Metaplanet распространяется пятилетний запрет на продажу. 2 100 BTC составляют менее 5% казначейского резерва Metaplanet, насчитывающего около 44 000 $BTC. Передача позволит сохранить монеты внутри консолидированной группы, а не продавать их. Существующий рекламный и медиабизнес Super League продолжит работать как отдельное подразделение. Это позволит Metaplanet получить торгуемую в США компанию с биткоин-резервом наряду с листингом в Токио. Закрытие сделки всё ещё зависит от выполнения стандартных условий и ожидается в четвёртом квартале. Одобрение снимает вопрос с голосованием акционеров, но не завершает передачу. #Анализ цены BTC# #Прогноз цены биткоина: что будет дальше с биткоином?# #Макроэкономический обзор# $ETH

80
·
--
США ослабляют давление на Россию, поскольку Трамп пытается вернуть Путина к переговорам о мире в Украине. Трамп заключил с Россией соглашение об экспорте дизельного топлива, предусматривающее первоначальную поставку более 300 000 метрических тонн; дополнительные поставки запланированы на ноябрь и более поздний срок. Администрация также отложила введение новых санкций против России, предоставив чиновникам до 60 дней для оценки их экономического воздействия. Цель — увеличить мировые поставки топлива, снизить цены на энергоносители и побудить Москву вернуться к переговорам. Украина раскритиковала это решение, заявив, что ослабление санкций без получения уступок может укрепить позиции России. Для мировых рынков снижение цен на энергоносители может помочь ослабить инфляционное давление и, возможно, улучшить условия для рисковых активов, таких как $BTC. Главный вопрос в том, действительно ли соглашение снизит затраты на энергию и приведёт к значимому прогрессу на пути к миру или же просто даст России больше свободы действий. #Анализ цены BTC# #Прогноз цены Bitcoin: какой будет следующий шаг Bitcoin?# #Макроэкономический обзор# $BTC $XRP
США ослабляют давление на Россию, поскольку Трамп пытается вернуть Путина к переговорам о мире в Украине. Трамп заключил с Россией соглашение об экспорте дизельного топлива, предусматривающее первоначальную поставку более 300 000 метрических тонн; дополнительные поставки запланированы на ноябрь и более поздний срок. Администрация также отложила введение новых санкций против России, предоставив чиновникам до 60 дней для оценки их экономического воздействия. Цель — увеличить мировые поставки топлива, снизить цены на энергоносители и побудить Москву вернуться к переговорам. Украина раскритиковала это решение, заявив, что ослабление санкций без получения уступок может укрепить позиции России. Для мировых рынков снижение цен на энергоносители может помочь ослабить инфляционное давление и, возможно, улучшить условия для рисковых активов, таких как $BTC. Главный вопрос в том, действительно ли соглашение снизит затраты на энергию и приведёт к значимому прогрессу на пути к миру или же просто даст России больше свободы действий. #Анализ цены BTC# #Прогноз цены Bitcoin: какой будет следующий шаг Bitcoin?# #Макроэкономический обзор# $BTC $XRP

1
·
--
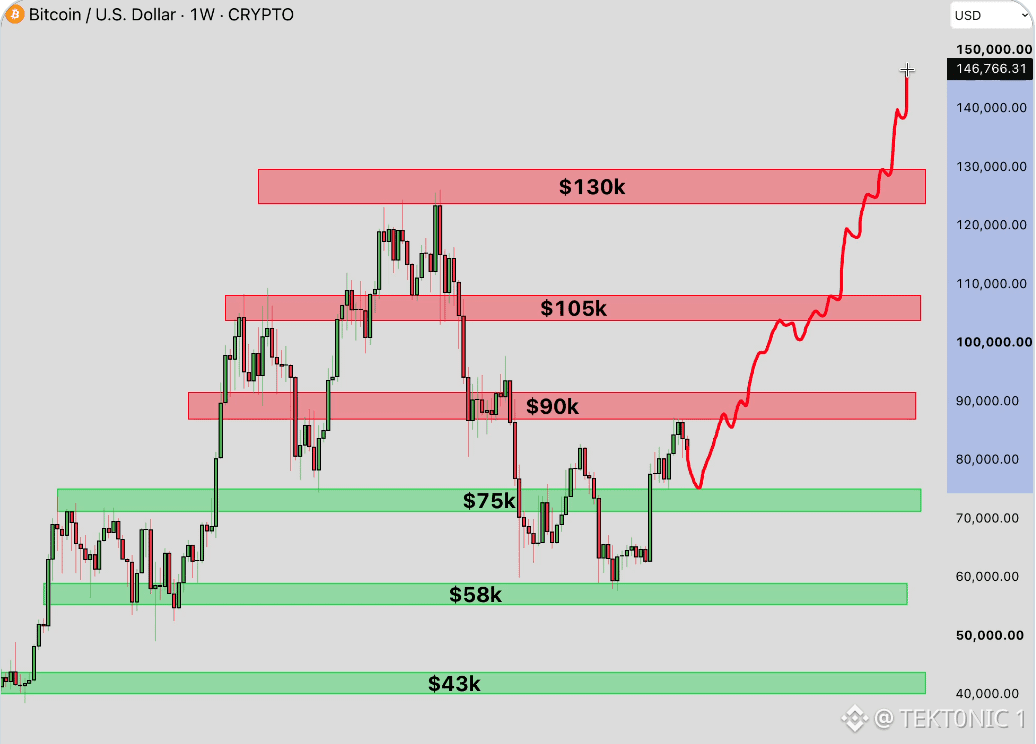
Недельный график $BTC отмечает три зоны поддержки и три зоны сопротивления, которые играли важную роль в этом цикле. Поддержка находится вблизи $75k, $58k и $43k. Сопротивление — вблизи $90k, $105k и $130k. Сейчас цена торгуется чуть выше отметки $75k после отката от более высоких уровней. Ранее каждая из этих горизонтальных зон удерживала цену при тестировании с противоположной стороны. Пробои зон сопротивления затем вели цену к следующей зоне, а удержание поддержки помогало сохранить более широкую структуру. Красная траектория на графике показывает путь, при котором цена преодолевает $90k и $105k, прежде чем протестировать зону $130k. Этот сценарий предполагает, что верхние красные зоны будут пробиты, а не станут препятствием. Для достижения $130k потребуется устойчивый покупательский спрос, способный преодолеть оба промежуточных уровня. Недельное закрытие $BTC ниже $75k, напротив, откроет путь к нижним зелёным зонам вблизи $58k и $43k. Эти уровни — зоны, где цена ранее останавливалась или находила покупателей. Они не дают никаких гарантий. Объём торгов, макроэкономические условия и повторные тестирования всё ещё могут повлиять на реакцию цены при достижении этих уровней. Карта показывает зоны, но не предопределяет следующий ход. #BTC Анализ цены# #Прогноз цены Bitcoin: каким будет следующий ход Bitcoin?# $XRP
Недельный график $BTC отмечает три зоны поддержки и три зоны сопротивления, которые играли важную роль в этом цикле. Поддержка находится вблизи $75k, $58k и $43k. Сопротивление — вблизи $90k, $105k и $130k. Сейчас цена торгуется чуть выше отметки $75k после отката от более высоких уровней. Ранее каждая из этих горизонтальных зон удерживала цену при тестировании с противоположной стороны. Пробои зон сопротивления затем вели цену к следующей зоне, а удержание поддержки помогало сохранить более широкую структуру. Красная траектория на графике показывает путь, при котором цена преодолевает $90k и $105k, прежде чем протестировать зону $130k. Этот сценарий предполагает, что верхние красные зоны будут пробиты, а не станут препятствием. Для достижения $130k потребуется устойчивый покупательский спрос, способный преодолеть оба промежуточных уровня. Недельное закрытие $BTC ниже $75k, напротив, откроет путь к нижним зелёным зонам вблизи $58k и $43k. Эти уровни — зоны, где цена ранее останавливалась или находила покупателей. Они не дают никаких гарантий. Объём торгов, макроэкономические условия и повторные тестирования всё ещё могут повлиять на реакцию цены при достижении этих уровней. Карта показывает зоны, но не предопределяет следующий ход. #BTC Анализ цены# #Прогноз цены Bitcoin: каким будет следующий ход Bitcoin?# $XRP
3
·
--
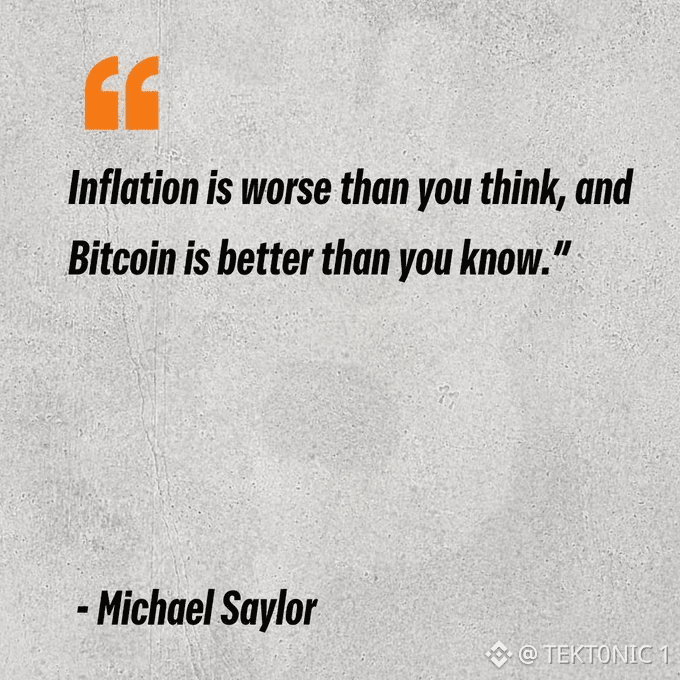
Майкл Сэйлор считает, что инфляция — более серьёзная проблема, чем думает большинство людей, и биткоин может стать частью решения. Его аргументы выходят за рамки роста цен на продукты, жильё и повседневные расходы. По мере снижения покупательной способности со временем хранить деньги становится менее выгодно, особенно когда зарплаты и сбережения не успевают за инфляцией. Здесь в обсуждение вступает $BTC. В отличие от фиатных валют, максимальное предложение биткоина ограничено 21 миллионом монет, а выпуск новых монет сокращается в результате халвингов примерно раз в четыре года. Сэйлор считает, что эта ограниченность помогает сохранять капитал в долгосрочной перспективе. Однако ограниченное предложение биткоина не устраняет волатильность цены, а его эффективность как защиты от инфляции может значительно различаться в краткосрочной перспективе. Главный вопрос заключается в том, сможет ли ограниченность предложения биткоина привести к росту покупательной способности в ближайшие годы. #Анализ цены BTC# #Прогноз цены биткоина: что будет дальше с биткоином?# $BTC $ETH
Майкл Сэйлор считает, что инфляция — более серьёзная проблема, чем думает большинство людей, и биткоин может стать частью решения. Его аргументы выходят за рамки роста цен на продукты, жильё и повседневные расходы. По мере снижения покупательной способности со временем хранить деньги становится менее выгодно, особенно когда зарплаты и сбережения не успевают за инфляцией. Здесь в обсуждение вступает $BTC. В отличие от фиатных валют, максимальное предложение биткоина ограничено 21 миллионом монет, а выпуск новых монет сокращается в результате халвингов примерно раз в четыре года. Сэйлор считает, что эта ограниченность помогает сохранять капитал в долгосрочной перспективе. Однако ограниченное предложение биткоина не устраняет волатильность цены, а его эффективность как защиты от инфляции может значительно различаться в краткосрочной перспективе. Главный вопрос заключается в том, сможет ли ограниченность предложения биткоина привести к росту покупательной способности в ближайшие годы. #Анализ цены BTC# #Прогноз цены биткоина: что будет дальше с биткоином?# $BTC $ETH
14
·
--
Держатели биткоина, купившие его 6–12 месяцев назад, почти перестали переводить монеты на биржи. По данным CryptoQuant, доля их переводов, направлявшихся на биржи, упала с 40,4% в середине июня всего до 4,4% в середине октября. Эти монеты в основном принадлежат покупателям, которые приобрели их около пика 2025 года или после него. Общий объём биткоина, перемещаемого этой группой, не сократился. Он оставался в диапазоне примерно от 144K до 217K $BTC за 30-дневный период, а последнее значение даже превысило июньское. Изменилось только направление переводов. Объём переводов этой группы на биржи упал примерно с 63,8K BTC в июне до 9,1K $BTC к октябрю. Это устраняет потенциальный источник давления со стороны продавцов от группы, которая часто быстро реагировала на изменения цены. Сокращение переводов на биржи от этих держателей снижает давление со стороны предложения в ближайшей перспективе. Но это не гарантирует роста цены. Рынку по-прежнему нужны новые покупатели, чтобы двигаться вверх, а такого спроса пока не наблюдается в значительном объёме. Монеты реже переводят на биржи, но они всё ещё перемещаются. #Анализ цены BTC# #Прогноз цены биткоина: каким будет следующий шаг биткоина?# #Макроэкономический обзор# $ETH
Держатели биткоина, купившие его 6–12 месяцев назад, почти перестали переводить монеты на биржи. По данным CryptoQuant, доля их переводов, направлявшихся на биржи, упала с 40,4% в середине июня всего до 4,4% в середине октября. Эти монеты в основном принадлежат покупателям, которые приобрели их около пика 2025 года или после него. Общий объём биткоина, перемещаемого этой группой, не сократился. Он оставался в диапазоне примерно от 144K до 217K $BTC за 30-дневный период, а последнее значение даже превысило июньское. Изменилось только направление переводов. Объём переводов этой группы на биржи упал примерно с 63,8K BTC в июне до 9,1K $BTC к октябрю. Это устраняет потенциальный источник давления со стороны продавцов от группы, которая часто быстро реагировала на изменения цены. Сокращение переводов на биржи от этих держателей снижает давление со стороны предложения в ближайшей перспективе. Но это не гарантирует роста цены. Рынку по-прежнему нужны новые покупатели, чтобы двигаться вверх, а такого спроса пока не наблюдается в значительном объёме. Монеты реже переводят на биржи, но они всё ещё перемещаются. #Анализ цены BTC# #Прогноз цены биткоина: каким будет следующий шаг биткоина?# #Макроэкономический обзор# $ETH


24
·
--
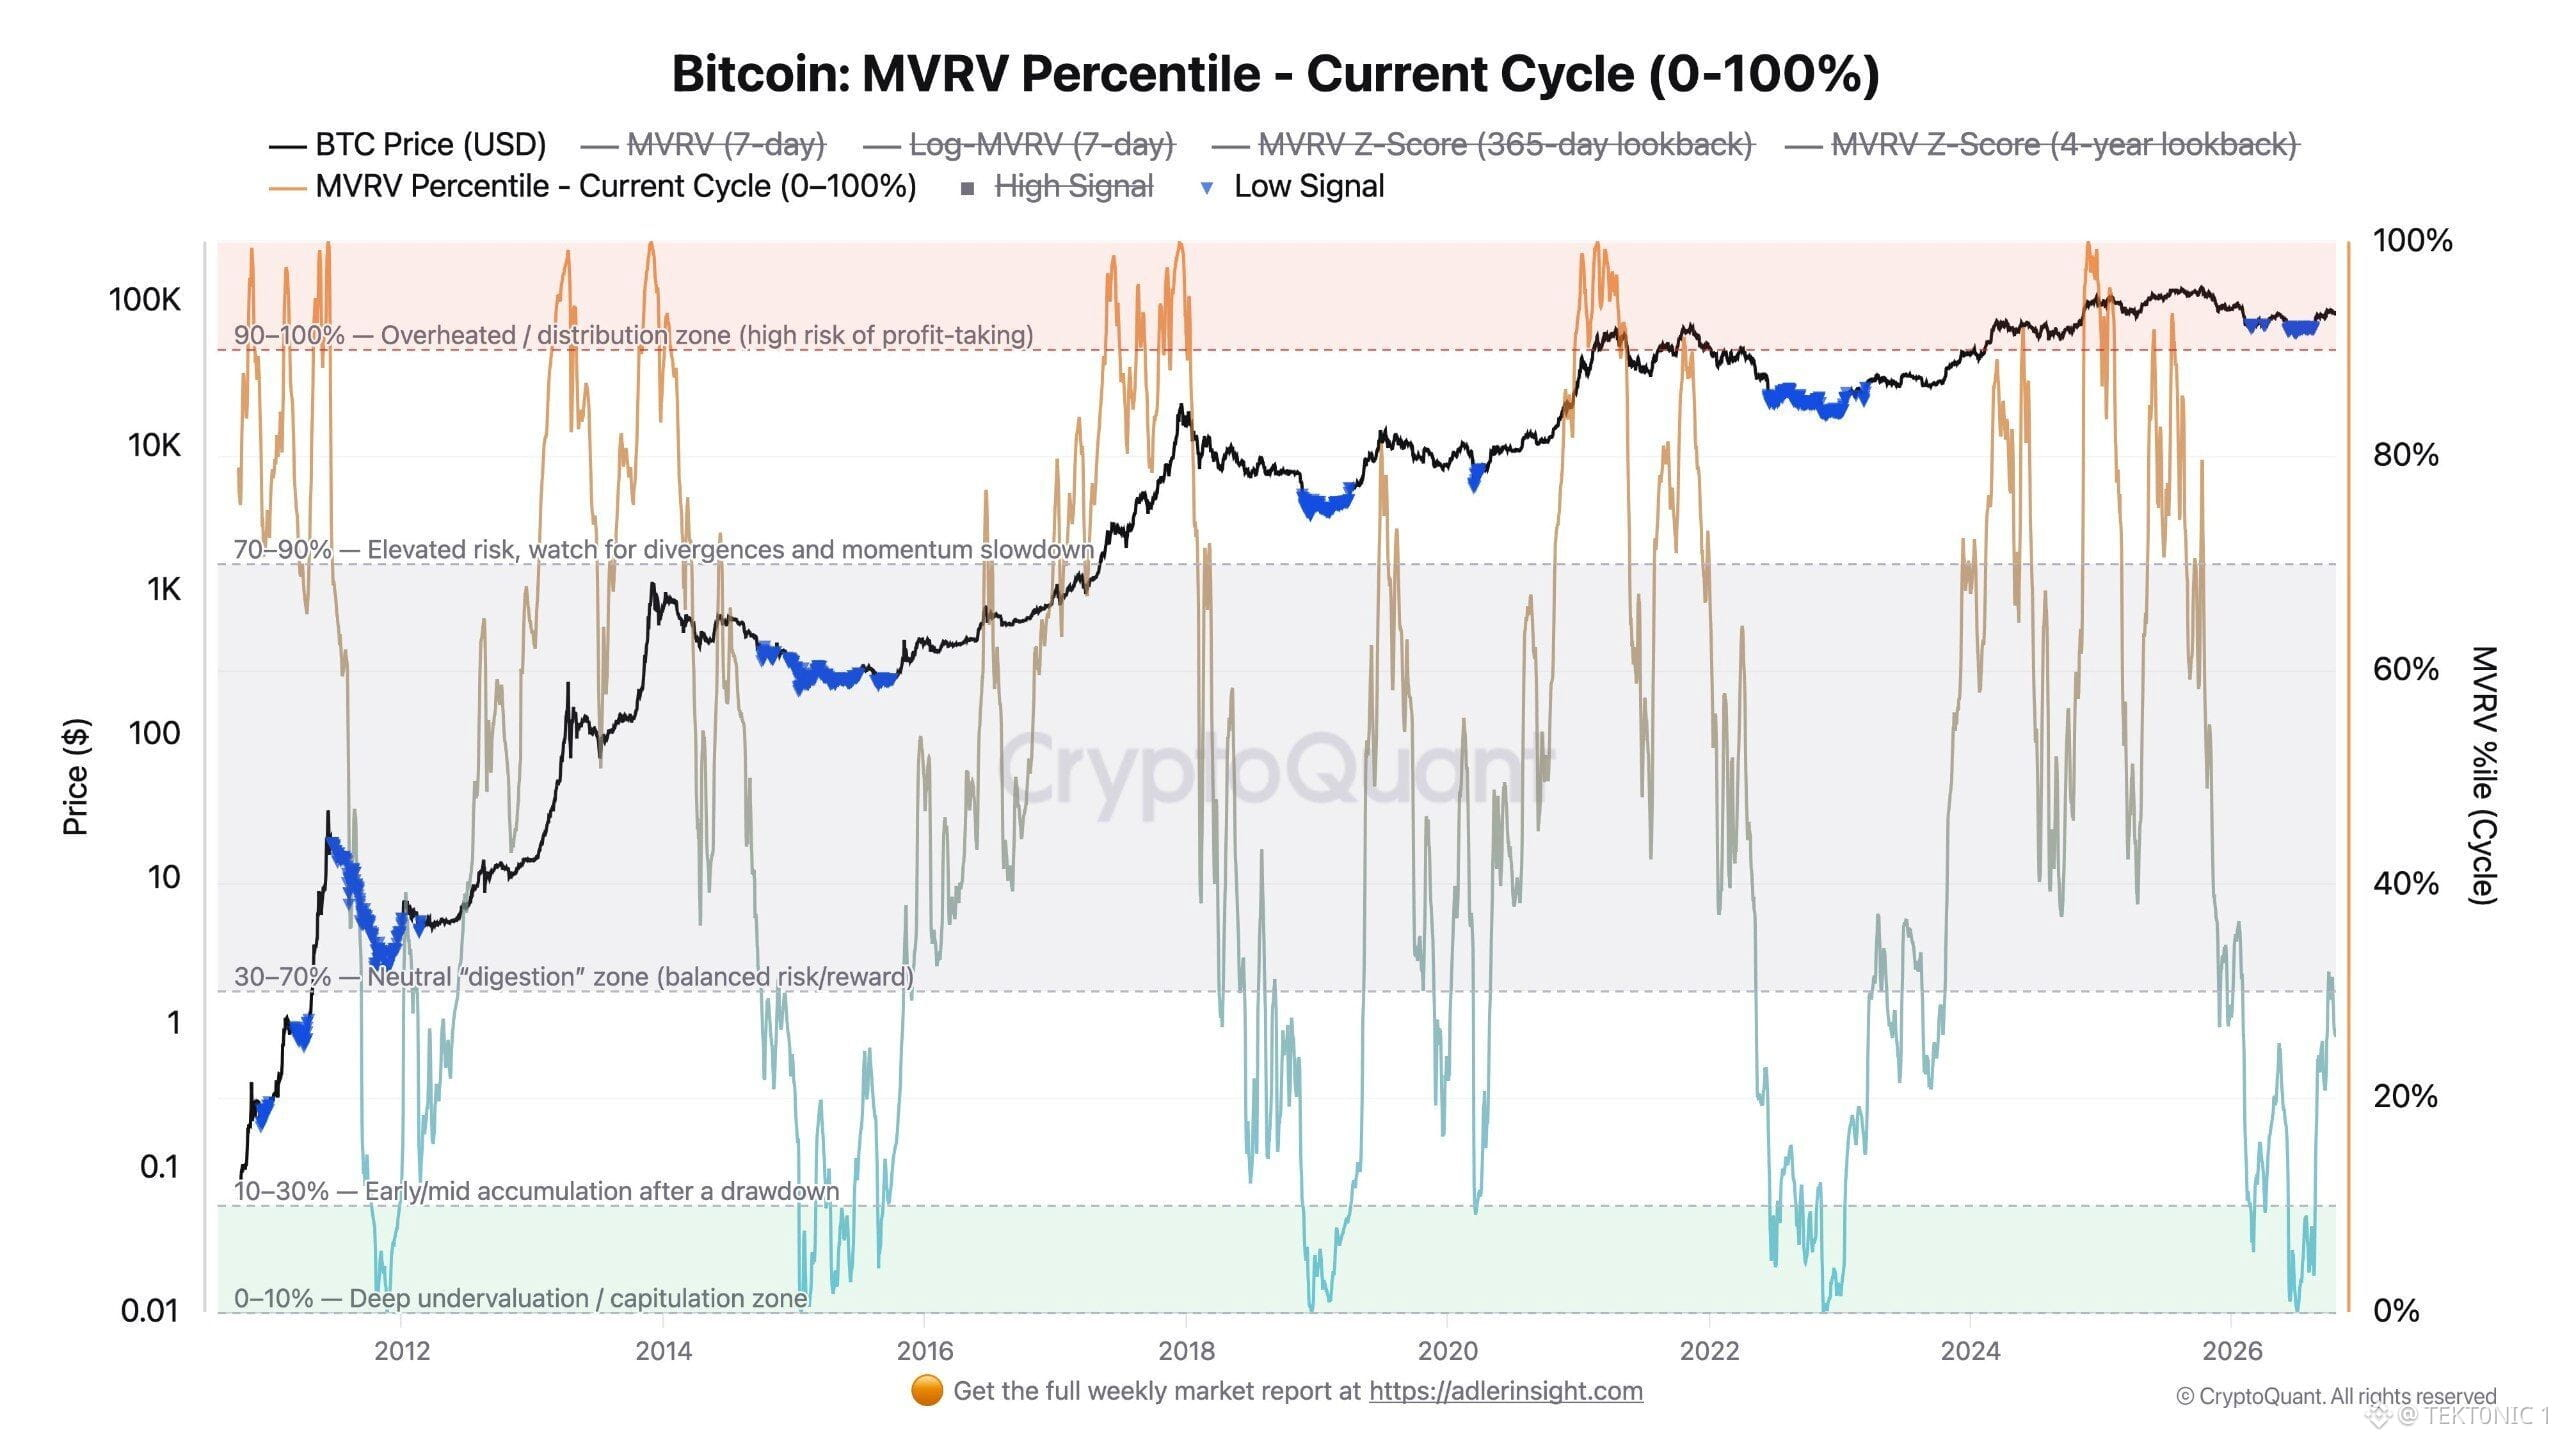
Биткойн не смог закрепиться у отметки $87K, и с тех пор процентиль MVRV снова опустился ниже исторического уровня в 30-й процентиль. Согласно оценке Darkfost, сейчас он составляет около 25,7%, что соответствует ранней или средней фазе накопления на графике цикла. Процентиль показывает, как текущий показатель MVRV соотносится с его прошлыми значениями. Сам коэффициент MVRV по-прежнему находится около 1,51–1,53, то есть рынок в целом всё ещё имеет умеренную прибыль относительно средней цены, по которой монеты перемещались в последний раз. $BTC находился на таком относительном уровне оценки лишь около 25% своей истории. Уровни ниже 30-го процентиля часто совпадали с накоплением после просадок, хотя это не зоны экстремальной недооценённости, которые исторически находились ниже 10-го процентиля. Сейчас цена составляет около $81–82K — значительно ниже максимума октября 2025 года вблизи $126K, а показатель снизился после недавней попытки роста к $87K. График указывает, что оценка перешла в этот более низкий диапазон. Это не гарантирует отскока на этой неделе. Одна сильная торговая сессия всё ещё может поднять среднее значение, даже если другие дни завершатся снижением. Процентиль вернулся в зону накопления, но пока не достиг самых низких исторических уровней. #Анализ цены BTC# #Прогноз цены биткойна: что дальше ждёт биткойн?# $BTC $ETH
Биткойн не смог закрепиться у отметки $87K, и с тех пор процентиль MVRV снова опустился ниже исторического уровня в 30-й процентиль. Согласно оценке Darkfost, сейчас он составляет около 25,7%, что соответствует ранней или средней фазе накопления на графике цикла. Процентиль показывает, как текущий показатель MVRV соотносится с его прошлыми значениями. Сам коэффициент MVRV по-прежнему находится около 1,51–1,53, то есть рынок в целом всё ещё имеет умеренную прибыль относительно средней цены, по которой монеты перемещались в последний раз. $BTC находился на таком относительном уровне оценки лишь около 25% своей истории. Уровни ниже 30-го процентиля часто совпадали с накоплением после просадок, хотя это не зоны экстремальной недооценённости, которые исторически находились ниже 10-го процентиля. Сейчас цена составляет около $81–82K — значительно ниже максимума октября 2025 года вблизи $126K, а показатель снизился после недавней попытки роста к $87K. График указывает, что оценка перешла в этот более низкий диапазон. Это не гарантирует отскока на этой неделе. Одна сильная торговая сессия всё ещё может поднять среднее значение, даже если другие дни завершатся снижением. Процентиль вернулся в зону накопления, но пока не достиг самых низких исторических уровней. #Анализ цены BTC# #Прогноз цены биткойна: что дальше ждёт биткойн?# $BTC $ETH
34
Войдите, чтобы посмотреть больше материала
Присоединяйтесь к пользователям криптовалют по всему миру на Binance Square
⚡️ Получайте новейшую и полезную информацию о криптоактивах.
💬 Нам доверяет крупнейшая в мире криптобиржа.
👍 Получите достоверные аналитические данные от верифицированных создателей контента.
Эл. почта/номер телефона
В тренде
BinancePick
Просмотров: 3.1M
153,048 обсуждают
Присоединяйтесь к #EarningsSeason: прогнозируйте финансовые результаты на Binance Pick и делитесь своим мнением на Binance Square!
Binance Square Official
·Лайков: 412
·Просмотров: 343.3k
EarningsSeason
Просмотров: 5.3M
26,029 обсуждают
AnthropicTTMRevenueGrewAbout1200%
Просмотров: 32,027
436 обсуждают