

R3N 1
635 Публикации

R3N 1
Отправить жалобу
Заблокировать пользователя
Web3 & crypto Analyst || Breaking down market moves || token updates daily ➪NFA!!!
0 подписок(и/а)
3 подписчиков(а)
4 понравилось
Посты
·
--
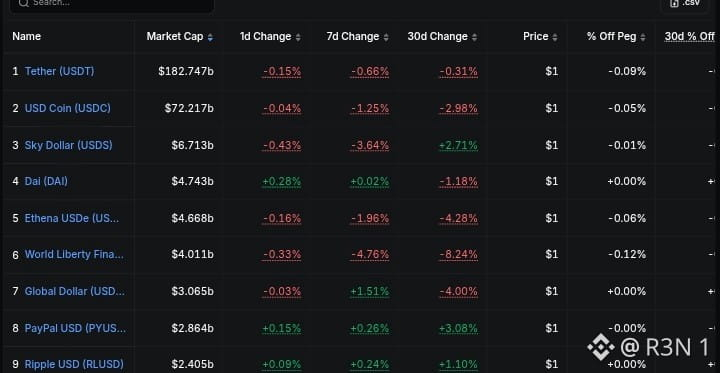
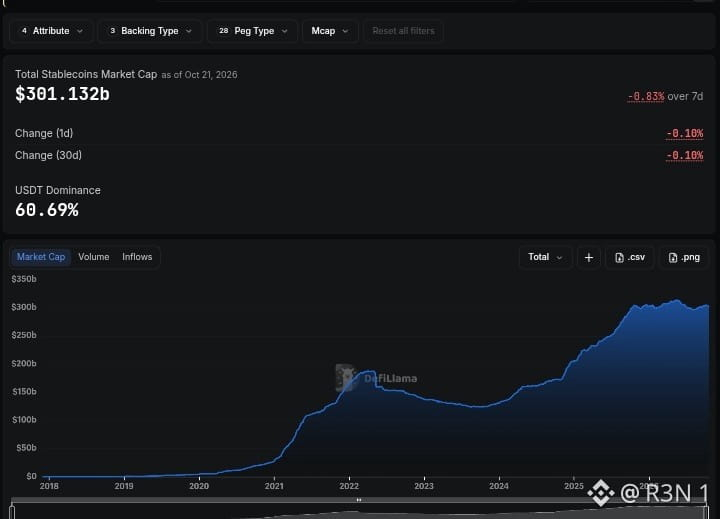
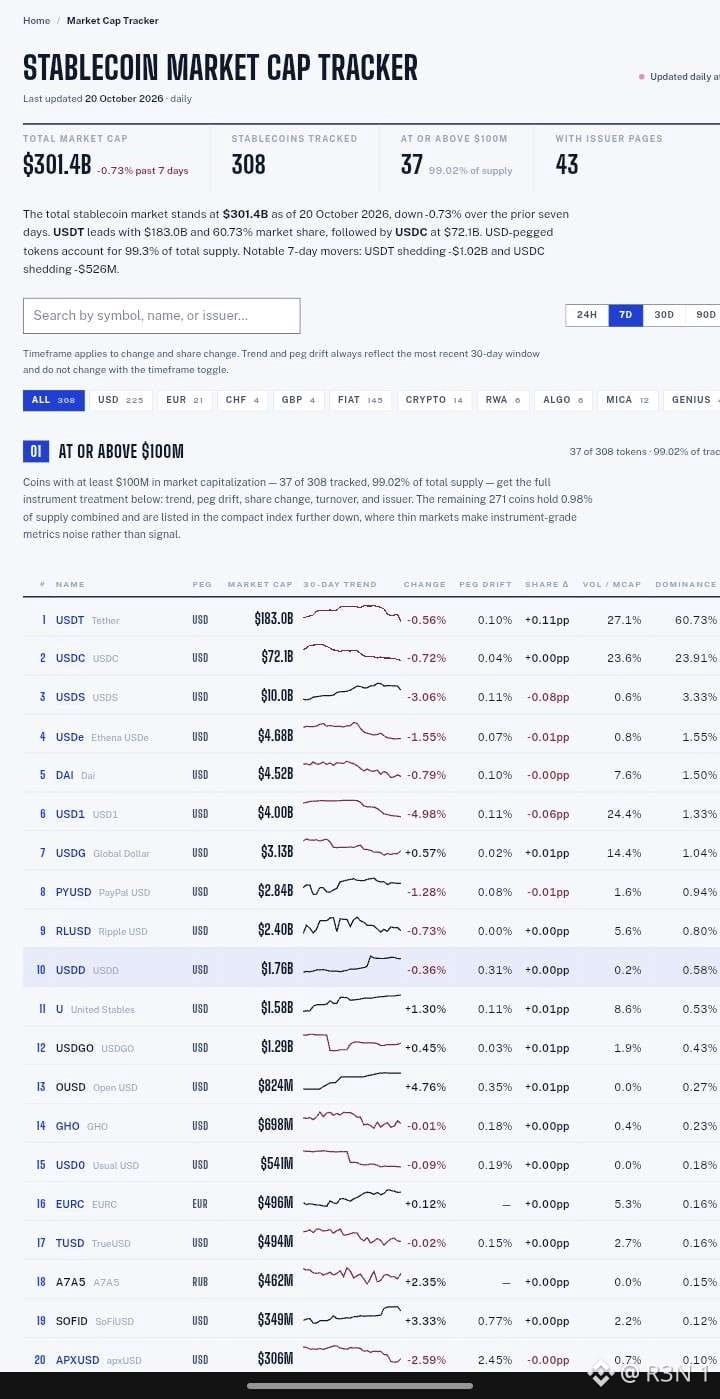
301 млрд долларов. Два имени. 84,7% всего рынка стейблкоинов.
Такова ситуация на октябрь 2026 года — и цифры этой недели рассказывают историю, которую большинство предпочитает не замечать.
На этой неделе USDT от Tether потерял почти 1 млрд долларов за пять дней. Балансы на биржах на 19 крупных платформах сократились на 4,6 млрд долларов с июля по 1 октября. Капитал не покинул крипторынок. Он перетёк — из Tether в USDC и RLUSD. Это различие важнее, чем многие думают.
USDT по-прежнему лидирует с капитализацией в 183 млрд долларов и долей рынка 60,71%.
Эта позиция не рушится. Но впервые со времён кризиса FTX в 2022 году объём предложения USDT снижался два месяца подряд, тогда как USDC вырос на 72% год к году. Рыночная капитализация показывает, сколько денег хранится. Объём транзакций показывает, сколько денег движется. С начала года объём транзакций в USDC составил 2,55 трлн долларов против 1,49 трлн долларов у USDT — это значит, что стейблкоин с меньшей капитализацией обращается быстрее и активнее используется для платежей и расчётов.
Затем наступило 30 сентября. Visa, Mastercard, Stripe, Coinbase, BlackRock и ещё более 140 компаний запустили OUSD — Open USD — с гарантированной ликвидностью в 1 млрд долларов и моделью распределения прибыли, которая даёт каждому партнёру финансовый стимул направлять через него транзакции вместо USDC. Спустя три недели объём предложения OUSD уже вырос на 4,5%, а за семь дней — на 10,73%, согласно данным DefiLlama по состоянию на 15 октября.
Рынок стейблкоинов никогда не был настолько перекошенным — и в то же время настолько конкурентным.
USDT лидирует в гонке за хранящиеся средства. USDC выигрывает гонку за движущиеся деньги. OUSD только что вышел на рынок при самой мощной корпоративной поддержке за всю историю платежей. А ни один другой стейблкоин не преодолел отметку в 5 млрд долларов — обрыв после первой двойки настолько резкий.
Это первая часть серии «Войны стейблкоинов». Во второй части мы расскажем, какой стейблкоин переживёт ужесточение регулирования — и ответ может вас удивить.
— R3N | @R3N_Research
$BTC #USDC #BTC Анализ цены# $ETH
301 млрд долларов. Два имени. 84,7% всего рынка стейблкоинов.
Такова ситуация на октябрь 2026 года — и цифры этой недели рассказывают историю, которую большинство предпочитает не замечать.
На этой неделе USDT от Tether потерял почти 1 млрд долларов за пять дней. Балансы на биржах на 19 крупных платформах сократились на 4,6 млрд долларов с июля по 1 октября. Капитал не покинул крипторынок. Он перетёк — из Tether в USDC и RLUSD. Это различие важнее, чем многие думают.
USDT по-прежнему лидирует с капитализацией в 183 млрд долларов и долей рынка 60,71%.
Эта позиция не рушится. Но впервые со времён кризиса FTX в 2022 году объём предложения USDT снижался два месяца подряд, тогда как USDC вырос на 72% год к году. Рыночная капитализация показывает, сколько денег хранится. Объём транзакций показывает, сколько денег движется. С начала года объём транзакций в USDC составил 2,55 трлн долларов против 1,49 трлн долларов у USDT — это значит, что стейблкоин с меньшей капитализацией обращается быстрее и активнее используется для платежей и расчётов.
Затем наступило 30 сентября. Visa, Mastercard, Stripe, Coinbase, BlackRock и ещё более 140 компаний запустили OUSD — Open USD — с гарантированной ликвидностью в 1 млрд долларов и моделью распределения прибыли, которая даёт каждому партнёру финансовый стимул направлять через него транзакции вместо USDC. Спустя три недели объём предложения OUSD уже вырос на 4,5%, а за семь дней — на 10,73%, согласно данным DefiLlama по состоянию на 15 октября.
Рынок стейблкоинов никогда не был настолько перекошенным — и в то же время настолько конкурентным.
USDT лидирует в гонке за хранящиеся средства. USDC выигрывает гонку за движущиеся деньги. OUSD только что вышел на рынок при самой мощной корпоративной поддержке за всю историю платежей. А ни один другой стейблкоин не преодолел отметку в 5 млрд долларов — обрыв после первой двойки настолько резкий.
Это первая часть серии «Войны стейблкоинов». Во второй части мы расскажем, какой стейблкоин переживёт ужесточение регулирования — и ответ может вас удивить.
— R3N | @R3N_Research
$BTC #USDC #BTC Анализ цены# $ETH
Такова ситуация на октябрь 2026 года — и цифры этой недели рассказывают историю, которую большинство предпочитает не замечать.
На этой неделе USDT от Tether потерял почти 1 млрд долларов за пять дней. Балансы на биржах на 19 крупных платформах сократились на 4,6 млрд долларов с июля по 1 октября. Капитал не покинул крипторынок. Он перетёк — из Tether в USDC и RLUSD. Это различие важнее, чем многие думают.
USDT по-прежнему лидирует с капитализацией в 183 млрд долларов и долей рынка 60,71%.
Эта позиция не рушится. Но впервые со времён кризиса FTX в 2022 году объём предложения USDT снижался два месяца подряд, тогда как USDC вырос на 72% год к году. Рыночная капитализация показывает, сколько денег хранится. Объём транзакций показывает, сколько денег движется. С начала года объём транзакций в USDC составил 2,55 трлн долларов против 1,49 трлн долларов у USDT — это значит, что стейблкоин с меньшей капитализацией обращается быстрее и активнее используется для платежей и расчётов.
Затем наступило 30 сентября. Visa, Mastercard, Stripe, Coinbase, BlackRock и ещё более 140 компаний запустили OUSD — Open USD — с гарантированной ликвидностью в 1 млрд долларов и моделью распределения прибыли, которая даёт каждому партнёру финансовый стимул направлять через него транзакции вместо USDC. Спустя три недели объём предложения OUSD уже вырос на 4,5%, а за семь дней — на 10,73%, согласно данным DefiLlama по состоянию на 15 октября.
Рынок стейблкоинов никогда не был настолько перекошенным — и в то же время настолько конкурентным.
USDT лидирует в гонке за хранящиеся средства. USDC выигрывает гонку за движущиеся деньги. OUSD только что вышел на рынок при самой мощной корпоративной поддержке за всю историю платежей. А ни один другой стейблкоин не преодолел отметку в 5 млрд долларов — обрыв после первой двойки настолько резкий.
Это первая часть серии «Войны стейблкоинов». Во второй части мы расскажем, какой стейблкоин переживёт ужесточение регулирования — и ответ может вас удивить.
— R3N | @R3N_Research
$BTC #USDC #BTC Анализ цены# $ETH
53
·
--
В конце июля Satsuma продала все 669 $BTC и ушла с биржи, Bitdeer обнулила свои резервы в феврале, а Genius Group распродала свои активы, тогда как Vaultz отказалась от политики хранения резервов. Другие продавали частично: например, MARA в марте продала 15 133 BTC, чтобы выкупить конвертируемые облигации примерно на $1 млрд, а Empery продала почти половину своих монет. Что бросается мне в глаза — это мотивы и сроки. Среди названных причин — погашение долгов, обратный выкуп акций, операционные расходы и затраты на центры обработки данных для ИИ, а не оценка перспектив цены биткоина. Большинство продаж пришлось на период с февраля по август, когда курс BTC был значительно ниже. Акции Satsuma упали примерно на 97%, прежде чем держатели проголосовали за ликвидацию компании, так что у компании с наступающим сроком погашения долга почти не оставалось выбора. Важен и масштаб. По сообщениям, ранее в этом году публичные компании владели примерно 1,16 млн BTC, поэтому 669 BTC у Satsuma — это около 0,06% от общего объёма. Strategy, первоначальная компания такой модели, по-прежнему владеет более чем 840 000 BTC после продажи небольшой части и 12 октября купила ещё 250 BTC. Но важен контраргумент. В 2025 году эти покупатели были реальным источником спроса, и если предельный корпоративный покупатель исчез, этот спрос вернётся нескоро. В октябре резервы компаний оценивались более чем в $100 млрд против примерно $80 млрд в сентябре, что даёт менее устойчивым компаниям возможность продавать на подъёме. В опубликованном на этой неделе отчёте отмечены переводы MARA на биржи на сумму $82 млн. Я бы следил за тем, у кого приближается срок погашения конвертируемого долга и торгуются ли акции компаний с резервами ниже стоимости принадлежащих им биткоинов. #Анализ цены BTC# $BTC #Прогноз цены Bitcoin: куда Bitcoin двинется дальше?#
В конце июля Satsuma продала все 669 $BTC и ушла с биржи, Bitdeer обнулила свои резервы в феврале, а Genius Group распродала свои активы, тогда как Vaultz отказалась от политики хранения резервов. Другие продавали частично: например, MARA в марте продала 15 133 BTC, чтобы выкупить конвертируемые облигации примерно на $1 млрд, а Empery продала почти половину своих монет. Что бросается мне в глаза — это мотивы и сроки. Среди названных причин — погашение долгов, обратный выкуп акций, операционные расходы и затраты на центры обработки данных для ИИ, а не оценка перспектив цены биткоина. Большинство продаж пришлось на период с февраля по август, когда курс BTC был значительно ниже. Акции Satsuma упали примерно на 97%, прежде чем держатели проголосовали за ликвидацию компании, так что у компании с наступающим сроком погашения долга почти не оставалось выбора. Важен и масштаб. По сообщениям, ранее в этом году публичные компании владели примерно 1,16 млн BTC, поэтому 669 BTC у Satsuma — это около 0,06% от общего объёма. Strategy, первоначальная компания такой модели, по-прежнему владеет более чем 840 000 BTC после продажи небольшой части и 12 октября купила ещё 250 BTC. Но важен контраргумент. В 2025 году эти покупатели были реальным источником спроса, и если предельный корпоративный покупатель исчез, этот спрос вернётся нескоро. В октябре резервы компаний оценивались более чем в $100 млрд против примерно $80 млрд в сентябре, что даёт менее устойчивым компаниям возможность продавать на подъёме. В опубликованном на этой неделе отчёте отмечены переводы MARA на биржи на сумму $82 млн. Я бы следил за тем, у кого приближается срок погашения конвертируемого долга и торгуются ли акции компаний с резервами ниже стоимости принадлежащих им биткоинов. #Анализ цены BTC# $BTC #Прогноз цены Bitcoin: куда Bitcoin двинется дальше?#
77
·
--
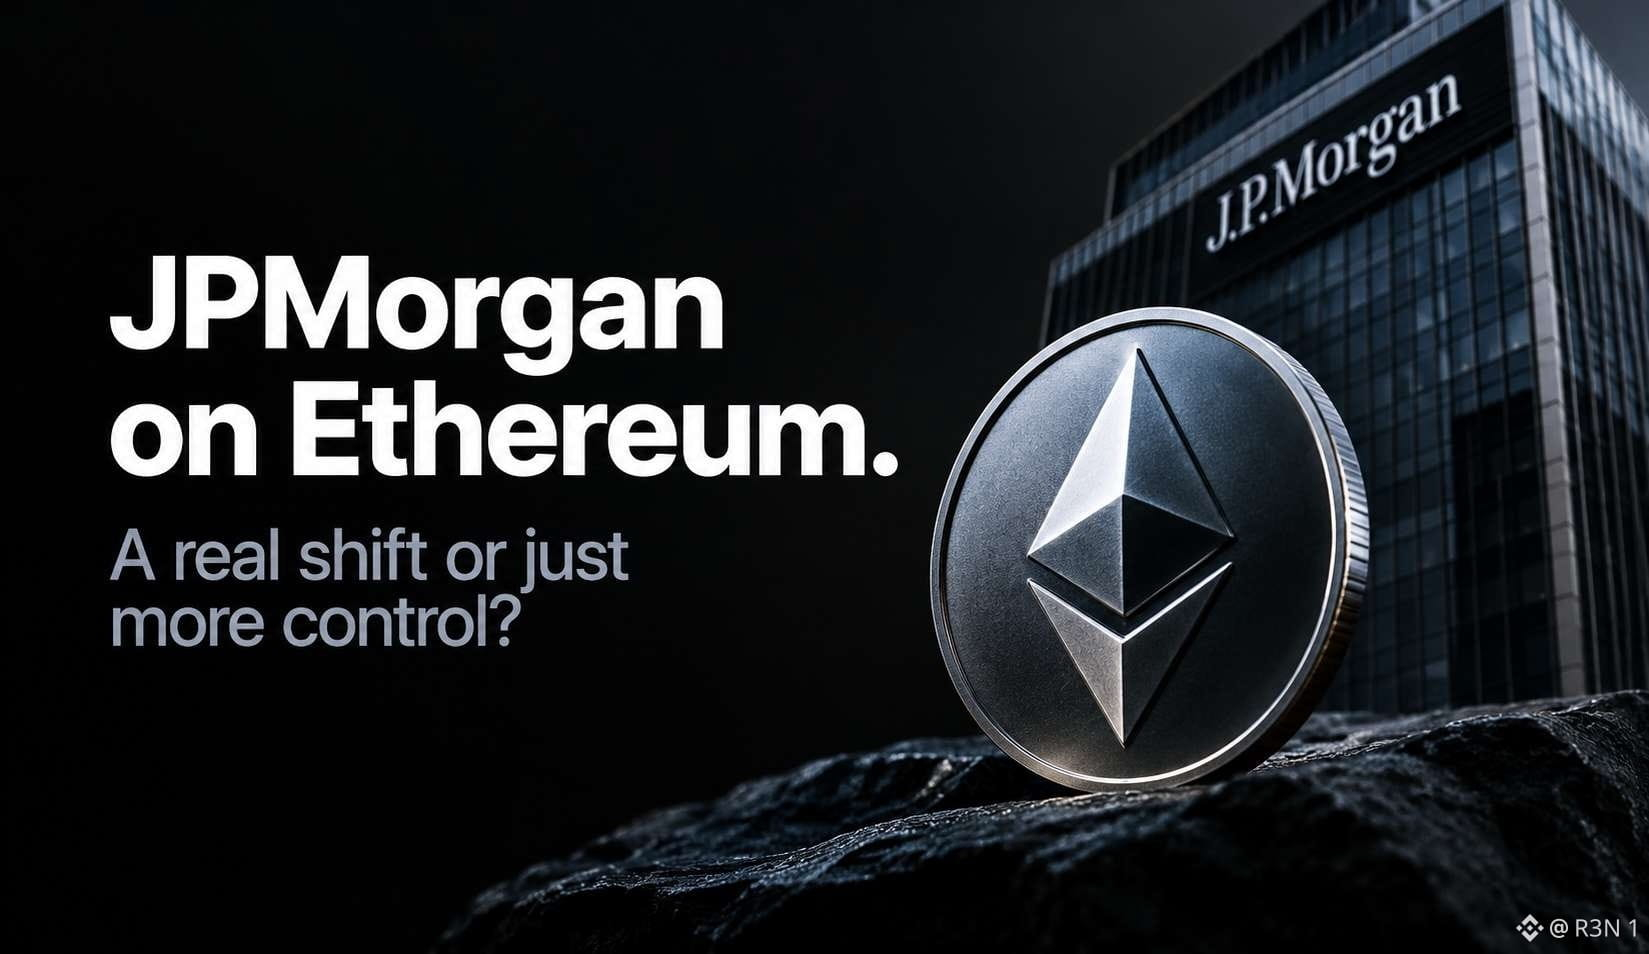
JPM Coin (тикер JPMD) — это токенизированный долларовый депозит в JPMorgan. С 19 октября он работает в основной сети Ethereum — спустя год после запуска в сети Base. Его выпускают только для одобренных институциональных клиентов через Kinexys, блокчейн-подразделение банка; розничным клиентам он недоступен. Это требование к банку, а не стейблкоин без разрешений.
Для сети это реальный сигнал. Kinexys обосновала этот шаг с поэтому прямой спрос невелик. Пока объём JPMD не станет значительным, это скорее позитивный информационный фон, чем источник комиссионных доходов. За день ETH вырос примерно на 1%, а отток средств из ETF на ETH на прошлой неделе составил около 320 млн долларов.
Меня особенно удивляет, как много остаётся нераскрытым. JPMorgan не сообщил, сколько клиентов будут пользоваться основной сетью, какой объём JPMD будет выпущен, и не опубликовал адрес контракта. Kinexys заявляет, что обработала триллионы долларов, но речь идёт обо всей платформе, а не об основной сети Ethereum.
Контраргумент в том, что JPMorgan не привязан к одной сети. Интеграция с Canton по-прежнему запланирована, а сам банк представляет это как обеспечение совместимости. Выиграть может та сеть, в которой окажутся активы, против которых клиенты захотят проводить расчёты.
Я бы следил за появлением первых названных клиентов, раскрытием объёма выпуска в основной сети и тем, начнёт ли объём Kinexys действительно перемещаться в блокчейн.
$ETH #BTC Анализ цены# #Альфа мемов#
JPM Coin (тикер JPMD) — это токенизированный долларовый депозит в JPMorgan. С 19 октября он работает в основной сети Ethereum — спустя год после запуска в сети Base. Его выпускают только для одобренных институциональных клиентов через Kinexys, блокчейн-подразделение банка; розничным клиентам он недоступен. Это требование к банку, а не стейблкоин без разрешений.
Для сети это реальный сигнал. Kinexys обосновала этот шаг с поэтому прямой спрос невелик. Пока объём JPMD не станет значительным, это скорее позитивный информационный фон, чем источник комиссионных доходов. За день ETH вырос примерно на 1%, а отток средств из ETF на ETH на прошлой неделе составил около 320 млн долларов.
Меня особенно удивляет, как много остаётся нераскрытым. JPMorgan не сообщил, сколько клиентов будут пользоваться основной сетью, какой объём JPMD будет выпущен, и не опубликовал адрес контракта. Kinexys заявляет, что обработала триллионы долларов, но речь идёт обо всей платформе, а не об основной сети Ethereum.
Контраргумент в том, что JPMorgan не привязан к одной сети. Интеграция с Canton по-прежнему запланирована, а сам банк представляет это как обеспечение совместимости. Выиграть может та сеть, в которой окажутся активы, против которых клиенты захотят проводить расчёты.
Я бы следил за появлением первых названных клиентов, раскрытием объёма выпуска в основной сети и тем, начнёт ли объём Kinexys действительно перемещаться в блокчейн.
$ETH #BTC Анализ цены# #Альфа мемов#
Для сети это реальный сигнал. Kinexys обосновала этот шаг с поэтому прямой спрос невелик. Пока объём JPMD не станет значительным, это скорее позитивный информационный фон, чем источник комиссионных доходов. За день ETH вырос примерно на 1%, а отток средств из ETF на ETH на прошлой неделе составил около 320 млн долларов.
Меня особенно удивляет, как много остаётся нераскрытым. JPMorgan не сообщил, сколько клиентов будут пользоваться основной сетью, какой объём JPMD будет выпущен, и не опубликовал адрес контракта. Kinexys заявляет, что обработала триллионы долларов, но речь идёт обо всей платформе, а не об основной сети Ethereum.
Контраргумент в том, что JPMorgan не привязан к одной сети. Интеграция с Canton по-прежнему запланирована, а сам банк представляет это как обеспечение совместимости. Выиграть может та сеть, в которой окажутся активы, против которых клиенты захотят проводить расчёты.
Я бы следил за появлением первых названных клиентов, раскрытием объёма выпуска в основной сети и тем, начнёт ли объём Kinexys действительно перемещаться в блокчейн.
$ETH #BTC Анализ цены# #Альфа мемов#
50
·
--
Американские спотовые ETF потеряли около $229 млн в BTC, $320 млн в ETH, $25,5 млн в SOL и $1,8 млн в XRP за период с 12 по 16 октября. Итог по биткоину определила одна торговая сессия. 14 октября, когда вышли высокие данные по инфляции, из фондов вывели $261 млн — больше, чем чистый отток за всю неделю. Днём ранее, напротив, был приток в $176 млн. На IBIT пришлось около 72% недельного оттока средств из BTC.
С Ethereum ситуация выглядит иначе. С середины сентября у фондов на его основе была лишь одна сессия с притоком; эта неделя стала третьей убыточной подряд, а 93% недельного оттока пришлось на один фонд — BlackRock. 16 октября стал для фондов ETH и SOL 11-м днём оттока в этом месяце, тогда как для BTC — шестым.
Больше всего меня впечатляет масштаб. $229 млн — это около 0,2% от примерно $104 млрд, которые находятся в биткоин-ETF, то есть речь идёт о сокращении позиций, а не о выходе. И это не ротация: все четыре категории потеряли средства.
Я считаю, что макроэкономика объясняет ситуацию с биткоином, а у ETH своя проблема. Высокая инфляция и заседание ФРС 28 октября давят на всё, а потоки в BTC отреагировали в день публикации данных по ИПЦ. Средства из ETH уходили и в спокойные дни — это больше похоже не на реакцию на новости, а на потерю интереса со стороны инвесторов.
Контраргумент в том, что концентрация работает в обе стороны. Если основная часть оттока из ETH приходится на один фонд, его можно объяснить действиями одного крупного инвестора, и ситуация может так же быстро прекратиться, как началась.
Я бы следил за двумя вещами: станут ли потоки в биткоин положительными после 28 октября и продолжат ли накапливаться дни оттока из ETH, когда нет громких макроэкономических новостей.
$BTC #BTC Анализ цены# #Мемная альфа# $ETH
Американские спотовые ETF потеряли около $229 млн в BTC, $320 млн в ETH, $25,5 млн в SOL и $1,8 млн в XRP за период с 12 по 16 октября. Итог по биткоину определила одна торговая сессия. 14 октября, когда вышли высокие данные по инфляции, из фондов вывели $261 млн — больше, чем чистый отток за всю неделю. Днём ранее, напротив, был приток в $176 млн. На IBIT пришлось около 72% недельного оттока средств из BTC.
С Ethereum ситуация выглядит иначе. С середины сентября у фондов на его основе была лишь одна сессия с притоком; эта неделя стала третьей убыточной подряд, а 93% недельного оттока пришлось на один фонд — BlackRock. 16 октября стал для фондов ETH и SOL 11-м днём оттока в этом месяце, тогда как для BTC — шестым.
Больше всего меня впечатляет масштаб. $229 млн — это около 0,2% от примерно $104 млрд, которые находятся в биткоин-ETF, то есть речь идёт о сокращении позиций, а не о выходе. И это не ротация: все четыре категории потеряли средства.
Я считаю, что макроэкономика объясняет ситуацию с биткоином, а у ETH своя проблема. Высокая инфляция и заседание ФРС 28 октября давят на всё, а потоки в BTC отреагировали в день публикации данных по ИПЦ. Средства из ETH уходили и в спокойные дни — это больше похоже не на реакцию на новости, а на потерю интереса со стороны инвесторов.
Контраргумент в том, что концентрация работает в обе стороны. Если основная часть оттока из ETH приходится на один фонд, его можно объяснить действиями одного крупного инвестора, и ситуация может так же быстро прекратиться, как началась.
Я бы следил за двумя вещами: станут ли потоки в биткоин положительными после 28 октября и продолжат ли накапливаться дни оттока из ETH, когда нет громких макроэкономических новостей.
$BTC #BTC Анализ цены# #Мемная альфа# $ETH
С Ethereum ситуация выглядит иначе. С середины сентября у фондов на его основе была лишь одна сессия с притоком; эта неделя стала третьей убыточной подряд, а 93% недельного оттока пришлось на один фонд — BlackRock. 16 октября стал для фондов ETH и SOL 11-м днём оттока в этом месяце, тогда как для BTC — шестым.
Больше всего меня впечатляет масштаб. $229 млн — это около 0,2% от примерно $104 млрд, которые находятся в биткоин-ETF, то есть речь идёт о сокращении позиций, а не о выходе. И это не ротация: все четыре категории потеряли средства.
Я считаю, что макроэкономика объясняет ситуацию с биткоином, а у ETH своя проблема. Высокая инфляция и заседание ФРС 28 октября давят на всё, а потоки в BTC отреагировали в день публикации данных по ИПЦ. Средства из ETH уходили и в спокойные дни — это больше похоже не на реакцию на новости, а на потерю интереса со стороны инвесторов.
Контраргумент в том, что концентрация работает в обе стороны. Если основная часть оттока из ETH приходится на один фонд, его можно объяснить действиями одного крупного инвестора, и ситуация может так же быстро прекратиться, как началась.
Я бы следил за двумя вещами: станут ли потоки в биткоин положительными после 28 октября и продолжат ли накапливаться дни оттока из ETH, когда нет громких макроэкономических новостей.
$BTC #BTC Анализ цены# #Мемная альфа# $ETH


69
·
--
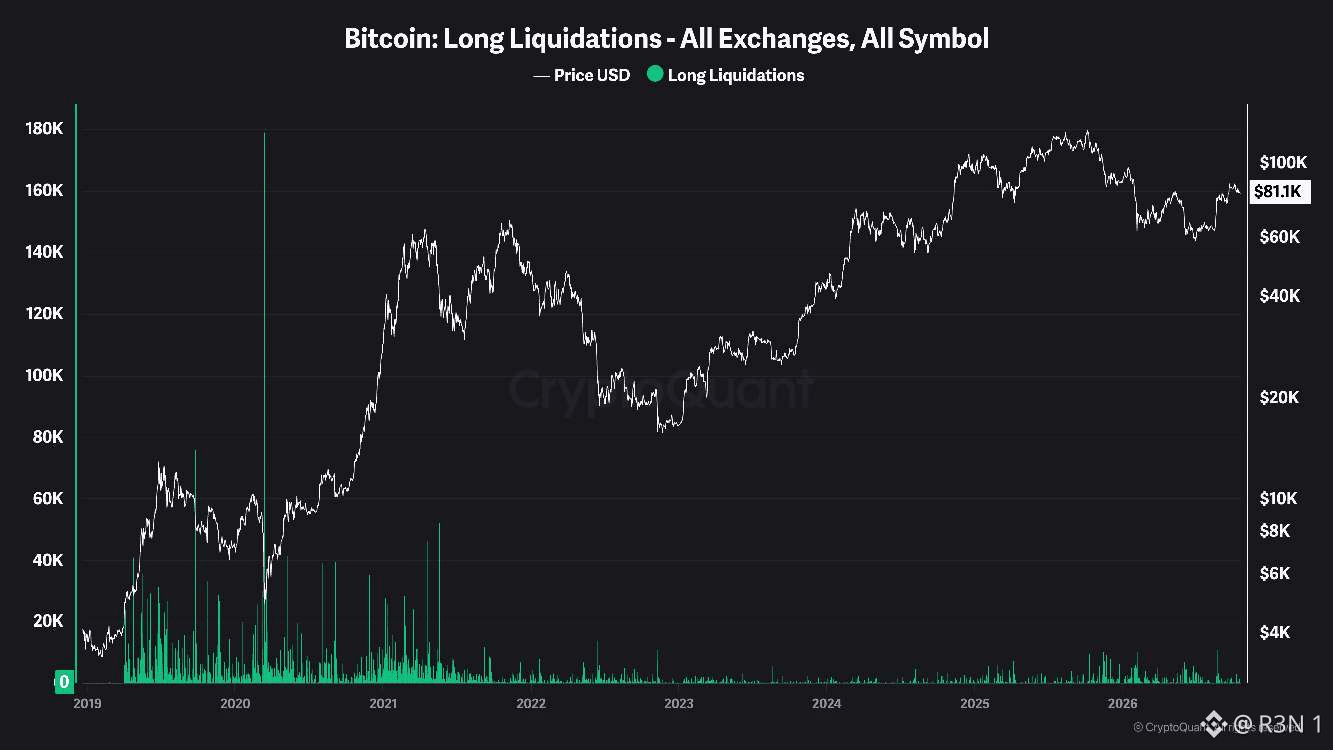
Ликвидации длинных позиций по биткоину на графике CryptoQuant выглядят незначительными, но единицы измерения скрывают большую часть картины.
На графике показаны ликвидации длинных позиций в BTC. В марте 2020 года показатель достиг примерно 180 тыс. BTC, а с 2019-го по 2021-й дни с объёмом от 40 тыс. до 75 тыс. BTC были обычным делом. Сейчас крупнейшие всплески за последний год — около 10–11 тыс. BTC. Может показаться, что рынок успокоился. Но это не так: BTC сейчас примерно в 16 раз дороже. По моим расчётам, 180 тыс. BTC по цене около $5 тыс. — это примерно $0,9 млрд, а 10 тыс. BTC по нынешней цене $81 тыс. — около $0,8 млрд. Суммы в долларах сопоставимы, а столбец гораздо ниже.
Больше всего меня интересует, как на этом фоне выглядит октябрь. По данным Coinglass, 8 и 9 октября общий объём ликвидаций составил около $1,19 млрд, из них примерно $273 млн пришлось на длинные позиции по BTC. Ещё около $820 млн — 12 октября. После этой встряски открытый интерес держался на уровне около $52,7 млрд. На этом графике те события почти незаметны: несколько тысяч BTC — немного по сравнению с прошлыми значениями.
Но есть и контраргумент: низкие столбцы могут означать совсем не то, что кажется. Постепенное сокращение кредитного плеча, когда позиции выбивает на несколько сотен миллионов долларов за раз, полезнее, чем один масштабный каскад ликвидаций. К тому же этот показатель отражает принудительные продажи, а не фактический объём кредитного плеча на рынке.
Я бы также осторожно сравнивал разные периоды. С 2019 года охват бирж изменился, поэтому ранние и поздние значения не вполне сопоставимы.
Главный ориентир — максимум за рассматриваемый период. Столбец выше 10–11 тыс. BTC станет крупнейшей волной ликвидаций за последний год. При цене BTC около $81 тыс. и уровне $80 тыс. в качестве поддержки именно за таким сценарием стоит следить, если вновь усилятся ожидания повышения ставки из-за данных по ИПЦ.
#АнализЦеныBTC# $BTC #СезонАльткоинов# #Макроэкономика#
Ликвидации длинных позиций по биткоину на графике CryptoQuant выглядят незначительными, но единицы измерения скрывают большую часть картины.
На графике показаны ликвидации длинных позиций в BTC. В марте 2020 года показатель достиг примерно 180 тыс. BTC, а с 2019-го по 2021-й дни с объёмом от 40 тыс. до 75 тыс. BTC были обычным делом. Сейчас крупнейшие всплески за последний год — около 10–11 тыс. BTC. Может показаться, что рынок успокоился. Но это не так: BTC сейчас примерно в 16 раз дороже. По моим расчётам, 180 тыс. BTC по цене около $5 тыс. — это примерно $0,9 млрд, а 10 тыс. BTC по нынешней цене $81 тыс. — около $0,8 млрд. Суммы в долларах сопоставимы, а столбец гораздо ниже.
Больше всего меня интересует, как на этом фоне выглядит октябрь. По данным Coinglass, 8 и 9 октября общий объём ликвидаций составил около $1,19 млрд, из них примерно $273 млн пришлось на длинные позиции по BTC. Ещё около $820 млн — 12 октября. После этой встряски открытый интерес держался на уровне около $52,7 млрд. На этом графике те события почти незаметны: несколько тысяч BTC — немного по сравнению с прошлыми значениями.
Но есть и контраргумент: низкие столбцы могут означать совсем не то, что кажется. Постепенное сокращение кредитного плеча, когда позиции выбивает на несколько сотен миллионов долларов за раз, полезнее, чем один масштабный каскад ликвидаций. К тому же этот показатель отражает принудительные продажи, а не фактический объём кредитного плеча на рынке.
Я бы также осторожно сравнивал разные периоды. С 2019 года охват бирж изменился, поэтому ранние и поздние значения не вполне сопоставимы.
Главный ориентир — максимум за рассматриваемый период. Столбец выше 10–11 тыс. BTC станет крупнейшей волной ликвидаций за последний год. При цене BTC около $81 тыс. и уровне $80 тыс. в качестве поддержки именно за таким сценарием стоит следить, если вновь усилятся ожидания повышения ставки из-за данных по ИПЦ.
#АнализЦеныBTC# $BTC #СезонАльткоинов# #Макроэкономика#
На графике показаны ликвидации длинных позиций в BTC. В марте 2020 года показатель достиг примерно 180 тыс. BTC, а с 2019-го по 2021-й дни с объёмом от 40 тыс. до 75 тыс. BTC были обычным делом. Сейчас крупнейшие всплески за последний год — около 10–11 тыс. BTC. Может показаться, что рынок успокоился. Но это не так: BTC сейчас примерно в 16 раз дороже. По моим расчётам, 180 тыс. BTC по цене около $5 тыс. — это примерно $0,9 млрд, а 10 тыс. BTC по нынешней цене $81 тыс. — около $0,8 млрд. Суммы в долларах сопоставимы, а столбец гораздо ниже.
Больше всего меня интересует, как на этом фоне выглядит октябрь. По данным Coinglass, 8 и 9 октября общий объём ликвидаций составил около $1,19 млрд, из них примерно $273 млн пришлось на длинные позиции по BTC. Ещё около $820 млн — 12 октября. После этой встряски открытый интерес держался на уровне около $52,7 млрд. На этом графике те события почти незаметны: несколько тысяч BTC — немного по сравнению с прошлыми значениями.
Но есть и контраргумент: низкие столбцы могут означать совсем не то, что кажется. Постепенное сокращение кредитного плеча, когда позиции выбивает на несколько сотен миллионов долларов за раз, полезнее, чем один масштабный каскад ликвидаций. К тому же этот показатель отражает принудительные продажи, а не фактический объём кредитного плеча на рынке.
Я бы также осторожно сравнивал разные периоды. С 2019 года охват бирж изменился, поэтому ранние и поздние значения не вполне сопоставимы.
Главный ориентир — максимум за рассматриваемый период. Столбец выше 10–11 тыс. BTC станет крупнейшей волной ликвидаций за последний год. При цене BTC около $81 тыс. и уровне $80 тыс. в качестве поддержки именно за таким сценарием стоит следить, если вновь усилятся ожидания повышения ставки из-за данных по ИПЦ.
#АнализЦеныBTC# $BTC #СезонАльткоинов# #Макроэкономика#
28
·
--
Объём бессрочных контрактов на RWA на Injective вырос с $61 млн в мае до более чем $230 млн за последний месяц. Эта тенденция важнее заголовочной цифры в $1,1 млрд с начала года.
Эти данные взяты из публикации самой Injective от 18 октября, так что это цифры сети, а не независимый аудит. Впрочем, они сходятся: по данным CoinGecko, с начала года по август объём составил $845,9 млн, из них $186,5 млн пришлось на июль и $209,7 млн — на август; последний месяц добавляет к этой сумме. Среди 135 активных рынков главную роль играют акции. В разбивке за последние 30 дней, которую мне удалось найти, на них пришлось $127,3 млн из $214,9 млн; объём валютного рынка составил $49 млн, а остаток поделили сырьевые товары, акции компаний до IPO и индексы.
Больше всего бросается в глаза, насколько эти цифры малы по сравнению с лидером. В июле объём торгов на рынках Hyperliquid, развёрнутых билдерами, составил около $114 млрд, согласно данным Artemis. По моим расчётам, весь годовой объём Injective — это примерно 1% от объёма Hyperliquid за один месяц. Но это не значит, что Injective неважна. Это нишевая площадка в категории, которая уже достигла колоссальных масштабов.
В данных есть и ещё одна оговорка. По данным CoinGecko, с начала 2025 года совокупный объём торгов бессрочными контрактами на RWA составил $5,3 млрд. По моим расчётам, это означает, что в 2025 году средний месячный объём превышал $300 млн. Так что $230 млн в месяц — это восстановление до прежнего уровня, а не новый пик.
Остаётся открытым вопрос, кто торгует на этой площадке. Injective не сообщала, какая доля объёма приходится на институциональных участников, а какая — на розничных трейдеров с плечом. И заявление о лидерстве по выручке относительно FDV имеет смысл, только если объём торгов сохраняется.
Я бы следил за тем, удержится ли месячный объём выше $200 млн ещё один квартал и вырастет ли доля сырьевых товаров и акций до IPO, которая пока совсем невелика.
$INJ #АнализЦеныBTC# #СезонАльткоинов# #BNBChain#
Объём бессрочных контрактов на RWA на Injective вырос с $61 млн в мае до более чем $230 млн за последний месяц. Эта тенденция важнее заголовочной цифры в $1,1 млрд с начала года.
Эти данные взяты из публикации самой Injective от 18 октября, так что это цифры сети, а не независимый аудит. Впрочем, они сходятся: по данным CoinGecko, с начала года по август объём составил $845,9 млн, из них $186,5 млн пришлось на июль и $209,7 млн — на август; последний месяц добавляет к этой сумме. Среди 135 активных рынков главную роль играют акции. В разбивке за последние 30 дней, которую мне удалось найти, на них пришлось $127,3 млн из $214,9 млн; объём валютного рынка составил $49 млн, а остаток поделили сырьевые товары, акции компаний до IPO и индексы.
Больше всего бросается в глаза, насколько эти цифры малы по сравнению с лидером. В июле объём торгов на рынках Hyperliquid, развёрнутых билдерами, составил около $114 млрд, согласно данным Artemis. По моим расчётам, весь годовой объём Injective — это примерно 1% от объёма Hyperliquid за один месяц. Но это не значит, что Injective неважна. Это нишевая площадка в категории, которая уже достигла колоссальных масштабов.
В данных есть и ещё одна оговорка. По данным CoinGecko, с начала 2025 года совокупный объём торгов бессрочными контрактами на RWA составил $5,3 млрд. По моим расчётам, это означает, что в 2025 году средний месячный объём превышал $300 млн. Так что $230 млн в месяц — это восстановление до прежнего уровня, а не новый пик.
Остаётся открытым вопрос, кто торгует на этой площадке. Injective не сообщала, какая доля объёма приходится на институциональных участников, а какая — на розничных трейдеров с плечом. И заявление о лидерстве по выручке относительно FDV имеет смысл, только если объём торгов сохраняется.
Я бы следил за тем, удержится ли месячный объём выше $200 млн ещё один квартал и вырастет ли доля сырьевых товаров и акций до IPO, которая пока совсем невелика.
$INJ #АнализЦеныBTC# #СезонАльткоинов# #BNBChain#
Эти данные взяты из публикации самой Injective от 18 октября, так что это цифры сети, а не независимый аудит. Впрочем, они сходятся: по данным CoinGecko, с начала года по август объём составил $845,9 млн, из них $186,5 млн пришлось на июль и $209,7 млн — на август; последний месяц добавляет к этой сумме. Среди 135 активных рынков главную роль играют акции. В разбивке за последние 30 дней, которую мне удалось найти, на них пришлось $127,3 млн из $214,9 млн; объём валютного рынка составил $49 млн, а остаток поделили сырьевые товары, акции компаний до IPO и индексы.
Больше всего бросается в глаза, насколько эти цифры малы по сравнению с лидером. В июле объём торгов на рынках Hyperliquid, развёрнутых билдерами, составил около $114 млрд, согласно данным Artemis. По моим расчётам, весь годовой объём Injective — это примерно 1% от объёма Hyperliquid за один месяц. Но это не значит, что Injective неважна. Это нишевая площадка в категории, которая уже достигла колоссальных масштабов.
В данных есть и ещё одна оговорка. По данным CoinGecko, с начала 2025 года совокупный объём торгов бессрочными контрактами на RWA составил $5,3 млрд. По моим расчётам, это означает, что в 2025 году средний месячный объём превышал $300 млн. Так что $230 млн в месяц — это восстановление до прежнего уровня, а не новый пик.
Остаётся открытым вопрос, кто торгует на этой площадке. Injective не сообщала, какая доля объёма приходится на институциональных участников, а какая — на розничных трейдеров с плечом. И заявление о лидерстве по выручке относительно FDV имеет смысл, только если объём торгов сохраняется.
Я бы следил за тем, удержится ли месячный объём выше $200 млн ещё один квартал и вырастет ли доля сырьевых товаров и акций до IPO, которая пока совсем невелика.
$INJ #АнализЦеныBTC# #СезонАльткоинов# #BNBChain#
28
·
--
Из каждого доллара, заработанного USDC, 59 центов уходят ещё до того, как что-либо остаётся Circle. Именно на эту цифру стоит обратить внимание в первую очередь.
Согласно опубликованной Circle 16 октября разбивке за первое полугодие 2026 года, выручка и доход от резервов составили около $1,4 млрд. Примерно $819 млн, или 59%, ушли партнёрам по дистрибуции и на транзакционные издержки. Ещё $473 млн, или 34%, направили на инфраструктуру — лицензирование, комплаенс и разработку продукта. Осталось около $98 млн чистой прибыли — примерно 7 центов с каждого доллара. За полугодие через USDC также прошло более $36 трлн ончейн-транзакций; в июне на него пришлось около 77% объёма транзакций со стейблкоинами.
Меня особенно удивляет, как малая доля этих $36 трлн превращается в выручку. По моим расчётам, $1,4 млрд с $36 трлн — это меньше половины базисного пункта. Выручка зависит от резервов — в основном от процентов на активы, обеспечивающие USDC, — а не от того, как часто перемещается монета. Поэтому дистрибуция — главный рычаг: партнёрам, которые хранят или продвигают USDC, платят за эти остатки. Новая пятилетняя сделка с Binance, предусматривающая долю в капитале и ежемесячное стимулирующее вознаграждение, привязанное к объёму хранящегося USDC, — та же логика, но в более агрессивной форме.
На мой взгляд, эта разбивка — ещё и послание. Circle опубликовала её одновременно с запуском бесплатного погашения почти в реальном времени. Похоже, это ответ на заявления о том, что эмитенты оставляют себе большую часть дохода. Это собственная трактовка компании, а не результаты аудита; кроме того, «партнёры и транзакционные издержки» сведены в одну категорию, поэтому долю одних только партнёров определить нельзя.
Контраргумент в том, что низкая маржа — это цена роста. Маржа в 7% для бизнеса с таким охватом не означает проблем, а сентябрьское снижение ставки ФРС произошло уже после этого периода, поэтому во втором полугодии доход от резервов может выглядеть лучше. Цикл снижения ставок повлиял бы в обратную сторону.
Я бы следил за тем, снизится ли доля в 59% по мере роста USDC или же партнёры будут забирать себе больше по мере усиления их влияния.
$USDC #BTC Анализ цены# #Мем-альфа# $SUI
Из каждого доллара, заработанного USDC, 59 центов уходят ещё до того, как что-либо остаётся Circle. Именно на эту цифру стоит обратить внимание в первую очередь.
Согласно опубликованной Circle 16 октября разбивке за первое полугодие 2026 года, выручка и доход от резервов составили около $1,4 млрд. Примерно $819 млн, или 59%, ушли партнёрам по дистрибуции и на транзакционные издержки. Ещё $473 млн, или 34%, направили на инфраструктуру — лицензирование, комплаенс и разработку продукта. Осталось около $98 млн чистой прибыли — примерно 7 центов с каждого доллара. За полугодие через USDC также прошло более $36 трлн ончейн-транзакций; в июне на него пришлось около 77% объёма транзакций со стейблкоинами.
Меня особенно удивляет, как малая доля этих $36 трлн превращается в выручку. По моим расчётам, $1,4 млрд с $36 трлн — это меньше половины базисного пункта. Выручка зависит от резервов — в основном от процентов на активы, обеспечивающие USDC, — а не от того, как часто перемещается монета. Поэтому дистрибуция — главный рычаг: партнёрам, которые хранят или продвигают USDC, платят за эти остатки. Новая пятилетняя сделка с Binance, предусматривающая долю в капитале и ежемесячное стимулирующее вознаграждение, привязанное к объёму хранящегося USDC, — та же логика, но в более агрессивной форме.
На мой взгляд, эта разбивка — ещё и послание. Circle опубликовала её одновременно с запуском бесплатного погашения почти в реальном времени. Похоже, это ответ на заявления о том, что эмитенты оставляют себе большую часть дохода. Это собственная трактовка компании, а не результаты аудита; кроме того, «партнёры и транзакционные издержки» сведены в одну категорию, поэтому долю одних только партнёров определить нельзя.
Контраргумент в том, что низкая маржа — это цена роста. Маржа в 7% для бизнеса с таким охватом не означает проблем, а сентябрьское снижение ставки ФРС произошло уже после этого периода, поэтому во втором полугодии доход от резервов может выглядеть лучше. Цикл снижения ставок повлиял бы в обратную сторону.
Я бы следил за тем, снизится ли доля в 59% по мере роста USDC или же партнёры будут забирать себе больше по мере усиления их влияния.
$USDC #BTC Анализ цены# #Мем-альфа# $SUI
Согласно опубликованной Circle 16 октября разбивке за первое полугодие 2026 года, выручка и доход от резервов составили около $1,4 млрд. Примерно $819 млн, или 59%, ушли партнёрам по дистрибуции и на транзакционные издержки. Ещё $473 млн, или 34%, направили на инфраструктуру — лицензирование, комплаенс и разработку продукта. Осталось около $98 млн чистой прибыли — примерно 7 центов с каждого доллара. За полугодие через USDC также прошло более $36 трлн ончейн-транзакций; в июне на него пришлось около 77% объёма транзакций со стейблкоинами.
Меня особенно удивляет, как малая доля этих $36 трлн превращается в выручку. По моим расчётам, $1,4 млрд с $36 трлн — это меньше половины базисного пункта. Выручка зависит от резервов — в основном от процентов на активы, обеспечивающие USDC, — а не от того, как часто перемещается монета. Поэтому дистрибуция — главный рычаг: партнёрам, которые хранят или продвигают USDC, платят за эти остатки. Новая пятилетняя сделка с Binance, предусматривающая долю в капитале и ежемесячное стимулирующее вознаграждение, привязанное к объёму хранящегося USDC, — та же логика, но в более агрессивной форме.
На мой взгляд, эта разбивка — ещё и послание. Circle опубликовала её одновременно с запуском бесплатного погашения почти в реальном времени. Похоже, это ответ на заявления о том, что эмитенты оставляют себе большую часть дохода. Это собственная трактовка компании, а не результаты аудита; кроме того, «партнёры и транзакционные издержки» сведены в одну категорию, поэтому долю одних только партнёров определить нельзя.
Контраргумент в том, что низкая маржа — это цена роста. Маржа в 7% для бизнеса с таким охватом не означает проблем, а сентябрьское снижение ставки ФРС произошло уже после этого периода, поэтому во втором полугодии доход от резервов может выглядеть лучше. Цикл снижения ставок повлиял бы в обратную сторону.
Я бы следил за тем, снизится ли доля в 59% по мере роста USDC или же партнёры будут забирать себе больше по мере усиления их влияния.
$USDC #BTC Анализ цены# #Мем-альфа# $SUI

45
·
--
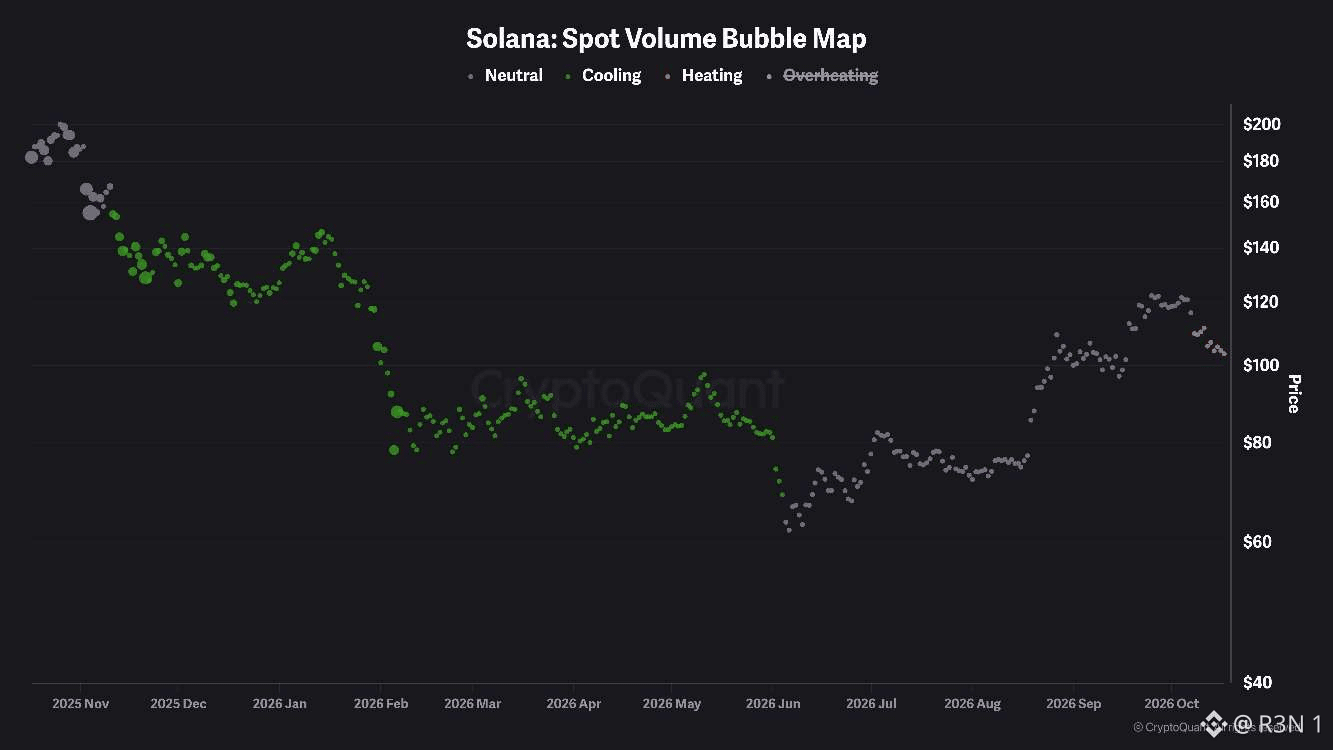
На карте пузырьков спотового объёма CryptoQuant впервые за этот период появились показатели «нагрева» SOL — около шести пузырьков на фоне снижения цены примерно со $112 до $103. Большую часть года график выглядел иначе. С декабря до начала июня почти все пузырьки были зелёными: это означало, что объёмы остывали, пока цена опускалась примерно со $150 до нижней границы диапазона $80. Участие рынка постепенно затихало, и июньский минимум около $62 тоже не сопровождался всплеском объёмов.
Меня больше всего поражает контраст. Остывающий объём при падающей цене — это апатия. Нагревающийся объём при падении цены означает, что люди активно продают, и именно так это выглядит. Цвет показывает объём, а не направление движения, поэтому направление я определяю по ценовой шкале.
Другие данные указывают на то же самое, хотя к некоторым из них я бы относился с осторожностью. По сообщениям, спотовые ETF на Solana фиксируют отток средств десять дней подряд, объём стейблкоинов в сети с 25 сентября сократился примерно на $1,5 млрд, а в субботу открытый интерес по фьючерсам упал на 4% — сильнее, чем у других крупных активов. SOL торгуется в районе $102–104.
Контраргумент состоит в том, что это всё ещё откат в рамках восстановления. По моим расчётам, SOL примерно на 65% выше июньского минимума, а период «нагрева» короткий, поэтому нескольких спокойных сессий хватит, чтобы он исчез.
Я бы следил за двумя вещами. Если пузырьки снова станут нейтральными, а SOL удержится в районе $100, значит, давление продаж ослабевает. Если «нагрев» сохранится при пробое отметки $100, объём подтверждает движение, и тогда главный вопрос — усилится ли оно дальше.
$SOL #Макроэкономический обзор# #Анализ цены BTC# $BTC
На карте пузырьков спотового объёма CryptoQuant впервые за этот период появились показатели «нагрева» SOL — около шести пузырьков на фоне снижения цены примерно со $112 до $103. Большую часть года график выглядел иначе. С декабря до начала июня почти все пузырьки были зелёными: это означало, что объёмы остывали, пока цена опускалась примерно со $150 до нижней границы диапазона $80. Участие рынка постепенно затихало, и июньский минимум около $62 тоже не сопровождался всплеском объёмов.
Меня больше всего поражает контраст. Остывающий объём при падающей цене — это апатия. Нагревающийся объём при падении цены означает, что люди активно продают, и именно так это выглядит. Цвет показывает объём, а не направление движения, поэтому направление я определяю по ценовой шкале.
Другие данные указывают на то же самое, хотя к некоторым из них я бы относился с осторожностью. По сообщениям, спотовые ETF на Solana фиксируют отток средств десять дней подряд, объём стейблкоинов в сети с 25 сентября сократился примерно на $1,5 млрд, а в субботу открытый интерес по фьючерсам упал на 4% — сильнее, чем у других крупных активов. SOL торгуется в районе $102–104.
Контраргумент состоит в том, что это всё ещё откат в рамках восстановления. По моим расчётам, SOL примерно на 65% выше июньского минимума, а период «нагрева» короткий, поэтому нескольких спокойных сессий хватит, чтобы он исчез.
Я бы следил за двумя вещами. Если пузырьки снова станут нейтральными, а SOL удержится в районе $100, значит, давление продаж ослабевает. Если «нагрев» сохранится при пробое отметки $100, объём подтверждает движение, и тогда главный вопрос — усилится ли оно дальше.
$SOL #Макроэкономический обзор# #Анализ цены BTC# $BTC
Меня больше всего поражает контраст. Остывающий объём при падающей цене — это апатия. Нагревающийся объём при падении цены означает, что люди активно продают, и именно так это выглядит. Цвет показывает объём, а не направление движения, поэтому направление я определяю по ценовой шкале.
Другие данные указывают на то же самое, хотя к некоторым из них я бы относился с осторожностью. По сообщениям, спотовые ETF на Solana фиксируют отток средств десять дней подряд, объём стейблкоинов в сети с 25 сентября сократился примерно на $1,5 млрд, а в субботу открытый интерес по фьючерсам упал на 4% — сильнее, чем у других крупных активов. SOL торгуется в районе $102–104.
Контраргумент состоит в том, что это всё ещё откат в рамках восстановления. По моим расчётам, SOL примерно на 65% выше июньского минимума, а период «нагрева» короткий, поэтому нескольких спокойных сессий хватит, чтобы он исчез.
Я бы следил за двумя вещами. Если пузырьки снова станут нейтральными, а SOL удержится в районе $100, значит, давление продаж ослабевает. Если «нагрев» сохранится при пробое отметки $100, объём подтверждает движение, и тогда главный вопрос — усилится ли оно дальше.
$SOL #Макроэкономический обзор# #Анализ цены BTC# $BTC
57
·
--
Краткосрочные держатели перешли от продажи с прибылью к продаже в безубыток — и это не так тревожно, как может показаться.
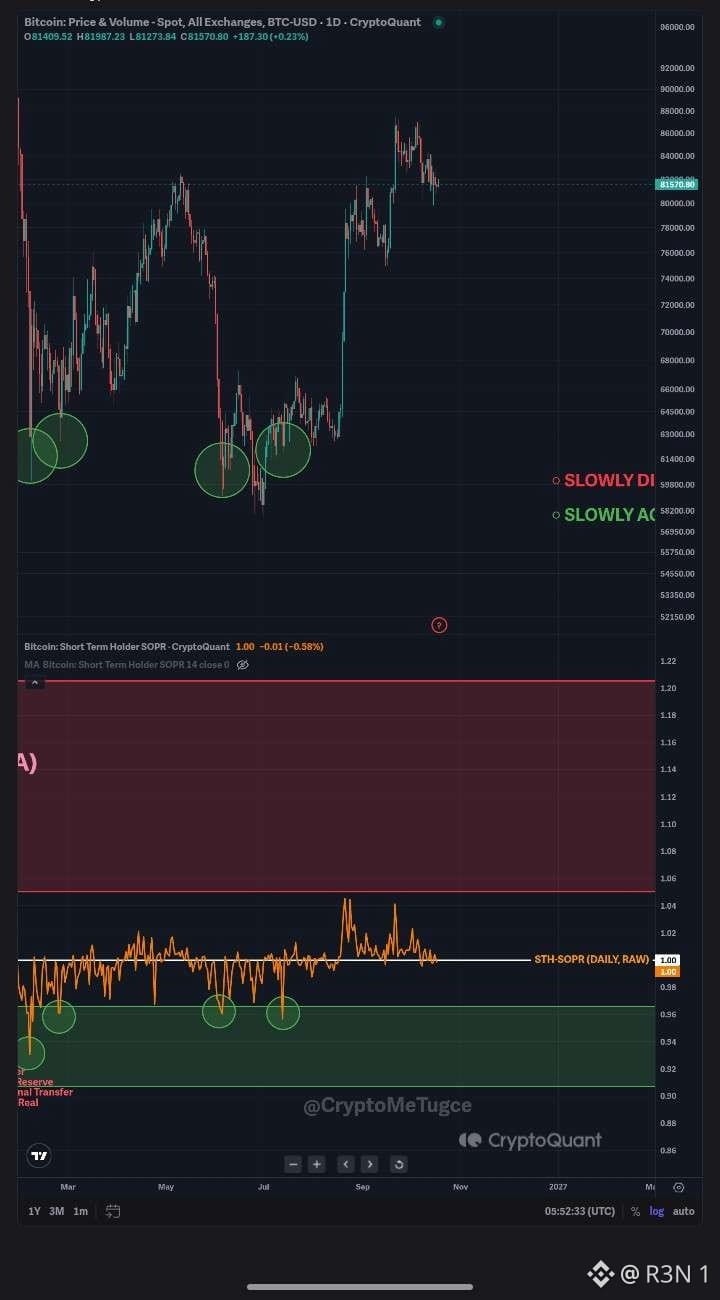
Показатель STH-SOPR от CryptoQuant составляет 1,00, а BTC торгуется около $81,6 тыс. — примерно на 6% ниже максимума начала октября. Этот показатель отражает, продают ли недавние покупатели монеты дороже или дешевле цены покупки. Во время роста с сентября по октябрь он достиг пика около 1,04 — значит, фиксация прибыли оставалась умеренной. Он так и не поднялся до отметки 1,05, которая обычно появляется, когда толпа начинает жадничать.
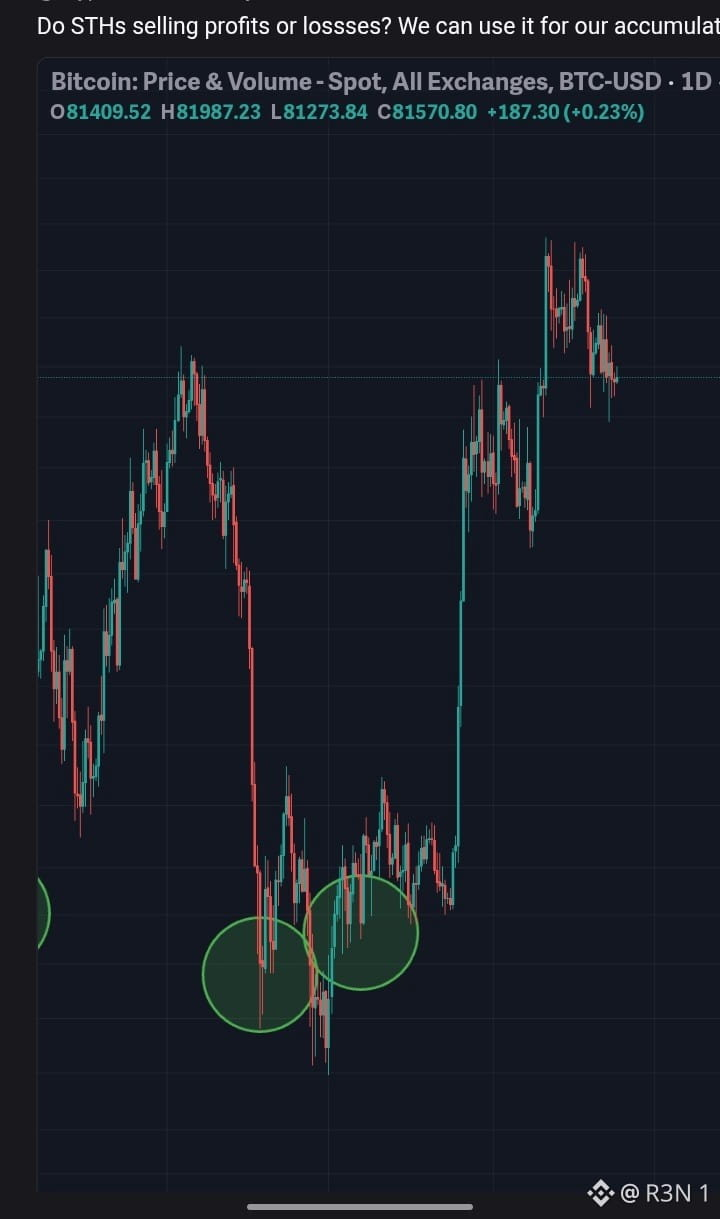
Но мне бросается в глаза другая часть графика. Каждый крупный минимум в этом году — около $60 тыс. в феврале и марте, а затем в июне и июле — сопровождался снижением STH-SOPR примерно до 0,93–0,96. Недавние покупатели капитулировали, и вскоре после этого цена достигала дна. Четыре примера — небольшая выборка, но закономерность прослеживается.
Макроэкономический фон объясняет возврат показателя к 1,00. Индекс потребительских цен, оказавшийся выше ожиданий 14 октября, повысил вероятность повышения ставки перед заседанием ФРС 28 октября, и BTC просел к $80 тыс., прежде чем восстановиться. Краткосрочные держатели не капитулировали во время этого снижения: STH-SOPR не опустился в диапазон 0,93–0,96. Это говорит в пользу устойчивого ценового дна, хотя одного снижения недостаточно для подтверждения.
Контраргумент состоит в том, что значение ровно 1,0 также может указывать на нерешительность перед падением. Если ФРС повысит ставку, а цена пробьёт октябрьский минимум около $80 тыс., краткосрочные держатели окажутся в убытке — именно это и опускало коэффициент в диапазон, отмечавший предыдущие минимумы.
Я бы следил за тем, какой из сценариев закрепится. Падение ниже 0,97 стало бы капитуляцией, которая исторически происходила вблизи дна, а удержание выше 1,0 вплоть до заседания ФРС показало бы, что покупатели не готовы продавать себе в убыток.
$BTC #BTC Анализ цены# #Мемная альфа#
Краткосрочные держатели перешли от продажи с прибылью к продаже в безубыток — и это не так тревожно, как может показаться.
Показатель STH-SOPR от CryptoQuant составляет 1,00, а BTC торгуется около $81,6 тыс. — примерно на 6% ниже максимума начала октября. Этот показатель отражает, продают ли недавние покупатели монеты дороже или дешевле цены покупки. Во время роста с сентября по октябрь он достиг пика около 1,04 — значит, фиксация прибыли оставалась умеренной. Он так и не поднялся до отметки 1,05, которая обычно появляется, когда толпа начинает жадничать.
Но мне бросается в глаза другая часть графика. Каждый крупный минимум в этом году — около $60 тыс. в феврале и марте, а затем в июне и июле — сопровождался снижением STH-SOPR примерно до 0,93–0,96. Недавние покупатели капитулировали, и вскоре после этого цена достигала дна. Четыре примера — небольшая выборка, но закономерность прослеживается.
Макроэкономический фон объясняет возврат показателя к 1,00. Индекс потребительских цен, оказавшийся выше ожиданий 14 октября, повысил вероятность повышения ставки перед заседанием ФРС 28 октября, и BTC просел к $80 тыс., прежде чем восстановиться. Краткосрочные держатели не капитулировали во время этого снижения: STH-SOPR не опустился в диапазон 0,93–0,96. Это говорит в пользу устойчивого ценового дна, хотя одного снижения недостаточно для подтверждения.
Контраргумент состоит в том, что значение ровно 1,0 также может указывать на нерешительность перед падением. Если ФРС повысит ставку, а цена пробьёт октябрьский минимум около $80 тыс., краткосрочные держатели окажутся в убытке — именно это и опускало коэффициент в диапазон, отмечавший предыдущие минимумы.
Я бы следил за тем, какой из сценариев закрепится. Падение ниже 0,97 стало бы капитуляцией, которая исторически происходила вблизи дна, а удержание выше 1,0 вплоть до заседания ФРС показало бы, что покупатели не готовы продавать себе в убыток.
$BTC #BTC Анализ цены# #Мемная альфа#
Показатель STH-SOPR от CryptoQuant составляет 1,00, а BTC торгуется около $81,6 тыс. — примерно на 6% ниже максимума начала октября. Этот показатель отражает, продают ли недавние покупатели монеты дороже или дешевле цены покупки. Во время роста с сентября по октябрь он достиг пика около 1,04 — значит, фиксация прибыли оставалась умеренной. Он так и не поднялся до отметки 1,05, которая обычно появляется, когда толпа начинает жадничать.
Но мне бросается в глаза другая часть графика. Каждый крупный минимум в этом году — около $60 тыс. в феврале и марте, а затем в июне и июле — сопровождался снижением STH-SOPR примерно до 0,93–0,96. Недавние покупатели капитулировали, и вскоре после этого цена достигала дна. Четыре примера — небольшая выборка, но закономерность прослеживается.
Макроэкономический фон объясняет возврат показателя к 1,00. Индекс потребительских цен, оказавшийся выше ожиданий 14 октября, повысил вероятность повышения ставки перед заседанием ФРС 28 октября, и BTC просел к $80 тыс., прежде чем восстановиться. Краткосрочные держатели не капитулировали во время этого снижения: STH-SOPR не опустился в диапазон 0,93–0,96. Это говорит в пользу устойчивого ценового дна, хотя одного снижения недостаточно для подтверждения.
Контраргумент состоит в том, что значение ровно 1,0 также может указывать на нерешительность перед падением. Если ФРС повысит ставку, а цена пробьёт октябрьский минимум около $80 тыс., краткосрочные держатели окажутся в убытке — именно это и опускало коэффициент в диапазон, отмечавший предыдущие минимумы.
Я бы следил за тем, какой из сценариев закрепится. Падение ниже 0,97 стало бы капитуляцией, которая исторически происходила вблизи дна, а удержание выше 1,0 вплоть до заседания ФРС показало бы, что покупатели не готовы продавать себе в убыток.
$BTC #BTC Анализ цены# #Мемная альфа#
68
·
--
Большинство потерь токенов в DeFi происходит не из-за сбоев протоколов. Они происходят из-за взаимодействия с токенами, с которыми изначально не стоило иметь дело. Информация, необходимая для выявления большинства небезопасных токенов, доступна публично ещё до того, как будут вложены средства.
Вот список проверок, который я выполняю перед обменом любого незнакомого токена.
Во-первых, проверьте адрес контракта в официальном источнике. Не в результатах поиска и не в публикации в соцсетях. Используйте официальный сайт, официальный Telegram-канал или официальный аккаунт в X. Любой может создать токен с таким же названием. Но адрес контракта подделать нельзя: у каждого фальшивого токена адрес отличается от адреса настоящего.
Во-вторых, проверьте метку токена в интерфейсе STONfi. STONfi помечает токены как Fake, Honeypot, Taxable, Suspicious и DMCA. Токены с метками Fake и Honeypot нельзя обменять. Если токен отображается только при ручном вводе адреса контракта, значит, на это есть причина.
В-третьих, проверьте распределение токенов между держателями. Если один кошелёк владеет 50% или более всего предложения токена, это создаёт настолько высокий риск концентрации, что никакая доходность в APR его не компенсирует.
В-четвёртых, сопоставьте глубину ликвидности с рыночной капитализацией. Токен с рыночной капитализацией $10M и ликвидностью в пуле всего $50K невозможно продать без катастрофического влияния на цену.
В-пятых, проверьте, есть ли функции выпуска новых токенов или права владельца, позволяющие увеличить предложение либо приостановить переводы после запуска.
Прежде чем подвергать риску реальные средства, проверьте свои знания о безопасности криптовалют в интерактивной игре https://stonverse.com/cybersecgame/ . В ней рассматриваются реальные векторы атак — стоит пройти её один раз до первого серьёзного вложения в DeFi.
Пять проверок. Пять минут. Большинство небезопасных токенов явно проваливают хотя бы одну из них.
$BTC #BTC Анализ цены# $SOL #Мемный альфа-сигнал#
Большинство потерь токенов в DeFi происходит не из-за сбоев протоколов. Они происходят из-за взаимодействия с токенами, с которыми изначально не стоило иметь дело. Информация, необходимая для выявления большинства небезопасных токенов, доступна публично ещё до того, как будут вложены средства.
Вот список проверок, который я выполняю перед обменом любого незнакомого токена.
Во-первых, проверьте адрес контракта в официальном источнике. Не в результатах поиска и не в публикации в соцсетях. Используйте официальный сайт, официальный Telegram-канал или официальный аккаунт в X. Любой может создать токен с таким же названием. Но адрес контракта подделать нельзя: у каждого фальшивого токена адрес отличается от адреса настоящего.
Во-вторых, проверьте метку токена в интерфейсе STONfi. STONfi помечает токены как Fake, Honeypot, Taxable, Suspicious и DMCA. Токены с метками Fake и Honeypot нельзя обменять. Если токен отображается только при ручном вводе адреса контракта, значит, на это есть причина.
В-третьих, проверьте распределение токенов между держателями. Если один кошелёк владеет 50% или более всего предложения токена, это создаёт настолько высокий риск концентрации, что никакая доходность в APR его не компенсирует.
В-четвёртых, сопоставьте глубину ликвидности с рыночной капитализацией. Токен с рыночной капитализацией $10M и ликвидностью в пуле всего $50K невозможно продать без катастрофического влияния на цену.
В-пятых, проверьте, есть ли функции выпуска новых токенов или права владельца, позволяющие увеличить предложение либо приостановить переводы после запуска.
Прежде чем подвергать риску реальные средства, проверьте свои знания о безопасности криптовалют в интерактивной игре https://stonverse.com/cybersecgame/ . В ней рассматриваются реальные векторы атак — стоит пройти её один раз до первого серьёзного вложения в DeFi.
Пять проверок. Пять минут. Большинство небезопасных токенов явно проваливают хотя бы одну из них.
$BTC #BTC Анализ цены# $SOL #Мемный альфа-сигнал#
Вот список проверок, который я выполняю перед обменом любого незнакомого токена.
Во-первых, проверьте адрес контракта в официальном источнике. Не в результатах поиска и не в публикации в соцсетях. Используйте официальный сайт, официальный Telegram-канал или официальный аккаунт в X. Любой может создать токен с таким же названием. Но адрес контракта подделать нельзя: у каждого фальшивого токена адрес отличается от адреса настоящего.
Во-вторых, проверьте метку токена в интерфейсе STONfi. STONfi помечает токены как Fake, Honeypot, Taxable, Suspicious и DMCA. Токены с метками Fake и Honeypot нельзя обменять. Если токен отображается только при ручном вводе адреса контракта, значит, на это есть причина.
В-третьих, проверьте распределение токенов между держателями. Если один кошелёк владеет 50% или более всего предложения токена, это создаёт настолько высокий риск концентрации, что никакая доходность в APR его не компенсирует.
В-четвёртых, сопоставьте глубину ликвидности с рыночной капитализацией. Токен с рыночной капитализацией $10M и ликвидностью в пуле всего $50K невозможно продать без катастрофического влияния на цену.
В-пятых, проверьте, есть ли функции выпуска новых токенов или права владельца, позволяющие увеличить предложение либо приостановить переводы после запуска.
Прежде чем подвергать риску реальные средства, проверьте свои знания о безопасности криптовалют в интерактивной игре https://stonverse.com/cybersecgame/ . В ней рассматриваются реальные векторы атак — стоит пройти её один раз до первого серьёзного вложения в DeFi.
Пять проверок. Пять минут. Большинство небезопасных токенов явно проваливают хотя бы одну из них.
$BTC #BTC Анализ цены# $SOL #Мемный альфа-сигнал#

76
·
--
Золото подешевело примерно на 2%, серебро — на 6%, биткоин — на 2–3%, эфир — на 6%. Четыре актива с четырьмя разными историями продали по одной причине.
Сентябрьская инфляция составила 3,7%, а базовая выросла за месяц на 0,3% — больше, чем ожидало почти всё множество экономистов, опрошенных Bloomberg. Вероятность повышения ставки ФРС в октябре подскочила примерно с 22% до 45–55% — в зависимости от метода оценки. Доходность 10-летних гособлигаций достигла примерно 5,3% — максимума с 2002 года, а доллар укрепился.
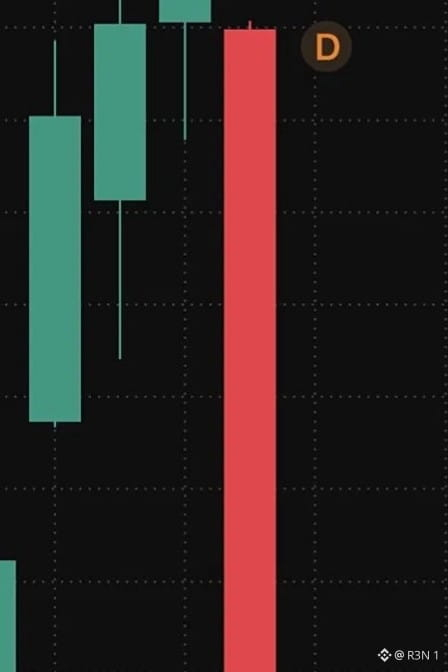
Золото не приносит дохода, поэтому рост доходности и укрепление доллара бьют по нему напрямую. Именно поэтому данные о высокой инфляции обрушили его цену: сейчас оно торгуется как актив, чувствительный к процентным ставкам, а не как защита от инфляции. Биткоин продавали по тому же сценарию, усугублённому кредитным плечом. За 24 часа ликвидировали позиции примерно на 1 млрд долларов.
Меня особенно впечатляет, что оба актива восстановились на фоне изменения одного и того же показателя. Доходность снизилась примерно до 5,1%, а вероятность повышения ставки вернулась примерно к 30% после того, как Джон Уильямс из Федерального резервного банка Нью-Йорка заявил, что дальнейшее повышение ставок после этого года, по всей видимости, не потребуется. Золото отскочило примерно до 4 158 долларов, а BTC после падения примерно к 80 000 долларам вернулся к уровню около 82 300 долларов.
Поэтому главным событием станет заседание 28 октября, а не публикация данных по ИПЦ. ФРС также примет решение до того, как увидит предпочитаемый ею показатель инфляции PCE, который выйдет вскоре после заседания.
Контраргумент состоит в том, что это был энергетический шок. Бензин подорожал на 9,1% и обеспечил более половины месячного прироста, тогда как базовая инфляция составляет 2,6% в годовом выражении. Если ФРС не будет учитывать этот фактор, то распродажа окажется чрезмерной реакцией.
Мой вывод: сейчас золото и BTC торгуются под влиянием одного показателя. Следите за доходностью 10-летних гособлигаций. Если она удержится выше 5%, оба актива, скорее всего, останутся под давлением — независимо от того, как называют причину инфляции.
$BTC #BTC Анализ цены# #Мемная альфа# $XAUt
Золото подешевело примерно на 2%, серебро — на 6%, биткоин — на 2–3%, эфир — на 6%. Четыре актива с четырьмя разными историями продали по одной причине.
Сентябрьская инфляция составила 3,7%, а базовая выросла за месяц на 0,3% — больше, чем ожидало почти всё множество экономистов, опрошенных Bloomberg. Вероятность повышения ставки ФРС в октябре подскочила примерно с 22% до 45–55% — в зависимости от метода оценки. Доходность 10-летних гособлигаций достигла примерно 5,3% — максимума с 2002 года, а доллар укрепился.
Золото не приносит дохода, поэтому рост доходности и укрепление доллара бьют по нему напрямую. Именно поэтому данные о высокой инфляции обрушили его цену: сейчас оно торгуется как актив, чувствительный к процентным ставкам, а не как защита от инфляции. Биткоин продавали по тому же сценарию, усугублённому кредитным плечом. За 24 часа ликвидировали позиции примерно на 1 млрд долларов.
Меня особенно впечатляет, что оба актива восстановились на фоне изменения одного и того же показателя. Доходность снизилась примерно до 5,1%, а вероятность повышения ставки вернулась примерно к 30% после того, как Джон Уильямс из Федерального резервного банка Нью-Йорка заявил, что дальнейшее повышение ставок после этого года, по всей видимости, не потребуется. Золото отскочило примерно до 4 158 долларов, а BTC после падения примерно к 80 000 долларам вернулся к уровню около 82 300 долларов.
Поэтому главным событием станет заседание 28 октября, а не публикация данных по ИПЦ. ФРС также примет решение до того, как увидит предпочитаемый ею показатель инфляции PCE, который выйдет вскоре после заседания.
Контраргумент состоит в том, что это был энергетический шок. Бензин подорожал на 9,1% и обеспечил более половины месячного прироста, тогда как базовая инфляция составляет 2,6% в годовом выражении. Если ФРС не будет учитывать этот фактор, то распродажа окажется чрезмерной реакцией.
Мой вывод: сейчас золото и BTC торгуются под влиянием одного показателя. Следите за доходностью 10-летних гособлигаций. Если она удержится выше 5%, оба актива, скорее всего, останутся под давлением — независимо от того, как называют причину инфляции.
$BTC #BTC Анализ цены# #Мемная альфа# $XAUt
Сентябрьская инфляция составила 3,7%, а базовая выросла за месяц на 0,3% — больше, чем ожидало почти всё множество экономистов, опрошенных Bloomberg. Вероятность повышения ставки ФРС в октябре подскочила примерно с 22% до 45–55% — в зависимости от метода оценки. Доходность 10-летних гособлигаций достигла примерно 5,3% — максимума с 2002 года, а доллар укрепился.
Золото не приносит дохода, поэтому рост доходности и укрепление доллара бьют по нему напрямую. Именно поэтому данные о высокой инфляции обрушили его цену: сейчас оно торгуется как актив, чувствительный к процентным ставкам, а не как защита от инфляции. Биткоин продавали по тому же сценарию, усугублённому кредитным плечом. За 24 часа ликвидировали позиции примерно на 1 млрд долларов.
Меня особенно впечатляет, что оба актива восстановились на фоне изменения одного и того же показателя. Доходность снизилась примерно до 5,1%, а вероятность повышения ставки вернулась примерно к 30% после того, как Джон Уильямс из Федерального резервного банка Нью-Йорка заявил, что дальнейшее повышение ставок после этого года, по всей видимости, не потребуется. Золото отскочило примерно до 4 158 долларов, а BTC после падения примерно к 80 000 долларам вернулся к уровню около 82 300 долларов.
Поэтому главным событием станет заседание 28 октября, а не публикация данных по ИПЦ. ФРС также примет решение до того, как увидит предпочитаемый ею показатель инфляции PCE, который выйдет вскоре после заседания.
Контраргумент состоит в том, что это был энергетический шок. Бензин подорожал на 9,1% и обеспечил более половины месячного прироста, тогда как базовая инфляция составляет 2,6% в годовом выражении. Если ФРС не будет учитывать этот фактор, то распродажа окажется чрезмерной реакцией.
Мой вывод: сейчас золото и BTC торгуются под влиянием одного показателя. Следите за доходностью 10-летних гособлигаций. Если она удержится выше 5%, оба актива, скорее всего, останутся под давлением — независимо от того, как называют причину инфляции.
$BTC #BTC Анализ цены# #Мемная альфа# $XAUt


29
·
--
Прибыль в $58 млн, которая пока не зафиксирована, по позиции, заметной всем уже несколько недель.
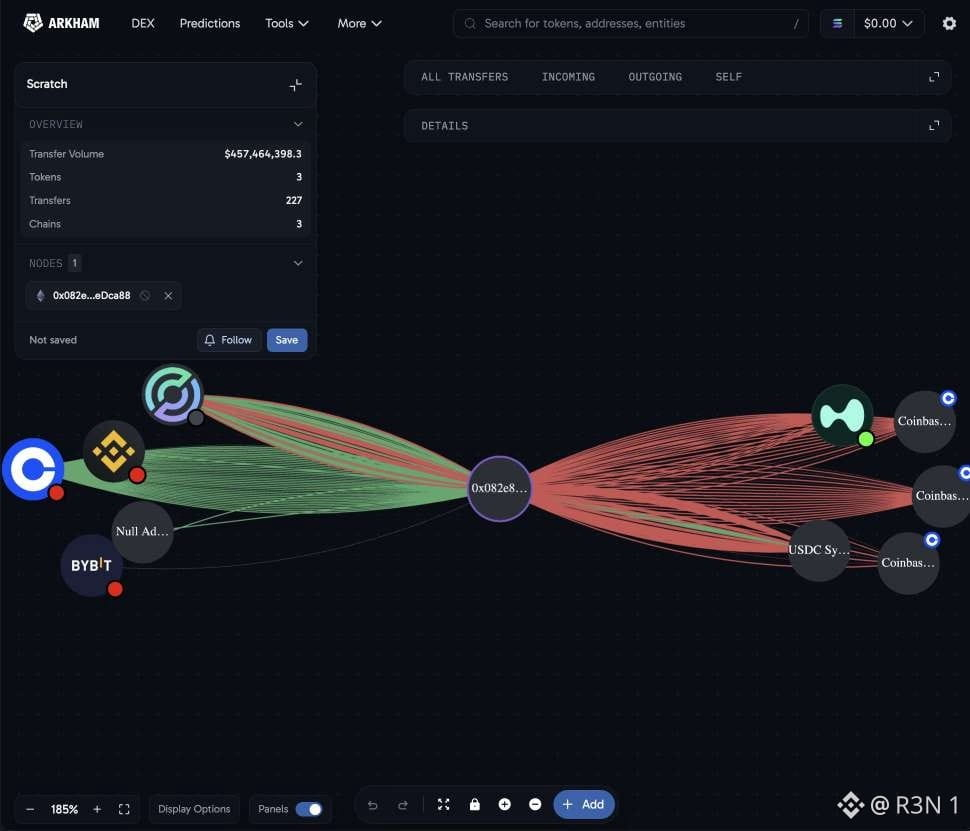
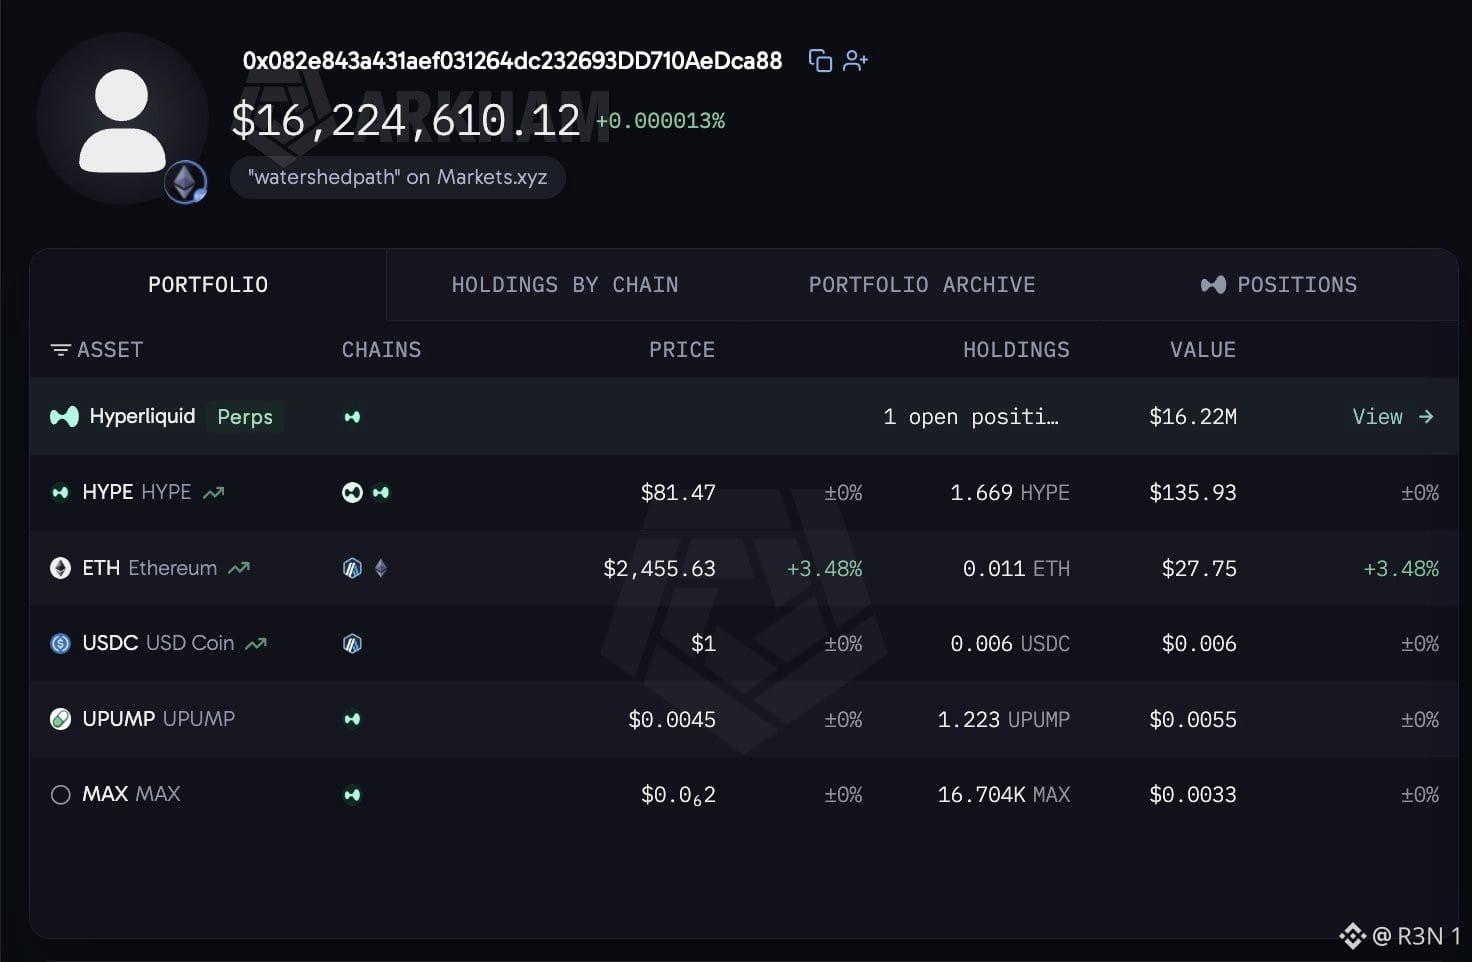
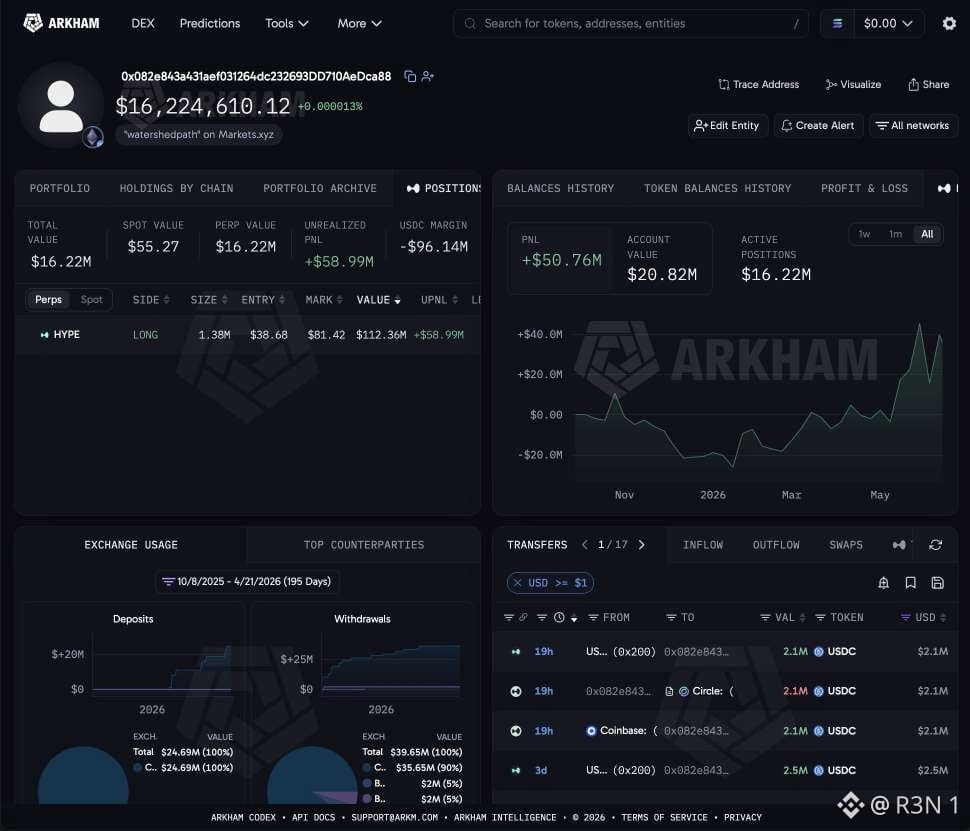
Трейдер «watershedpath» держит длинную позицию примерно на $112 млн в HYPE на Hyperliquid с плечом 5x и средней ценой входа $38,68. Сейчас HYPE стоит $81,38, так что нереализованная прибыль составляет около $58 млн, а, по сообщениям, совокупная прибыль аккаунта за всё время превышает $50 млн. Два издания указали размер позиции как $11,2 млн, но расчёты сходятся только при $112 млн: примерно 1,38 млн HYPE, умноженные на прирост в $42,70.
Больше всего меня впечатляет то, как трейдер удерживает позицию. В отчёте четырёхнедельной давности были указаны та же цена входа и экспозиция около $120 млн, когда HYPE стоил примерно $88. По моим расчётам, количество токенов примерно такое же — значит, он переждал откат, который сократил нереализованную прибыль примерно на $9 млн, и до сих пор ничего не закрыл.
Риск — в цифрах. Каждое движение HYPE на 10% означает примерно $11 млн прибыли или убытка по этой позиции, а вся прибыль существует, только пока цена выше $38,68. В отчётах не указано, используется кросс-маржа или изолированная, поэтому извне определить цену ликвидации невозможно.
Стоит с осторожностью относиться к копированию подобных заголовков. Мы видим один кошелёк, но не весь портфель за ним. Запас токенов на спотовом рынке или компенсирующая позиция на другой площадке здесь не отобразятся, а публично известный победитель — это тот, кто выжил, а не сигнал к действию. На мой взгляд, заметный размер позиции также может стать мишенью, когда ликвидность падает.
Открытый вопрос — продолжает ли он наращивать позицию или просто удерживает её. Я бы следил за любым изменением размера: если такой крупный трейдер начнёт сокращать позицию на росте, это скажет больше, чем нереализованная прибыль.
Отслеживать кошелёк: https://arkm.com/explorer/address/0x082e843a431aef031264dc232693DD710AeDca88
#Анализ цены BTC# $BTC #Альфа мемов# $HYPE
Прибыль в $58 млн, которая пока не зафиксирована, по позиции, заметной всем уже несколько недель.
Трейдер «watershedpath» держит длинную позицию примерно на $112 млн в HYPE на Hyperliquid с плечом 5x и средней ценой входа $38,68. Сейчас HYPE стоит $81,38, так что нереализованная прибыль составляет около $58 млн, а, по сообщениям, совокупная прибыль аккаунта за всё время превышает $50 млн. Два издания указали размер позиции как $11,2 млн, но расчёты сходятся только при $112 млн: примерно 1,38 млн HYPE, умноженные на прирост в $42,70.
Больше всего меня впечатляет то, как трейдер удерживает позицию. В отчёте четырёхнедельной давности были указаны та же цена входа и экспозиция около $120 млн, когда HYPE стоил примерно $88. По моим расчётам, количество токенов примерно такое же — значит, он переждал откат, который сократил нереализованную прибыль примерно на $9 млн, и до сих пор ничего не закрыл.
Риск — в цифрах. Каждое движение HYPE на 10% означает примерно $11 млн прибыли или убытка по этой позиции, а вся прибыль существует, только пока цена выше $38,68. В отчётах не указано, используется кросс-маржа или изолированная, поэтому извне определить цену ликвидации невозможно.
Стоит с осторожностью относиться к копированию подобных заголовков. Мы видим один кошелёк, но не весь портфель за ним. Запас токенов на спотовом рынке или компенсирующая позиция на другой площадке здесь не отобразятся, а публично известный победитель — это тот, кто выжил, а не сигнал к действию. На мой взгляд, заметный размер позиции также может стать мишенью, когда ликвидность падает.
Открытый вопрос — продолжает ли он наращивать позицию или просто удерживает её. Я бы следил за любым изменением размера: если такой крупный трейдер начнёт сокращать позицию на росте, это скажет больше, чем нереализованная прибыль.
Отслеживать кошелёк: https://arkm.com/explorer/address/0x082e843a431aef031264dc232693DD710AeDca88
#Анализ цены BTC# $BTC #Альфа мемов# $HYPE
Трейдер «watershedpath» держит длинную позицию примерно на $112 млн в HYPE на Hyperliquid с плечом 5x и средней ценой входа $38,68. Сейчас HYPE стоит $81,38, так что нереализованная прибыль составляет около $58 млн, а, по сообщениям, совокупная прибыль аккаунта за всё время превышает $50 млн. Два издания указали размер позиции как $11,2 млн, но расчёты сходятся только при $112 млн: примерно 1,38 млн HYPE, умноженные на прирост в $42,70.
Больше всего меня впечатляет то, как трейдер удерживает позицию. В отчёте четырёхнедельной давности были указаны та же цена входа и экспозиция около $120 млн, когда HYPE стоил примерно $88. По моим расчётам, количество токенов примерно такое же — значит, он переждал откат, который сократил нереализованную прибыль примерно на $9 млн, и до сих пор ничего не закрыл.
Риск — в цифрах. Каждое движение HYPE на 10% означает примерно $11 млн прибыли или убытка по этой позиции, а вся прибыль существует, только пока цена выше $38,68. В отчётах не указано, используется кросс-маржа или изолированная, поэтому извне определить цену ликвидации невозможно.
Стоит с осторожностью относиться к копированию подобных заголовков. Мы видим один кошелёк, но не весь портфель за ним. Запас токенов на спотовом рынке или компенсирующая позиция на другой площадке здесь не отобразятся, а публично известный победитель — это тот, кто выжил, а не сигнал к действию. На мой взгляд, заметный размер позиции также может стать мишенью, когда ликвидность падает.
Открытый вопрос — продолжает ли он наращивать позицию или просто удерживает её. Я бы следил за любым изменением размера: если такой крупный трейдер начнёт сокращать позицию на росте, это скажет больше, чем нереализованная прибыль.
Отслеживать кошелёк: https://arkm.com/explorer/address/0x082e843a431aef031264dc232693DD710AeDca88
#Анализ цены BTC# $BTC #Альфа мемов# $HYPE
45
·
--
У крупных держателей нет инсайдерской информации. У них просто другой временной горизонт, и данные показывают, что он становится всё длиннее.
15 октября Santiment насчитал 20 338 кошельков с балансом от 10 до 10 000 BTC — это рекордный показатель. С середины июля их число растёт, а согласно одному из отчётов, с 15 июля чистый прирост в этой группе составил около 113 950 BTC — по моим подсчётам, примерно $9 млрд. За последний период, примерно за три недели, к ним прибавилось более 85 000 монет, пока BTC снижался с уровня около $87 тыс. до $80 тыс.
Вот что интересно: они покупали на падении, а не на пробое вверх. Santiment считает, что рост этой группы на фоне нестабильных торгов говорит о том, что инвесторы с крупным капиталом не выходят из рынка.
Но есть и ограничения: громкий заголовок преувеличивает, о чём может рассказать число кошельков. Считаются адреса, а не люди, и один владелец может распределить монеты по нескольким адресам. Нижний порог в 10 BTC — это всего около $800 тыс., так что группа довольно широкая. Рост числа адресов может также отражать реорганизацию активов самими держателями, а не приток новых денег.
История показывает и обратную сторону. По данным Santiment, такие темпы наблюдались лишь дважды за последний год, а в одном отчёте отмечается, что однажды схожая картина предшествовала падению на 34%. Мне не удалось найти подробности того эпизода, поэтому воспринимайте это как предупреждение, а не как закономерность.
Пока динамика рынка этого не подтверждает. BTC стоит около $82 тыс. после падения ниже $80 тыс. в четверг — примерно на 35% ниже прошлогоднего октябрьского максимума. Ставки финансирования на Binance стали отрицательными, а ETF зафиксировали отток средств в октябре.
Так знают ли киты что-то, чего не знаете вы? Не в отношении направления рынка. Они демонстрируют уверенность — а это не одно и то же. Я бы следил за тем, продолжит ли расти число кошельков, если BTC опустится ниже $80 400. Накопление, которое продолжается после пробоя поддержки, — более сильный сигнал, чем покупки на просадке.
$BTC #Bitcoin Прогноз цены: каким будет следующий шаг Bitcoin?
У крупных держателей нет инсайдерской информации. У них просто другой временной горизонт, и данные показывают, что он становится всё длиннее.
15 октября Santiment насчитал 20 338 кошельков с балансом от 10 до 10 000 BTC — это рекордный показатель. С середины июля их число растёт, а согласно одному из отчётов, с 15 июля чистый прирост в этой группе составил около 113 950 BTC — по моим подсчётам, примерно $9 млрд. За последний период, примерно за три недели, к ним прибавилось более 85 000 монет, пока BTC снижался с уровня около $87 тыс. до $80 тыс.
Вот что интересно: они покупали на падении, а не на пробое вверх. Santiment считает, что рост этой группы на фоне нестабильных торгов говорит о том, что инвесторы с крупным капиталом не выходят из рынка.
Но есть и ограничения: громкий заголовок преувеличивает, о чём может рассказать число кошельков. Считаются адреса, а не люди, и один владелец может распределить монеты по нескольким адресам. Нижний порог в 10 BTC — это всего около $800 тыс., так что группа довольно широкая. Рост числа адресов может также отражать реорганизацию активов самими держателями, а не приток новых денег.
История показывает и обратную сторону. По данным Santiment, такие темпы наблюдались лишь дважды за последний год, а в одном отчёте отмечается, что однажды схожая картина предшествовала падению на 34%. Мне не удалось найти подробности того эпизода, поэтому воспринимайте это как предупреждение, а не как закономерность.
Пока динамика рынка этого не подтверждает. BTC стоит около $82 тыс. после падения ниже $80 тыс. в четверг — примерно на 35% ниже прошлогоднего октябрьского максимума. Ставки финансирования на Binance стали отрицательными, а ETF зафиксировали отток средств в октябре.
Так знают ли киты что-то, чего не знаете вы? Не в отношении направления рынка. Они демонстрируют уверенность — а это не одно и то же. Я бы следил за тем, продолжит ли расти число кошельков, если BTC опустится ниже $80 400. Накопление, которое продолжается после пробоя поддержки, — более сильный сигнал, чем покупки на просадке.
$BTC #Bitcoin Прогноз цены: каким будет следующий шаг Bitcoin?
15 октября Santiment насчитал 20 338 кошельков с балансом от 10 до 10 000 BTC — это рекордный показатель. С середины июля их число растёт, а согласно одному из отчётов, с 15 июля чистый прирост в этой группе составил около 113 950 BTC — по моим подсчётам, примерно $9 млрд. За последний период, примерно за три недели, к ним прибавилось более 85 000 монет, пока BTC снижался с уровня около $87 тыс. до $80 тыс.
Вот что интересно: они покупали на падении, а не на пробое вверх. Santiment считает, что рост этой группы на фоне нестабильных торгов говорит о том, что инвесторы с крупным капиталом не выходят из рынка.
Но есть и ограничения: громкий заголовок преувеличивает, о чём может рассказать число кошельков. Считаются адреса, а не люди, и один владелец может распределить монеты по нескольким адресам. Нижний порог в 10 BTC — это всего около $800 тыс., так что группа довольно широкая. Рост числа адресов может также отражать реорганизацию активов самими держателями, а не приток новых денег.
История показывает и обратную сторону. По данным Santiment, такие темпы наблюдались лишь дважды за последний год, а в одном отчёте отмечается, что однажды схожая картина предшествовала падению на 34%. Мне не удалось найти подробности того эпизода, поэтому воспринимайте это как предупреждение, а не как закономерность.
Пока динамика рынка этого не подтверждает. BTC стоит около $82 тыс. после падения ниже $80 тыс. в четверг — примерно на 35% ниже прошлогоднего октябрьского максимума. Ставки финансирования на Binance стали отрицательными, а ETF зафиксировали отток средств в октябре.
Так знают ли киты что-то, чего не знаете вы? Не в отношении направления рынка. Они демонстрируют уверенность — а это не одно и то же. Я бы следил за тем, продолжит ли расти число кошельков, если BTC опустится ниже $80 400. Накопление, которое продолжается после пробоя поддержки, — более сильный сигнал, чем покупки на просадке.
$BTC #Bitcoin Прогноз цены: каким будет следующий шаг Bitcoin?

58
·
--
Данные RWA.xyz показали, что в сентябре 2025 года весь рынок токенизированных активов Solana превысил $500 млн. Сегодня только на Ondo в этой сети приходится больше.
По состоянию на 15 октября стоимость распределённых активов Ondo в Solana составляет $508,1 млн и охватывает 454 актива — рост примерно на 46% за 30 дней. Во всех сетях Ondo располагает активами на $3,96 млрд, что за тот же период означает рост всего на 9,7%. Solana растёт почти в пять раз быстрее платформы в целом, её доля приближается к 13%, и среди сетей Ondo она занимает третье место. На Ethereum по-прежнему сосредоточена основная часть активов — примерно половина общей стоимости Ondo по последним подсчётам.
Важен и состав активов. Портфель Solana сочетает токенизированные акции с продуктами, обеспеченными казначейскими облигациями, такими как USDY. Когда rwa.xyz запустила панель отслеживания акций, на Solana приходилось около 95% объёма торговли акциями в блокчейне. Это говорит о том, что привлекательность сети связана не только с объёмом хранящихся в ней активов, но и с торговой активностью. Ежемесячный объём переводов на всей платформе Ondo составляет около $2,5 млрд, увеличившись примерно на 48%. Это указывает на то, что токены перемещаются, а не просто лежат без движения после выпуска.
Здесь я бы сохранял осторожность: стоимость распределённых активов — это количество токенов, умноженное на их цену, поэтому рост стоимости базовых акций повышает этот показатель даже без единого нового покупателя. Рост на 46% за месяц складывается как из реальных притоков, так и из рыночных колебаний, а эти данные не позволяют разделить их.
Больше всего обращает на себя внимание направление движения. Ликвидность Ondo выходит за пределы одной сети, и Solana получает самую большую долю этого притока.
Что отслеживать дальше: продолжит ли доля Solana в общем объёме Ondo расти выше 13% и сохранится ли объём переводов, если цены на акции пойдут вниз.
$ONDO #АнализЦеныBTC# #СезонАльткоинов# $SOL
Данные RWA.xyz показали, что в сентябре 2025 года весь рынок токенизированных активов Solana превысил $500 млн. Сегодня только на Ondo в этой сети приходится больше.
По состоянию на 15 октября стоимость распределённых активов Ondo в Solana составляет $508,1 млн и охватывает 454 актива — рост примерно на 46% за 30 дней. Во всех сетях Ondo располагает активами на $3,96 млрд, что за тот же период означает рост всего на 9,7%. Solana растёт почти в пять раз быстрее платформы в целом, её доля приближается к 13%, и среди сетей Ondo она занимает третье место. На Ethereum по-прежнему сосредоточена основная часть активов — примерно половина общей стоимости Ondo по последним подсчётам.
Важен и состав активов. Портфель Solana сочетает токенизированные акции с продуктами, обеспеченными казначейскими облигациями, такими как USDY. Когда rwa.xyz запустила панель отслеживания акций, на Solana приходилось около 95% объёма торговли акциями в блокчейне. Это говорит о том, что привлекательность сети связана не только с объёмом хранящихся в ней активов, но и с торговой активностью. Ежемесячный объём переводов на всей платформе Ondo составляет около $2,5 млрд, увеличившись примерно на 48%. Это указывает на то, что токены перемещаются, а не просто лежат без движения после выпуска.
Здесь я бы сохранял осторожность: стоимость распределённых активов — это количество токенов, умноженное на их цену, поэтому рост стоимости базовых акций повышает этот показатель даже без единого нового покупателя. Рост на 46% за месяц складывается как из реальных притоков, так и из рыночных колебаний, а эти данные не позволяют разделить их.
Больше всего обращает на себя внимание направление движения. Ликвидность Ondo выходит за пределы одной сети, и Solana получает самую большую долю этого притока.
Что отслеживать дальше: продолжит ли доля Solana в общем объёме Ondo расти выше 13% и сохранится ли объём переводов, если цены на акции пойдут вниз.
$ONDO #АнализЦеныBTC# #СезонАльткоинов# $SOL
По состоянию на 15 октября стоимость распределённых активов Ondo в Solana составляет $508,1 млн и охватывает 454 актива — рост примерно на 46% за 30 дней. Во всех сетях Ondo располагает активами на $3,96 млрд, что за тот же период означает рост всего на 9,7%. Solana растёт почти в пять раз быстрее платформы в целом, её доля приближается к 13%, и среди сетей Ondo она занимает третье место. На Ethereum по-прежнему сосредоточена основная часть активов — примерно половина общей стоимости Ondo по последним подсчётам.
Важен и состав активов. Портфель Solana сочетает токенизированные акции с продуктами, обеспеченными казначейскими облигациями, такими как USDY. Когда rwa.xyz запустила панель отслеживания акций, на Solana приходилось около 95% объёма торговли акциями в блокчейне. Это говорит о том, что привлекательность сети связана не только с объёмом хранящихся в ней активов, но и с торговой активностью. Ежемесячный объём переводов на всей платформе Ondo составляет около $2,5 млрд, увеличившись примерно на 48%. Это указывает на то, что токены перемещаются, а не просто лежат без движения после выпуска.
Здесь я бы сохранял осторожность: стоимость распределённых активов — это количество токенов, умноженное на их цену, поэтому рост стоимости базовых акций повышает этот показатель даже без единого нового покупателя. Рост на 46% за месяц складывается как из реальных притоков, так и из рыночных колебаний, а эти данные не позволяют разделить их.
Больше всего обращает на себя внимание направление движения. Ликвидность Ondo выходит за пределы одной сети, и Solana получает самую большую долю этого притока.
Что отслеживать дальше: продолжит ли доля Solana в общем объёме Ondo расти выше 13% и сохранится ли объём переводов, если цены на акции пойдут вниз.
$ONDO #АнализЦеныBTC# #СезонАльткоинов# $SOL


65
·
--
USDT в сети TON и USDT в сети Base — это один и тот же стейблкоин, выпущенный в двух отдельных блокчейнах. Обычный перевод с кошелька на кошелёк не позволяет перевести его из одной сети в другую. Для этого нужен кроссчейн-свап.
Вот полный процесс на STONfi
Шаг первый. Откройте https://app.ston.fi и подключите кошелёк TON через TON Connect. Для получения USDT в сети Base также понадобится MetaMask или совместимый EVM-кошелёк. В сети Base для оплаты газа используется ETH — если планируете использовать полученные USDT для дальнейших операций, перед началом подготовьте небольшое количество ETH в сети Base.
Шаг второй. В интерфейсе переключитесь в режим кроссчейн-свапа. Выберите TON в качестве исходной сети, а Base — в качестве целевой.
Шаг третий. Выберите USDT в качестве исходного актива в сети TON, а USDT или USDC — в качестве целевого актива в сети Base. Введите сумму.
Шаг четвёртый. Внимательно проверьте котировку. Убедитесь, что верны сумма к получению, общая комиссия, подписи сетей TON и Base с обеих сторон, а также адрес целевого кошелька. Комиссии за газ в сети Base низкие — это одно из самых выгодных направлений в EVM-сетях для перевода стейблкоинов из TON.
Шаг пятый. Подтвердите транзакцию. Omniston координирует выполнение кроссчейн-свапа. Ваши USDT либо поступят в сеть Base согласно котировке, либо исходные USDT в TON автоматически вернутся благодаря таймлоку. Большинство свапов завершается за 15–40 секунд.
Полное наглядное руководство со скриншотами каждого шага доступно по ссылке https://ston.fi/how-to-send-usdt-from-ton-to-base
Текущий лимит транзакции — 1 000 $ за один свап.
#АнализЦеныBTC# $BTC $ETH #СезонАльткоинов#
USDT в сети TON и USDT в сети Base — это один и тот же стейблкоин, выпущенный в двух отдельных блокчейнах. Обычный перевод с кошелька на кошелёк не позволяет перевести его из одной сети в другую. Для этого нужен кроссчейн-свап.
Вот полный процесс на STONfi
Шаг первый. Откройте https://app.ston.fi и подключите кошелёк TON через TON Connect. Для получения USDT в сети Base также понадобится MetaMask или совместимый EVM-кошелёк. В сети Base для оплаты газа используется ETH — если планируете использовать полученные USDT для дальнейших операций, перед началом подготовьте небольшое количество ETH в сети Base.
Шаг второй. В интерфейсе переключитесь в режим кроссчейн-свапа. Выберите TON в качестве исходной сети, а Base — в качестве целевой.
Шаг третий. Выберите USDT в качестве исходного актива в сети TON, а USDT или USDC — в качестве целевого актива в сети Base. Введите сумму.
Шаг четвёртый. Внимательно проверьте котировку. Убедитесь, что верны сумма к получению, общая комиссия, подписи сетей TON и Base с обеих сторон, а также адрес целевого кошелька. Комиссии за газ в сети Base низкие — это одно из самых выгодных направлений в EVM-сетях для перевода стейблкоинов из TON.
Шаг пятый. Подтвердите транзакцию. Omniston координирует выполнение кроссчейн-свапа. Ваши USDT либо поступят в сеть Base согласно котировке, либо исходные USDT в TON автоматически вернутся благодаря таймлоку. Большинство свапов завершается за 15–40 секунд.
Полное наглядное руководство со скриншотами каждого шага доступно по ссылке https://ston.fi/how-to-send-usdt-from-ton-to-base
Текущий лимит транзакции — 1 000 $ за один свап.
#АнализЦеныBTC# $BTC $ETH #СезонАльткоинов#
Вот полный процесс на STONfi
Шаг первый. Откройте https://app.ston.fi и подключите кошелёк TON через TON Connect. Для получения USDT в сети Base также понадобится MetaMask или совместимый EVM-кошелёк. В сети Base для оплаты газа используется ETH — если планируете использовать полученные USDT для дальнейших операций, перед началом подготовьте небольшое количество ETH в сети Base.
Шаг второй. В интерфейсе переключитесь в режим кроссчейн-свапа. Выберите TON в качестве исходной сети, а Base — в качестве целевой.
Шаг третий. Выберите USDT в качестве исходного актива в сети TON, а USDT или USDC — в качестве целевого актива в сети Base. Введите сумму.
Шаг четвёртый. Внимательно проверьте котировку. Убедитесь, что верны сумма к получению, общая комиссия, подписи сетей TON и Base с обеих сторон, а также адрес целевого кошелька. Комиссии за газ в сети Base низкие — это одно из самых выгодных направлений в EVM-сетях для перевода стейблкоинов из TON.
Шаг пятый. Подтвердите транзакцию. Omniston координирует выполнение кроссчейн-свапа. Ваши USDT либо поступят в сеть Base согласно котировке, либо исходные USDT в TON автоматически вернутся благодаря таймлоку. Большинство свапов завершается за 15–40 секунд.
Полное наглядное руководство со скриншотами каждого шага доступно по ссылке https://ston.fi/how-to-send-usdt-from-ton-to-base
Текущий лимит транзакции — 1 000 $ за один свап.
#АнализЦеныBTC# $BTC $ETH #СезонАльткоинов#

35
·
--
USDT в TON и USDT в Base — это один и тот же стейблкоин, выпущенный в двух отдельных блокчейнах. Обычный перевод с кошелька на кошелёк не позволяет перевести один в другой. Для этого нужен кроссчейн-свап.
Вот полная инструкция по обмену на STONfi.
Шаг первый. Откройте https://app.ston.fi и подключите кошелёк TON через TON Connect. Для получения USDT в сети Base также понадобится MetaMask или совместимый EVM-кошелёк. В Base для оплаты газа используется ETH. Если планируете использовать полученные USDT для дальнейших операций, перед началом убедитесь, что у вас есть небольшое количество ETH в Base.
Шаг второй. Переключите интерфейс в режим кроссчейн-обмена. Выберите TON в качестве исходной сети, а Base — в качестве целевой.
Шаг третий. Выберите USDT в качестве исходного актива в TON, а USDT или USDC — в качестве целевого актива в Base. Укажите сумму.
Шаг четвёртый. Внимательно проверьте условия обмена. Убедитесь, что верны сумма к получению, общая комиссия, названия сетей TON и Base с обеих сторон, а также адрес целевого кошелька. Комиссии за газ в Base низкие, поэтому это одно из самых выгодных EVM-направлений для перевода стейблкоинов из TON.
Шаг пятый. Подтвердите транзакцию. Omniston координирует выполнение кроссчейн-обмена. Ваши USDT либо поступят в Base согласно указанным условиям, либо исходные USDT в TON автоматически вернутся благодаря таймлоку. Большинство обменов завершается за 15–40 секунд.
Полную наглядную инструкцию со скриншотами каждого шага можно найти здесь: https://ston.fi/how-to-send-usdt-from-ton-to-base и https://ston.fi/cross-chain-swap-from-ton-to-base.
Текущий лимит транзакции — 1 000 $ за один обмен.
Попробовать обмен → https://app.ston.fi/swap?mode=cross-chain
#Анализ цены BTC# $BTC #Мем-альфа# $SOL
USDT в TON и USDT в Base — это один и тот же стейблкоин, выпущенный в двух отдельных блокчейнах. Обычный перевод с кошелька на кошелёк не позволяет перевести один в другой. Для этого нужен кроссчейн-свап.
Вот полная инструкция по обмену на STONfi.
Шаг первый. Откройте https://app.ston.fi и подключите кошелёк TON через TON Connect. Для получения USDT в сети Base также понадобится MetaMask или совместимый EVM-кошелёк. В Base для оплаты газа используется ETH. Если планируете использовать полученные USDT для дальнейших операций, перед началом убедитесь, что у вас есть небольшое количество ETH в Base.
Шаг второй. Переключите интерфейс в режим кроссчейн-обмена. Выберите TON в качестве исходной сети, а Base — в качестве целевой.
Шаг третий. Выберите USDT в качестве исходного актива в TON, а USDT или USDC — в качестве целевого актива в Base. Укажите сумму.
Шаг четвёртый. Внимательно проверьте условия обмена. Убедитесь, что верны сумма к получению, общая комиссия, названия сетей TON и Base с обеих сторон, а также адрес целевого кошелька. Комиссии за газ в Base низкие, поэтому это одно из самых выгодных EVM-направлений для перевода стейблкоинов из TON.
Шаг пятый. Подтвердите транзакцию. Omniston координирует выполнение кроссчейн-обмена. Ваши USDT либо поступят в Base согласно указанным условиям, либо исходные USDT в TON автоматически вернутся благодаря таймлоку. Большинство обменов завершается за 15–40 секунд.
Полную наглядную инструкцию со скриншотами каждого шага можно найти здесь: https://ston.fi/how-to-send-usdt-from-ton-to-base и https://ston.fi/cross-chain-swap-from-ton-to-base.
Текущий лимит транзакции — 1 000 $ за один обмен.
Попробовать обмен → https://app.ston.fi/swap?mode=cross-chain
#Анализ цены BTC# $BTC #Мем-альфа# $SOL
Вот полная инструкция по обмену на STONfi.
Шаг первый. Откройте https://app.ston.fi и подключите кошелёк TON через TON Connect. Для получения USDT в сети Base также понадобится MetaMask или совместимый EVM-кошелёк. В Base для оплаты газа используется ETH. Если планируете использовать полученные USDT для дальнейших операций, перед началом убедитесь, что у вас есть небольшое количество ETH в Base.
Шаг второй. Переключите интерфейс в режим кроссчейн-обмена. Выберите TON в качестве исходной сети, а Base — в качестве целевой.
Шаг третий. Выберите USDT в качестве исходного актива в TON, а USDT или USDC — в качестве целевого актива в Base. Укажите сумму.
Шаг четвёртый. Внимательно проверьте условия обмена. Убедитесь, что верны сумма к получению, общая комиссия, названия сетей TON и Base с обеих сторон, а также адрес целевого кошелька. Комиссии за газ в Base низкие, поэтому это одно из самых выгодных EVM-направлений для перевода стейблкоинов из TON.
Шаг пятый. Подтвердите транзакцию. Omniston координирует выполнение кроссчейн-обмена. Ваши USDT либо поступят в Base согласно указанным условиям, либо исходные USDT в TON автоматически вернутся благодаря таймлоку. Большинство обменов завершается за 15–40 секунд.
Полную наглядную инструкцию со скриншотами каждого шага можно найти здесь: https://ston.fi/how-to-send-usdt-from-ton-to-base и https://ston.fi/cross-chain-swap-from-ton-to-base.
Текущий лимит транзакции — 1 000 $ за один обмен.
Попробовать обмен → https://app.ston.fi/swap?mode=cross-chain
#Анализ цены BTC# $BTC #Мем-альфа# $SOL

57
·
--
Предложение — это AWS, а не Goldman. 15 октября Джефф Ян рассказал Bloomberg в программе Odd Lots, что Hyperliquid хочет предоставлять торговые технологии финансовым организациям, а не заменять компании с Уолл-стрит.
В основе этой модели — разделение ответственности в регулировании. Ян утверждает, что за соблюдение требований должны отвечать компании, которые управляют рынками на базе Hyperliquid и контролируют их, а не сам блокчейн, — примерно так же, как ответственность лежит на финансовых компаниях, использующих интернет-инфраструктуру. На мой взгляд, это соответствует рынкам в стиле HIP-3, которые разворачивают сторонние разработчики и где оператор сам выбирает устройство рынка.
Уже есть пример для проверки этой модели на практике. Перпетуальные фьючерсы Hyperliquid по-прежнему недоступны пользователям из США, но материнская компания Kraken, Payward, планирует предложить американским инвесторам деривативы на базе технологий Hyperliquid через регулируемую биржу. Именно такую модель и описывает Ян: впереди стоит лицензированный оператор.
Стоит прямо сказать, что это такое: позиция, продвигаемая в интересах компании. Bloomberg отметил, что такое разделение позволит Hyperliquid расширяться в сторону Уолл-стрит без всего бремени соблюдения требований, которое несёт традиционная биржа. Регуляторы США всё ещё ищут способ включить офшорные площадки в национальную нормативную систему, и ни один из них пока не поддержал это разделение.
Меня больше всего занимает вопрос о токене. Если институциональные игроки будут строить проекты на Hyperliquid, кому достанется созданная ценность — HYPE или операторам? Данные за август показали, что создатели рынков HIP-3 оставляют себе половину комиссий, полученных на этих рынках, причём на одного создателя пришлось почти весь этот объём. Инфраструктура — прибыльный бизнес, только если плата за её использование достаётся самой инфраструктуре.
У аналогии с AWS тоже есть пределы. В некоторых юрисдикциях регуляторы уже считают крупных облачных провайдеров критически важными третьими сторонами для финансового сектора, поэтому «просто инфраструктура» не обязательно означает «вне регулирования».
Я бы следил за тем, запустится ли продукт Payward на самом деле и даст ли какой-нибудь регулятор понять, что принимает подход, при котором регулируется оператор, а не блокчейн.
$XRP #BTC Анализ цены# #Сезон альткоинов# $HYPE
Предложение — это AWS, а не Goldman. 15 октября Джефф Ян рассказал Bloomberg в программе Odd Lots, что Hyperliquid хочет предоставлять торговые технологии финансовым организациям, а не заменять компании с Уолл-стрит.
В основе этой модели — разделение ответственности в регулировании. Ян утверждает, что за соблюдение требований должны отвечать компании, которые управляют рынками на базе Hyperliquid и контролируют их, а не сам блокчейн, — примерно так же, как ответственность лежит на финансовых компаниях, использующих интернет-инфраструктуру. На мой взгляд, это соответствует рынкам в стиле HIP-3, которые разворачивают сторонние разработчики и где оператор сам выбирает устройство рынка.
Уже есть пример для проверки этой модели на практике. Перпетуальные фьючерсы Hyperliquid по-прежнему недоступны пользователям из США, но материнская компания Kraken, Payward, планирует предложить американским инвесторам деривативы на базе технологий Hyperliquid через регулируемую биржу. Именно такую модель и описывает Ян: впереди стоит лицензированный оператор.
Стоит прямо сказать, что это такое: позиция, продвигаемая в интересах компании. Bloomberg отметил, что такое разделение позволит Hyperliquid расширяться в сторону Уолл-стрит без всего бремени соблюдения требований, которое несёт традиционная биржа. Регуляторы США всё ещё ищут способ включить офшорные площадки в национальную нормативную систему, и ни один из них пока не поддержал это разделение.
Меня больше всего занимает вопрос о токене. Если институциональные игроки будут строить проекты на Hyperliquid, кому достанется созданная ценность — HYPE или операторам? Данные за август показали, что создатели рынков HIP-3 оставляют себе половину комиссий, полученных на этих рынках, причём на одного создателя пришлось почти весь этот объём. Инфраструктура — прибыльный бизнес, только если плата за её использование достаётся самой инфраструктуре.
У аналогии с AWS тоже есть пределы. В некоторых юрисдикциях регуляторы уже считают крупных облачных провайдеров критически важными третьими сторонами для финансового сектора, поэтому «просто инфраструктура» не обязательно означает «вне регулирования».
Я бы следил за тем, запустится ли продукт Payward на самом деле и даст ли какой-нибудь регулятор понять, что принимает подход, при котором регулируется оператор, а не блокчейн.
$XRP #BTC Анализ цены# #Сезон альткоинов# $HYPE
В основе этой модели — разделение ответственности в регулировании. Ян утверждает, что за соблюдение требований должны отвечать компании, которые управляют рынками на базе Hyperliquid и контролируют их, а не сам блокчейн, — примерно так же, как ответственность лежит на финансовых компаниях, использующих интернет-инфраструктуру. На мой взгляд, это соответствует рынкам в стиле HIP-3, которые разворачивают сторонние разработчики и где оператор сам выбирает устройство рынка.
Уже есть пример для проверки этой модели на практике. Перпетуальные фьючерсы Hyperliquid по-прежнему недоступны пользователям из США, но материнская компания Kraken, Payward, планирует предложить американским инвесторам деривативы на базе технологий Hyperliquid через регулируемую биржу. Именно такую модель и описывает Ян: впереди стоит лицензированный оператор.
Стоит прямо сказать, что это такое: позиция, продвигаемая в интересах компании. Bloomberg отметил, что такое разделение позволит Hyperliquid расширяться в сторону Уолл-стрит без всего бремени соблюдения требований, которое несёт традиционная биржа. Регуляторы США всё ещё ищут способ включить офшорные площадки в национальную нормативную систему, и ни один из них пока не поддержал это разделение.
Меня больше всего занимает вопрос о токене. Если институциональные игроки будут строить проекты на Hyperliquid, кому достанется созданная ценность — HYPE или операторам? Данные за август показали, что создатели рынков HIP-3 оставляют себе половину комиссий, полученных на этих рынках, причём на одного создателя пришлось почти весь этот объём. Инфраструктура — прибыльный бизнес, только если плата за её использование достаётся самой инфраструктуре.
У аналогии с AWS тоже есть пределы. В некоторых юрисдикциях регуляторы уже считают крупных облачных провайдеров критически важными третьими сторонами для финансового сектора, поэтому «просто инфраструктура» не обязательно означает «вне регулирования».
Я бы следил за тем, запустится ли продукт Payward на самом деле и даст ли какой-нибудь регулятор понять, что принимает подход, при котором регулируется оператор, а не блокчейн.
$XRP #BTC Анализ цены# #Сезон альткоинов# $HYPE


76
·
--
Большинство людей приходят в криптовалюту через централизованную биржу. Они создают аккаунт, проходят проверку личности, вносят средства и торгуют через биржевой стакан. Биржа хранит их активы. Она может заморозить аккаунт или стать неплатёжеспособной, пока средства находятся на её счету.
Децентрализованная биржа устроена иначе на каждом уровне.
DEX — это набор смарт-контрактов, работающих на блокчейне. Ни одна компания не управляет им. Не нужно создавать аккаунт. Не требуется проверка личности. Никакая платформа не хранит ваши активы от вашего имени. Вы подключаете контролируемый вами кошелёк, торгуете напрямую через смарт-контракты, а активы остаются под вашим контролем вплоть до момента исполнения обмена.
Механизм определения цены тоже отличается. Централизованные биржи используют стаканы заявок: покупатели и продавцы выставляют цены спроса и предложения, которые совпадают, когда цены устраивают обе стороны. Большинство DEX вместо этого используют автоматических маркет-мейкеров. Поставщики ликвидности вносят пары активов в пулы. Формула определяет цену каждой сделки на основе текущего соотношения активов в пуле. В пуле всегда можно совершить сделку, даже если ни один другой пользователь не хочет занять противоположную сторону вашей позиции.
На STONfi модель AMM работает вместе с маршрутизацией Omniston на основе намерений, которая находит лучшую доступную цену в нескольких пулах. В результате сделки исполняются выгоднее, и пользователям не нужно вручную сравнивать пулы.
Понимание разницы между кастодиальными и некастодиальными биржами — основа всего остального в DeFi. На https://whatisdex.com/ понятным языком описана работа DEX — это полезный материал для всех, кто хочет разобраться в теме с самых основ.
#BTC Анализ цены# $BTC #Сезон альткоинов# $ETH
Большинство людей приходят в криптовалюту через централизованную биржу. Они создают аккаунт, проходят проверку личности, вносят средства и торгуют через биржевой стакан. Биржа хранит их активы. Она может заморозить аккаунт или стать неплатёжеспособной, пока средства находятся на её счету.
Децентрализованная биржа устроена иначе на каждом уровне.
DEX — это набор смарт-контрактов, работающих на блокчейне. Ни одна компания не управляет им. Не нужно создавать аккаунт. Не требуется проверка личности. Никакая платформа не хранит ваши активы от вашего имени. Вы подключаете контролируемый вами кошелёк, торгуете напрямую через смарт-контракты, а активы остаются под вашим контролем вплоть до момента исполнения обмена.
Механизм определения цены тоже отличается. Централизованные биржи используют стаканы заявок: покупатели и продавцы выставляют цены спроса и предложения, которые совпадают, когда цены устраивают обе стороны. Большинство DEX вместо этого используют автоматических маркет-мейкеров. Поставщики ликвидности вносят пары активов в пулы. Формула определяет цену каждой сделки на основе текущего соотношения активов в пуле. В пуле всегда можно совершить сделку, даже если ни один другой пользователь не хочет занять противоположную сторону вашей позиции.
На STONfi модель AMM работает вместе с маршрутизацией Omniston на основе намерений, которая находит лучшую доступную цену в нескольких пулах. В результате сделки исполняются выгоднее, и пользователям не нужно вручную сравнивать пулы.
Понимание разницы между кастодиальными и некастодиальными биржами — основа всего остального в DeFi. На https://whatisdex.com/ понятным языком описана работа DEX — это полезный материал для всех, кто хочет разобраться в теме с самых основ.
#BTC Анализ цены# $BTC #Сезон альткоинов# $ETH
Децентрализованная биржа устроена иначе на каждом уровне.
DEX — это набор смарт-контрактов, работающих на блокчейне. Ни одна компания не управляет им. Не нужно создавать аккаунт. Не требуется проверка личности. Никакая платформа не хранит ваши активы от вашего имени. Вы подключаете контролируемый вами кошелёк, торгуете напрямую через смарт-контракты, а активы остаются под вашим контролем вплоть до момента исполнения обмена.
Механизм определения цены тоже отличается. Централизованные биржи используют стаканы заявок: покупатели и продавцы выставляют цены спроса и предложения, которые совпадают, когда цены устраивают обе стороны. Большинство DEX вместо этого используют автоматических маркет-мейкеров. Поставщики ликвидности вносят пары активов в пулы. Формула определяет цену каждой сделки на основе текущего соотношения активов в пуле. В пуле всегда можно совершить сделку, даже если ни один другой пользователь не хочет занять противоположную сторону вашей позиции.
На STONfi модель AMM работает вместе с маршрутизацией Omniston на основе намерений, которая находит лучшую доступную цену в нескольких пулах. В результате сделки исполняются выгоднее, и пользователям не нужно вручную сравнивать пулы.
Понимание разницы между кастодиальными и некастодиальными биржами — основа всего остального в DeFi. На https://whatisdex.com/ понятным языком описана работа DEX — это полезный материал для всех, кто хочет разобраться в теме с самых основ.
#BTC Анализ цены# $BTC #Сезон альткоинов# $ETH
58
·
--
Один кит вывел $34 млн из биткоина и вложил $36 млн в эфир, и цены сделок говорят больше, чем их размер.
По данным Lookonchain, адрес продал 410,14 BTC на Hyperliquid за $34,16 млн — примерно по $83 300 за монету, — а затем купил на децентрализованных биржах 14 341 ETH за $36,14 млн, около $2 520 за каждый. Это сделка на относительную стоимость при соотношении ETH/BTC около 0,0303, причём в покупку ETH было вложено дополнительно примерно $2 млн. В сообщениях не уточняется, была ли сделка с BTC спотовой или с бессрочными фьючерсами, и владелец кошелька не установлен.
Масштаб помогает взглянуть на ситуацию трезво. $36 млн — это менее 7% от $542 млн, выведенных из спотовых ETF на ETH в США за неделю, завершившуюся 9 октября, и капля в море по сравнению с дневным объёмом торгов биткоином. Необычно здесь время: покупатель вкладывается в ETH сразу после недели значительного оттока средств из ETF.
Киты тоже не действуют заодно. По данным Coinglass, киты на Hyperliquid в целом открыли больше коротких позиций: около 54% от общего объёма позиций в $8,8 млрд. По последним данным, один адрес потерял примерно $24 млн на короткой позиции по ETH с плечом 5x, открытой около $2 323. То, что один кошелёк переводит средства в ETH, пока другой терпит убытки, говорит о том, что вокруг ETH идёт борьба, а не о том, что рынок выбрал сторону.
На мой взгляд, главное здесь — ротация, а не выход с рынка. Кит остался в криптовалютах, изменив соотношение активов, — это похоже на ставку на то, что ETH покажет результат лучше BTC, а не на падение биткоина.
Но вот почему не стоит придавать этому слишком большое значение: один кошелёк, одна сделка, никаких заявленных намерений. Это может быть ребалансировка, часть хеджирования или сделка трейдера, который уже на следующей неделе развернёт позицию.
Дальше стоит следить за тем, продолжит ли тот же адрес переводить средства и удержится ли ETH/BTC выше 0,030 после покупки.
$ETH #BTC Анализ цены# #Сезон альткоинов# $BTC
Один кит вывел $34 млн из биткоина и вложил $36 млн в эфир, и цены сделок говорят больше, чем их размер.
По данным Lookonchain, адрес продал 410,14 BTC на Hyperliquid за $34,16 млн — примерно по $83 300 за монету, — а затем купил на децентрализованных биржах 14 341 ETH за $36,14 млн, около $2 520 за каждый. Это сделка на относительную стоимость при соотношении ETH/BTC около 0,0303, причём в покупку ETH было вложено дополнительно примерно $2 млн. В сообщениях не уточняется, была ли сделка с BTC спотовой или с бессрочными фьючерсами, и владелец кошелька не установлен.
Масштаб помогает взглянуть на ситуацию трезво. $36 млн — это менее 7% от $542 млн, выведенных из спотовых ETF на ETH в США за неделю, завершившуюся 9 октября, и капля в море по сравнению с дневным объёмом торгов биткоином. Необычно здесь время: покупатель вкладывается в ETH сразу после недели значительного оттока средств из ETF.
Киты тоже не действуют заодно. По данным Coinglass, киты на Hyperliquid в целом открыли больше коротких позиций: около 54% от общего объёма позиций в $8,8 млрд. По последним данным, один адрес потерял примерно $24 млн на короткой позиции по ETH с плечом 5x, открытой около $2 323. То, что один кошелёк переводит средства в ETH, пока другой терпит убытки, говорит о том, что вокруг ETH идёт борьба, а не о том, что рынок выбрал сторону.
На мой взгляд, главное здесь — ротация, а не выход с рынка. Кит остался в криптовалютах, изменив соотношение активов, — это похоже на ставку на то, что ETH покажет результат лучше BTC, а не на падение биткоина.
Но вот почему не стоит придавать этому слишком большое значение: один кошелёк, одна сделка, никаких заявленных намерений. Это может быть ребалансировка, часть хеджирования или сделка трейдера, который уже на следующей неделе развернёт позицию.
Дальше стоит следить за тем, продолжит ли тот же адрес переводить средства и удержится ли ETH/BTC выше 0,030 после покупки.
$ETH #BTC Анализ цены# #Сезон альткоинов# $BTC
По данным Lookonchain, адрес продал 410,14 BTC на Hyperliquid за $34,16 млн — примерно по $83 300 за монету, — а затем купил на децентрализованных биржах 14 341 ETH за $36,14 млн, около $2 520 за каждый. Это сделка на относительную стоимость при соотношении ETH/BTC около 0,0303, причём в покупку ETH было вложено дополнительно примерно $2 млн. В сообщениях не уточняется, была ли сделка с BTC спотовой или с бессрочными фьючерсами, и владелец кошелька не установлен.
Масштаб помогает взглянуть на ситуацию трезво. $36 млн — это менее 7% от $542 млн, выведенных из спотовых ETF на ETH в США за неделю, завершившуюся 9 октября, и капля в море по сравнению с дневным объёмом торгов биткоином. Необычно здесь время: покупатель вкладывается в ETH сразу после недели значительного оттока средств из ETF.
Киты тоже не действуют заодно. По данным Coinglass, киты на Hyperliquid в целом открыли больше коротких позиций: около 54% от общего объёма позиций в $8,8 млрд. По последним данным, один адрес потерял примерно $24 млн на короткой позиции по ETH с плечом 5x, открытой около $2 323. То, что один кошелёк переводит средства в ETH, пока другой терпит убытки, говорит о том, что вокруг ETH идёт борьба, а не о том, что рынок выбрал сторону.
На мой взгляд, главное здесь — ротация, а не выход с рынка. Кит остался в криптовалютах, изменив соотношение активов, — это похоже на ставку на то, что ETH покажет результат лучше BTC, а не на падение биткоина.
Но вот почему не стоит придавать этому слишком большое значение: один кошелёк, одна сделка, никаких заявленных намерений. Это может быть ребалансировка, часть хеджирования или сделка трейдера, который уже на следующей неделе развернёт позицию.
Дальше стоит следить за тем, продолжит ли тот же адрес переводить средства и удержится ли ETH/BTC выше 0,030 после покупки.
$ETH #BTC Анализ цены# #Сезон альткоинов# $BTC
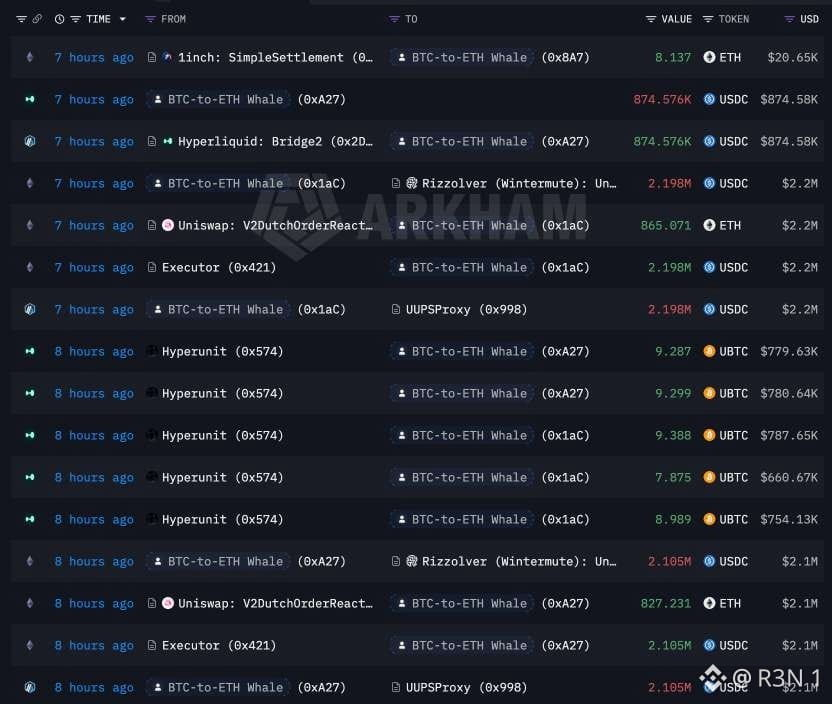
73
·
--
Показатель «144M» также встречается в июльском обновлении Flare, но там он относится к FXRP, размещённому в DeFi, поэтому проверьте, какой именно показатель имеется в виду у вас. Я не нашёл число в 14 085 держателей ни в одном источнике, поэтому отметил его как сообщаемое. В апреле объём предложения также превышал 150M — это стало основным акцентом публикации.
Здесь модель доверия важнее, чем сам рубеж.
Каждый FXRP выпускается только после того, как уровень данных Flare подтверждает соответствующий платёж в XRP в XRP Ledger; сами XRP хранятся в Core Vault под управлением мультиподписи, контролируемой Flare. Спустя год Flare сообщает примерно о 145M выпущенных FXRP, около 130M из которых размещены в DeFi — примерно 89,5% от общего предложения. Также сообщается о 14 085 держателях.
Больше всего мне бросается в глаза динамика. Первый лимит в 5M был достигнут за четыре часа, к январю предложение превысило 90M, а в апреле Flare сообщила, что в обращении находится более 150M. При объёме около 145M предложение ниже апрельского уровня. Поэтому это скорее плато после быстрого роста, а не новый всплеск.
Сценарии использования реальны. FXRP теперь служит обеспечением для опционов и бессрочных контрактов на Derive, а также для займов в RLUSD через хранилища Morpho; ещё около 21M FXRP находится в других сетях благодаря LayerZero.
Важно прямо сказать о масштабах. По моим расчётам, 145M — это примерно 0,2% от обращающегося предложения XRP. Flare также заявляет, что используется около 85% текущих возможностей для выпуска, поэтому дальнейший рост зависит от того, будут ли агенты вносить дополнительное обеспечение.
Оговорка касается стимулов. На момент запуска объём предложения был ограничен, пока Flare запускала программу вознаграждений. На мой взгляд, высокая доля размещённых токенов может отражать не только уверенность пользователей, но и фарминг доходности. Обёртывание XRP также означает переход от нативного хранения к модели проверки и хранилищ Flare.
Открытый вопрос — что произойдёт по мере сокращения стимулов. Вырастет ли предложение снова выше апрельского пика или FXRP останется нишевым сегментом экосистемы XRP?
$XRP #ОбзорМакроэкономики# #АнализЦеныBTC# $BTC
Показатель «144M» также встречается в июльском обновлении Flare, но там он относится к FXRP, размещённому в DeFi, поэтому проверьте, какой именно показатель имеется в виду у вас. Я не нашёл число в 14 085 держателей ни в одном источнике, поэтому отметил его как сообщаемое. В апреле объём предложения также превышал 150M — это стало основным акцентом публикации.
Здесь модель доверия важнее, чем сам рубеж.
Каждый FXRP выпускается только после того, как уровень данных Flare подтверждает соответствующий платёж в XRP в XRP Ledger; сами XRP хранятся в Core Vault под управлением мультиподписи, контролируемой Flare. Спустя год Flare сообщает примерно о 145M выпущенных FXRP, около 130M из которых размещены в DeFi — примерно 89,5% от общего предложения. Также сообщается о 14 085 держателях.
Больше всего мне бросается в глаза динамика. Первый лимит в 5M был достигнут за четыре часа, к январю предложение превысило 90M, а в апреле Flare сообщила, что в обращении находится более 150M. При объёме около 145M предложение ниже апрельского уровня. Поэтому это скорее плато после быстрого роста, а не новый всплеск.
Сценарии использования реальны. FXRP теперь служит обеспечением для опционов и бессрочных контрактов на Derive, а также для займов в RLUSD через хранилища Morpho; ещё около 21M FXRP находится в других сетях благодаря LayerZero.
Важно прямо сказать о масштабах. По моим расчётам, 145M — это примерно 0,2% от обращающегося предложения XRP. Flare также заявляет, что используется около 85% текущих возможностей для выпуска, поэтому дальнейший рост зависит от того, будут ли агенты вносить дополнительное обеспечение.
Оговорка касается стимулов. На момент запуска объём предложения был ограничен, пока Flare запускала программу вознаграждений. На мой взгляд, высокая доля размещённых токенов может отражать не только уверенность пользователей, но и фарминг доходности. Обёртывание XRP также означает переход от нативного хранения к модели проверки и хранилищ Flare.
Открытый вопрос — что произойдёт по мере сокращения стимулов. Вырастет ли предложение снова выше апрельского пика или FXRP останется нишевым сегментом экосистемы XRP?
$XRP #ОбзорМакроэкономики# #АнализЦеныBTC# $BTC
Здесь модель доверия важнее, чем сам рубеж.
Каждый FXRP выпускается только после того, как уровень данных Flare подтверждает соответствующий платёж в XRP в XRP Ledger; сами XRP хранятся в Core Vault под управлением мультиподписи, контролируемой Flare. Спустя год Flare сообщает примерно о 145M выпущенных FXRP, около 130M из которых размещены в DeFi — примерно 89,5% от общего предложения. Также сообщается о 14 085 держателях.
Больше всего мне бросается в глаза динамика. Первый лимит в 5M был достигнут за четыре часа, к январю предложение превысило 90M, а в апреле Flare сообщила, что в обращении находится более 150M. При объёме около 145M предложение ниже апрельского уровня. Поэтому это скорее плато после быстрого роста, а не новый всплеск.
Сценарии использования реальны. FXRP теперь служит обеспечением для опционов и бессрочных контрактов на Derive, а также для займов в RLUSD через хранилища Morpho; ещё около 21M FXRP находится в других сетях благодаря LayerZero.
Важно прямо сказать о масштабах. По моим расчётам, 145M — это примерно 0,2% от обращающегося предложения XRP. Flare также заявляет, что используется около 85% текущих возможностей для выпуска, поэтому дальнейший рост зависит от того, будут ли агенты вносить дополнительное обеспечение.
Оговорка касается стимулов. На момент запуска объём предложения был ограничен, пока Flare запускала программу вознаграждений. На мой взгляд, высокая доля размещённых токенов может отражать не только уверенность пользователей, но и фарминг доходности. Обёртывание XRP также означает переход от нативного хранения к модели проверки и хранилищ Flare.
Открытый вопрос — что произойдёт по мере сокращения стимулов. Вырастет ли предложение снова выше апрельского пика или FXRP останется нишевым сегментом экосистемы XRP?
$XRP #ОбзорМакроэкономики# #АнализЦеныBTC# $BTC

2
Войдите, чтобы посмотреть больше материала
Присоединяйтесь к пользователям криптовалют по всему миру на Binance Square
⚡️ Получайте новейшую и полезную информацию о криптоактивах.
💬 Нам доверяет крупнейшая в мире криптобиржа.
👍 Получите достоверные аналитические данные от верифицированных создателей контента.
Эл. почта/номер телефона
В тренде
BinancePick
Просмотров: 2.7M
142,581 обсуждают
Присоединяйтесь к #EarningsSeason: прогнозируйте финансовые результаты на Binance Pick и делитесь своим мнением на Binance Square!
Binance Square Official
·Лайков: 402
·Просмотров: 338.7k
EarningsSeason
Просмотров: 5M
24,468 обсуждают
SouthKoreaReportedlyWeighsFourthCryptoTaxDelay
Просмотров: 0
3 обсуждают