
ZIV OREN
12.7k Публикации

ZIV OREN
 Square Verified
Отправить жалобу
Заблокировать пользователя
Energy can't be faked | Sharp mind, Calm Soul. KITE_539271
Открытая сделка
Случайный трейдер
1.4 г
282 подписок(и/а)
34.3K+ подписчиков(а)
29.8K+ понравилось
Посты
Портфель
Все
Цитирования
Активно
·
--
Падение
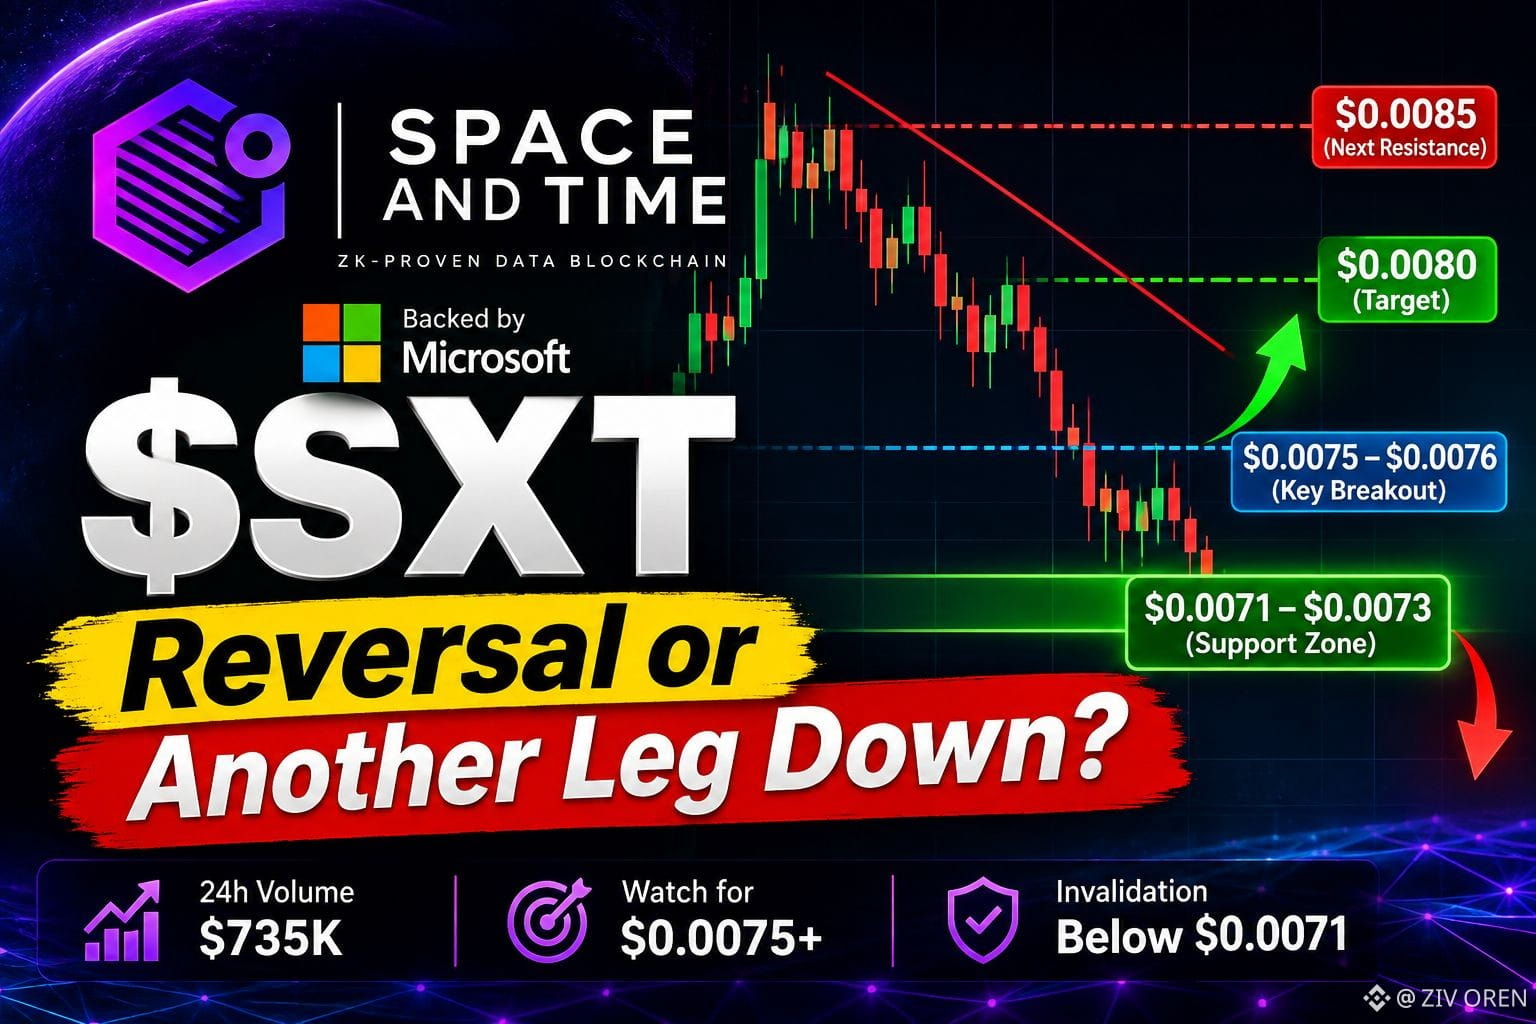
Space and Time ($SXT ) is under pressure, and I’m watching closely to see whether buyers can defend the current support zone. SXT is trading around $0.0073–$0.0074, down roughly 6–7% over the last 24 hours. The short-term structure remains bearish, so I’m not rushing into a position just because the price is lower. CoinGlass +1
On the 4H chart, I’m focused on the $0.0071–$0.0073 support area. If buyers defend this zone and price starts forming higher lows, a recovery toward $0.0079–$0.0080 could be the first sign of improving momentum. A clean break above that resistance would make $0.0083–$0.0085 my next upside areas to watch. However, losing $0.0071 could expose SXT to another leg down.
Volume is another important factor here. Reported 24-hour spot volume varies across data providers, while derivatives activity remains significant. CoinGlass reports approximately $735K in spot volume and $4.44M in futures volume, alongside declining open interest and predominantly long-side liquidations. That suggests leveraged bullish positions are being flushed out rather than a confirmed reversal taking shape. CoinGlass +1
My trading plan is to avoid chasing the price while sellers remain in control. I’d consider scaling into a spot position near $0.0072–$0.0071 only if support holds and buying pressure returns. I’d look for a stronger entry confirmation through a 4H reclaim of $0.0075–$0.0076, supported by rising volume. If support breaks decisively, I’ll wait for a new structure instead of blindly averaging down.
What keeps SXT on my watchlist is its focus on verifiable blockchain data and zero-knowledge proofs, with Microsoft backing adding credibility to the project's broader ecosystem story. But fundamentals alone don’t guarantee a price recovery.
For me, the next move depends on one thing: can SXT reclaim resistance, or will sellers push it below support? I’m watching confirmation, volume, and market structure before making my move.
#sxt $SXT @SpaceandTimeDB
Space and Time ($SXT ) is under pressure, and I’m watching closely to see whether buyers can defend the current support zone. SXT is trading around $0.0073–$0.0074, down roughly 6–7% over the last 24 hours. The short-term structure remains bearish, so I’m not rushing into a position just because the price is lower. CoinGlass +1
On the 4H chart, I’m focused on the $0.0071–$0.0073 support area. If buyers defend this zone and price starts forming higher lows, a recovery toward $0.0079–$0.0080 could be the first sign of improving momentum. A clean break above that resistance would make $0.0083–$0.0085 my next upside areas to watch. However, losing $0.0071 could expose SXT to another leg down.
Volume is another important factor here. Reported 24-hour spot volume varies across data providers, while derivatives activity remains significant. CoinGlass reports approximately $735K in spot volume and $4.44M in futures volume, alongside declining open interest and predominantly long-side liquidations. That suggests leveraged bullish positions are being flushed out rather than a confirmed reversal taking shape. CoinGlass +1
My trading plan is to avoid chasing the price while sellers remain in control. I’d consider scaling into a spot position near $0.0072–$0.0071 only if support holds and buying pressure returns. I’d look for a stronger entry confirmation through a 4H reclaim of $0.0075–$0.0076, supported by rising volume. If support breaks decisively, I’ll wait for a new structure instead of blindly averaging down.
What keeps SXT on my watchlist is its focus on verifiable blockchain data and zero-knowledge proofs, with Microsoft backing adding credibility to the project's broader ecosystem story. But fundamentals alone don’t guarantee a price recovery.
For me, the next move depends on one thing: can SXT reclaim resistance, or will sellers push it below support? I’m watching confirmation, volume, and market structure before making my move.
#sxt $SXT @SpaceandTime
On the 4H chart, I’m focused on the $0.0071–$0.0073 support area. If buyers defend this zone and price starts forming higher lows, a recovery toward $0.0079–$0.0080 could be the first sign of improving momentum. A clean break above that resistance would make $0.0083–$0.0085 my next upside areas to watch. However, losing $0.0071 could expose SXT to another leg down.
Volume is another important factor here. Reported 24-hour spot volume varies across data providers, while derivatives activity remains significant. CoinGlass reports approximately $735K in spot volume and $4.44M in futures volume, alongside declining open interest and predominantly long-side liquidations. That suggests leveraged bullish positions are being flushed out rather than a confirmed reversal taking shape. CoinGlass +1
My trading plan is to avoid chasing the price while sellers remain in control. I’d consider scaling into a spot position near $0.0072–$0.0071 only if support holds and buying pressure returns. I’d look for a stronger entry confirmation through a 4H reclaim of $0.0075–$0.0076, supported by rising volume. If support breaks decisively, I’ll wait for a new structure instead of blindly averaging down.
What keeps SXT on my watchlist is its focus on verifiable blockchain data and zero-knowledge proofs, with Microsoft backing adding credibility to the project's broader ecosystem story. But fundamentals alone don’t guarantee a price recovery.
For me, the next move depends on one thing: can SXT reclaim resistance, or will sellers push it below support? I’m watching confirmation, volume, and market structure before making my move.
#sxt $SXT @SpaceandTime
2
519
·
--
Рост
$NEAR UNDER PRESSURE — WILL $2.757 SUPPORT HOLD?
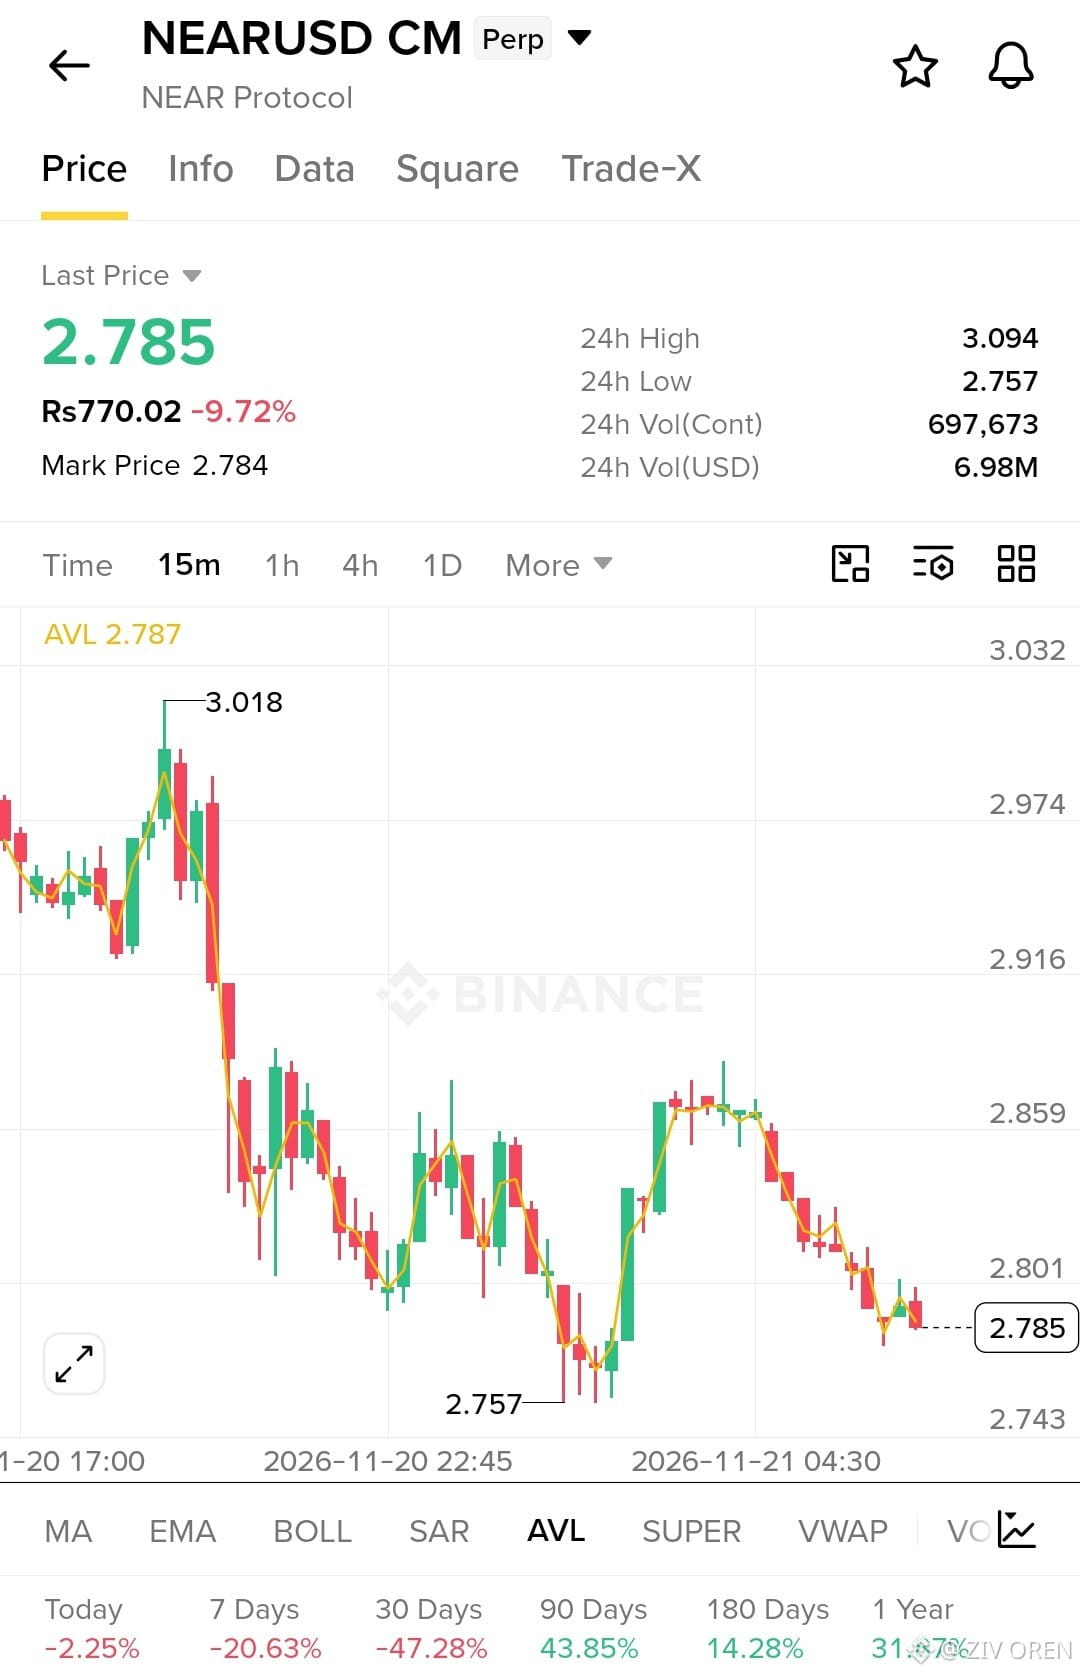
NEAR is trading at $2.785, down 9.72% in 24 hours, and the 15-minute chart continues to show bearish momentum. After reaching $3.018, price suffered a sharp decline, briefly recovered toward $2.859, and then faced another wave of selling. Buyers are struggling to maintain the rebound, keeping the $2.757 support level firmly in focus.
24-hour trading volume stands at 697,673 contracts, worth approximately $6.98M in USD volume. Price is now hovering just above the recent low, suggesting the market remains vulnerable to further selling. Although the longer-term performance shown on the chart includes gains over 90 days, the immediate structure remains weak.
My Trading Plan
I’m watching $2.757–$2.780 for signs of stabilization before considering a long entry. I don’t want to buy simply because price is near support; I need a confirmed bounce and stronger buying pressure. If NEAR reclaims $2.801 and holds above it, that would be an early sign of recovery.
A stronger move above $2.859 could open the way toward $2.916. On the downside, a clean break below $2.757 would invalidate my immediate bullish recovery idea and could expose lower levels.
For now, I’m avoiding aggressive DCA while the chart continues to make lower highs. I’ll consider adding only after support is defended and price action improves.
NEAR is approaching a critical support zone. I’m watching $2.757 closely because the next reaction could determine whether buyers attempt another recovery or sellers extend the decline. Confirmation first, capital protection always.
$NEAR UNDER PRESSURE — WILL $2.757 SUPPORT HOLD?
NEAR is trading at $2.785, down 9.72% in 24 hours, and the 15-minute chart continues to show bearish momentum. After reaching $3.018, price suffered a sharp decline, briefly recovered toward $2.859, and then faced another wave of selling. Buyers are struggling to maintain the rebound, keeping the $2.757 support level firmly in focus.
24-hour trading volume stands at 697,673 contracts, worth approximately $6.98M in USD volume. Price is now hovering just above the recent low, suggesting the market remains vulnerable to further selling. Although the longer-term performance shown on the chart includes gains over 90 days, the immediate structure remains weak.
My Trading Plan
I’m watching $2.757–$2.780 for signs of stabilization before considering a long entry. I don’t want to buy simply because price is near support; I need a confirmed bounce and stronger buying pressure. If NEAR reclaims $2.801 and holds above it, that would be an early sign of recovery.
A stronger move above $2.859 could open the way toward $2.916. On the downside, a clean break below $2.757 would invalidate my immediate bullish recovery idea and could expose lower levels.
For now, I’m avoiding aggressive DCA while the chart continues to make lower highs. I’ll consider adding only after support is defended and price action improves.
NEAR is approaching a critical support zone. I’m watching $2.757 closely because the next reaction could determine whether buyers attempt another recovery or sellers extend the decline. Confirmation first, capital protection always.
NEAR is trading at $2.785, down 9.72% in 24 hours, and the 15-minute chart continues to show bearish momentum. After reaching $3.018, price suffered a sharp decline, briefly recovered toward $2.859, and then faced another wave of selling. Buyers are struggling to maintain the rebound, keeping the $2.757 support level firmly in focus.
24-hour trading volume stands at 697,673 contracts, worth approximately $6.98M in USD volume. Price is now hovering just above the recent low, suggesting the market remains vulnerable to further selling. Although the longer-term performance shown on the chart includes gains over 90 days, the immediate structure remains weak.
My Trading Plan
I’m watching $2.757–$2.780 for signs of stabilization before considering a long entry. I don’t want to buy simply because price is near support; I need a confirmed bounce and stronger buying pressure. If NEAR reclaims $2.801 and holds above it, that would be an early sign of recovery.
A stronger move above $2.859 could open the way toward $2.916. On the downside, a clean break below $2.757 would invalidate my immediate bullish recovery idea and could expose lower levels.
For now, I’m avoiding aggressive DCA while the chart continues to make lower highs. I’ll consider adding only after support is defended and price action improves.
NEAR is approaching a critical support zone. I’m watching $2.757 closely because the next reaction could determine whether buyers attempt another recovery or sellers extend the decline. Confirmation first, capital protection always.
182
·
--
Рост
$LINK SHOWS A RECOVERY — CAN BULLS BREAK $8.596?
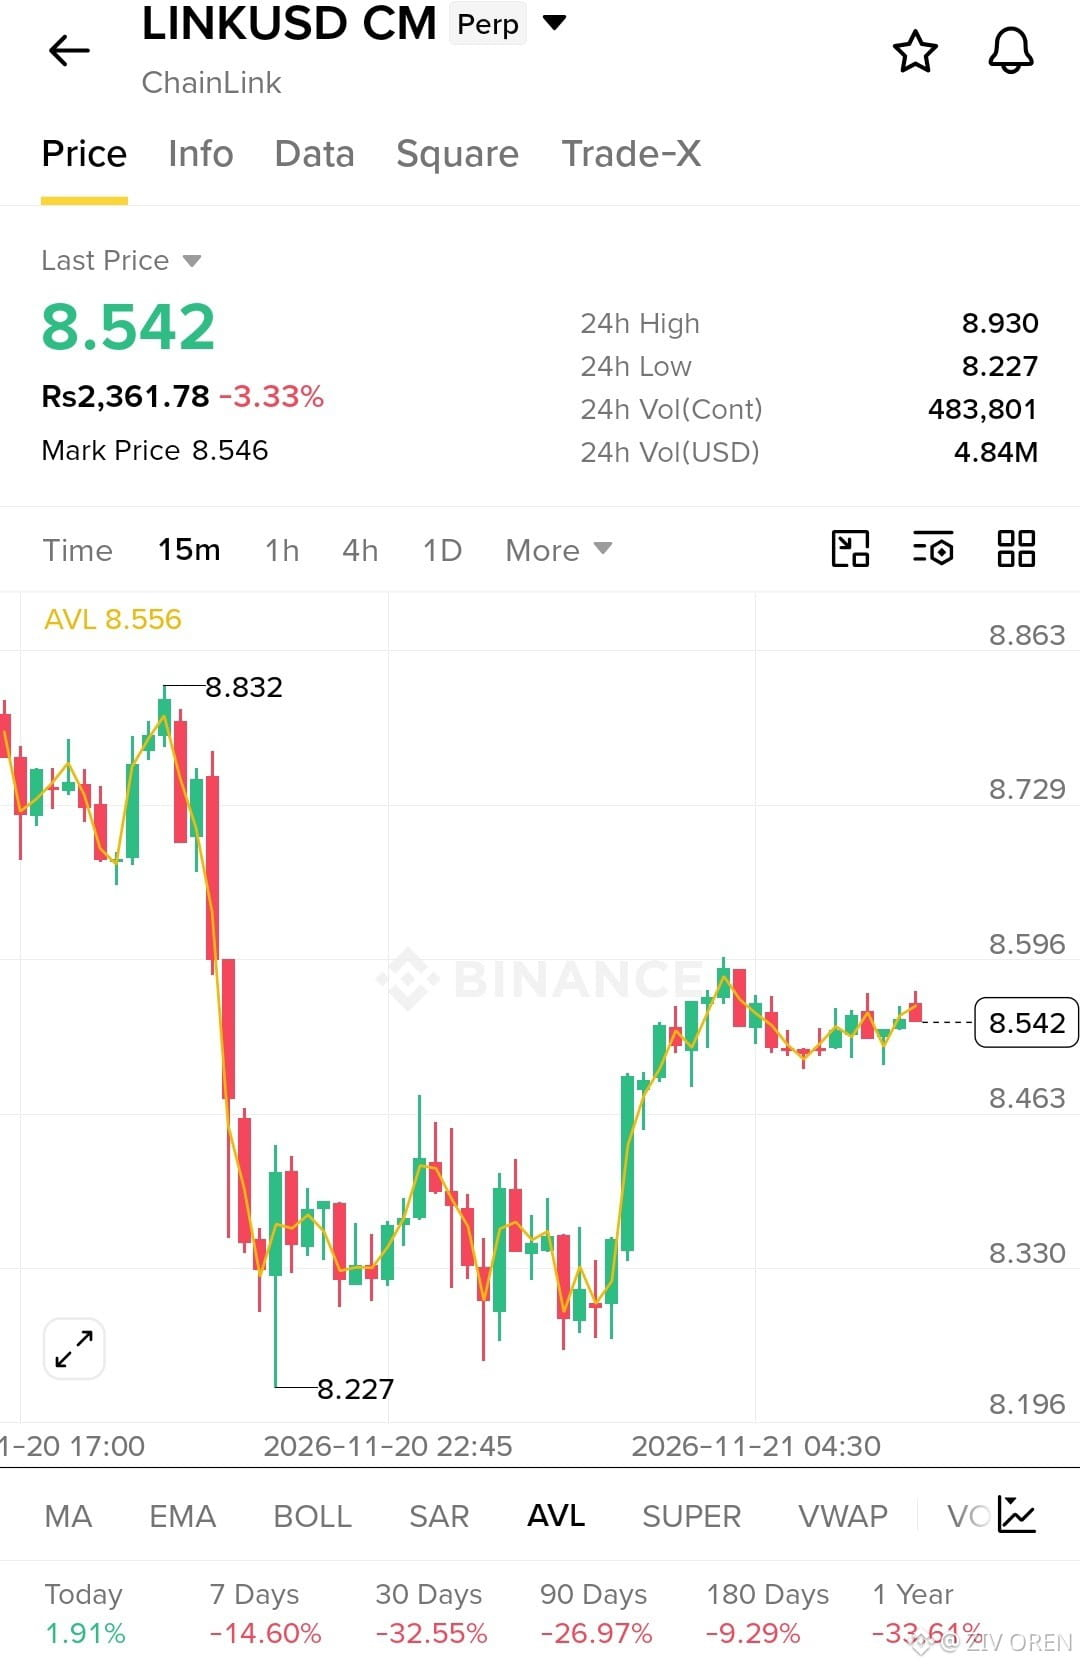
Chainlink (LINK) is trading at $8.542, down 3.33% in 24 hours, after a sharp sell-off on the 15-minute chart. Price dropped from the $8.832 area to a low of $8.227 before recovering toward $8.54. Buyers have regained some ground, but the market still needs a confirmed breakout to shift the short-term structure in their favor.
24-hour trading volume stands at 483,801 contracts, worth approximately $4.84M in USD volume. Price is now consolidating above the $8.463 area after the rebound, suggesting selling pressure has eased in the short term. However, the broader daily performance remains weak, so I want confirmation before treating this recovery as a trend reversal.
My Trading Plan
I’m watching $8.46–$8.50 for a potential entry if buyers continue defending support. I’d consider adding through DCA only if price holds this zone and produces a clear bullish reaction.
For confirmation, I want LINK to break above $8.596 with sustained buying pressure. That could open a move toward $8.729 and the previous high near $8.832. If price loses $8.463, the recovery weakens, and a retest of $8.330 becomes possible. A break below $8.227 would invalidate my immediate bullish setup.
I’m not chasing the rebound while LINK remains below resistance. The next move around $8.596 will tell me whether buyers are ready to take control or this is simply a temporary recovery.
$LINK SHOWS A RECOVERY — CAN BULLS BREAK $8.596?
Chainlink (LINK) is trading at $8.542, down 3.33% in 24 hours, after a sharp sell-off on the 15-minute chart. Price dropped from the $8.832 area to a low of $8.227 before recovering toward $8.54. Buyers have regained some ground, but the market still needs a confirmed breakout to shift the short-term structure in their favor.
24-hour trading volume stands at 483,801 contracts, worth approximately $4.84M in USD volume. Price is now consolidating above the $8.463 area after the rebound, suggesting selling pressure has eased in the short term. However, the broader daily performance remains weak, so I want confirmation before treating this recovery as a trend reversal.
My Trading Plan
I’m watching $8.46–$8.50 for a potential entry if buyers continue defending support. I’d consider adding through DCA only if price holds this zone and produces a clear bullish reaction.
For confirmation, I want LINK to break above $8.596 with sustained buying pressure. That could open a move toward $8.729 and the previous high near $8.832. If price loses $8.463, the recovery weakens, and a retest of $8.330 becomes possible. A break below $8.227 would invalidate my immediate bullish setup.
I’m not chasing the rebound while LINK remains below resistance. The next move around $8.596 will tell me whether buyers are ready to take control or this is simply a temporary recovery.
Chainlink (LINK) is trading at $8.542, down 3.33% in 24 hours, after a sharp sell-off on the 15-minute chart. Price dropped from the $8.832 area to a low of $8.227 before recovering toward $8.54. Buyers have regained some ground, but the market still needs a confirmed breakout to shift the short-term structure in their favor.
24-hour trading volume stands at 483,801 contracts, worth approximately $4.84M in USD volume. Price is now consolidating above the $8.463 area after the rebound, suggesting selling pressure has eased in the short term. However, the broader daily performance remains weak, so I want confirmation before treating this recovery as a trend reversal.
My Trading Plan
I’m watching $8.46–$8.50 for a potential entry if buyers continue defending support. I’d consider adding through DCA only if price holds this zone and produces a clear bullish reaction.
For confirmation, I want LINK to break above $8.596 with sustained buying pressure. That could open a move toward $8.729 and the previous high near $8.832. If price loses $8.463, the recovery weakens, and a retest of $8.330 becomes possible. A break below $8.227 would invalidate my immediate bullish setup.
I’m not chasing the rebound while LINK remains below resistance. The next move around $8.596 will tell me whether buyers are ready to take control or this is simply a temporary recovery.
191
·
--
$ETH UNDER HEAVY PRESSURE — CAN $1,577 SUPPORT HOLD?
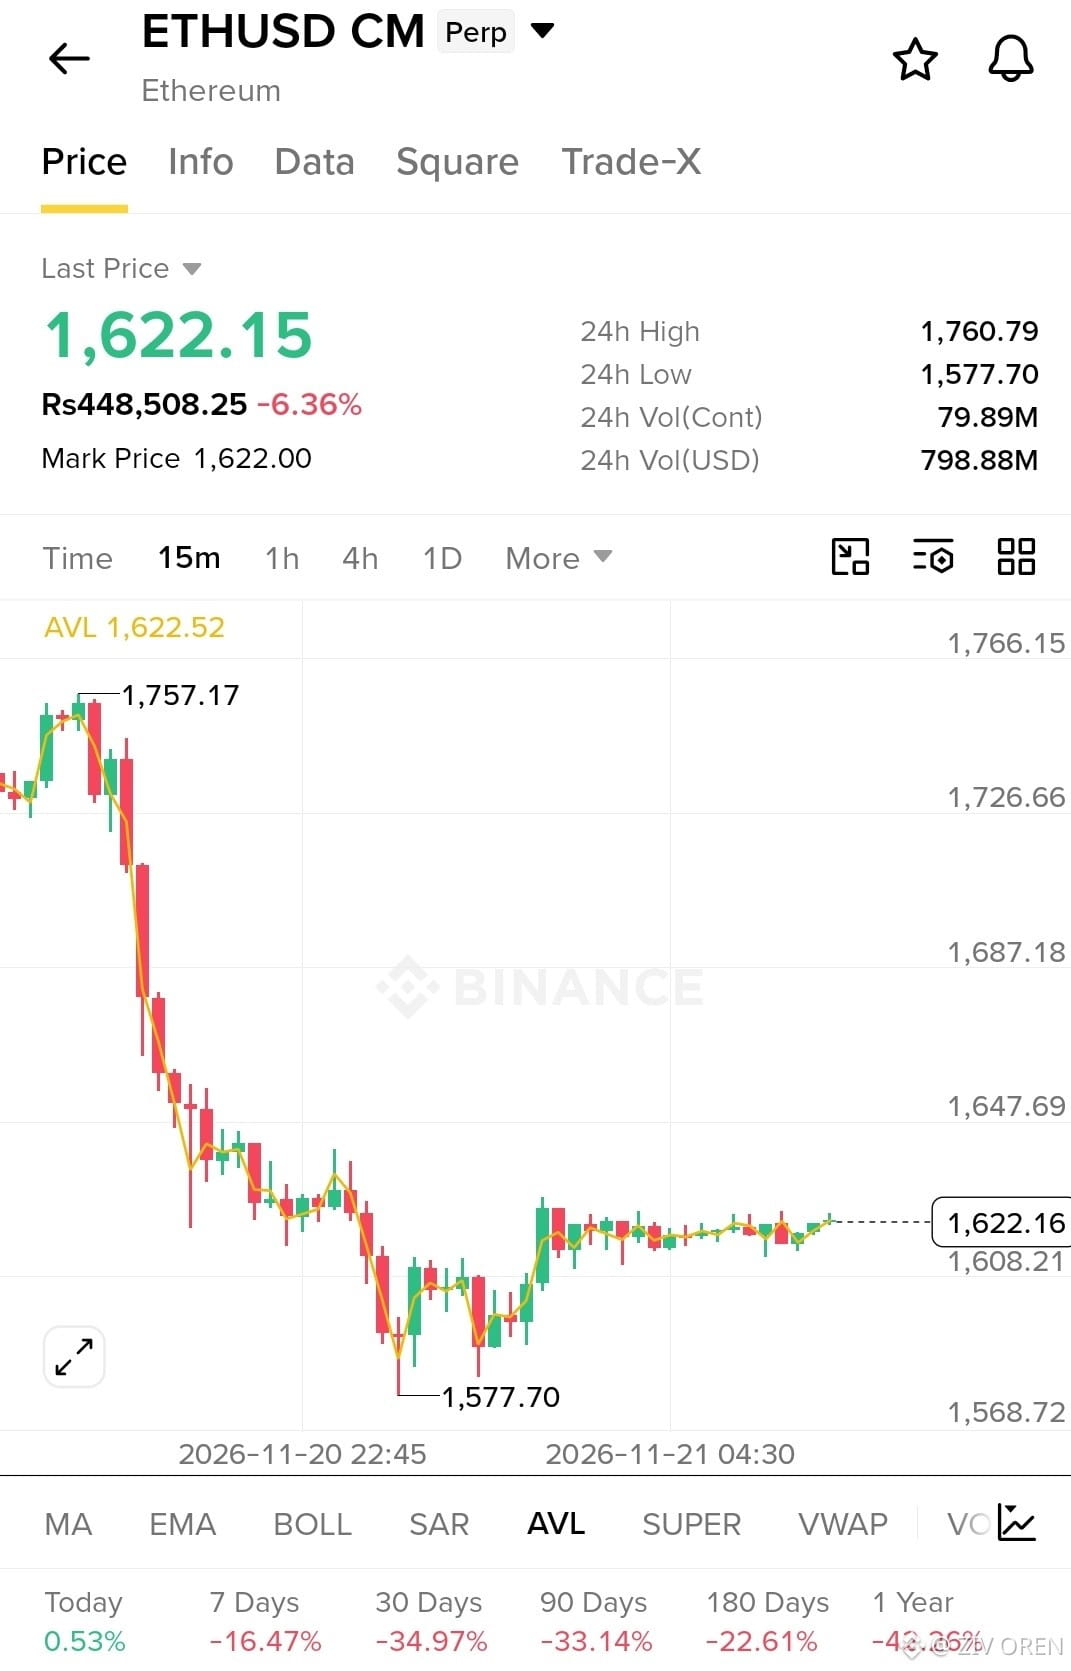
Ethereum is trading at $1,622.15, down 6.36% in 24 hours, after a sharp sell-off on the 15-minute chart. Price dropped from the $1,757 area to a low of $1,577.70 before recovering and consolidating around $1,622. Buyers are attempting to stabilize the market, but the short-term structure remains bearish until stronger recovery signals appear.
24-hour trading volume stands at 79.89M contracts, worth approximately $798.88M in USD volume. After the steep decline, ETH is moving sideways near $1,622, suggesting a pause in selling rather than a confirmed trend reversal. I’m watching whether buyers can reclaim nearby resistance or sellers resume control.
My Trading Plan
I’m not rushing into a long position here. I’m watching $1,608–$1,615 for signs of support, with the recent low at $1,577.70 as the key level bulls need to defend. I’d consider a cautious entry only after a confirmed bounce and a reclaim of nearby resistance.
If ETH breaks above $1,647, the recovery could gain traction toward $1,687. On the downside, a breakdown below $1,608 would weaken the current consolidation, while losing $1,577.70 would invalidate my immediate bullish recovery idea.
For shorts, I’d prefer a clear rejection near $1,647 or a confirmed breakdown below support rather than entering after an already extended decline. Any position needs a defined invalidation level and controlled risk.
ETH is at a critical decision point. I’m watching whether $1,608 holds and buyers can reclaim $1,647. Until the chart confirms a direction, patience matters more than chasing a move.
$ETH UNDER HEAVY PRESSURE — CAN $1,577 SUPPORT HOLD?
Ethereum is trading at $1,622.15, down 6.36% in 24 hours, after a sharp sell-off on the 15-minute chart. Price dropped from the $1,757 area to a low of $1,577.70 before recovering and consolidating around $1,622. Buyers are attempting to stabilize the market, but the short-term structure remains bearish until stronger recovery signals appear.
24-hour trading volume stands at 79.89M contracts, worth approximately $798.88M in USD volume. After the steep decline, ETH is moving sideways near $1,622, suggesting a pause in selling rather than a confirmed trend reversal. I’m watching whether buyers can reclaim nearby resistance or sellers resume control.
My Trading Plan
I’m not rushing into a long position here. I’m watching $1,608–$1,615 for signs of support, with the recent low at $1,577.70 as the key level bulls need to defend. I’d consider a cautious entry only after a confirmed bounce and a reclaim of nearby resistance.
If ETH breaks above $1,647, the recovery could gain traction toward $1,687. On the downside, a breakdown below $1,608 would weaken the current consolidation, while losing $1,577.70 would invalidate my immediate bullish recovery idea.
For shorts, I’d prefer a clear rejection near $1,647 or a confirmed breakdown below support rather than entering after an already extended decline. Any position needs a defined invalidation level and controlled risk.
ETH is at a critical decision point. I’m watching whether $1,608 holds and buyers can reclaim $1,647. Until the chart confirms a direction, patience matters more than chasing a move.
Ethereum is trading at $1,622.15, down 6.36% in 24 hours, after a sharp sell-off on the 15-minute chart. Price dropped from the $1,757 area to a low of $1,577.70 before recovering and consolidating around $1,622. Buyers are attempting to stabilize the market, but the short-term structure remains bearish until stronger recovery signals appear.
24-hour trading volume stands at 79.89M contracts, worth approximately $798.88M in USD volume. After the steep decline, ETH is moving sideways near $1,622, suggesting a pause in selling rather than a confirmed trend reversal. I’m watching whether buyers can reclaim nearby resistance or sellers resume control.
My Trading Plan
I’m not rushing into a long position here. I’m watching $1,608–$1,615 for signs of support, with the recent low at $1,577.70 as the key level bulls need to defend. I’d consider a cautious entry only after a confirmed bounce and a reclaim of nearby resistance.
If ETH breaks above $1,647, the recovery could gain traction toward $1,687. On the downside, a breakdown below $1,608 would weaken the current consolidation, while losing $1,577.70 would invalidate my immediate bullish recovery idea.
For shorts, I’d prefer a clear rejection near $1,647 or a confirmed breakdown below support rather than entering after an already extended decline. Any position needs a defined invalidation level and controlled risk.
ETH is at a critical decision point. I’m watching whether $1,608 holds and buyers can reclaim $1,647. Until the chart confirms a direction, patience matters more than chasing a move.
722
·
--
Рост
$SOXLB CRASHES 21% — CAN BUYERS DEFEND $29.86?
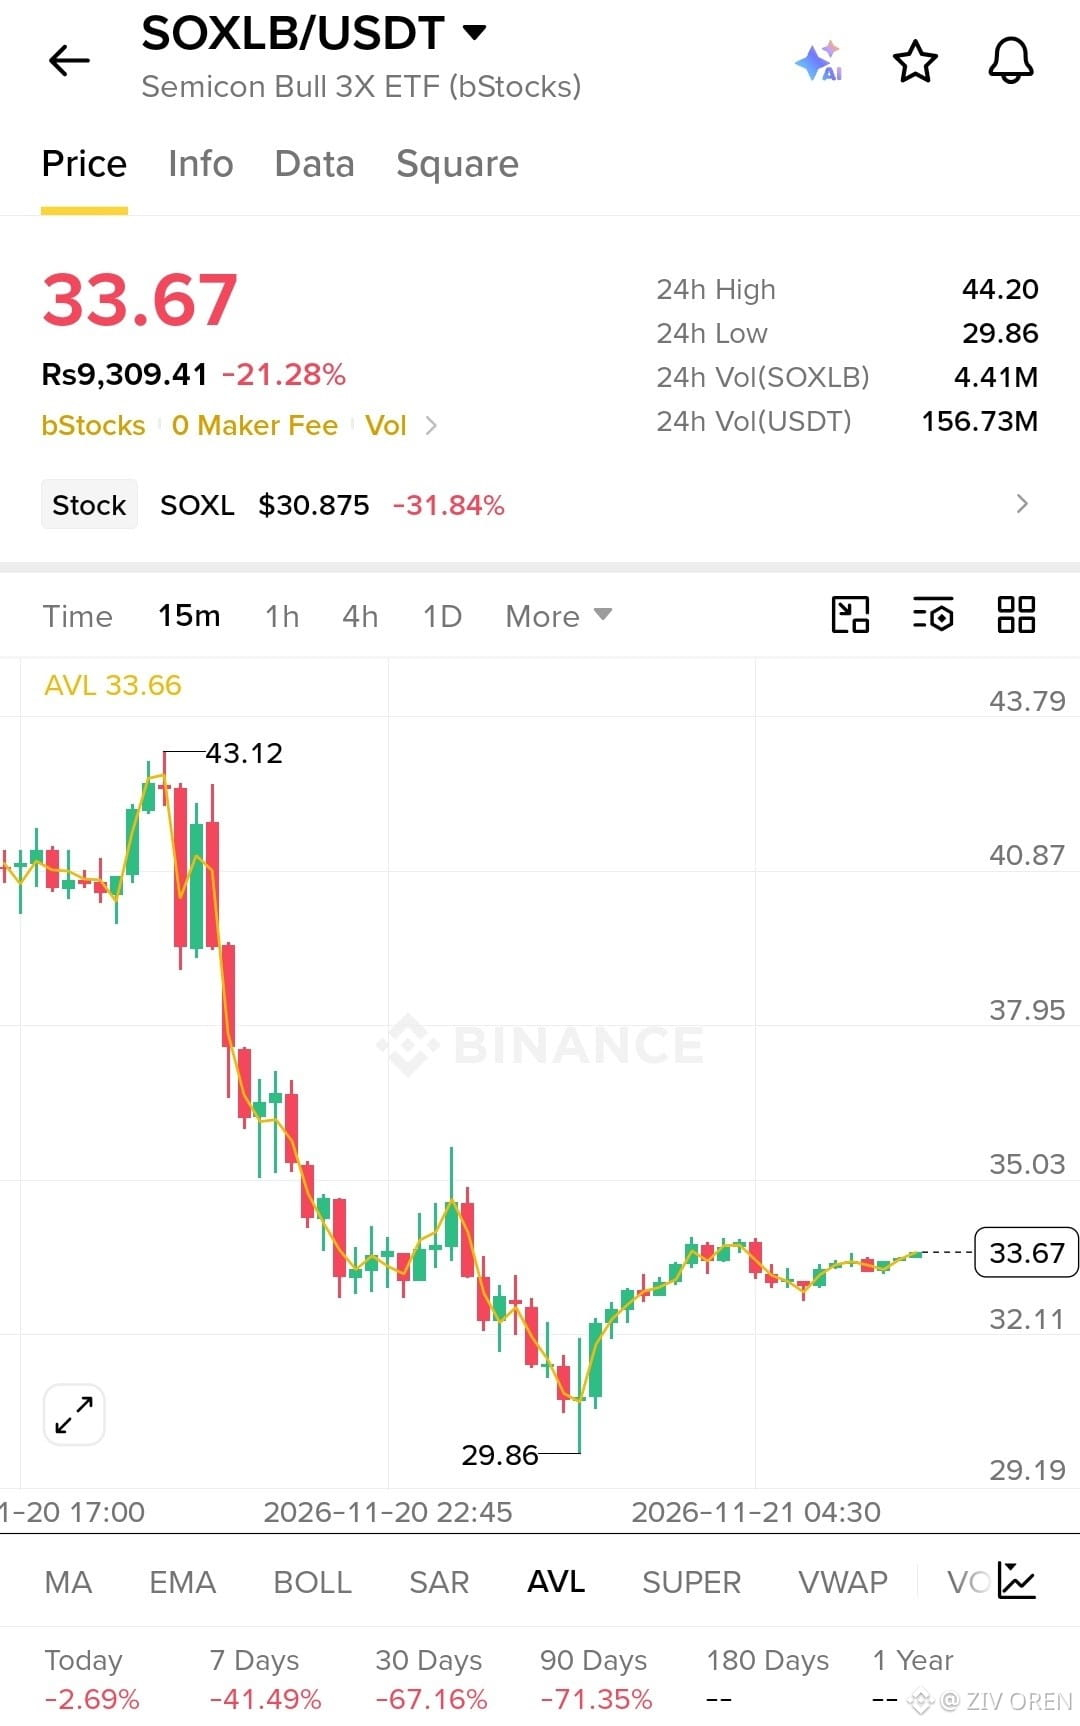
SOXLB is trading at $33.67, down 21.28% in 24 hours, after a sharp sell-off on the 15-minute chart. Price plunged from the $43.12 area to a low of $29.86 before recovering toward $33.67. Buyers have stepped in, but the rebound still needs confirmation before I consider the trend bullish.
24-hour trading volume stands at 4.41M SOXLB, worth 156.73M USDT. The underlying SOXL stock is down 31.84% at $30.875, highlighting the intense volatility across this leveraged semiconductor ETF product. Despite the recovery from the low, SOXLB remains under significant pressure.
My Trading Plan
I’m watching $32.10–$32.50 for potential support, but I want to see buyers defend the zone before considering an entry. If price holds and reclaims $34.00–$35.00, that could strengthen the recovery setup. My preferred DCA area would be near $30.00–$30.50 only if price stabilizes and confirms a bullish reaction.
The key support remains $29.86. A decisive break below it would invalidate my immediate recovery idea. On the upside, $35.03 is the first major resistance zone, followed by $37.95. I’m not assuming these targets will be reached without sustained buying pressure.
One important point: SOXLB is a 3× leveraged bull ETF. Its performance depends on the underlying SOXL product and its leverage mechanics, so sharp moves and volatility can make risk management especially important.
I’m watching whether SOXLB can hold above $32 and reclaim $35. Until buyers prove they can sustain the rebound, capital protection comes first.
$SOXLB CRASHES 21% — CAN BUYERS DEFEND $29.86?
SOXLB is trading at $33.67, down 21.28% in 24 hours, after a sharp sell-off on the 15-minute chart. Price plunged from the $43.12 area to a low of $29.86 before recovering toward $33.67. Buyers have stepped in, but the rebound still needs confirmation before I consider the trend bullish.
24-hour trading volume stands at 4.41M SOXLB, worth 156.73M USDT. The underlying SOXL stock is down 31.84% at $30.875, highlighting the intense volatility across this leveraged semiconductor ETF product. Despite the recovery from the low, SOXLB remains under significant pressure.
My Trading Plan
I’m watching $32.10–$32.50 for potential support, but I want to see buyers defend the zone before considering an entry. If price holds and reclaims $34.00–$35.00, that could strengthen the recovery setup. My preferred DCA area would be near $30.00–$30.50 only if price stabilizes and confirms a bullish reaction.
The key support remains $29.86. A decisive break below it would invalidate my immediate recovery idea. On the upside, $35.03 is the first major resistance zone, followed by $37.95. I’m not assuming these targets will be reached without sustained buying pressure.
One important point: SOXLB is a 3× leveraged bull ETF. Its performance depends on the underlying SOXL product and its leverage mechanics, so sharp moves and volatility can make risk management especially important.
I’m watching whether SOXLB can hold above $32 and reclaim $35. Until buyers prove they can sustain the rebound, capital protection comes first.
SOXLB is trading at $33.67, down 21.28% in 24 hours, after a sharp sell-off on the 15-minute chart. Price plunged from the $43.12 area to a low of $29.86 before recovering toward $33.67. Buyers have stepped in, but the rebound still needs confirmation before I consider the trend bullish.
24-hour trading volume stands at 4.41M SOXLB, worth 156.73M USDT. The underlying SOXL stock is down 31.84% at $30.875, highlighting the intense volatility across this leveraged semiconductor ETF product. Despite the recovery from the low, SOXLB remains under significant pressure.
My Trading Plan
I’m watching $32.10–$32.50 for potential support, but I want to see buyers defend the zone before considering an entry. If price holds and reclaims $34.00–$35.00, that could strengthen the recovery setup. My preferred DCA area would be near $30.00–$30.50 only if price stabilizes and confirms a bullish reaction.
The key support remains $29.86. A decisive break below it would invalidate my immediate recovery idea. On the upside, $35.03 is the first major resistance zone, followed by $37.95. I’m not assuming these targets will be reached without sustained buying pressure.
One important point: SOXLB is a 3× leveraged bull ETF. Its performance depends on the underlying SOXL product and its leverage mechanics, so sharp moves and volatility can make risk management especially important.
I’m watching whether SOXLB can hold above $32 and reclaim $35. Until buyers prove they can sustain the rebound, capital protection comes first.
337
·
--
Рост
$KERNEL HOLDS $0.0469 — CAN BULLS RECLAIM $0.0517?
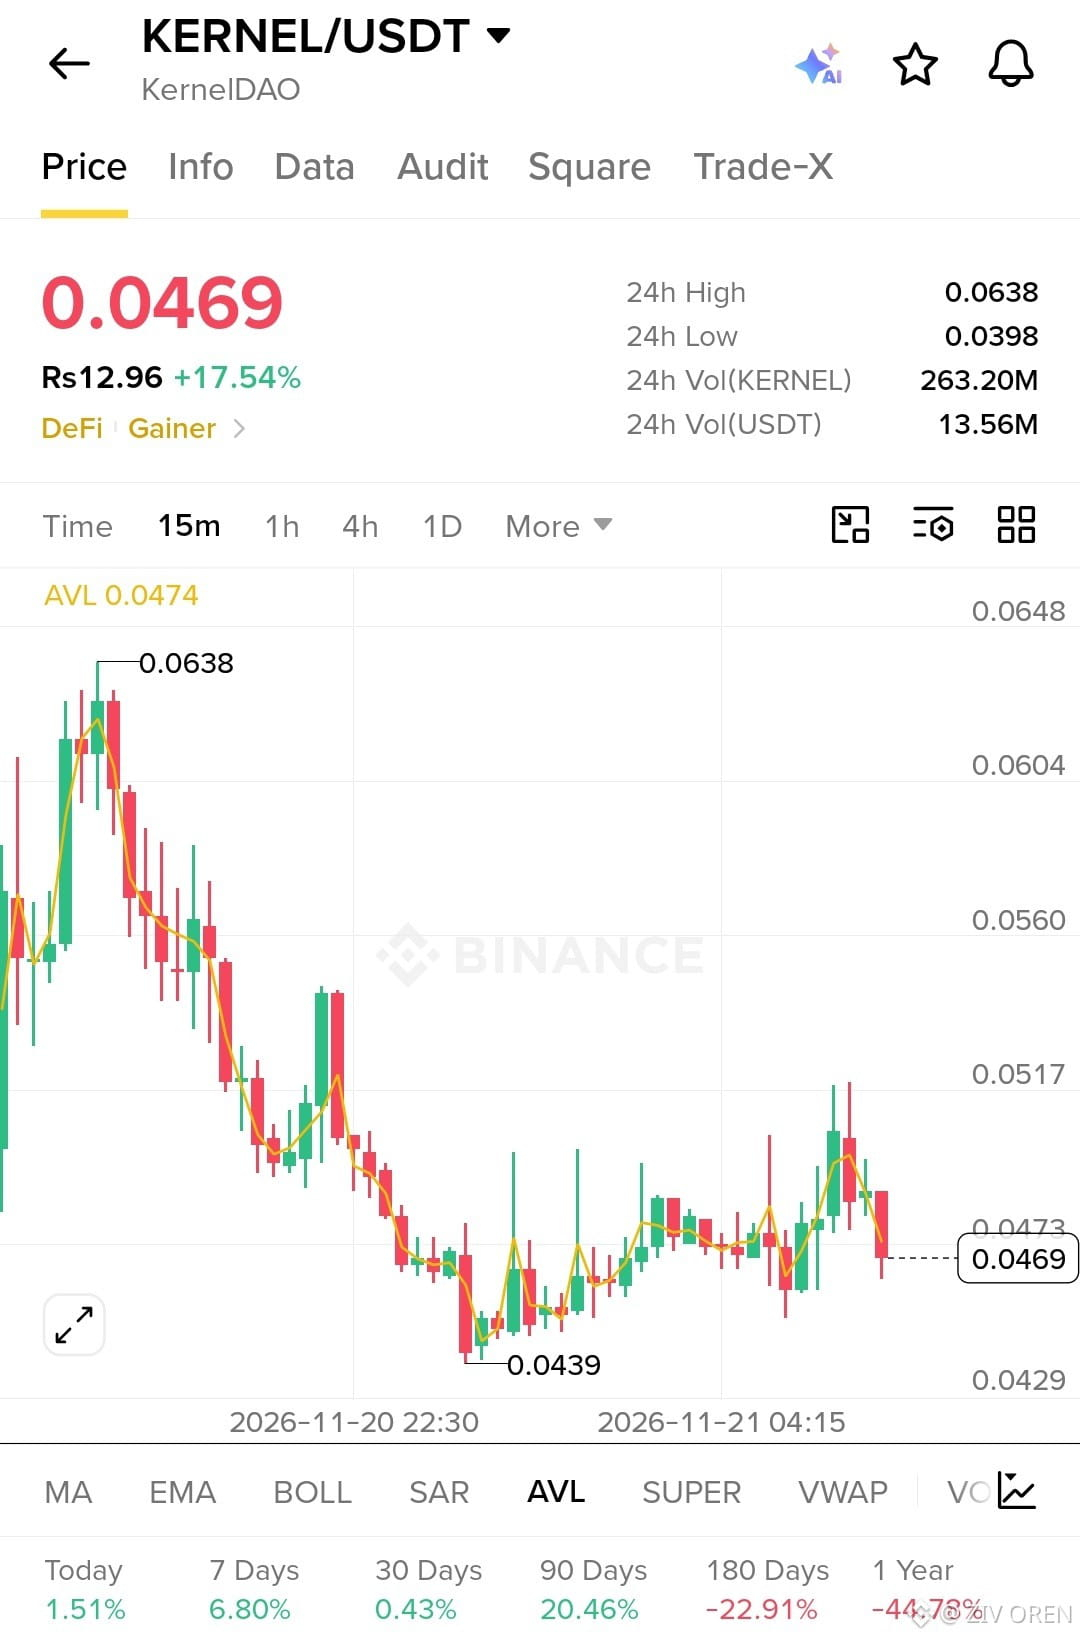
KERNEL is trading at $0.0469, up 17.54% in 24 hours, but the 15-minute chart shows buyers struggling to maintain the recent recovery. After falling from $0.0638 to a low of $0.0439, price rebounded toward $0.0500 before facing renewed selling pressure.
24-hour trading volume stands at 263.20M KERNEL, worth 13.56M USDT. Activity remains substantial, but the latest rejection near $0.0517 shows that buyers need stronger follow-through to regain control. Despite today's gains, the broader chart structure still reflects a significant decline from the recent high.
My Trading Plan
I’m watching $0.0460–$0.0470 for a potential entry, provided buyers defend the zone and confirm a bounce. My preferred DCA area is $0.0440–$0.0450, close to the recent swing low, but I would only add if support holds.
For bullish confirmation, I want to see KERNEL reclaim $0.0473, followed by a move through $0.0485–$0.0490. A sustained breakout above $0.0517 could open the way toward $0.0540. On the downside, losing $0.0439 would invalidate my immediate recovery setup.
KERNEL has posted a strong daily gain, but I’m not chasing green candles. The key is whether buyers can defend support and turn $0.0517 into the next breakout target. Confirmation first, entry second.
$KERNEL HOLDS $0.0469 — CAN BULLS RECLAIM $0.0517?
KERNEL is trading at $0.0469, up 17.54% in 24 hours, but the 15-minute chart shows buyers struggling to maintain the recent recovery. After falling from $0.0638 to a low of $0.0439, price rebounded toward $0.0500 before facing renewed selling pressure.
24-hour trading volume stands at 263.20M KERNEL, worth 13.56M USDT. Activity remains substantial, but the latest rejection near $0.0517 shows that buyers need stronger follow-through to regain control. Despite today's gains, the broader chart structure still reflects a significant decline from the recent high.
My Trading Plan
I’m watching $0.0460–$0.0470 for a potential entry, provided buyers defend the zone and confirm a bounce. My preferred DCA area is $0.0440–$0.0450, close to the recent swing low, but I would only add if support holds.
For bullish confirmation, I want to see KERNEL reclaim $0.0473, followed by a move through $0.0485–$0.0490. A sustained breakout above $0.0517 could open the way toward $0.0540. On the downside, losing $0.0439 would invalidate my immediate recovery setup.
KERNEL has posted a strong daily gain, but I’m not chasing green candles. The key is whether buyers can defend support and turn $0.0517 into the next breakout target. Confirmation first, entry second.
KERNEL is trading at $0.0469, up 17.54% in 24 hours, but the 15-minute chart shows buyers struggling to maintain the recent recovery. After falling from $0.0638 to a low of $0.0439, price rebounded toward $0.0500 before facing renewed selling pressure.
24-hour trading volume stands at 263.20M KERNEL, worth 13.56M USDT. Activity remains substantial, but the latest rejection near $0.0517 shows that buyers need stronger follow-through to regain control. Despite today's gains, the broader chart structure still reflects a significant decline from the recent high.
My Trading Plan
I’m watching $0.0460–$0.0470 for a potential entry, provided buyers defend the zone and confirm a bounce. My preferred DCA area is $0.0440–$0.0450, close to the recent swing low, but I would only add if support holds.
For bullish confirmation, I want to see KERNEL reclaim $0.0473, followed by a move through $0.0485–$0.0490. A sustained breakout above $0.0517 could open the way toward $0.0540. On the downside, losing $0.0439 would invalidate my immediate recovery setup.
KERNEL has posted a strong daily gain, but I’m not chasing green candles. The key is whether buyers can defend support and turn $0.0517 into the next breakout target. Confirmation first, entry second.
79
·
--
Рост
$SKDDB JUMPS 21% — IS THE RALLY LOSING STEAM?
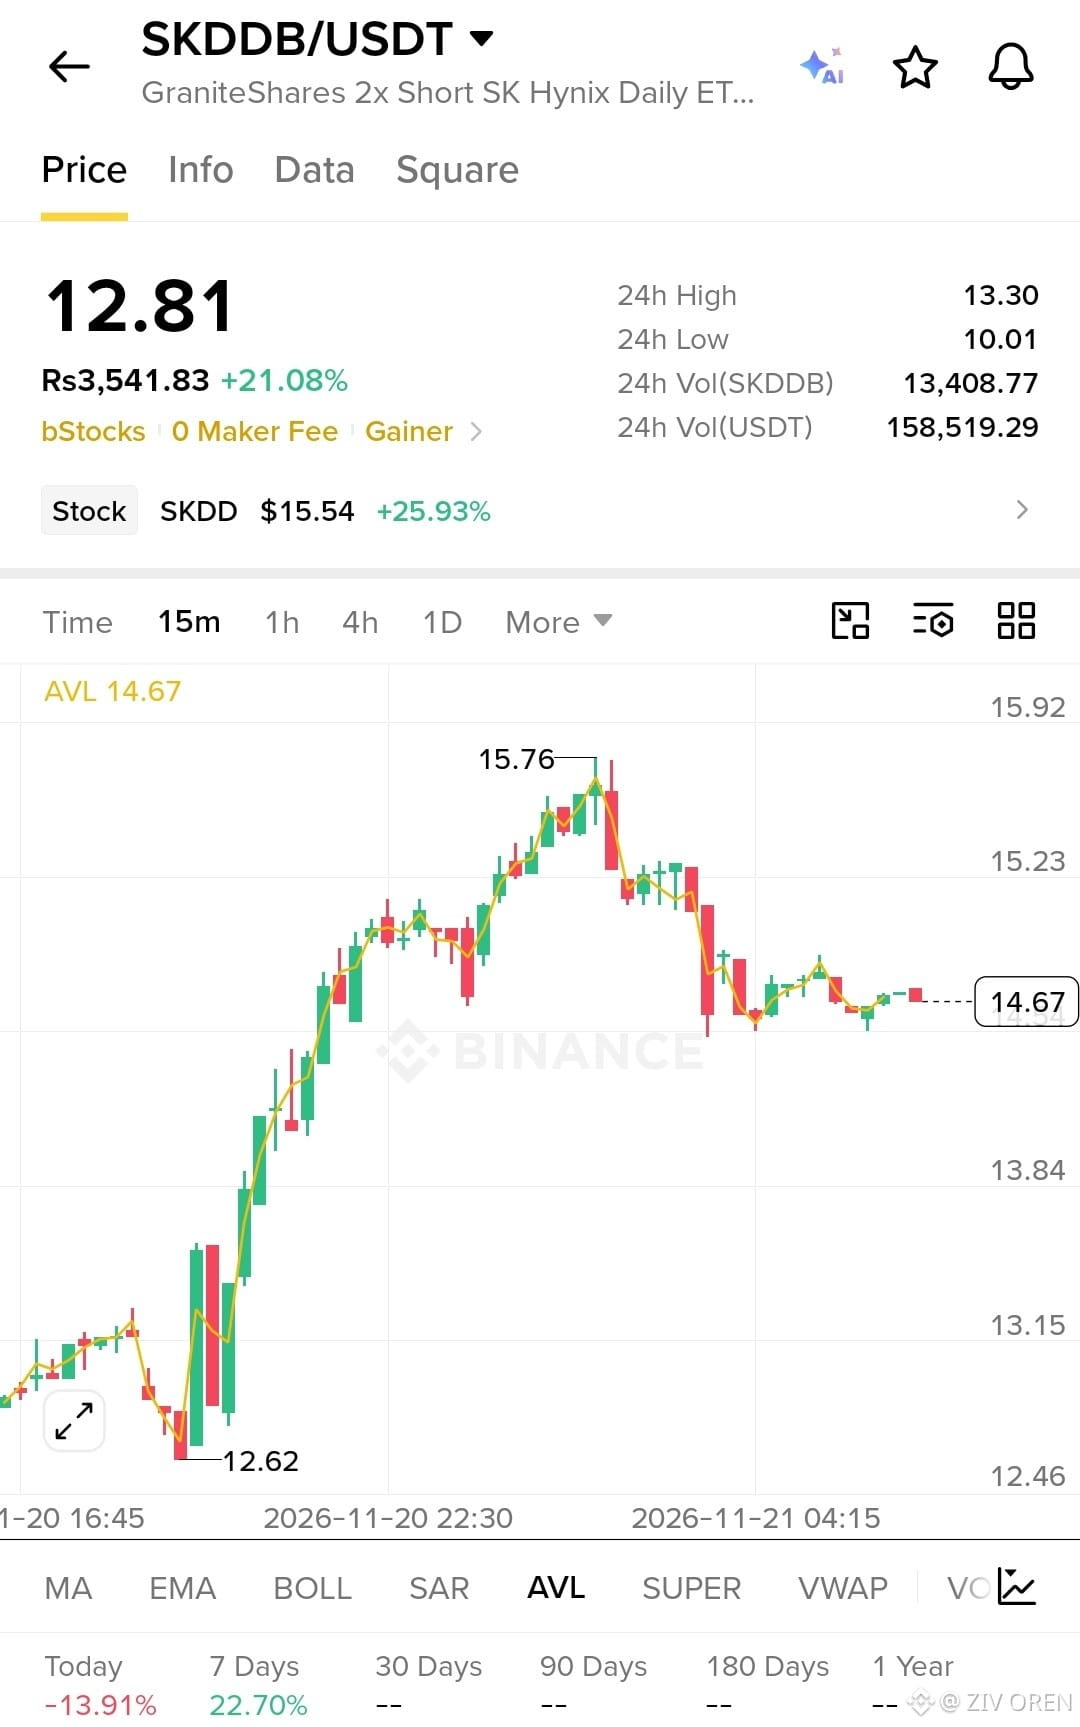
SKDDB is trading at $12.81, up 21.08% in 24 hours, but the 15-minute chart shows a pullback after a strong rally. Price climbed from $12.62 to a peak of $15.76 before retreating toward the $14.67 area shown on the chart. I’m watching whether buyers can regain control or if the rally continues to unwind.
24-hour trading volume stands at 13,408.77 SKDDB, worth 158,519.29 USDT. The underlying SK Hynix stock is shown at $15.54, up 25.93%. SKDDB represents a 2× short SK Hynix daily ETF product, so its performance depends on the underlying stock’s daily movement and leverage mechanics. The recent rise in SKDDB alongside a gain in the underlying stock makes it especially important to understand the product’s structure before trading.
My Trading Plan
I’m not chasing the move at current levels. I’m watching the $14.60–$14.70 zone for stabilization, but I want confirmation that buyers can hold this area before considering an entry.
If price recovers above $15.00, I’ll watch for a possible move toward $15.23 and the previous high near $15.76. If $14.60 fails, the next visible support area is around $13.84. A break below that zone would weaken the recovery setup, with $12.62 marking the earlier swing low.
Because this is a leveraged inverse stock product, I’d be particularly cautious about holding it based on a simple chart pattern or assuming it will move exactly twice the opposite of the stock over longer periods.
My focus now is on whether SKDDB can stabilize and reclaim resistance. I want confirmation, controlled risk, and a clear setup before making a move.
$SKDDB JUMPS 21% — IS THE RALLY LOSING STEAM?
SKDDB is trading at $12.81, up 21.08% in 24 hours, but the 15-minute chart shows a pullback after a strong rally. Price climbed from $12.62 to a peak of $15.76 before retreating toward the $14.67 area shown on the chart. I’m watching whether buyers can regain control or if the rally continues to unwind.
24-hour trading volume stands at 13,408.77 SKDDB, worth 158,519.29 USDT. The underlying SK Hynix stock is shown at $15.54, up 25.93%. SKDDB represents a 2× short SK Hynix daily ETF product, so its performance depends on the underlying stock’s daily movement and leverage mechanics. The recent rise in SKDDB alongside a gain in the underlying stock makes it especially important to understand the product’s structure before trading.
My Trading Plan
I’m not chasing the move at current levels. I’m watching the $14.60–$14.70 zone for stabilization, but I want confirmation that buyers can hold this area before considering an entry.
If price recovers above $15.00, I’ll watch for a possible move toward $15.23 and the previous high near $15.76. If $14.60 fails, the next visible support area is around $13.84. A break below that zone would weaken the recovery setup, with $12.62 marking the earlier swing low.
Because this is a leveraged inverse stock product, I’d be particularly cautious about holding it based on a simple chart pattern or assuming it will move exactly twice the opposite of the stock over longer periods.
My focus now is on whether SKDDB can stabilize and reclaim resistance. I want confirmation, controlled risk, and a clear setup before making a move.
SKDDB is trading at $12.81, up 21.08% in 24 hours, but the 15-minute chart shows a pullback after a strong rally. Price climbed from $12.62 to a peak of $15.76 before retreating toward the $14.67 area shown on the chart. I’m watching whether buyers can regain control or if the rally continues to unwind.
24-hour trading volume stands at 13,408.77 SKDDB, worth 158,519.29 USDT. The underlying SK Hynix stock is shown at $15.54, up 25.93%. SKDDB represents a 2× short SK Hynix daily ETF product, so its performance depends on the underlying stock’s daily movement and leverage mechanics. The recent rise in SKDDB alongside a gain in the underlying stock makes it especially important to understand the product’s structure before trading.
My Trading Plan
I’m not chasing the move at current levels. I’m watching the $14.60–$14.70 zone for stabilization, but I want confirmation that buyers can hold this area before considering an entry.
If price recovers above $15.00, I’ll watch for a possible move toward $15.23 and the previous high near $15.76. If $14.60 fails, the next visible support area is around $13.84. A break below that zone would weaken the recovery setup, with $12.62 marking the earlier swing low.
Because this is a leveraged inverse stock product, I’d be particularly cautious about holding it based on a simple chart pattern or assuming it will move exactly twice the opposite of the stock over longer periods.
My focus now is on whether SKDDB can stabilize and reclaim resistance. I want confirmation, controlled risk, and a clear setup before making a move.
184
·
--
Рост
$KERNEL SURGES 18% — CAN BULLS RECLAIM $0.0517?
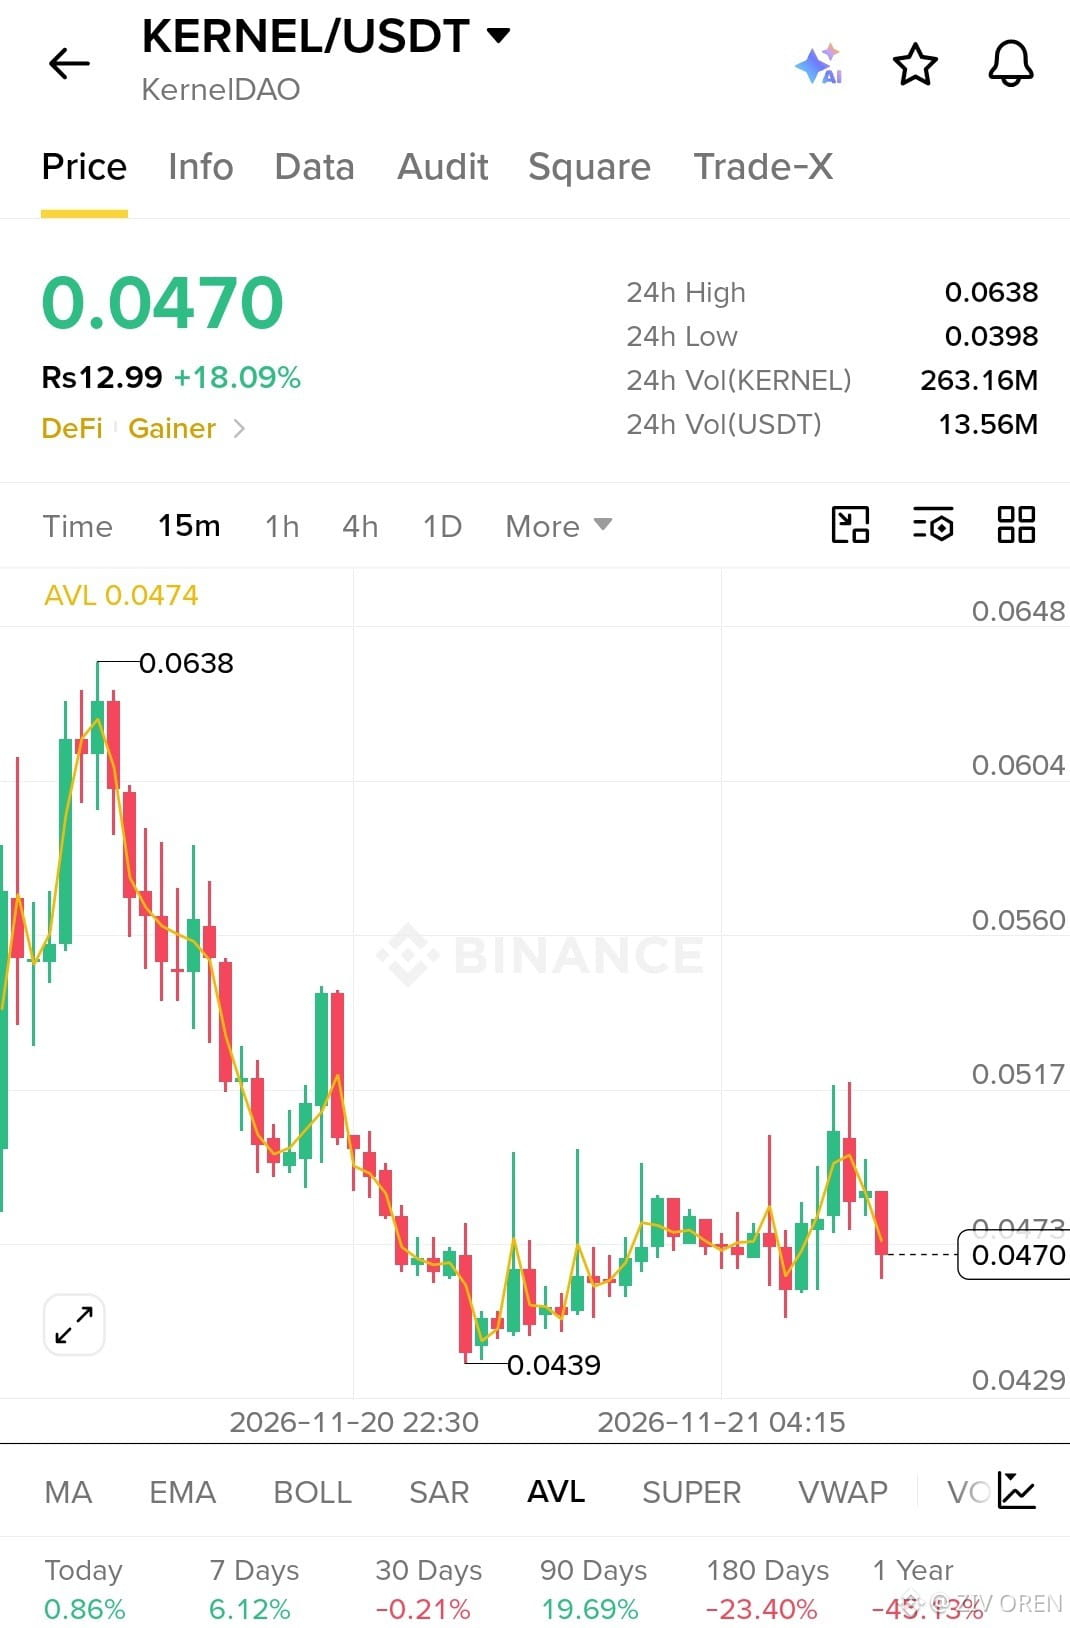
KERNEL is trading at $0.0470, up 18.09% in 24 hours, but I’m watching the structure carefully before getting too bullish. On the 15-minute chart, price has recovered from the $0.0439 low after a prolonged decline from $0.0638. Buyers have stepped in, but the latest rejection near $0.0500–$0.0517 shows that sellers are still active.
24-hour trading volume has reached 263.16M KERNEL, worth 13.56M USDT. That indicates substantial trading activity, although the screenshot doesn't show a volume-change percentage. Despite the daily gain, KERNEL is still trading well below its recent high, so I want confirmation that this recovery can develop into a sustained trend reversal.
My Trading Plan
I’m watching $0.0460–$0.0470 for a potential entry if price stabilizes and buyers defend the zone. My preferred DCA area is $0.0440–$0.0450, close to the recent swing low, but I would only consider adding if support holds and a bullish reaction appears.
For confirmation, I want KERNEL to reclaim $0.0473 and push through $0.0485–$0.0490 with sustained buying pressure. The next major resistance is around $0.0517. A clean breakout above that level could open the way toward $0.0540, while failure to hold $0.0439 would invalidate my immediate bullish recovery setup.
KERNEL has momentum, but momentum alone isn't enough. I’m watching whether buyers can turn $0.0470 into support and challenge $0.0517 next. No chasing — confirmation comes first.
$KERNEL SURGES 18% — CAN BULLS RECLAIM $0.0517?
KERNEL is trading at $0.0470, up 18.09% in 24 hours, but I’m watching the structure carefully before getting too bullish. On the 15-minute chart, price has recovered from the $0.0439 low after a prolonged decline from $0.0638. Buyers have stepped in, but the latest rejection near $0.0500–$0.0517 shows that sellers are still active.
24-hour trading volume has reached 263.16M KERNEL, worth 13.56M USDT. That indicates substantial trading activity, although the screenshot doesn't show a volume-change percentage. Despite the daily gain, KERNEL is still trading well below its recent high, so I want confirmation that this recovery can develop into a sustained trend reversal.
My Trading Plan
I’m watching $0.0460–$0.0470 for a potential entry if price stabilizes and buyers defend the zone. My preferred DCA area is $0.0440–$0.0450, close to the recent swing low, but I would only consider adding if support holds and a bullish reaction appears.
For confirmation, I want KERNEL to reclaim $0.0473 and push through $0.0485–$0.0490 with sustained buying pressure. The next major resistance is around $0.0517. A clean breakout above that level could open the way toward $0.0540, while failure to hold $0.0439 would invalidate my immediate bullish recovery setup.
KERNEL has momentum, but momentum alone isn't enough. I’m watching whether buyers can turn $0.0470 into support and challenge $0.0517 next. No chasing — confirmation comes first.
KERNEL is trading at $0.0470, up 18.09% in 24 hours, but I’m watching the structure carefully before getting too bullish. On the 15-minute chart, price has recovered from the $0.0439 low after a prolonged decline from $0.0638. Buyers have stepped in, but the latest rejection near $0.0500–$0.0517 shows that sellers are still active.
24-hour trading volume has reached 263.16M KERNEL, worth 13.56M USDT. That indicates substantial trading activity, although the screenshot doesn't show a volume-change percentage. Despite the daily gain, KERNEL is still trading well below its recent high, so I want confirmation that this recovery can develop into a sustained trend reversal.
My Trading Plan
I’m watching $0.0460–$0.0470 for a potential entry if price stabilizes and buyers defend the zone. My preferred DCA area is $0.0440–$0.0450, close to the recent swing low, but I would only consider adding if support holds and a bullish reaction appears.
For confirmation, I want KERNEL to reclaim $0.0473 and push through $0.0485–$0.0490 with sustained buying pressure. The next major resistance is around $0.0517. A clean breakout above that level could open the way toward $0.0540, while failure to hold $0.0439 would invalidate my immediate bullish recovery setup.
KERNEL has momentum, but momentum alone isn't enough. I’m watching whether buyers can turn $0.0470 into support and challenge $0.0517 next. No chasing — confirmation comes first.
250
·
--
Рост
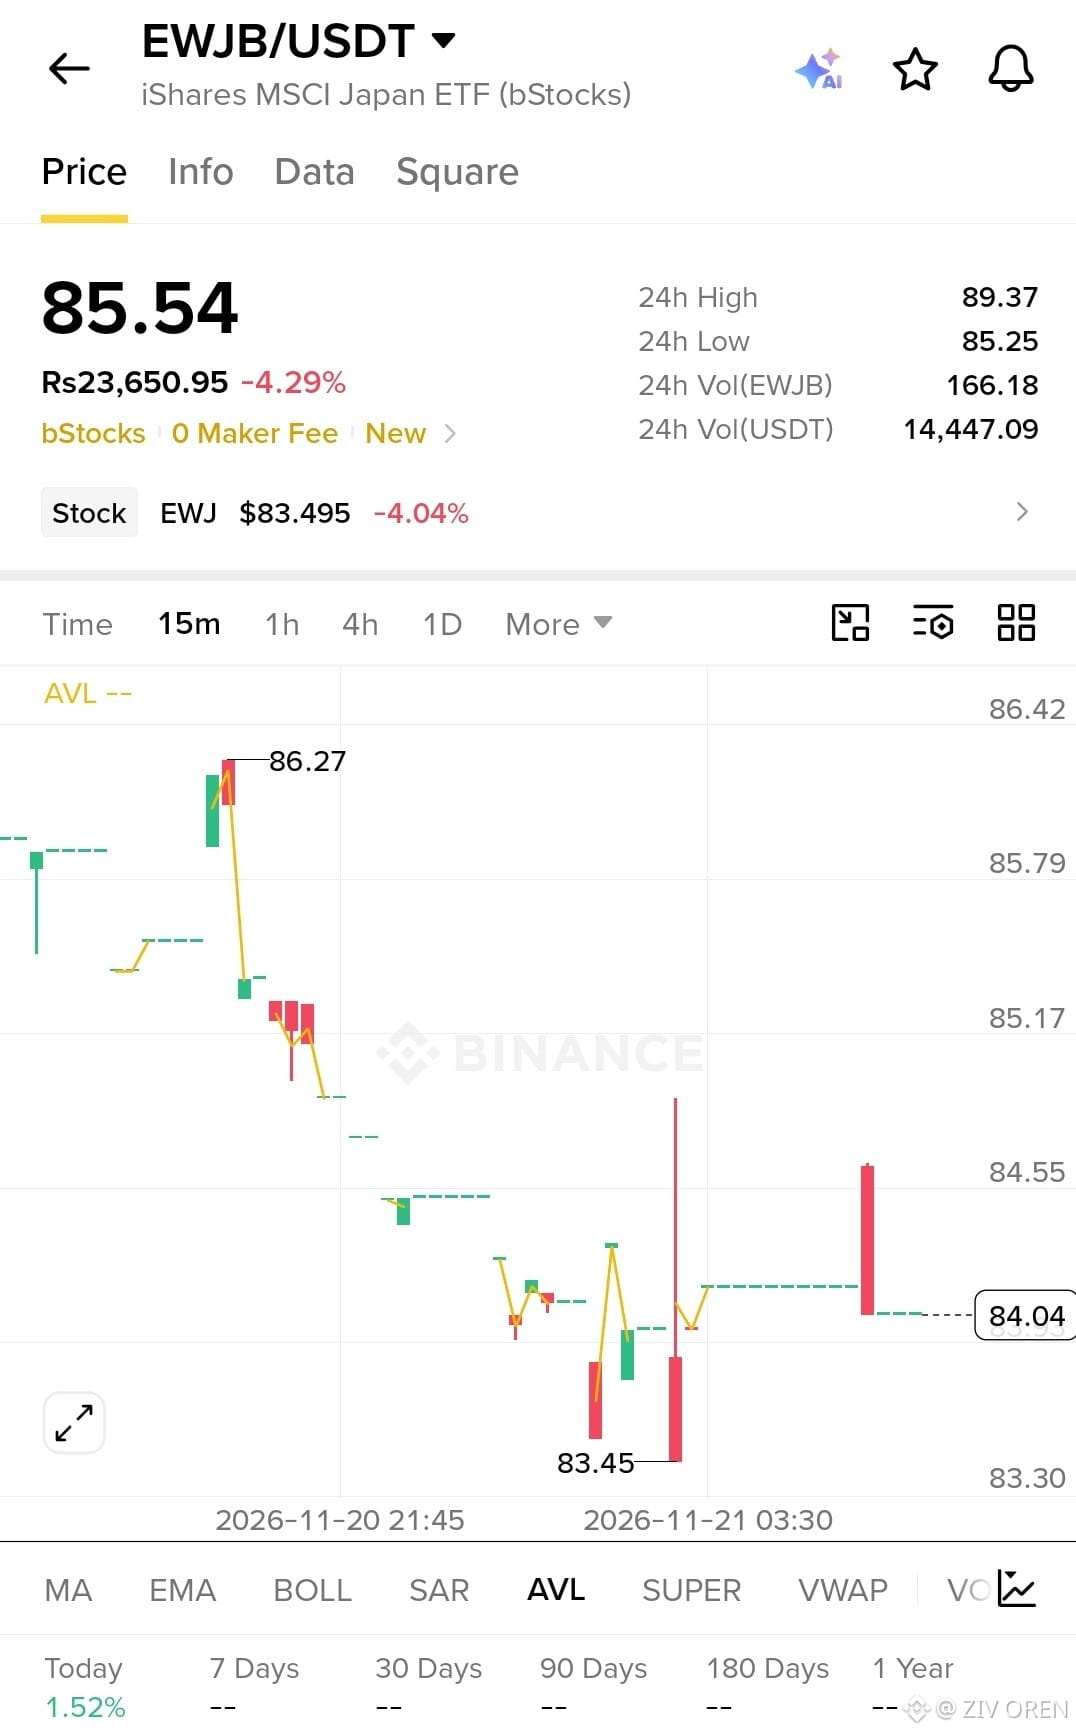
$EWJB FACES SELLING PRESSURE — CAN BUYERS DEFEND $83.45?
EWJB is trading at $85.54, down 4.29%, with the 15-minute chart showing a clear short-term bearish structure. Price has dropped sharply from the $86.27 area and recently touched $83.45 before attempting a recovery. I’m watching whether buyers can stabilize the price or if sellers push it toward another low.
The 24-hour trading volume stands at 166.18 EWJB, worth approximately 14,447.09 USDT. Price remains under pressure, and the recent rebound has not yet confirmed a bullish reversal. EWJB tracks the iShares MSCI Japan ETF through Binance’s bStocks product, so the underlying stock-market movement may also influence its price.
My Trading Plan
I’m not rushing into a buy while the short-term structure remains weak. I’m watching the $85.15–$85.55 area for a potential reclaim and stronger buying confirmation. If price recovers this zone and holds it, I’ll consider a cautious entry.
For DCA, I’m monitoring $84.00–$84.20, with the recent low at $83.45 as the key support to defend. A breakdown below $83.45 would invalidate my immediate bullish recovery idea. On the upside, resistance sits around $85.17, followed by $85.79 and $86.27.
A sustained move above $85.55 would improve the recovery setup, while continued rejection could expose lower support again. These are chart-based levels, not guaranteed outcomes.
$EWJB FACES SELLING PRESSURE — CAN BUYERS DEFEND $83.45?
EWJB is trading at $85.54, down 4.29%, with the 15-minute chart showing a clear short-term bearish structure. Price has dropped sharply from the $86.27 area and recently touched $83.45 before attempting a recovery. I’m watching whether buyers can stabilize the price or if sellers push it toward another low.
The 24-hour trading volume stands at 166.18 EWJB, worth approximately 14,447.09 USDT. Price remains under pressure, and the recent rebound has not yet confirmed a bullish reversal. EWJB tracks the iShares MSCI Japan ETF through Binance’s bStocks product, so the underlying stock-market movement may also influence its price.
My Trading Plan
I’m not rushing into a buy while the short-term structure remains weak. I’m watching the $85.15–$85.55 area for a potential reclaim and stronger buying confirmation. If price recovers this zone and holds it, I’ll consider a cautious entry.
For DCA, I’m monitoring $84.00–$84.20, with the recent low at $83.45 as the key support to defend. A breakdown below $83.45 would invalidate my immediate bullish recovery idea. On the upside, resistance sits around $85.17, followed by $85.79 and $86.27.
A sustained move above $85.55 would improve the recovery setup, while continued rejection could expose lower support again. These are chart-based levels, not guaranteed outcomes.
EWJB is trading at $85.54, down 4.29%, with the 15-minute chart showing a clear short-term bearish structure. Price has dropped sharply from the $86.27 area and recently touched $83.45 before attempting a recovery. I’m watching whether buyers can stabilize the price or if sellers push it toward another low.
The 24-hour trading volume stands at 166.18 EWJB, worth approximately 14,447.09 USDT. Price remains under pressure, and the recent rebound has not yet confirmed a bullish reversal. EWJB tracks the iShares MSCI Japan ETF through Binance’s bStocks product, so the underlying stock-market movement may also influence its price.
My Trading Plan
I’m not rushing into a buy while the short-term structure remains weak. I’m watching the $85.15–$85.55 area for a potential reclaim and stronger buying confirmation. If price recovers this zone and holds it, I’ll consider a cautious entry.
For DCA, I’m monitoring $84.00–$84.20, with the recent low at $83.45 as the key support to defend. A breakdown below $83.45 would invalidate my immediate bullish recovery idea. On the upside, resistance sits around $85.17, followed by $85.79 and $86.27.
A sustained move above $85.55 would improve the recovery setup, while continued rejection could expose lower support again. These are chart-based levels, not guaranteed outcomes.
147
·
--
Рост
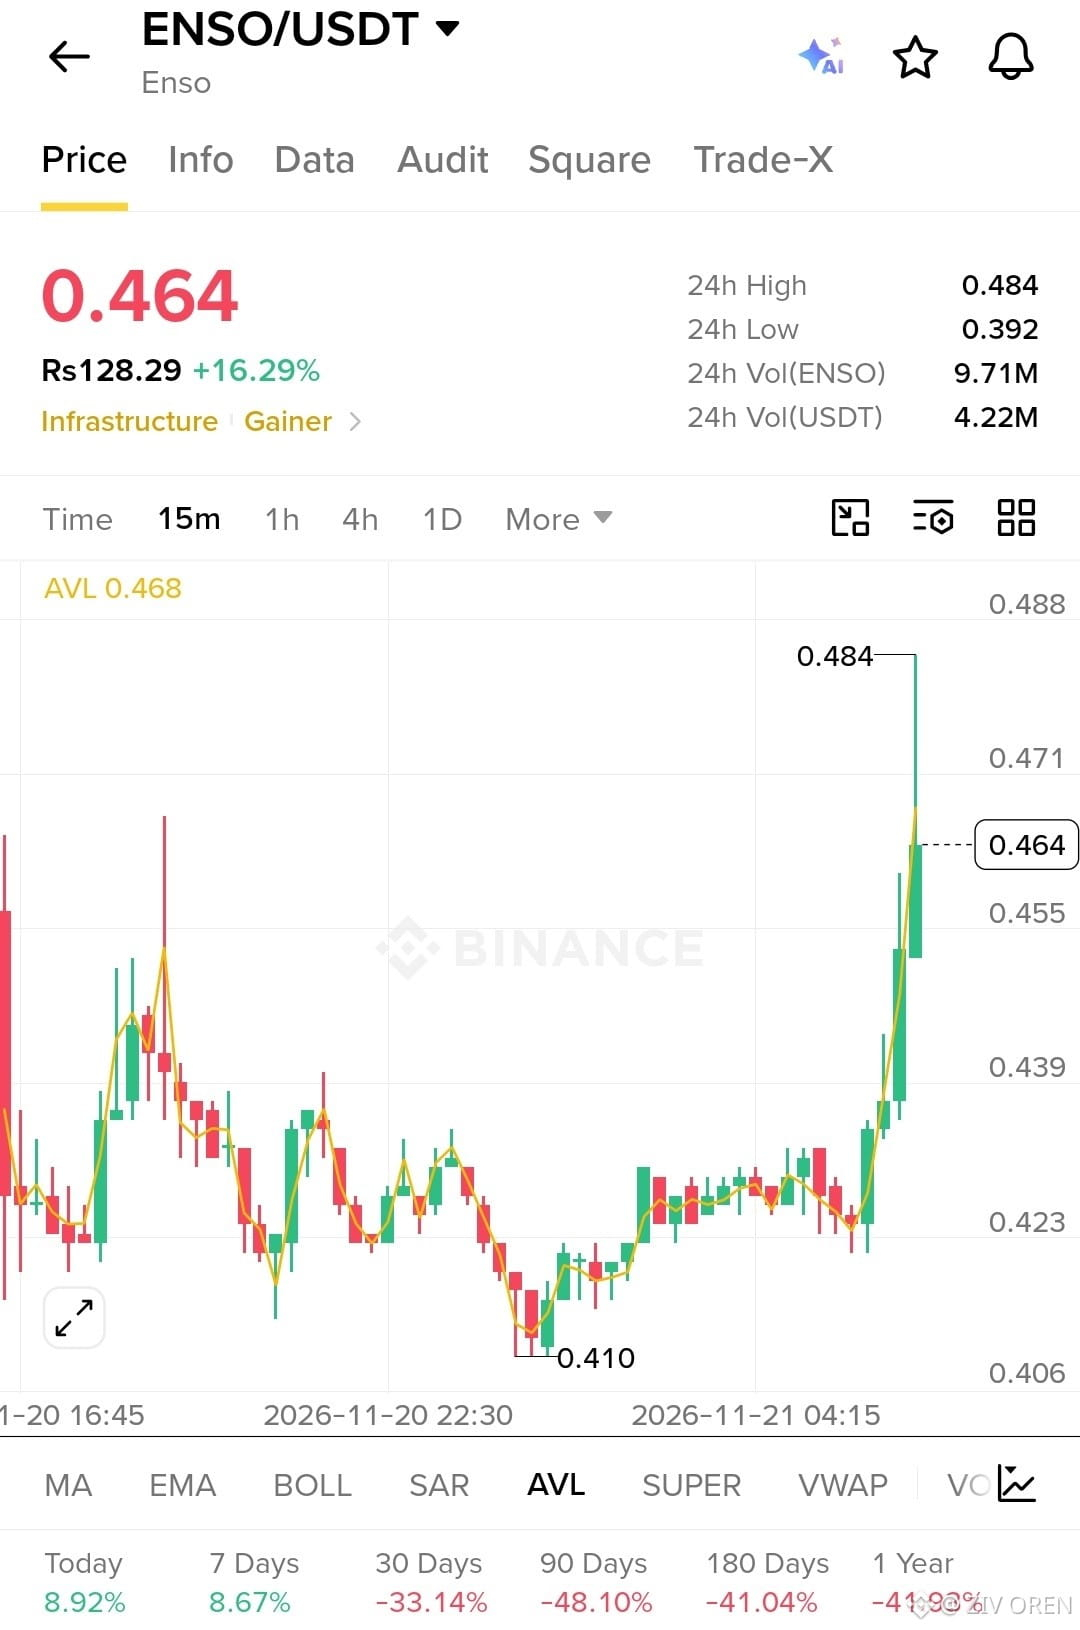
$ENSO IS EXPLODING — CAN BULLS BREAK $0.484?
ENSO is trading at $0.464, up 16.29% in 24 hours, with strong bullish momentum on the 15-minute chart. Price has surged from the $0.410 low and broken above the $0.439 resistance zone. Now, I’m watching whether buyers can push through $0.484 or if profit-taking starts to kick in.
24-hour trading volume stands at 9.71M ENSO ($4.22M in USDT volume). The sharp rally shows increased market activity, but I want to see whether buyers can sustain this momentum rather than chase a sudden spike.
My Trading Plan
I’m watching $0.450–$0.455 for a potential pullback entry, with additional DCA interest around $0.439–$0.445 if support holds. I’d prefer a confirmed bounce or consolidation before entering rather than buying directly into resistance.
A strong breakout above $0.484 with sustained volume could open the way toward $0.500, while rejection may bring price back toward $0.455 and $0.439. A breakdown below $0.439 would weaken my bullish setup, with $0.423 as the next key support to watch.
ENSO has momentum, but the next move matters more than the current green candle. I’m watching $0.484 for breakout confirmation and how price reacts on any pullback. No chasing — I want confirmation before committing.
$ENSO IS EXPLODING — CAN BULLS BREAK $0.484?
ENSO is trading at $0.464, up 16.29% in 24 hours, with strong bullish momentum on the 15-minute chart. Price has surged from the $0.410 low and broken above the $0.439 resistance zone. Now, I’m watching whether buyers can push through $0.484 or if profit-taking starts to kick in.
24-hour trading volume stands at 9.71M ENSO ($4.22M in USDT volume). The sharp rally shows increased market activity, but I want to see whether buyers can sustain this momentum rather than chase a sudden spike.
My Trading Plan
I’m watching $0.450–$0.455 for a potential pullback entry, with additional DCA interest around $0.439–$0.445 if support holds. I’d prefer a confirmed bounce or consolidation before entering rather than buying directly into resistance.
A strong breakout above $0.484 with sustained volume could open the way toward $0.500, while rejection may bring price back toward $0.455 and $0.439. A breakdown below $0.439 would weaken my bullish setup, with $0.423 as the next key support to watch.
ENSO has momentum, but the next move matters more than the current green candle. I’m watching $0.484 for breakout confirmation and how price reacts on any pullback. No chasing — I want confirmation before committing.
ENSO is trading at $0.464, up 16.29% in 24 hours, with strong bullish momentum on the 15-minute chart. Price has surged from the $0.410 low and broken above the $0.439 resistance zone. Now, I’m watching whether buyers can push through $0.484 or if profit-taking starts to kick in.
24-hour trading volume stands at 9.71M ENSO ($4.22M in USDT volume). The sharp rally shows increased market activity, but I want to see whether buyers can sustain this momentum rather than chase a sudden spike.
My Trading Plan
I’m watching $0.450–$0.455 for a potential pullback entry, with additional DCA interest around $0.439–$0.445 if support holds. I’d prefer a confirmed bounce or consolidation before entering rather than buying directly into resistance.
A strong breakout above $0.484 with sustained volume could open the way toward $0.500, while rejection may bring price back toward $0.455 and $0.439. A breakdown below $0.439 would weaken my bullish setup, with $0.423 as the next key support to watch.
ENSO has momentum, but the next move matters more than the current green candle. I’m watching $0.484 for breakout confirmation and how price reacts on any pullback. No chasing — I want confirmation before committing.
1
510
·
--
Рост
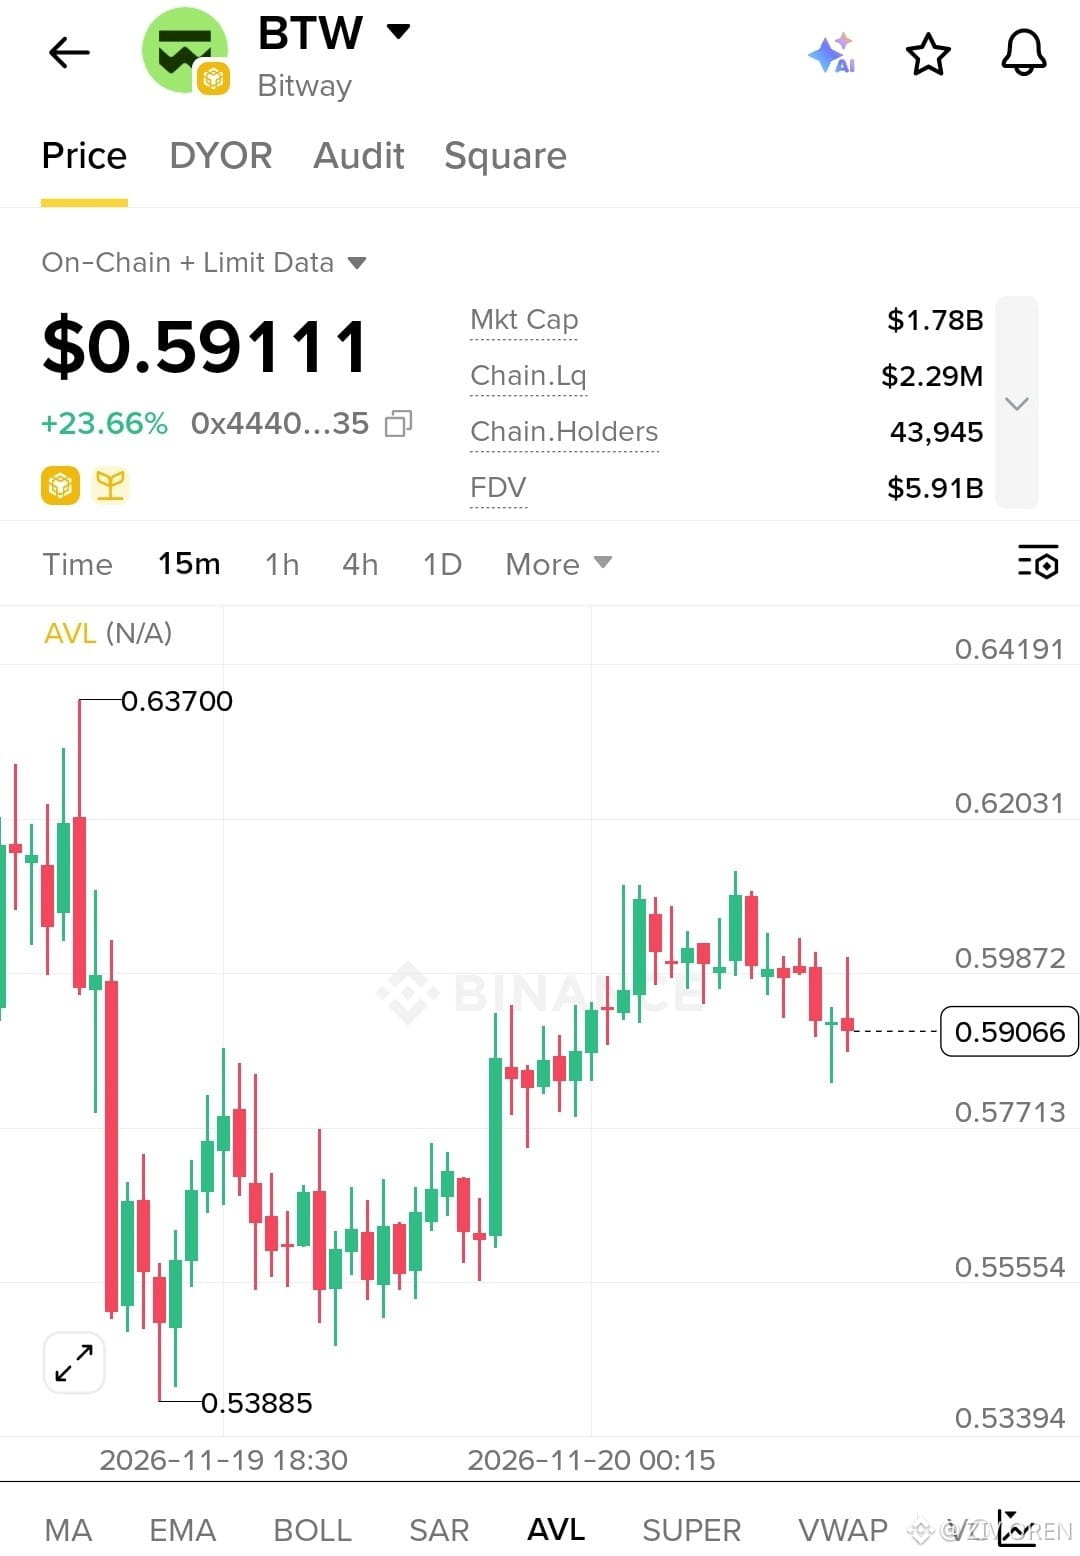
$BTW Is Showing Strong Recovery — Can Buyers Reclaim $0.60?
BTW is gaining momentum on the 15-minute chart, currently trading around $0.5911, up 23.66%. After dropping from the $0.6370 high to a low near $0.5388, price has made a solid recovery.
What catches my attention is the recovery from the $0.55 area and the move back toward $0.60. However, buyers are facing some resistance around $0.5987–$0.6000, and the latest candles show some selling pressure.
Volume & Market Participation
The screenshot shows a market cap of $1.78B, liquidity of $2.29M, and 43,945 holders. Actual 24-hour trading volume isn't visible, so I want to see stronger participation before expecting another major move.
My Trading Plan
I'm not interested in chasing BTW at current levels. I'd rather wait for a better entry.
My preferred spot entry is around $0.5800–$0.5850 if buyers defend this support. For DCA, I'll watch the $0.5550–$0.5600 area in case of a deeper pullback.
A strong 15-minute recovery above $0.6000 would give me more confidence to add to my position. If price loses $0.5550 and fails to recover, I'll reconsider the setup.
For now, I'm watching the $0.60 resistance closely. A confirmed breakout with strong volume could change the short-term structure, while another rejection may bring a fresh test of support. The next few candles will be important.
$BTW Is Showing Strong Recovery — Can Buyers Reclaim $0.60?
BTW is gaining momentum on the 15-minute chart, currently trading around $0.5911, up 23.66%. After dropping from the $0.6370 high to a low near $0.5388, price has made a solid recovery.
What catches my attention is the recovery from the $0.55 area and the move back toward $0.60. However, buyers are facing some resistance around $0.5987–$0.6000, and the latest candles show some selling pressure.
Volume & Market Participation
The screenshot shows a market cap of $1.78B, liquidity of $2.29M, and 43,945 holders. Actual 24-hour trading volume isn't visible, so I want to see stronger participation before expecting another major move.
My Trading Plan
I'm not interested in chasing BTW at current levels. I'd rather wait for a better entry.
My preferred spot entry is around $0.5800–$0.5850 if buyers defend this support. For DCA, I'll watch the $0.5550–$0.5600 area in case of a deeper pullback.
A strong 15-minute recovery above $0.6000 would give me more confidence to add to my position. If price loses $0.5550 and fails to recover, I'll reconsider the setup.
For now, I'm watching the $0.60 resistance closely. A confirmed breakout with strong volume could change the short-term structure, while another rejection may bring a fresh test of support. The next few candles will be important.
BTW is gaining momentum on the 15-minute chart, currently trading around $0.5911, up 23.66%. After dropping from the $0.6370 high to a low near $0.5388, price has made a solid recovery.
What catches my attention is the recovery from the $0.55 area and the move back toward $0.60. However, buyers are facing some resistance around $0.5987–$0.6000, and the latest candles show some selling pressure.
Volume & Market Participation
The screenshot shows a market cap of $1.78B, liquidity of $2.29M, and 43,945 holders. Actual 24-hour trading volume isn't visible, so I want to see stronger participation before expecting another major move.
My Trading Plan
I'm not interested in chasing BTW at current levels. I'd rather wait for a better entry.
My preferred spot entry is around $0.5800–$0.5850 if buyers defend this support. For DCA, I'll watch the $0.5550–$0.5600 area in case of a deeper pullback.
A strong 15-minute recovery above $0.6000 would give me more confidence to add to my position. If price loses $0.5550 and fails to recover, I'll reconsider the setup.
For now, I'm watching the $0.60 resistance closely. A confirmed breakout with strong volume could change the short-term structure, while another rejection may bring a fresh test of support. The next few candles will be important.
364
·
--
Рост
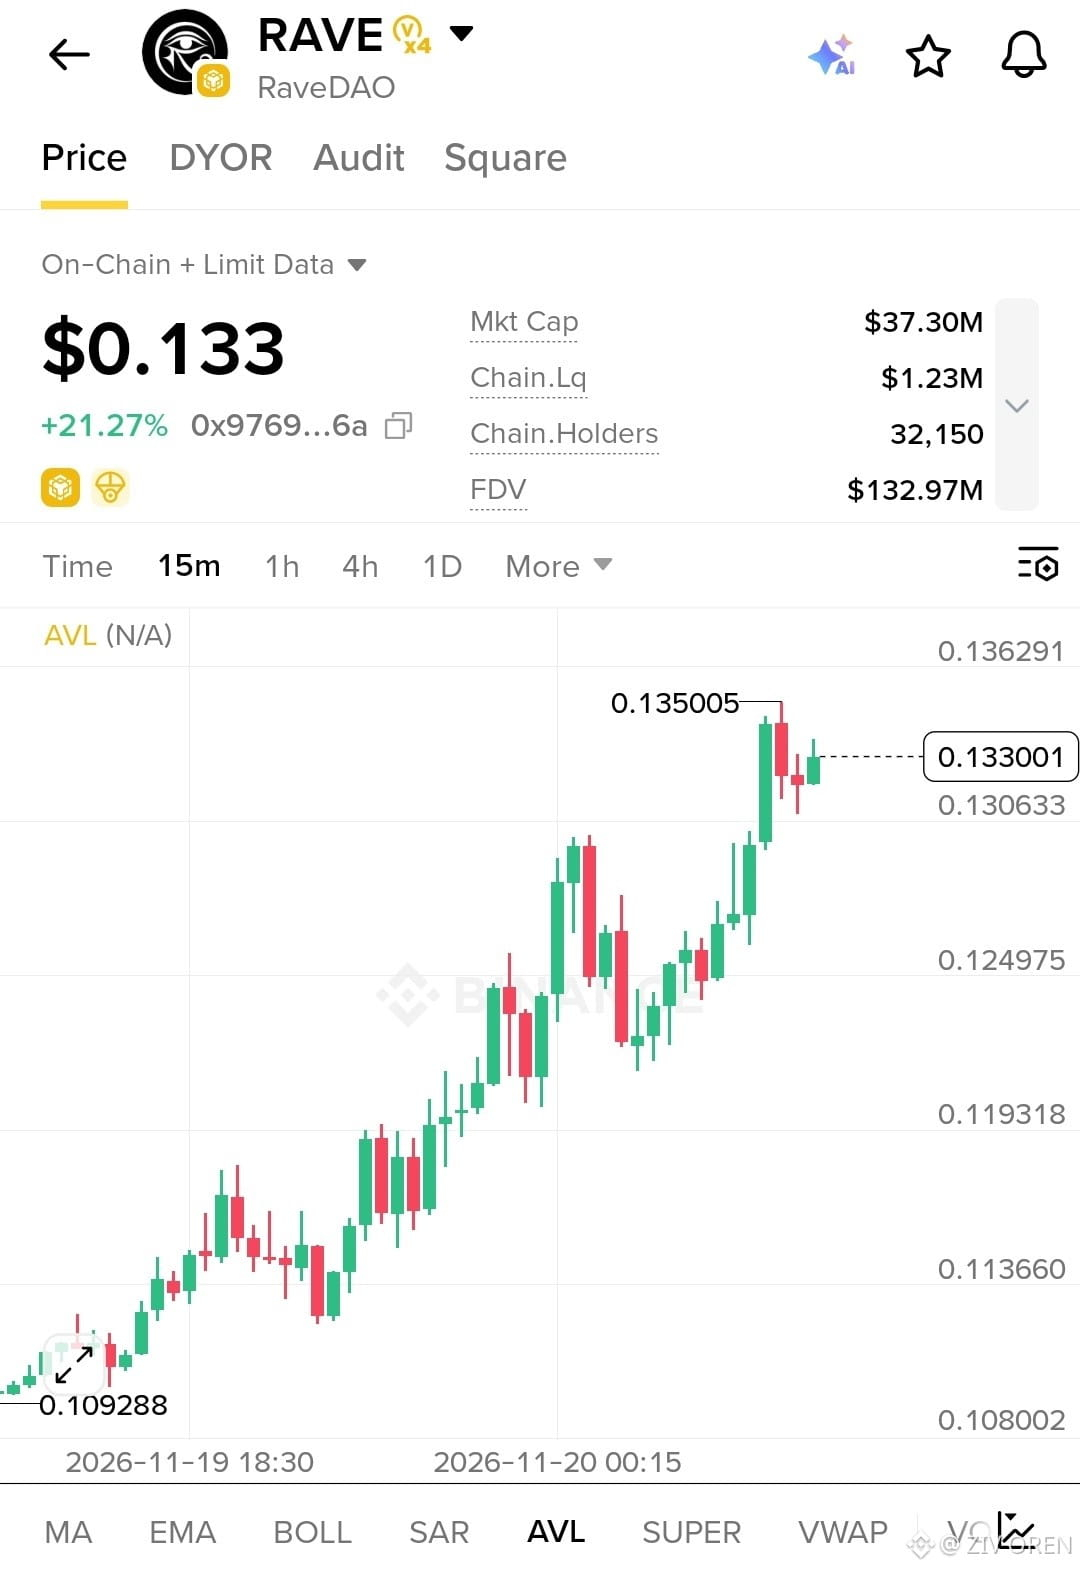
$RAVE Is Building Strong Momentum — Can Buyers Push It Higher?
RAVE is showing impressive strength on the 15-minute chart. Price has climbed from around $0.1093 to a recent high of $0.1350 and is currently trading near $0.1330, up 21.27%.
What catches my attention is the consistent recovery and formation of higher highs and higher lows. Buyers are maintaining control, but price is now approaching an important resistance zone around $0.1350–$0.1363. A clean breakout above this area could create room for another upward move.
Volume & Market Participation
The screenshot shows a market cap of $37.30M, liquidity of $1.23M, and 32,150 holders. Actual 24-hour trading volume isn't visible, so I want to see stronger volume supporting any breakout attempt.
My Trading Plan
I'm not interested in chasing after this strong move. I'd rather wait for a controlled pullback.
My preferred spot entry is around $0.1300–$0.1310 if buyers defend this area. For DCA, I'll keep an eye on $0.1250–$0.1270 if the market offers a deeper correction.
A strong recovery from support or a confirmed 15-minute close above $0.1363 would give me more confidence to add.
If price loses $0.1250 and fails to reclaim it, I'll reconsider the setup.
For now, I'm watching the $0.1350–$0.1363 resistance zone closely. The next reaction will help determine whether RAVE has enough buying strength to continue its move or needs more time to consolidate.
$RAVE Is Building Strong Momentum — Can Buyers Push It Higher?
RAVE is showing impressive strength on the 15-minute chart. Price has climbed from around $0.1093 to a recent high of $0.1350 and is currently trading near $0.1330, up 21.27%.
What catches my attention is the consistent recovery and formation of higher highs and higher lows. Buyers are maintaining control, but price is now approaching an important resistance zone around $0.1350–$0.1363. A clean breakout above this area could create room for another upward move.
Volume & Market Participation
The screenshot shows a market cap of $37.30M, liquidity of $1.23M, and 32,150 holders. Actual 24-hour trading volume isn't visible, so I want to see stronger volume supporting any breakout attempt.
My Trading Plan
I'm not interested in chasing after this strong move. I'd rather wait for a controlled pullback.
My preferred spot entry is around $0.1300–$0.1310 if buyers defend this area. For DCA, I'll keep an eye on $0.1250–$0.1270 if the market offers a deeper correction.
A strong recovery from support or a confirmed 15-minute close above $0.1363 would give me more confidence to add.
If price loses $0.1250 and fails to reclaim it, I'll reconsider the setup.
For now, I'm watching the $0.1350–$0.1363 resistance zone closely. The next reaction will help determine whether RAVE has enough buying strength to continue its move or needs more time to consolidate.
RAVE is showing impressive strength on the 15-minute chart. Price has climbed from around $0.1093 to a recent high of $0.1350 and is currently trading near $0.1330, up 21.27%.
What catches my attention is the consistent recovery and formation of higher highs and higher lows. Buyers are maintaining control, but price is now approaching an important resistance zone around $0.1350–$0.1363. A clean breakout above this area could create room for another upward move.
Volume & Market Participation
The screenshot shows a market cap of $37.30M, liquidity of $1.23M, and 32,150 holders. Actual 24-hour trading volume isn't visible, so I want to see stronger volume supporting any breakout attempt.
My Trading Plan
I'm not interested in chasing after this strong move. I'd rather wait for a controlled pullback.
My preferred spot entry is around $0.1300–$0.1310 if buyers defend this area. For DCA, I'll keep an eye on $0.1250–$0.1270 if the market offers a deeper correction.
A strong recovery from support or a confirmed 15-minute close above $0.1363 would give me more confidence to add.
If price loses $0.1250 and fails to reclaim it, I'll reconsider the setup.
For now, I'm watching the $0.1350–$0.1363 resistance zone closely. The next reaction will help determine whether RAVE has enough buying strength to continue its move or needs more time to consolidate.
2
471
·
--
Рост
$EVAA Is Showing Strong Momentum — The Next Move Could Be Important!
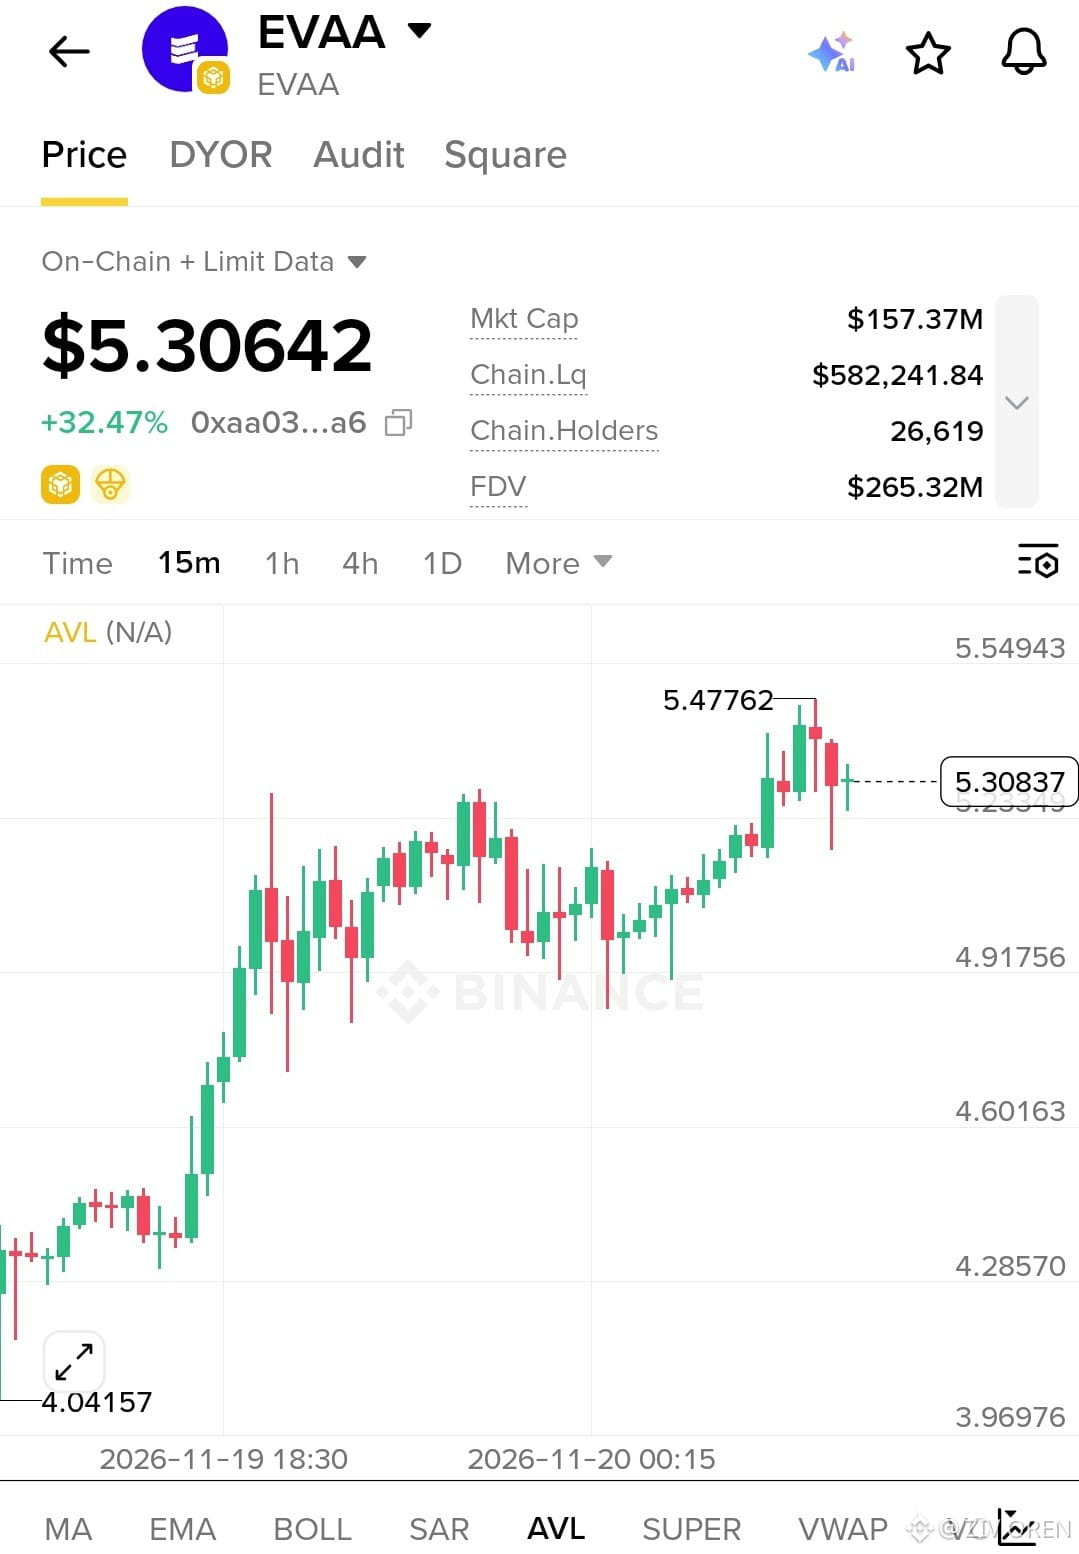
EVAA is catching attention after a strong upward move. On the 15-minute chart, price has climbed from around $4.04 to a recent high of $5.4776 and is currently trading near $5.3064, up 32.47% according to the screenshot.
What I like is that buyers are still keeping price above the $5.23 area after the recent pullback. However, the market is approaching an important resistance zone between $5.47 and $5.55. A clean move above this area could open the door for another leg higher.
Volume & Market Participation
The screenshot shows a market cap of $157.37M, FDV of $265.32M, and 26,619 holders. Actual 24-hour trading volume isn't visible, so I want to see stronger volume before treating this move as a confirmed breakout.
My Trading Plan
I'm not interested in chasing EVAA after such a strong move. I'd rather wait for a healthy pullback.
My preferred spot entry area is around $5.20–$5.25 if buyers defend this zone. For DCA, I'll also watch the $4.92–$5.00 support area if price corrects further.
A strong 15-minute recovery and a successful reclaim of $5.47 would give me more confidence to add to a position. A sustained breakdown below $4.92 would invalidate this setup.
For now, I'm watching how EVAA reacts around $5.23 and whether buyers can challenge $5.47 again. The next move around these levels will tell us a lot about the strength of this rally.
$EVAA Is Showing Strong Momentum — The Next Move Could Be Important!
EVAA is catching attention after a strong upward move. On the 15-minute chart, price has climbed from around $4.04 to a recent high of $5.4776 and is currently trading near $5.3064, up 32.47% according to the screenshot.
What I like is that buyers are still keeping price above the $5.23 area after the recent pullback. However, the market is approaching an important resistance zone between $5.47 and $5.55. A clean move above this area could open the door for another leg higher.
Volume & Market Participation
The screenshot shows a market cap of $157.37M, FDV of $265.32M, and 26,619 holders. Actual 24-hour trading volume isn't visible, so I want to see stronger volume before treating this move as a confirmed breakout.
My Trading Plan
I'm not interested in chasing EVAA after such a strong move. I'd rather wait for a healthy pullback.
My preferred spot entry area is around $5.20–$5.25 if buyers defend this zone. For DCA, I'll also watch the $4.92–$5.00 support area if price corrects further.
A strong 15-minute recovery and a successful reclaim of $5.47 would give me more confidence to add to a position. A sustained breakdown below $4.92 would invalidate this setup.
For now, I'm watching how EVAA reacts around $5.23 and whether buyers can challenge $5.47 again. The next move around these levels will tell us a lot about the strength of this rally.
EVAA is catching attention after a strong upward move. On the 15-minute chart, price has climbed from around $4.04 to a recent high of $5.4776 and is currently trading near $5.3064, up 32.47% according to the screenshot.
What I like is that buyers are still keeping price above the $5.23 area after the recent pullback. However, the market is approaching an important resistance zone between $5.47 and $5.55. A clean move above this area could open the door for another leg higher.
Volume & Market Participation
The screenshot shows a market cap of $157.37M, FDV of $265.32M, and 26,619 holders. Actual 24-hour trading volume isn't visible, so I want to see stronger volume before treating this move as a confirmed breakout.
My Trading Plan
I'm not interested in chasing EVAA after such a strong move. I'd rather wait for a healthy pullback.
My preferred spot entry area is around $5.20–$5.25 if buyers defend this zone. For DCA, I'll also watch the $4.92–$5.00 support area if price corrects further.
A strong 15-minute recovery and a successful reclaim of $5.47 would give me more confidence to add to a position. A sustained breakdown below $4.92 would invalidate this setup.
For now, I'm watching how EVAA reacts around $5.23 and whether buyers can challenge $5.47 again. The next move around these levels will tell us a lot about the strength of this rally.
100
·
--
Рост
$AMD Is Showing Strong Momentum, But $555 Is the Level I'm Watching Closely!
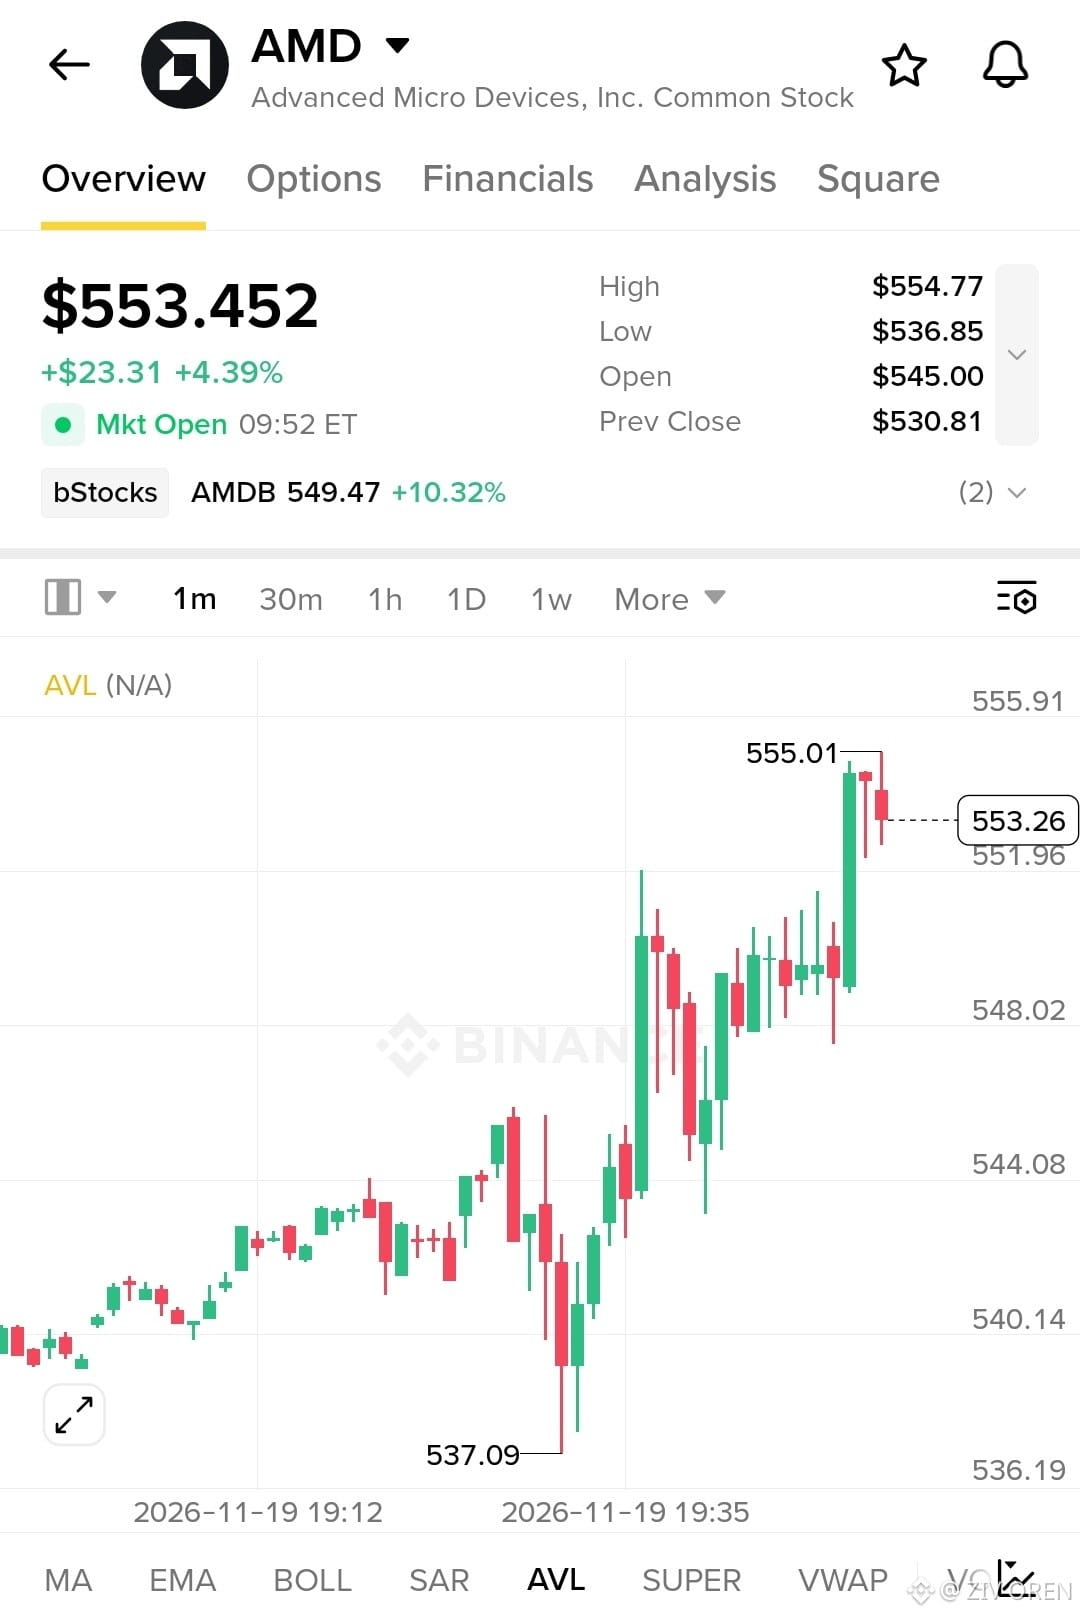
AMD is trading around $553.45, up 4.39%, showing strong intraday buying pressure. On the 1-minute chart, price has recovered from the $537.09 low and formed a series of higher highs and higher lows.
The latest bullish candle pushed price toward $555.01, but we're now seeing a small pullback. The $554.77–$555.01 zone is the immediate resistance to watch. A clean break and hold above this area could open the door for another upside move.
Key Levels I'm Watching:
* Immediate Resistance: $554.77–$555.01
* First Support: $551.96
* Stronger Support: $548.02
* Lower Support: $544.08
* Intraday Low: $537.09
My Trading Plan:
I'm not interested in chasing the latest green candle. I'd rather wait for a healthy pullback toward $551.96 or $548.02 and look for buyers to step back in.
For a spot entry, I'd consider scaling in gradually rather than taking a full position at once. If AMD holds support and reclaims $555 with strong volume, that would give me more confidence to add.
A loss of $548.02 would weaken this short-term bullish setup, so that's an important level for me to monitor.
What I'm Watching Next:
AMD has strong short-term momentum, but the real test is whether buyers can turn $555 into support. I want to see a confirmed breakout, not just another quick spike above resistance.
The next move around $555 could tell us a lot about whether this rally has more room to run.
$AMD Is Showing Strong Momentum, But $555 Is the Level I'm Watching Closely!
AMD is trading around $553.45, up 4.39%, showing strong intraday buying pressure. On the 1-minute chart, price has recovered from the $537.09 low and formed a series of higher highs and higher lows.
The latest bullish candle pushed price toward $555.01, but we're now seeing a small pullback. The $554.77–$555.01 zone is the immediate resistance to watch. A clean break and hold above this area could open the door for another upside move.
Key Levels I'm Watching:
* Immediate Resistance: $554.77–$555.01
* First Support: $551.96
* Stronger Support: $548.02
* Lower Support: $544.08
* Intraday Low: $537.09
My Trading Plan:
I'm not interested in chasing the latest green candle. I'd rather wait for a healthy pullback toward $551.96 or $548.02 and look for buyers to step back in.
For a spot entry, I'd consider scaling in gradually rather than taking a full position at once. If AMD holds support and reclaims $555 with strong volume, that would give me more confidence to add.
A loss of $548.02 would weaken this short-term bullish setup, so that's an important level for me to monitor.
What I'm Watching Next:
AMD has strong short-term momentum, but the real test is whether buyers can turn $555 into support. I want to see a confirmed breakout, not just another quick spike above resistance.
The next move around $555 could tell us a lot about whether this rally has more room to run.
AMD is trading around $553.45, up 4.39%, showing strong intraday buying pressure. On the 1-minute chart, price has recovered from the $537.09 low and formed a series of higher highs and higher lows.
The latest bullish candle pushed price toward $555.01, but we're now seeing a small pullback. The $554.77–$555.01 zone is the immediate resistance to watch. A clean break and hold above this area could open the door for another upside move.
Key Levels I'm Watching:
* Immediate Resistance: $554.77–$555.01
* First Support: $551.96
* Stronger Support: $548.02
* Lower Support: $544.08
* Intraday Low: $537.09
My Trading Plan:
I'm not interested in chasing the latest green candle. I'd rather wait for a healthy pullback toward $551.96 or $548.02 and look for buyers to step back in.
For a spot entry, I'd consider scaling in gradually rather than taking a full position at once. If AMD holds support and reclaims $555 with strong volume, that would give me more confidence to add.
A loss of $548.02 would weaken this short-term bullish setup, so that's an important level for me to monitor.
What I'm Watching Next:
AMD has strong short-term momentum, but the real test is whether buyers can turn $555 into support. I want to see a confirmed breakout, not just another quick spike above resistance.
The next move around $555 could tell us a lot about whether this rally has more room to run.
331
·
--
Рост
$NVDA — NVIDIA Is Showing Signs of Recovery After the Dip
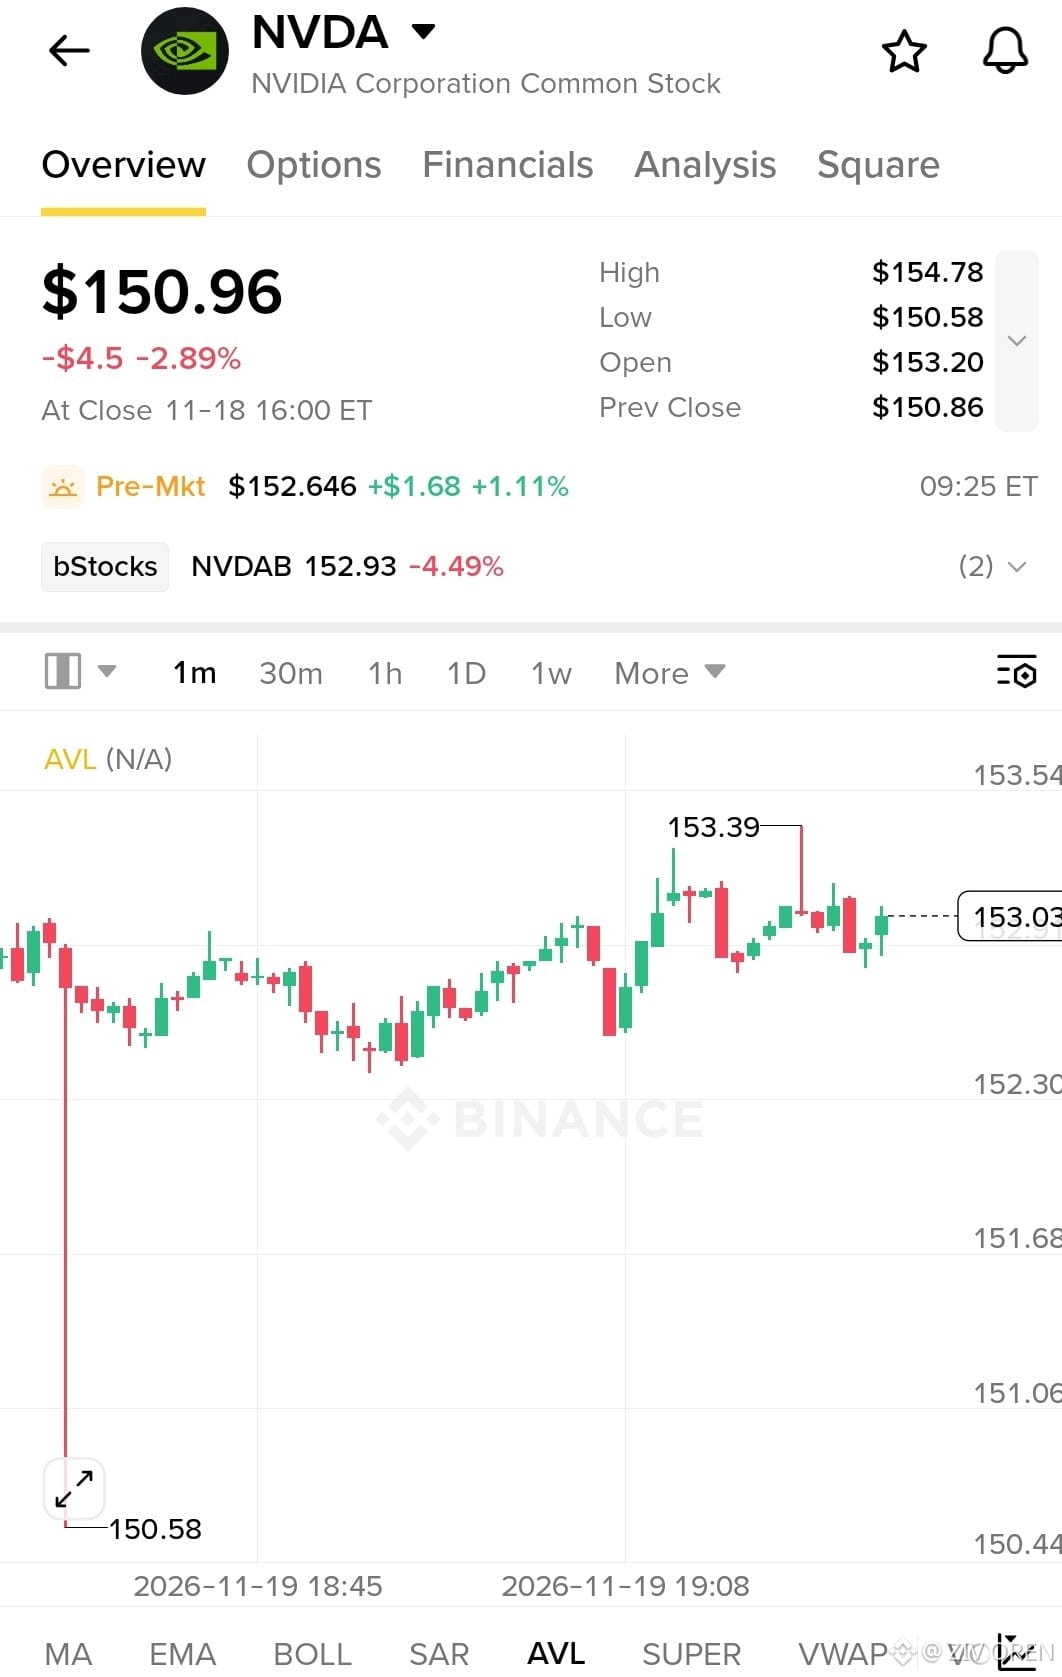
NVIDIA closed at $150.96, down 2.89%, after trading between $150.58 and $154.78. However, the pre-market price is showing strength around $152.646, up 1.11%.
On the 1-minute chart, buyers have stepped in after the sharp drop toward $150.58. Price recovered toward $153.39 and is now consolidating around $153.03. This is an encouraging short-term recovery, but I still want to see buyers hold their ground before calling it a confirmed reversal.
Key Levels I'm Watching
Immediate Support: $152.30
Strong Support: $150.58
Immediate Resistance: $153.39
Major Resistance: $154.78
My Trading Plan
I'm interested in a potential spot entry if NVDA maintains support around $152.30 and shows continued buying pressure.
For DCA, I would watch the $152.30–$152.60 area, provided buyers defend it. A clean move above $153.39 would give me more confidence to add to a position.
My next upside level to watch is $154.78. However, if price loses $152.30 and selling pressure increases, I'll reconsider the setup rather than average down blindly.
What I'm Watching Next
The key is whether NVDA can turn $153.39 into support and build enough momentum to challenge $154.78. I prefer waiting for confirmation instead of chasing every small bounce.
$NVDA — NVIDIA Is Showing Signs of Recovery After the Dip
NVIDIA closed at $150.96, down 2.89%, after trading between $150.58 and $154.78. However, the pre-market price is showing strength around $152.646, up 1.11%.
On the 1-minute chart, buyers have stepped in after the sharp drop toward $150.58. Price recovered toward $153.39 and is now consolidating around $153.03. This is an encouraging short-term recovery, but I still want to see buyers hold their ground before calling it a confirmed reversal.
Key Levels I'm Watching
Immediate Support: $152.30
Strong Support: $150.58
Immediate Resistance: $153.39
Major Resistance: $154.78
My Trading Plan
I'm interested in a potential spot entry if NVDA maintains support around $152.30 and shows continued buying pressure.
For DCA, I would watch the $152.30–$152.60 area, provided buyers defend it. A clean move above $153.39 would give me more confidence to add to a position.
My next upside level to watch is $154.78. However, if price loses $152.30 and selling pressure increases, I'll reconsider the setup rather than average down blindly.
What I'm Watching Next
The key is whether NVDA can turn $153.39 into support and build enough momentum to challenge $154.78. I prefer waiting for confirmation instead of chasing every small bounce.
NVIDIA closed at $150.96, down 2.89%, after trading between $150.58 and $154.78. However, the pre-market price is showing strength around $152.646, up 1.11%.
On the 1-minute chart, buyers have stepped in after the sharp drop toward $150.58. Price recovered toward $153.39 and is now consolidating around $153.03. This is an encouraging short-term recovery, but I still want to see buyers hold their ground before calling it a confirmed reversal.
Key Levels I'm Watching
Immediate Support: $152.30
Strong Support: $150.58
Immediate Resistance: $153.39
Major Resistance: $154.78
My Trading Plan
I'm interested in a potential spot entry if NVDA maintains support around $152.30 and shows continued buying pressure.
For DCA, I would watch the $152.30–$152.60 area, provided buyers defend it. A clean move above $153.39 would give me more confidence to add to a position.
My next upside level to watch is $154.78. However, if price loses $152.30 and selling pressure increases, I'll reconsider the setup rather than average down blindly.
What I'm Watching Next
The key is whether NVDA can turn $153.39 into support and build enough momentum to challenge $154.78. I prefer waiting for confirmation instead of chasing every small bounce.
364
·
--
Рост
$DODO — Selling Pressure Continues, But Support Is Getting Closer
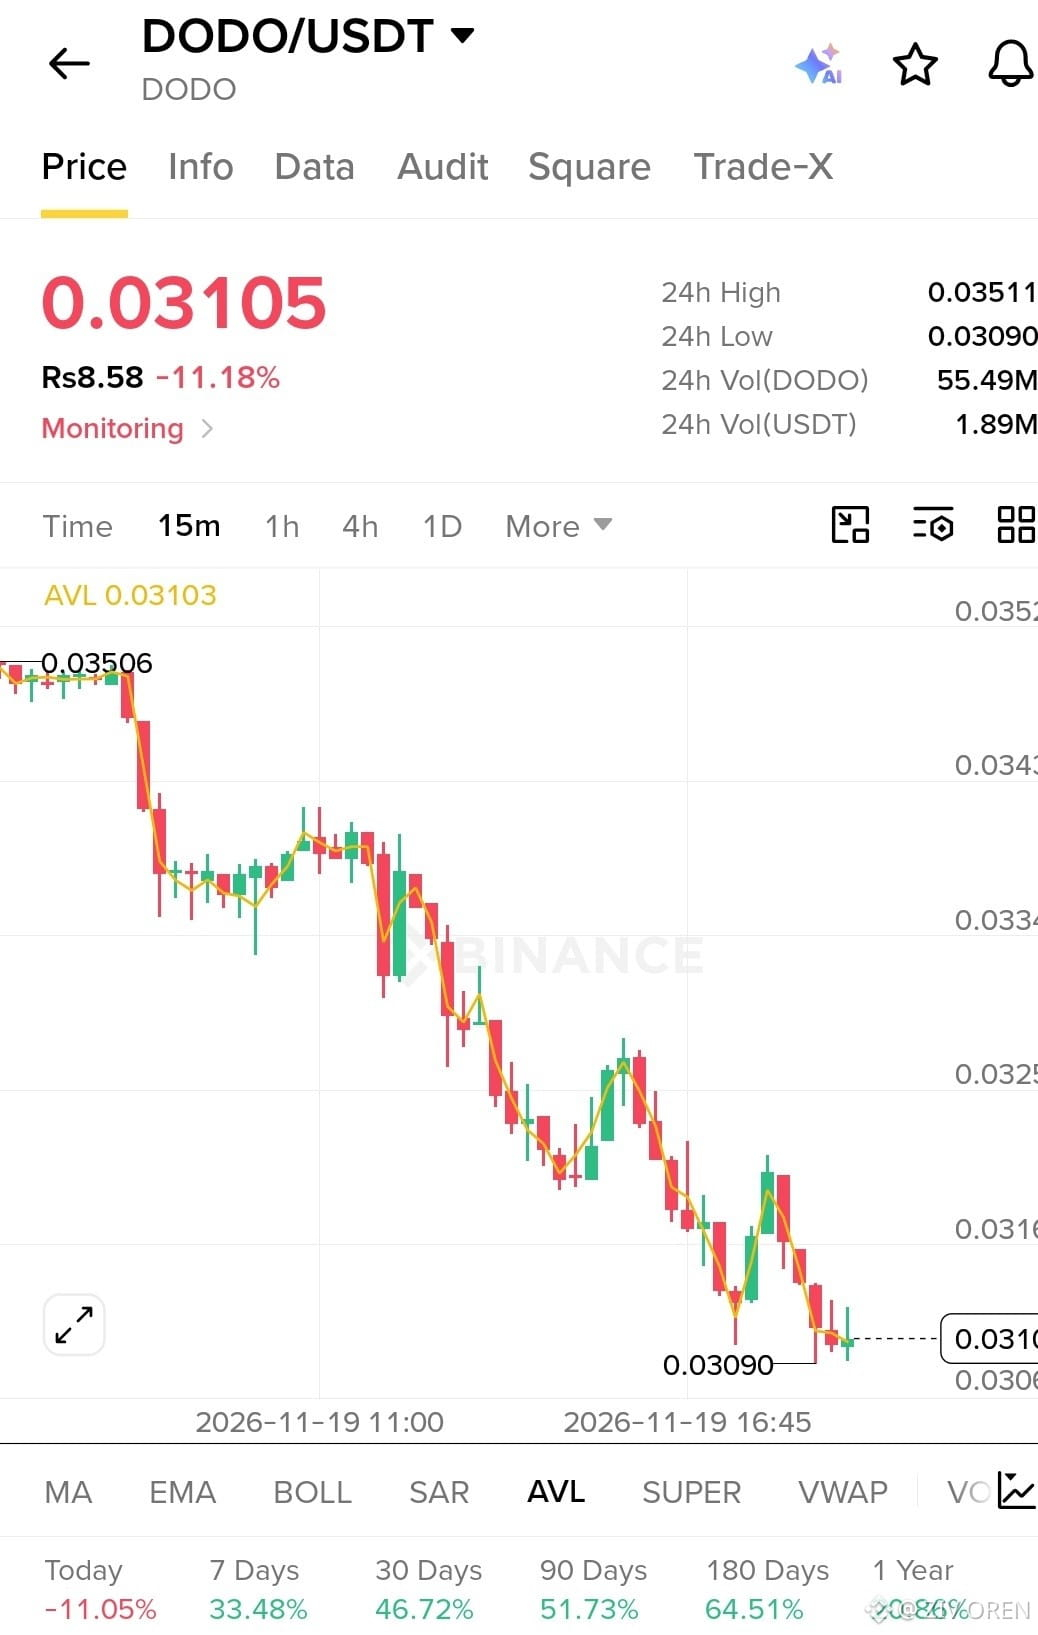
DODO is currently trading around $0.03105, down 11.18% over the last 24 hours. On the 15-minute chart, the market structure remains weak, with lower highs and lower lows dominating the price action. Every recovery attempt has faced selling pressure, and the latest bounce has failed to hold.
The key level I'm watching is $0.03090, which marks the recent low. If buyers can defend this area, DODO may attempt another recovery toward $0.03160 and $0.03250. However, a clean break below support would signal further weakness.
Volume & Market Participation
24-hour trading volume stands at 55.49M DODO, worth approximately 1.89M USDT. Despite active trading, the price decline suggests sellers are currently controlling the short-term movement. I would like to see stronger buying volume before treating any bounce as a meaningful recovery.
My Trading Plan
I'm not rushing into a spot entry here. My first DCA interest is around $0.03090–$0.03100, but only if price shows clear support and buyers step in.
A sustained recovery above $0.03160 would make me more interested in adding to a position. The next resistance areas I'm watching are $0.03200 and $0.03250.
If DODO loses $0.03090 without a quick recovery, I'll reconsider the setup and avoid averaging down blindly.
What I'm Watching Next
For now, $0.03090 is the level that matters most. I want to see buyers defend support and reclaim nearby resistance before committing more capital. Patience is important while the short-term trend remains under pressure.
$DODO — Selling Pressure Continues, But Support Is Getting Closer
DODO is currently trading around $0.03105, down 11.18% over the last 24 hours. On the 15-minute chart, the market structure remains weak, with lower highs and lower lows dominating the price action. Every recovery attempt has faced selling pressure, and the latest bounce has failed to hold.
The key level I'm watching is $0.03090, which marks the recent low. If buyers can defend this area, DODO may attempt another recovery toward $0.03160 and $0.03250. However, a clean break below support would signal further weakness.
Volume & Market Participation
24-hour trading volume stands at 55.49M DODO, worth approximately 1.89M USDT. Despite active trading, the price decline suggests sellers are currently controlling the short-term movement. I would like to see stronger buying volume before treating any bounce as a meaningful recovery.
My Trading Plan
I'm not rushing into a spot entry here. My first DCA interest is around $0.03090–$0.03100, but only if price shows clear support and buyers step in.
A sustained recovery above $0.03160 would make me more interested in adding to a position. The next resistance areas I'm watching are $0.03200 and $0.03250.
If DODO loses $0.03090 without a quick recovery, I'll reconsider the setup and avoid averaging down blindly.
What I'm Watching Next
For now, $0.03090 is the level that matters most. I want to see buyers defend support and reclaim nearby resistance before committing more capital. Patience is important while the short-term trend remains under pressure.
DODO is currently trading around $0.03105, down 11.18% over the last 24 hours. On the 15-minute chart, the market structure remains weak, with lower highs and lower lows dominating the price action. Every recovery attempt has faced selling pressure, and the latest bounce has failed to hold.
The key level I'm watching is $0.03090, which marks the recent low. If buyers can defend this area, DODO may attempt another recovery toward $0.03160 and $0.03250. However, a clean break below support would signal further weakness.
Volume & Market Participation
24-hour trading volume stands at 55.49M DODO, worth approximately 1.89M USDT. Despite active trading, the price decline suggests sellers are currently controlling the short-term movement. I would like to see stronger buying volume before treating any bounce as a meaningful recovery.
My Trading Plan
I'm not rushing into a spot entry here. My first DCA interest is around $0.03090–$0.03100, but only if price shows clear support and buyers step in.
A sustained recovery above $0.03160 would make me more interested in adding to a position. The next resistance areas I'm watching are $0.03200 and $0.03250.
If DODO loses $0.03090 without a quick recovery, I'll reconsider the setup and avoid averaging down blindly.
What I'm Watching Next
For now, $0.03090 is the level that matters most. I want to see buyers defend support and reclaim nearby resistance before committing more capital. Patience is important while the short-term trend remains under pressure.
290
·
--
Рост
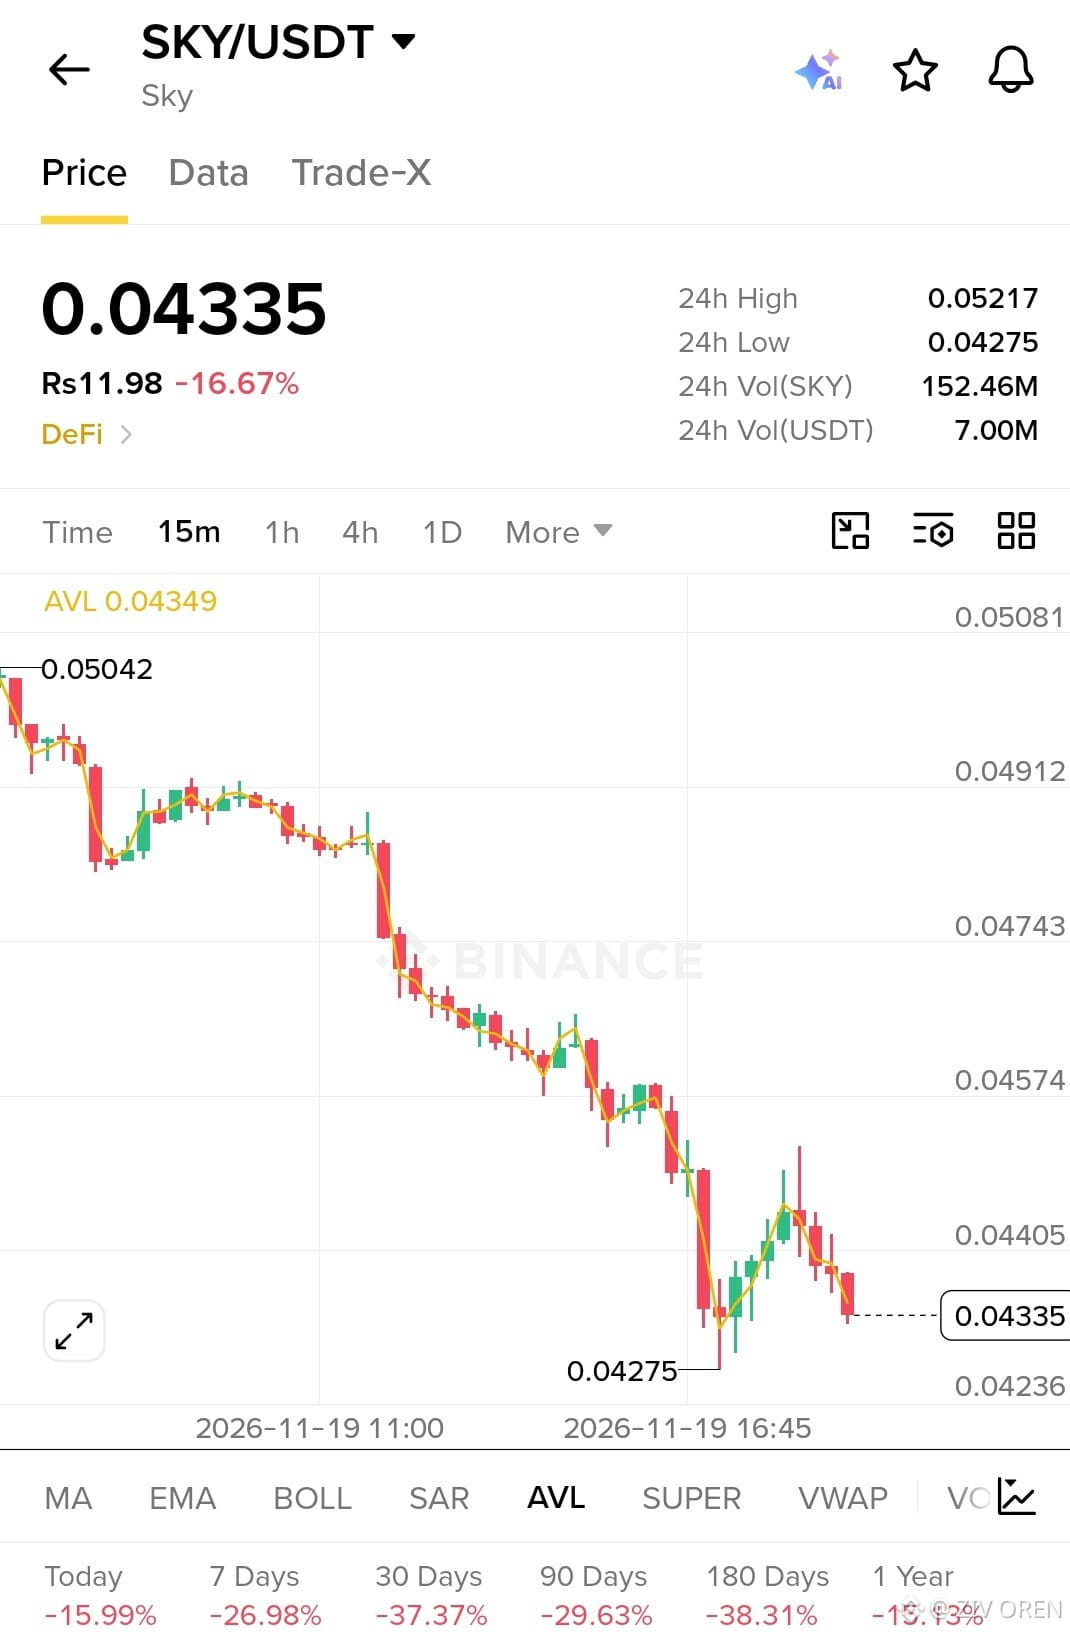
$SKY — A Recovery Attempt After a Heavy Sell-Off
SKY is facing strong selling pressure, currently trading around $0.04335, down 16.67% over the last 24 hours. On the 15-minute chart, the structure remains bearish, with consistent lower highs and lower lows. The recent bounce from $0.04275 toward $0.04430 shows some buying interest, but sellers have stepped in again.
24-hour trading volume stands at 152.46M SKY, worth approximately 7M USDT. This shows active market participation during the decline, but volume alone does not confirm that buyers are taking control.
My Trading Plan
I'm not rushing into a spot position while the short-term structure remains weak. My first area of interest is around $0.04300–$0.04275, where I would look for signs of stabilization before considering an initial entry.
For DCA, I would prefer gradual entries only if support holds and buyers start showing strength. A recovery above $0.04405 would be my first confirmation to watch, while $0.04574 is the next important resistance area.
If SKY breaks below $0.04275 and fails to recover, I would reconsider the setup rather than continue averaging down.
What I'm Watching Next
SKY needs to defend its recent low and reclaim nearby resistance before I become more confident. For now, patience and proper risk management matter more than chasing a quick recovery.
$SKY — A Recovery Attempt After a Heavy Sell-Off
SKY is facing strong selling pressure, currently trading around $0.04335, down 16.67% over the last 24 hours. On the 15-minute chart, the structure remains bearish, with consistent lower highs and lower lows. The recent bounce from $0.04275 toward $0.04430 shows some buying interest, but sellers have stepped in again.
24-hour trading volume stands at 152.46M SKY, worth approximately 7M USDT. This shows active market participation during the decline, but volume alone does not confirm that buyers are taking control.
My Trading Plan
I'm not rushing into a spot position while the short-term structure remains weak. My first area of interest is around $0.04300–$0.04275, where I would look for signs of stabilization before considering an initial entry.
For DCA, I would prefer gradual entries only if support holds and buyers start showing strength. A recovery above $0.04405 would be my first confirmation to watch, while $0.04574 is the next important resistance area.
If SKY breaks below $0.04275 and fails to recover, I would reconsider the setup rather than continue averaging down.
What I'm Watching Next
SKY needs to defend its recent low and reclaim nearby resistance before I become more confident. For now, patience and proper risk management matter more than chasing a quick recovery.
SKY is facing strong selling pressure, currently trading around $0.04335, down 16.67% over the last 24 hours. On the 15-minute chart, the structure remains bearish, with consistent lower highs and lower lows. The recent bounce from $0.04275 toward $0.04430 shows some buying interest, but sellers have stepped in again.
24-hour trading volume stands at 152.46M SKY, worth approximately 7M USDT. This shows active market participation during the decline, but volume alone does not confirm that buyers are taking control.
My Trading Plan
I'm not rushing into a spot position while the short-term structure remains weak. My first area of interest is around $0.04300–$0.04275, where I would look for signs of stabilization before considering an initial entry.
For DCA, I would prefer gradual entries only if support holds and buyers start showing strength. A recovery above $0.04405 would be my first confirmation to watch, while $0.04574 is the next important resistance area.
If SKY breaks below $0.04275 and fails to recover, I would reconsider the setup rather than continue averaging down.
What I'm Watching Next
SKY needs to defend its recent low and reclaim nearby resistance before I become more confident. For now, patience and proper risk management matter more than chasing a quick recovery.
811
·
--
Рост
$BTW is showing strong bullish momentum, currently trading at $0.46554, up 29.63%. On the 15-minute chart, buyers have delivered a powerful breakout from the $0.42–$0.43 consolidation zone, pushing price to a recent high of $0.49802.
However, the latest candle shows selling pressure after the sharp rally. I don't want to chase this move blindly. The key question now is whether buyers can defend $0.456–$0.460 and build another move toward $0.50.
Market Activity
* Market Cap: $1.40B
* FDV: $4.66B
* On-chain Liquidity: $2.08M
* Holders: 43,852
* Current Price: $0.46554
* Recent High: $0.49802
The breakout is impressive, but the screenshot does not provide trading volume. I would like to see sustained buying activity before trusting another breakout.
My Trading Plan
I'm more interested in a controlled pullback than entering after a 29% move.
* First Entry: $0.455–$0.462
* DCA 1: $0.445–$0.450
* DCA 2: $0.433–$0.438
* TP1: $0.480
* TP2: $0.498
* TP3: $0.520
* Stop Loss: Below $0.410
I would prefer a 15-minute candle to hold above $0.456 and buyers to reclaim $0.480 before considering additional exposure. A breakdown below support would weaken this setup.
My focus is simple: BTW has momentum, but momentum alone is not confirmation. I want to see whether buyers can turn this sharp breakout into a sustainable move.
$BTW is showing strong bullish momentum, currently trading at $0.46554, up 29.63%. On the 15-minute chart, buyers have delivered a powerful breakout from the $0.42–$0.43 consolidation zone, pushing price to a recent high of $0.49802.
However, the latest candle shows selling pressure after the sharp rally. I don't want to chase this move blindly. The key question now is whether buyers can defend $0.456–$0.460 and build another move toward $0.50.
Market Activity
* Market Cap: $1.40B
* FDV: $4.66B
* On-chain Liquidity: $2.08M
* Holders: 43,852
* Current Price: $0.46554
* Recent High: $0.49802
The breakout is impressive, but the screenshot does not provide trading volume. I would like to see sustained buying activity before trusting another breakout.
My Trading Plan
I'm more interested in a controlled pullback than entering after a 29% move.
* First Entry: $0.455–$0.462
* DCA 1: $0.445–$0.450
* DCA 2: $0.433–$0.438
* TP1: $0.480
* TP2: $0.498
* TP3: $0.520
* Stop Loss: Below $0.410
I would prefer a 15-minute candle to hold above $0.456 and buyers to reclaim $0.480 before considering additional exposure. A breakdown below support would weaken this setup.
My focus is simple: BTW has momentum, but momentum alone is not confirmation. I want to see whether buyers can turn this sharp breakout into a sustainable move.
However, the latest candle shows selling pressure after the sharp rally. I don't want to chase this move blindly. The key question now is whether buyers can defend $0.456–$0.460 and build another move toward $0.50.
Market Activity
* Market Cap: $1.40B
* FDV: $4.66B
* On-chain Liquidity: $2.08M
* Holders: 43,852
* Current Price: $0.46554
* Recent High: $0.49802
The breakout is impressive, but the screenshot does not provide trading volume. I would like to see sustained buying activity before trusting another breakout.
My Trading Plan
I'm more interested in a controlled pullback than entering after a 29% move.
* First Entry: $0.455–$0.462
* DCA 1: $0.445–$0.450
* DCA 2: $0.433–$0.438
* TP1: $0.480
* TP2: $0.498
* TP3: $0.520
* Stop Loss: Below $0.410
I would prefer a 15-minute candle to hold above $0.456 and buyers to reclaim $0.480 before considering additional exposure. A breakdown below support would weaken this setup.
My focus is simple: BTW has momentum, but momentum alone is not confirmation. I want to see whether buyers can turn this sharp breakout into a sustainable move.
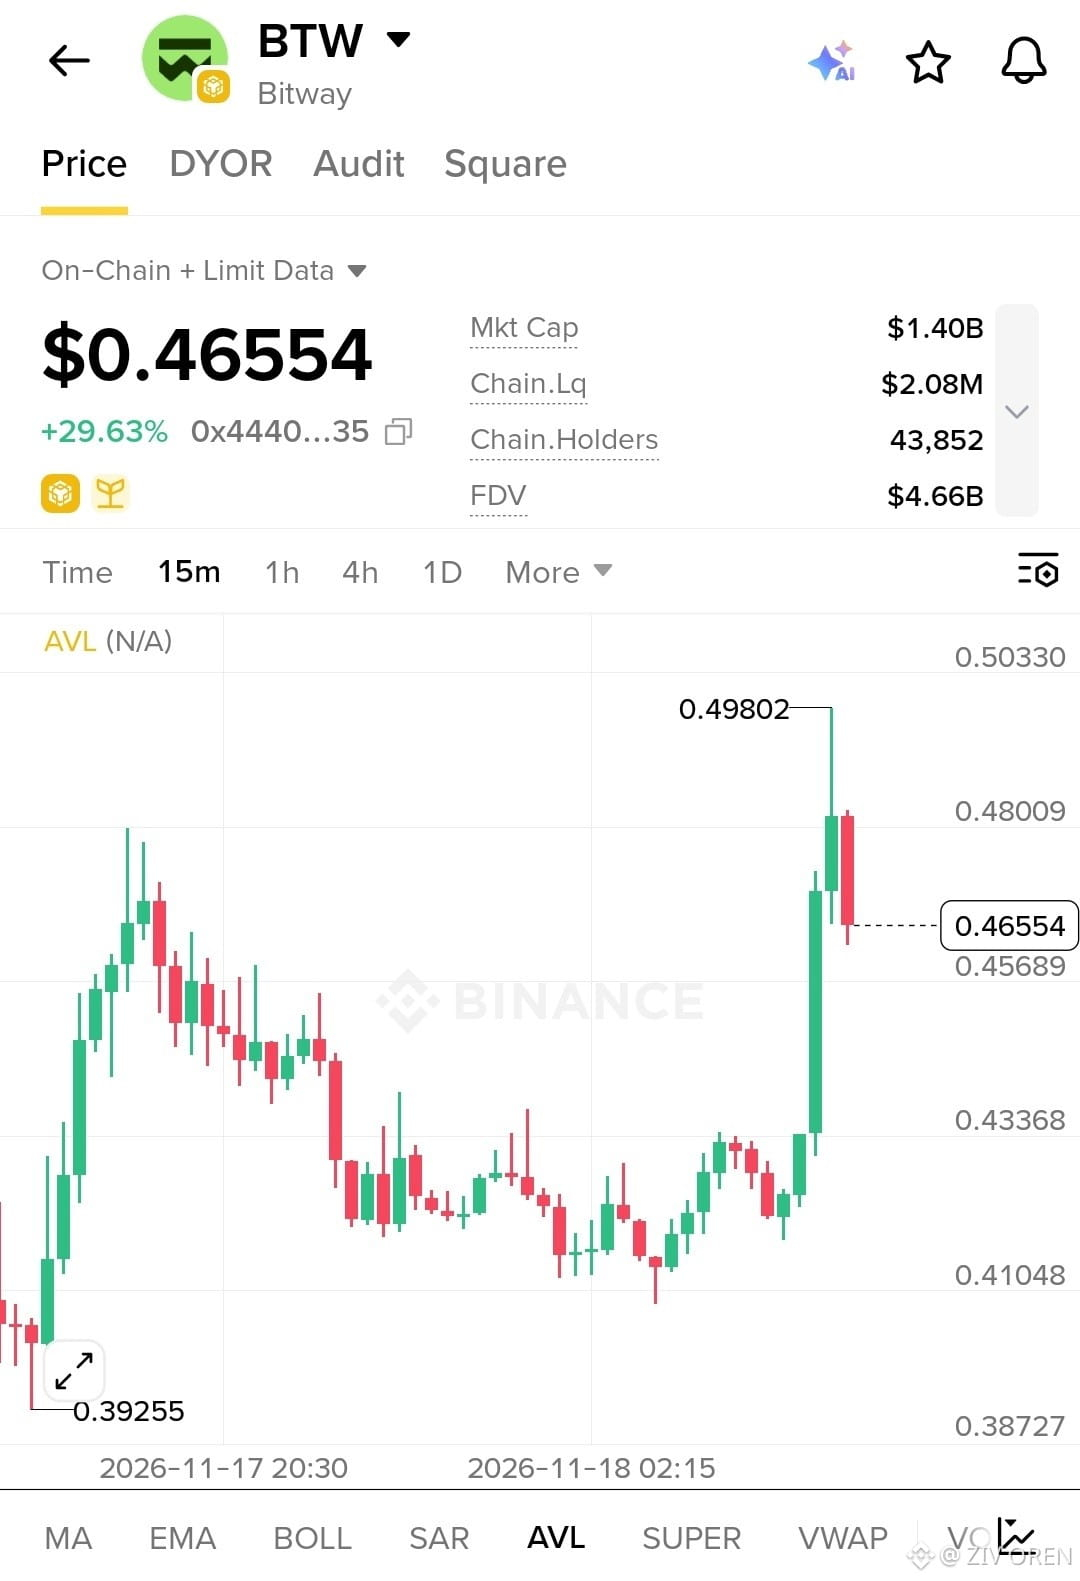
164
·
--
Рост
I'm keeping a close eye on $AMD . The stock closed at $503.41, down just 0.17%, but overnight trading shows a strong recovery toward $518.80, up approximately 3.05%.
On the 1-minute chart, buyers pushed the price from $519.53 to $524.61 before facing some selling pressure. AMD is now consolidating around $523.08. This suggests buyers are stepping back in, but I want to see confirmation before calling it a fresh breakout.
Market Activity
* Previous Close: $504.37
* Regular Session High: $532.00
* Regular Session Low: $480.50
* Overnight Price: $518.80
* Overnight Change: +3.05%
* Chart High: $524.61
* Current Chart Price: $523.08
My Trading Plan
I'm interested in a long position if AMD maintains its short-term recovery.
* Entry Zone: $521.50–$522.50
* DCA 1: $520.50
* DCA 2: $519.50
* TP1: $524.60
* TP2: $527.00
* TP3: $530.00
* Stop Loss: $518.80
I would prefer a clean break above $524.61 with strong buying pressure before adding to the position. A drop below $519.50 would weaken this short-term setup.
My focus is on whether AMD can turn $524.61 into support. If buyers manage that, another move toward $530 becomes interesting. I'm watching the confirmation, not chasing the candles.
I'm keeping a close eye on $AMD . The stock closed at $503.41, down just 0.17%, but overnight trading shows a strong recovery toward $518.80, up approximately 3.05%.
On the 1-minute chart, buyers pushed the price from $519.53 to $524.61 before facing some selling pressure. AMD is now consolidating around $523.08. This suggests buyers are stepping back in, but I want to see confirmation before calling it a fresh breakout.
Market Activity
* Previous Close: $504.37
* Regular Session High: $532.00
* Regular Session Low: $480.50
* Overnight Price: $518.80
* Overnight Change: +3.05%
* Chart High: $524.61
* Current Chart Price: $523.08
My Trading Plan
I'm interested in a long position if AMD maintains its short-term recovery.
* Entry Zone: $521.50–$522.50
* DCA 1: $520.50
* DCA 2: $519.50
* TP1: $524.60
* TP2: $527.00
* TP3: $530.00
* Stop Loss: $518.80
I would prefer a clean break above $524.61 with strong buying pressure before adding to the position. A drop below $519.50 would weaken this short-term setup.
My focus is on whether AMD can turn $524.61 into support. If buyers manage that, another move toward $530 becomes interesting. I'm watching the confirmation, not chasing the candles.
On the 1-minute chart, buyers pushed the price from $519.53 to $524.61 before facing some selling pressure. AMD is now consolidating around $523.08. This suggests buyers are stepping back in, but I want to see confirmation before calling it a fresh breakout.
Market Activity
* Previous Close: $504.37
* Regular Session High: $532.00
* Regular Session Low: $480.50
* Overnight Price: $518.80
* Overnight Change: +3.05%
* Chart High: $524.61
* Current Chart Price: $523.08
My Trading Plan
I'm interested in a long position if AMD maintains its short-term recovery.
* Entry Zone: $521.50–$522.50
* DCA 1: $520.50
* DCA 2: $519.50
* TP1: $524.60
* TP2: $527.00
* TP3: $530.00
* Stop Loss: $518.80
I would prefer a clean break above $524.61 with strong buying pressure before adding to the position. A drop below $519.50 would weaken this short-term setup.
My focus is on whether AMD can turn $524.61 into support. If buyers manage that, another move toward $530 becomes interesting. I'm watching the confirmation, not chasing the candles.
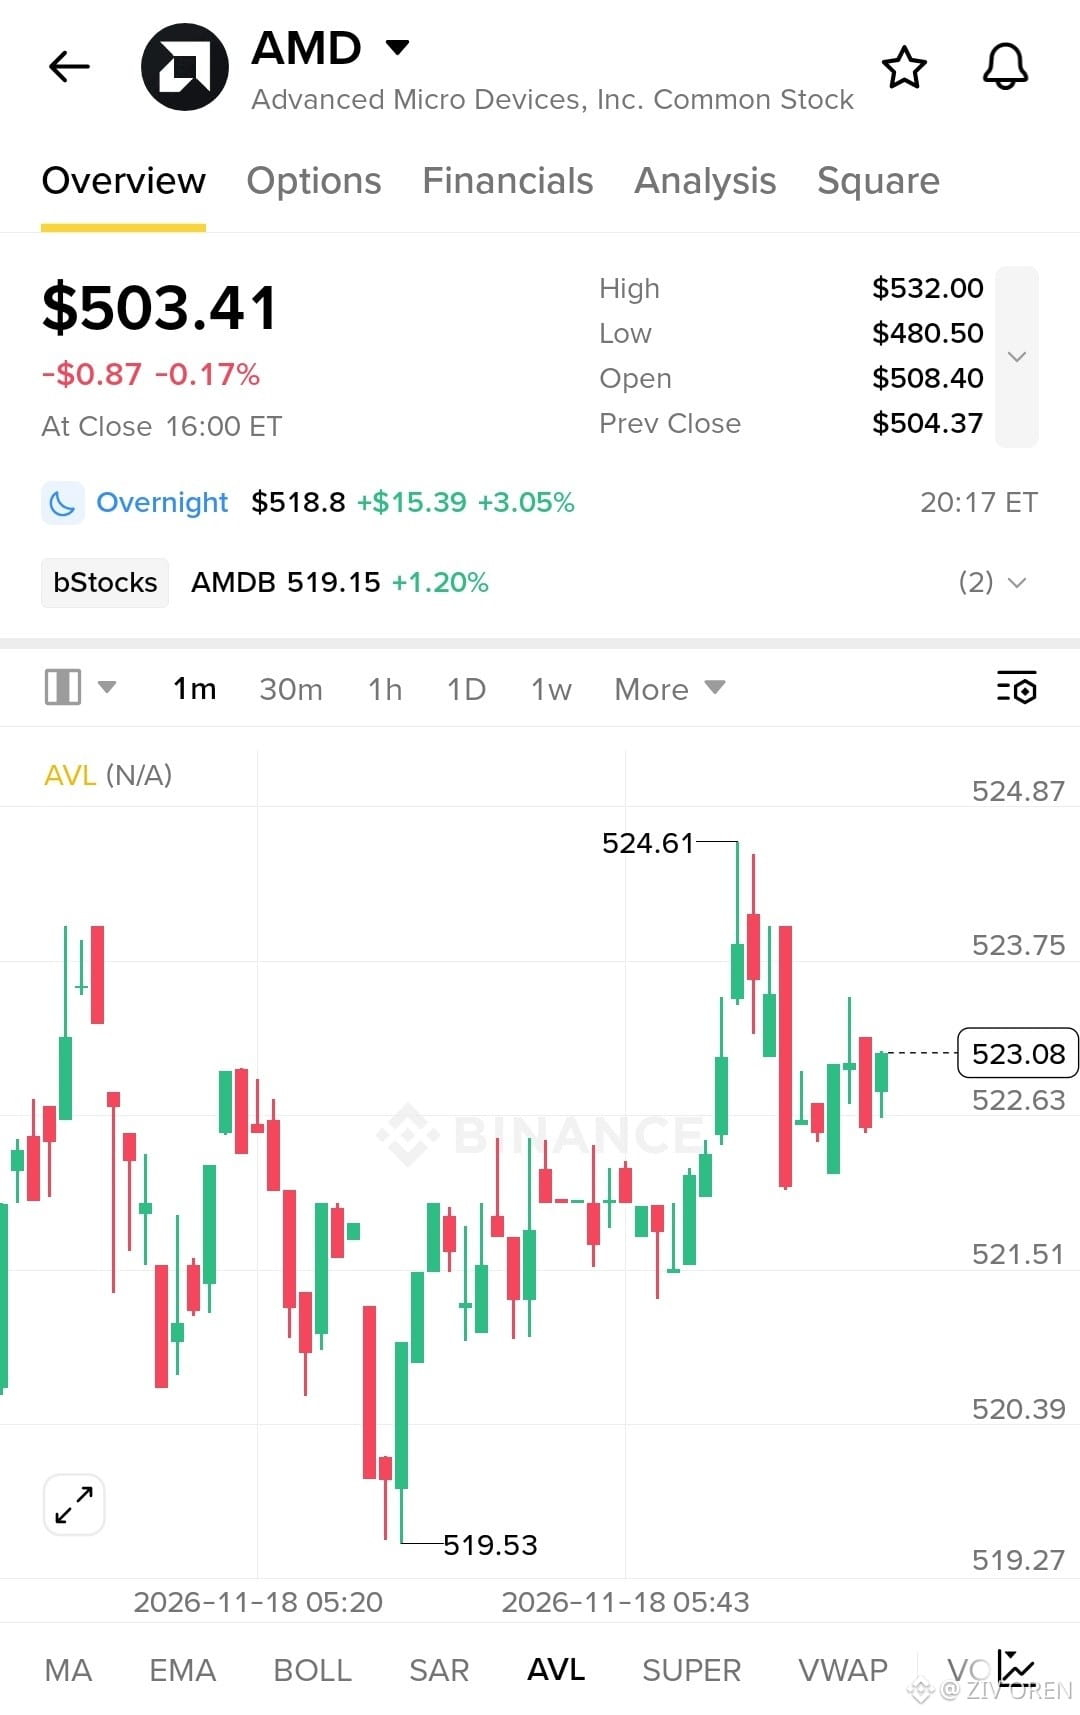
100
·
--
Рост
I'm watching $ETH around $1,815.97 on the 15-minute chart. After dropping sharply to $1,751.39, buyers managed to recover the price and push it toward $1,836.00. However, that rally has faced resistance, and ETH is now pulling back.
The short-term recovery is still interesting, but momentum has cooled. I want to see buyers defend the $1,803–$1,810 support zone before considering another entry. A break above $1,836 with strong buying pressure could open the door toward $1,850 and $1,870.
Volume & Market Activity
ETH is showing approximately $650.68M in 24-hour USDT trading volume, with 360,290.20 ETH traded. This indicates substantial market activity, but volume confirmation is still needed for the next breakout attempt.
My Trading Plan
I'm looking for a spot entry on a healthy pullback rather than chasing the recent recovery.
* First Entry: $1,808–$1,815
* DCA 1: $1,795–$1,803
* DCA 2: $1,780–$1,785
* Resistance 1: $1,836
* Resistance 2: $1,850
* TP1: $1,850
* TP2: $1,870
* TP3: $1,890
* Stop Loss: Below $1,765
I would prefer a confirmed 15-minute reclaim of $1,821 followed by a successful retest before adding aggressively. A breakdown below support would weaken this setup.
My focus is simple: ETH needs to reclaim $1,836 to prove that buyers are ready for another push. Until then, patience and disciplined entries matter more than chasing the move.
I'm watching $ETH around $1,815.97 on the 15-minute chart. After dropping sharply to $1,751.39, buyers managed to recover the price and push it toward $1,836.00. However, that rally has faced resistance, and ETH is now pulling back.
The short-term recovery is still interesting, but momentum has cooled. I want to see buyers defend the $1,803–$1,810 support zone before considering another entry. A break above $1,836 with strong buying pressure could open the door toward $1,850 and $1,870.
Volume & Market Activity
ETH is showing approximately $650.68M in 24-hour USDT trading volume, with 360,290.20 ETH traded. This indicates substantial market activity, but volume confirmation is still needed for the next breakout attempt.
My Trading Plan
I'm looking for a spot entry on a healthy pullback rather than chasing the recent recovery.
* First Entry: $1,808–$1,815
* DCA 1: $1,795–$1,803
* DCA 2: $1,780–$1,785
* Resistance 1: $1,836
* Resistance 2: $1,850
* TP1: $1,850
* TP2: $1,870
* TP3: $1,890
* Stop Loss: Below $1,765
I would prefer a confirmed 15-minute reclaim of $1,821 followed by a successful retest before adding aggressively. A breakdown below support would weaken this setup.
My focus is simple: ETH needs to reclaim $1,836 to prove that buyers are ready for another push. Until then, patience and disciplined entries matter more than chasing the move.
The short-term recovery is still interesting, but momentum has cooled. I want to see buyers defend the $1,803–$1,810 support zone before considering another entry. A break above $1,836 with strong buying pressure could open the door toward $1,850 and $1,870.
Volume & Market Activity
ETH is showing approximately $650.68M in 24-hour USDT trading volume, with 360,290.20 ETH traded. This indicates substantial market activity, but volume confirmation is still needed for the next breakout attempt.
My Trading Plan
I'm looking for a spot entry on a healthy pullback rather than chasing the recent recovery.
* First Entry: $1,808–$1,815
* DCA 1: $1,795–$1,803
* DCA 2: $1,780–$1,785
* Resistance 1: $1,836
* Resistance 2: $1,850
* TP1: $1,850
* TP2: $1,870
* TP3: $1,890
* Stop Loss: Below $1,765
I would prefer a confirmed 15-minute reclaim of $1,821 followed by a successful retest before adding aggressively. A breakdown below support would weaken this setup.
My focus is simple: ETH needs to reclaim $1,836 to prove that buyers are ready for another push. Until then, patience and disciplined entries matter more than chasing the move.
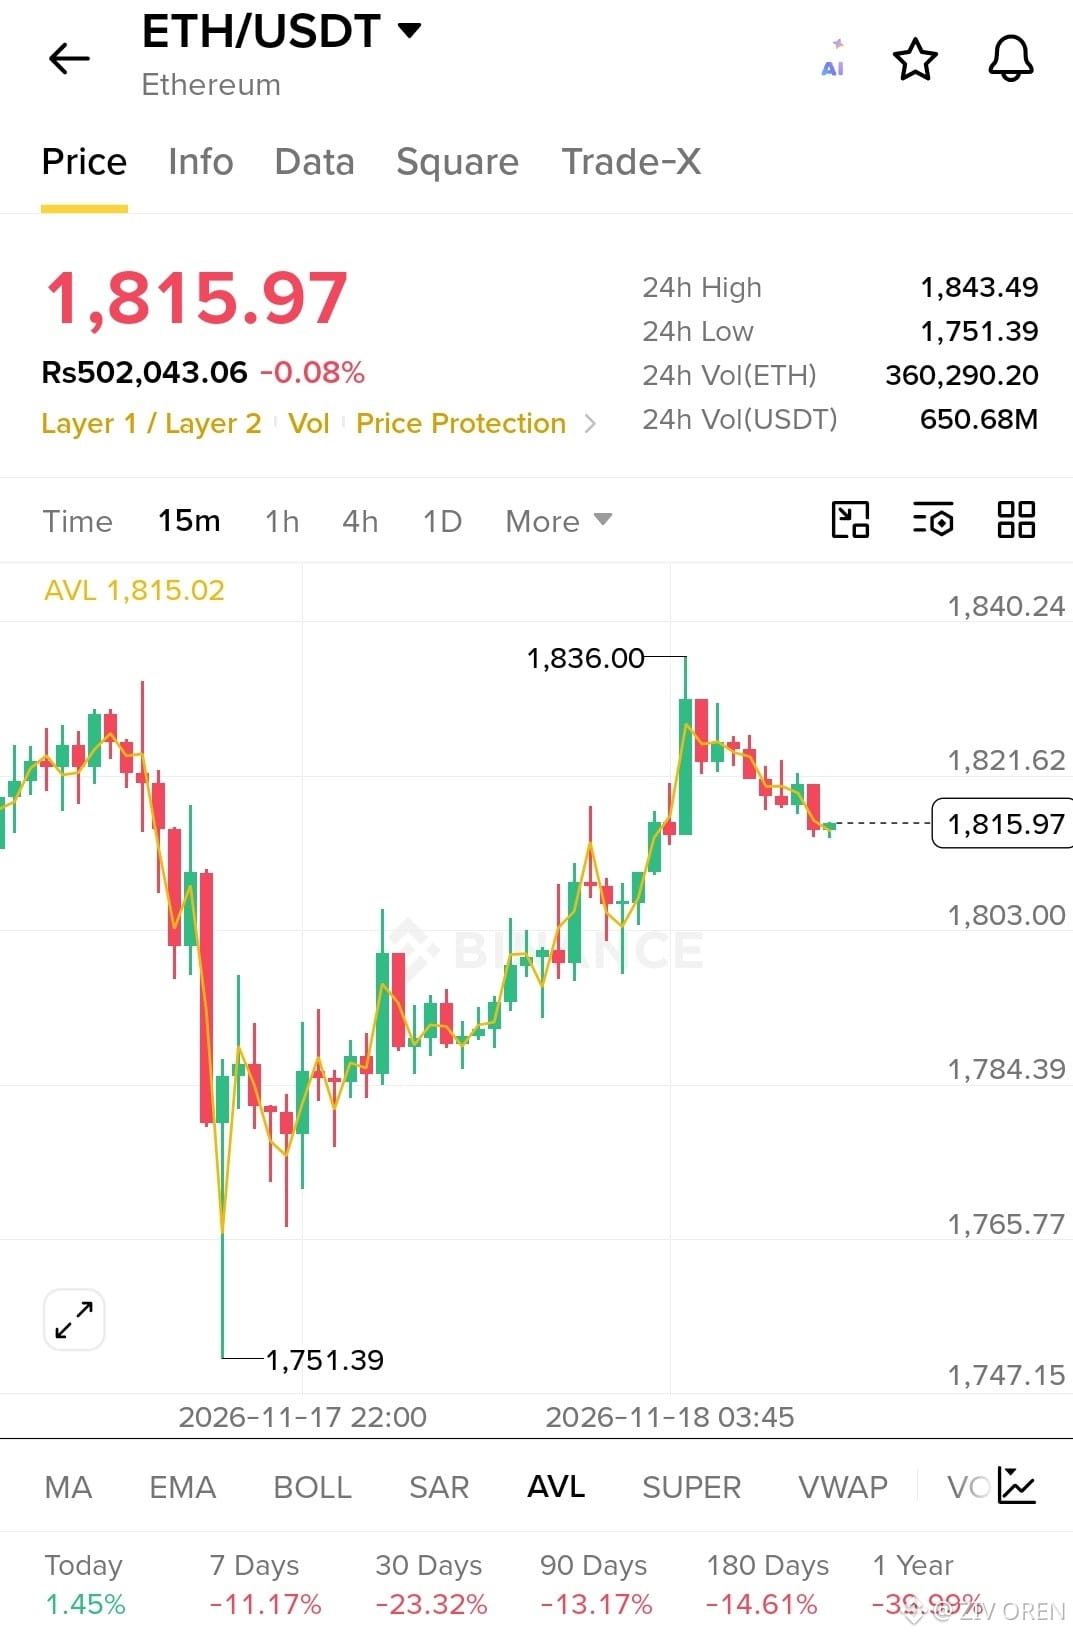
566
Войдите, чтобы посмотреть больше материала
Присоединяйтесь к пользователям криптовалют по всему миру на Binance Square
⚡️ Получайте новейшую и полезную информацию о криптоактивах.
💬 Нам доверяет крупнейшая в мире криптобиржа.
👍 Получите достоверные аналитические данные от верифицированных создателей контента.
Эл. почта/номер телефона
В тренде
NvidiaLoses$2.7TrillionInMonthAndAHalf
Просмотров: 12,751
103 обсуждают
Nvidia’s $2.7 Trillion Wipeout: When Narrative Overrides Numbers 📉
Crypto With Faisal
·Лайков: 7
·Просмотров: 4.5k
CanBTCReboundAfterFallingBelow60K?
Просмотров: 696,869
2,851 обсуждают
GlobalStocksFaceLongestLosingStreakSince2023
Просмотров: 250,239
1,925 обсуждают