

Herculis Gold Coin XAUH
100 Публикации

Herculis Gold Coin XAUH
Отправить жалобу
Заблокировать пользователя
XAUH is a payment crypto token fully backed by LBMA-certified fine gold bullion (999.9 purity), refined in Switzerland and listed on DEX and CEX.
4 подписок(и/а)
32 подписчиков(а)
143 понравилось
Посты
Все
Цитирования
Видео
$XAUH is now available on ChangeNOW!
A major step forward in expanding global access to tokenized physical gold.
ChangeNOW, operating since 2017, has built a global crypto ecosystem serving:
10M+ users worldwide 175 countries
5,000+ API partners
50,000+ exchanges every day
CghangeNow, this global infrastructure provides another gateway to $XAUH— a digital asset backed 1:1 by 1 gram of Swiss LBMA 999.9 fine gold, securely stored and insured in Switzerland.
Physical gold backing 24/7 digital access.
Easy crypto swaps.
Greater global accessibility.
The ChangeNOW ecosystem supports 1,000+ crypto assets, while its listing infrastructure connects assets with thousands of partners and millions of users.
Physical gold.
Digital mobility.
Global access.
$XAUH is now available on ChangeNOW!
A major step forward in expanding global access to tokenized physical gold.
ChangeNOW, operating since 2017, has built a global crypto ecosystem serving:
10M+ users worldwide 175 countries
5,000+ API partners
50,000+ exchanges every day
CghangeNow, this global infrastructure provides another gateway to $XAUH— a digital asset backed 1:1 by 1 gram of Swiss LBMA 999.9 fine gold, securely stored and insured in Switzerland.
Physical gold backing 24/7 digital access.
Easy crypto swaps.
Greater global accessibility.
The ChangeNOW ecosystem supports 1,000+ crypto assets, while its listing infrastructure connects assets with thousands of partners and millions of users.
Physical gold.
Digital mobility.
Global access.
A major step forward in expanding global access to tokenized physical gold.
ChangeNOW, operating since 2017, has built a global crypto ecosystem serving:
10M+ users worldwide 175 countries
5,000+ API partners
50,000+ exchanges every day
CghangeNow, this global infrastructure provides another gateway to $XAUH— a digital asset backed 1:1 by 1 gram of Swiss LBMA 999.9 fine gold, securely stored and insured in Switzerland.
Physical gold backing 24/7 digital access.
Easy crypto swaps.
Greater global accessibility.
The ChangeNOW ecosystem supports 1,000+ crypto assets, while its listing infrastructure connects assets with thousands of partners and millions of users.
Physical gold.
Digital mobility.
Global access.

5
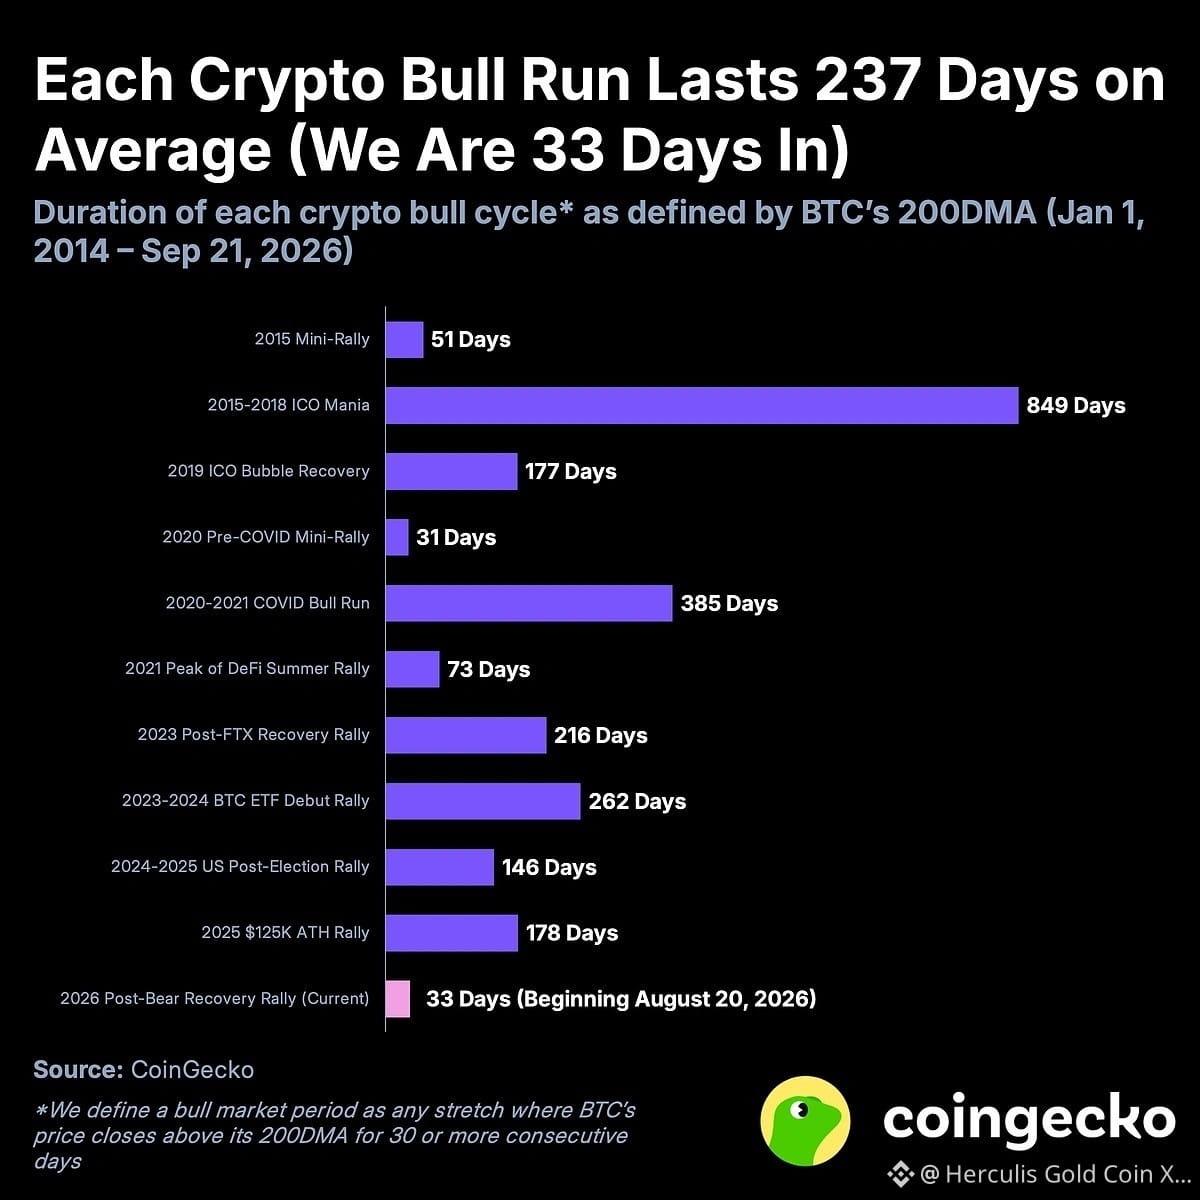
Bitcoin climbed as high as $87,158 on last week, up more than 25% since the latest bull cycle began on August 20, 2026. Historical data shows that Bitcoin bull cycles have lasted 169 days on average when excluding one unusually long cycle, with BTC gaining +130.5% from start to peak on average. This is Bitcoin's 11th bull market since 2014. Bitcoin closed above its 200-day moving average on August 20, bringing the 2025–2026 bear market to an end after 290 days. Using the inverse the bear market definition, we consider Bitcoin to be in a bull cycle when it trades above its 200-day moving average for at least 30 consecutive days. Across nine completed cycles since 2014, Bitcoin rose an average of +130.5% from the start of each bull cycle to its peak, excluding the extreme 2015–2018 rally.
Bitcoin climbed as high as $87,158 on last week, up more than 25% since the latest bull cycle began on August 20, 2026. Historical data shows that Bitcoin bull cycles have lasted 169 days on average when excluding one unusually long cycle, with BTC gaining +130.5% from start to peak on average. This is Bitcoin's 11th bull market since 2014. Bitcoin closed above its 200-day moving average on August 20, bringing the 2025–2026 bear market to an end after 290 days. Using the inverse the bear market definition, we consider Bitcoin to be in a bull cycle when it trades above its 200-day moving average for at least 30 consecutive days. Across nine completed cycles since 2014, Bitcoin rose an average of +130.5% from the start of each bull cycle to its peak, excluding the extreme 2015–2018 rally.
1
104
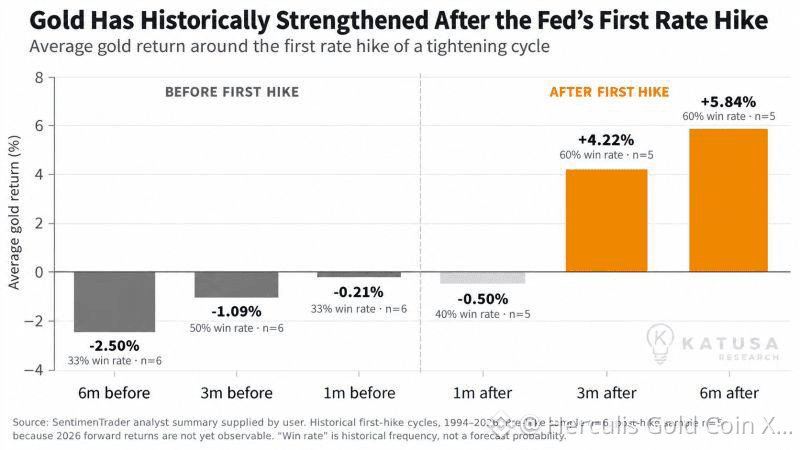
Gold Has Historically Strengthened After the Fed’s First Rate Hike.
Gold’s relationship with monetary tightening is often misunderstood. Conventional wisdom suggests that higher interest rates should automatically be negative for gold. History tells a more nuanced story.
As the chart shows, gold has historically weakened in the months leading up to the Federal Reserve’s first rate hike, as markets price in tighter monetary conditions ahead of time. But after the first hike, the pattern has tended to reverse.
Across the historical tightening cycles represented in the chart:
6 months before the first hike: gold averaged −2.50% 3 months before: −1.09% 1 month before: −0.21% 1 month after: −0.50% 3 months after: +4.22% 6 months after: +5.84%
The key point is that markets are forward-looking. By the time the Fed actually raises rates, a significant part of the tightening expectations may already be reflected in gold price.
Gold Has Historically Strengthened After the Fed’s First Rate Hike.
Gold’s relationship with monetary tightening is often misunderstood. Conventional wisdom suggests that higher interest rates should automatically be negative for gold. History tells a more nuanced story.
As the chart shows, gold has historically weakened in the months leading up to the Federal Reserve’s first rate hike, as markets price in tighter monetary conditions ahead of time. But after the first hike, the pattern has tended to reverse.
Across the historical tightening cycles represented in the chart:
6 months before the first hike: gold averaged −2.50% 3 months before: −1.09% 1 month before: −0.21% 1 month after: −0.50% 3 months after: +4.22% 6 months after: +5.84%
The key point is that markets are forward-looking. By the time the Fed actually raises rates, a significant part of the tightening expectations may already be reflected in gold price.
Gold’s relationship with monetary tightening is often misunderstood. Conventional wisdom suggests that higher interest rates should automatically be negative for gold. History tells a more nuanced story.
As the chart shows, gold has historically weakened in the months leading up to the Federal Reserve’s first rate hike, as markets price in tighter monetary conditions ahead of time. But after the first hike, the pattern has tended to reverse.
Across the historical tightening cycles represented in the chart:
6 months before the first hike: gold averaged −2.50% 3 months before: −1.09% 1 month before: −0.21% 1 month after: −0.50% 3 months after: +4.22% 6 months after: +5.84%
The key point is that markets are forward-looking. By the time the Fed actually raises rates, a significant part of the tightening expectations may already be reflected in gold price.
1
148
Keeping purchasing power of money is hard. A simple cup of coffee tells the story. If a coffee cost €1.00 in January 2002, that same euro would have needed to grow to roughly €1.69 by July 2026 just to preserve its purchasing power, based on Eurostat’s euro-area HICP illustration. That is the quiet effect of inflation: your account balance may stay the same while the amount it can buy gradually declines. For investors, the lesson is straightforward. Preserving wealth is not only about avoiding losses in nominal terms — it is about generating returns that protect purchasing power over time.
Keeping purchasing power of money is hard. A simple cup of coffee tells the story. If a coffee cost €1.00 in January 2002, that same euro would have needed to grow to roughly €1.69 by July 2026 just to preserve its purchasing power, based on Eurostat’s euro-area HICP illustration. That is the quiet effect of inflation: your account balance may stay the same while the amount it can buy gradually declines. For investors, the lesson is straightforward. Preserving wealth is not only about avoiding losses in nominal terms — it is about generating returns that protect purchasing power over time.
1
341
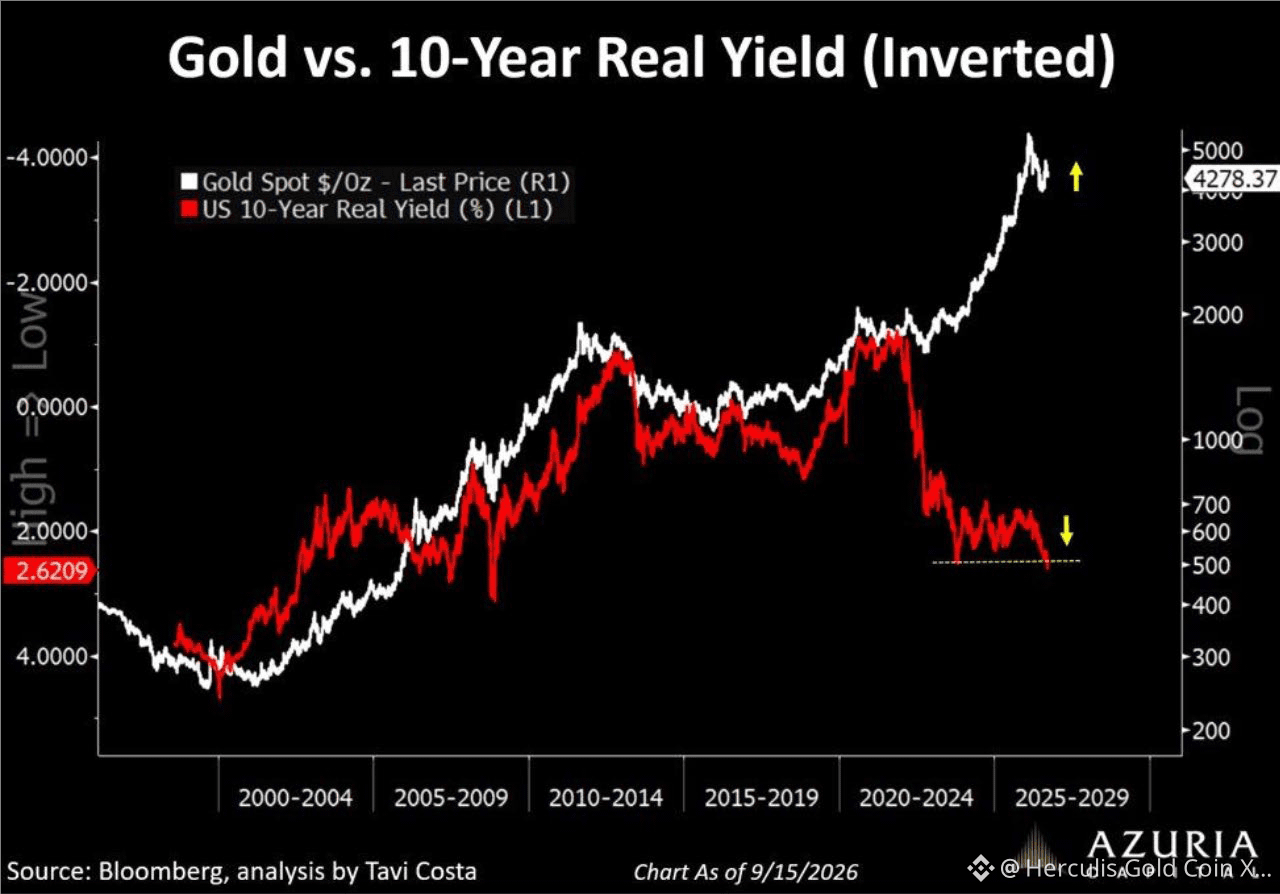
For decades, the rule was simple: rising real rates meant falling gold prices. This relationship worked because Treasuries served as the ultimate collateral—politically neutral and financially liquid. Since the freezing of Russian reserves in 2022, that neutrality has vanished. A dollar-denominated asset is no longer just a claim on the U.S.; it is also a claim subject to U.S. jurisdiction.
Gold is therefore no longer purchased solely as a hedge against inflation. It is acquired as collateral, without sanctions risk. This is why gold can rise alongside real interest rates. It is not a correlation anomaly. It is a revaluation of the political risk embedded in foreign exchange reserves.
And no one understands this shift better than Beijing. China’s officially reported holdings of Treasuries fell to $618 billion in July, their lowest level since August 2008, down from more than $1,300 billion at their peak in November 2013.
China is not engaging in a dramatic sell-off, as it has no interest in collapsing the asset it is divesting. It is orchestrating a slow, disciplined, and strategic shift toward gold, agency bonds, certain real assets, and its own financial ecosystem. Investors should follow suit.
China is not betting on the sudden collapse of the U.S.; it is protecting itself against the gradual erosion of the U.S.’s privilege. It isn’t selling a price. It’s selling a dependency.
For decades, the rule was simple: rising real rates meant falling gold prices. This relationship worked because Treasuries served as the ultimate collateral—politically neutral and financially liquid. Since the freezing of Russian reserves in 2022, that neutrality has vanished. A dollar-denominated asset is no longer just a claim on the U.S.; it is also a claim subject to U.S. jurisdiction.
Gold is therefore no longer purchased solely as a hedge against inflation. It is acquired as collateral, without sanctions risk. This is why gold can rise alongside real interest rates. It is not a correlation anomaly. It is a revaluation of the political risk embedded in foreign exchange reserves.
And no one understands this shift better than Beijing. China’s officially reported holdings of Treasuries fell to $618 billion in July, their lowest level since August 2008, down from more than $1,300 billion at their peak in November 2013.
China is not engaging in a dramatic sell-off, as it has no interest in collapsing the asset it is divesting. It is orchestrating a slow, disciplined, and strategic shift toward gold, agency bonds, certain real assets, and its own financial ecosystem. Investors should follow suit.
China is not betting on the sudden collapse of the U.S.; it is protecting itself against the gradual erosion of the U.S.’s privilege. It isn’t selling a price. It’s selling a dependency.
Gold is therefore no longer purchased solely as a hedge against inflation. It is acquired as collateral, without sanctions risk. This is why gold can rise alongside real interest rates. It is not a correlation anomaly. It is a revaluation of the political risk embedded in foreign exchange reserves.
And no one understands this shift better than Beijing. China’s officially reported holdings of Treasuries fell to $618 billion in July, their lowest level since August 2008, down from more than $1,300 billion at their peak in November 2013.
China is not engaging in a dramatic sell-off, as it has no interest in collapsing the asset it is divesting. It is orchestrating a slow, disciplined, and strategic shift toward gold, agency bonds, certain real assets, and its own financial ecosystem. Investors should follow suit.
China is not betting on the sudden collapse of the U.S.; it is protecting itself against the gradual erosion of the U.S.’s privilege. It isn’t selling a price. It’s selling a dependency.
1
163
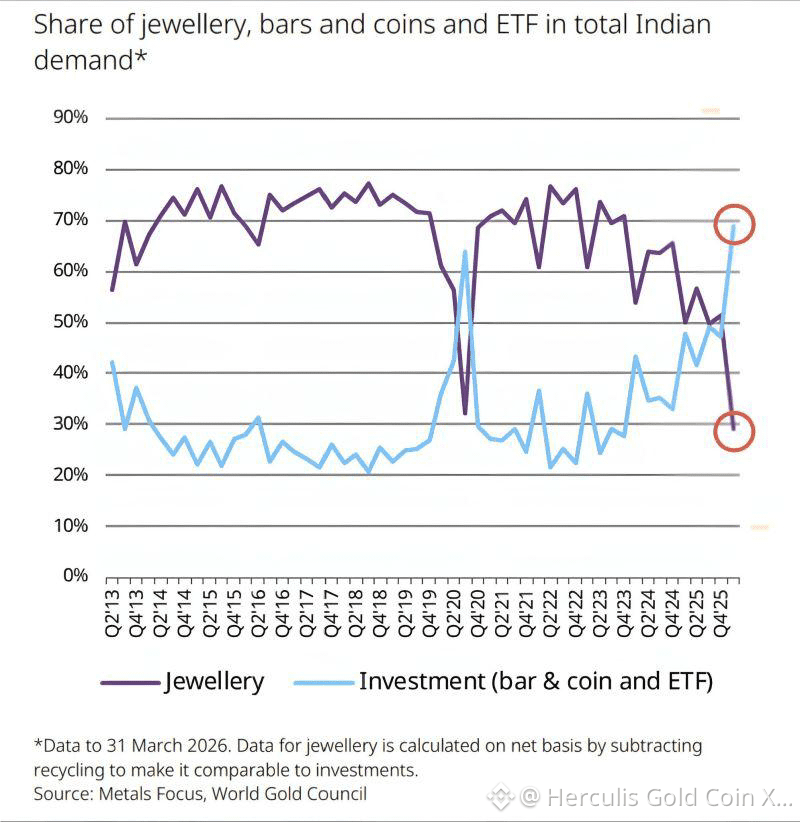
India’s Relationship With Gold Is Changing: Investment Is Overtaking Jewellery
For generations, India has been synonymous with gold jewellery. But the latest data point to an important shift: Indians are increasingly buying gold as an investment, not simply as jewellery.
In Q1 2026, investment demand across gold bars, coins and ETFs reached 82 tonnes, up 54% year-on-year, compared with 66 tonnes of jewellery demand. On the comparable net basis used in the chart, investment represented nearly 70% of Indian gold demand, while jewellery fell to around 30% — its lowest share in the World Gold Council’s data going back to 2000.
The physical market is particularly striking. Indians purchased 62 tonnes of bars and coins, up 34% YoY and the strongest first quarter since 2013. Gold ETFs added another record 20 tonnes, with ETF holdings reaching 115 tonnes by the end of March.
This is more than a change in how Indians buy gold. It is a change in why they own it.
This strengthens our long-term bullish view on gold. India is one of the world’s largest gold markets, and a structural migration from jewellery toward bars, coins, ETFs and digital forms of gold could make demand increasingly investment-driven and price-sensitive to the upside.
We would maintain a strategic 5–10% gold allocation in diversified portfolios and use meaningful price corrections to build positions rather than chase sharp rallies.
The bigger message from the chart is clear: gold in India is evolving from something you wear into something you invest in.
India’s Relationship With Gold Is Changing: Investment Is Overtaking Jewellery
For generations, India has been synonymous with gold jewellery. But the latest data point to an important shift: Indians are increasingly buying gold as an investment, not simply as jewellery.
In Q1 2026, investment demand across gold bars, coins and ETFs reached 82 tonnes, up 54% year-on-year, compared with 66 tonnes of jewellery demand. On the comparable net basis used in the chart, investment represented nearly 70% of Indian gold demand, while jewellery fell to around 30% — its lowest share in the World Gold Council’s data going back to 2000.
The physical market is particularly striking. Indians purchased 62 tonnes of bars and coins, up 34% YoY and the strongest first quarter since 2013. Gold ETFs added another record 20 tonnes, with ETF holdings reaching 115 tonnes by the end of March.
This is more than a change in how Indians buy gold. It is a change in why they own it.
This strengthens our long-term bullish view on gold. India is one of the world’s largest gold markets, and a structural migration from jewellery toward bars, coins, ETFs and digital forms of gold could make demand increasingly investment-driven and price-sensitive to the upside.
We would maintain a strategic 5–10% gold allocation in diversified portfolios and use meaningful price corrections to build positions rather than chase sharp rallies.
The bigger message from the chart is clear: gold in India is evolving from something you wear into something you invest in.
For generations, India has been synonymous with gold jewellery. But the latest data point to an important shift: Indians are increasingly buying gold as an investment, not simply as jewellery.
In Q1 2026, investment demand across gold bars, coins and ETFs reached 82 tonnes, up 54% year-on-year, compared with 66 tonnes of jewellery demand. On the comparable net basis used in the chart, investment represented nearly 70% of Indian gold demand, while jewellery fell to around 30% — its lowest share in the World Gold Council’s data going back to 2000.
The physical market is particularly striking. Indians purchased 62 tonnes of bars and coins, up 34% YoY and the strongest first quarter since 2013. Gold ETFs added another record 20 tonnes, with ETF holdings reaching 115 tonnes by the end of March.
This is more than a change in how Indians buy gold. It is a change in why they own it.
This strengthens our long-term bullish view on gold. India is one of the world’s largest gold markets, and a structural migration from jewellery toward bars, coins, ETFs and digital forms of gold could make demand increasingly investment-driven and price-sensitive to the upside.
We would maintain a strategic 5–10% gold allocation in diversified portfolios and use meaningful price corrections to build positions rather than chase sharp rallies.
The bigger message from the chart is clear: gold in India is evolving from something you wear into something you invest in.
1
169
Worried that US stocks are in a bubble? A bubble can keep inflating for months, sometimes years. Calling it a bubble tells you very little about how much upside is left before it bursts. That is the uncomfortable part of the investment decision. Take the Nasdaq-100. Since the beginning of 2020, it had gained around 233% (as of 10 September 2026 COB). Over the equivalent period starting in 1991, the gain was around 450%. And the 1990s rally was far from finished. From that point in September 1997, the index rose another 327% before reaching its March 2000 peak. Then it lost 83% by October 2002.
Worried that US stocks are in a bubble? A bubble can keep inflating for months, sometimes years. Calling it a bubble tells you very little about how much upside is left before it bursts. That is the uncomfortable part of the investment decision. Take the Nasdaq-100. Since the beginning of 2020, it had gained around 233% (as of 10 September 2026 COB). Over the equivalent period starting in 1991, the gain was around 450%. And the 1990s rally was far from finished. From that point in September 1997, the index rose another 327% before reaching its March 2000 peak. Then it lost 83% by October 2002.
1
112
Taiwan Semiconductor Manufacturing Company (TSMC) now represents an extraordinary 41.4% of the entire Taiwan Stock Exchange’s market capitalization.
The transformation has been remarkable: TSMC’s share of Taiwan’s equity market increased from 16.3% in 2016 to 22.7% in 2019, 28.9% in 2021, 38.3% in 2025, and approximately 41.4% by August 2026.
TSMC sits at the center of the global semiconductor ecosystem and is one of the principal beneficiaries of the AI infrastructure boom.
Taiwan Semiconductor Manufacturing Company (TSMC) now represents an extraordinary 41.4% of the entire Taiwan Stock Exchange’s market capitalization.
The transformation has been remarkable: TSMC’s share of Taiwan’s equity market increased from 16.3% in 2016 to 22.7% in 2019, 28.9% in 2021, 38.3% in 2025, and approximately 41.4% by August 2026.
TSMC sits at the center of the global semiconductor ecosystem and is one of the principal beneficiaries of the AI infrastructure boom.
The transformation has been remarkable: TSMC’s share of Taiwan’s equity market increased from 16.3% in 2016 to 22.7% in 2019, 28.9% in 2021, 38.3% in 2025, and approximately 41.4% by August 2026.
TSMC sits at the center of the global semiconductor ecosystem and is one of the principal beneficiaries of the AI infrastructure boom.
1
1
250
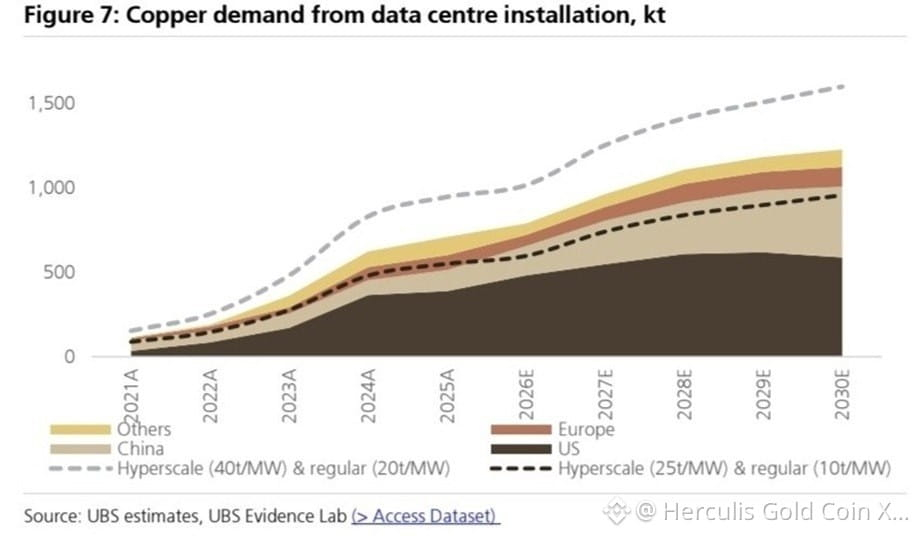
According to UBS, copper demand from data centers is expected to increase sharply through 2030 as the rapid expansion of AI infrastructure adds another major source of consumption to an already tight market.
At the same time, the era of easily accessible, low-cost copper appears to be coming to an end. Many new deposits are located in remote regions, at extreme depths, or contain lower-grade ores, making future production increasingly expensive. New mining projects are also unlikely to fully offset the natural decline in output from existing mines, creating persistent pressure on global supply.
Copper prices have already responded to this tightening environment, recently reaching record levels of around $14,800 per tonne.
Yet the longer-term investment case goes well beyond AI. Against a backdrop of stagnating supply, copper consumption continues to rise due to the global energy transition—including renewable energy, electric vehicles and massive investment in electricity grids—while the explosive expansion of AI data centers is creating an additional source of structural demand.
We remain structurally bullish on copper over a 3–5 year investment horizon, but after the recent move to record highs we would avoid aggressively chasing the metal at current prices.
Among equities, we would favor high-quality producers with large existing reserves, relatively low production costs and the ability to expand output without relying entirely on greenfield projects. Freeport-McMoRan, BHP, Rio Tinto, Antofagasta and Lundin Mining are particularly interesting candidates for further analysis.
According to UBS, copper demand from data centers is expected to increase sharply through 2030 as the rapid expansion of AI infrastructure adds another major source of consumption to an already tight market.
At the same time, the era of easily accessible, low-cost copper appears to be coming to an end. Many new deposits are located in remote regions, at extreme depths, or contain lower-grade ores, making future production increasingly expensive. New mining projects are also unlikely to fully offset the natural decline in output from existing mines, creating persistent pressure on global supply.
Copper prices have already responded to this tightening environment, recently reaching record levels of around $14,800 per tonne.
Yet the longer-term investment case goes well beyond AI. Against a backdrop of stagnating supply, copper consumption continues to rise due to the global energy transition—including renewable energy, electric vehicles and massive investment in electricity grids—while the explosive expansion of AI data centers is creating an additional source of structural demand.
We remain structurally bullish on copper over a 3–5 year investment horizon, but after the recent move to record highs we would avoid aggressively chasing the metal at current prices.
Among equities, we would favor high-quality producers with large existing reserves, relatively low production costs and the ability to expand output without relying entirely on greenfield projects. Freeport-McMoRan, BHP, Rio Tinto, Antofagasta and Lundin Mining are particularly interesting candidates for further analysis.
At the same time, the era of easily accessible, low-cost copper appears to be coming to an end. Many new deposits are located in remote regions, at extreme depths, or contain lower-grade ores, making future production increasingly expensive. New mining projects are also unlikely to fully offset the natural decline in output from existing mines, creating persistent pressure on global supply.
Copper prices have already responded to this tightening environment, recently reaching record levels of around $14,800 per tonne.
Yet the longer-term investment case goes well beyond AI. Against a backdrop of stagnating supply, copper consumption continues to rise due to the global energy transition—including renewable energy, electric vehicles and massive investment in electricity grids—while the explosive expansion of AI data centers is creating an additional source of structural demand.
We remain structurally bullish on copper over a 3–5 year investment horizon, but after the recent move to record highs we would avoid aggressively chasing the metal at current prices.
Among equities, we would favor high-quality producers with large existing reserves, relatively low production costs and the ability to expand output without relying entirely on greenfield projects. Freeport-McMoRan, BHP, Rio Tinto, Antofagasta and Lundin Mining are particularly interesting candidates for further analysis.
1
143
European Gold ETFs Attracted a Record $7.9 Billion
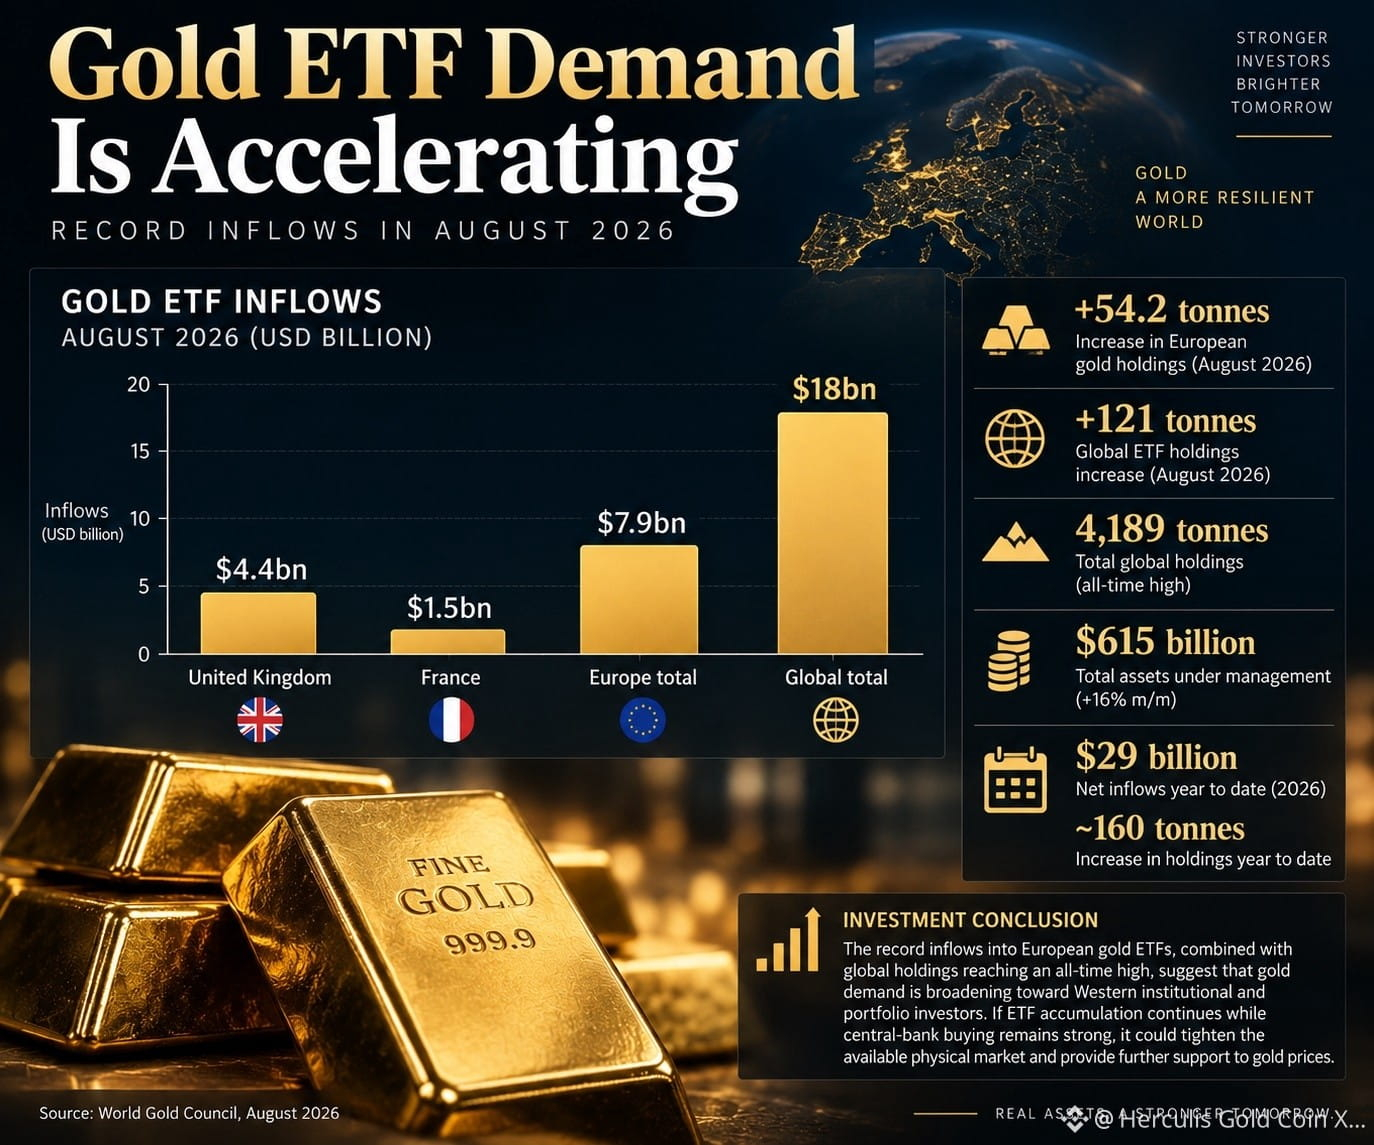
European exchange-traded funds backed by physical gold attracted a record $7.9 billion in August 2026, increasing their gold holdings by 54.2 tonnes, according to a report by the World Gold Council (WGC). The United Kingdom accounted for the largest share of inflows, at $4.4 billion, marking the country’s second-largest monthly inflow on record. French funds attracted $1.5 billion.
Globally, gold ETFs recorded $18 billion in inflows in August, the second-largest monthly inflow in dollar terms on record, according to the organization. Supported by strong investor inflows and rising gold prices, total assets under management increased by 16% during the month to $615 billion.
Global gold ETF holdings increased by 121 tonnes to an all-time high of 4,189 tonnes. Since the beginning of the year, gold ETFs have attracted $29 billion in net inflows and increased their physical gold holdings by approximately 160 tonnes. The record inflows into European gold ETFs, combined with global holdings reaching an all-time high, suggest that gold demand is broadening beyond central banks and Asian investors toward Western institutional and portfolio investors.
This is an important structural signal: if ETF accumulation continues while central-bank buying remains strong, incremental investment demand could tighten the available physical market and provide further support to gold prices.
European Gold ETFs Attracted a Record $7.9 Billion
European exchange-traded funds backed by physical gold attracted a record $7.9 billion in August 2026, increasing their gold holdings by 54.2 tonnes, according to a report by the World Gold Council (WGC). The United Kingdom accounted for the largest share of inflows, at $4.4 billion, marking the country’s second-largest monthly inflow on record. French funds attracted $1.5 billion.
Globally, gold ETFs recorded $18 billion in inflows in August, the second-largest monthly inflow in dollar terms on record, according to the organization. Supported by strong investor inflows and rising gold prices, total assets under management increased by 16% during the month to $615 billion.
Global gold ETF holdings increased by 121 tonnes to an all-time high of 4,189 tonnes. Since the beginning of the year, gold ETFs have attracted $29 billion in net inflows and increased their physical gold holdings by approximately 160 tonnes. The record inflows into European gold ETFs, combined with global holdings reaching an all-time high, suggest that gold demand is broadening beyond central banks and Asian investors toward Western institutional and portfolio investors.
This is an important structural signal: if ETF accumulation continues while central-bank buying remains strong, incremental investment demand could tighten the available physical market and provide further support to gold prices.
European exchange-traded funds backed by physical gold attracted a record $7.9 billion in August 2026, increasing their gold holdings by 54.2 tonnes, according to a report by the World Gold Council (WGC). The United Kingdom accounted for the largest share of inflows, at $4.4 billion, marking the country’s second-largest monthly inflow on record. French funds attracted $1.5 billion.
Globally, gold ETFs recorded $18 billion in inflows in August, the second-largest monthly inflow in dollar terms on record, according to the organization. Supported by strong investor inflows and rising gold prices, total assets under management increased by 16% during the month to $615 billion.
Global gold ETF holdings increased by 121 tonnes to an all-time high of 4,189 tonnes. Since the beginning of the year, gold ETFs have attracted $29 billion in net inflows and increased their physical gold holdings by approximately 160 tonnes. The record inflows into European gold ETFs, combined with global holdings reaching an all-time high, suggest that gold demand is broadening beyond central banks and Asian investors toward Western institutional and portfolio investors.
This is an important structural signal: if ETF accumulation continues while central-bank buying remains strong, incremental investment demand could tighten the available physical market and provide further support to gold prices.
1
189
🚀 Another milestone for Herculis Gold Coin ($XAUH).
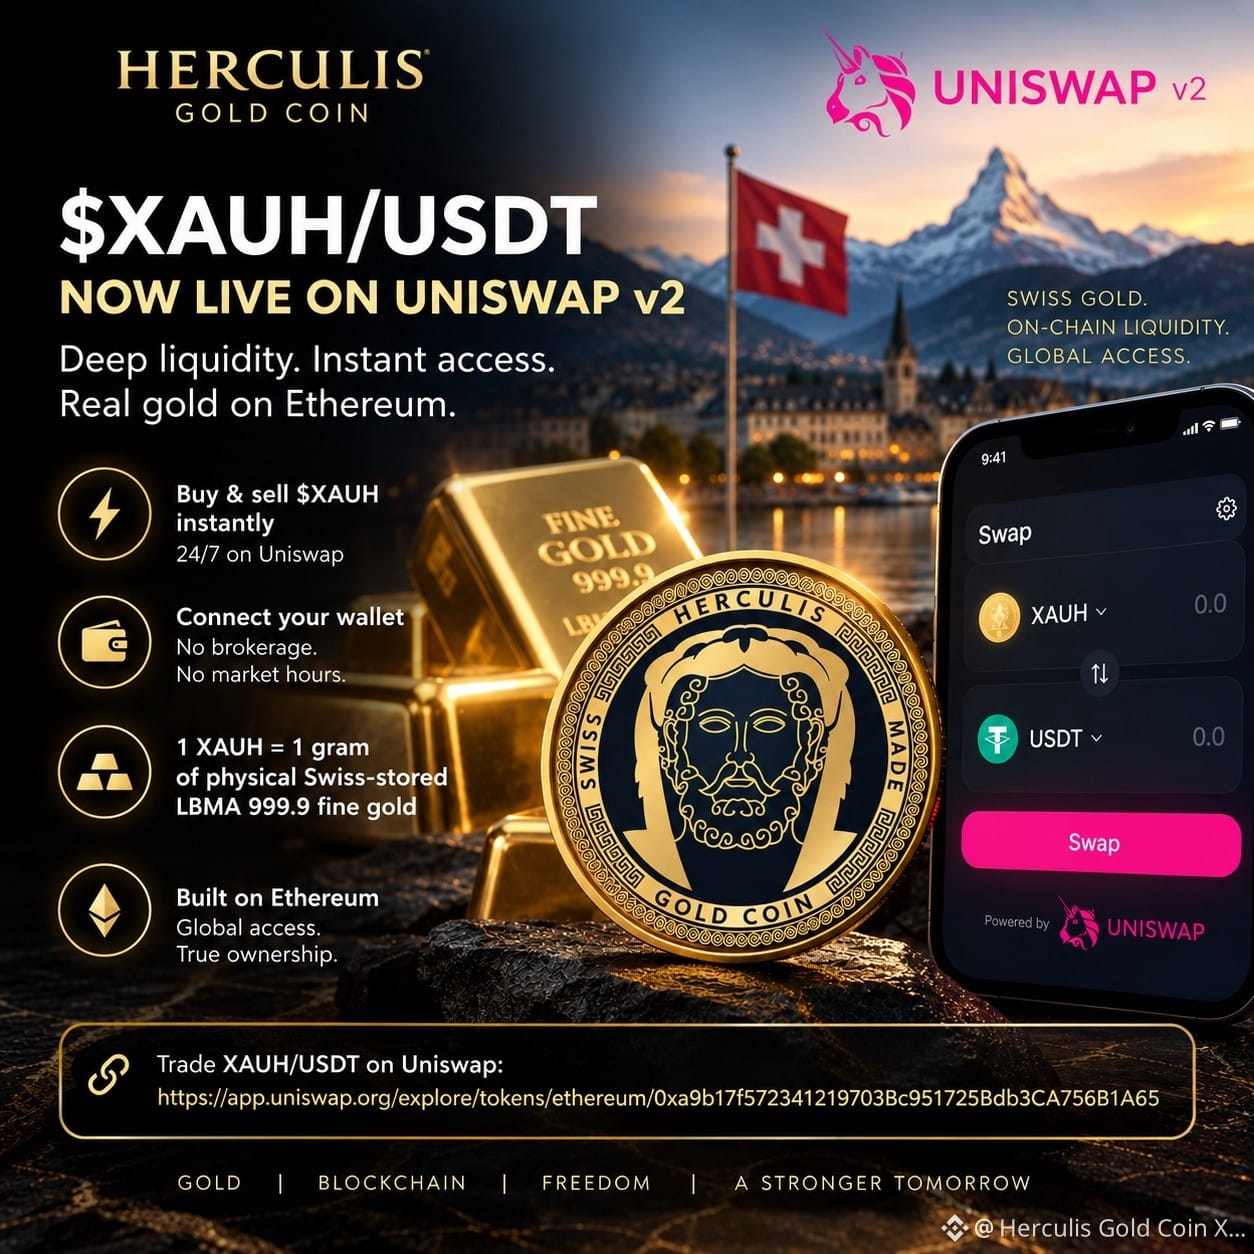
We’re proud to announce the launch of the XAUH/USDT liquidity pool on Uniswap v2, bringing deep on-chain liquidity to $XAUH on Ethereum.
Ethereum investors can now buy and sell $XAUH instantly on Uniswap — directly from their own wallets, 24/7.
🪙 1 XAUH = 1 gram of physical Swiss-stored LBMA 999.9 fine gold
No traditional brokerage. No market-hour restrictions. Just connect your wallet and access physical gold through the Ethereum ecosystem.
🔗 Trade XAUH/USDT on Uniswap:
Swiss gold. On-chain liquidity. Global access.
$XAUH #Gold #RWA #Tokenization #Ethereum #Uniswap #DeFi
🚀 Another milestone for Herculis Gold Coin ($XAUH).
We’re proud to announce the launch of the XAUH/USDT liquidity pool on Uniswap v2, bringing deep on-chain liquidity to $XAUH on Ethereum.
Ethereum investors can now buy and sell $XAUH instantly on Uniswap — directly from their own wallets, 24/7.
🪙 1 XAUH = 1 gram of physical Swiss-stored LBMA 999.9 fine gold
No traditional brokerage. No market-hour restrictions. Just connect your wallet and access physical gold through the Ethereum ecosystem.
🔗 Trade XAUH/USDT on Uniswap:
Swiss gold. On-chain liquidity. Global access.
$XAUH #Gold #RWA #Tokenization #Ethereum #Uniswap #DeFi
We’re proud to announce the launch of the XAUH/USDT liquidity pool on Uniswap v2, bringing deep on-chain liquidity to $XAUH on Ethereum.
Ethereum investors can now buy and sell $XAUH instantly on Uniswap — directly from their own wallets, 24/7.
🪙 1 XAUH = 1 gram of physical Swiss-stored LBMA 999.9 fine gold
No traditional brokerage. No market-hour restrictions. Just connect your wallet and access physical gold through the Ethereum ecosystem.
🔗 Trade XAUH/USDT on Uniswap:
Swiss gold. On-chain liquidity. Global access.
$XAUH #Gold #RWA #Tokenization #Ethereum #Uniswap #DeFi
1
68
Robinhood is having a monster day.
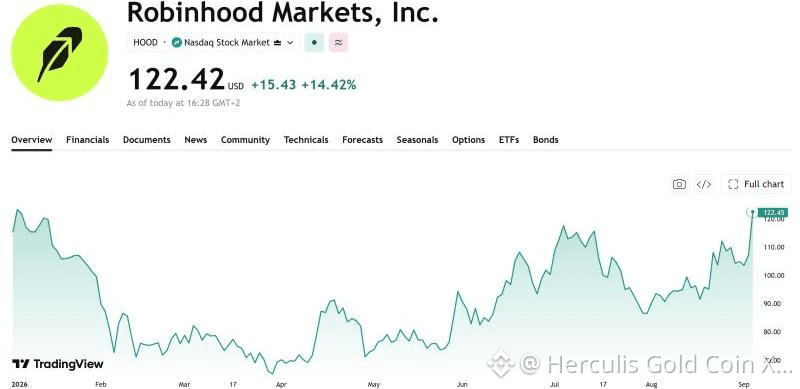
$HOOD surged 13% as Robinhood Chain smashed its previous records, generating approximately $4 million in onchain revenue on September 2—more than any other blockchain that day. Its ambition is to bring stocks, ETFs, private assets and other real-world assets onchain—enabling 24/7 trading, self-custody, lending and integration with decentralized finance. Morgan Stanley just upgraded $HOOD to Overweight with a $150 price target, while Scotiabank initiated coverage with a Sector Outperform rating. Robinhood is increasingly evolving from a retail brokerage into a vertically integrated onchain financial infrastructure platform. If Robinhood Chain succeeds in moving meaningful volumes of equities, ETFs and private assets onchain, $HOOD could capture economics across trading, tokenization, custody, lending and settlement. $HOOD offers one of the clearest public-equity plays on the convergence of traditional finance, tokenization and crypto infrastructure.
Robinhood is having a monster day.
$HOOD surged 13% as Robinhood Chain smashed its previous records, generating approximately $4 million in onchain revenue on September 2—more than any other blockchain that day. Its ambition is to bring stocks, ETFs, private assets and other real-world assets onchain—enabling 24/7 trading, self-custody, lending and integration with decentralized finance. Morgan Stanley just upgraded $HOOD to Overweight with a $150 price target, while Scotiabank initiated coverage with a Sector Outperform rating. Robinhood is increasingly evolving from a retail brokerage into a vertically integrated onchain financial infrastructure platform. If Robinhood Chain succeeds in moving meaningful volumes of equities, ETFs and private assets onchain, $HOOD could capture economics across trading, tokenization, custody, lending and settlement. $HOOD offers one of the clearest public-equity plays on the convergence of traditional finance, tokenization and crypto infrastructure.
$HOOD surged 13% as Robinhood Chain smashed its previous records, generating approximately $4 million in onchain revenue on September 2—more than any other blockchain that day. Its ambition is to bring stocks, ETFs, private assets and other real-world assets onchain—enabling 24/7 trading, self-custody, lending and integration with decentralized finance. Morgan Stanley just upgraded $HOOD to Overweight with a $150 price target, while Scotiabank initiated coverage with a Sector Outperform rating. Robinhood is increasingly evolving from a retail brokerage into a vertically integrated onchain financial infrastructure platform. If Robinhood Chain succeeds in moving meaningful volumes of equities, ETFs and private assets onchain, $HOOD could capture economics across trading, tokenization, custody, lending and settlement. $HOOD offers one of the clearest public-equity plays on the convergence of traditional finance, tokenization and crypto infrastructure.
1
168
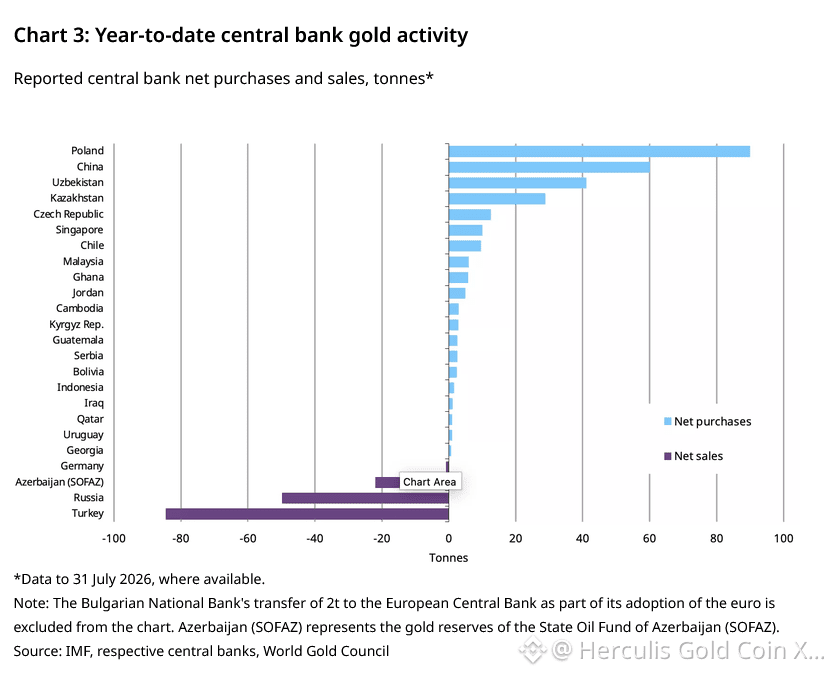
Central banks remain positive in July with net buying of 23t.
- The National Bank of Poland continued its gold accumulation streak, with 8t purchased this month. The country has accumulated 640t of gold – against its target of 700t – or approximately 28% of its total reserves.
- In its 21st consecutive month of buying the Central Bank of China added 20t to its gold reserves in July. China has added 60t to its gold reserves y-t-d. China’s official gold reserves now stand at 8% of total reserves, or around 2,366t.
- The Central Bank of Uzbekistan sold 1t this month; its y-t-d gold purchases stand at 40t. Uzbekistan’s gold now stands at 87% of total reserves, or about 431t.
- The Czech National Bank also bought 2t of gold this month in its 41st consecutive month of net buying. The central bank has bought 12t y-t-d, bringing its gold holdings to 6% of its total reserves, or 84t.
- The National Bank of Kazakhstan (NBK) bought 1t of gold this month. On a y-t-d basis the NBK has accumulated 29t of gold and is one of the top five gold accumulators globally. Kazakhstan’s gold holdings stand at 75% of its total reserves.
- The Central Bank of Russia continued its net sales in July, offloading a further 6t of gold. Russia has sold 50t of gold y-t-d, lowering its total gold holdings to 2,277t.
- The Central Bank of the Republic of Turkey sold 1t of gold this month, bringing its total sales so far this year to 85t.
Central banks remain positive in July with net buying of 23t.
- The National Bank of Poland continued its gold accumulation streak, with 8t purchased this month. The country has accumulated 640t of gold – against its target of 700t – or approximately 28% of its total reserves.
- In its 21st consecutive month of buying the Central Bank of China added 20t to its gold reserves in July. China has added 60t to its gold reserves y-t-d. China’s official gold reserves now stand at 8% of total reserves, or around 2,366t.
- The Central Bank of Uzbekistan sold 1t this month; its y-t-d gold purchases stand at 40t. Uzbekistan’s gold now stands at 87% of total reserves, or about 431t.
- The Czech National Bank also bought 2t of gold this month in its 41st consecutive month of net buying. The central bank has bought 12t y-t-d, bringing its gold holdings to 6% of its total reserves, or 84t.
- The National Bank of Kazakhstan (NBK) bought 1t of gold this month. On a y-t-d basis the NBK has accumulated 29t of gold and is one of the top five gold accumulators globally. Kazakhstan’s gold holdings stand at 75% of its total reserves.
- The Central Bank of Russia continued its net sales in July, offloading a further 6t of gold. Russia has sold 50t of gold y-t-d, lowering its total gold holdings to 2,277t.
- The Central Bank of the Republic of Turkey sold 1t of gold this month, bringing its total sales so far this year to 85t.
- The National Bank of Poland continued its gold accumulation streak, with 8t purchased this month. The country has accumulated 640t of gold – against its target of 700t – or approximately 28% of its total reserves.
- In its 21st consecutive month of buying the Central Bank of China added 20t to its gold reserves in July. China has added 60t to its gold reserves y-t-d. China’s official gold reserves now stand at 8% of total reserves, or around 2,366t.
- The Central Bank of Uzbekistan sold 1t this month; its y-t-d gold purchases stand at 40t. Uzbekistan’s gold now stands at 87% of total reserves, or about 431t.
- The Czech National Bank also bought 2t of gold this month in its 41st consecutive month of net buying. The central bank has bought 12t y-t-d, bringing its gold holdings to 6% of its total reserves, or 84t.
- The National Bank of Kazakhstan (NBK) bought 1t of gold this month. On a y-t-d basis the NBK has accumulated 29t of gold and is one of the top five gold accumulators globally. Kazakhstan’s gold holdings stand at 75% of its total reserves.
- The Central Bank of Russia continued its net sales in July, offloading a further 6t of gold. Russia has sold 50t of gold y-t-d, lowering its total gold holdings to 2,277t.
- The Central Bank of the Republic of Turkey sold 1t of gold this month, bringing its total sales so far this year to 85t.
1
4
·
--
Рост
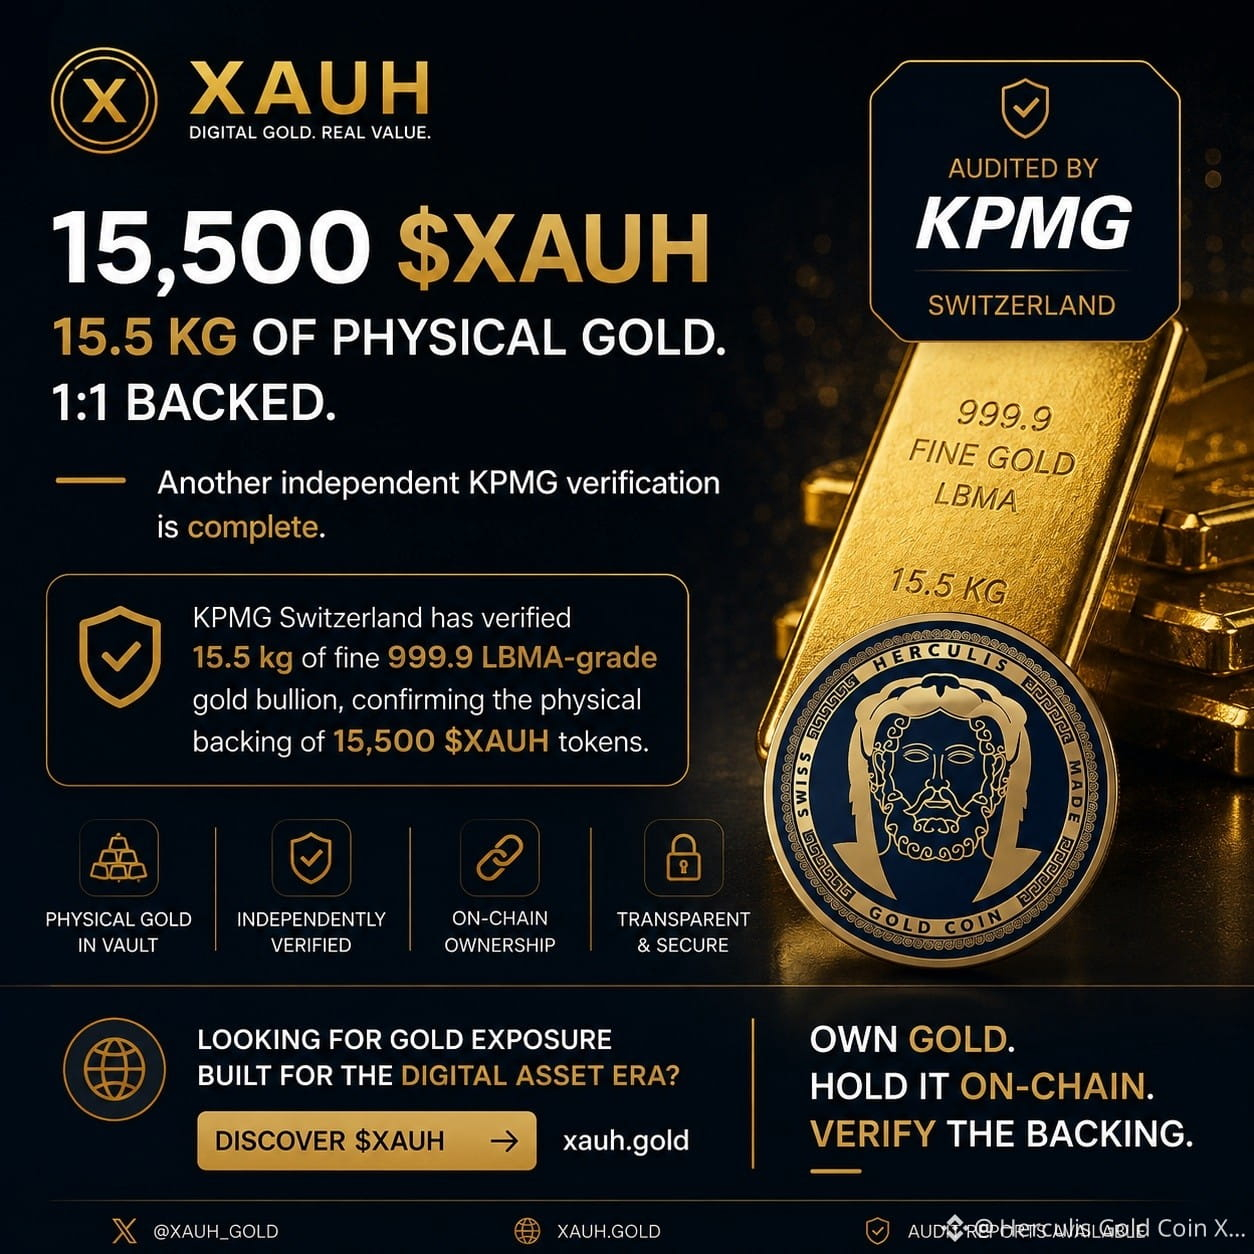
🥇 15,500 $XAUH. 15.5 KG OF PHYSICAL GOLD. 1:1 BACKED.
Another independent KPMG verification is complete.
KPMG Switzerland has verified 15.5 kg of fine 999.9 LBMA-grade gold bullion, confirming the physical backing of 15,500 $XAUH tokens.
The full KPMG audit report is available on www.xauh.gold
No algorithmic backing.
No synthetic exposure.
No promises.
1 $XAUH = 1 gram of physical gold.
On-chain ownership. Physical gold backing. Independently verified.
Real gold. Real reserves. On-chain. 🔗🥇
Looking for gold exposure built for the digital asset era?
Discover $XAUH → xauh.gold
Own gold. Hold it on-chain. Verify the backing.
🥇 15,500 $XAUH. 15.5 KG OF PHYSICAL GOLD. 1:1 BACKED.
Another independent KPMG verification is complete.
KPMG Switzerland has verified 15.5 kg of fine 999.9 LBMA-grade gold bullion, confirming the physical backing of 15,500 $XAUH tokens.
The full KPMG audit report is available on www.xauh.gold
No algorithmic backing.
No synthetic exposure.
No promises.
1 $XAUH = 1 gram of physical gold.
On-chain ownership. Physical gold backing. Independently verified.
Real gold. Real reserves. On-chain. 🔗🥇
Looking for gold exposure built for the digital asset era?
Discover $XAUH → xauh.gold
Own gold. Hold it on-chain. Verify the backing.
Another independent KPMG verification is complete.
KPMG Switzerland has verified 15.5 kg of fine 999.9 LBMA-grade gold bullion, confirming the physical backing of 15,500 $XAUH tokens.
The full KPMG audit report is available on www.xauh.gold
No algorithmic backing.
No synthetic exposure.
No promises.
1 $XAUH = 1 gram of physical gold.
On-chain ownership. Physical gold backing. Independently verified.
Real gold. Real reserves. On-chain. 🔗🥇
Looking for gold exposure built for the digital asset era?
Discover $XAUH → xauh.gold
Own gold. Hold it on-chain. Verify the backing.
1
100
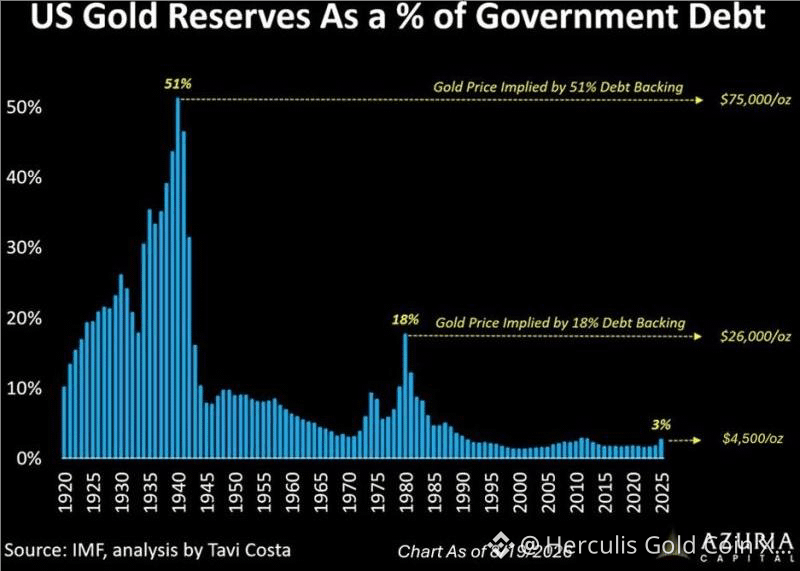
The chart is about the market value of US gold reserves relative to government debt, rather than Treasuries literally being “backed” by gold. The underlying contrast is nevertheless striking: US official gold holdings remain around 8,133 tonnes, while the debt stock has expanded enormously.
The key point is not that the US needs to return to a gold standard. It is the enormous divergence between a virtually fixed stock of sovereign gold and an exponentially expanding stock of sovereign liabilities. The US cannot manufacture additional gold to match additional debt.
This creates an asymmetric adjustment mechanism: if confidence in sovereign debt deteriorates, the quantity of US gold does not need to increase—the dollar price of that fixed gold stock can do the adjustment. The chart illustrates the scale: restoring the roughly 18% gold-to-debt valuation seen around 1980 would imply gold around $26,000/oz, while a return toward the extraordinary WWII-era ratio would imply approximately $75,000/oz. These are valuation scenarios, not price forecasts. Similar historical analysis puts the early-1940s ratio around 51%.
The investment case for gold therefore extends beyond inflation or interest-rate expectations. Gold increasingly represents insurance against sovereign balance-sheet expansion and monetary dilution. With the denominator—government debt—continuing to grow while the US gold stock remains essentially fixed, even a modest strategic revaluation of gold relative to sovereign liabilities could support substantially higher prices.
The chart is about the market value of US gold reserves relative to government debt, rather than Treasuries literally being “backed” by gold. The underlying contrast is nevertheless striking: US official gold holdings remain around 8,133 tonnes, while the debt stock has expanded enormously.
The key point is not that the US needs to return to a gold standard. It is the enormous divergence between a virtually fixed stock of sovereign gold and an exponentially expanding stock of sovereign liabilities. The US cannot manufacture additional gold to match additional debt.
This creates an asymmetric adjustment mechanism: if confidence in sovereign debt deteriorates, the quantity of US gold does not need to increase—the dollar price of that fixed gold stock can do the adjustment. The chart illustrates the scale: restoring the roughly 18% gold-to-debt valuation seen around 1980 would imply gold around $26,000/oz, while a return toward the extraordinary WWII-era ratio would imply approximately $75,000/oz. These are valuation scenarios, not price forecasts. Similar historical analysis puts the early-1940s ratio around 51%.
The investment case for gold therefore extends beyond inflation or interest-rate expectations. Gold increasingly represents insurance against sovereign balance-sheet expansion and monetary dilution. With the denominator—government debt—continuing to grow while the US gold stock remains essentially fixed, even a modest strategic revaluation of gold relative to sovereign liabilities could support substantially higher prices.
The key point is not that the US needs to return to a gold standard. It is the enormous divergence between a virtually fixed stock of sovereign gold and an exponentially expanding stock of sovereign liabilities. The US cannot manufacture additional gold to match additional debt.
This creates an asymmetric adjustment mechanism: if confidence in sovereign debt deteriorates, the quantity of US gold does not need to increase—the dollar price of that fixed gold stock can do the adjustment. The chart illustrates the scale: restoring the roughly 18% gold-to-debt valuation seen around 1980 would imply gold around $26,000/oz, while a return toward the extraordinary WWII-era ratio would imply approximately $75,000/oz. These are valuation scenarios, not price forecasts. Similar historical analysis puts the early-1940s ratio around 51%.
The investment case for gold therefore extends beyond inflation or interest-rate expectations. Gold increasingly represents insurance against sovereign balance-sheet expansion and monetary dilution. With the denominator—government debt—continuing to grow while the US gold stock remains essentially fixed, even a modest strategic revaluation of gold relative to sovereign liabilities could support substantially higher prices.
1
127
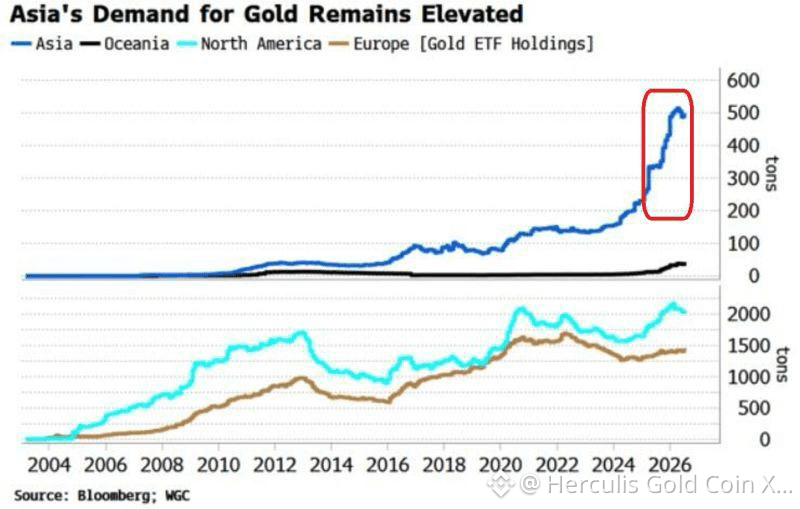
Gold demand in Asia remains exceptionally strong.
Asian gold ETF holdings have more than doubled over the past year, surpassing 500 tonnes for the first time this century, with China driving much of the surge. By contrast, gold ETF holdings in North America and Europe have remained broadly stable. What is changing is investor demand. Asian investors, particularly in China, are accumulating gold at an accelerating pace.
What makes this move particularly important is its scale and speed: Asian ETF holdings are not merely recovering—they are breaking decisively above their previous historical range. This suggests a structural reallocation toward gold, increasingly driven by private investors alongside already-strong central-bank demand.
The acceleration of Asian demand adds another structural pillar to the gold bull market. If Chinese and broader Asian allocations continue converging toward Western levels while Western ETF holdings merely remain stable, the resulting incremental demand could materially tighten the physical market. We therefore remain strategically bullish on gold and would view meaningful price corrections as accumulation opportunities rather than a reversal of the long-term trend.
Gold demand in Asia remains exceptionally strong.
Asian gold ETF holdings have more than doubled over the past year, surpassing 500 tonnes for the first time this century, with China driving much of the surge. By contrast, gold ETF holdings in North America and Europe have remained broadly stable. What is changing is investor demand. Asian investors, particularly in China, are accumulating gold at an accelerating pace.
What makes this move particularly important is its scale and speed: Asian ETF holdings are not merely recovering—they are breaking decisively above their previous historical range. This suggests a structural reallocation toward gold, increasingly driven by private investors alongside already-strong central-bank demand.
The acceleration of Asian demand adds another structural pillar to the gold bull market. If Chinese and broader Asian allocations continue converging toward Western levels while Western ETF holdings merely remain stable, the resulting incremental demand could materially tighten the physical market. We therefore remain strategically bullish on gold and would view meaningful price corrections as accumulation opportunities rather than a reversal of the long-term trend.
Asian gold ETF holdings have more than doubled over the past year, surpassing 500 tonnes for the first time this century, with China driving much of the surge. By contrast, gold ETF holdings in North America and Europe have remained broadly stable. What is changing is investor demand. Asian investors, particularly in China, are accumulating gold at an accelerating pace.
What makes this move particularly important is its scale and speed: Asian ETF holdings are not merely recovering—they are breaking decisively above their previous historical range. This suggests a structural reallocation toward gold, increasingly driven by private investors alongside already-strong central-bank demand.
The acceleration of Asian demand adds another structural pillar to the gold bull market. If Chinese and broader Asian allocations continue converging toward Western levels while Western ETF holdings merely remain stable, the resulting incremental demand could materially tighten the physical market. We therefore remain strategically bullish on gold and would view meaningful price corrections as accumulation opportunities rather than a reversal of the long-term trend.
1
147
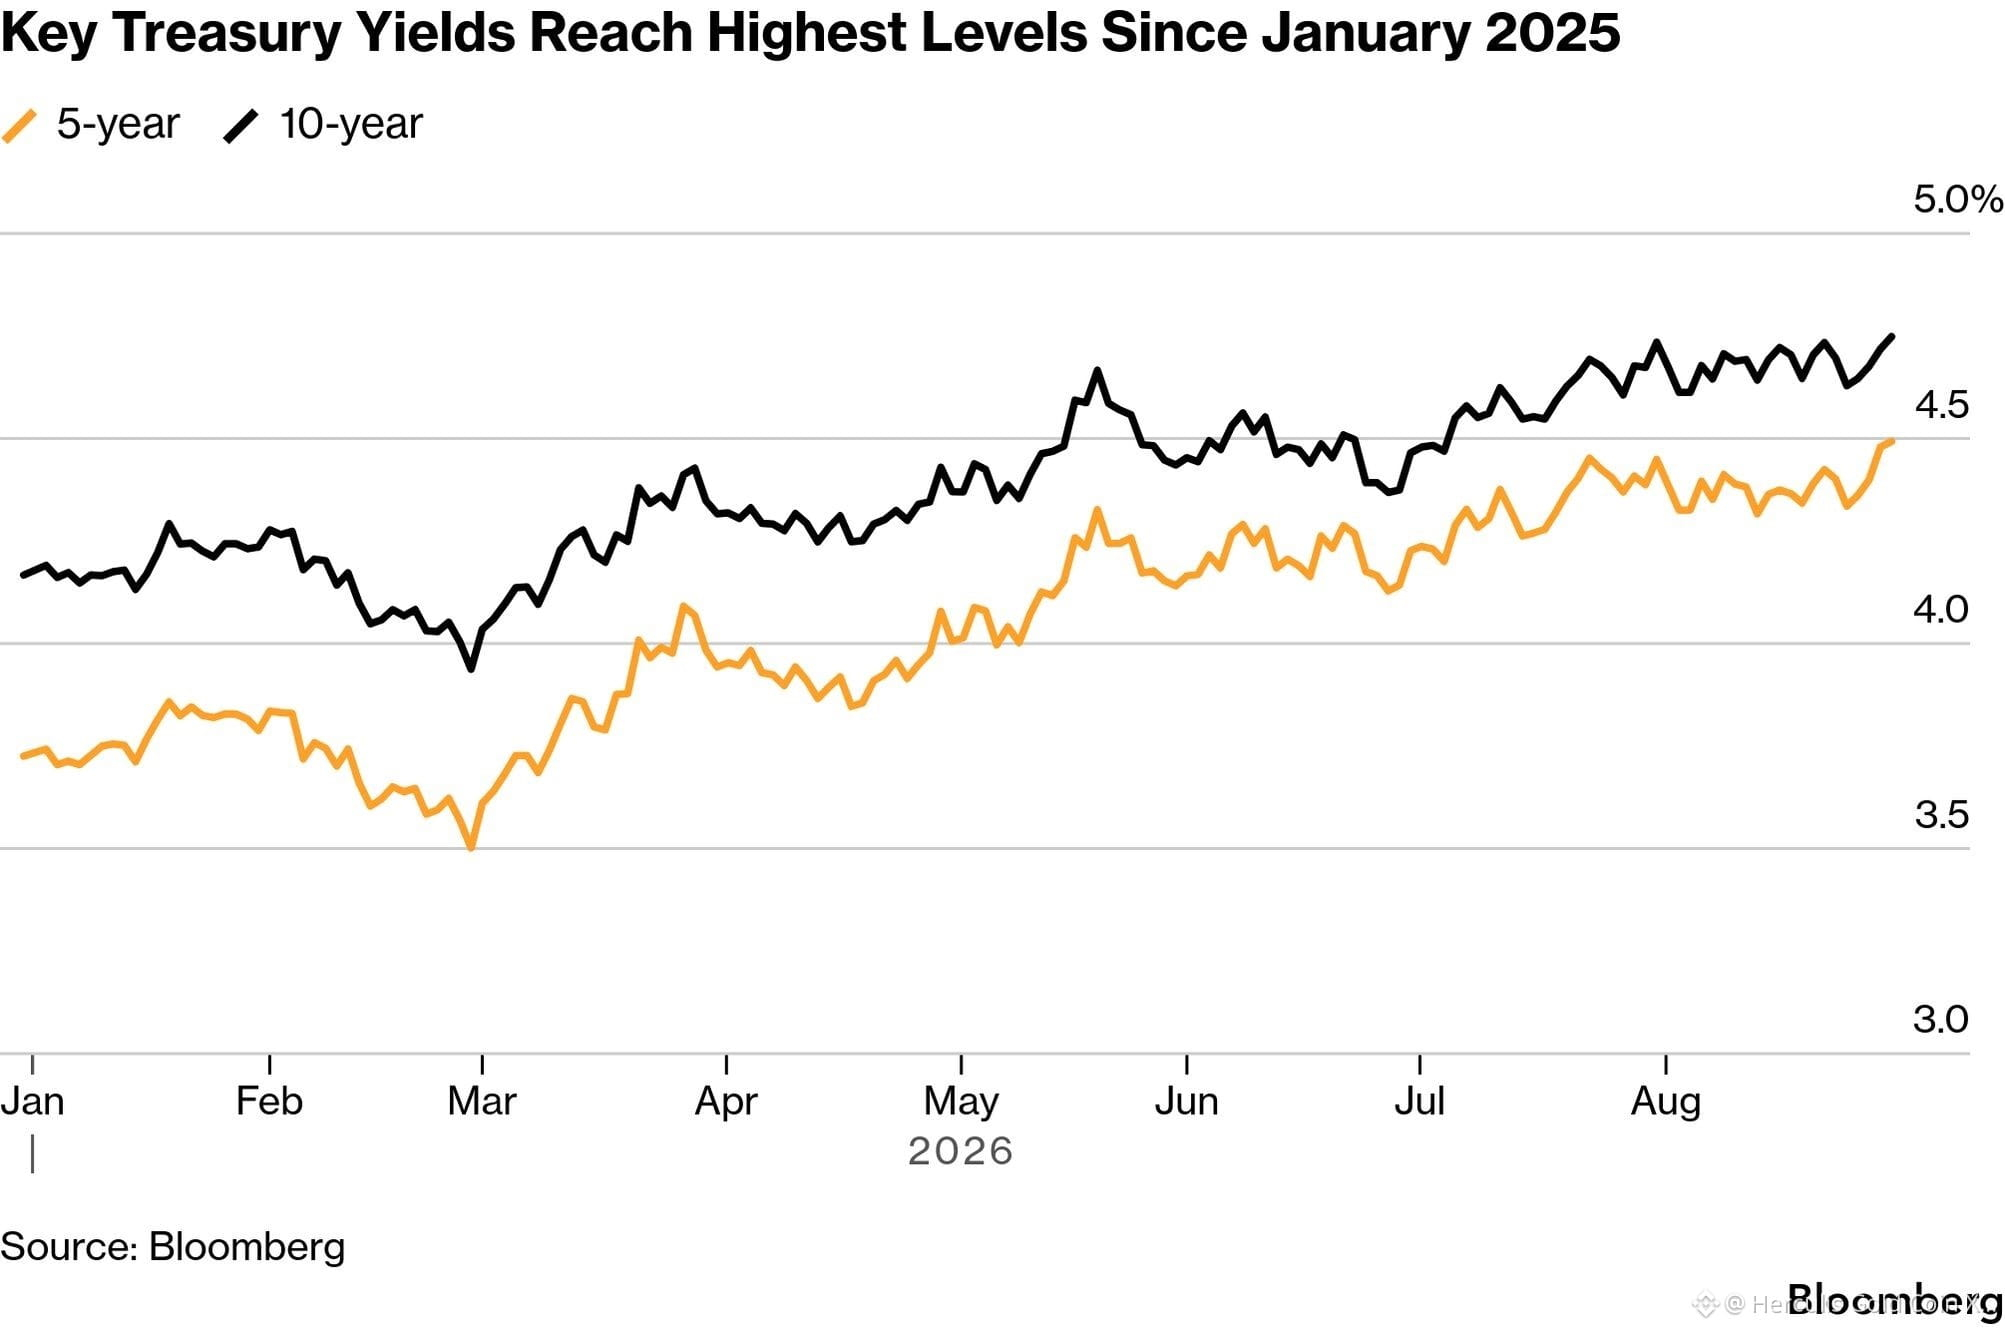
Yields for the US 10-year Treasury topped 4.75% on Monday for the first time since January 2025 following a spike in oil prices tied to renewed fighting around the Strait of Hormuz and the stalemate in the six-month US-Israel war with Iran.
Five-year yields are also hitting their highest level since early last year while 30-year yields, the subject of much discussion in the aftermath of the US exceeding $40 trillion in debt, surpassed last week’s highs.
In parallel,
- the 10-year Japanese JGB has hit 3% for the first time since 1996,
- Australian bonds are back at their 2011 levels,
- And Europe is following suit:
o France at 4.16%, the highest since 2008;
o Germany at 3.31%, the highest since 2011;
o Italy at 4.15%;
o Spain at 3.76%;
o Portugal at 3.67%.
The bond market does not necessarily signal an imminent crisis. It points to something more specific and more troubling. The inflation, budget deficits, war, artificial intelligence, and the erosion of political credibility must now all be financed simultaneously.
Welcome to the war of attrition on capital. Who wins?
Yields for the US 10-year Treasury topped 4.75% on Monday for the first time since January 2025 following a spike in oil prices tied to renewed fighting around the Strait of Hormuz and the stalemate in the six-month US-Israel war with Iran.
Five-year yields are also hitting their highest level since early last year while 30-year yields, the subject of much discussion in the aftermath of the US exceeding $40 trillion in debt, surpassed last week’s highs.
In parallel,
- the 10-year Japanese JGB has hit 3% for the first time since 1996,
- Australian bonds are back at their 2011 levels,
- And Europe is following suit:
o France at 4.16%, the highest since 2008;
o Germany at 3.31%, the highest since 2011;
o Italy at 4.15%;
o Spain at 3.76%;
o Portugal at 3.67%.
The bond market does not necessarily signal an imminent crisis. It points to something more specific and more troubling. The inflation, budget deficits, war, artificial intelligence, and the erosion of political credibility must now all be financed simultaneously.
Welcome to the war of attrition on capital. Who wins?
Five-year yields are also hitting their highest level since early last year while 30-year yields, the subject of much discussion in the aftermath of the US exceeding $40 trillion in debt, surpassed last week’s highs.
In parallel,
- the 10-year Japanese JGB has hit 3% for the first time since 1996,
- Australian bonds are back at their 2011 levels,
- And Europe is following suit:
o France at 4.16%, the highest since 2008;
o Germany at 3.31%, the highest since 2011;
o Italy at 4.15%;
o Spain at 3.76%;
o Portugal at 3.67%.
The bond market does not necessarily signal an imminent crisis. It points to something more specific and more troubling. The inflation, budget deficits, war, artificial intelligence, and the erosion of political credibility must now all be financed simultaneously.
Welcome to the war of attrition on capital. Who wins?
1
2
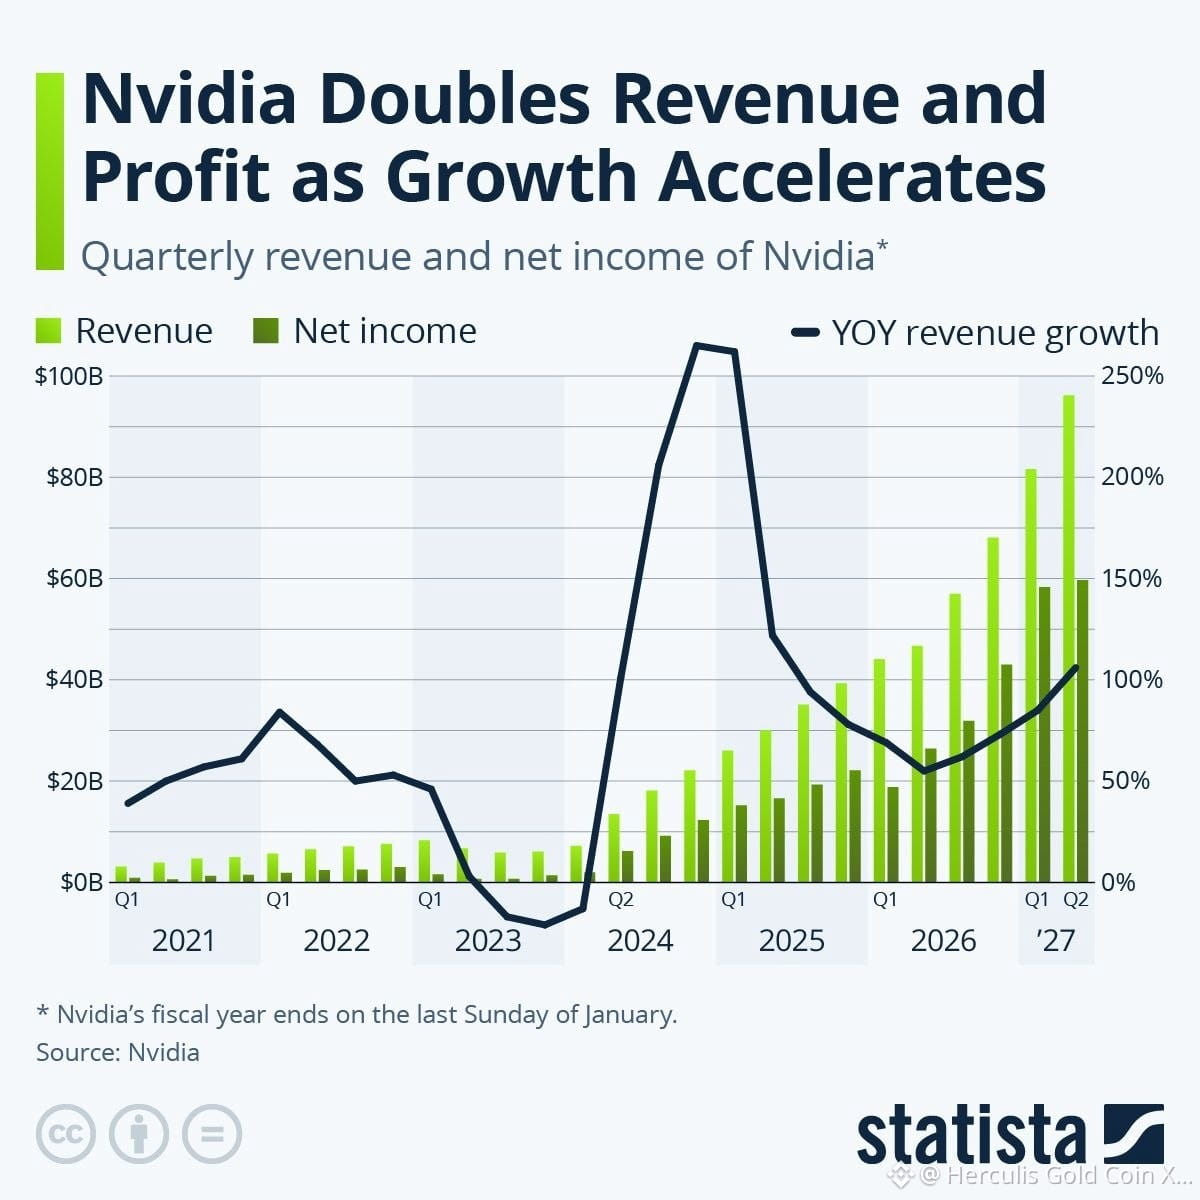
For the three months ended July 26, Nvidia’s revenue rose 106% year over year to $96.2 billion, exceeding both its own forecast of $91 billion and analysts’ expectations.
Net income more than doubled to $59.7 billion, putting Nvidia firmly on track to become the world’s first company with annual net profit exceeding $200 billion.
The most remarkable feature is not simply 106% revenue growth, but the economics behind it: Nvidia maintained a 75% gross margin while generating $59.7 billion of quarterly net income. Data Center revenue reached $89.0 billion, up 117% YoY. This combination of hyper-growth, exceptional margins and relatively low capital intensity makes Nvidia increasingly resemble a highly scalable AI infrastructure platform rather than a conventional semiconductor manufacturer.
Nvidia remains one of the highest-quality structural exposures to global AI infrastructure spending.
Nvidia is no longer merely selling the chips behind the AI revolution—it is capturing an extraordinary share of the economic value being created by it.
For the three months ended July 26, Nvidia’s revenue rose 106% year over year to $96.2 billion, exceeding both its own forecast of $91 billion and analysts’ expectations.
Net income more than doubled to $59.7 billion, putting Nvidia firmly on track to become the world’s first company with annual net profit exceeding $200 billion.
The most remarkable feature is not simply 106% revenue growth, but the economics behind it: Nvidia maintained a 75% gross margin while generating $59.7 billion of quarterly net income. Data Center revenue reached $89.0 billion, up 117% YoY. This combination of hyper-growth, exceptional margins and relatively low capital intensity makes Nvidia increasingly resemble a highly scalable AI infrastructure platform rather than a conventional semiconductor manufacturer.
Nvidia remains one of the highest-quality structural exposures to global AI infrastructure spending.
Nvidia is no longer merely selling the chips behind the AI revolution—it is capturing an extraordinary share of the economic value being created by it.
Net income more than doubled to $59.7 billion, putting Nvidia firmly on track to become the world’s first company with annual net profit exceeding $200 billion.
The most remarkable feature is not simply 106% revenue growth, but the economics behind it: Nvidia maintained a 75% gross margin while generating $59.7 billion of quarterly net income. Data Center revenue reached $89.0 billion, up 117% YoY. This combination of hyper-growth, exceptional margins and relatively low capital intensity makes Nvidia increasingly resemble a highly scalable AI infrastructure platform rather than a conventional semiconductor manufacturer.
Nvidia remains one of the highest-quality structural exposures to global AI infrastructure spending.
Nvidia is no longer merely selling the chips behind the AI revolution—it is capturing an extraordinary share of the economic value being created by it.
1
130
🏆 Another important milestone for Herculis Gold Coin ($XAUH)!
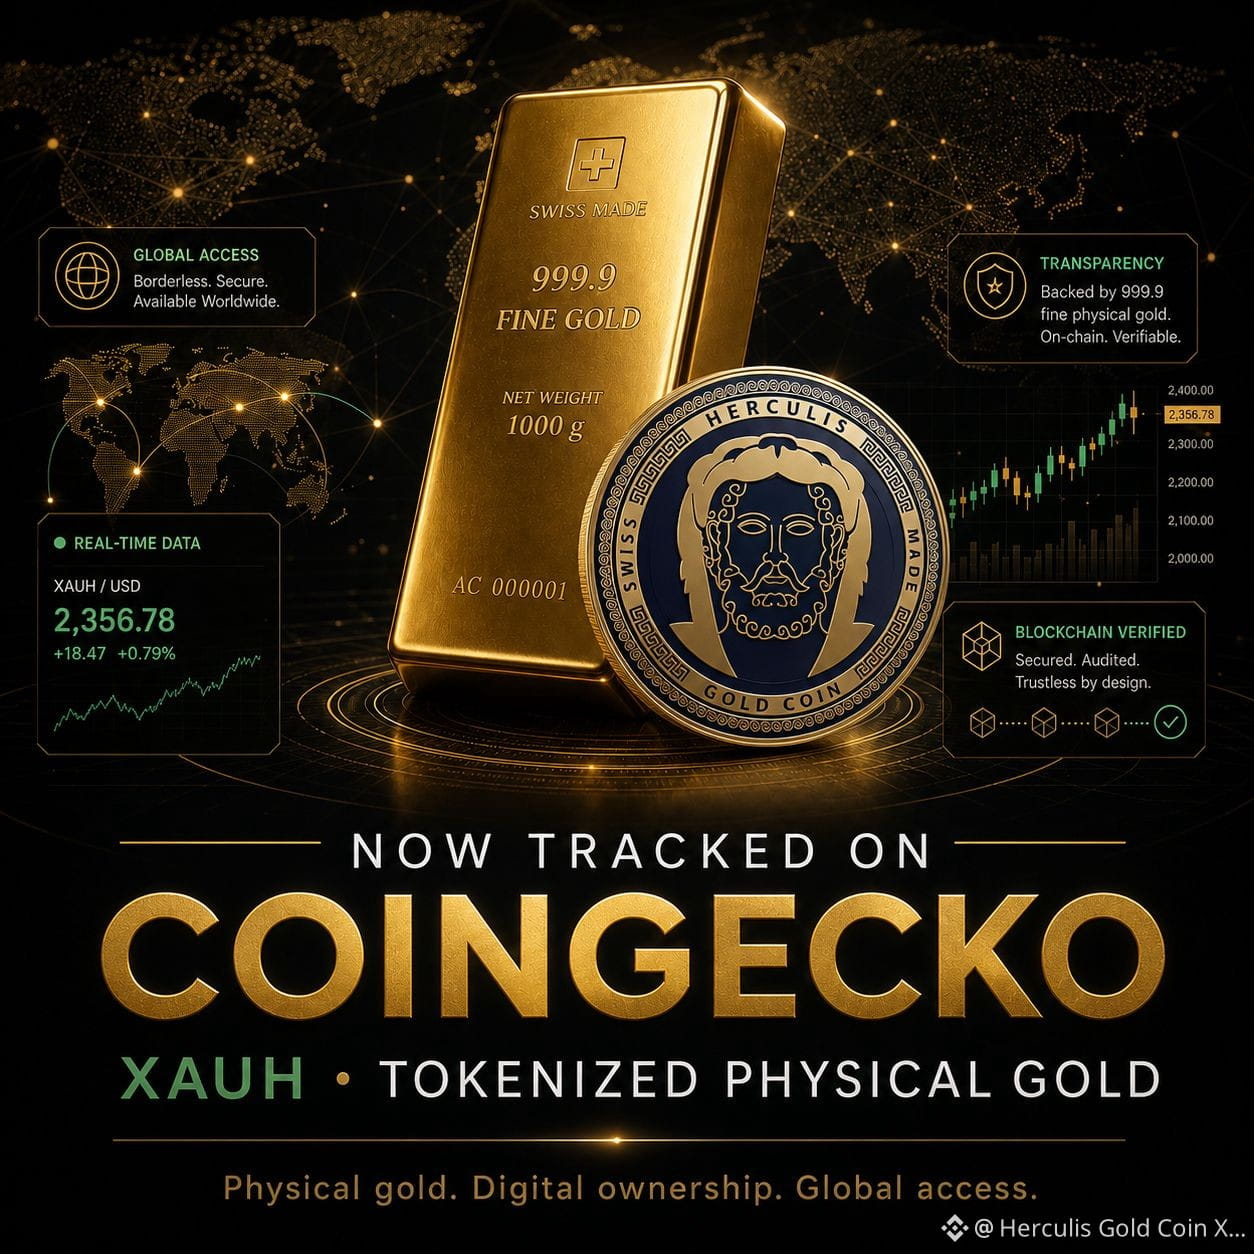
We are proud to announce that $XAUH is now listed on CoinGecko, one of the world’s leading independent cryptocurrency data platforms.
This listing gives investors greater visibility, transparency, and access to market data on $XAUH, including real-time pricing, market capitalization, trading volumes, available exchanges, liquidity, and other key metrics.
For $XAUH, the CoinGecko listing represents another important step in building a transparent and globally accessible ecosystem for tokenized physical gold—bridging the security of Swiss physical gold with the efficiency and accessibility of blockchain technology.
Physical gold. Digital ownership. Global access. $XAUH.
🏆 Another important milestone for Herculis Gold Coin ($XAUH)!
We are proud to announce that $XAUH is now listed on CoinGecko, one of the world’s leading independent cryptocurrency data platforms.
This listing gives investors greater visibility, transparency, and access to market data on $XAUH, including real-time pricing, market capitalization, trading volumes, available exchanges, liquidity, and other key metrics.
For $XAUH, the CoinGecko listing represents another important step in building a transparent and globally accessible ecosystem for tokenized physical gold—bridging the security of Swiss physical gold with the efficiency and accessibility of blockchain technology.
Physical gold. Digital ownership. Global access. $XAUH.
We are proud to announce that $XAUH is now listed on CoinGecko, one of the world’s leading independent cryptocurrency data platforms.
This listing gives investors greater visibility, transparency, and access to market data on $XAUH, including real-time pricing, market capitalization, trading volumes, available exchanges, liquidity, and other key metrics.
For $XAUH, the CoinGecko listing represents another important step in building a transparent and globally accessible ecosystem for tokenized physical gold—bridging the security of Swiss physical gold with the efficiency and accessibility of blockchain technology.
Physical gold. Digital ownership. Global access. $XAUH.
1
75
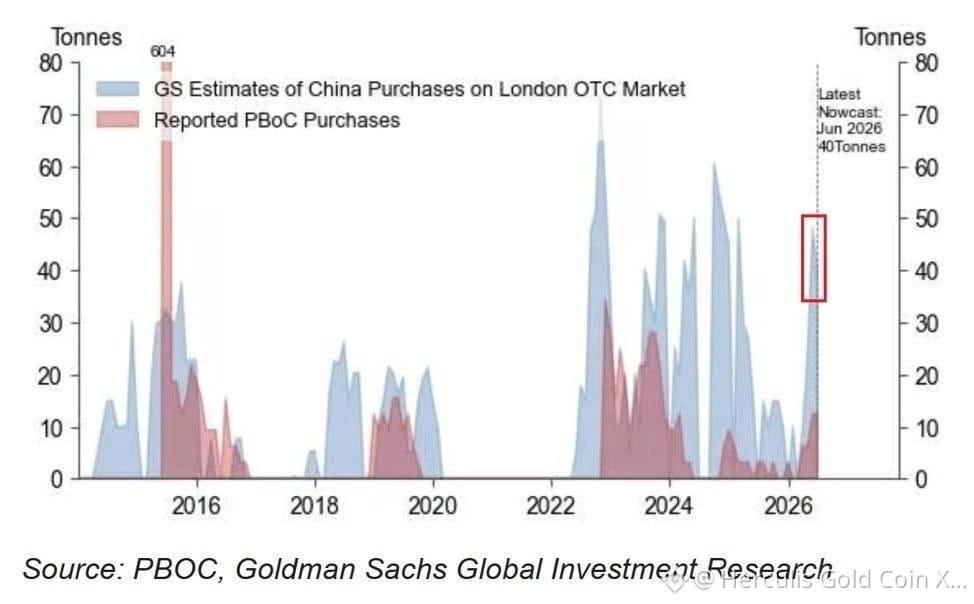
In June, China purchased more than 40 tonnes of gold through the London over-the-counter (OTC) market, marking its second-largest monthly purchase since the beginning of 2025.
This was 167% higher than the official figures published by the People’s Bank of China (PBoC), which reported gold purchases of 15 tonnes in June.
It is also estimated that China purchased an additional approximately 48 tonnes of gold through the OTC market in May, 380% more than the central bank’s officially reported purchase of 10 tonnes.
Meanwhile, in July, the PBoC officially increased its gold reserves by 20 tonnes, representing its largest monthly purchase since October 2023.
Since the beginning of the year, China has officially increased its gold reserves by 60 tonnes, bringing its total holdings to a record 2,366 tonnes.
Thus, China purchased approximately 88 tonnes of gold through the OTC market in May and June alone—more than the amount officially reported for the entire year to date. This suggests that China is acquiring significantly more gold than is reflected in its official data.
In June, China purchased more than 40 tonnes of gold through the London over-the-counter (OTC) market, marking its second-largest monthly purchase since the beginning of 2025.
This was 167% higher than the official figures published by the People’s Bank of China (PBoC), which reported gold purchases of 15 tonnes in June.
It is also estimated that China purchased an additional approximately 48 tonnes of gold through the OTC market in May, 380% more than the central bank’s officially reported purchase of 10 tonnes.
Meanwhile, in July, the PBoC officially increased its gold reserves by 20 tonnes, representing its largest monthly purchase since October 2023.
Since the beginning of the year, China has officially increased its gold reserves by 60 tonnes, bringing its total holdings to a record 2,366 tonnes.
Thus, China purchased approximately 88 tonnes of gold through the OTC market in May and June alone—more than the amount officially reported for the entire year to date. This suggests that China is acquiring significantly more gold than is reflected in its official data.
This was 167% higher than the official figures published by the People’s Bank of China (PBoC), which reported gold purchases of 15 tonnes in June.
It is also estimated that China purchased an additional approximately 48 tonnes of gold through the OTC market in May, 380% more than the central bank’s officially reported purchase of 10 tonnes.
Meanwhile, in July, the PBoC officially increased its gold reserves by 20 tonnes, representing its largest monthly purchase since October 2023.
Since the beginning of the year, China has officially increased its gold reserves by 60 tonnes, bringing its total holdings to a record 2,366 tonnes.
Thus, China purchased approximately 88 tonnes of gold through the OTC market in May and June alone—more than the amount officially reported for the entire year to date. This suggests that China is acquiring significantly more gold than is reflected in its official data.
1
65
Войдите, чтобы посмотреть больше материала
Присоединяйтесь к пользователям криптовалют по всему миру на Binance Square
⚡️ Получайте новейшую и полезную информацию о криптоактивах.
💬 Нам доверяет крупнейшая в мире криптобиржа.
👍 Получите достоверные аналитические данные от верифицированных создателей контента.
Эл. почта/номер телефона
В тренде
USRussiaUkraineTalksReportedlyIncludeLukoilOilDeal
Просмотров: 0
16 обсуждают
#USRussiaUkraineTalksReportedlyIncludeLukoilOilDeal
⚡ U.S.–Russia Talks Reportedly Expand Into a $Billion-Dollar Oil Deal
🇺🇸🇷🇺 Reports say discussions over Ukraine may now involve a potential deal for Lukoil’s international oil assets, including refineries, oil fields and fuel stations.
💰 The reported investor group includes U.S. investor Todd Boehly and Middle Eastern business groups, with approvals reportedly needed from both Washington and Moscow.
🛢️ Why it matters: The deal could intersect with sanctions, energy markets and Ukraine peace negotiations.
⚠️ Nothing is confirmed yet. The White House, U.S. Treasury and Lukoil had not commented in the cited reporting.
👀 Could a major oil deal become part of the wider Ukraine negotiations?
#Lukoil #OilMarkets #Ukraine #Geopolitics
CrypVexa
·Лайков: 1
·Просмотров: 54
BitcoinParesGainsAfterRallyTo$86.5K
Просмотров: 28,288
105 обсуждают
CerebrasSinksNearly20%OnReportNvidiaToPowerOpenAI
Просмотров: 52,615
605 обсуждают