
Crypto Insights 360
3.9k Публикации

Crypto Insights 360
Breaking Crypto News & Daily Market Analysis. Providing real-time updates and hidden gems you don't want to miss. Follow for daily Alpha! 💎
Трейдер с регулярными сделками
3.7 г
4 подписок(и/а)
60 подписчиков(а)
145 понравилось
Посты
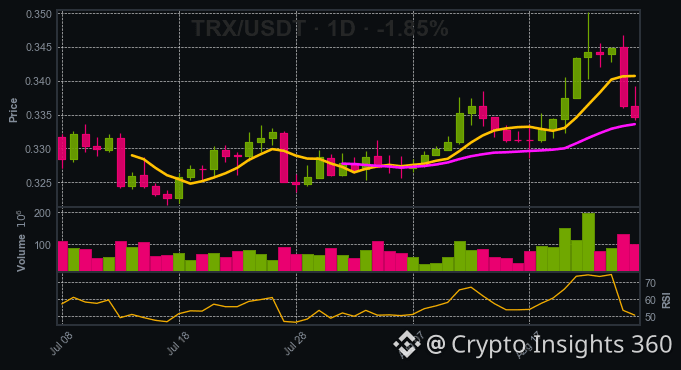
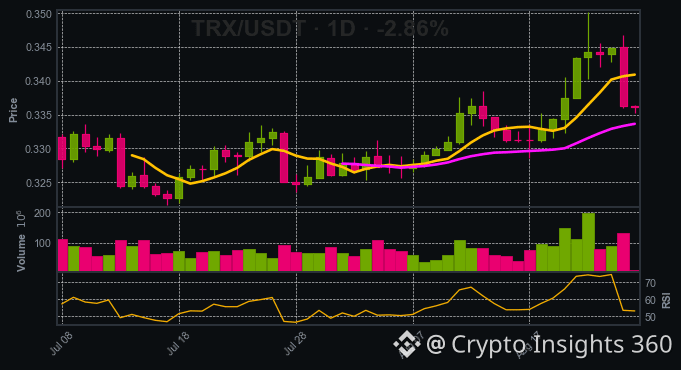
TRX is currently at $0.3347. The price sits below the 7‑day SMA and above the 25‑day SMA, while volume is climbing—classic signs of a potential bounce. With support at $0.3235 and resistance at $0.3502, I’m buying around $0.3347, setting a stop below $0.3235, and targeting $0.3502.
- Price is above the 25‑day SMA, showing underlying strength.
- Rising volume confirms momentum.
- Clear support/resistance levels give a tight risk‑to‑reward setup.
- Price is above the 25‑day SMA, showing underlying strength.
- Rising volume confirms momentum.
- Clear support/resistance levels give a tight risk‑to‑reward setup.
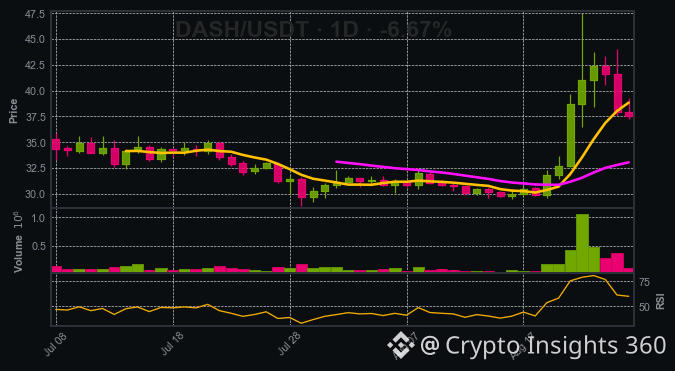
Yesterday, $DASH slid 6.7% from 40.16 to 37.53, leaving a bearish candle on the chart that signals a shift. The price is still 13.6% above its 25‑day SMA but sits below its 7‑day SMA, indicating a weakening uptrend. I’m shorting at 37.53, placing a stop just above the 47.55 resistance and aiming for the 28.84 support. If the current trend holds, the next move could push $DASH back down toward the 28‑level in a matter of days.
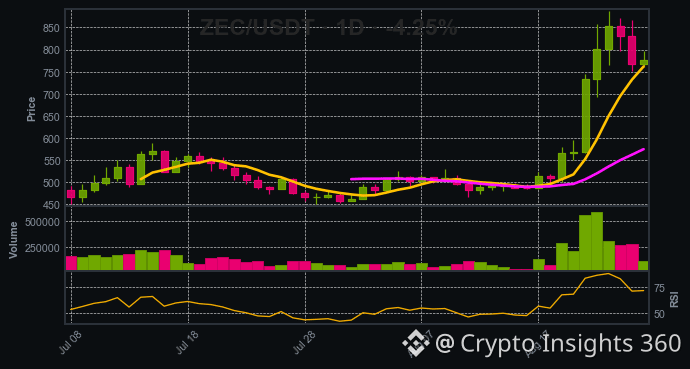
Just watched $ZEC rally back up after a dip, closing at 775.69 with a bullish candle that pushed it 34.9% above its 25‑period SMA—definitely a sign of strength. I’m putting my buy in at 775.69, setting a stop just below the 451.75 support line, and aiming for the 888.00 resistance. If the trend keeps its momentum, we’re looking at a clean breakout and a solid upside. Keep your eyes on the chart and your risk tight—this could be a great long play.
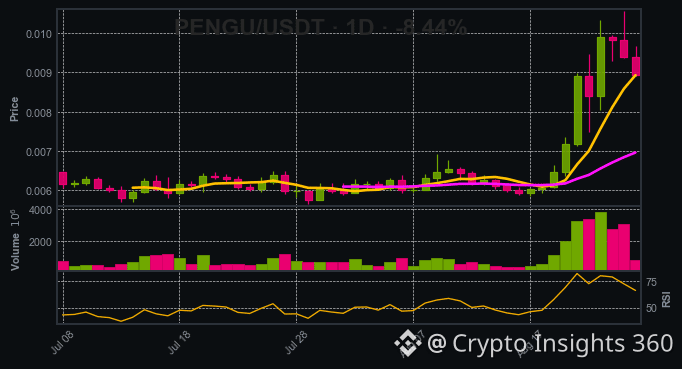
Everyone’s hyping $PENGU , but the charts say otherwise. The price sits at $0.008923, 28 % above its 25‑day SMA, and the last candle is a clear bearish reversal. If the market keeps overextending, the next move is likely a pullback. I’m shorting around $0.008923 with a stop just above resistance at $0.0106 and a target near support at $0.0057. Don’t let the hype blind you – this could be a quick profit if the price corrects. Stay sharp, traders.
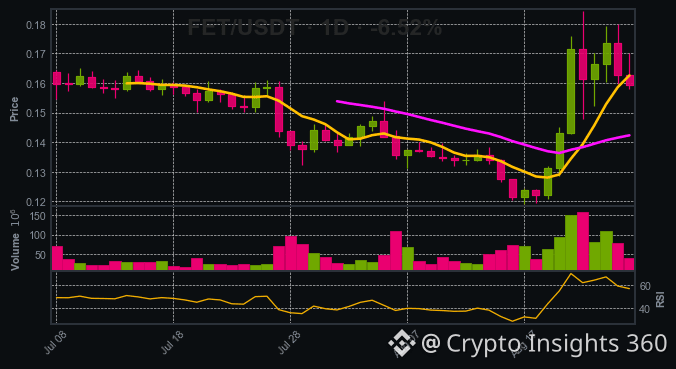
Seeing $FET ’s price still 11.9% above SMA25 while sitting just below the 7‑day moving average, and with a 10‑bar bullish streak broken by a bearish candle, it looks like a good moment to lock in a short. I’ll sell around 0.1591, set my stop at 0.1192 and aim for 0.1845. Volume’s been climbing, so the market is hungry for a reversal. Ready to jump in?
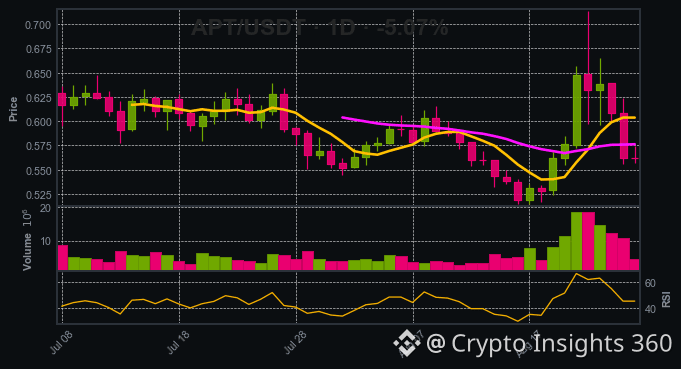
Right now $APT is trading at 0.562, sitting below the 7‑MA (0.6037) and the 25‑MA (0.5762). Even though the 10‑bar trend has been bullish, the latest candle is bearish and volume is up, so momentum is shifting. With the 7‑MA above the 25‑MA, we have a short bias from the bias score (LONG=2, SHORT=3). The nearest support is 0.515 and resistance is 0.714. I’m setting a short around 0.562, putting the stop just below 0.515 to protect against a quick bounce, and aiming for the 0.714 resistance as a target. If the price breaks below 0.515, the short turns into a long play; if i…
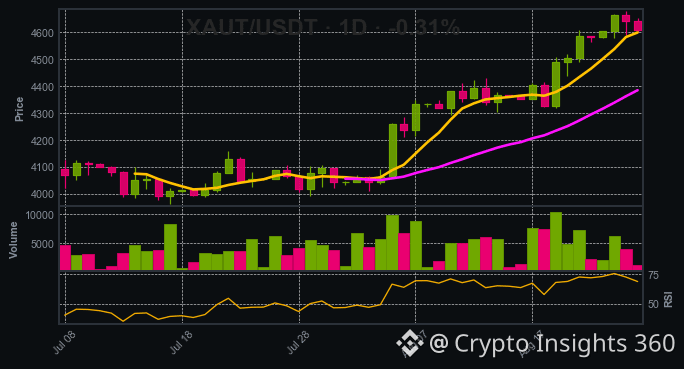
• 7‑ and 25‑day SMAs are both below 4612.18, with SMA7 higher than SMA25—classic bullish setup.\n• The recent swing high at 20 confirms higher highs, keeping the uptrend intact.\n• With support at 3992.23 and resistance near 4679.45, I’m entering at 4612.18, placing a stop just below 3992.23 and aiming for 4679.45.
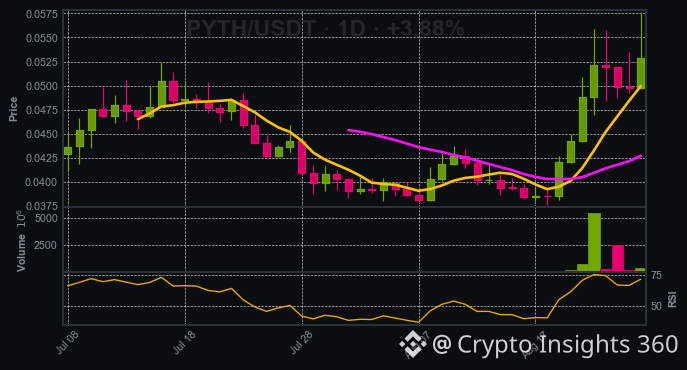
Everyone’s shouting that $PYTH is overextended at 0.05281 and ready to crash. I’m buying at 0.05281 with a stop below 0.0376, targeting 0.0577. The price is 23.7% above SMA25, the 7‑day average is above the 25‑day, and the 10‑bar trend is bullish. Volume is up, the 5‑bar volume beat the prior five, and the swing highs and lows show higher highs and higher lows. It’s the classic sign of a bullish continuation, not a reversal. Don’t let the hype silence you – $PYTH has room to swing higher before it settles into a new range.
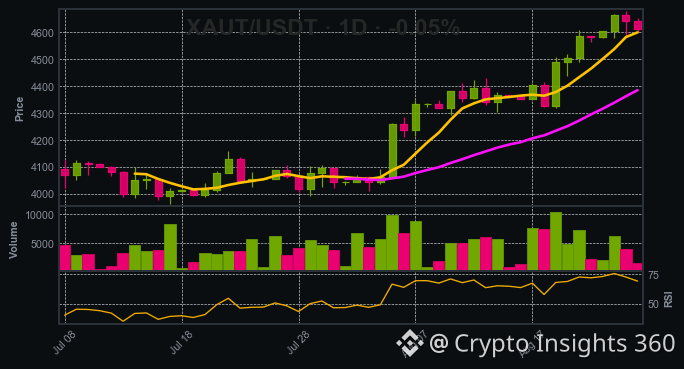
Current price of $XAUT is 4608.17, sitting comfortably above both the 7‑period SMA (4,598) and the 25‑period SMA (4,384). The short‑term average is already higher than the long‑term one, which is a classic sign of bullish momentum. Even though the last candle closed slightly bearish, the overall 10‑bar trend stays bullish and the swing high count (20) far exceeds the swing low count (11). Our support sits at 3,992.23 and resistance at 4,679.45. I’m planning to enter near the current price of 4608.17, place a stop just below support around 3,992.23, and target the resistanc…
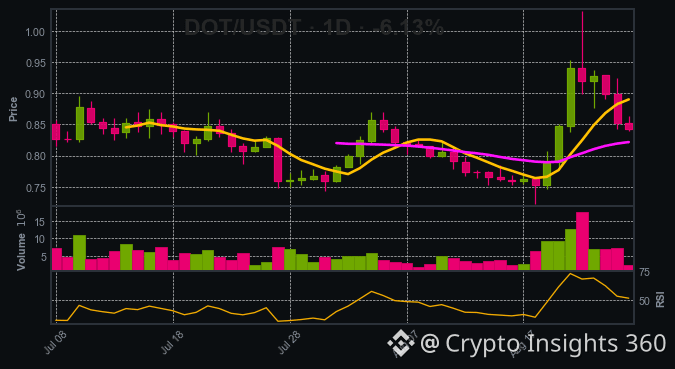
Been watching $DOT wobble at 0.842 after a 6% dip, but the chart still feels bullish. The 10‑bar trend is up, SMA7 is above SMA25, and the 14th swing high suggests a breakout could be coming. I’m buying around 0.842, putting the stop just below the 0.723 support, and setting a target near 1.032. If the price climbs back into the 1.0‑zone, we’re looking at a decent 22% move before the next resistance. Stay sharp and keep an eye on the volume—if it starts spiking, that could confirm the rally.
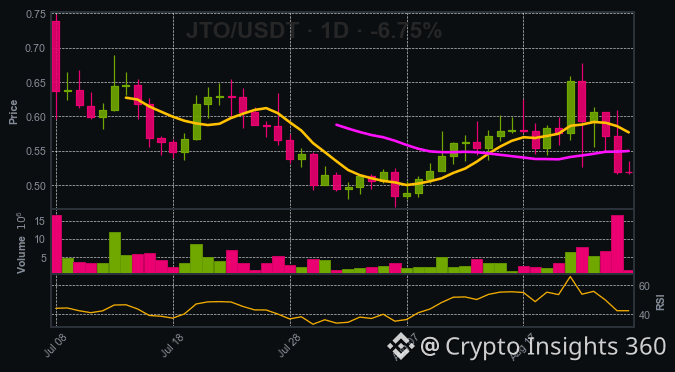
$JTO is sliding under both its 7‑day (0.5769) and 25‑day (0.5499) averages, and the last candle keeps the 10‑bar trend looking bearish. At 0.5196 we’re looking to short, putting a stop just above the 7‑day SMA at 0.5769 and targeting the support level at 0.4692. Will you jump on this short wave?
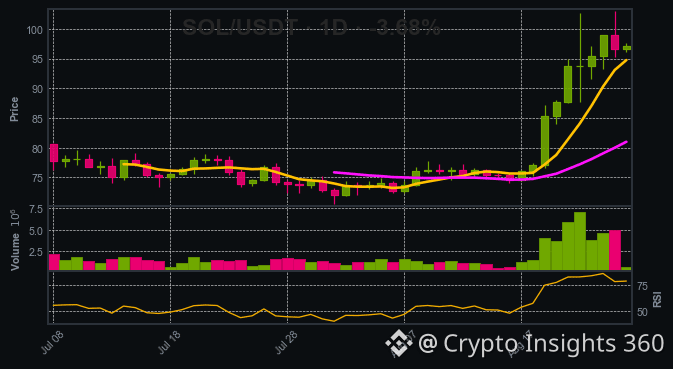
The last week, $SOL slipped through 95 but the bulls kept the price on an upward swing, and now it’s sitting at 97.17. With a 20% overextension above SMA25 and a bullish 10‑bar trend, I’m looking to ride the next move. Buying around 97.17 with a stop below 70.58 and targeting 103.08 – if it hits the resistance, that’s a clean 5‑point win.
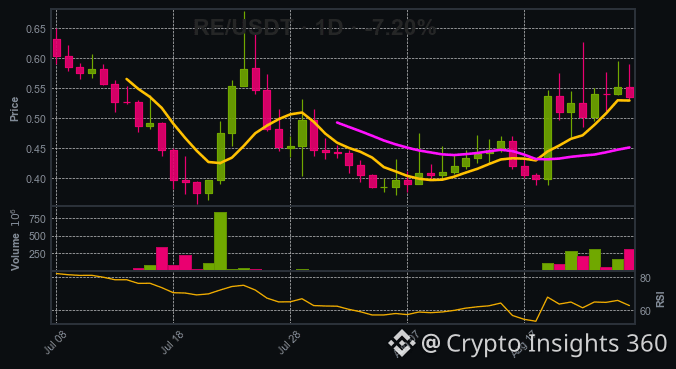
Just watched $RE tear through 0.5352 after a sharp 7% dip. The price is currently 18.6% above its 25‑day SMA, signaling a potential short‑term overextension, but the 7‑day average is still ahead, giving us a bullish backdrop. I'm buying around 0.5352, setting my stop just below the 0.3723 support and aiming for the 0.6260 resistance. If it pushes that ceiling, we could see a solid 17% move—time to buckle up.
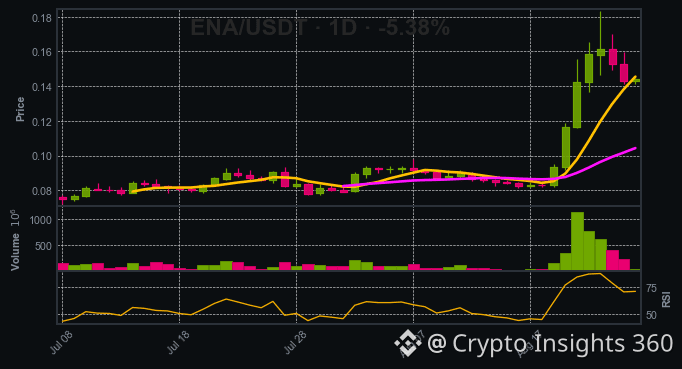
At 0.1443, $ENA is hovering above its 25‑day SMA but still below the 7‑day SMA, showing a pullback before the next move. I’d buy around 0.1443, set a stop just below the 0.0770 support, and target the 0.1835 resistance. With volume climbing and a bullish 10‑bar trend, this looks like a solid long setup. Will the market honor the next resistance?
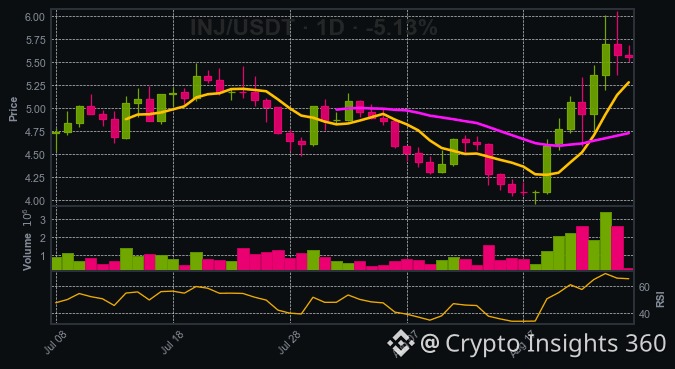
Hey fam, look at this. $INJ is sitting at 5.553, nicely above both the 7‑day and 25‑day moving averages – 5.28 and 4.72, respectively – and the 10‑bar trend is still bullish. The last candle was bearish, but we’re still 17.6% above SMA25, so the long bias is solid. I’m planning to enter around 5.553, set my stop just below the support level at 3.9570, and aim for the resistance at 6.0570. If the price hits that, we could see a decent 2.4x return on a 10% move. Keep an eye on volume; it’s been climbing over the last five bars, which confirms the strength. Stay sharp, keep t…
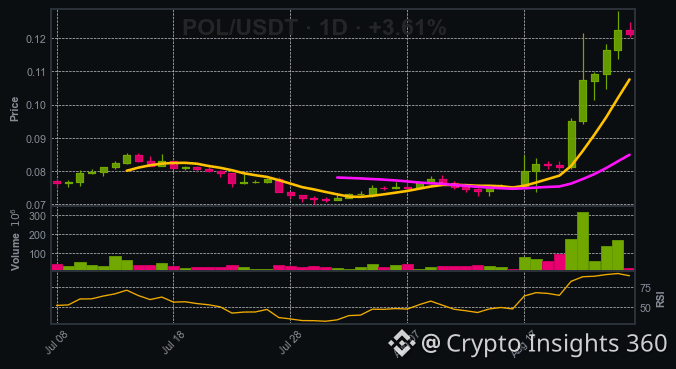
People keep saying $POL is overextended and due for a dump, but that’s a classic contrarian trap. The price is at 0.12122, a level that sits just above the 7‑day SMA and 25‑day SMA—both of which are converging, a strong sign of momentum. I’m putting a long on $POL at 0.12122, with a stop just below the 0.0702 support, and a target at 0.1283 where resistance lines up. If the price keeps moving above the 25‑day SMA, we could be looking at a fresh wave of buying pressure. Keep an eye on the volume—it's climbing, and that’s a bullish confirmation. Time to ride the next wave.
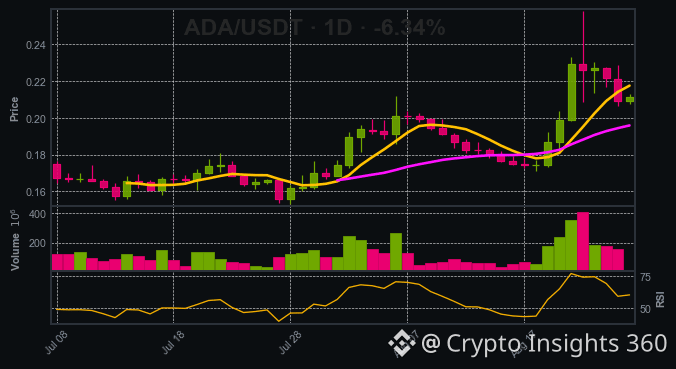
Everyone’s hunkered down after the 6.3% slide, but that’s just a temporary wobble. $ADA is still marching higher – the 10‑bar trend is bullish, 7‑day SMA is ahead of 25‑day SMA, and the price is hovering just below the 7‑day SMA, which is a classic buying zone. I’m putting my money in at 0.2113, set the stop just below the 0.1533 support, and aim for the 0.2584 resistance. If the trend holds, we’re looking at a ~22% upside before the next pullback. Don’t let the fear of a 6% dip scare you out of a coin that’s still on the move.
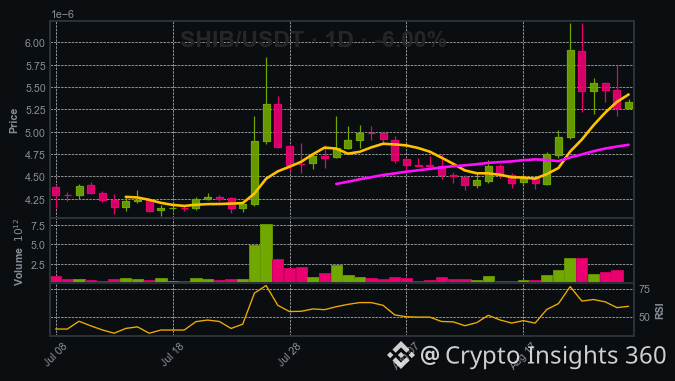
Last night’s rally saw $SHIB break out above its 25‑period SMA, a sign that the bulls are still in control. I’m taking a long position right now at 5.33e-06, setting my stop just below the 0.00000435 support to protect against a quick pullback. My target is the 0.00000622 resistance level, where a strong bounce could send the price back up. If the momentum continues, we could see $SHIB touch that resistance in the next few hours—don
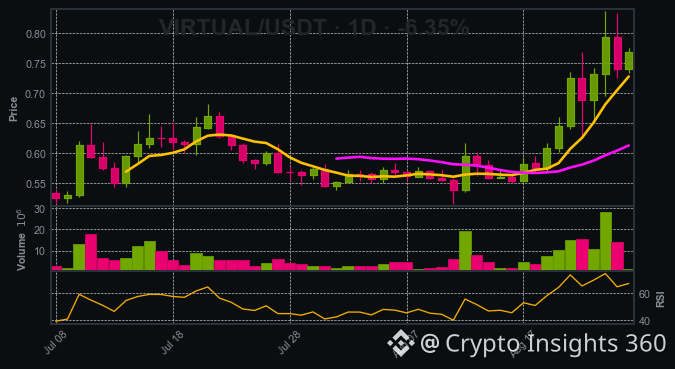
I’m looking at $VIRTUAL right now, price at 0.7674. The 7‑day SMA is 0.7272, the 25‑day SMA is 0.6121 – both below the current close, confirming the uptrend. My entry sits around 0.7674, a tight stop below the 0.5150 support, and a take‑profit near the 0.8372 resistance. With volume up and the chart bias scoring 5‑3 for LONG, I feel the momentum is in my favor. Let’s see if this bullish run carries on.
- Buying around 0.3361 with a stop just below 0.3235 and targeting 0.3502 gives a solid risk‑reward of 1:1.3.
- The price stays above the 25‑day SMA while flirting with the 7‑day SMA, a textbook pullback pattern.
- Strong support at 0.3235 and resistance at 0.3502 provide clear entry, exit, and exit targets.
- The price stays above the 25‑day SMA while flirting with the 7‑day SMA, a textbook pullback pattern.
- Strong support at 0.3235 and resistance at 0.3502 provide clear entry, exit, and exit targets.
Войдите, чтобы посмотреть больше материала