
YANG BNB
10.6k Публикации

YANG BNB
Отправить жалобу
Заблокировать пользователя
Community Builder || BNB Holder || We b3.0 || NFT’s || Binance KOL”
Открытая сделка
Трейдер с частыми сделками
5.5 г
32 подписок(и/а)
10.9K+ подписчиков(а)
12.6K+ понравилось
Посты
Портфель
Все
Цитирования
Видео
Активно
PINNED
·
--
Рост
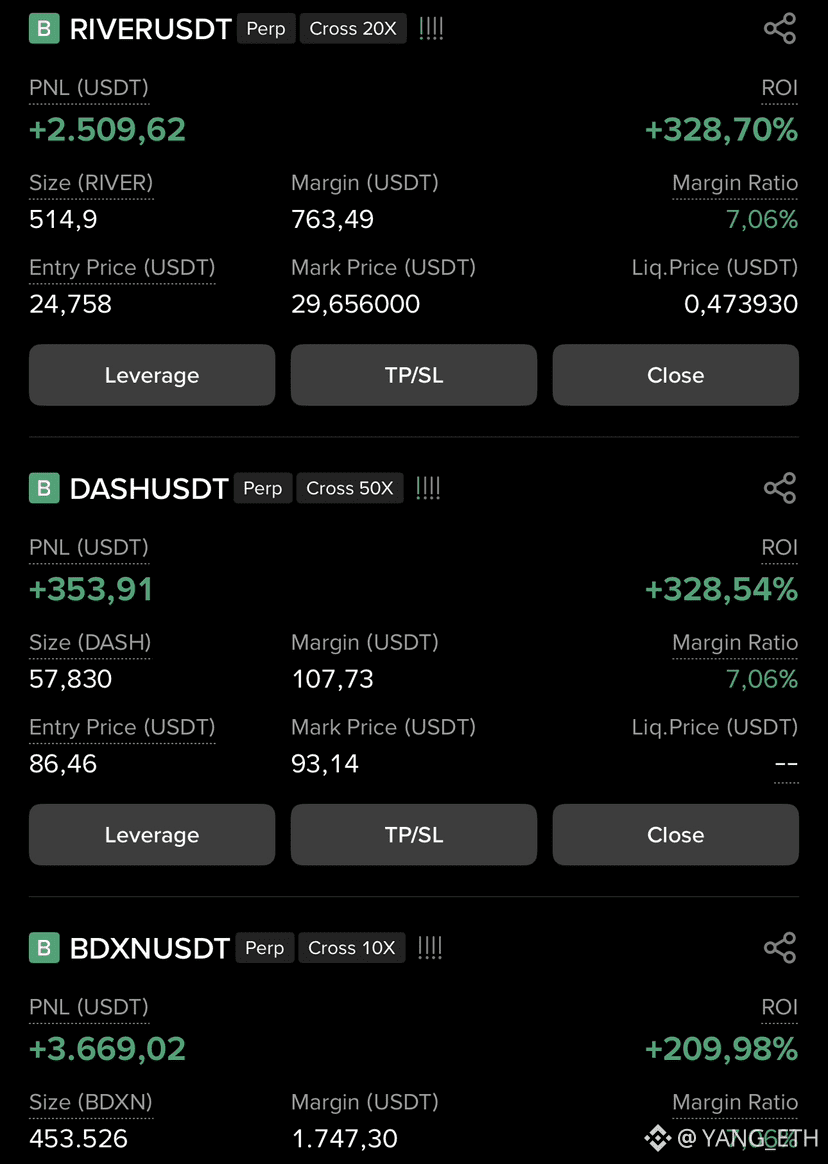
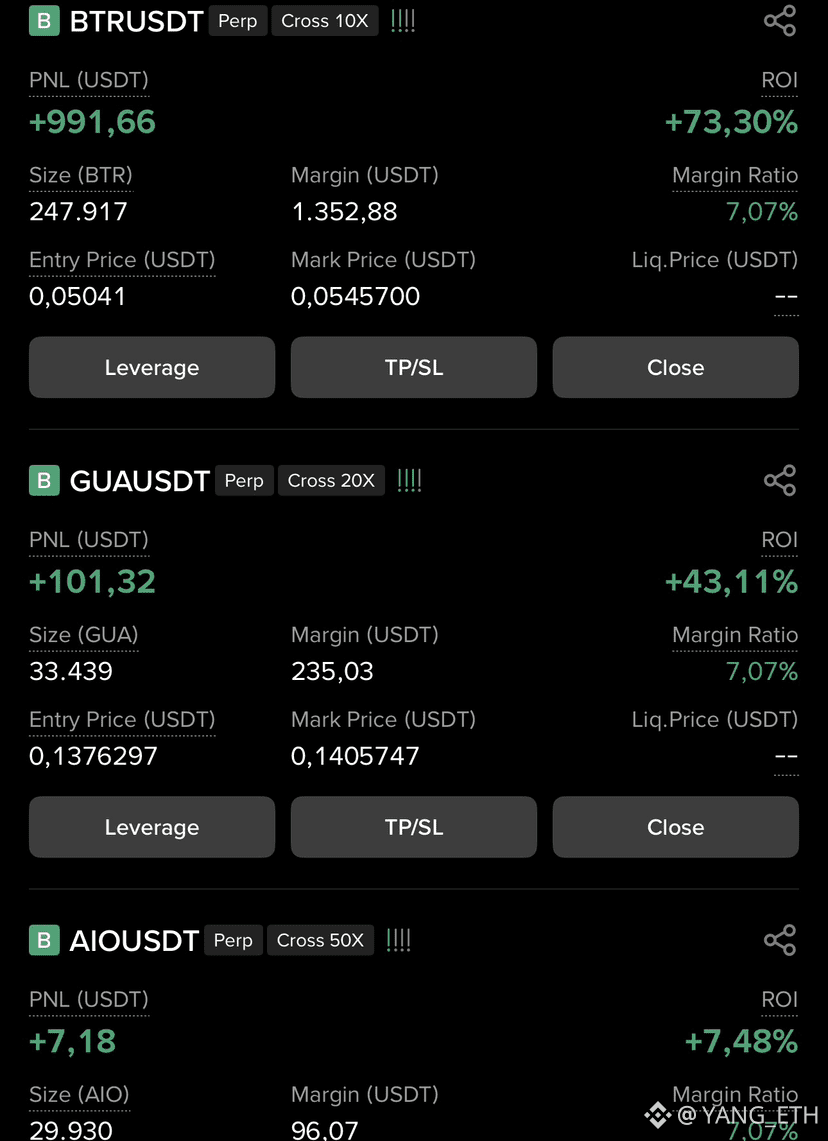
🔥 ALL CALLS IN PROFIT — STRONG DAY! 🔥
Every setup I shared is now in profit — clean execution across the board.
$RIVER , $BDXN , and$DASH are leading the way with the strongest momentum and growth 🚀
If you caught profits on these trades, drop a comment below — your feedback keeps me motivated to keep calling these moves early.
You can hold and ride the trend or secure profits if you feel it’s enough — discipline always comes first.
Thanks to everyone who followed and trusted the calls.
More opportunities ahead — stay locked in 🔥📈
{future}(DASHUSDT)
{future}(BDXNUSDT)
{future}(RIVERUSDT)
🔥 ALL CALLS IN PROFIT — STRONG DAY! 🔥
Every setup I shared is now in profit — clean execution across the board.
$RIVER , $BDXN , and$DASH are leading the way with the strongest momentum and growth 🚀
If you caught profits on these trades, drop a comment below — your feedback keeps me motivated to keep calling these moves early.
You can hold and ride the trend or secure profits if you feel it’s enough — discipline always comes first.
Thanks to everyone who followed and trusted the calls.
More opportunities ahead — stay locked in 🔥📈
Every setup I shared is now in profit — clean execution across the board.
$RIVER , $BDXN , and$DASH are leading the way with the strongest momentum and growth 🚀
If you caught profits on these trades, drop a comment below — your feedback keeps me motivated to keep calling these moves early.
You can hold and ride the trend or secure profits if you feel it’s enough — discipline always comes first.
Thanks to everyone who followed and trusted the calls.
More opportunities ahead — stay locked in 🔥📈
70
19
110
8k
·
--
Падение
🔥 $ARB BIG SHORT OPPORTUNITY :
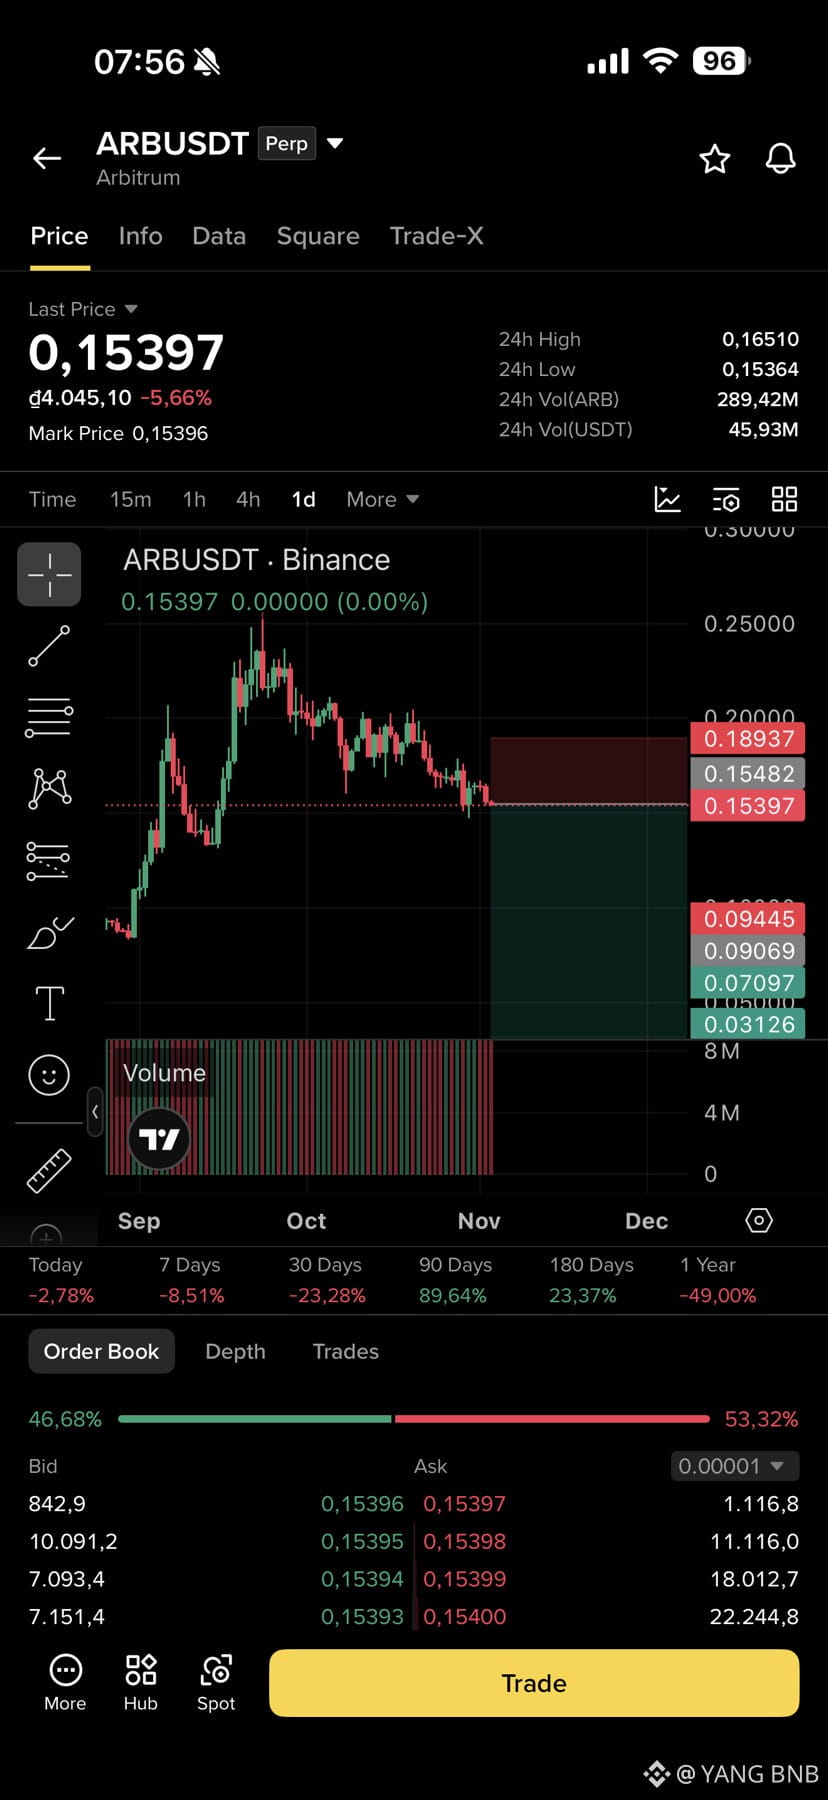
ARB is showing continued bearish momentum after facing repeated rejection from its previous resistance zones. The price is currently trading around 0.15397, down more than 5% in the last 24 hours. Sellers remain in control, pushing the price lower after failing to maintain its previous highs around 0.23000. The daily chart shows a clear bearish structure, with consistent lower highs and persistent selling pressure. The price is now approaching an important support zone around 0.15000. If this level fails to hold and selling pressure continues, further downside toward lower support levels could follow. 📉
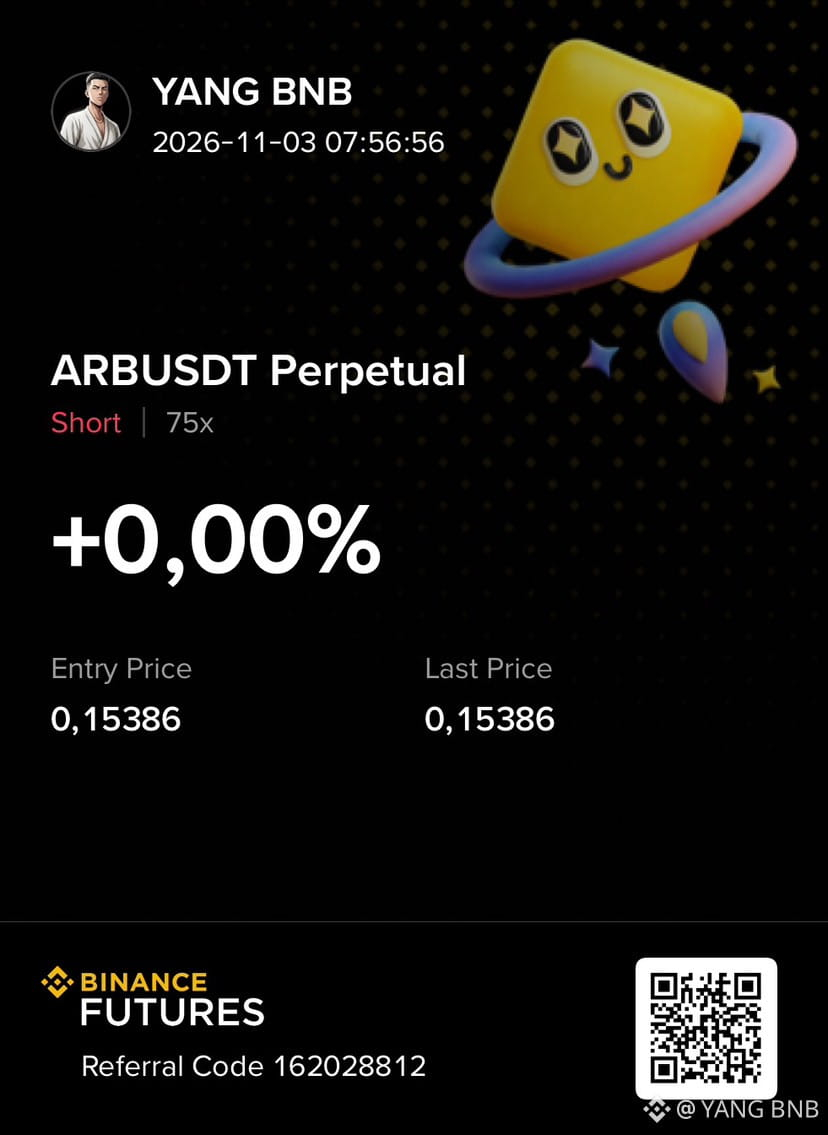
Trading Ideas Short $ARBUSDT
Entry: 0.15300 – 0.15600
TP1: 0.12000
TP2: 0.09445
SL: 0.18937
TP3: 0.03126
Short $ARB 👇
{future}(ARBUSDT)
🔥 $ARB BIG SHORT OPPORTUNITY :
ARB is showing continued bearish momentum after facing repeated rejection from its previous resistance zones. The price is currently trading around 0.15397, down more than 5% in the last 24 hours. Sellers remain in control, pushing the price lower after failing to maintain its previous highs around 0.23000. The daily chart shows a clear bearish structure, with consistent lower highs and persistent selling pressure. The price is now approaching an important support zone around 0.15000. If this level fails to hold and selling pressure continues, further downside toward lower support levels could follow. 📉
Trading Ideas Short $ARBUSDT
Entry: 0.15300 – 0.15600
TP1: 0.12000
TP2: 0.09445
SL: 0.18937
TP3: 0.03126
Short $ARB 👇
ARB is showing continued bearish momentum after facing repeated rejection from its previous resistance zones. The price is currently trading around 0.15397, down more than 5% in the last 24 hours. Sellers remain in control, pushing the price lower after failing to maintain its previous highs around 0.23000. The daily chart shows a clear bearish structure, with consistent lower highs and persistent selling pressure. The price is now approaching an important support zone around 0.15000. If this level fails to hold and selling pressure continues, further downside toward lower support levels could follow. 📉
Trading Ideas Short $ARBUSDT
Entry: 0.15300 – 0.15600
TP1: 0.12000
TP2: 0.09445
SL: 0.18937
TP3: 0.03126
Short $ARB 👇
14
·
--
Падение
🔥 $BEAMX BIG SHORT OPPORTUNITY :
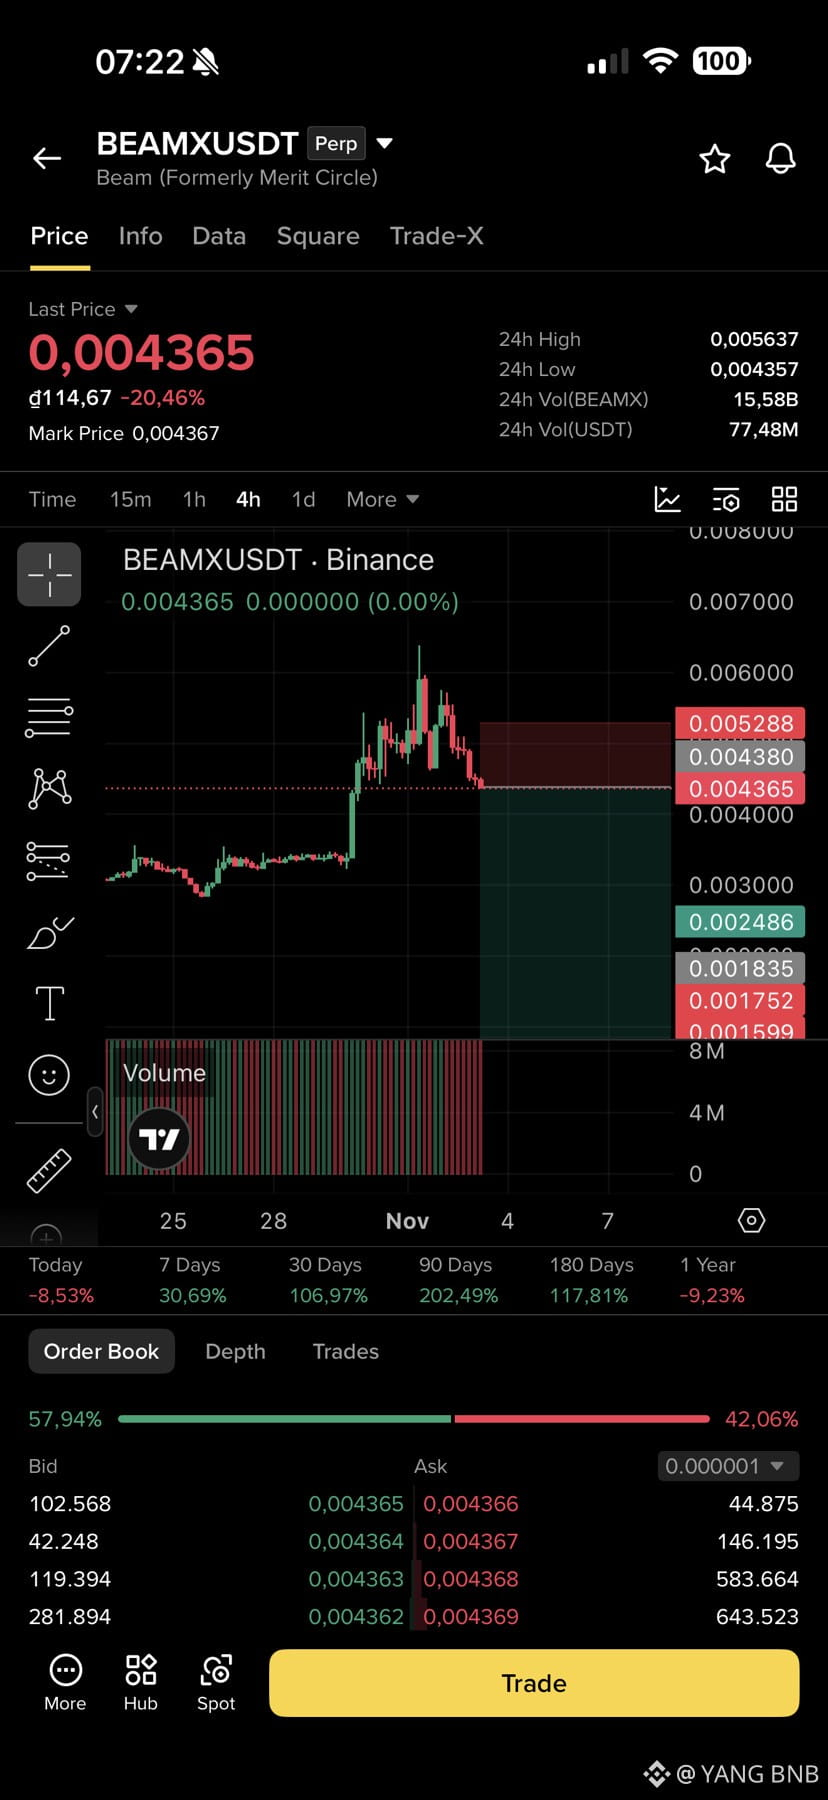
BEAMX is showing strong bearish momentum after facing a sharp rejection from its recent resistance zone. The price is currently trading around 0.004365, down more than 20% in the last 24 hours. Sellers have regained control after the price failed to maintain its recent highs around 0.006000. The 4H chart shows a clear bearish reversal, with consecutive red candles pushing the price toward its previous support zone.
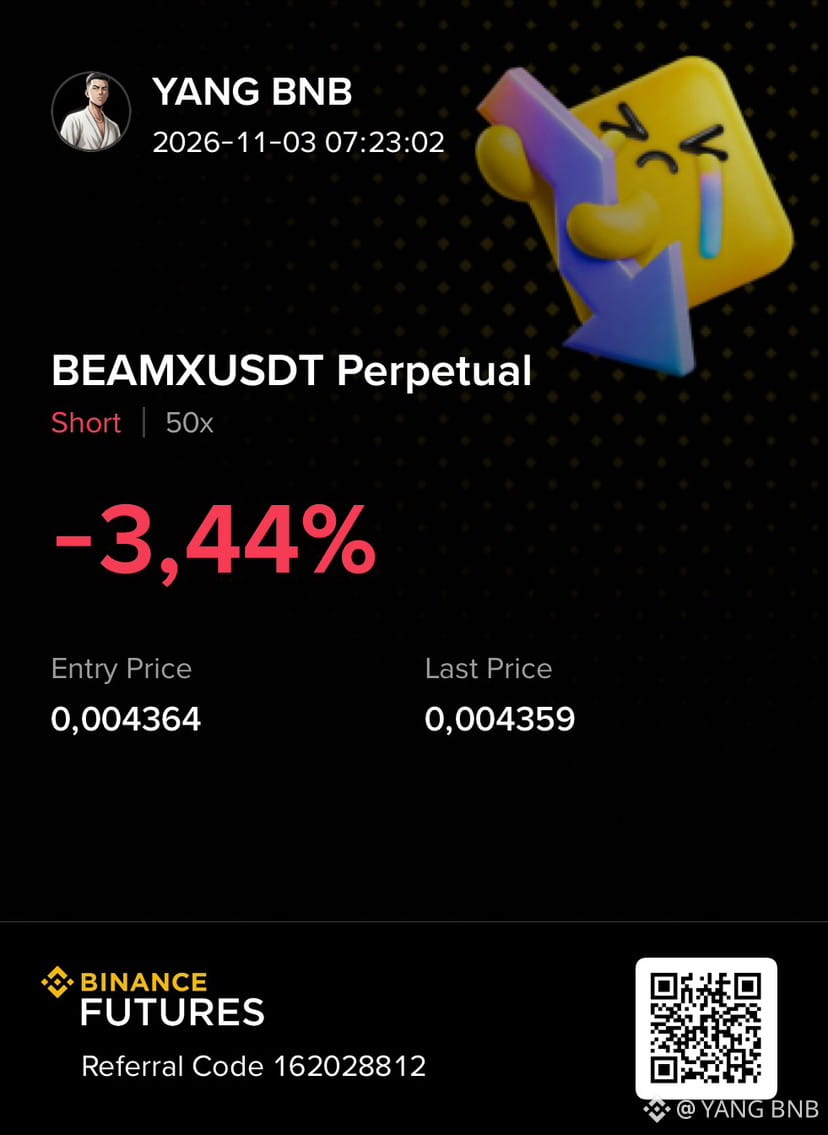
Trading Ideas Short $BEAMXUSDT
Entry: 0.004360 – 0.004500
TP1: 0.003500
TP2: 0.002486
SL: 0.005288
TP3: 0.001599
Short $BEAMX 👇
{future}(BEAMXUSDT)
🔥 $BEAMX BIG SHORT OPPORTUNITY :
BEAMX is showing strong bearish momentum after facing a sharp rejection from its recent resistance zone. The price is currently trading around 0.004365, down more than 20% in the last 24 hours. Sellers have regained control after the price failed to maintain its recent highs around 0.006000. The 4H chart shows a clear bearish reversal, with consecutive red candles pushing the price toward its previous support zone.
Trading Ideas Short $BEAMXUSDT
Entry: 0.004360 – 0.004500
TP1: 0.003500
TP2: 0.002486
SL: 0.005288
TP3: 0.001599
Short $BEAMX 👇
BEAMX is showing strong bearish momentum after facing a sharp rejection from its recent resistance zone. The price is currently trading around 0.004365, down more than 20% in the last 24 hours. Sellers have regained control after the price failed to maintain its recent highs around 0.006000. The 4H chart shows a clear bearish reversal, with consecutive red candles pushing the price toward its previous support zone.
Trading Ideas Short $BEAMXUSDT
Entry: 0.004360 – 0.004500
TP1: 0.003500
TP2: 0.002486
SL: 0.005288
TP3: 0.001599
Short $BEAMX 👇
211
·
--
Падение
🔥 $NEAR BIG SHORT OPPORTUNITY :
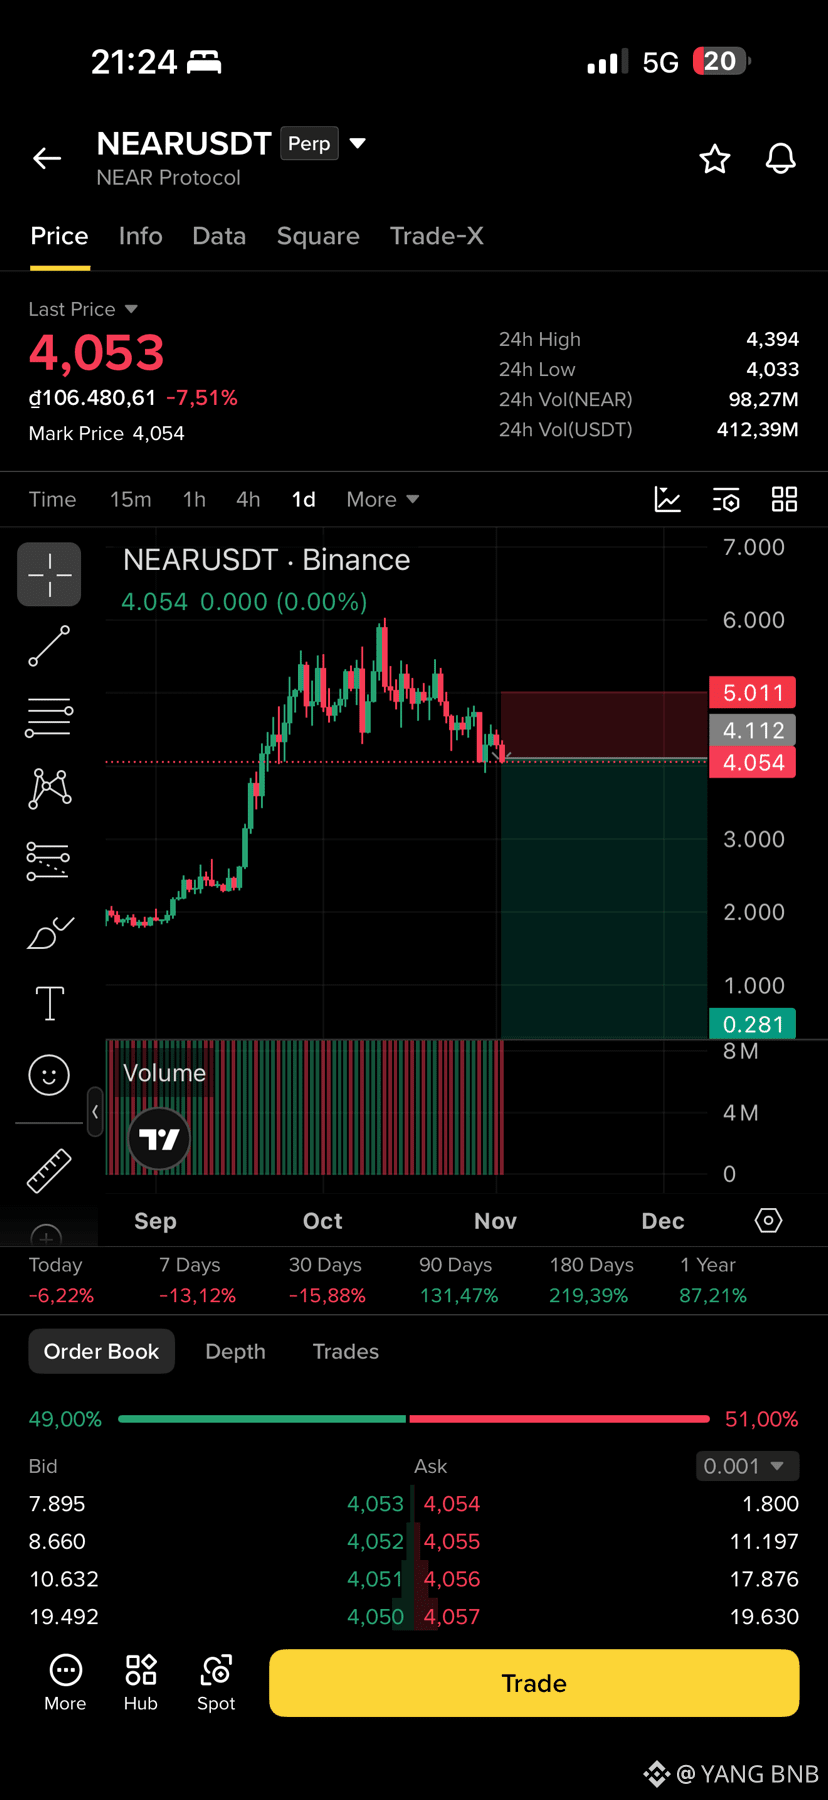
NEAR is showing continued bearish momentum after facing repeated rejection from its previous resistance zones. The price is currently trading around 4.053, down more than 7% in the last 24 hours. Sellers are gradually regaining control, pushing the price lower after failing to maintain its previous highs around 5.500–6.000.
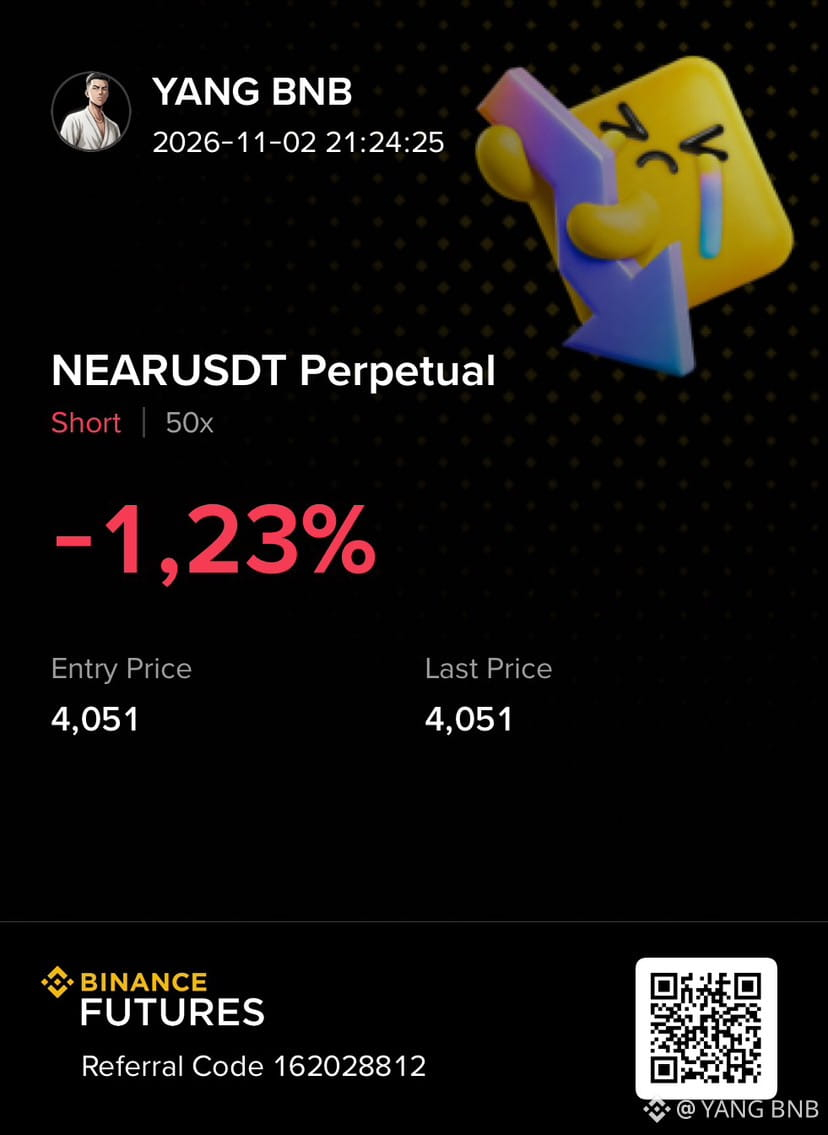
Trading Ideas Short $NEARUSDT
Entry: 4.050 – 4.150
TP1: 3.500
TP2: 3.000
SL: 5.011
TP3: 0.281
Short $NEAR 👇
{future}(NEARUSDT)
🔥 $NEAR BIG SHORT OPPORTUNITY :
NEAR is showing continued bearish momentum after facing repeated rejection from its previous resistance zones. The price is currently trading around 4.053, down more than 7% in the last 24 hours. Sellers are gradually regaining control, pushing the price lower after failing to maintain its previous highs around 5.500–6.000.
Trading Ideas Short $NEARUSDT
Entry: 4.050 – 4.150
TP1: 3.500
TP2: 3.000
SL: 5.011
TP3: 0.281
Short $NEAR 👇
NEAR is showing continued bearish momentum after facing repeated rejection from its previous resistance zones. The price is currently trading around 4.053, down more than 7% in the last 24 hours. Sellers are gradually regaining control, pushing the price lower after failing to maintain its previous highs around 5.500–6.000.
Trading Ideas Short $NEARUSDT
Entry: 4.050 – 4.150
TP1: 3.500
TP2: 3.000
SL: 5.011
TP3: 0.281
Short $NEAR 👇
513
·
--
Падение
🔥 $MUBARAK BIG SHORT OPPORTUNITY :
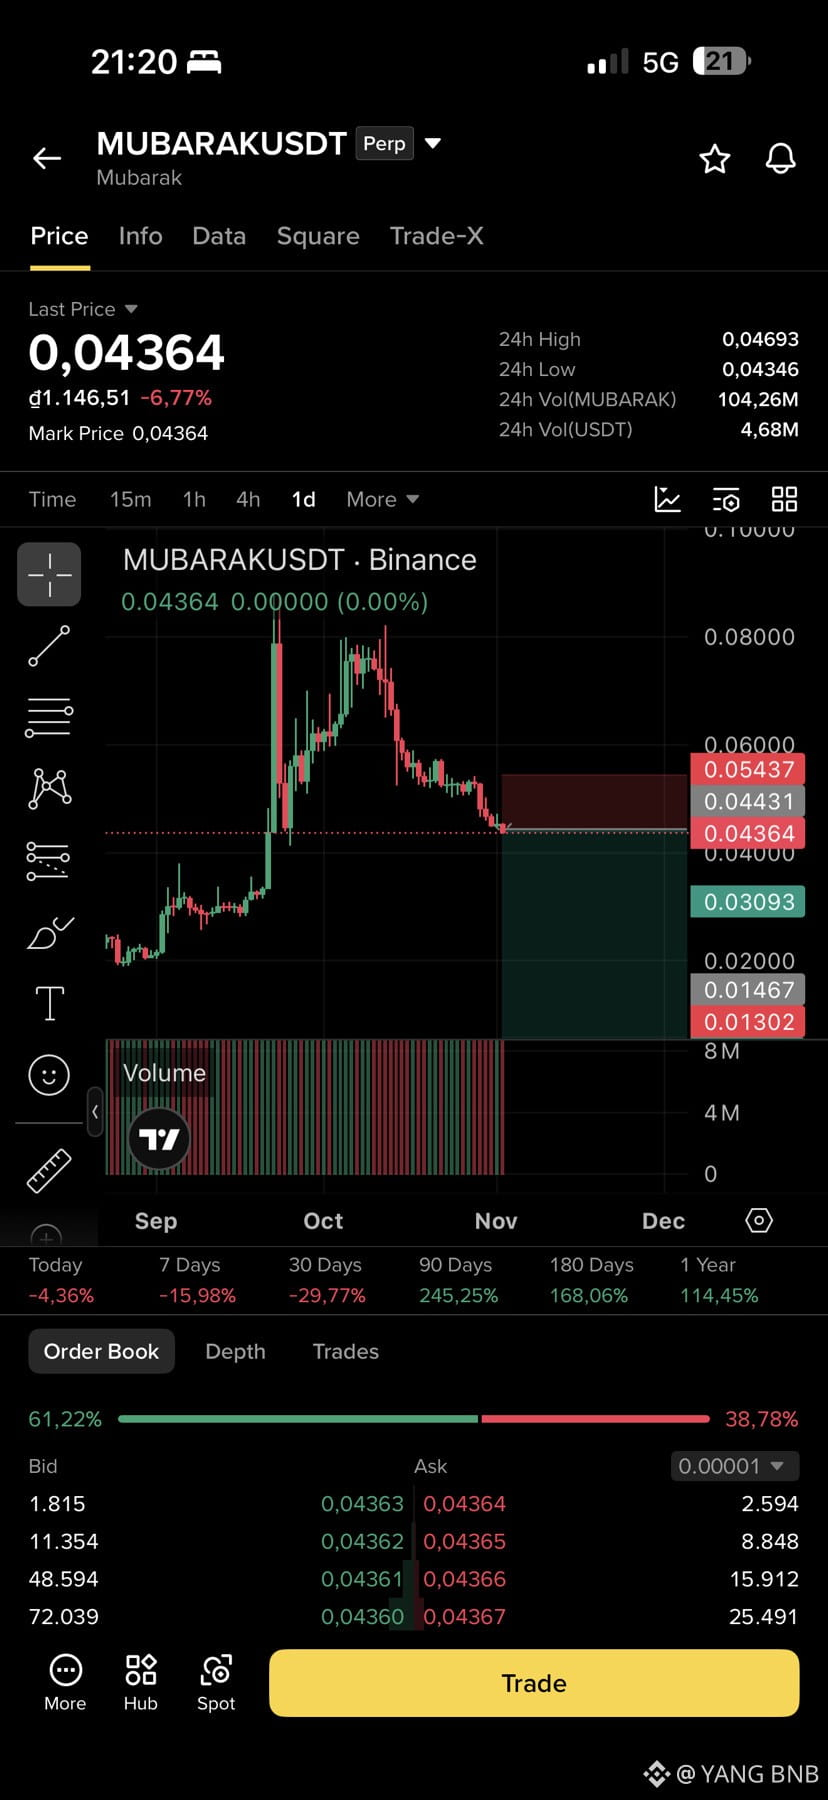
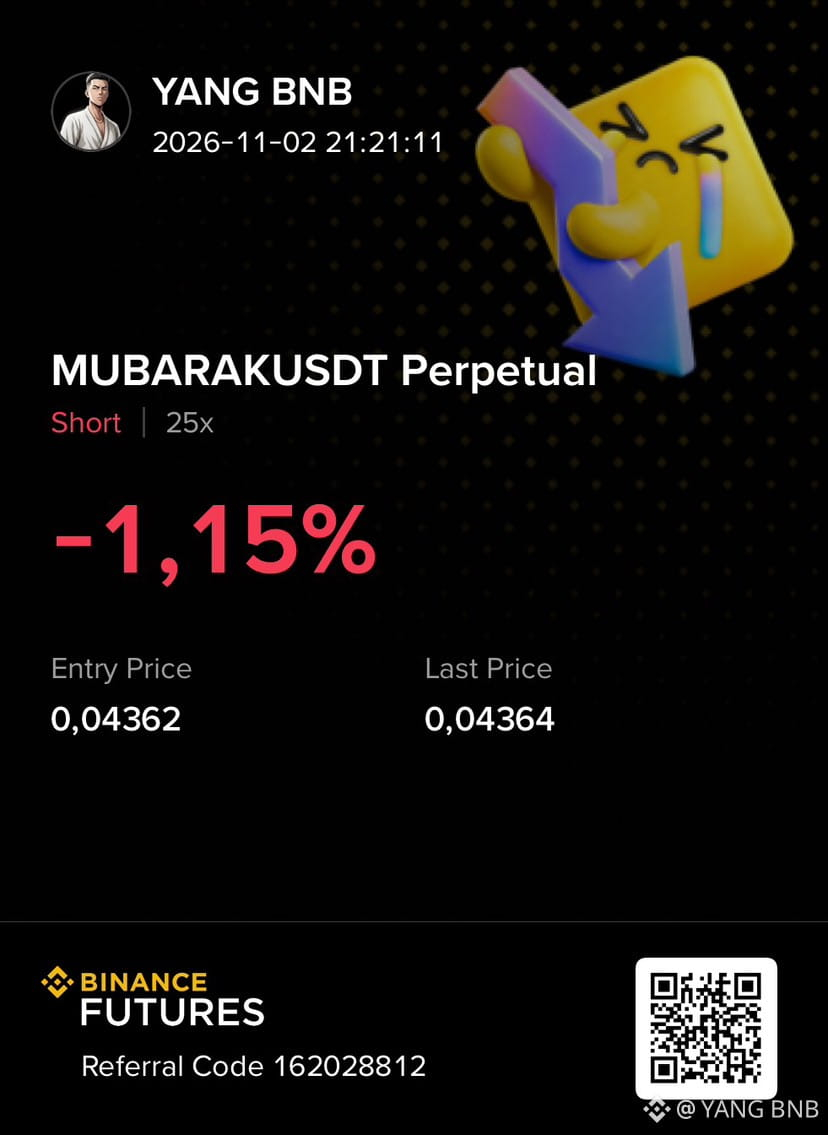
MUBARAK is showing continued bearish momentum after facing repeated rejection from its previous resistance zones. The price is currently trading around 0.04364, down nearly 7% in the last 24 hours. Sellers remain in control, pushing the price lower after failing to maintain its previous highs around 0.08000. The daily chart shows a clear bearish structure, with consecutive lower highs and consistent selling pressure. The price is now approaching an important support zone around 0.04300. If buyers fail to defend this level and selling pressure continues, further downside toward lower support levels could follow. 📉
Trading Ideas Short $MUBARAKUSDT
Entry: 0.04360 – 0.04500
TP1: 0.04000
TP2: 0.03093
SL: 0.05437
TP3: 0.01302.
Short $MUBARAK 👇
{future}(MUBARAKUSDT)
🔥 $MUBARAK BIG SHORT OPPORTUNITY :
MUBARAK is showing continued bearish momentum after facing repeated rejection from its previous resistance zones. The price is currently trading around 0.04364, down nearly 7% in the last 24 hours. Sellers remain in control, pushing the price lower after failing to maintain its previous highs around 0.08000. The daily chart shows a clear bearish structure, with consecutive lower highs and consistent selling pressure. The price is now approaching an important support zone around 0.04300. If buyers fail to defend this level and selling pressure continues, further downside toward lower support levels could follow. 📉
Trading Ideas Short $MUBARAKUSDT
Entry: 0.04360 – 0.04500
TP1: 0.04000
TP2: 0.03093
SL: 0.05437
TP3: 0.01302.
Short $MUBARAK 👇
MUBARAK is showing continued bearish momentum after facing repeated rejection from its previous resistance zones. The price is currently trading around 0.04364, down nearly 7% in the last 24 hours. Sellers remain in control, pushing the price lower after failing to maintain its previous highs around 0.08000. The daily chart shows a clear bearish structure, with consecutive lower highs and consistent selling pressure. The price is now approaching an important support zone around 0.04300. If buyers fail to defend this level and selling pressure continues, further downside toward lower support levels could follow. 📉
Trading Ideas Short $MUBARAKUSDT
Entry: 0.04360 – 0.04500
TP1: 0.04000
TP2: 0.03093
SL: 0.05437
TP3: 0.01302.
Short $MUBARAK 👇
1
362
·
--
Падение
🔥 $CVC BIG SHORT OPPORTUNITY :
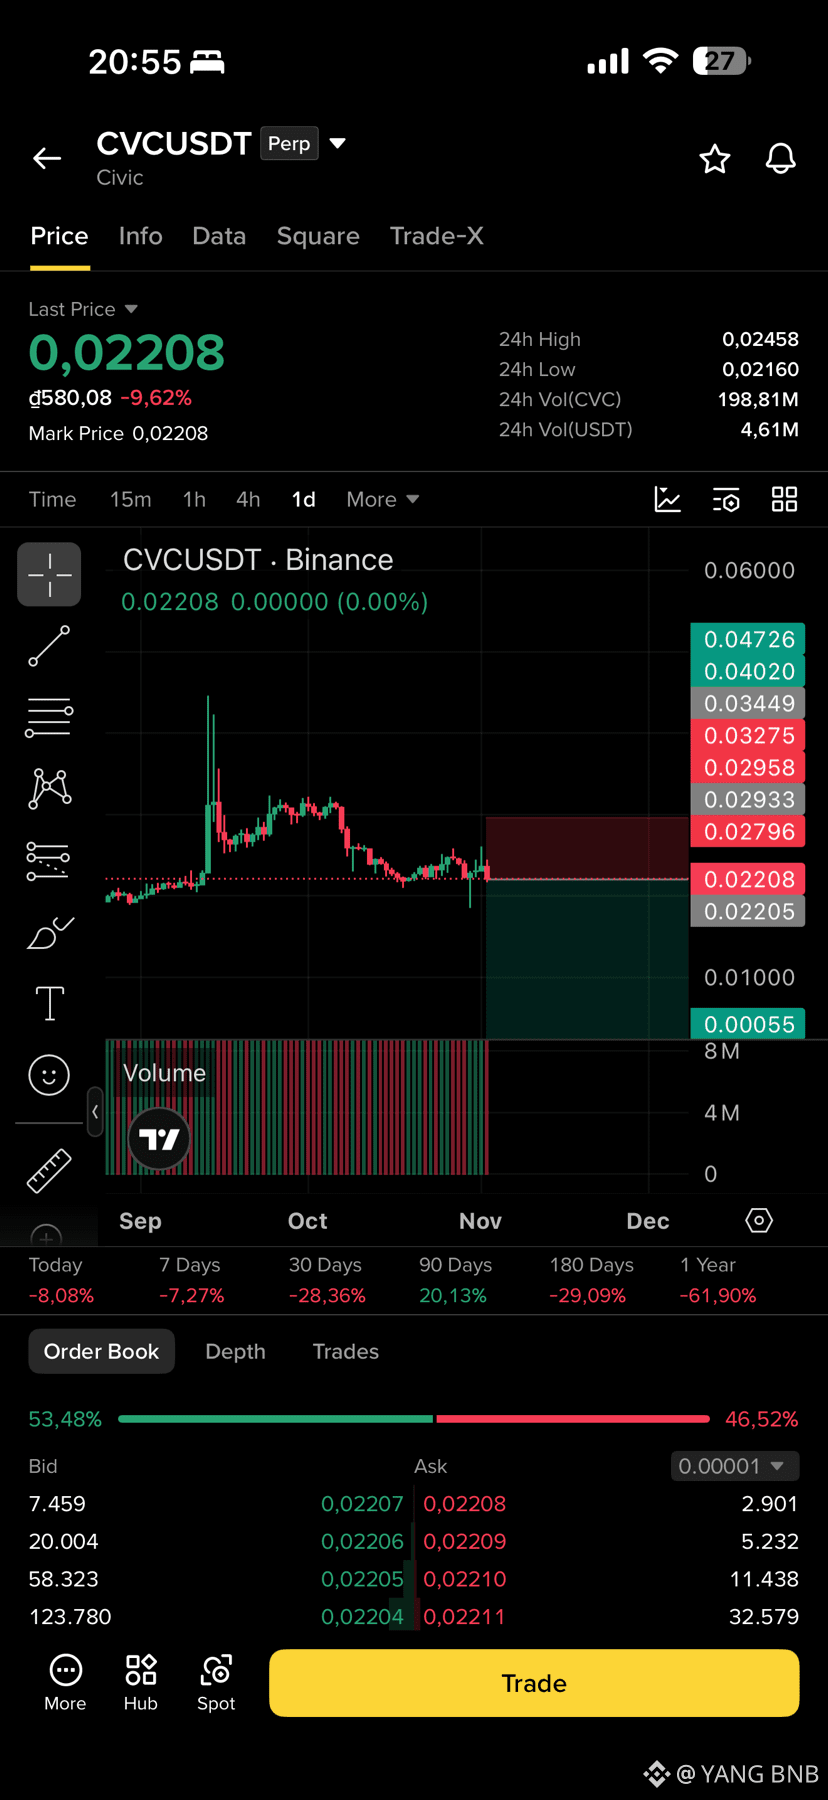
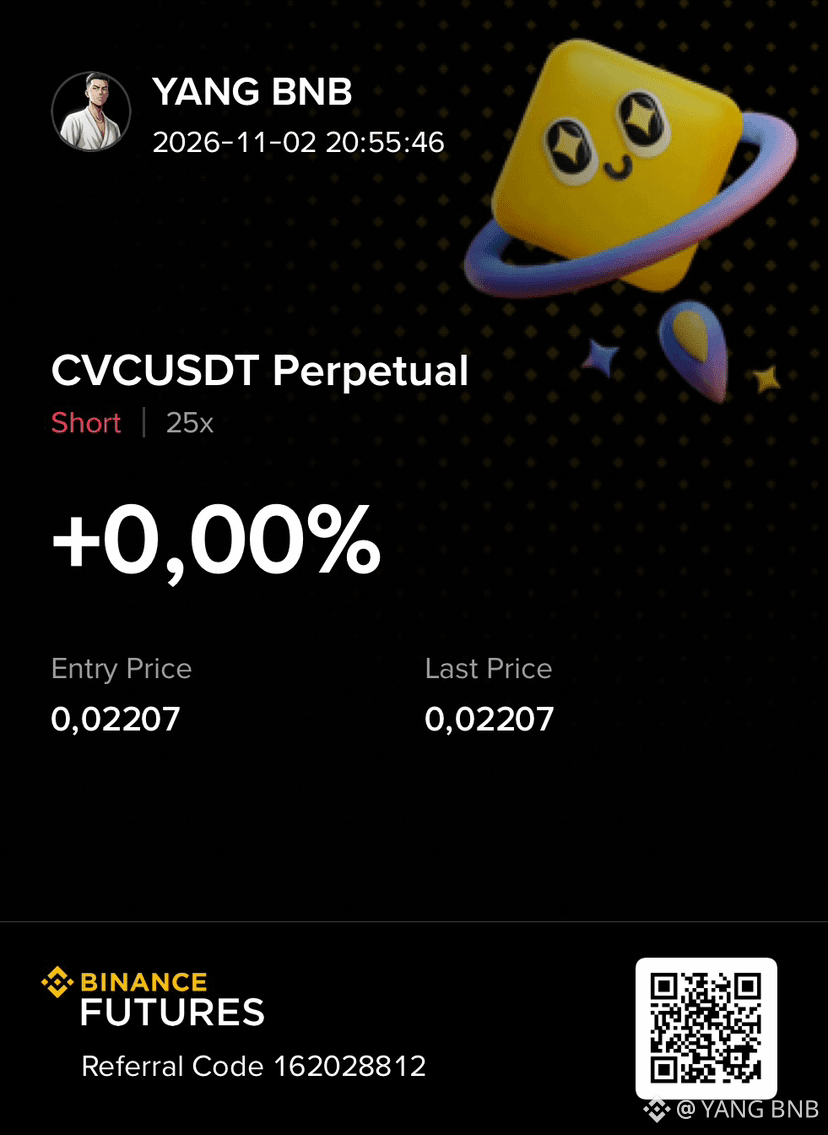
CVC is showing continued bearish momentum after facing repeated rejection from its previous resistance zones. The price is currently trading around 0.02208, down more than 9% in the last 24 hours. Sellers remain in control, pushing the price lower after failing to recover above the 0.03000 resistance area. The daily chart shows a bearish market structure, with lower highs and persistent selling pressure.
Trading Ideas Short $CVCUSDT
Entry: 0.02200 – 0.02280
TP1: 0.02000
TP2: 0.01500
SL: 0.02796
TP3: 0.00055
Short $CVC 👇
{future}(CVCUSDT)
🔥 $CVC BIG SHORT OPPORTUNITY :
CVC is showing continued bearish momentum after facing repeated rejection from its previous resistance zones. The price is currently trading around 0.02208, down more than 9% in the last 24 hours. Sellers remain in control, pushing the price lower after failing to recover above the 0.03000 resistance area. The daily chart shows a bearish market structure, with lower highs and persistent selling pressure.
Trading Ideas Short $CVCUSDT
Entry: 0.02200 – 0.02280
TP1: 0.02000
TP2: 0.01500
SL: 0.02796
TP3: 0.00055
Short $CVC 👇
CVC is showing continued bearish momentum after facing repeated rejection from its previous resistance zones. The price is currently trading around 0.02208, down more than 9% in the last 24 hours. Sellers remain in control, pushing the price lower after failing to recover above the 0.03000 resistance area. The daily chart shows a bearish market structure, with lower highs and persistent selling pressure.
Trading Ideas Short $CVCUSDT
Entry: 0.02200 – 0.02280
TP1: 0.02000
TP2: 0.01500
SL: 0.02796
TP3: 0.00055
Short $CVC 👇
294
·
--
Падение
🔥 $2Z BIG SHORT OPPORTUNITY :
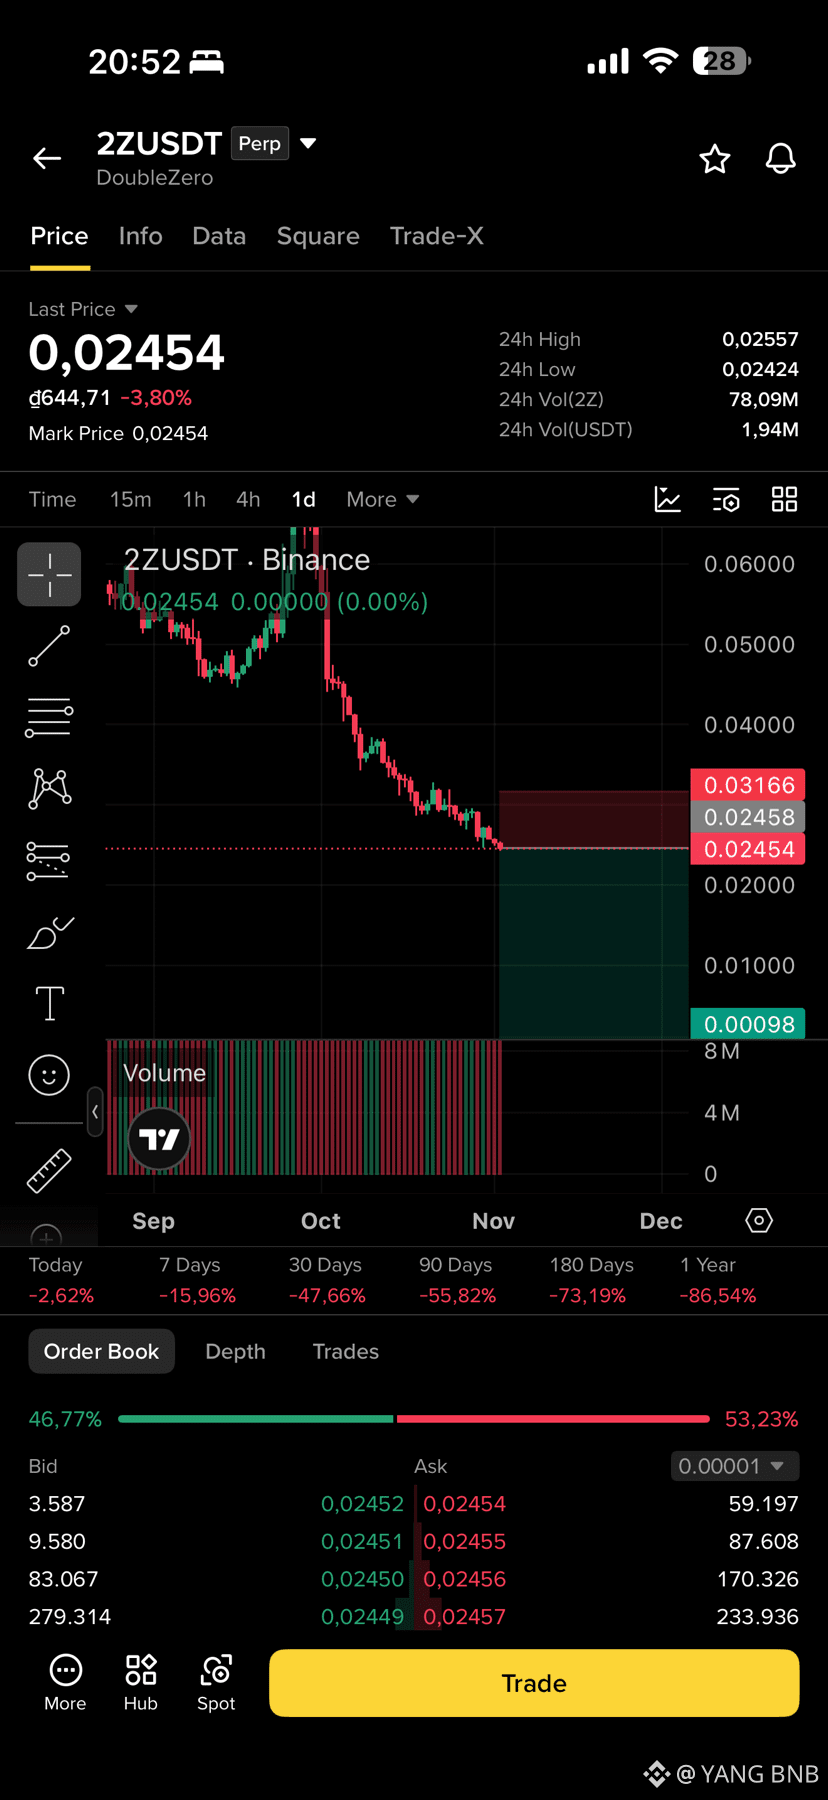
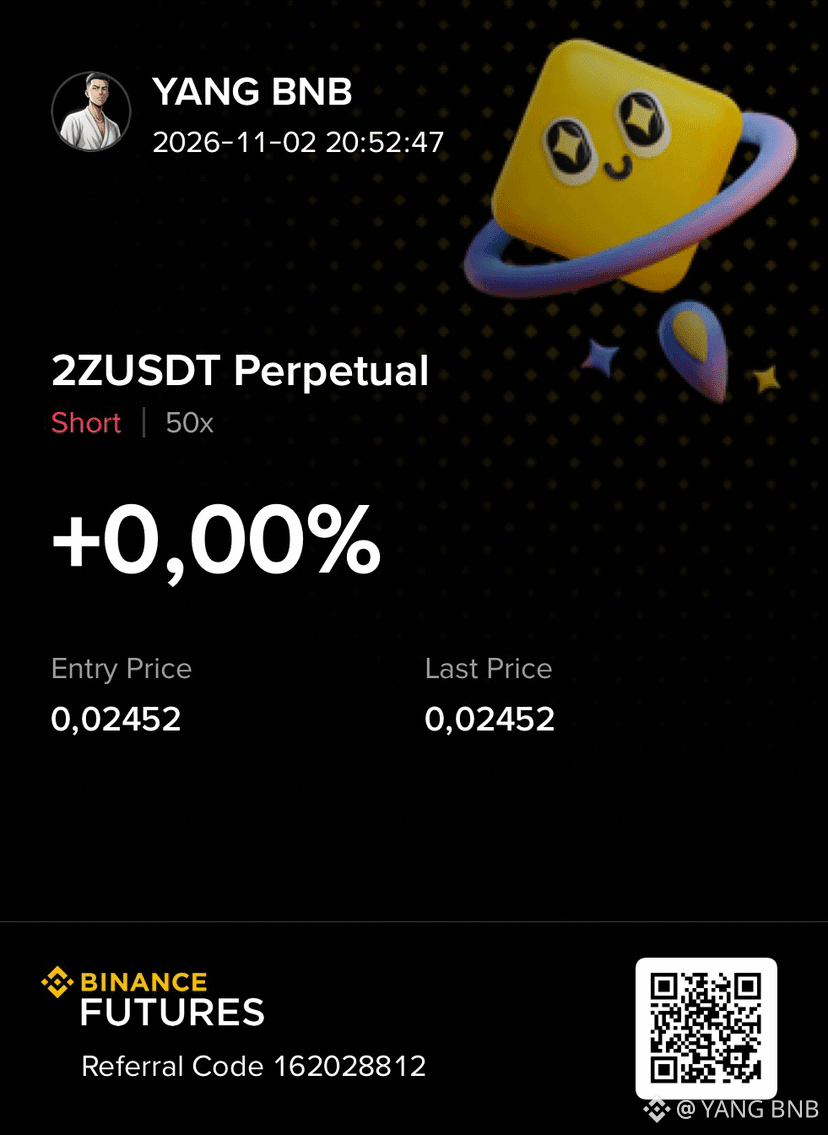
2Z is showing strong bearish momentum after experiencing a significant breakdown from its previous support zones. The price is currently trading around 0.02454, down nearly 4% in the last 24 hours. Sellers remain firmly in control, with the daily chart showing a consistent pattern of lower highs and lower lows.
Trading Ideas Short $2ZUSDT
Entry: 0.02450 – 0.02500
TP1: 0.02000
TP2: 0.01500
SL: 0.03166
TP3: 0.00098
Short $2Z 👇
{future}(2ZUSDT)
🔥 $2Z BIG SHORT OPPORTUNITY :
2Z is showing strong bearish momentum after experiencing a significant breakdown from its previous support zones. The price is currently trading around 0.02454, down nearly 4% in the last 24 hours. Sellers remain firmly in control, with the daily chart showing a consistent pattern of lower highs and lower lows.
Trading Ideas Short $2ZUSDT
Entry: 0.02450 – 0.02500
TP1: 0.02000
TP2: 0.01500
SL: 0.03166
TP3: 0.00098
Short $2Z 👇
2Z is showing strong bearish momentum after experiencing a significant breakdown from its previous support zones. The price is currently trading around 0.02454, down nearly 4% in the last 24 hours. Sellers remain firmly in control, with the daily chart showing a consistent pattern of lower highs and lower lows.
Trading Ideas Short $2ZUSDT
Entry: 0.02450 – 0.02500
TP1: 0.02000
TP2: 0.01500
SL: 0.03166
TP3: 0.00098
Short $2Z 👇
209
·
--
Падение
🔥 $KOMA BIG SHORT OPPORTUNITY :
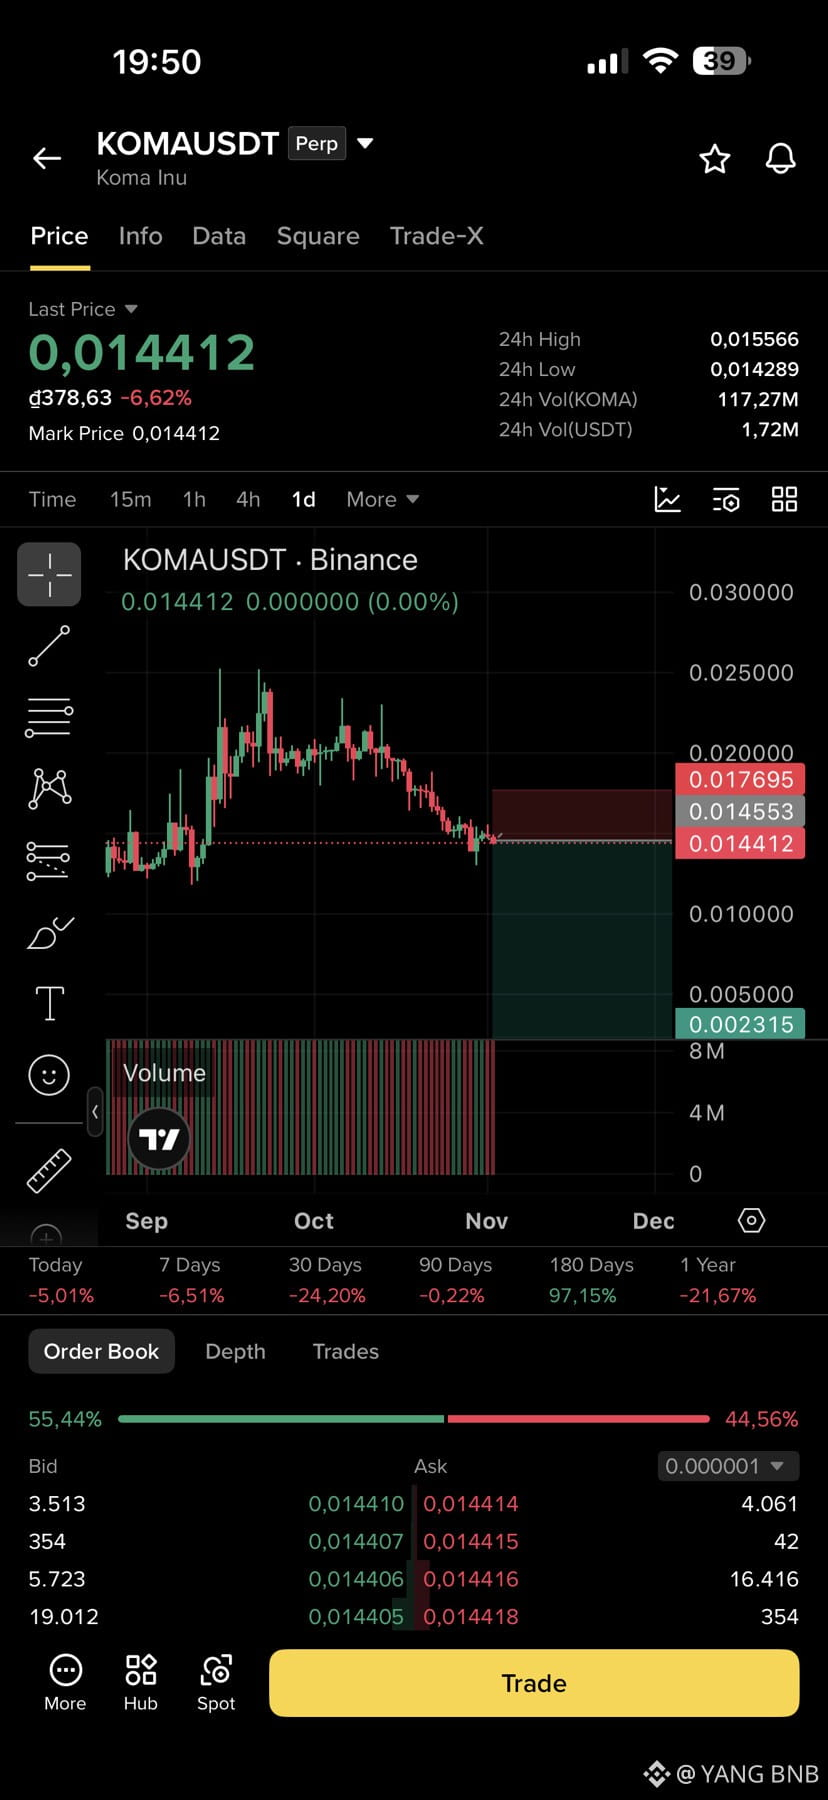
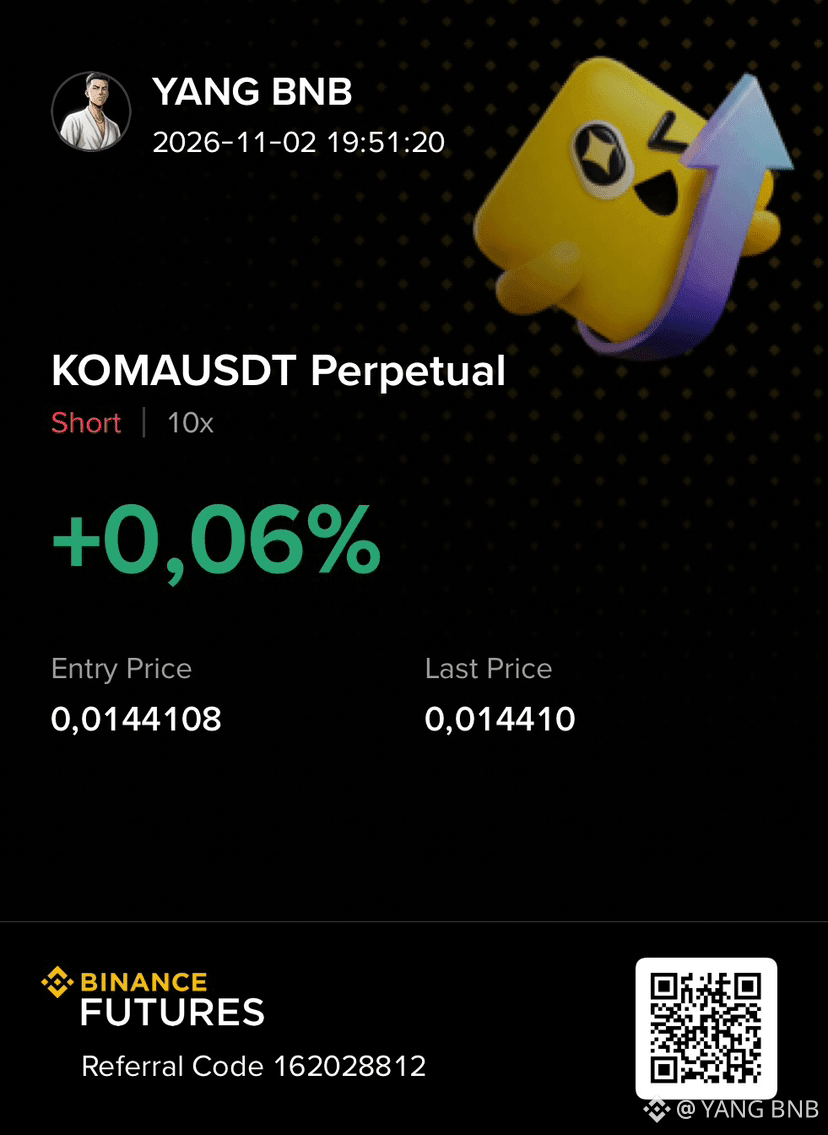
KOMA is showing continued bearish momentum after facing repeated rejection from its previous resistance zones. The price is currently trading around 0.014412, down more than 6% in the last 24 hours. Sellers remain in control, pushing the price lower after failing to maintain its previous highs around 0.02500.
Trading Ideas Short $KOMAUSDT
Entry: 0.01440 – 0.01460
TP1: 0.01200
TP2: 0.01000
SL: 0.017695
TP3: 0.002315
Short $KOMA 👇
{future}(KOMAUSDT)
🔥 $KOMA BIG SHORT OPPORTUNITY :
KOMA is showing continued bearish momentum after facing repeated rejection from its previous resistance zones. The price is currently trading around 0.014412, down more than 6% in the last 24 hours. Sellers remain in control, pushing the price lower after failing to maintain its previous highs around 0.02500.
Trading Ideas Short $KOMAUSDT
Entry: 0.01440 – 0.01460
TP1: 0.01200
TP2: 0.01000
SL: 0.017695
TP3: 0.002315
Short $KOMA 👇
KOMA is showing continued bearish momentum after facing repeated rejection from its previous resistance zones. The price is currently trading around 0.014412, down more than 6% in the last 24 hours. Sellers remain in control, pushing the price lower after failing to maintain its previous highs around 0.02500.
Trading Ideas Short $KOMAUSDT
Entry: 0.01440 – 0.01460
TP1: 0.01200
TP2: 0.01000
SL: 0.017695
TP3: 0.002315
Short $KOMA 👇
329
·
--
Падение
🔥 $PROVE BIG SHORT OPPORTUNITY :
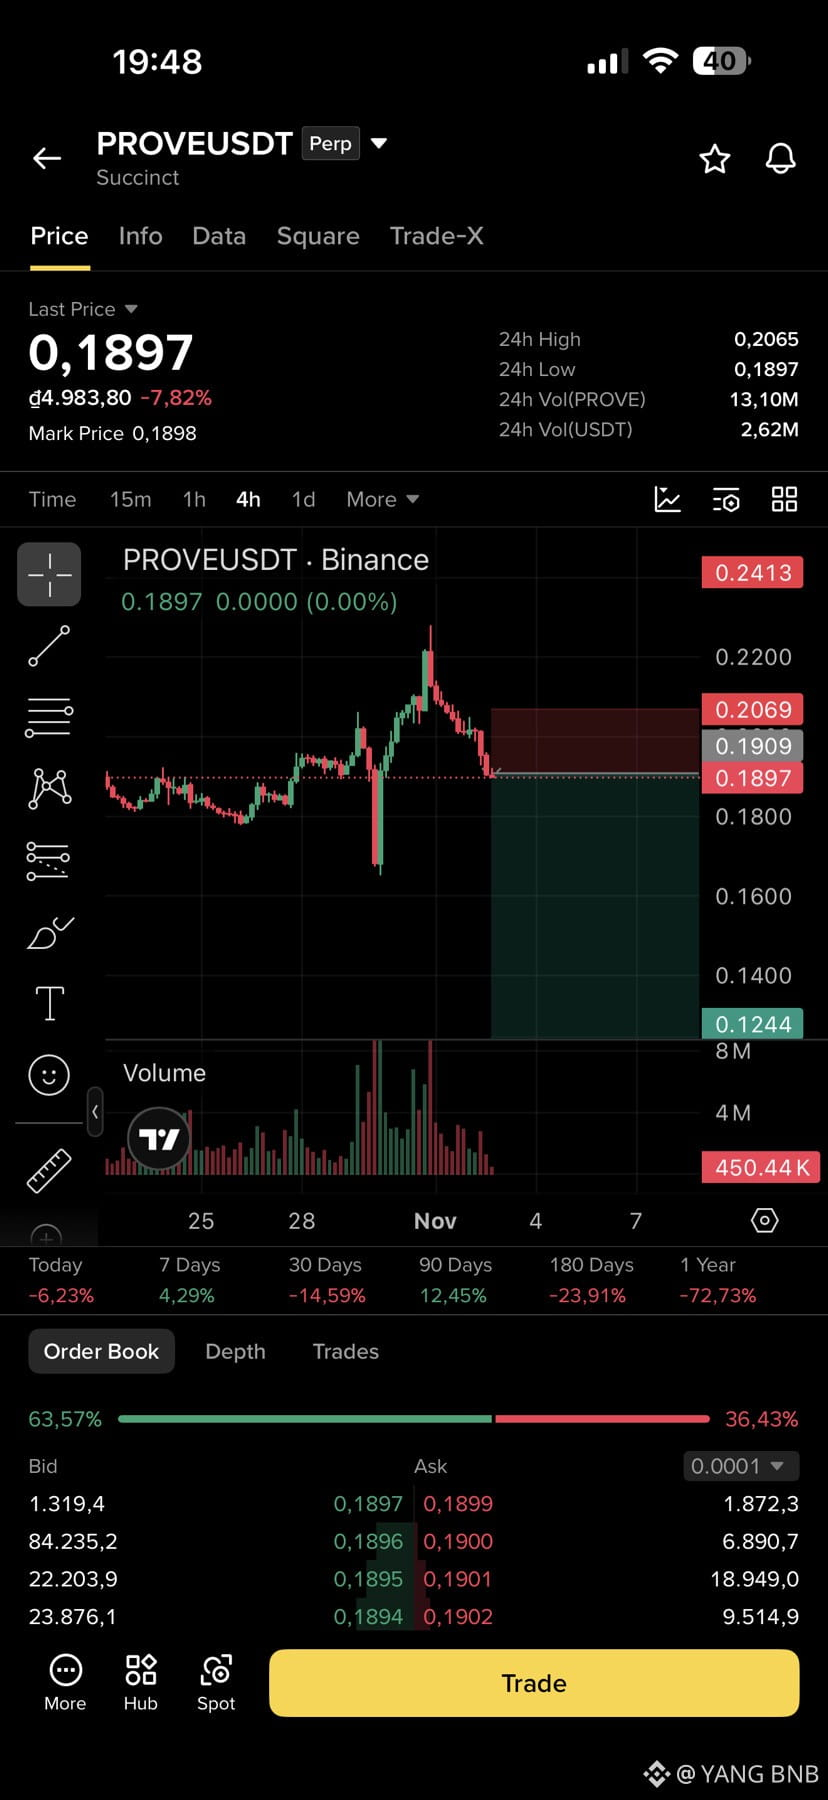
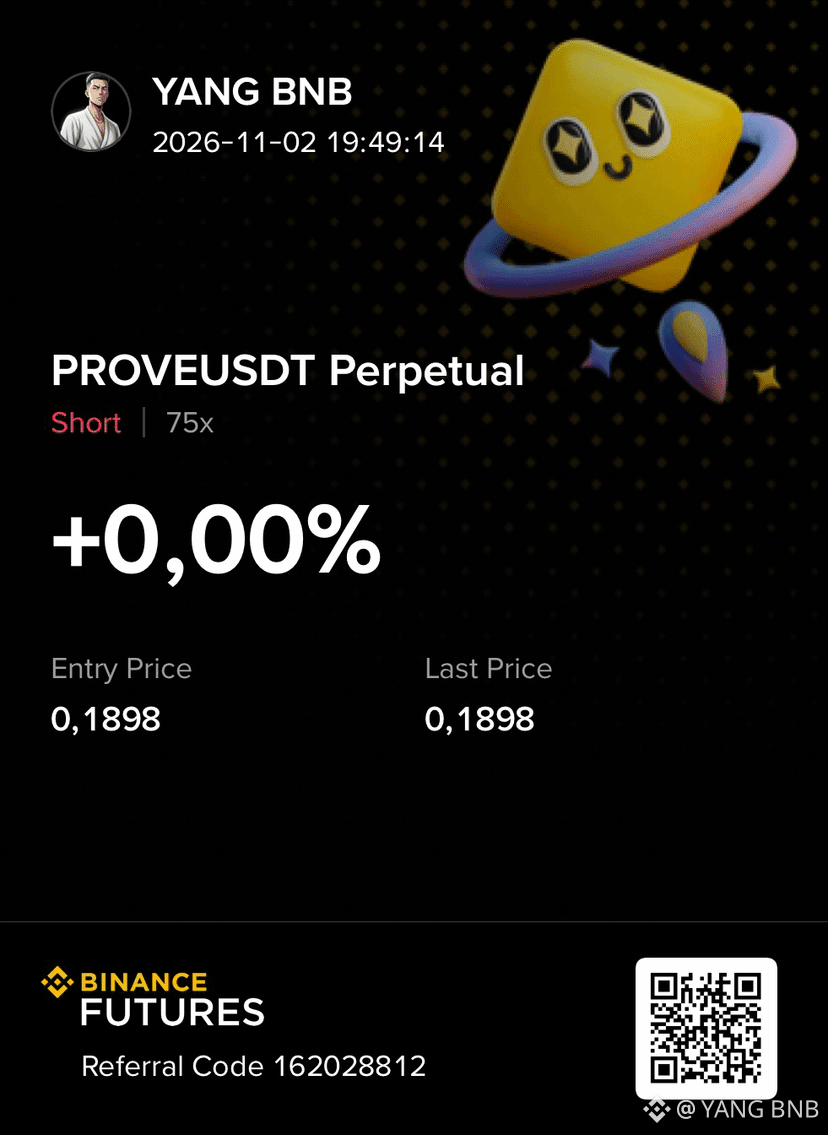
PROVE is showing increasing bearish momentum after facing strong rejection from its recent resistance zone. The price is currently trading around 0.1897, down nearly 8% in the last 24 hours. Sellers are gradually regaining control after the price failed to maintain its previous highs around 0.2200. The 4H chart shows a bearish reversal, with consecutive red candles pushing the price back toward its previous support zone. Buying momentum appears to be weakening, while selling pressure continues to increase. If the current support around 0.1890 fails to hold, further downside toward lower support levels could follow. 📉
Trading Ideas Short $PROVE
Entry: 0.1890 – 0.1930
TP1: 0.1800
TP2: 0.1600
SL: 0.2069
TP3: 0.1244
Short $PROVE 👇
{future}(PROVEUSDT)
🔥 $PROVE BIG SHORT OPPORTUNITY :
PROVE is showing increasing bearish momentum after facing strong rejection from its recent resistance zone. The price is currently trading around 0.1897, down nearly 8% in the last 24 hours. Sellers are gradually regaining control after the price failed to maintain its previous highs around 0.2200. The 4H chart shows a bearish reversal, with consecutive red candles pushing the price back toward its previous support zone. Buying momentum appears to be weakening, while selling pressure continues to increase. If the current support around 0.1890 fails to hold, further downside toward lower support levels could follow. 📉
Trading Ideas Short $PROVE
Entry: 0.1890 – 0.1930
TP1: 0.1800
TP2: 0.1600
SL: 0.2069
TP3: 0.1244
Short $PROVE 👇
PROVE is showing increasing bearish momentum after facing strong rejection from its recent resistance zone. The price is currently trading around 0.1897, down nearly 8% in the last 24 hours. Sellers are gradually regaining control after the price failed to maintain its previous highs around 0.2200. The 4H chart shows a bearish reversal, with consecutive red candles pushing the price back toward its previous support zone. Buying momentum appears to be weakening, while selling pressure continues to increase. If the current support around 0.1890 fails to hold, further downside toward lower support levels could follow. 📉
Trading Ideas Short $PROVE
Entry: 0.1890 – 0.1930
TP1: 0.1800
TP2: 0.1600
SL: 0.2069
TP3: 0.1244
Short $PROVE 👇
228
·
--
Падение
🔥 $ZETA BIG SHORT OPPORTUNITY :
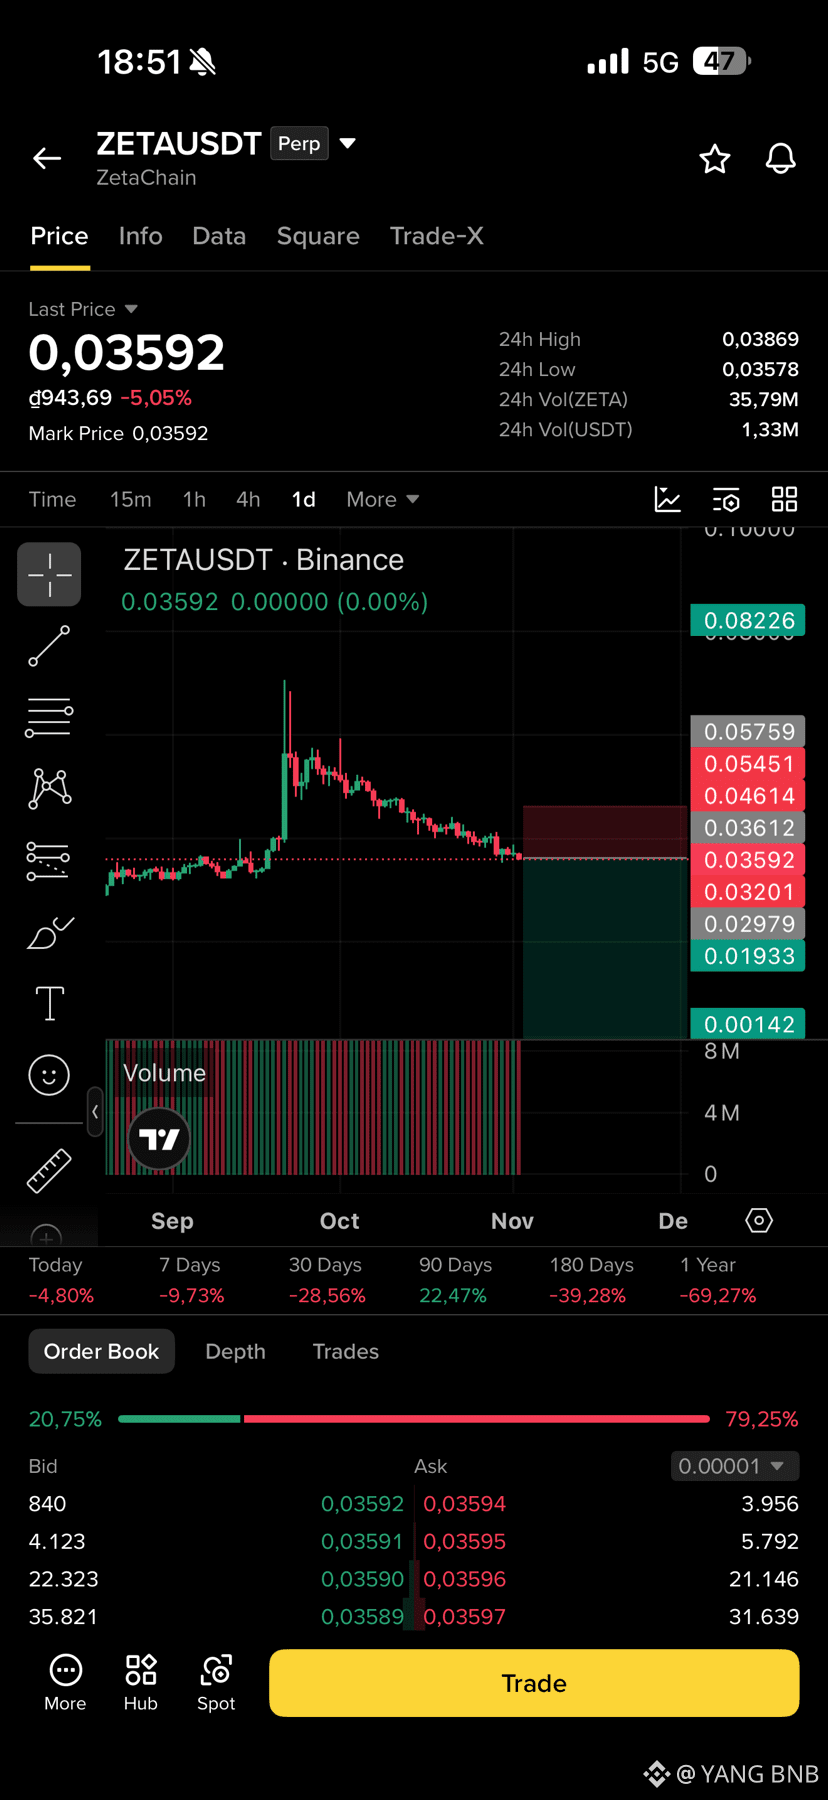
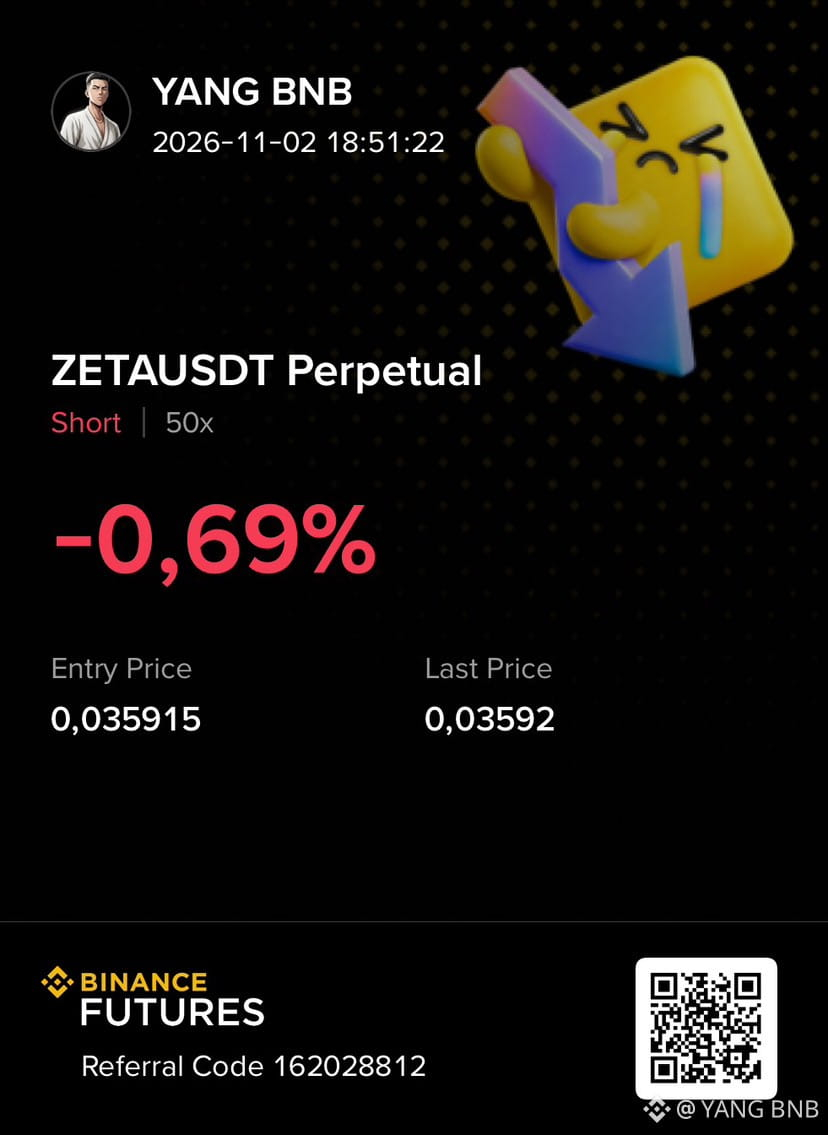
ZETA is showing continued bearish momentum after experiencing a significant rejection from its previous resistance zone. The price is currently trading around 0.03592, down more than 5% in the last 24 hours. Sellers remain firmly in control, pushing the price lower after failing to maintain its previous highs around 0.05500. The daily chart shows a clear bearish structure, with consistent lower highs and persistent selling pressure. The price is now approaching an important support zone around 0.03500. If this level breaks and bearish momentum continues, further downside toward lower support levels could follow. 📉
Trading Ideas Short $ZETAUSDT
Entry: 0.03590 – 0.03650
TP1: 0.03201
TP2: 0.02979
SL: 0.04614
TP3: 0.01933
Short $ZETA 👇
{future}(ZETAUSDT)
🔥 $ZETA BIG SHORT OPPORTUNITY :
ZETA is showing continued bearish momentum after experiencing a significant rejection from its previous resistance zone. The price is currently trading around 0.03592, down more than 5% in the last 24 hours. Sellers remain firmly in control, pushing the price lower after failing to maintain its previous highs around 0.05500. The daily chart shows a clear bearish structure, with consistent lower highs and persistent selling pressure. The price is now approaching an important support zone around 0.03500. If this level breaks and bearish momentum continues, further downside toward lower support levels could follow. 📉
Trading Ideas Short $ZETAUSDT
Entry: 0.03590 – 0.03650
TP1: 0.03201
TP2: 0.02979
SL: 0.04614
TP3: 0.01933
Short $ZETA 👇
ZETA is showing continued bearish momentum after experiencing a significant rejection from its previous resistance zone. The price is currently trading around 0.03592, down more than 5% in the last 24 hours. Sellers remain firmly in control, pushing the price lower after failing to maintain its previous highs around 0.05500. The daily chart shows a clear bearish structure, with consistent lower highs and persistent selling pressure. The price is now approaching an important support zone around 0.03500. If this level breaks and bearish momentum continues, further downside toward lower support levels could follow. 📉
Trading Ideas Short $ZETAUSDT
Entry: 0.03590 – 0.03650
TP1: 0.03201
TP2: 0.02979
SL: 0.04614
TP3: 0.01933
Short $ZETA 👇
208
·
--
Падение
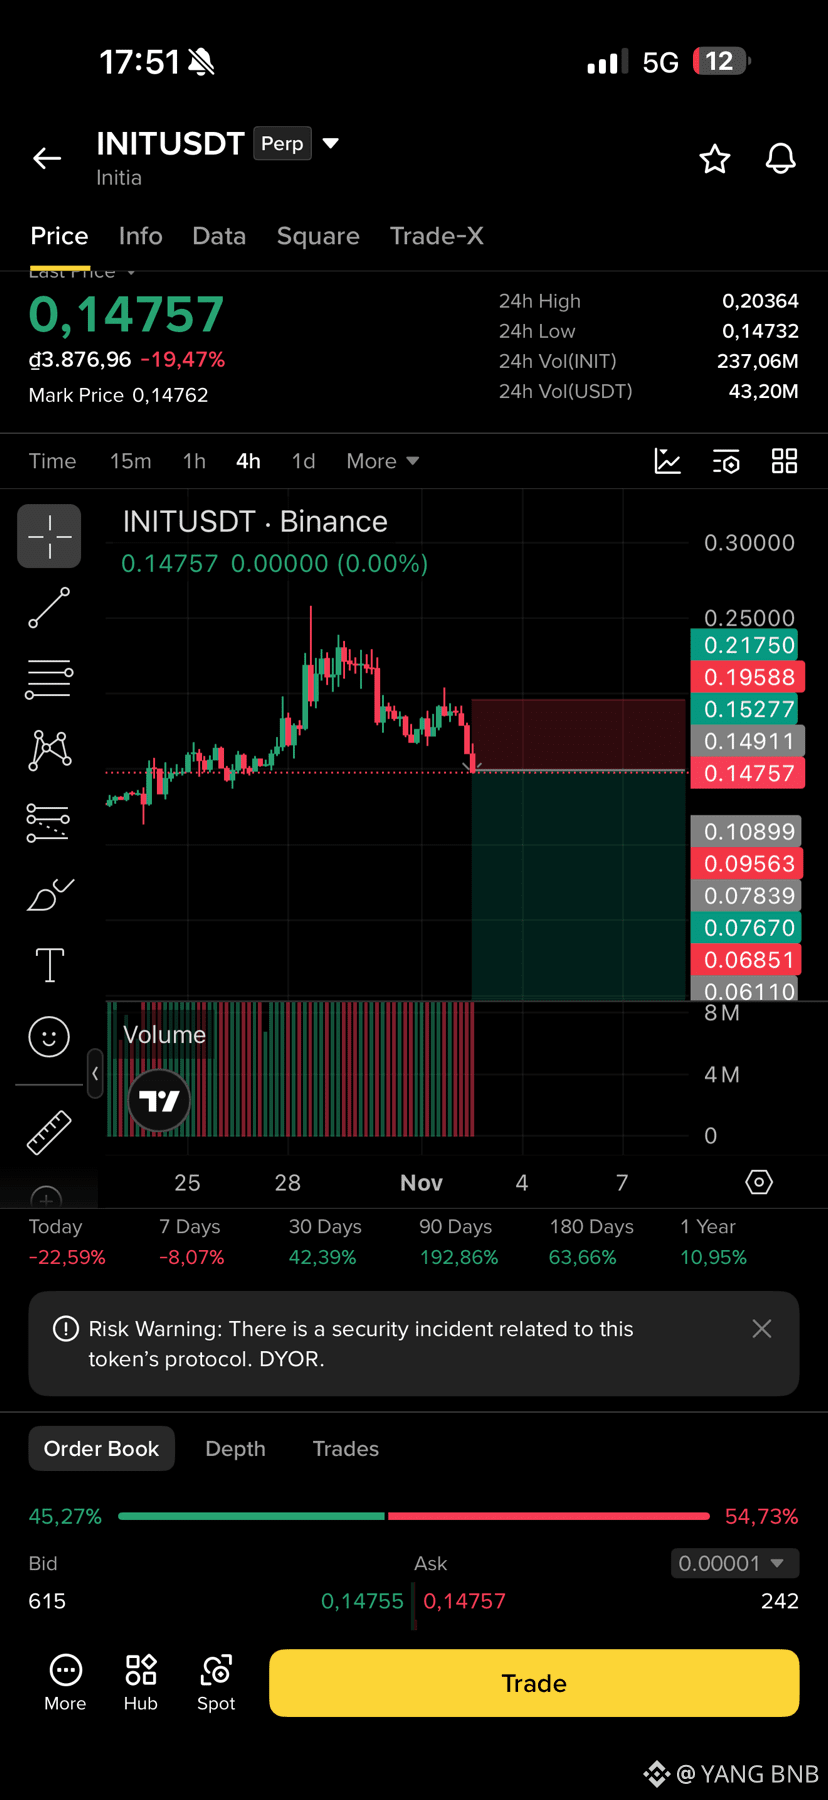
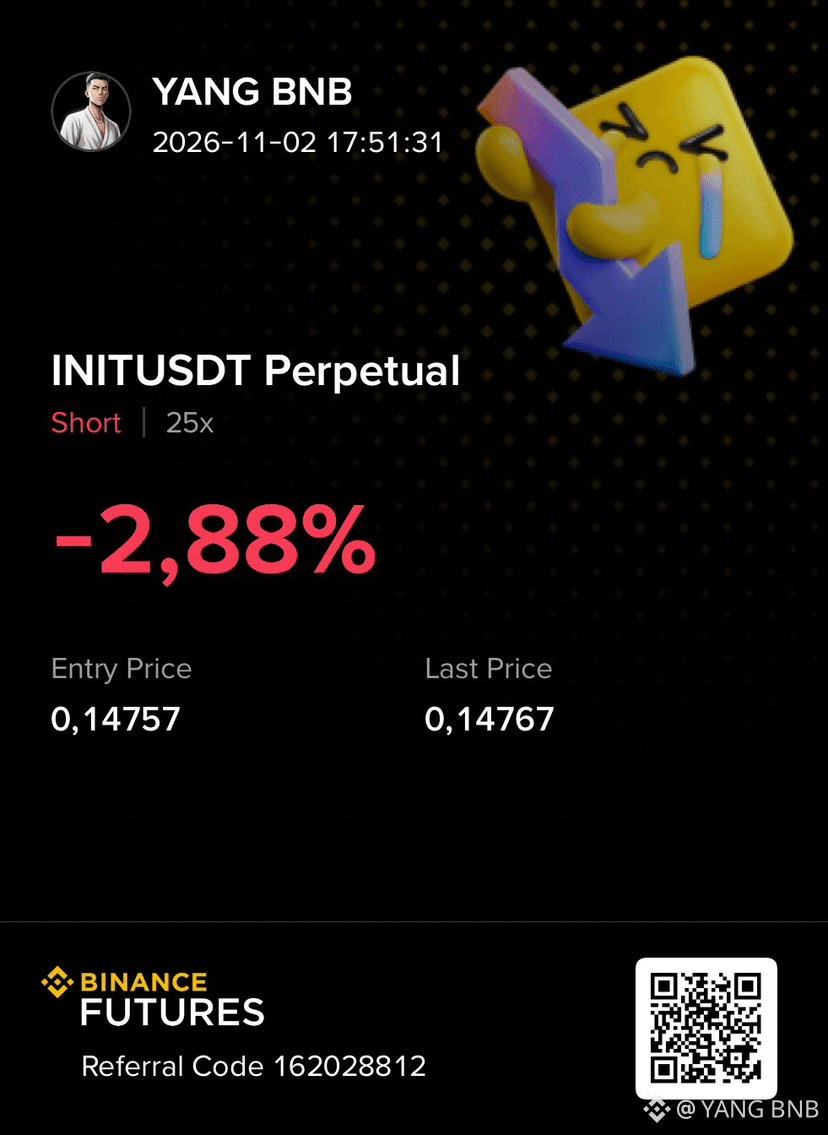
🔥 $INIT BIG SHORT OPPORTUNITY :
INIT is showing strong bearish momentum after facing repeated rejection from its previous resistance zone. The price is currently trading around 0.14757, down more than 19% in the last 24 hours. Sellers have regained control, pushing the price sharply lower after failing to maintain its previous highs around 0.22000.
Trading Ideas Short $INIT
Entry: 0.14750 – 0.15300
TP1: 0.10899
TP2: 0.09563
SL: 0.19588
TP3: 0.06851
{future}(INITUSDT)
🔥 $INIT BIG SHORT OPPORTUNITY :
INIT is showing strong bearish momentum after facing repeated rejection from its previous resistance zone. The price is currently trading around 0.14757, down more than 19% in the last 24 hours. Sellers have regained control, pushing the price sharply lower after failing to maintain its previous highs around 0.22000.
Trading Ideas Short $INIT
Entry: 0.14750 – 0.15300
TP1: 0.10899
TP2: 0.09563
SL: 0.19588
TP3: 0.06851
INIT is showing strong bearish momentum after facing repeated rejection from its previous resistance zone. The price is currently trading around 0.14757, down more than 19% in the last 24 hours. Sellers have regained control, pushing the price sharply lower after failing to maintain its previous highs around 0.22000.
Trading Ideas Short $INIT
Entry: 0.14750 – 0.15300
TP1: 0.10899
TP2: 0.09563
SL: 0.19588
TP3: 0.06851
395
·
--
Падение
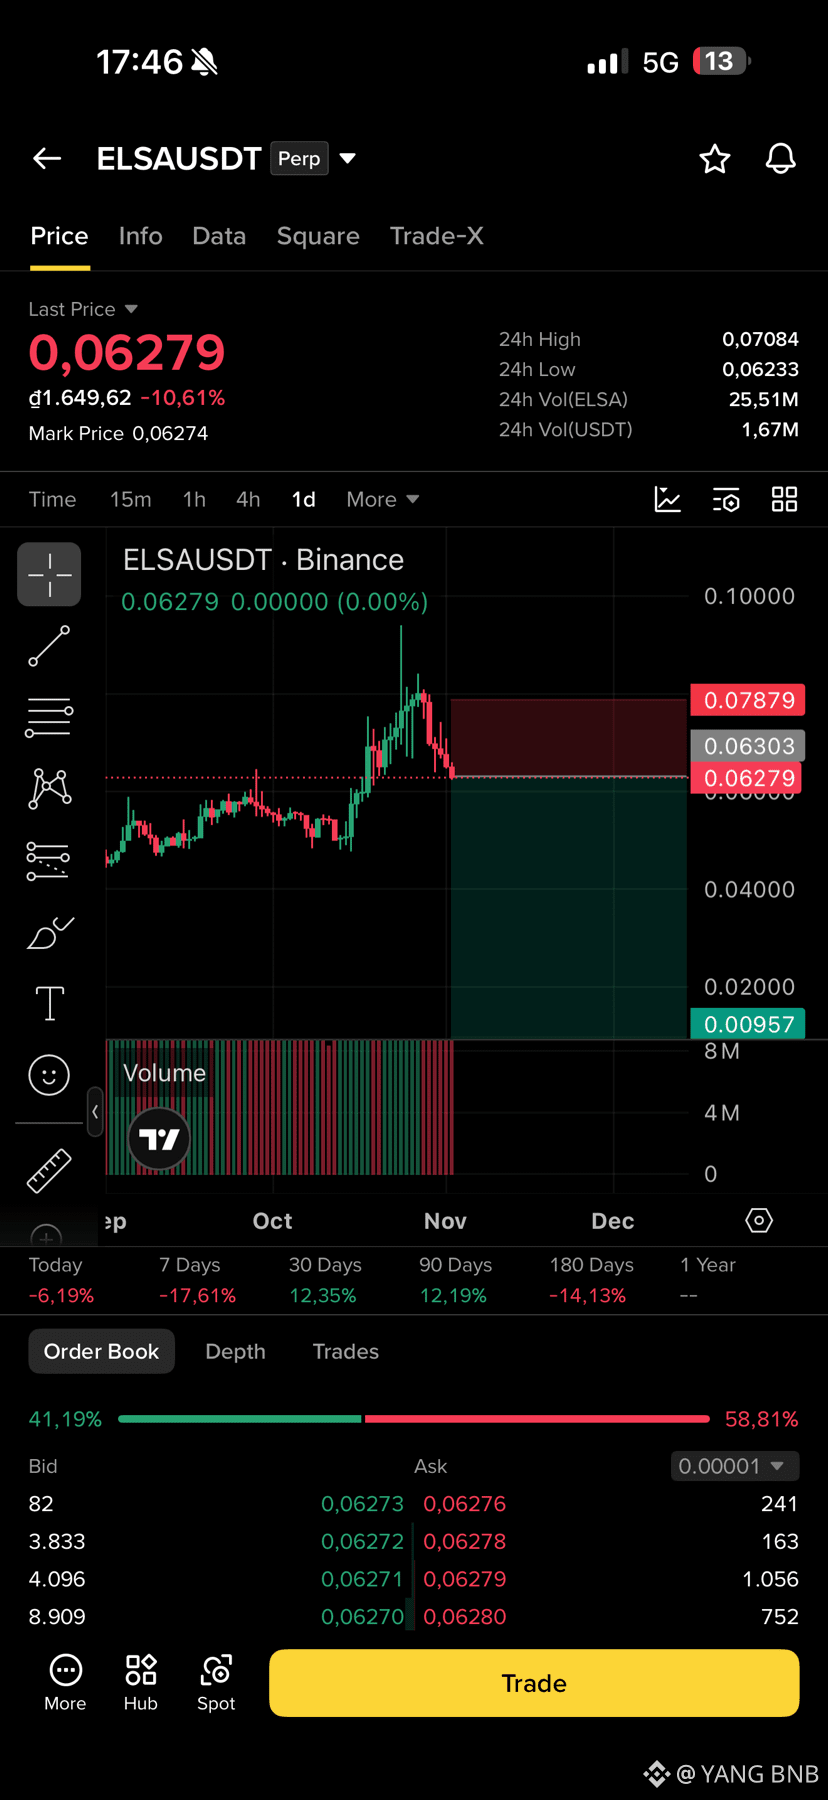
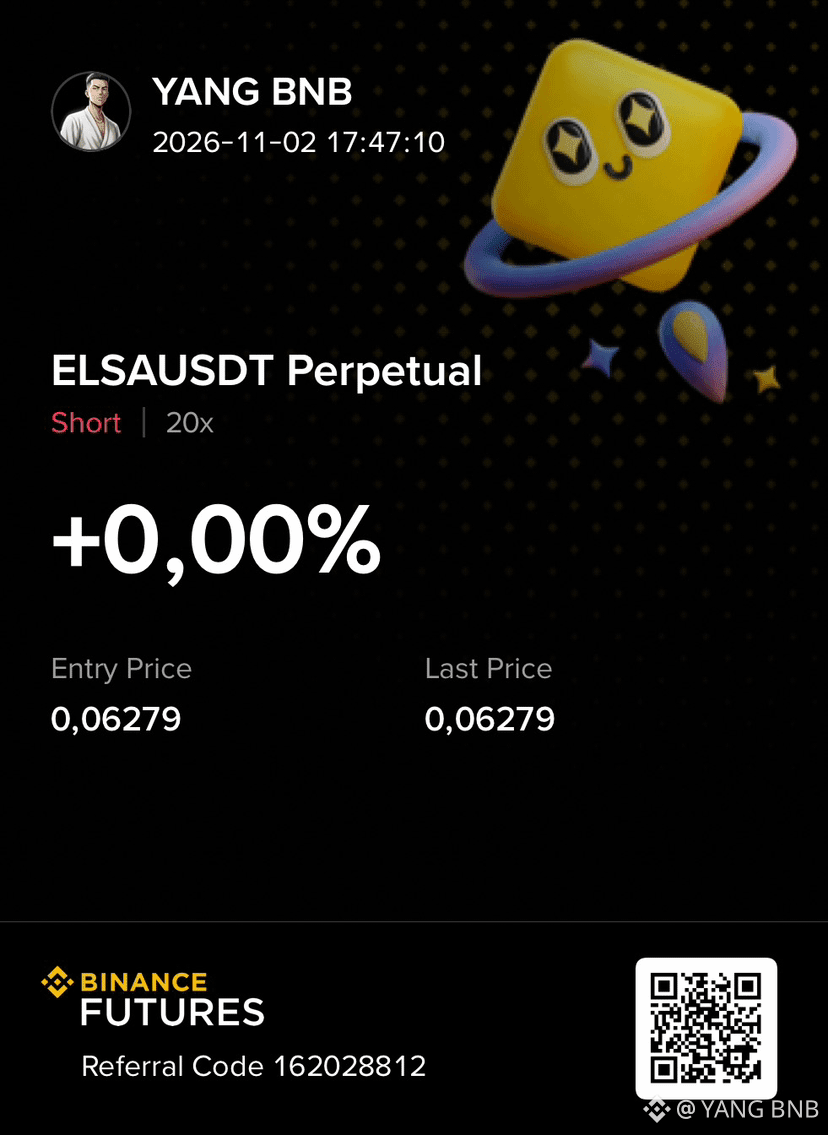
🔥 $ELSA BIG SHORT OPPORTUNITY :
ELSA is showing strong bearish momentum after facing a sharp rejection from its recent highs. The price is currently trading around 0.06279, down more than 10% in the last 24 hours. Sellers are regaining control after the price failed to maintain its previous breakout above the 0.07500 resistance zone.
Trading Ideas Short $ELSA
Entry: 0.06280 – 0.06400
TP1: 0.05500
TP2: 0.04000
SL: 0.07879
TP3: 0.00957
Short $ELSA 👇
{future}(ELSAUSDT)
🔥 $ELSA BIG SHORT OPPORTUNITY :
ELSA is showing strong bearish momentum after facing a sharp rejection from its recent highs. The price is currently trading around 0.06279, down more than 10% in the last 24 hours. Sellers are regaining control after the price failed to maintain its previous breakout above the 0.07500 resistance zone.
Trading Ideas Short $ELSA
Entry: 0.06280 – 0.06400
TP1: 0.05500
TP2: 0.04000
SL: 0.07879
TP3: 0.00957
Short $ELSA 👇
ELSA is showing strong bearish momentum after facing a sharp rejection from its recent highs. The price is currently trading around 0.06279, down more than 10% in the last 24 hours. Sellers are regaining control after the price failed to maintain its previous breakout above the 0.07500 resistance zone.
Trading Ideas Short $ELSA
Entry: 0.06280 – 0.06400
TP1: 0.05500
TP2: 0.04000
SL: 0.07879
TP3: 0.00957
Short $ELSA 👇
177
·
--
Падение
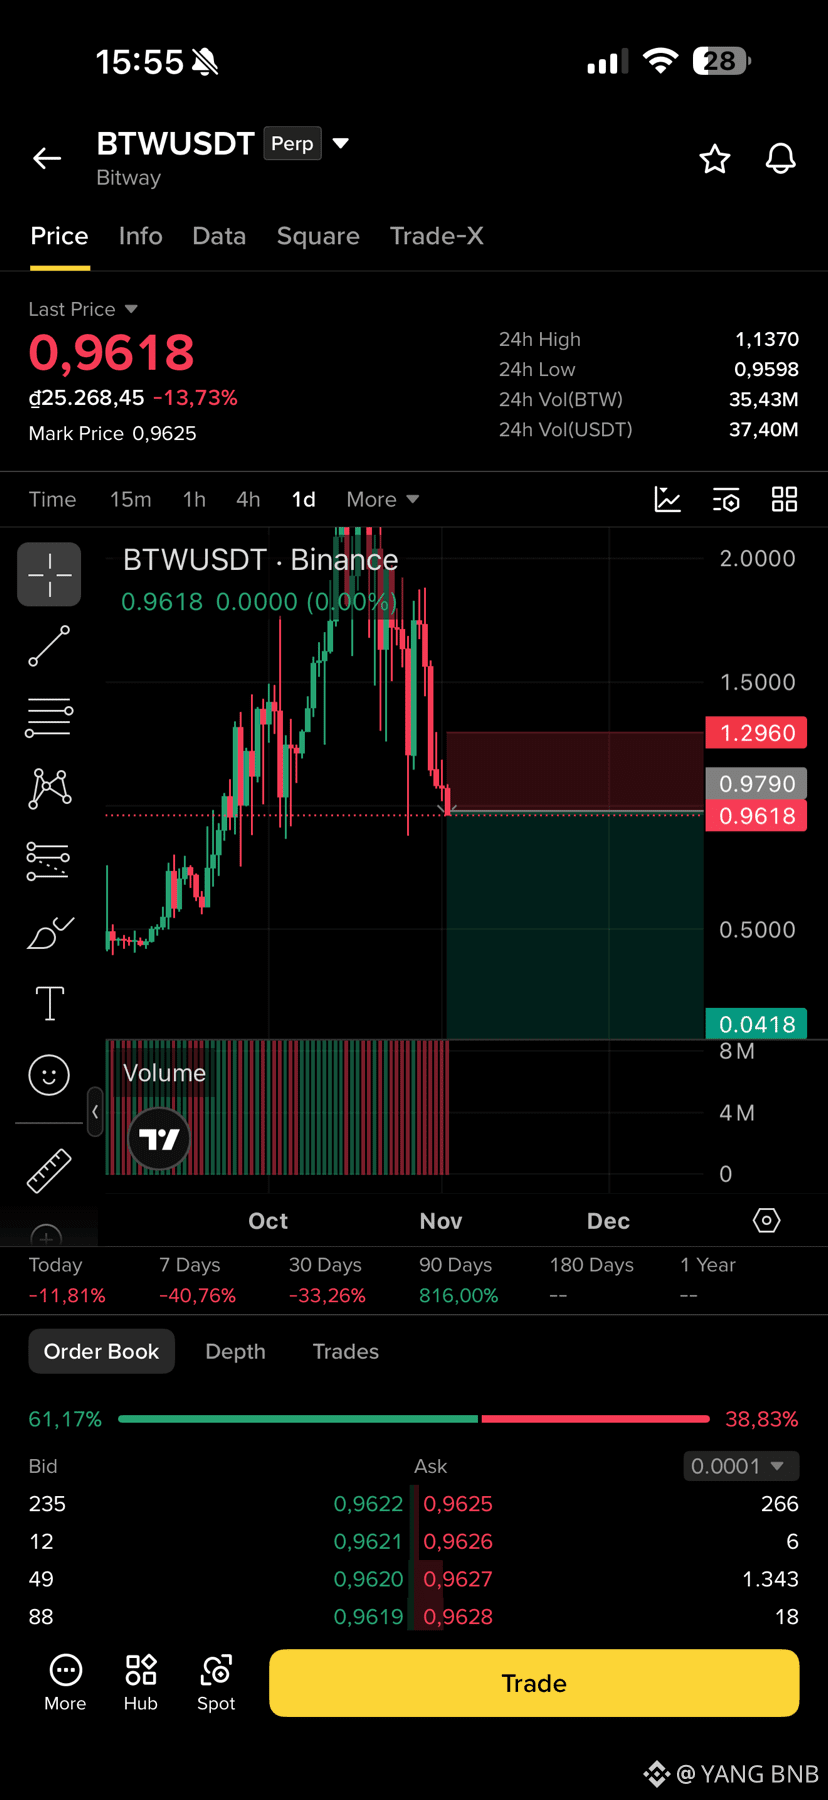
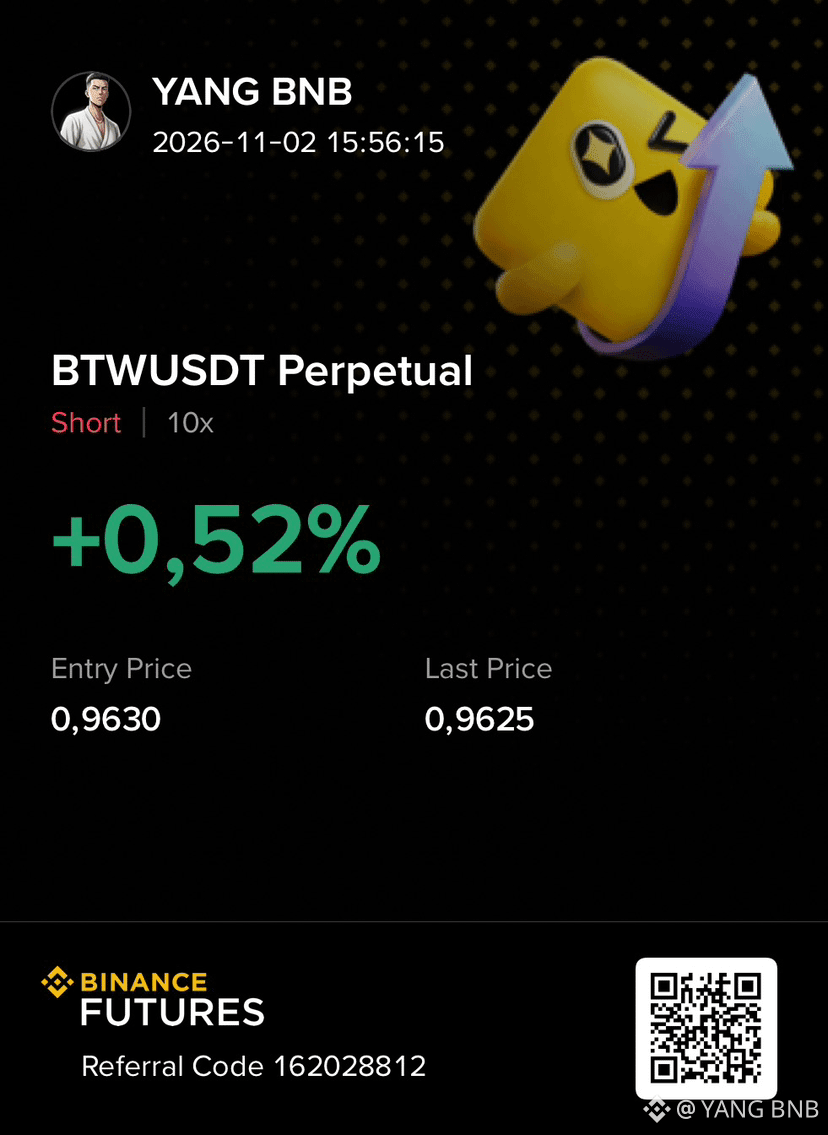
🔥 $BTW BIG SHORT OPPORTUNITY :
BTW is showing strong bearish momentum after experiencing a sharp rejection from its previous highs. The price is currently trading around 0.9618, down more than 13% in the last 24 hours. Sellers have taken control, pushing the price sharply lower after failing to maintain its previous resistance zone around 1.5000–2.0000. The daily chart shows a clear bearish reversal, with consecutive selling candles indicating increasing downward pressure. The price is now approaching an important support area. If selling pressure continues and buyers fail to defend the current levels, further downside could follow toward lower support zones. 📉
Trading Ideas Short $BTW
Entry: 0.9600 – 0.9800
TP1: 0.8000
TP2: 0.5000
SL: 1.2960
TP3: 0.0418
{future}(BTWUSDT)
🔥 $BTW BIG SHORT OPPORTUNITY :
BTW is showing strong bearish momentum after experiencing a sharp rejection from its previous highs. The price is currently trading around 0.9618, down more than 13% in the last 24 hours. Sellers have taken control, pushing the price sharply lower after failing to maintain its previous resistance zone around 1.5000–2.0000. The daily chart shows a clear bearish reversal, with consecutive selling candles indicating increasing downward pressure. The price is now approaching an important support area. If selling pressure continues and buyers fail to defend the current levels, further downside could follow toward lower support zones. 📉
Trading Ideas Short $BTW
Entry: 0.9600 – 0.9800
TP1: 0.8000
TP2: 0.5000
SL: 1.2960
TP3: 0.0418
BTW is showing strong bearish momentum after experiencing a sharp rejection from its previous highs. The price is currently trading around 0.9618, down more than 13% in the last 24 hours. Sellers have taken control, pushing the price sharply lower after failing to maintain its previous resistance zone around 1.5000–2.0000. The daily chart shows a clear bearish reversal, with consecutive selling candles indicating increasing downward pressure. The price is now approaching an important support area. If selling pressure continues and buyers fail to defend the current levels, further downside could follow toward lower support zones. 📉
Trading Ideas Short $BTW
Entry: 0.9600 – 0.9800
TP1: 0.8000
TP2: 0.5000
SL: 1.2960
TP3: 0.0418
353
·
--
Падение
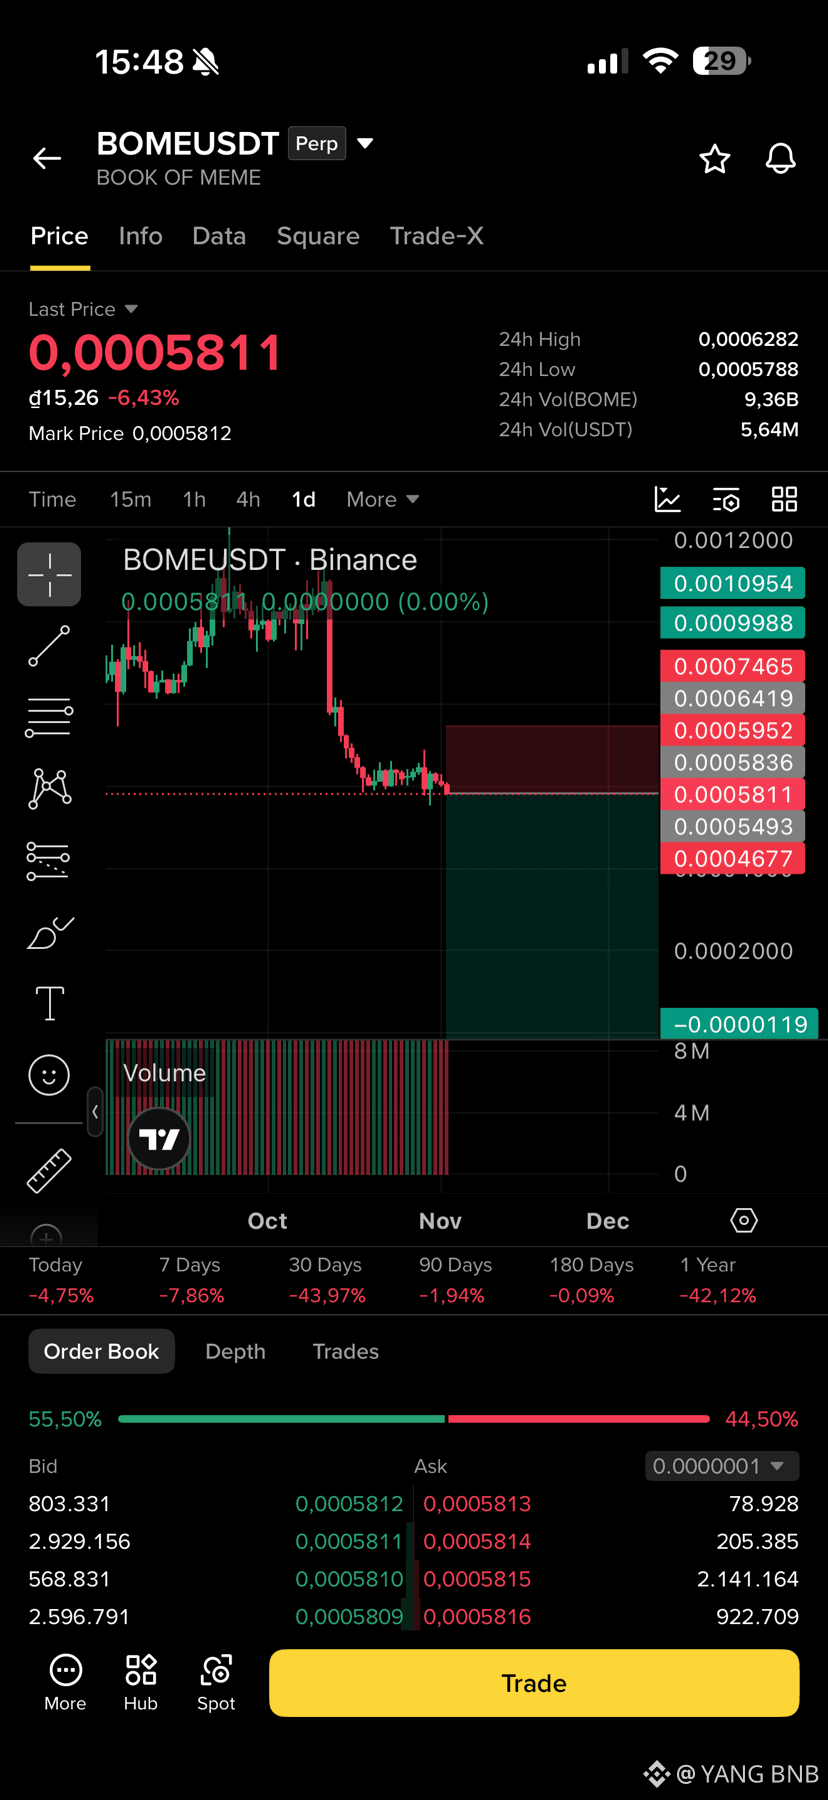
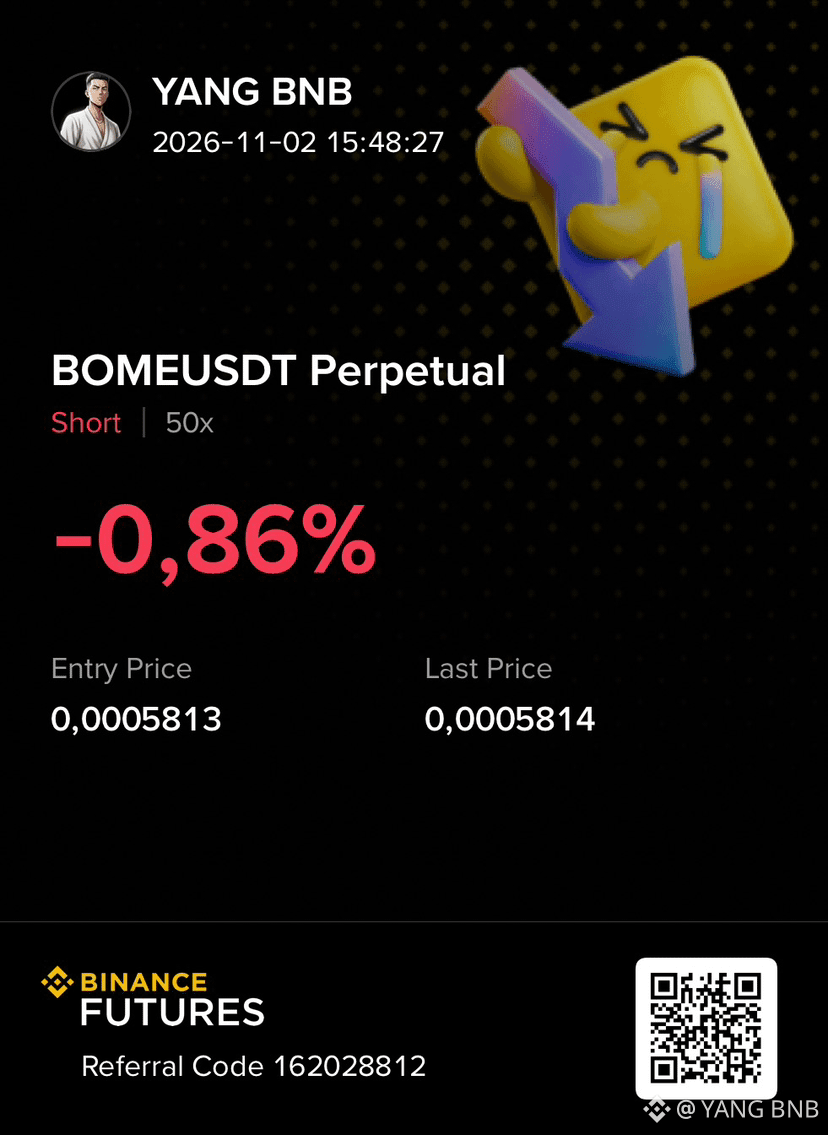
🔥 $BOME BIG SHORT OPPORTUNITY :
BOME is showing continued bearish momentum after experiencing a major breakdown from its previous consolidation zone. The price is currently trading around 0.0005811, down more than 6% in the last 24 hours. Sellers remain firmly in control, pushing the price lower after losing important support levels. The daily chart shows a clear bearish structure, with a sharp decline from its previous highs around 0.0010000. The price is now consolidating near its recent lows, but buying pressure remains weak. If the current support zone fails to hold, another downward move toward lower support levels could follow. 📉
Trading Ideas Short $BOMEUSDT
Entry: 0.0005810 – 0.0005950
TP1: 0.0005493
TP2: 0.0005000
SL: 0.0007465
TP3: 0.0004677
Short $BOME 👇
{future}(BOMEUSDT)
🔥 $BOME BIG SHORT OPPORTUNITY :
BOME is showing continued bearish momentum after experiencing a major breakdown from its previous consolidation zone. The price is currently trading around 0.0005811, down more than 6% in the last 24 hours. Sellers remain firmly in control, pushing the price lower after losing important support levels. The daily chart shows a clear bearish structure, with a sharp decline from its previous highs around 0.0010000. The price is now consolidating near its recent lows, but buying pressure remains weak. If the current support zone fails to hold, another downward move toward lower support levels could follow. 📉
Trading Ideas Short $BOMEUSDT
Entry: 0.0005810 – 0.0005950
TP1: 0.0005493
TP2: 0.0005000
SL: 0.0007465
TP3: 0.0004677
Short $BOME 👇
BOME is showing continued bearish momentum after experiencing a major breakdown from its previous consolidation zone. The price is currently trading around 0.0005811, down more than 6% in the last 24 hours. Sellers remain firmly in control, pushing the price lower after losing important support levels. The daily chart shows a clear bearish structure, with a sharp decline from its previous highs around 0.0010000. The price is now consolidating near its recent lows, but buying pressure remains weak. If the current support zone fails to hold, another downward move toward lower support levels could follow. 📉
Trading Ideas Short $BOMEUSDT
Entry: 0.0005810 – 0.0005950
TP1: 0.0005493
TP2: 0.0005000
SL: 0.0007465
TP3: 0.0004677
Short $BOME 👇
1
186
·
--
Падение
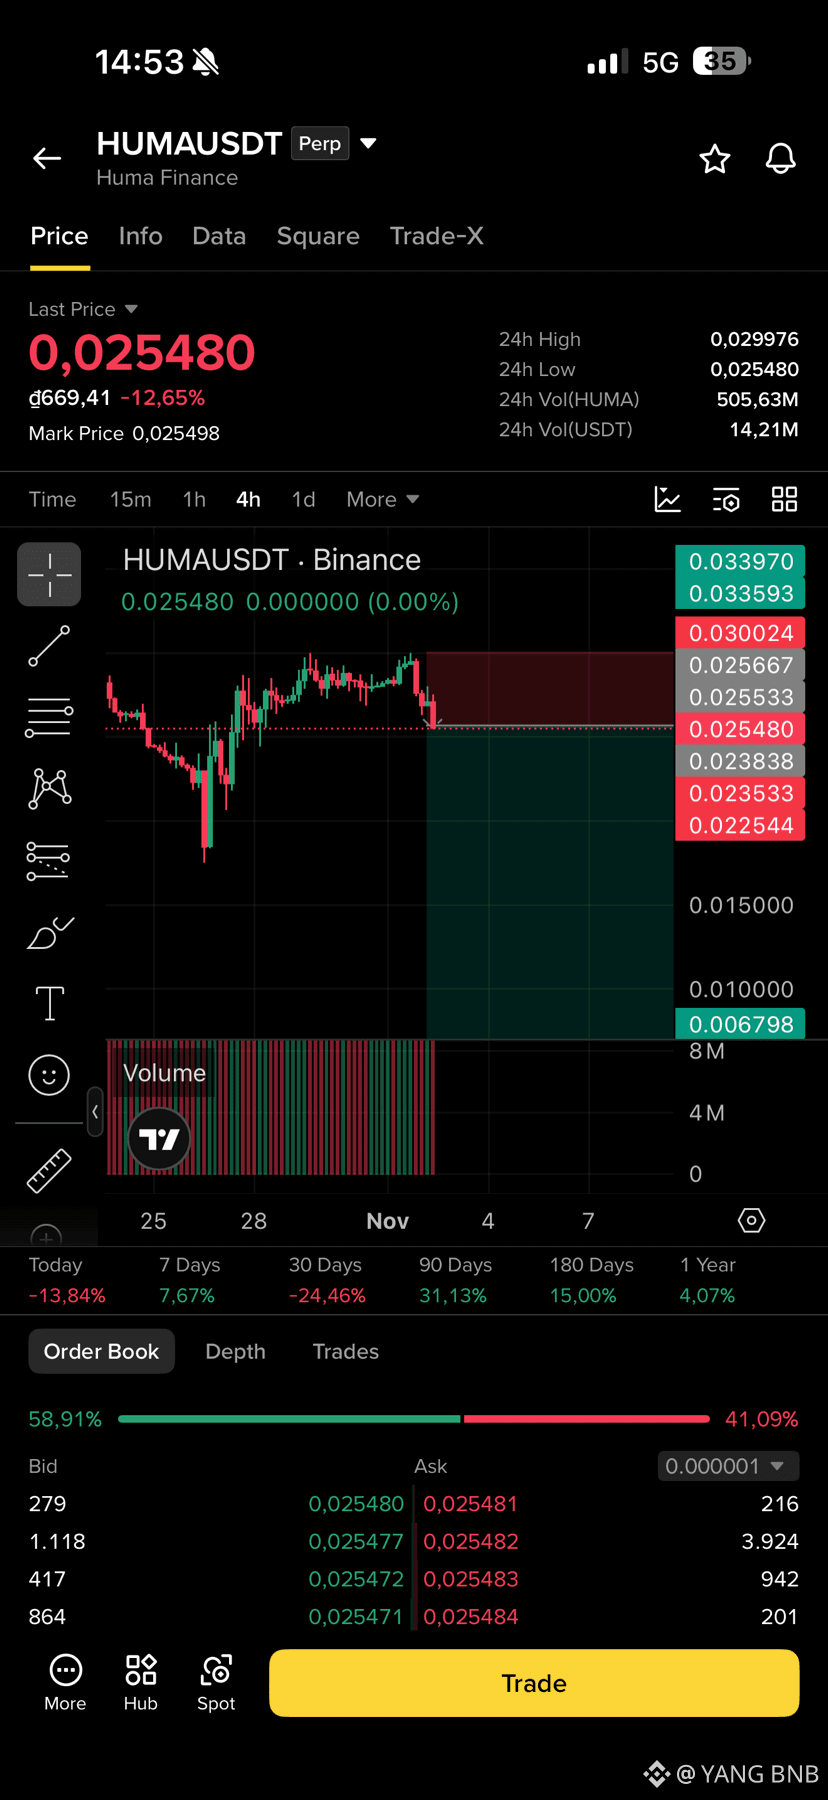
🔥 $HUMA BIG SHORT OPPORTUNITY :
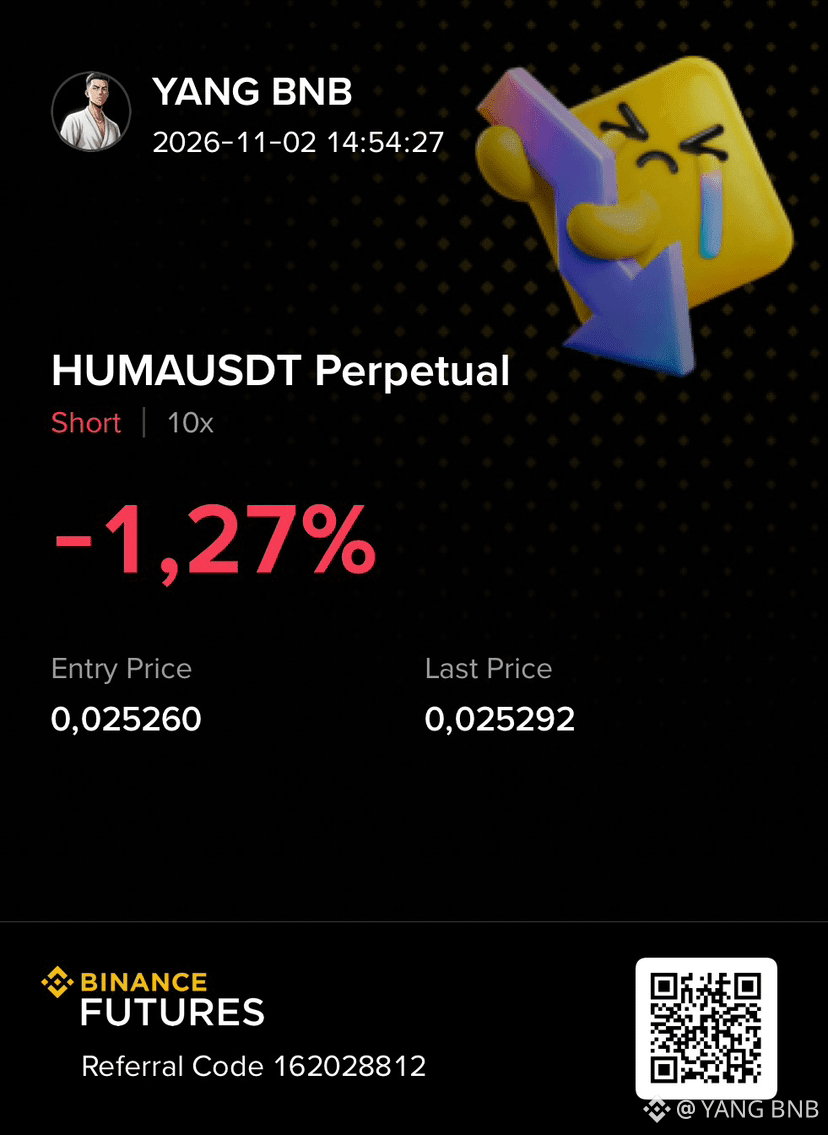
HUMA is showing strong bearish momentum after facing repeated rejection from its previous resistance zone. The price is currently trading around 0.025480, down more than 12% in the last 24 hours. Sellers are regaining control, pushing the price lower after failing to maintain its previous highs around 0.03000.
Trading Ideas Short $HUMAUSDT
Entry: 0.02550 – 0.02600
TP1: 0.02353
TP2: 0.02254
SL: 0.03002
TP3: 0.00679
.
{future}(HUMAUSDT)
🔥 $HUMA BIG SHORT OPPORTUNITY :
HUMA is showing strong bearish momentum after facing repeated rejection from its previous resistance zone. The price is currently trading around 0.025480, down more than 12% in the last 24 hours. Sellers are regaining control, pushing the price lower after failing to maintain its previous highs around 0.03000.
Trading Ideas Short $HUMAUSDT
Entry: 0.02550 – 0.02600
TP1: 0.02353
TP2: 0.02254
SL: 0.03002
TP3: 0.00679
.
HUMA is showing strong bearish momentum after facing repeated rejection from its previous resistance zone. The price is currently trading around 0.025480, down more than 12% in the last 24 hours. Sellers are regaining control, pushing the price lower after failing to maintain its previous highs around 0.03000.
Trading Ideas Short $HUMAUSDT
Entry: 0.02550 – 0.02600
TP1: 0.02353
TP2: 0.02254
SL: 0.03002
TP3: 0.00679
.
256
·
--
Рост
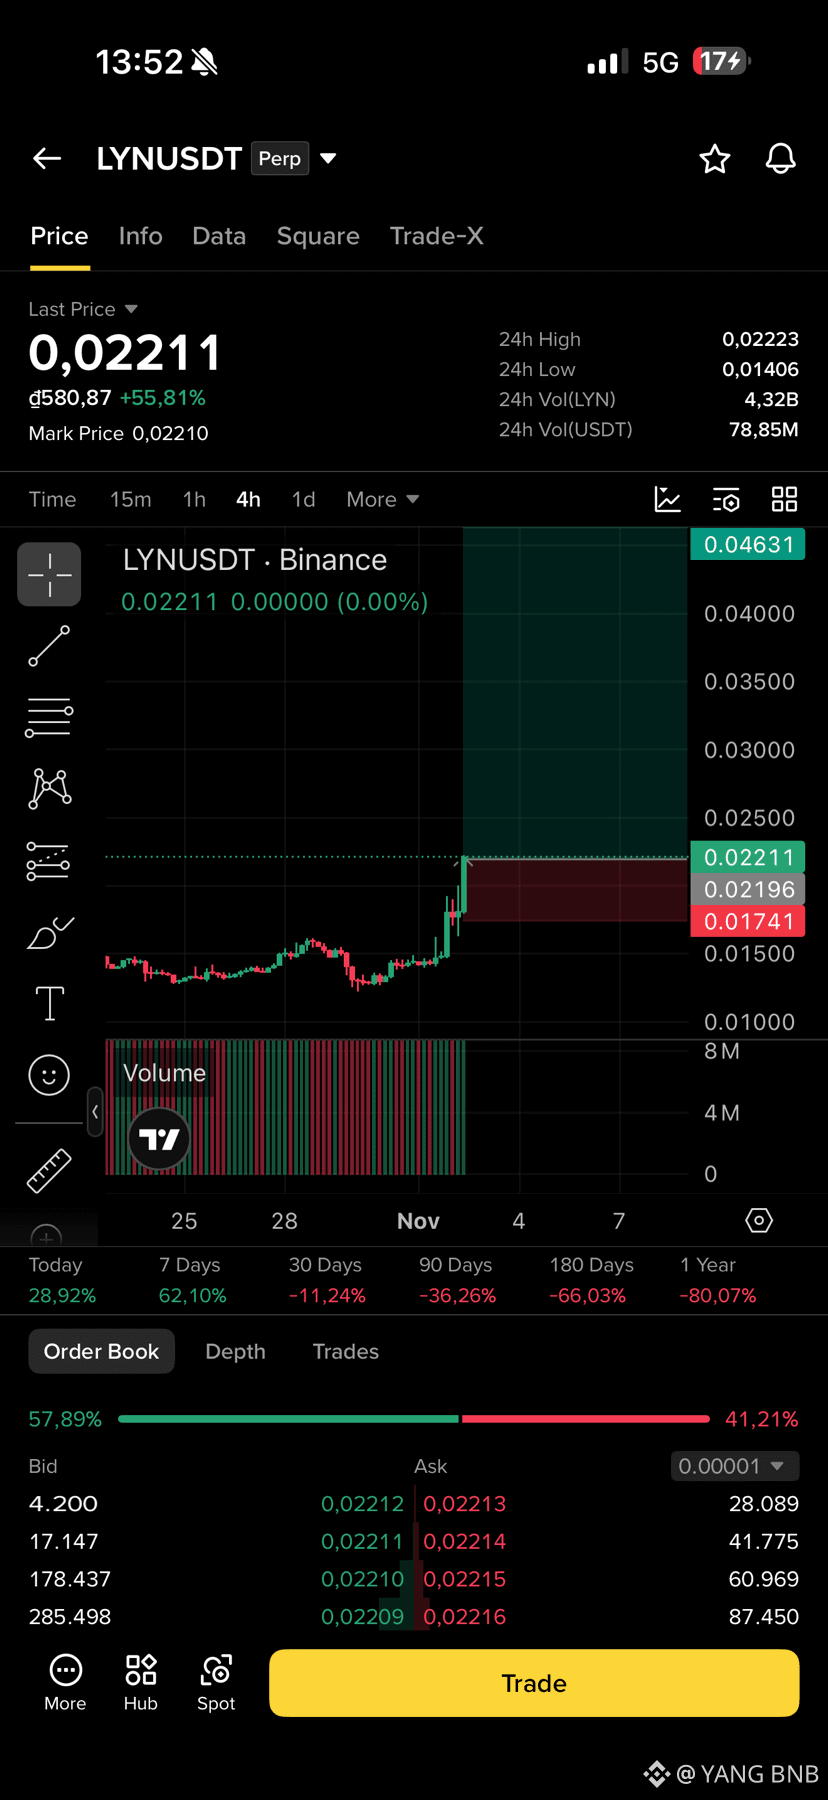
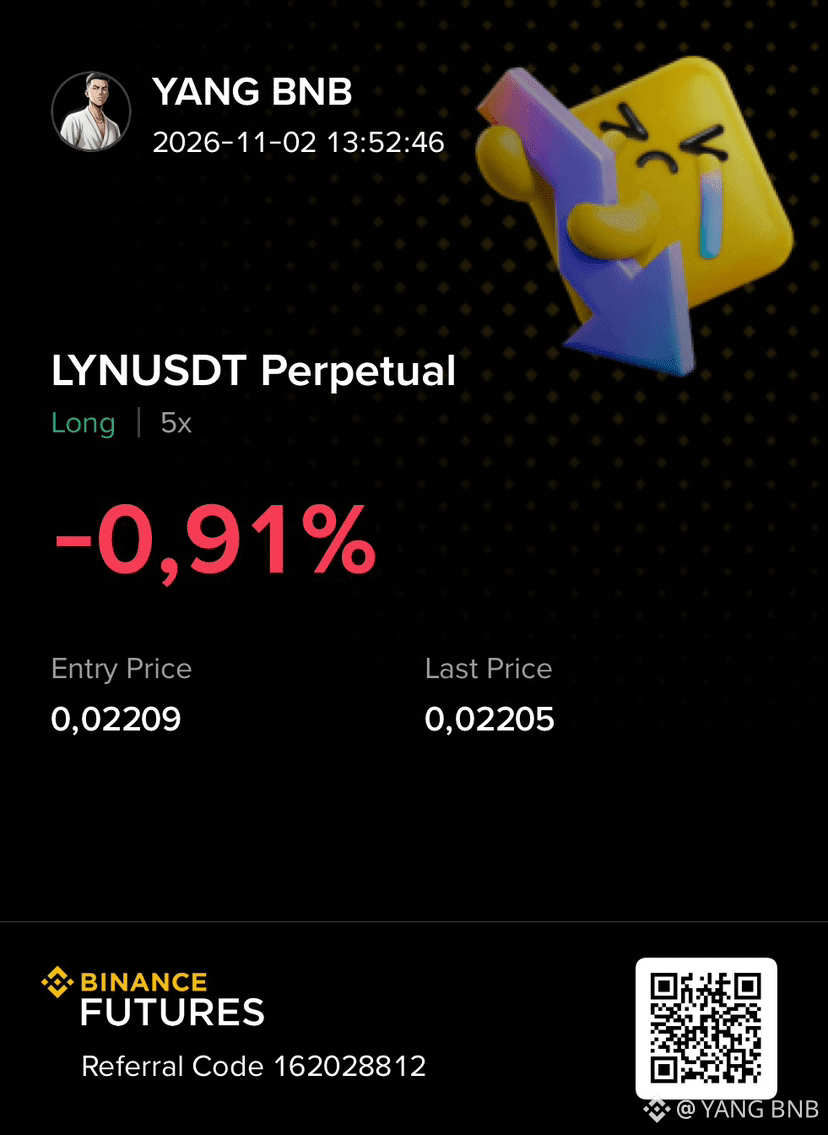
🔥 $LYN BIG LONG OPPORTUNITY :
LYN is showing strong bullish momentum after breaking out from its previous consolidation zone. The price is currently trading around 0.02211, gaining more than 55% in the last 24 hours. Buyers have taken control, pushing the price sharply higher with a significant increase in trading activity. The 4H chart shows a strong bullish breakout after an extended period of sideways movement. The price is now attempting to establish a new support zone around 0.02100–0.02200. If buying pressure remains strong and the price holds above this breakout area, further upside toward higher resistance levels could follow. 📈
Trading Ideas Long $LYNUSDT
Entry: 0.02150 – 0.02220
TP1: 0.03000
TP2: 0.03500
SL: 0.01741
TP3: 0.04631
Long $LYN 👇
{future}(LYNUSDT)
🔥 $LYN BIG LONG OPPORTUNITY :
LYN is showing strong bullish momentum after breaking out from its previous consolidation zone. The price is currently trading around 0.02211, gaining more than 55% in the last 24 hours. Buyers have taken control, pushing the price sharply higher with a significant increase in trading activity. The 4H chart shows a strong bullish breakout after an extended period of sideways movement. The price is now attempting to establish a new support zone around 0.02100–0.02200. If buying pressure remains strong and the price holds above this breakout area, further upside toward higher resistance levels could follow. 📈
Trading Ideas Long $LYNUSDT
Entry: 0.02150 – 0.02220
TP1: 0.03000
TP2: 0.03500
SL: 0.01741
TP3: 0.04631
Long $LYN 👇
LYN is showing strong bullish momentum after breaking out from its previous consolidation zone. The price is currently trading around 0.02211, gaining more than 55% in the last 24 hours. Buyers have taken control, pushing the price sharply higher with a significant increase in trading activity. The 4H chart shows a strong bullish breakout after an extended period of sideways movement. The price is now attempting to establish a new support zone around 0.02100–0.02200. If buying pressure remains strong and the price holds above this breakout area, further upside toward higher resistance levels could follow. 📈
Trading Ideas Long $LYNUSDT
Entry: 0.02150 – 0.02220
TP1: 0.03000
TP2: 0.03500
SL: 0.01741
TP3: 0.04631
Long $LYN 👇
357
·
--
Падение
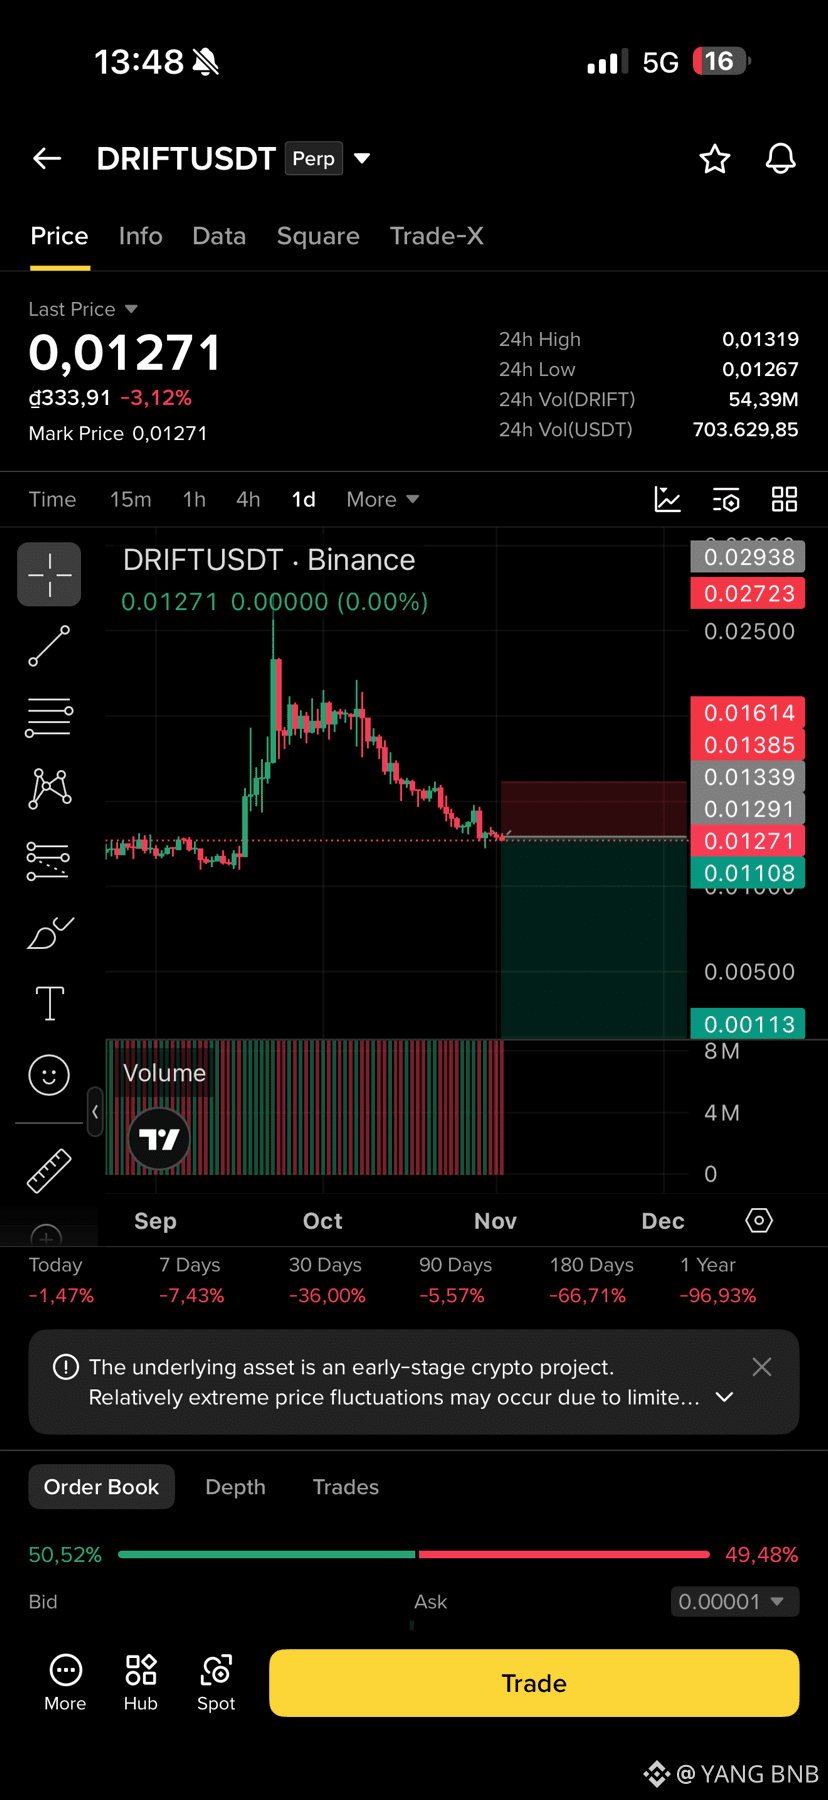
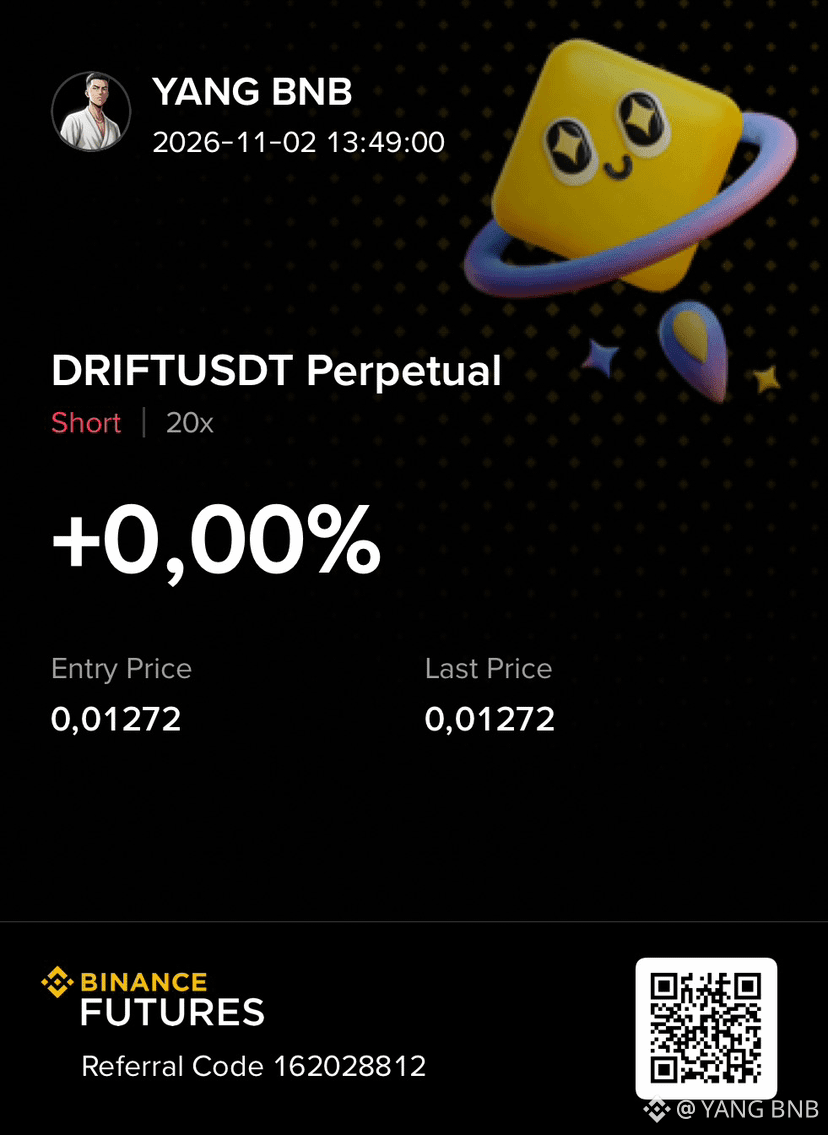
🔥 $DRIFT BIG SHORT OPPORTUNITY :
DRIFT is showing continued bearish momentum after experiencing a significant decline from its previous highs. The price is currently trading around 0.01271, down more than 3% in the last 24 hours. Sellers remain in control, with the daily chart showing a consistent pattern of lower highs and lower lows. After failing to maintain its previous support around 0.01600, the price has continued moving downward and is now approaching its recent lows. The overall market structure remains bearish, and if selling pressure continues, another breakdown toward lower support levels could follow. 📉
Trading Ideas Short $DRIFT
Entry: 0.01270 – 0.01340
TP1: 0.01108
TP2: 0.00800
SL: 0.01614
TP3: 0.00113
Shirt $DRIFT 👇
{future}(DRIFTUSDT)
🔥 $DRIFT BIG SHORT OPPORTUNITY :
DRIFT is showing continued bearish momentum after experiencing a significant decline from its previous highs. The price is currently trading around 0.01271, down more than 3% in the last 24 hours. Sellers remain in control, with the daily chart showing a consistent pattern of lower highs and lower lows. After failing to maintain its previous support around 0.01600, the price has continued moving downward and is now approaching its recent lows. The overall market structure remains bearish, and if selling pressure continues, another breakdown toward lower support levels could follow. 📉
Trading Ideas Short $DRIFT
Entry: 0.01270 – 0.01340
TP1: 0.01108
TP2: 0.00800
SL: 0.01614
TP3: 0.00113
Shirt $DRIFT 👇
DRIFT is showing continued bearish momentum after experiencing a significant decline from its previous highs. The price is currently trading around 0.01271, down more than 3% in the last 24 hours. Sellers remain in control, with the daily chart showing a consistent pattern of lower highs and lower lows. After failing to maintain its previous support around 0.01600, the price has continued moving downward and is now approaching its recent lows. The overall market structure remains bearish, and if selling pressure continues, another breakdown toward lower support levels could follow. 📉
Trading Ideas Short $DRIFT
Entry: 0.01270 – 0.01340
TP1: 0.01108
TP2: 0.00800
SL: 0.01614
TP3: 0.00113
Shirt $DRIFT 👇
222
·
--
Падение
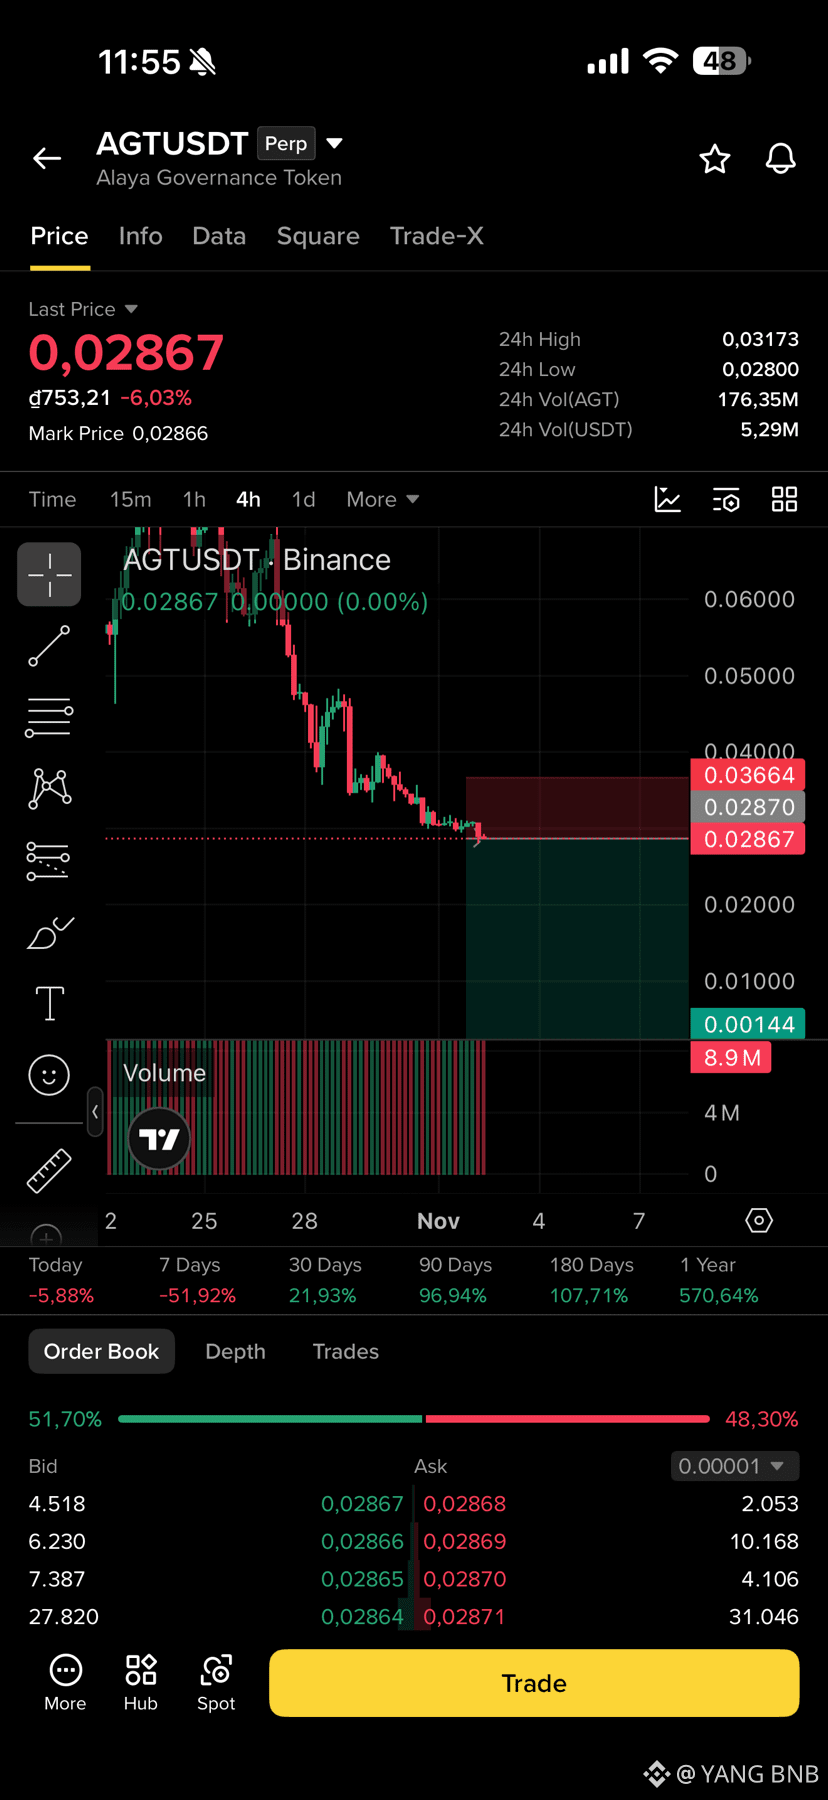
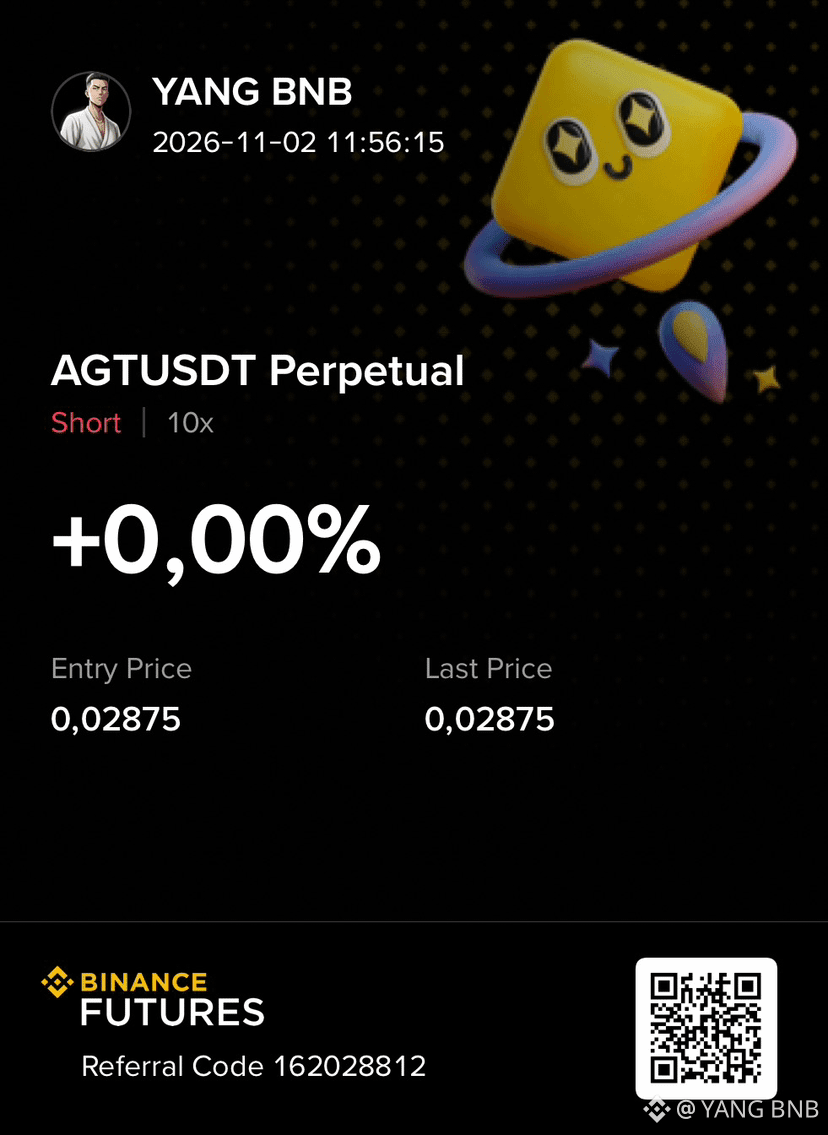
🔥 $AGT BIG SHORT OPPORTUNITY :
AGT is showing continued bearish momentum after experiencing a significant breakdown from its previous resistance zones. The price is currently trading around 0.02867, down more than 6% in the last 24 hours. Sellers remain firmly in control, pushing the price lower after repeated failures to recover above previous resistance levels. 📉
Trading Ideas Short $AGTUSDT
Entry: 0.02850 – 0.02950
TP1: 0.02500
TP2: 0.02000
SL: 0.03664
TP3: 0.00144
Short $AGT 👇
{future}(AGTUSDT)
🔥 $AGT BIG SHORT OPPORTUNITY :
AGT is showing continued bearish momentum after experiencing a significant breakdown from its previous resistance zones. The price is currently trading around 0.02867, down more than 6% in the last 24 hours. Sellers remain firmly in control, pushing the price lower after repeated failures to recover above previous resistance levels. 📉
Trading Ideas Short $AGTUSDT
Entry: 0.02850 – 0.02950
TP1: 0.02500
TP2: 0.02000
SL: 0.03664
TP3: 0.00144
Short $AGT 👇
AGT is showing continued bearish momentum after experiencing a significant breakdown from its previous resistance zones. The price is currently trading around 0.02867, down more than 6% in the last 24 hours. Sellers remain firmly in control, pushing the price lower after repeated failures to recover above previous resistance levels. 📉
Trading Ideas Short $AGTUSDT
Entry: 0.02850 – 0.02950
TP1: 0.02500
TP2: 0.02000
SL: 0.03664
TP3: 0.00144
Short $AGT 👇
271
·
--
Падение
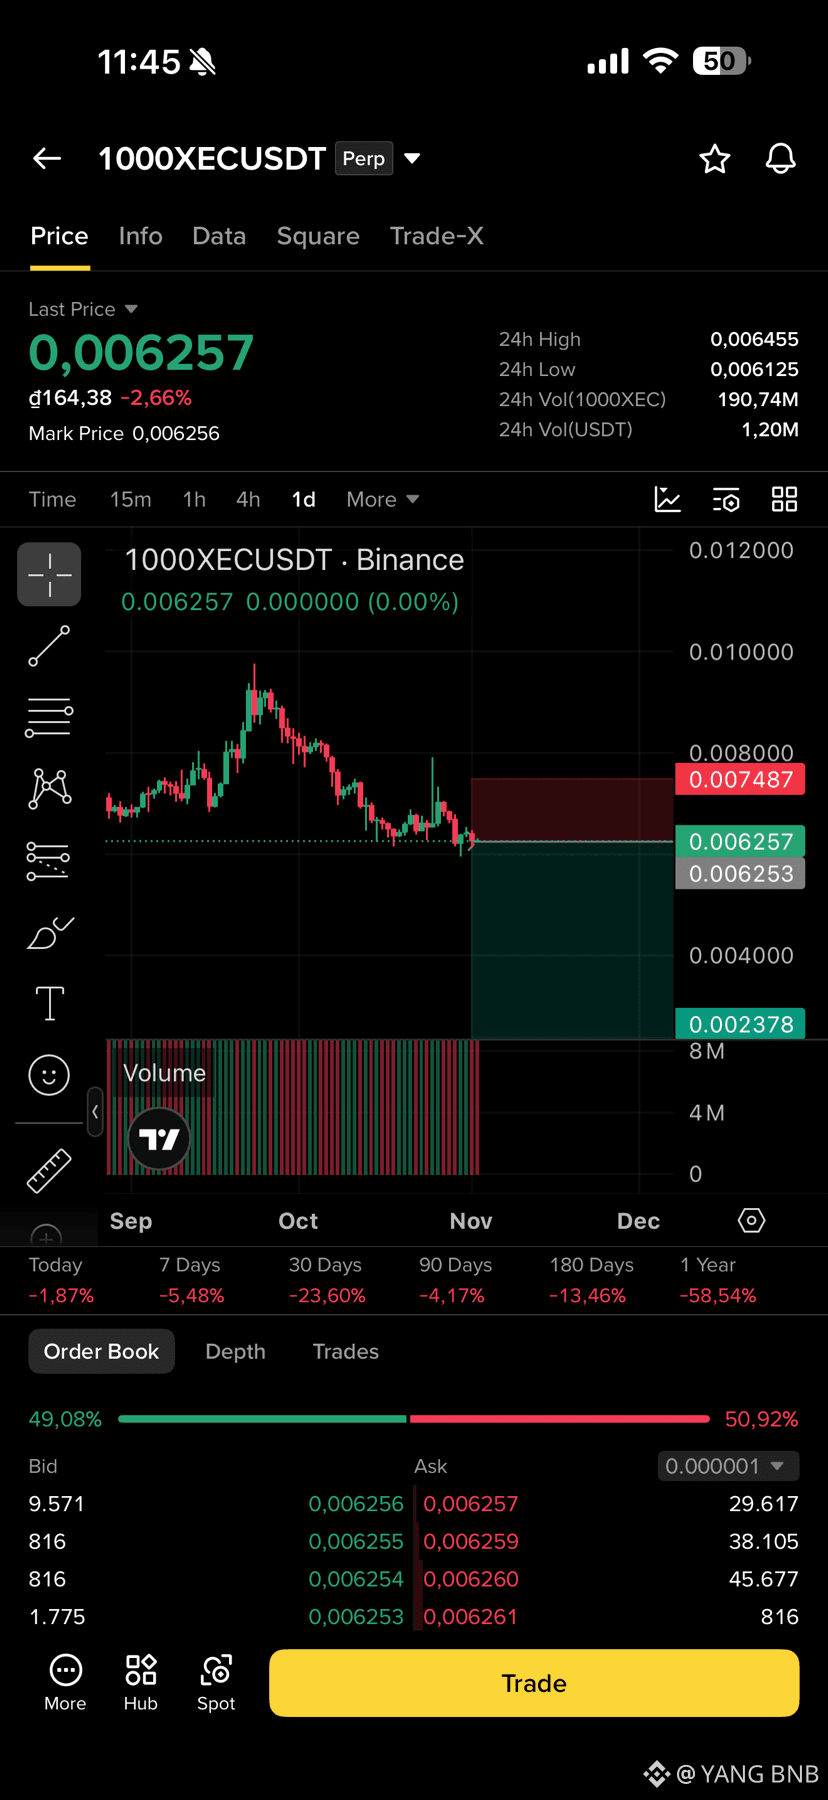
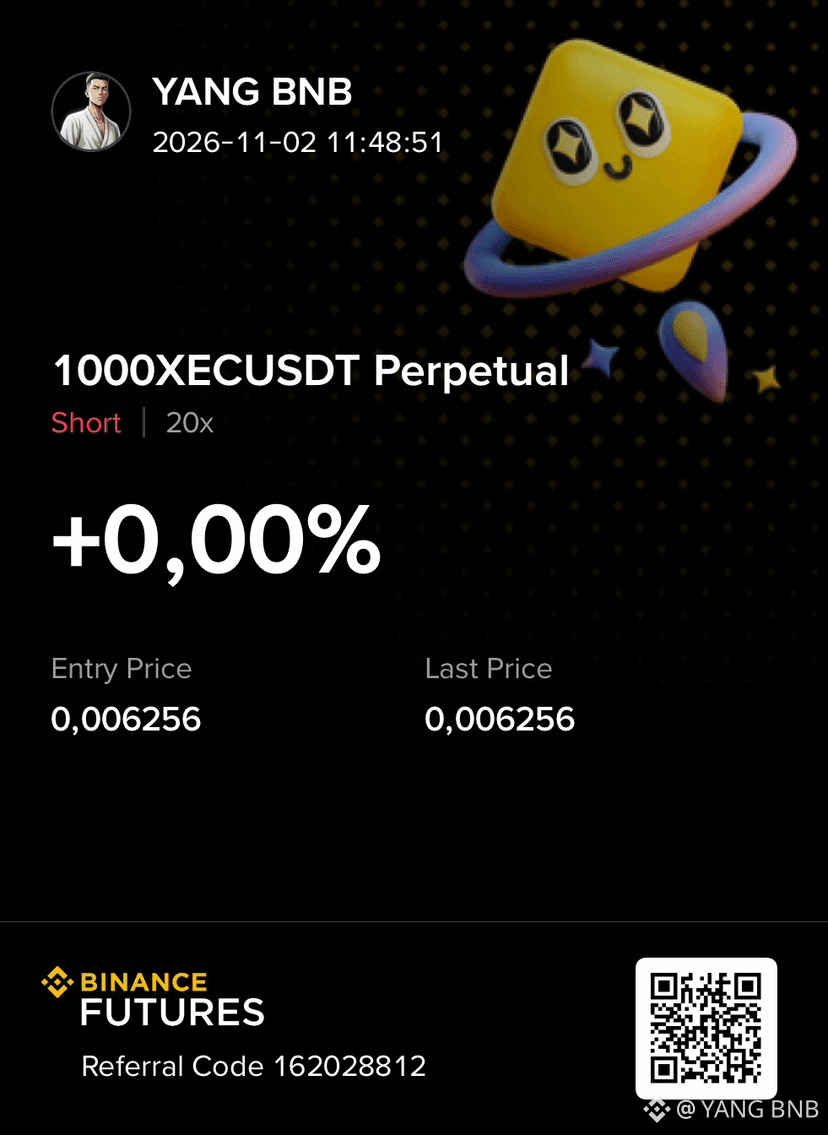
🔥 $1000XEC BIG SHORT OPPORTUNITY :
1000XEC is showing continued bearish momentum after facing repeated rejection from its previous resistance zones. The price is currently trading around 0.006257, with the daily chart showing a clear downward trend. Sellers are maintaining control, pushing the price toward its recent support levels after failing to recover above the 0.008000 resistance area. The overall market structure remains bearish, with lower highs and persistent selling pressure. If the current support zone breaks, further downside could follow as the price moves toward lower support levels. 📉
Trading Ideas Short $1000XECUSDT
Entry: 0.006250 – 0.006500
TP1: 0.005000
TP2: 0.004000
SL: 0.007487
TP3: 0.002378
Short $1000XEC 👇
{future}(1000XECUSDT)
🔥 $1000XEC BIG SHORT OPPORTUNITY :
1000XEC is showing continued bearish momentum after facing repeated rejection from its previous resistance zones. The price is currently trading around 0.006257, with the daily chart showing a clear downward trend. Sellers are maintaining control, pushing the price toward its recent support levels after failing to recover above the 0.008000 resistance area. The overall market structure remains bearish, with lower highs and persistent selling pressure. If the current support zone breaks, further downside could follow as the price moves toward lower support levels. 📉
Trading Ideas Short $1000XECUSDT
Entry: 0.006250 – 0.006500
TP1: 0.005000
TP2: 0.004000
SL: 0.007487
TP3: 0.002378
Short $1000XEC 👇
1000XEC is showing continued bearish momentum after facing repeated rejection from its previous resistance zones. The price is currently trading around 0.006257, with the daily chart showing a clear downward trend. Sellers are maintaining control, pushing the price toward its recent support levels after failing to recover above the 0.008000 resistance area. The overall market structure remains bearish, with lower highs and persistent selling pressure. If the current support zone breaks, further downside could follow as the price moves toward lower support levels. 📉
Trading Ideas Short $1000XECUSDT
Entry: 0.006250 – 0.006500
TP1: 0.005000
TP2: 0.004000
SL: 0.007487
TP3: 0.002378
Short $1000XEC 👇
221
·
--
Рост
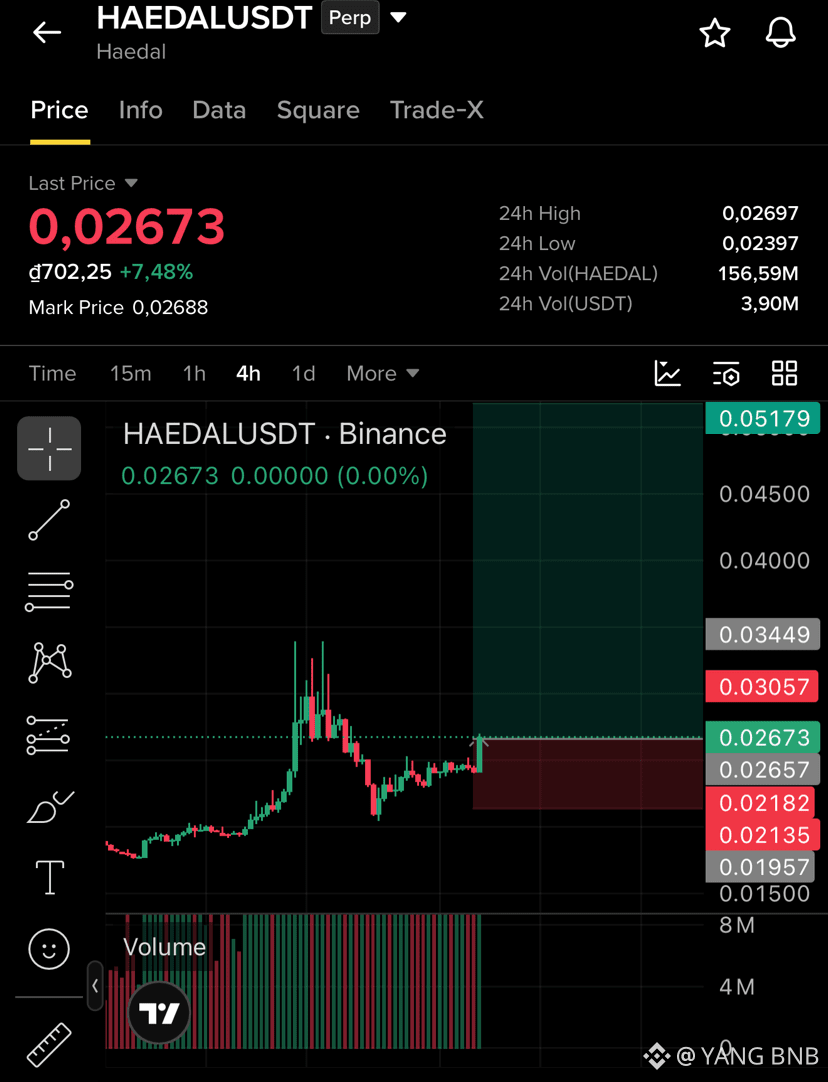
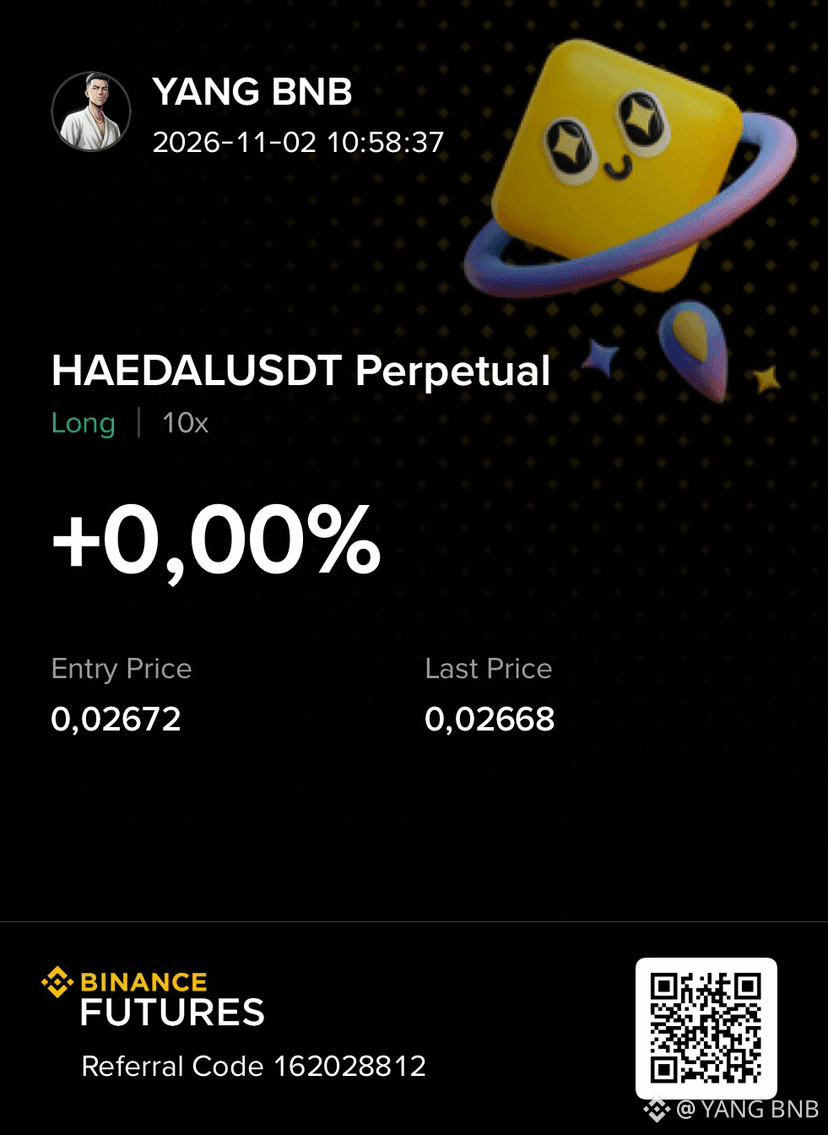
🔥 $HAEDAL BIG LONG OPPORTUNITY :
HAEDAL is showing signs of a potential bullish continuation after recovering strongly from its previous support zone. The price is currently trading around 0.02673, gaining more than 7% in the last 24 hours. Buyers are gradually regaining control after the recent correction, with the 4H chart showing signs of consolidation and renewed upward momentum.
Trading Ideas Long $HAEDALUSDT
Entry: 0.02650 – 0.02700
TP1: 0.03057
TP2: 0.03449
SL: 0.02182
TP3: 0.05179
Long $HAEDAL 👇
{future}(HAEDALUSDT)
🔥 $HAEDAL BIG LONG OPPORTUNITY :
HAEDAL is showing signs of a potential bullish continuation after recovering strongly from its previous support zone. The price is currently trading around 0.02673, gaining more than 7% in the last 24 hours. Buyers are gradually regaining control after the recent correction, with the 4H chart showing signs of consolidation and renewed upward momentum.
Trading Ideas Long $HAEDALUSDT
Entry: 0.02650 – 0.02700
TP1: 0.03057
TP2: 0.03449
SL: 0.02182
TP3: 0.05179
Long $HAEDAL 👇
HAEDAL is showing signs of a potential bullish continuation after recovering strongly from its previous support zone. The price is currently trading around 0.02673, gaining more than 7% in the last 24 hours. Buyers are gradually regaining control after the recent correction, with the 4H chart showing signs of consolidation and renewed upward momentum.
Trading Ideas Long $HAEDALUSDT
Entry: 0.02650 – 0.02700
TP1: 0.03057
TP2: 0.03449
SL: 0.02182
TP3: 0.05179
Long $HAEDAL 👇
386
Войдите, чтобы посмотреть больше материала
Присоединяйтесь к пользователям криптовалют по всему миру на Binance Square
⚡️ Получайте новейшую и полезную информацию о криптоактивах.
💬 Нам доверяет крупнейшая в мире криптобиржа.
👍 Получите достоверные аналитические данные от верифицированных создателей контента.
Эл. почта/номер телефона
В тренде
BinanceWithdrawalScamWarning
Просмотров: 57,800
743 обсуждают
Binance Warns Users of Withdrawal Scams as Services Resume: It Will Never Charge Fees, Sell Queue Spots or Ask You to Move Funds to a “Vault”
Binance News
·Лайков: 17
·Просмотров: 8.7k
USMidtermElections
Просмотров: 630,715
3,308 обсуждают
USOctoberNFP-AreRateCutsStillPossible
Просмотров: 62,356
593 обсуждают