

Top1Futures
3.8k Публикации

Top1Futures
Отправить жалобу
Заблокировать пользователя
Professional trader • Market Insights • Risk-managed trades • Retail access
Трейдер с регулярными сделками
3.8 г
128 подписок(и/а)
2.5K+ подписчиков(а)
10.4K+ понравилось
Посты
Все
Цитирования
Видео
Активно
·
--
Zcash is getting a new Wall Street bet — and $ZEC holders may want to watch this closely. 👀
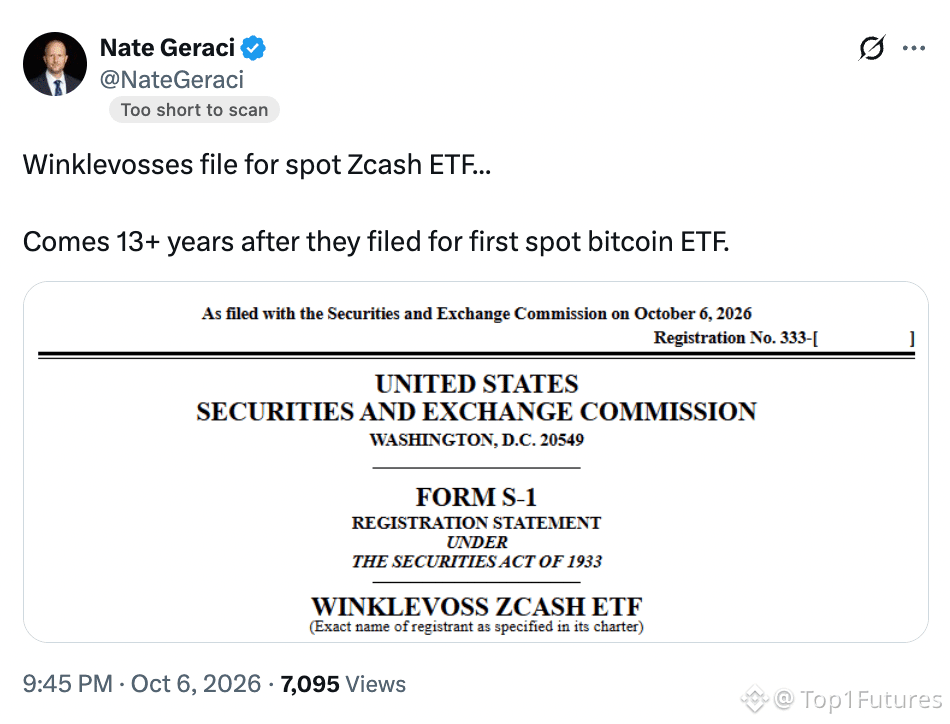
Cameron and Tyler Winklevoss have entered the growing U.S. Zcash ETF race with a proposed spot ETF that could trade on Nasdaq under the ticker WINK.
The idea is simple: investors could gain exposure to ZEC through a traditional brokerage account without directly buying or storing the cryptocurrency.
The proposed fund would charge a 0.25% annual fee, while Gemini Trust Company would reportedly act as the custodian for the ZEC held by the ETF.
But here’s where things get interesting.
Grayscale already has the first live U.S. spot Zcash ETF, ZCSH, and it has reportedly crossed $1 billion in assets under management. Bitwise has also filed for its own Zcash ETF.
So this is no longer just a single ETF story.
It’s becoming a competition for institutional ZEC demand.
ZEC has already gained more than 158% year-to-date, with price around $1,319 at the time of the report. That means expectations are already high — but another wave of ETF approvals, inflows, and institutional exposure could potentially extend the trend.
The risk? After such a huge rally, profit-taking could create sharp pullbacks.
But if ETF competition keeps growing, could ZEC be preparing for another institutional-driven move higher? 🚀
Zcash is getting a new Wall Street bet — and $ZEC holders may want to watch this closely. 👀
Cameron and Tyler Winklevoss have entered the growing U.S. Zcash ETF race with a proposed spot ETF that could trade on Nasdaq under the ticker WINK.
The idea is simple: investors could gain exposure to ZEC through a traditional brokerage account without directly buying or storing the cryptocurrency.
The proposed fund would charge a 0.25% annual fee, while Gemini Trust Company would reportedly act as the custodian for the ZEC held by the ETF.
But here’s where things get interesting.
Grayscale already has the first live U.S. spot Zcash ETF, ZCSH, and it has reportedly crossed $1 billion in assets under management. Bitwise has also filed for its own Zcash ETF.
So this is no longer just a single ETF story.
It’s becoming a competition for institutional ZEC demand.
ZEC has already gained more than 158% year-to-date, with price around $1,319 at the time of the report. That means expectations are already high — but another wave of ETF approvals, inflows, and institutional exposure could potentially extend the trend.
The risk? After such a huge rally, profit-taking could create sharp pullbacks.
But if ETF competition keeps growing, could ZEC be preparing for another institutional-driven move higher? 🚀
Cameron and Tyler Winklevoss have entered the growing U.S. Zcash ETF race with a proposed spot ETF that could trade on Nasdaq under the ticker WINK.
The idea is simple: investors could gain exposure to ZEC through a traditional brokerage account without directly buying or storing the cryptocurrency.
The proposed fund would charge a 0.25% annual fee, while Gemini Trust Company would reportedly act as the custodian for the ZEC held by the ETF.
But here’s where things get interesting.
Grayscale already has the first live U.S. spot Zcash ETF, ZCSH, and it has reportedly crossed $1 billion in assets under management. Bitwise has also filed for its own Zcash ETF.
So this is no longer just a single ETF story.
It’s becoming a competition for institutional ZEC demand.
ZEC has already gained more than 158% year-to-date, with price around $1,319 at the time of the report. That means expectations are already high — but another wave of ETF approvals, inflows, and institutional exposure could potentially extend the trend.
The risk? After such a huge rally, profit-taking could create sharp pullbacks.
But if ETF competition keeps growing, could ZEC be preparing for another institutional-driven move higher? 🚀
1
45
·
--
$SOL could be entering a completely different kind of cycle. 👀
This isn’t another #ETF headline or whale buying story.
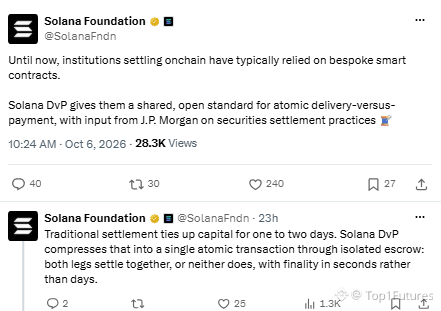
JPMorgan is reportedly involved in Solana’s new DvP settlement system — where both sides of a trade can settle on-chain in seconds instead of potentially taking 1–2 days.
That changes the question:
“Who is buying SOL?”
to
“Who is actually USING Solana?”
And that’s where things get interesting. 🧠
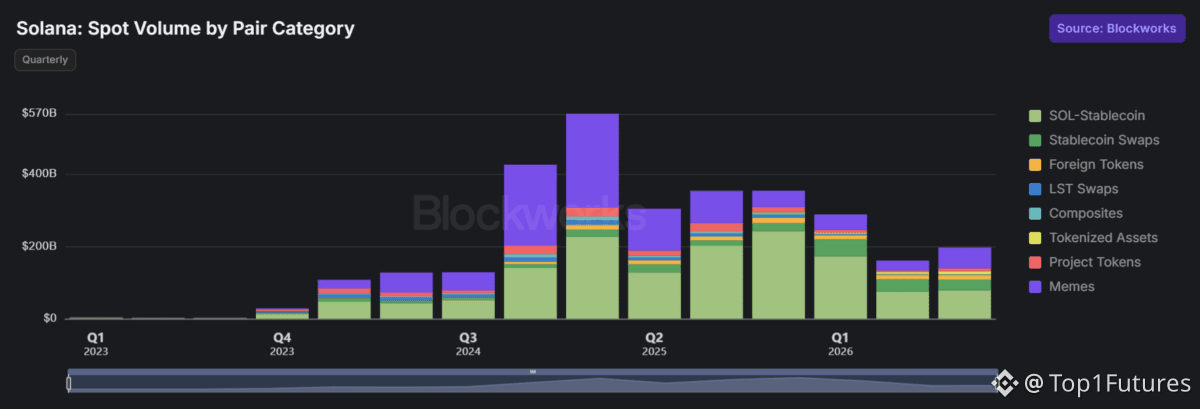
Solana’s tokenized-asset spot volume reportedly exploded from just $33M to around $8B — while memecoin volume fell from nearly $260B to $57B.
That’s a massive shift from speculation toward real-world utility.
Circle also minted another $750M USDC on Solana, adding more liquidity to the network.
Now imagine DvP adoption accelerates while tokenized assets keep growing.
SOL wouldn’t just be a crypto asset institutions hold.
It could increasingly become infrastructure they USE.
For traders, the key is whether this narrative starts translating into sustained liquidity and price strength — not just a short-lived hype pump.
If Solana really becomes a settlement layer for TradFi, are we looking at the beginning of SOL’s biggest institutional cycle yet? 🚀
$SOL could be entering a completely different kind of cycle. 👀
This isn’t another #ETF headline or whale buying story.
JPMorgan is reportedly involved in Solana’s new DvP settlement system — where both sides of a trade can settle on-chain in seconds instead of potentially taking 1–2 days.
That changes the question:
“Who is buying SOL?”
to
“Who is actually USING Solana?”
And that’s where things get interesting. 🧠
Solana’s tokenized-asset spot volume reportedly exploded from just $33M to around $8B — while memecoin volume fell from nearly $260B to $57B.
That’s a massive shift from speculation toward real-world utility.
Circle also minted another $750M USDC on Solana, adding more liquidity to the network.
Now imagine DvP adoption accelerates while tokenized assets keep growing.
SOL wouldn’t just be a crypto asset institutions hold.
It could increasingly become infrastructure they USE.
For traders, the key is whether this narrative starts translating into sustained liquidity and price strength — not just a short-lived hype pump.
If Solana really becomes a settlement layer for TradFi, are we looking at the beginning of SOL’s biggest institutional cycle yet? 🚀
This isn’t another #ETF headline or whale buying story.
JPMorgan is reportedly involved in Solana’s new DvP settlement system — where both sides of a trade can settle on-chain in seconds instead of potentially taking 1–2 days.
That changes the question:
“Who is buying SOL?”
to
“Who is actually USING Solana?”
And that’s where things get interesting. 🧠
Solana’s tokenized-asset spot volume reportedly exploded from just $33M to around $8B — while memecoin volume fell from nearly $260B to $57B.
That’s a massive shift from speculation toward real-world utility.
Circle also minted another $750M USDC on Solana, adding more liquidity to the network.
Now imagine DvP adoption accelerates while tokenized assets keep growing.
SOL wouldn’t just be a crypto asset institutions hold.
It could increasingly become infrastructure they USE.
For traders, the key is whether this narrative starts translating into sustained liquidity and price strength — not just a short-lived hype pump.
If Solana really becomes a settlement layer for TradFi, are we looking at the beginning of SOL’s biggest institutional cycle yet? 🚀
1
139
·
--
$MON lust dropped 13%… but something VERY interesting is happening underneath the sell-off ‼️👀
While price is bleeding, spot investors have accumulated roughly $10.46M worth of MON since September 6.
That’s the information gap traders need to watch.
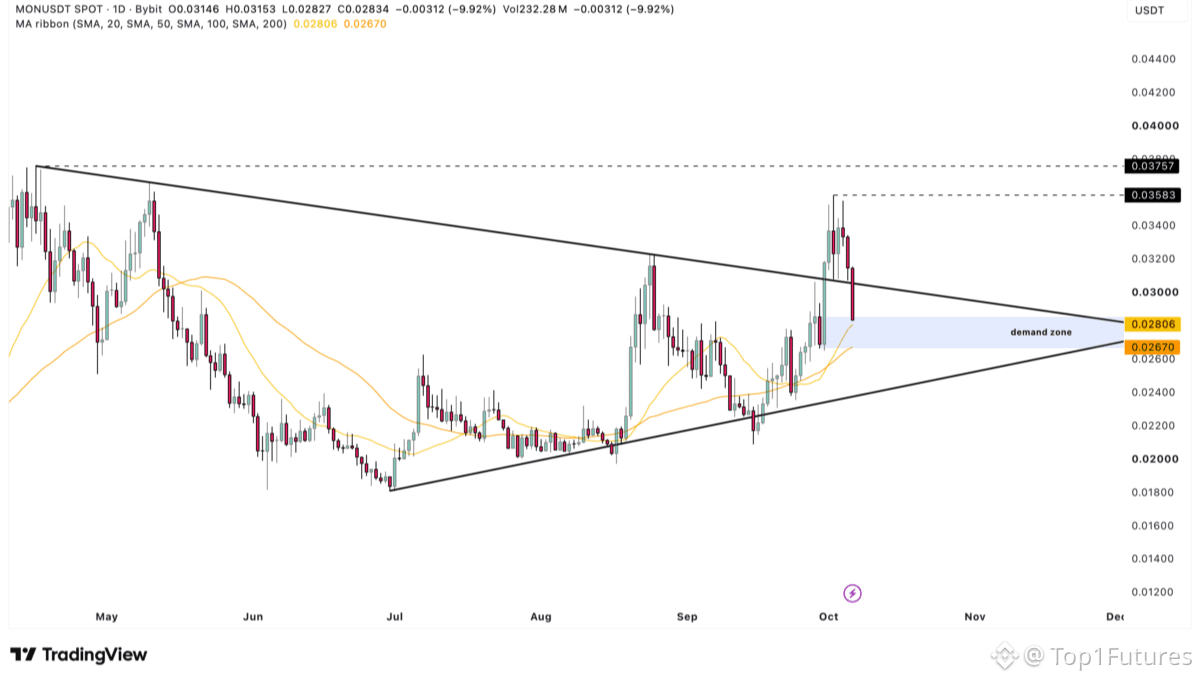
MON is now sitting inside a demand zone — an area where buyers previously stepped in aggressively. Spot netflow is also negative at around -$1.21M, suggesting coins are leaving exchanges.
If this zone holds, MON could attempt a recovery toward $0.035, with $0.037 as the next upside test.
But don’t get comfortable yet.
Momentum indicators still show short-term weakness, and another dip into the demand zone remains possible before any real reversal.
So the setup is simple:
Demand holds → recovery attempt.
Demand fails → deeper downside risk.
The real question: are these buyers smart-money accumulators catching the bottom… or are they buying too early? 👀
$MON lust dropped 13%… but something VERY interesting is happening underneath the sell-off ‼️👀
While price is bleeding, spot investors have accumulated roughly $10.46M worth of MON since September 6.
That’s the information gap traders need to watch.
MON is now sitting inside a demand zone — an area where buyers previously stepped in aggressively. Spot netflow is also negative at around -$1.21M, suggesting coins are leaving exchanges.
If this zone holds, MON could attempt a recovery toward $0.035, with $0.037 as the next upside test.
But don’t get comfortable yet.
Momentum indicators still show short-term weakness, and another dip into the demand zone remains possible before any real reversal.
So the setup is simple:
Demand holds → recovery attempt.
Demand fails → deeper downside risk.
The real question: are these buyers smart-money accumulators catching the bottom… or are they buying too early? 👀
While price is bleeding, spot investors have accumulated roughly $10.46M worth of MON since September 6.
That’s the information gap traders need to watch.
MON is now sitting inside a demand zone — an area where buyers previously stepped in aggressively. Spot netflow is also negative at around -$1.21M, suggesting coins are leaving exchanges.
If this zone holds, MON could attempt a recovery toward $0.035, with $0.037 as the next upside test.
But don’t get comfortable yet.
Momentum indicators still show short-term weakness, and another dip into the demand zone remains possible before any real reversal.
So the setup is simple:
Demand holds → recovery attempt.
Demand fails → deeper downside risk.
The real question: are these buyers smart-money accumulators catching the bottom… or are they buying too early? 👀
1
66
·
--
$ZRO just made a comeback… but $2.20 could decide whether this rally gets MUCH bigger 👀🔥
LayerZero jumped 11.5% to $2.19, while Spot volume surged 45%.
The interesting part? $1.03M flowed OUT of exchanges. That suggests traders are holding instead of rushing to sell.
Protocol fees also doubled from $147K → $301K in 30 days. Real usage is growing.
But there’s a problem traders can’t ignore…
A $50M token unlock is coming in ~2 weeks. That fresh supply could create serious profit-taking.
For now:
$2 = key support
$2.20 = breakout trigger
$2.50+ = possible next target
$1.70 = danger zone if momentum fails
If ZRO decisively flips $2.20, traders may start chasing the move.
But will the $50M unlock kill the rally… or will demand absorb it? 👀
$ZRO just made a comeback… but $2.20 could decide whether this rally gets MUCH bigger 👀🔥
LayerZero jumped 11.5% to $2.19, while Spot volume surged 45%.
The interesting part? $1.03M flowed OUT of exchanges. That suggests traders are holding instead of rushing to sell.
Protocol fees also doubled from $147K → $301K in 30 days. Real usage is growing.
But there’s a problem traders can’t ignore…
A $50M token unlock is coming in ~2 weeks. That fresh supply could create serious profit-taking.
For now:
$2 = key support
$2.20 = breakout trigger
$2.50+ = possible next target
$1.70 = danger zone if momentum fails
If ZRO decisively flips $2.20, traders may start chasing the move.
But will the $50M unlock kill the rally… or will demand absorb it? 👀
LayerZero jumped 11.5% to $2.19, while Spot volume surged 45%.
The interesting part? $1.03M flowed OUT of exchanges. That suggests traders are holding instead of rushing to sell.
Protocol fees also doubled from $147K → $301K in 30 days. Real usage is growing.
But there’s a problem traders can’t ignore…
A $50M token unlock is coming in ~2 weeks. That fresh supply could create serious profit-taking.
For now:
$2 = key support
$2.20 = breakout trigger
$2.50+ = possible next target
$1.70 = danger zone if momentum fails
If ZRO decisively flips $2.20, traders may start chasing the move.
But will the $50M unlock kill the rally… or will demand absorb it? 👀
1
89
·
--
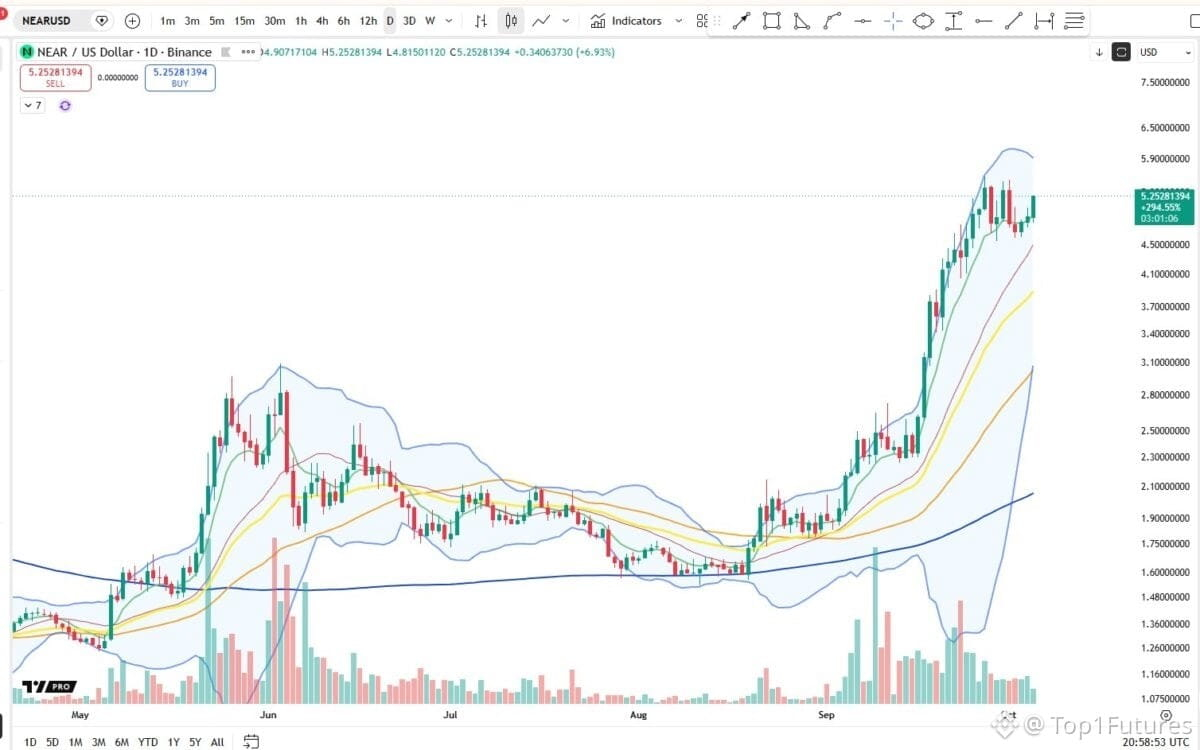
ℹ️ $NEAR is getting the AI spotlight… but the real move may be hiding behind one price level 👀
Grayscale just highlighted NEAR for “agentic commerce” — AI agents that could transact, pay, and interact across chains.
And September? NEAR exploded 183%. 🔥
Now traders are watching $5.39–$5.44.
A clean breakout could open $5.56 → $6.00.
But here’s the catch: hype alone won’t sustain this move. NEAR needs real AI-agent activity and healthy user retention, especially with MyNearWallet shutting down.
$5.13 is the key support. Lose it, and $4.70 could come back into play.
So the question is simple: will NEAR turn the AI narrative into real network demand — or is $6 just another liquidity target? 👀
ℹ️ $NEAR is getting the AI spotlight… but the real move may be hiding behind one price level 👀
Grayscale just highlighted NEAR for “agentic commerce” — AI agents that could transact, pay, and interact across chains.
And September? NEAR exploded 183%. 🔥
Now traders are watching $5.39–$5.44.
A clean breakout could open $5.56 → $6.00.
But here’s the catch: hype alone won’t sustain this move. NEAR needs real AI-agent activity and healthy user retention, especially with MyNearWallet shutting down.
$5.13 is the key support. Lose it, and $4.70 could come back into play.
So the question is simple: will NEAR turn the AI narrative into real network demand — or is $6 just another liquidity target? 👀
Grayscale just highlighted NEAR for “agentic commerce” — AI agents that could transact, pay, and interact across chains.
And September? NEAR exploded 183%. 🔥
Now traders are watching $5.39–$5.44.
A clean breakout could open $5.56 → $6.00.
But here’s the catch: hype alone won’t sustain this move. NEAR needs real AI-agent activity and healthy user retention, especially with MyNearWallet shutting down.
$5.13 is the key support. Lose it, and $4.70 could come back into play.
So the question is simple: will NEAR turn the AI narrative into real network demand — or is $6 just another liquidity target? 👀
1
95
·
--
$VIRTUAL just jumped 11%… but something underneath this rally is making traders nervous.
VIRTUAL — THE 11% RALLY HIDES A BIG WARNING
$49.2M flowed into perps. Funding turned positive. Open Interest exploded 25% to $133M.
Translation? Traders are aggressively positioning for more upside.
But here’s the twist…
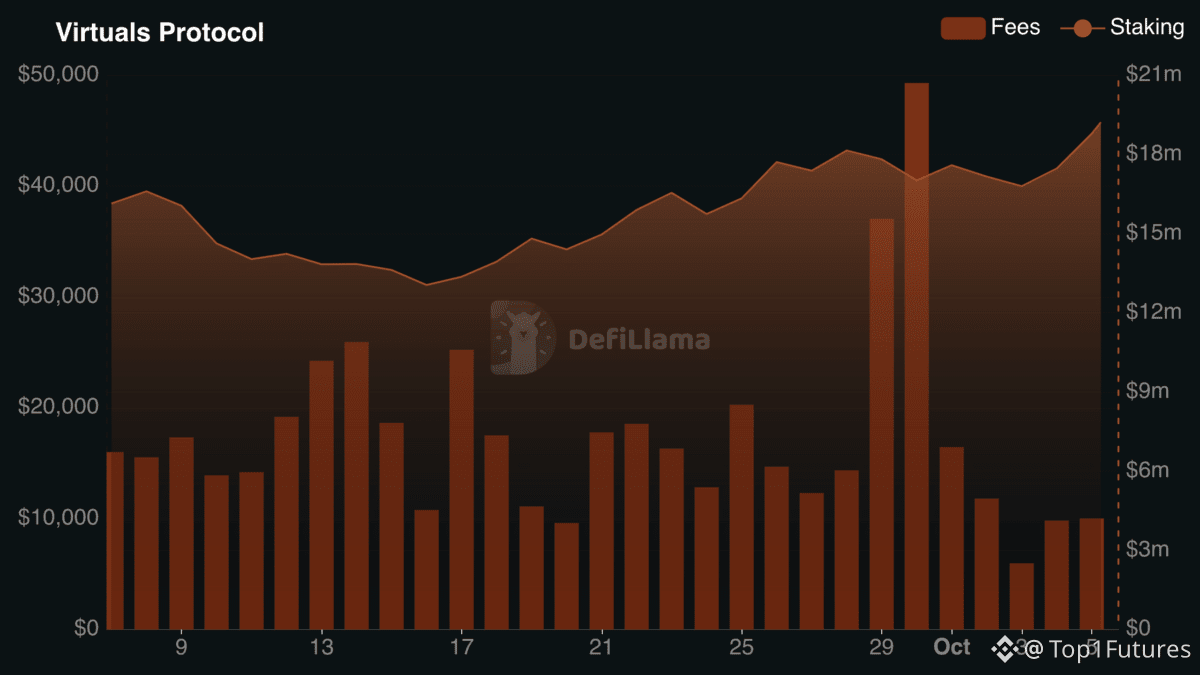
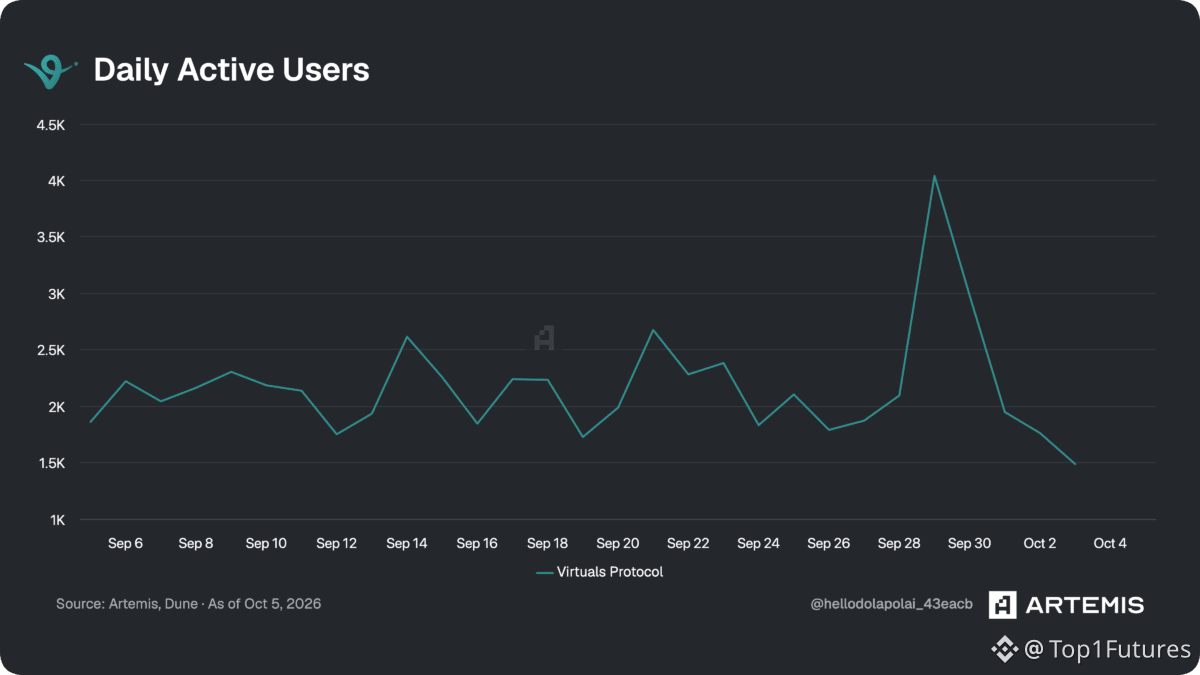
Daily users collapsed from 4,000 → 1,500. Revenue crashed from $45.4K → just $3.8K.
That’s a dangerous divergence: price and leverage rising while real usage falls.
If momentum holds, VIRTUAL could extend the rally. But if leveraged longs start unwinding, the move can reverse fast.
The real question isn’t “Can VIRTUAL pump?”
It’s: Who gets trapped if users don’t come back?
$VIRTUAL just jumped 11%… but something underneath this rally is making traders nervous.
VIRTUAL — THE 11% RALLY HIDES A BIG WARNING
$49.2M flowed into perps. Funding turned positive. Open Interest exploded 25% to $133M.
Translation? Traders are aggressively positioning for more upside.
But here’s the twist…
Daily users collapsed from 4,000 → 1,500. Revenue crashed from $45.4K → just $3.8K.
That’s a dangerous divergence: price and leverage rising while real usage falls.
If momentum holds, VIRTUAL could extend the rally. But if leveraged longs start unwinding, the move can reverse fast.
The real question isn’t “Can VIRTUAL pump?”
It’s: Who gets trapped if users don’t come back?
VIRTUAL — THE 11% RALLY HIDES A BIG WARNING
$49.2M flowed into perps. Funding turned positive. Open Interest exploded 25% to $133M.
Translation? Traders are aggressively positioning for more upside.
But here’s the twist…
Daily users collapsed from 4,000 → 1,500. Revenue crashed from $45.4K → just $3.8K.
That’s a dangerous divergence: price and leverage rising while real usage falls.
If momentum holds, VIRTUAL could extend the rally. But if leveraged longs start unwinding, the move can reverse fast.
The real question isn’t “Can VIRTUAL pump?”
It’s: Who gets trapped if users don’t come back?
1
110
·
--
ADA just jumped 10%… but the real fuel might be the traders still betting against it. 👀🔥
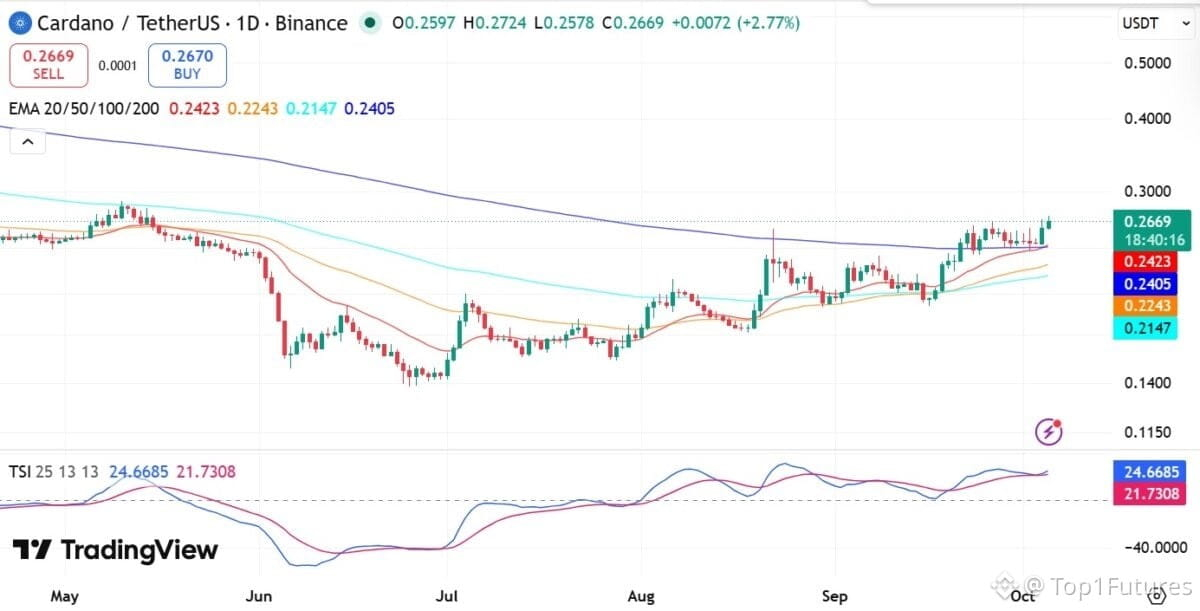
$ADA pushed from $0.24 to a 5-month high near $0.27, while spot volume exploded 297%. Then $2.1M in #ADA shorts got liquidated.
But here’s the twist: traders are still heavily positioned bearish. Open Interest jumped 18% to $635M, while the Long/Short Ratio fell to 0.71.
So what happens if ADA keeps climbing?
More shorts could be forced to close, adding fresh buying pressure and potentially pushing ADA through $0.28 toward $0.30.
But $0.24 is the line traders can’t ignore. Lose it, and the setup could weaken toward $0.22.
The squeeze setup is there…
Will ADA trigger another wave of short liquidations and break $0.30❓👀
ADA just jumped 10%… but the real fuel might be the traders still betting against it. 👀🔥
$ADA pushed from $0.24 to a 5-month high near $0.27, while spot volume exploded 297%. Then $2.1M in #ADA shorts got liquidated.
But here’s the twist: traders are still heavily positioned bearish. Open Interest jumped 18% to $635M, while the Long/Short Ratio fell to 0.71.
So what happens if ADA keeps climbing?
More shorts could be forced to close, adding fresh buying pressure and potentially pushing ADA through $0.28 toward $0.30.
But $0.24 is the line traders can’t ignore. Lose it, and the setup could weaken toward $0.22.
The squeeze setup is there…
Will ADA trigger another wave of short liquidations and break $0.30❓👀
$ADA pushed from $0.24 to a 5-month high near $0.27, while spot volume exploded 297%. Then $2.1M in #ADA shorts got liquidated.
But here’s the twist: traders are still heavily positioned bearish. Open Interest jumped 18% to $635M, while the Long/Short Ratio fell to 0.71.
So what happens if ADA keeps climbing?
More shorts could be forced to close, adding fresh buying pressure and potentially pushing ADA through $0.28 toward $0.30.
But $0.24 is the line traders can’t ignore. Lose it, and the setup could weaken toward $0.22.
The squeeze setup is there…
Will ADA trigger another wave of short liquidations and break $0.30❓👀
1
6
·
--
$SHIB just entered Solana… right when the memecoin market is heating up. 👀🔥
#ShibaInu is now live on Solana, giving SHIB access to a much larger DeFi ecosystem and deeper liquidity. And the timing is interesting: Solana processed roughly $190B in DEX volume during Q3, while Pump.fun remains a major driver of memecoin activity.
But there’s a problem traders can’t ignore…
More than 88T SHIB were sitting on exchanges, with net inflows above 288B SHIB. That means plenty of supply could still hit the market.
So the real battle is simple: can new Solana demand absorb that selling pressure?
SHIB is consolidating around $0.000005 after gaining more than 37% in Q3. If demand strengthens and this level holds, the next phase of the memecoin cycle could give SHIB another push higher.
But if exchange supply keeps rising, the Solana narrative may not be enough.
Q4 is just getting started…
Could SHIB’s Solana expansion be the catalyst that ignites the next memecoin cycle? 👀
$SHIB just entered Solana… right when the memecoin market is heating up. 👀🔥
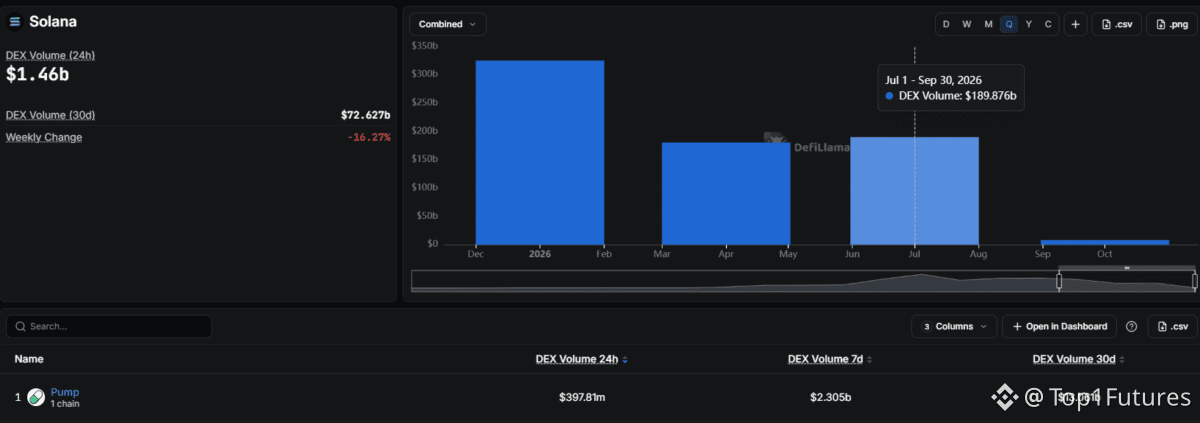
#ShibaInu is now live on Solana, giving SHIB access to a much larger DeFi ecosystem and deeper liquidity. And the timing is interesting: Solana processed roughly $190B in DEX volume during Q3, while Pump.fun remains a major driver of memecoin activity.
But there’s a problem traders can’t ignore…
More than 88T SHIB were sitting on exchanges, with net inflows above 288B SHIB. That means plenty of supply could still hit the market.
So the real battle is simple: can new Solana demand absorb that selling pressure?
SHIB is consolidating around $0.000005 after gaining more than 37% in Q3. If demand strengthens and this level holds, the next phase of the memecoin cycle could give SHIB another push higher.
But if exchange supply keeps rising, the Solana narrative may not be enough.
Q4 is just getting started…
Could SHIB’s Solana expansion be the catalyst that ignites the next memecoin cycle? 👀
#ShibaInu is now live on Solana, giving SHIB access to a much larger DeFi ecosystem and deeper liquidity. And the timing is interesting: Solana processed roughly $190B in DEX volume during Q3, while Pump.fun remains a major driver of memecoin activity.
But there’s a problem traders can’t ignore…
More than 88T SHIB were sitting on exchanges, with net inflows above 288B SHIB. That means plenty of supply could still hit the market.
So the real battle is simple: can new Solana demand absorb that selling pressure?
SHIB is consolidating around $0.000005 after gaining more than 37% in Q3. If demand strengthens and this level holds, the next phase of the memecoin cycle could give SHIB another push higher.
But if exchange supply keeps rising, the Solana narrative may not be enough.
Q4 is just getting started…
Could SHIB’s Solana expansion be the catalyst that ignites the next memecoin cycle? 👀
1
81
·
--
$PUMP is quietly becoming a serious contender… and the numbers are getting hard to ignore. 👀
#pump just generated $55.5M in 30-day revenue, beating Hyperliquid’s $54.34M. Even crazier? Daily volume has exploded from around $5M in July to $40M+ now.
Then whales stepped in.
One wallet bought 383M PUMP worth $2.4M, while another withdrew 189M from MEXC — reducing exchange supply.
More activity + fewer tokens available could create a powerful setup.
But here’s the catch: if volume fades or whales start depositing again, the momentum could disappear fast.
Is PUMP entering its next major expansion… or is this peak hype? 👀🔥
$PUMP is quietly becoming a serious contender… and the numbers are getting hard to ignore. 👀
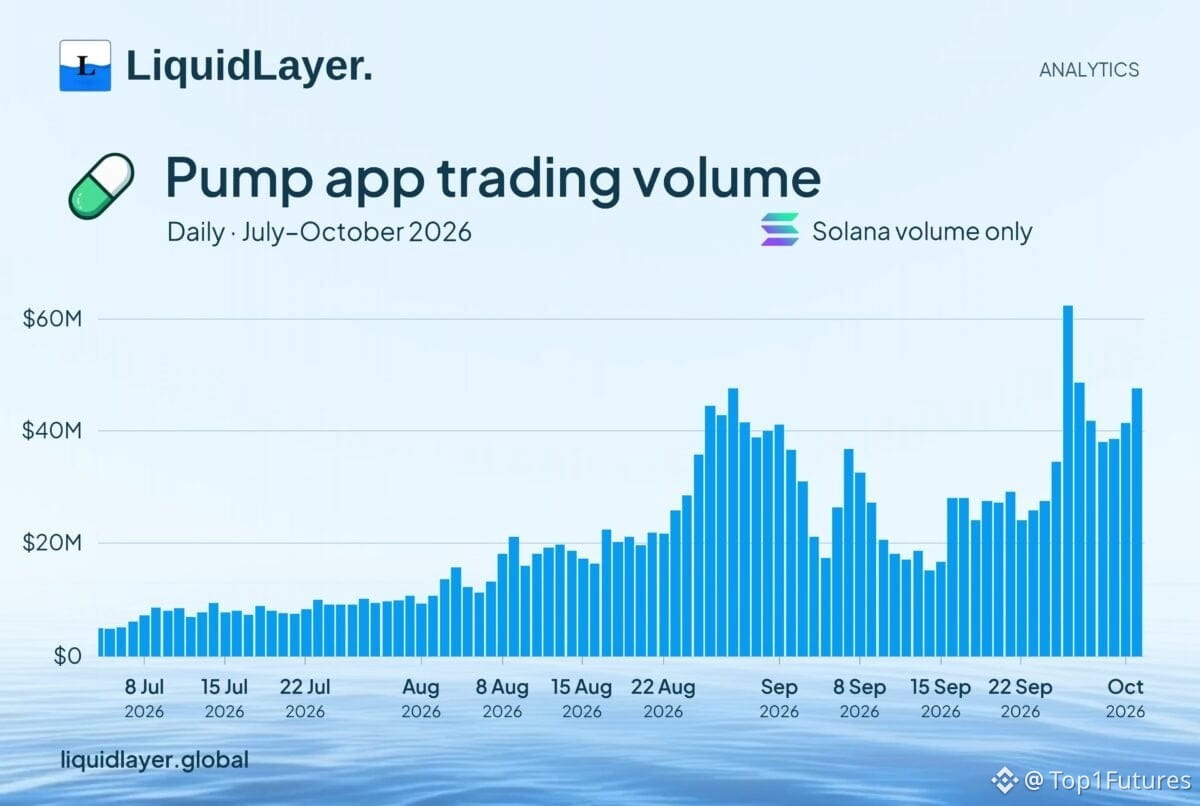
#pump just generated $55.5M in 30-day revenue, beating Hyperliquid’s $54.34M. Even crazier? Daily volume has exploded from around $5M in July to $40M+ now.
Then whales stepped in.
One wallet bought 383M PUMP worth $2.4M, while another withdrew 189M from MEXC — reducing exchange supply.
More activity + fewer tokens available could create a powerful setup.
But here’s the catch: if volume fades or whales start depositing again, the momentum could disappear fast.
Is PUMP entering its next major expansion… or is this peak hype? 👀🔥
#pump just generated $55.5M in 30-day revenue, beating Hyperliquid’s $54.34M. Even crazier? Daily volume has exploded from around $5M in July to $40M+ now.
Then whales stepped in.
One wallet bought 383M PUMP worth $2.4M, while another withdrew 189M from MEXC — reducing exchange supply.
More activity + fewer tokens available could create a powerful setup.
But here’s the catch: if volume fades or whales start depositing again, the momentum could disappear fast.
Is PUMP entering its next major expansion… or is this peak hype? 👀🔥

1
70
·
--
$LINK just hit a level that could decide the next move. 👀
Chainlink is holding $13.58 — but the interesting part is what’s happening underneath.
Exchange reserves are near multi-year lows at ~124.3M LINK. That means there’s less supply sitting on exchanges ready to be sold.
Now watch the trap:
$13.80 = immediate control
$14.15–$14.60 = breakout zone
$14.40 = major liquidity magnet 🎯
$15.60 = bigger upside target
If LINK clears $14.40 with momentum, short liquidations could accelerate the move toward $15.60.
But lose $13.58, and the setup weakens fast, with $12.80–$13.00 coming into focus.
The real question isn’t “Can LINK pump?”
It’s: Will $13.80 hold long enough for the $14.40 liquidity to get hunted? 👀
$LINK just hit a level that could decide the next move. 👀
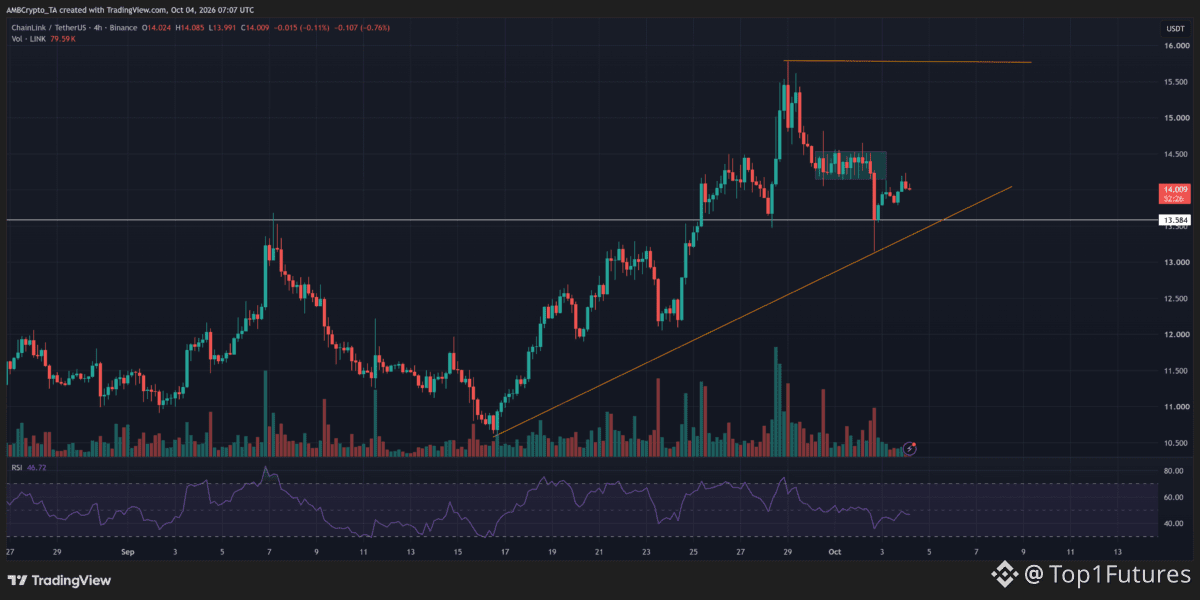
Chainlink is holding $13.58 — but the interesting part is what’s happening underneath.
Exchange reserves are near multi-year lows at ~124.3M LINK. That means there’s less supply sitting on exchanges ready to be sold.
Now watch the trap:
$13.80 = immediate control
$14.15–$14.60 = breakout zone
$14.40 = major liquidity magnet 🎯
$15.60 = bigger upside target
If LINK clears $14.40 with momentum, short liquidations could accelerate the move toward $15.60.
But lose $13.58, and the setup weakens fast, with $12.80–$13.00 coming into focus.
The real question isn’t “Can LINK pump?”
It’s: Will $13.80 hold long enough for the $14.40 liquidity to get hunted? 👀
Chainlink is holding $13.58 — but the interesting part is what’s happening underneath.
Exchange reserves are near multi-year lows at ~124.3M LINK. That means there’s less supply sitting on exchanges ready to be sold.
Now watch the trap:
$13.80 = immediate control
$14.15–$14.60 = breakout zone
$14.40 = major liquidity magnet 🎯
$15.60 = bigger upside target
If LINK clears $14.40 with momentum, short liquidations could accelerate the move toward $15.60.
But lose $13.58, and the setup weakens fast, with $12.80–$13.00 coming into focus.
The real question isn’t “Can LINK pump?”
It’s: Will $13.80 hold long enough for the $14.40 liquidity to get hunted? 👀
1
51
·
--
Рост
$NEAR 🟢 just had its strongest month ever… but October could decide whether this is a real trend or just another fakeout. ‼️👀
September delivered a massive 178% rally, taking $NEAR from $1.92 to $5.57. Now it has pulled back toward $4.50–$4.69 — the zone traders need to watch closely.🔍
Why? Because ETF demand is adding fuel. Bitwise’s NRR ETF has already pulled in nearly $58M, creating fresh spot demand.
“Hold $4.50… then what?”
If NEAR protects this breakout zone, $6.40 becomes the key resistance. A clean break there could open the path toward $8.30 and eventually $10.
But lose $4.50, and the breakout starts looking much less convincing.
So the real question isn’t whether NEAR can reach $10…
Can buyers defend the level that makes $10 possible? 🔥
$NEAR 🟢 just had its strongest month ever… but October could decide whether this is a real trend or just another fakeout. ‼️👀
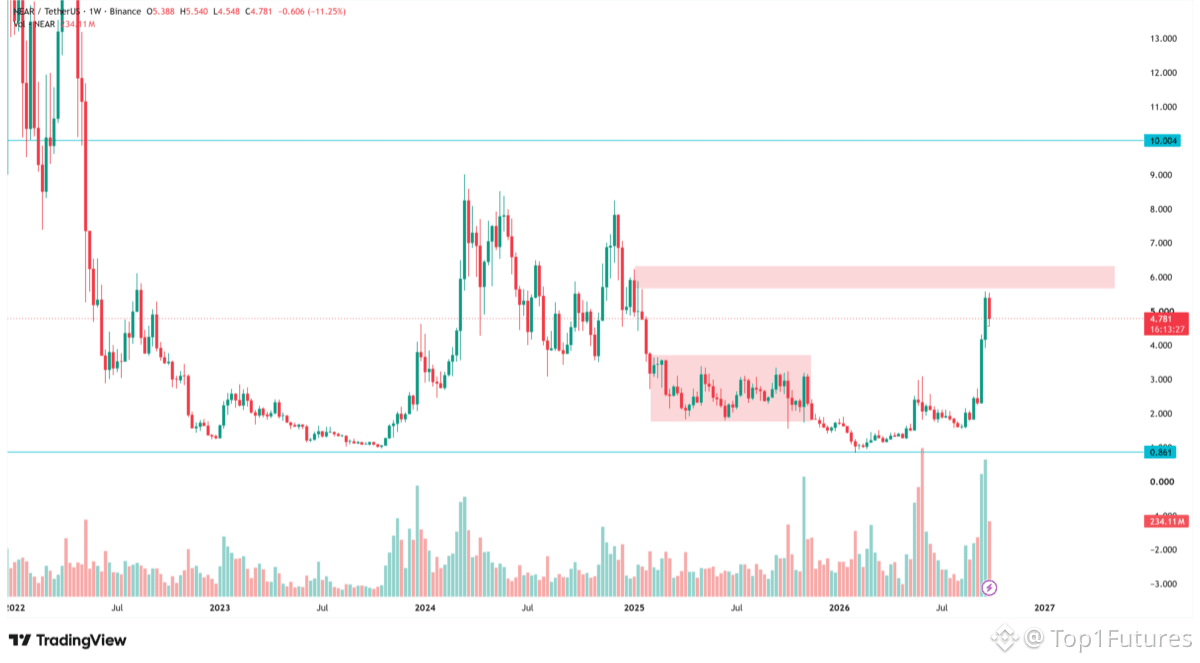
September delivered a massive 178% rally, taking $NEAR from $1.92 to $5.57. Now it has pulled back toward $4.50–$4.69 — the zone traders need to watch closely.🔍
Why? Because ETF demand is adding fuel. Bitwise’s NRR ETF has already pulled in nearly $58M, creating fresh spot demand.
“Hold $4.50… then what?”
If NEAR protects this breakout zone, $6.40 becomes the key resistance. A clean break there could open the path toward $8.30 and eventually $10.
But lose $4.50, and the breakout starts looking much less convincing.
So the real question isn’t whether NEAR can reach $10…
Can buyers defend the level that makes $10 possible? 🔥
September delivered a massive 178% rally, taking $NEAR from $1.92 to $5.57. Now it has pulled back toward $4.50–$4.69 — the zone traders need to watch closely.🔍
Why? Because ETF demand is adding fuel. Bitwise’s NRR ETF has already pulled in nearly $58M, creating fresh spot demand.
“Hold $4.50… then what?”
If NEAR protects this breakout zone, $6.40 becomes the key resistance. A clean break there could open the path toward $8.30 and eventually $10.
But lose $4.50, and the breakout starts looking much less convincing.
So the real question isn’t whether NEAR can reach $10…
Can buyers defend the level that makes $10 possible? 🔥
1
87
·
--
Рост
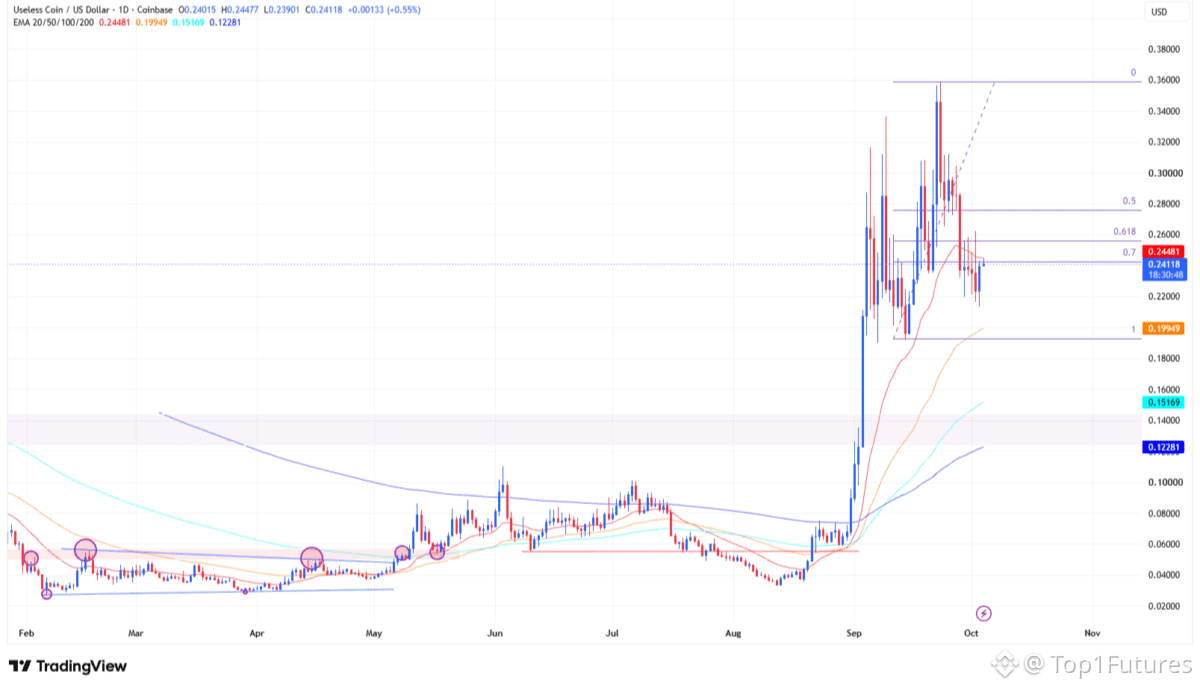
After bouncing from the Fibonacci golden zone, $USELESS is up 10% in 24H.⬆️‼️
Now the interesting part: social activity + Funding Rates are both surging, showing growing trader confidence.
🎯 $0.36 holds a ~$331K liquidity cluster...
If momentum stays strong, that zone could be the next magnet. But a rejection there could expose the bounce.
Will $USELESS break $0.36… or get trapped below it? 🔥
After bouncing from the Fibonacci golden zone, $USELESS is up 10% in 24H.⬆️‼️
Now the interesting part: social activity + Funding Rates are both surging, showing growing trader confidence.
🎯 $0.36 holds a ~$331K liquidity cluster...
If momentum stays strong, that zone could be the next magnet. But a rejection there could expose the bounce.
Will $USELESS break $0.36… or get trapped below it? 🔥
Now the interesting part: social activity + Funding Rates are both surging, showing growing trader confidence.
🎯 $0.36 holds a ~$331K liquidity cluster...
If momentum stays strong, that zone could be the next magnet. But a rejection there could expose the bounce.
Will $USELESS break $0.36… or get trapped below it? 🔥
1
118
·
--
📈 Ondo’s tokenized-asset story is getting bigger — but the real opportunity may be what happens next.
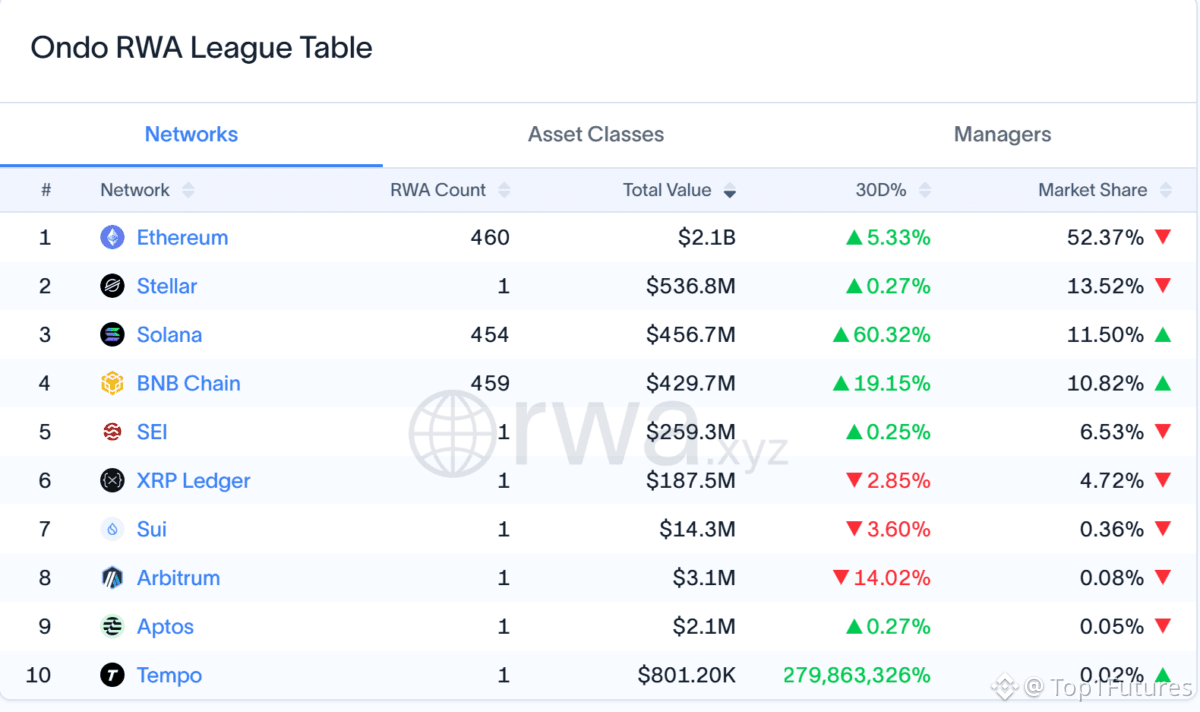
Ondo now has around $3.89B in tokenized assets, and the money is no longer concentrated mainly on Ethereum.
Ethereum still holds about $2.1B, or 52.37% of the total. But Solana is quickly gaining ground, with tokenized assets above $456.7M after growing more than 60% in 30 days. BNB Chain has also climbed to roughly $429.7M.
That shift matters.
Why?
Because tokenized assets are starting to move from simply “existing on-chain” to actually being used.
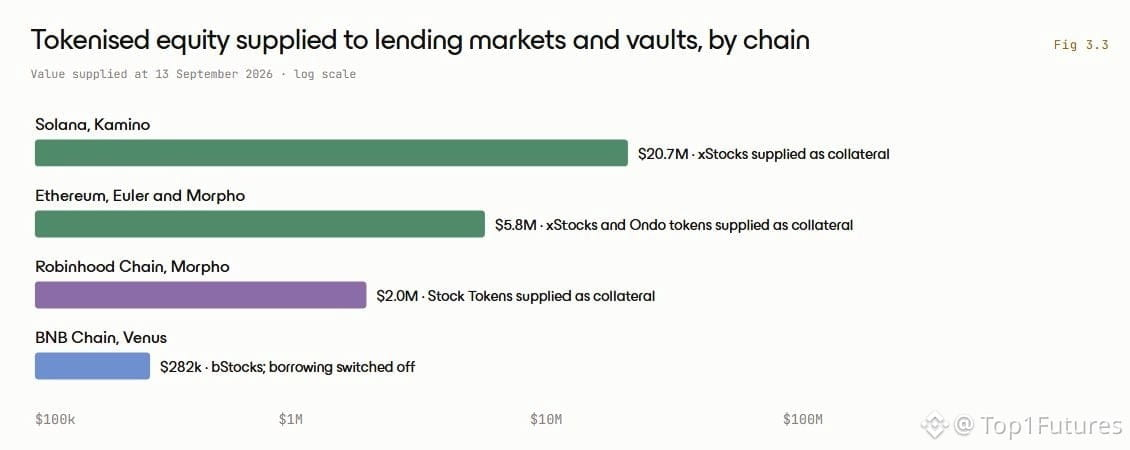
On Solana, more than $20.7M worth of tokenized stocks is already being used as collateral through Kamino. Ethereum currently has around $5.8M through Euler and Morpho.
For beginners, think of it like this: instead of selling a tokenized stock to get cash, users can potentially borrow against it while keeping their investment.
That could be the next major growth phase.
If lending demand continues rising, Ondo’s tokenized assets could become more useful across multiple chains rather than just representing ownership.
The key signal to watch is simple: Will collateral deposits and borrowing keep increasing without triggering heavy liquidations?
If they do, tokenized equities could evolve from a niche RWA narrative into a genuine on-chain credit market.
Ondo’s $3.89B base is already impressive.
But what if this liquidity starts working harder across every major chain? 👀
📈 Ondo’s tokenized-asset story is getting bigger — but the real opportunity may be what happens next.
Ondo now has around $3.89B in tokenized assets, and the money is no longer concentrated mainly on Ethereum.
Ethereum still holds about $2.1B, or 52.37% of the total. But Solana is quickly gaining ground, with tokenized assets above $456.7M after growing more than 60% in 30 days. BNB Chain has also climbed to roughly $429.7M.
That shift matters.
Why?
Because tokenized assets are starting to move from simply “existing on-chain” to actually being used.
On Solana, more than $20.7M worth of tokenized stocks is already being used as collateral through Kamino. Ethereum currently has around $5.8M through Euler and Morpho.
For beginners, think of it like this: instead of selling a tokenized stock to get cash, users can potentially borrow against it while keeping their investment.
That could be the next major growth phase.
If lending demand continues rising, Ondo’s tokenized assets could become more useful across multiple chains rather than just representing ownership.
The key signal to watch is simple: Will collateral deposits and borrowing keep increasing without triggering heavy liquidations?
If they do, tokenized equities could evolve from a niche RWA narrative into a genuine on-chain credit market.
Ondo’s $3.89B base is already impressive.
But what if this liquidity starts working harder across every major chain? 👀
Ondo now has around $3.89B in tokenized assets, and the money is no longer concentrated mainly on Ethereum.
Ethereum still holds about $2.1B, or 52.37% of the total. But Solana is quickly gaining ground, with tokenized assets above $456.7M after growing more than 60% in 30 days. BNB Chain has also climbed to roughly $429.7M.
That shift matters.
Why?
Because tokenized assets are starting to move from simply “existing on-chain” to actually being used.
On Solana, more than $20.7M worth of tokenized stocks is already being used as collateral through Kamino. Ethereum currently has around $5.8M through Euler and Morpho.
For beginners, think of it like this: instead of selling a tokenized stock to get cash, users can potentially borrow against it while keeping their investment.
That could be the next major growth phase.
If lending demand continues rising, Ondo’s tokenized assets could become more useful across multiple chains rather than just representing ownership.
The key signal to watch is simple: Will collateral deposits and borrowing keep increasing without triggering heavy liquidations?
If they do, tokenized equities could evolve from a niche RWA narrative into a genuine on-chain credit market.
Ondo’s $3.89B base is already impressive.
But what if this liquidity starts working harder across every major chain? 👀
1
74
·
--
🚀$AAVE just hit a level that could decide its next big move.
AAVE pushed to ~$188, then pulled back toward $180.51. Sounds bearish? Not necessarily.
Here’s the part traders are watching 👀
The old breakout zone around $176 is now the real test. If AAVE keeps holding above it, the message is simple: buyers are defending the breakout instead of giving back the move.
And the bigger picture gets even more interesting.
AAVE has climbed from around $111 since September, while RSI sits near 68 — strong momentum, but not yet in extreme territory.
Now add the fundamental fuel: Aave’s cumulative deposits have surged to nearly $3.8 TRILLION, showing how much the lending ecosystem has expanded.
There’s also a proposed foundation structure to manage Aave’s core intellectual property, potentially giving the protocol a clearer legal framework.
So the setup is pretty clean:
$176 = key support
$188 = breakout trigger
$156–158 = downside zone if $176 fails
If $176 holds and $188 breaks with momentum, a fresh leg higher becomes realistic.
But if $176 cracks, the entire breakout could turn into a trap.
The real question: is AAVE preparing for another breakout… or quietly setting up a deeper retest? 👀
🚀$AAVE just hit a level that could decide its next big move.
AAVE pushed to ~$188, then pulled back toward $180.51. Sounds bearish? Not necessarily.
Here’s the part traders are watching 👀
The old breakout zone around $176 is now the real test. If AAVE keeps holding above it, the message is simple: buyers are defending the breakout instead of giving back the move.
And the bigger picture gets even more interesting.
AAVE has climbed from around $111 since September, while RSI sits near 68 — strong momentum, but not yet in extreme territory.
Now add the fundamental fuel: Aave’s cumulative deposits have surged to nearly $3.8 TRILLION, showing how much the lending ecosystem has expanded.
There’s also a proposed foundation structure to manage Aave’s core intellectual property, potentially giving the protocol a clearer legal framework.
So the setup is pretty clean:
$176 = key support
$188 = breakout trigger
$156–158 = downside zone if $176 fails
If $176 holds and $188 breaks with momentum, a fresh leg higher becomes realistic.
But if $176 cracks, the entire breakout could turn into a trap.
The real question: is AAVE preparing for another breakout… or quietly setting up a deeper retest? 👀
AAVE pushed to ~$188, then pulled back toward $180.51. Sounds bearish? Not necessarily.
Here’s the part traders are watching 👀
The old breakout zone around $176 is now the real test. If AAVE keeps holding above it, the message is simple: buyers are defending the breakout instead of giving back the move.
And the bigger picture gets even more interesting.
AAVE has climbed from around $111 since September, while RSI sits near 68 — strong momentum, but not yet in extreme territory.
Now add the fundamental fuel: Aave’s cumulative deposits have surged to nearly $3.8 TRILLION, showing how much the lending ecosystem has expanded.
There’s also a proposed foundation structure to manage Aave’s core intellectual property, potentially giving the protocol a clearer legal framework.
So the setup is pretty clean:
$176 = key support
$188 = breakout trigger
$156–158 = downside zone if $176 fails
If $176 holds and $188 breaks with momentum, a fresh leg higher becomes realistic.
But if $176 cracks, the entire breakout could turn into a trap.
The real question: is AAVE preparing for another breakout… or quietly setting up a deeper retest? 👀
1
106
·
--
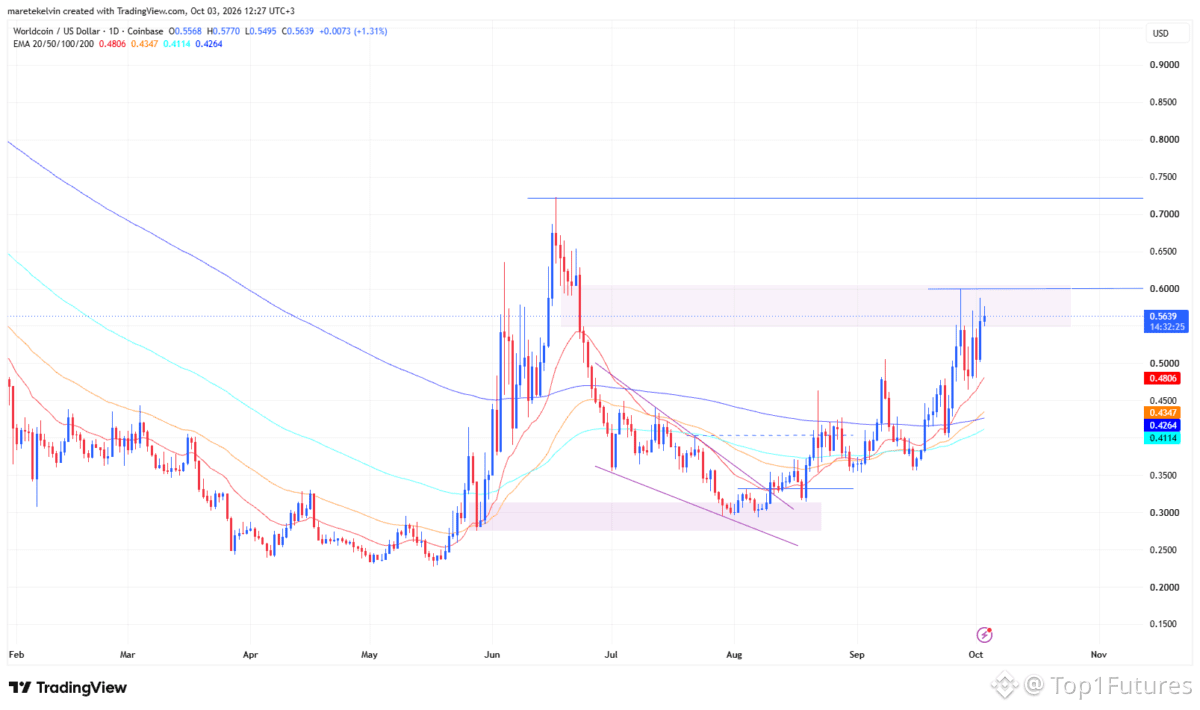
$WLD just made a move that could get very interesting from here… 👀
$WLD is up 10%, but the number I’m watching isn’t 10%.
It’s $0.60.
Why? Because that’s the level that could decide whether this rally fades… or turns into a much bigger move.
Trading volume exploded to $639M, up 45%, while whale activity in futures is increasing and spot buyers are still stepping in.
That combination matters.
When bigger players start positioning while spot demand strengthens, market psychology can change quickly. Traders who were waiting on the sidelines may start chasing if resistance finally breaks.
A clean daily breakout and hold above $0.60 could put $0.725 in sight — roughly 20% higher from there.
But if $0.60 rejects again, the momentum could cool before another attempt.
Right now, WLD has momentum, volume and growing participation.
The question is simple:
Does $0.60 become the ceiling… or the launchpad for $0.725? 🚀
#wld
$WLD just made a move that could get very interesting from here… 👀
$WLD is up 10%, but the number I’m watching isn’t 10%.
It’s $0.60.
Why? Because that’s the level that could decide whether this rally fades… or turns into a much bigger move.
Trading volume exploded to $639M, up 45%, while whale activity in futures is increasing and spot buyers are still stepping in.
That combination matters.
When bigger players start positioning while spot demand strengthens, market psychology can change quickly. Traders who were waiting on the sidelines may start chasing if resistance finally breaks.
A clean daily breakout and hold above $0.60 could put $0.725 in sight — roughly 20% higher from there.
But if $0.60 rejects again, the momentum could cool before another attempt.
Right now, WLD has momentum, volume and growing participation.
The question is simple:
Does $0.60 become the ceiling… or the launchpad for $0.725? 🚀
#wld
$WLD is up 10%, but the number I’m watching isn’t 10%.
It’s $0.60.
Why? Because that’s the level that could decide whether this rally fades… or turns into a much bigger move.
Trading volume exploded to $639M, up 45%, while whale activity in futures is increasing and spot buyers are still stepping in.
That combination matters.
When bigger players start positioning while spot demand strengthens, market psychology can change quickly. Traders who were waiting on the sidelines may start chasing if resistance finally breaks.
A clean daily breakout and hold above $0.60 could put $0.725 in sight — roughly 20% higher from there.
But if $0.60 rejects again, the momentum could cool before another attempt.
Right now, WLD has momentum, volume and growing participation.
The question is simple:
Does $0.60 become the ceiling… or the launchpad for $0.725? 🚀
#wld
2
156
·
--
$AVAX might have just found a catalyst most traders aren’t watching yet. 👀
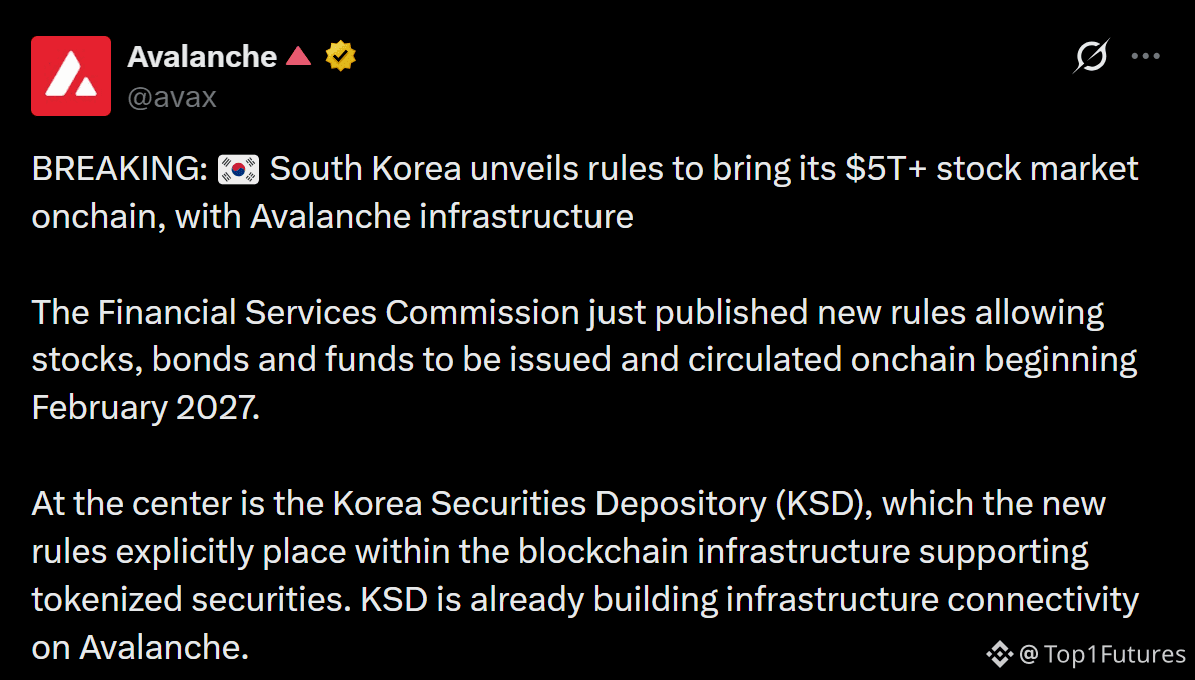
South Korea is preparing to move tokenized stocks, bonds and funds into a regulated market framework from February 2027.
And here’s where Avalanche gets interesting…
Korea Securities Depository (KSD) is already working on connecting its traditional financial infrastructure with Avalanche.
That’s not just another partnership headline.
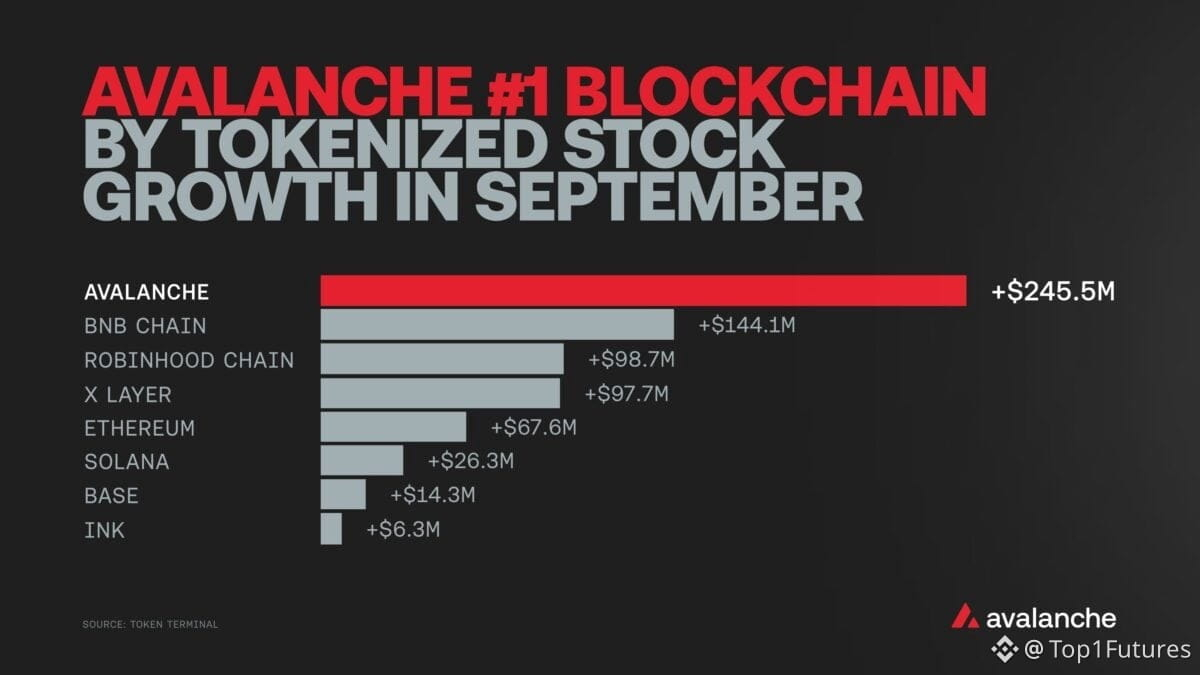
In September, Avalanche’s tokenized-stock market cap jumped by $245.5M — the biggest increase among blockchain networks mentioned in the report. And more than $131M flowed in during the final week alone.
Why does this matter?
Institutions don’t move billions because of hype. They move when infrastructure, regulation and liquidity start lining up.
If Korea’s rollout gains traction, Avalanche could become one of the networks capturing part of that on-chain equity flow.
For AVAX, the key question is whether this fundamental catalyst can translate into sustained buying pressure.
A breakout above its major resistance could open the door to a much larger recovery, while rejection could send traders back into wait-and-see mode.
The real move may come when institutions start using the rails.
Is AVAX still being priced like a normal altcoin… while something much bigger is quietly developing underneath? 👀
$AVAX might have just found a catalyst most traders aren’t watching yet. 👀
South Korea is preparing to move tokenized stocks, bonds and funds into a regulated market framework from February 2027.
And here’s where Avalanche gets interesting…
Korea Securities Depository (KSD) is already working on connecting its traditional financial infrastructure with Avalanche.
That’s not just another partnership headline.
In September, Avalanche’s tokenized-stock market cap jumped by $245.5M — the biggest increase among blockchain networks mentioned in the report. And more than $131M flowed in during the final week alone.
Why does this matter?
Institutions don’t move billions because of hype. They move when infrastructure, regulation and liquidity start lining up.
If Korea’s rollout gains traction, Avalanche could become one of the networks capturing part of that on-chain equity flow.
For AVAX, the key question is whether this fundamental catalyst can translate into sustained buying pressure.
A breakout above its major resistance could open the door to a much larger recovery, while rejection could send traders back into wait-and-see mode.
The real move may come when institutions start using the rails.
Is AVAX still being priced like a normal altcoin… while something much bigger is quietly developing underneath? 👀
South Korea is preparing to move tokenized stocks, bonds and funds into a regulated market framework from February 2027.
And here’s where Avalanche gets interesting…
Korea Securities Depository (KSD) is already working on connecting its traditional financial infrastructure with Avalanche.
That’s not just another partnership headline.
In September, Avalanche’s tokenized-stock market cap jumped by $245.5M — the biggest increase among blockchain networks mentioned in the report. And more than $131M flowed in during the final week alone.
Why does this matter?
Institutions don’t move billions because of hype. They move when infrastructure, regulation and liquidity start lining up.
If Korea’s rollout gains traction, Avalanche could become one of the networks capturing part of that on-chain equity flow.
For AVAX, the key question is whether this fundamental catalyst can translate into sustained buying pressure.
A breakout above its major resistance could open the door to a much larger recovery, while rejection could send traders back into wait-and-see mode.
The real move may come when institutions start using the rails.
Is AVAX still being priced like a normal altcoin… while something much bigger is quietly developing underneath? 👀
1
89
·
--
🚨$BTC just got a new macro trigger — and the next move could be bigger than expected.🔍
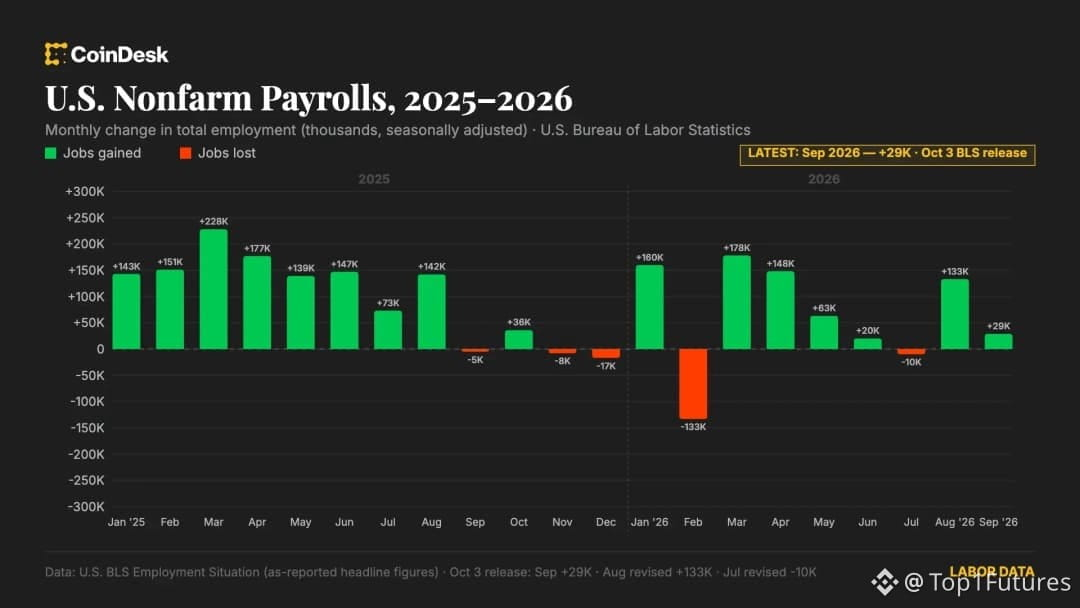
The U.S. labor market came in much weaker than forecasts.‼️
🇺🇸 September jobs:
• Only 29K added vs 90K expected
• Unemployment rose to 4.2%
• August jobs were revised lower
• Wage growth slowed to just 0.1% for the month
Why does this matter for Bitcoin?
A weaker jobs market can reduce pressure on the Federal Reserve to keep rates high. Lower yields can make risk assets like BTC more attractive.
And the market reacted fast:
BTC held near $87K, while Nasdaq futures pushed higher, Treasury yields dropped, gold gained, and the dollar weakened.
But here’s the interesting part 👀
If economic weakness continues and rate-cut expectations strengthen, Bitcoin could get another liquidity boost.
A sustained move above $87K could open the door toward higher resistance levels.
But if BTC fails to hold the breakout and macro fear returns, this could turn into another short-term rejection.
The jobs data changed the narrative.
Now the question is:
Will weaker U.S. growth become Bitcoin’s next bullish catalyst? 🚀
🚨$BTC just got a new macro trigger — and the next move could be bigger than expected.🔍
The U.S. labor market came in much weaker than forecasts.‼️
🇺🇸 September jobs:
• Only 29K added vs 90K expected
• Unemployment rose to 4.2%
• August jobs were revised lower
• Wage growth slowed to just 0.1% for the month
Why does this matter for Bitcoin?
A weaker jobs market can reduce pressure on the Federal Reserve to keep rates high. Lower yields can make risk assets like BTC more attractive.
And the market reacted fast:
BTC held near $87K, while Nasdaq futures pushed higher, Treasury yields dropped, gold gained, and the dollar weakened.
But here’s the interesting part 👀
If economic weakness continues and rate-cut expectations strengthen, Bitcoin could get another liquidity boost.
A sustained move above $87K could open the door toward higher resistance levels.
But if BTC fails to hold the breakout and macro fear returns, this could turn into another short-term rejection.
The jobs data changed the narrative.
Now the question is:
Will weaker U.S. growth become Bitcoin’s next bullish catalyst? 🚀
The U.S. labor market came in much weaker than forecasts.‼️
🇺🇸 September jobs:
• Only 29K added vs 90K expected
• Unemployment rose to 4.2%
• August jobs were revised lower
• Wage growth slowed to just 0.1% for the month
Why does this matter for Bitcoin?
A weaker jobs market can reduce pressure on the Federal Reserve to keep rates high. Lower yields can make risk assets like BTC more attractive.
And the market reacted fast:
BTC held near $87K, while Nasdaq futures pushed higher, Treasury yields dropped, gold gained, and the dollar weakened.
But here’s the interesting part 👀
If economic weakness continues and rate-cut expectations strengthen, Bitcoin could get another liquidity boost.
A sustained move above $87K could open the door toward higher resistance levels.
But if BTC fails to hold the breakout and macro fear returns, this could turn into another short-term rejection.
The jobs data changed the narrative.
Now the question is:
Will weaker U.S. growth become Bitcoin’s next bullish catalyst? 🚀
1
44
·
--
$XRP 🛑 is sitting on a level that could decide its next big move… 📈 ⬆️
45% Q3 rally. ~$307.9M in Q3 #ETF inflows. Yet $XRP keeps getting rejected near $1.70.
“ETF demand is strong… so why isn’t price breaking out?”
That’s the real question. 👀
The answer may be supply.
Exchange deposits have surged, meaning more XRP is potentially available for sellers. So even with institutional demand absorbing coins, profit-taking can keep pressure near resistance.
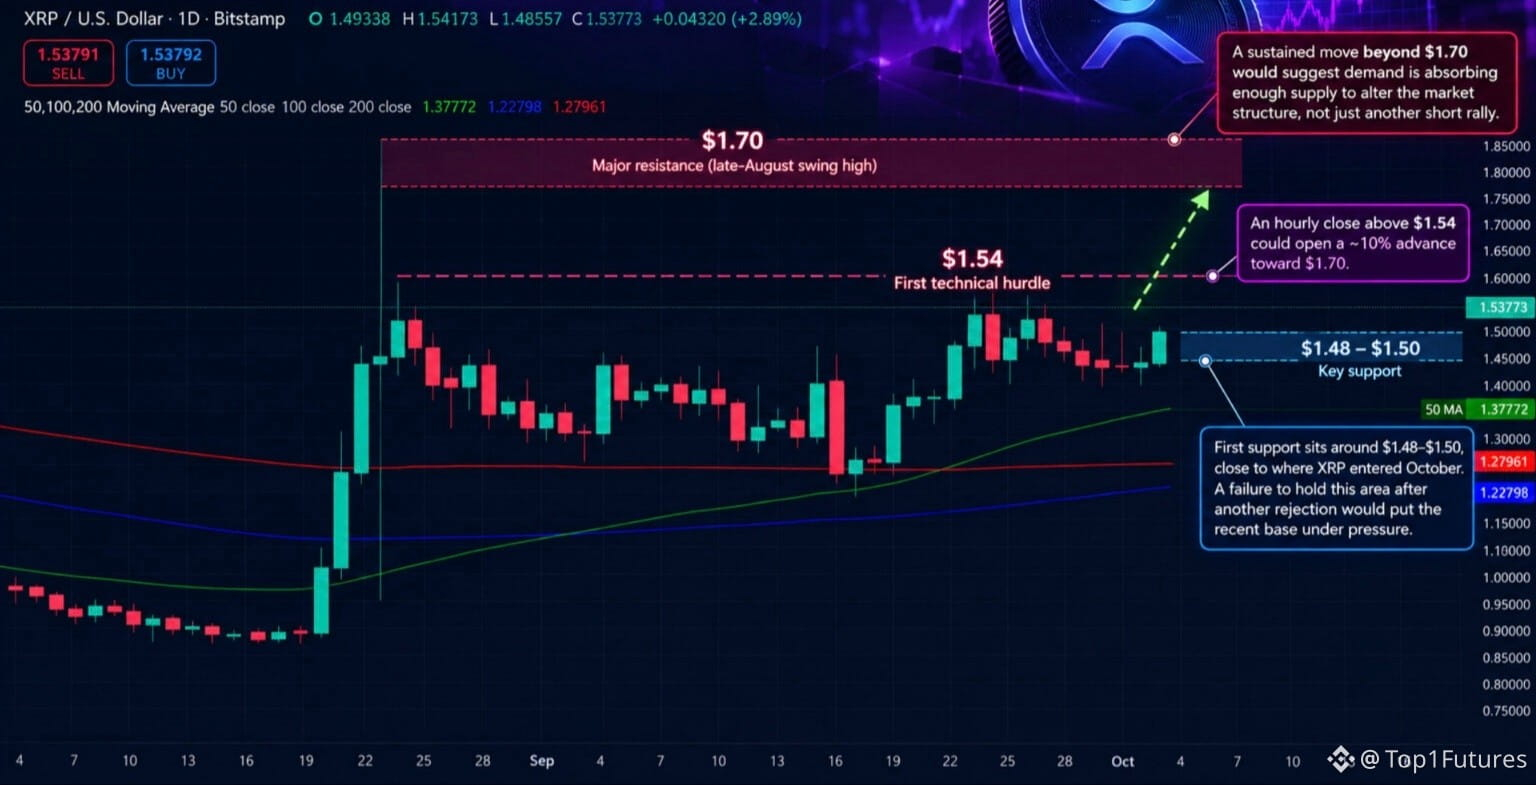
Now watch the levels:
$1.48–$1.50 → key support
$1.54 → first breakout trigger
$1.70 → major resistance
If #XRP holds $1.50 and clears $1.54, momentum could build toward $1.70. A sustained break above $1.70 could signal that demand is finally overwhelming the supply wall.
But another rejection could send XRP back toward $1.50.
The setup is getting tighter… 👀
Will $XRP finally break the $1.70 wall, or is another rejection coming❓🔴
$XRP 🛑 is sitting on a level that could decide its next big move… 📈 ⬆️
45% Q3 rally. ~$307.9M in Q3 #ETF inflows. Yet $XRP keeps getting rejected near $1.70.
“ETF demand is strong… so why isn’t price breaking out?”
That’s the real question. 👀
The answer may be supply.
Exchange deposits have surged, meaning more XRP is potentially available for sellers. So even with institutional demand absorbing coins, profit-taking can keep pressure near resistance.
Now watch the levels:
$1.48–$1.50 → key support
$1.54 → first breakout trigger
$1.70 → major resistance
If #XRP holds $1.50 and clears $1.54, momentum could build toward $1.70. A sustained break above $1.70 could signal that demand is finally overwhelming the supply wall.
But another rejection could send XRP back toward $1.50.
The setup is getting tighter… 👀
Will $XRP finally break the $1.70 wall, or is another rejection coming❓🔴
45% Q3 rally. ~$307.9M in Q3 #ETF inflows. Yet $XRP keeps getting rejected near $1.70.
“ETF demand is strong… so why isn’t price breaking out?”
That’s the real question. 👀
The answer may be supply.
Exchange deposits have surged, meaning more XRP is potentially available for sellers. So even with institutional demand absorbing coins, profit-taking can keep pressure near resistance.
Now watch the levels:
$1.48–$1.50 → key support
$1.54 → first breakout trigger
$1.70 → major resistance
If #XRP holds $1.50 and clears $1.54, momentum could build toward $1.70. A sustained break above $1.70 could signal that demand is finally overwhelming the supply wall.
But another rejection could send XRP back toward $1.50.
The setup is getting tighter… 👀
Will $XRP finally break the $1.70 wall, or is another rejection coming❓🔴
1
70
·
--
Рост
🚀 $BTC just flipped the level everyone is watching…👀‼️ But the next move could get interesting.❗
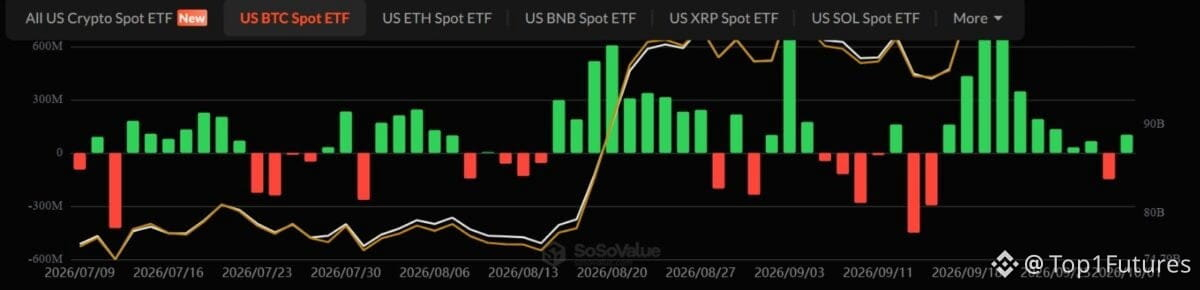
$BTC 🔼 jumped 3% to $86.9K as spot #ETF inflows swung back to +$102M, reversing the previous -$148M.
That matters because fresh ETF demand = new buying pressure.
Now watch $85K ‼️👀
Hold above it → $88K becomes the next test, with $90K potentially in sight.📈
Lose $85K on a daily close → $82K could come back fast.
The interesting part? Momentum is improving, but it’s not yet explosive.
Traders are watching whether this is the start of an Uptober breakout… or just another fakeout.
So, BTC… are you preparing for $90K, or is $85K about to trap late buyers❓🔥
🚀 $BTC just flipped the level everyone is watching…👀‼️ But the next move could get interesting.❗
$BTC 🔼 jumped 3% to $86.9K as spot #ETF inflows swung back to +$102M, reversing the previous -$148M.
That matters because fresh ETF demand = new buying pressure.
Now watch $85K ‼️👀
Hold above it → $88K becomes the next test, with $90K potentially in sight.📈
Lose $85K on a daily close → $82K could come back fast.
The interesting part? Momentum is improving, but it’s not yet explosive.
Traders are watching whether this is the start of an Uptober breakout… or just another fakeout.
So, BTC… are you preparing for $90K, or is $85K about to trap late buyers❓🔥
$BTC 🔼 jumped 3% to $86.9K as spot #ETF inflows swung back to +$102M, reversing the previous -$148M.
That matters because fresh ETF demand = new buying pressure.
Now watch $85K ‼️👀
Hold above it → $88K becomes the next test, with $90K potentially in sight.📈
Lose $85K on a daily close → $82K could come back fast.
The interesting part? Momentum is improving, but it’s not yet explosive.
Traders are watching whether this is the start of an Uptober breakout… or just another fakeout.
So, BTC… are you preparing for $90K, or is $85K about to trap late buyers❓🔥
1
43
·
--
$ETH 🚀 $ETH just delivered a historic 70%+ Q3 rally… so why does October suddenly feel dangerous❓👀
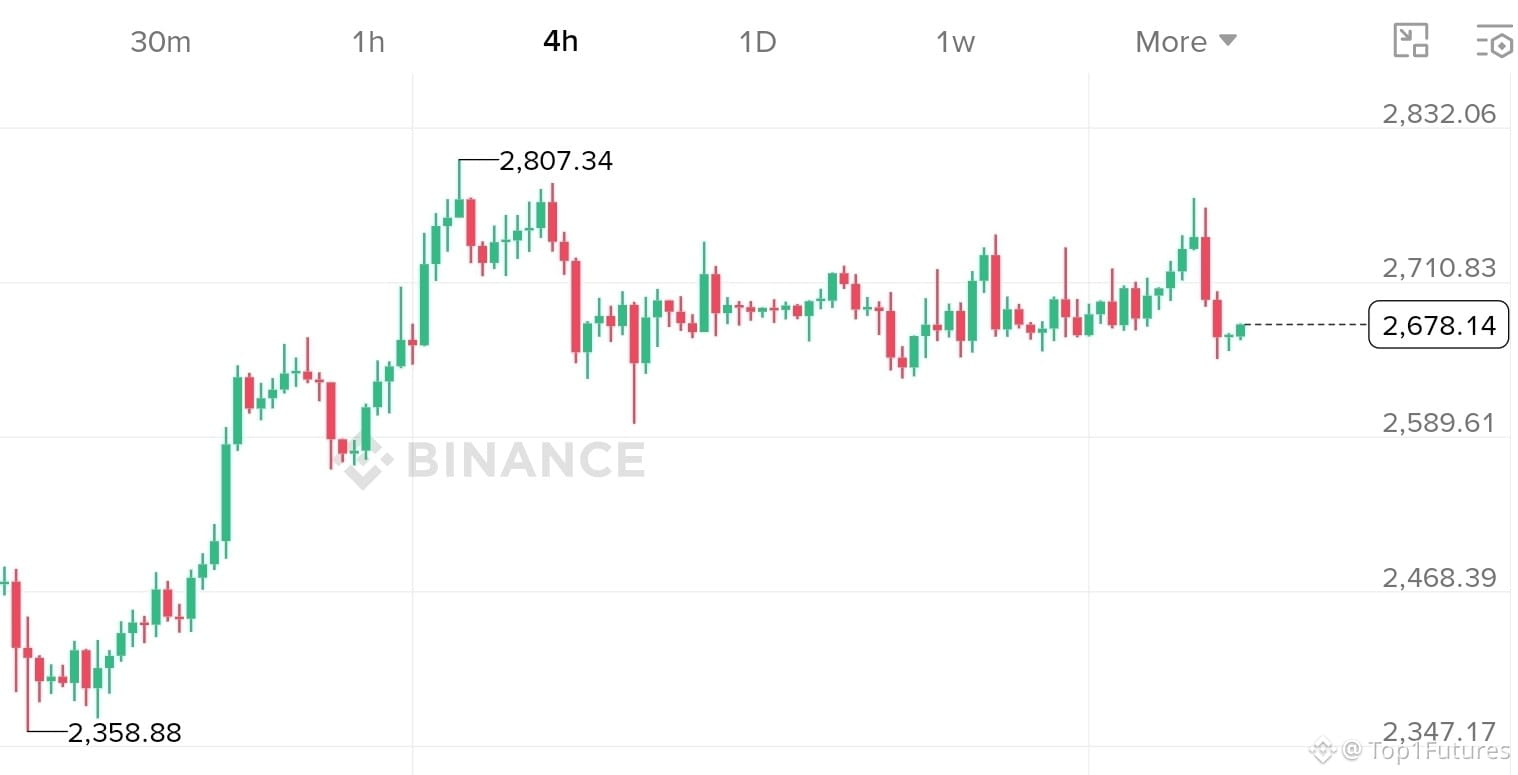
Sentiment slipped below 1.0, Binance Taker Buy/Sell Ratio fell to 0.95, while 773K+ $ETH sits in the exit queue. ETFs also saw $13.89M outflows.📊
After such a huge run, profit-taking could trigger a deeper pullback before the next move.📉🔽
But here’s the twist: extreme fear can also fuel a contrarian bounce.
Is October the start of ETH’s reversal—or the setup nobody expects❓ 👀
$ETH 🚀 $ETH just delivered a historic 70%+ Q3 rally… so why does October suddenly feel dangerous❓👀
Sentiment slipped below 1.0, Binance Taker Buy/Sell Ratio fell to 0.95, while 773K+ $ETH sits in the exit queue. ETFs also saw $13.89M outflows.📊
After such a huge run, profit-taking could trigger a deeper pullback before the next move.📉🔽
But here’s the twist: extreme fear can also fuel a contrarian bounce.
Is October the start of ETH’s reversal—or the setup nobody expects❓ 👀
Sentiment slipped below 1.0, Binance Taker Buy/Sell Ratio fell to 0.95, while 773K+ $ETH sits in the exit queue. ETFs also saw $13.89M outflows.📊
After such a huge run, profit-taking could trigger a deeper pullback before the next move.📉🔽
But here’s the twist: extreme fear can also fuel a contrarian bounce.
Is October the start of ETH’s reversal—or the setup nobody expects❓ 👀
1
60
Войдите, чтобы посмотреть больше материала
Присоединяйтесь к пользователям криптовалют по всему миру на Binance Square
⚡️ Получайте новейшую и полезную информацию о криптоактивах.
💬 Нам доверяет крупнейшая в мире криптобиржа.
👍 Получите достоверные аналитические данные от верифицированных создателей контента.
Эл. почта/номер телефона
В тренде
FedMinutesFocusOnOctoberPause
Просмотров: 52,316
745 обсуждают
#fedminutesfocusonoctoberpause
🚨 OCTOBER FED HIKE ODDS COLLAPSE TO 21.6%… Is $BTC About to React? 👀
The Fed is about to give markets another major clue.
Investors are waiting for today’s FOMC minutes — and the biggest question is whether October brings another rate hike… or a pause.
Right now, the odds of a 25-basis-point October hike have fallen to just 21.6%.
That’s a huge shift in expectations.
But here’s what makes this interesting… 👀
The Fed raised rates to 3.75%–4.00% in September, but recent weakness in jobs data and softer inflation have made another immediate hike look less certain.
And for crypto, this matters.
A Fed pause could reduce pressure on financial conditions and potentially improve risk appetite.
That could become a tailwind for BTC
But there’s a catch…
Bitcoin is already under pressure as the dollar and Treasury yields move higher.
So tonight’s minutes could become a volatility trigger.
Dovish Fed → liquidity hopes → bullish .
BTC narrative?
Hawkish Fed → higher-rate fears → more pressure on risk assets?
The real question:
Is October becoming the pause Bitcoin bulls have been waiting for… or could the Fed surprise the market again? 👀
Watch BTC + Fed expectations + Treasury yields closely.
#FederalReserve #Fed #Crypto #InterestRates
$ETH
$SOL
Shae Cassler Sw9r
·Лайков: 23
·Просмотров: 46.4k
BinanceLaunchesBinanceIntelligence
Просмотров: 997,110
6,010 обсуждают
EvernorthDelaysNasdaqDebutToOct12
Просмотров: 2,096
106 обсуждают