FIBO99

1 подписок(и/а)
106 подписчиков(а)
90 понравилось
Посты
·
--
·
--
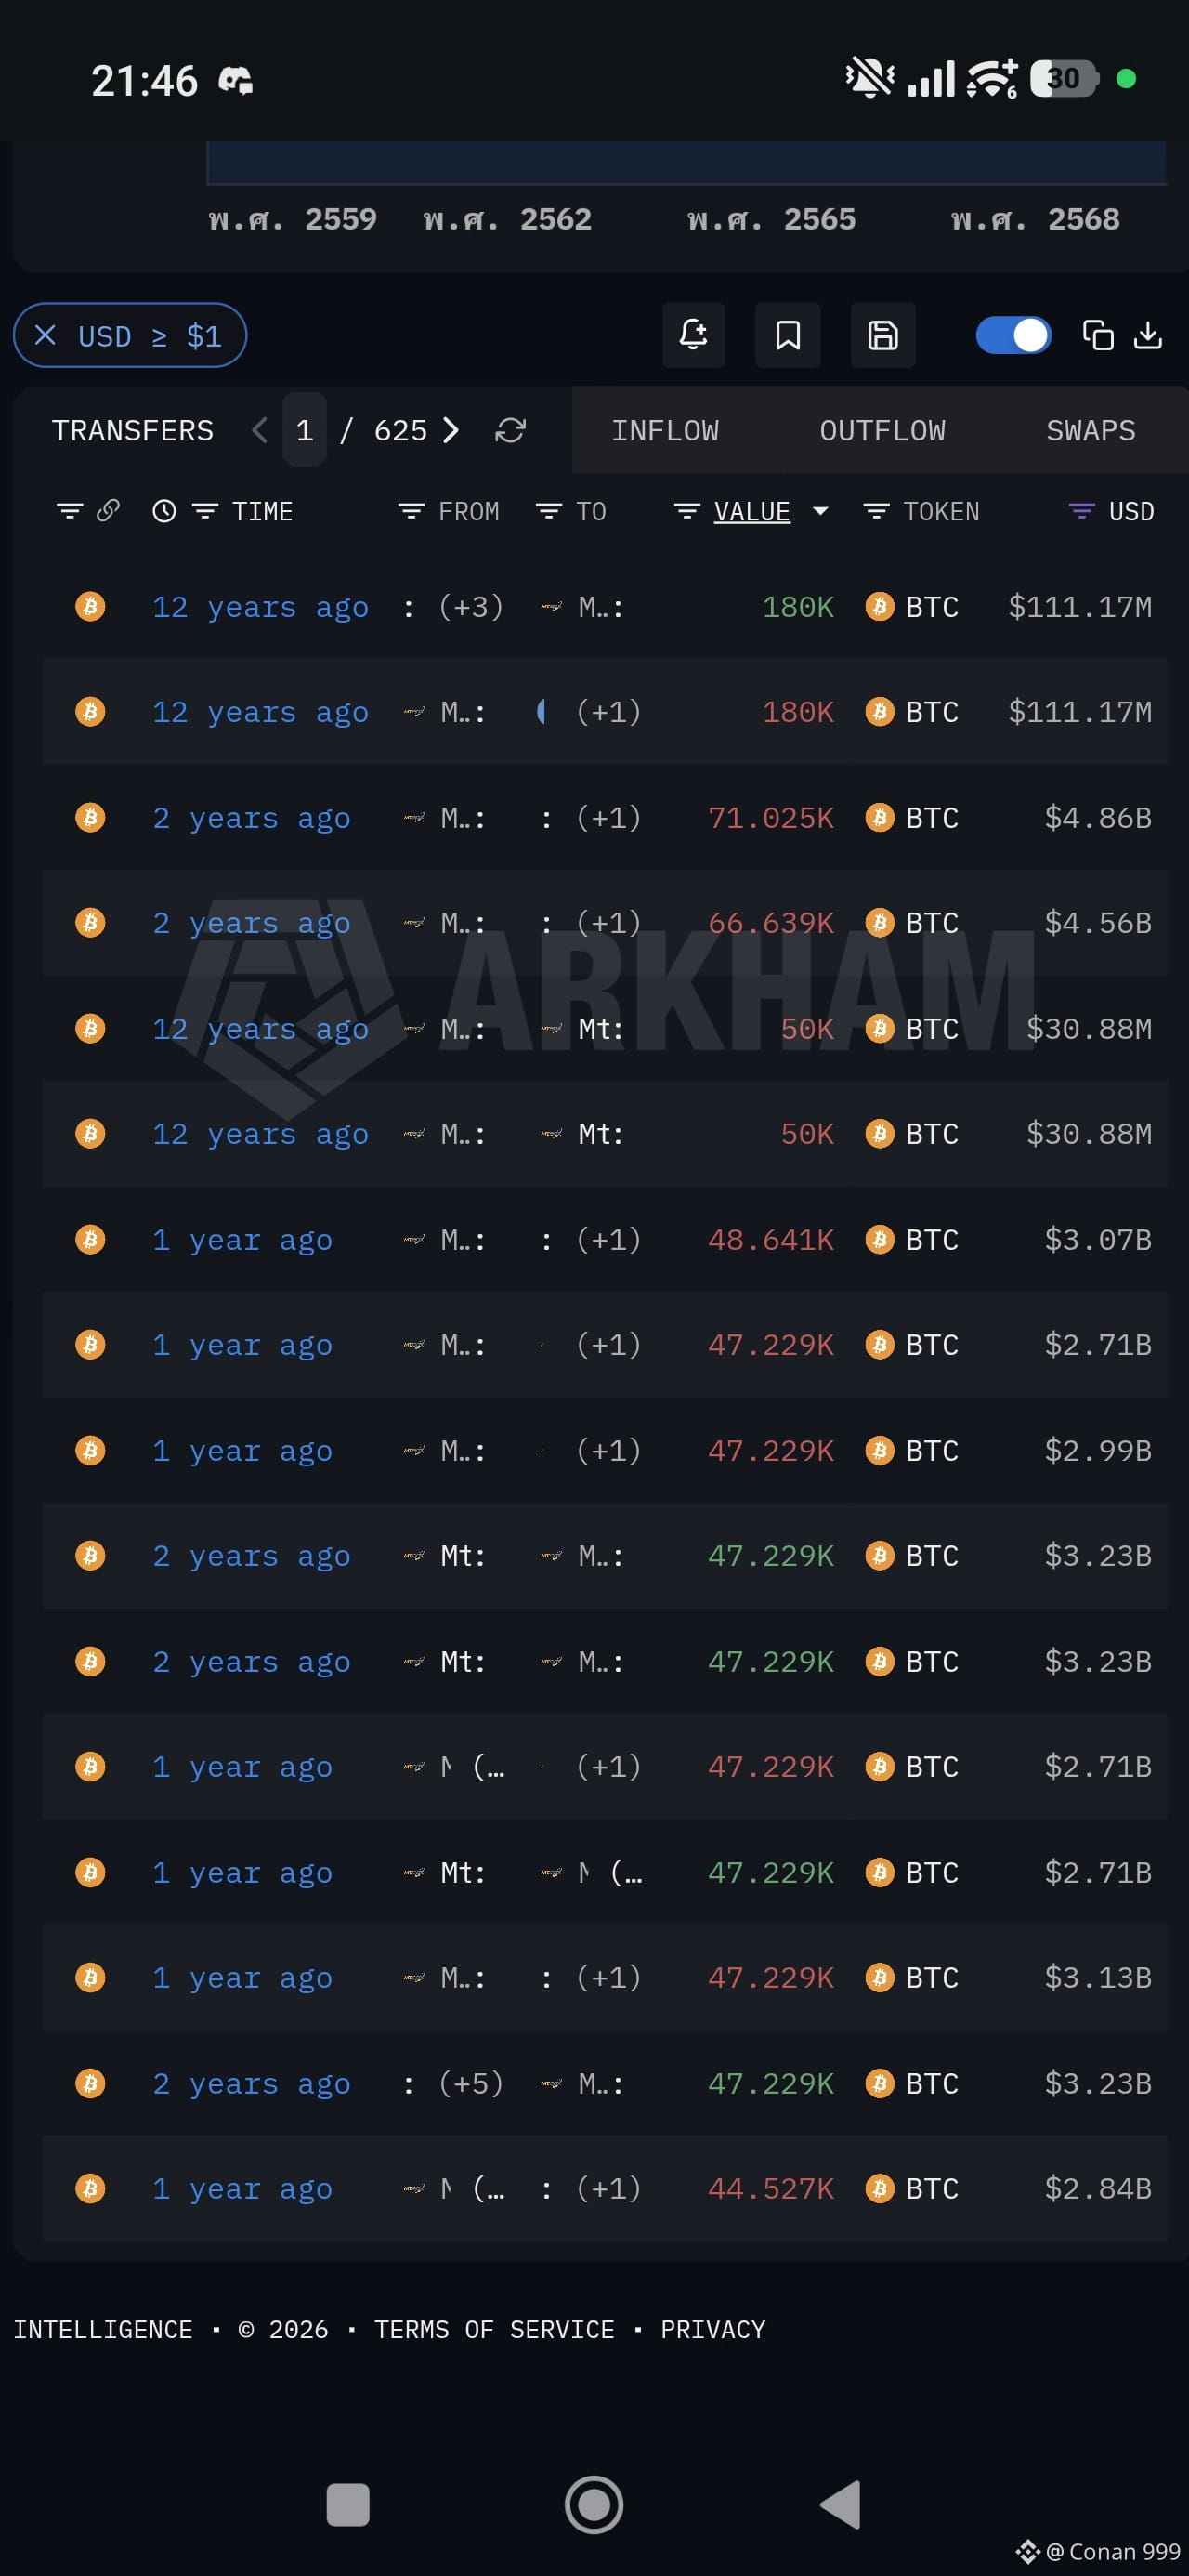
How did we even survive last year with Mt. Gox dumping that hard? This year is nothing like that, yet everyone is complaining about how brutal the market is #BTC . 🫵🤣​
·
--
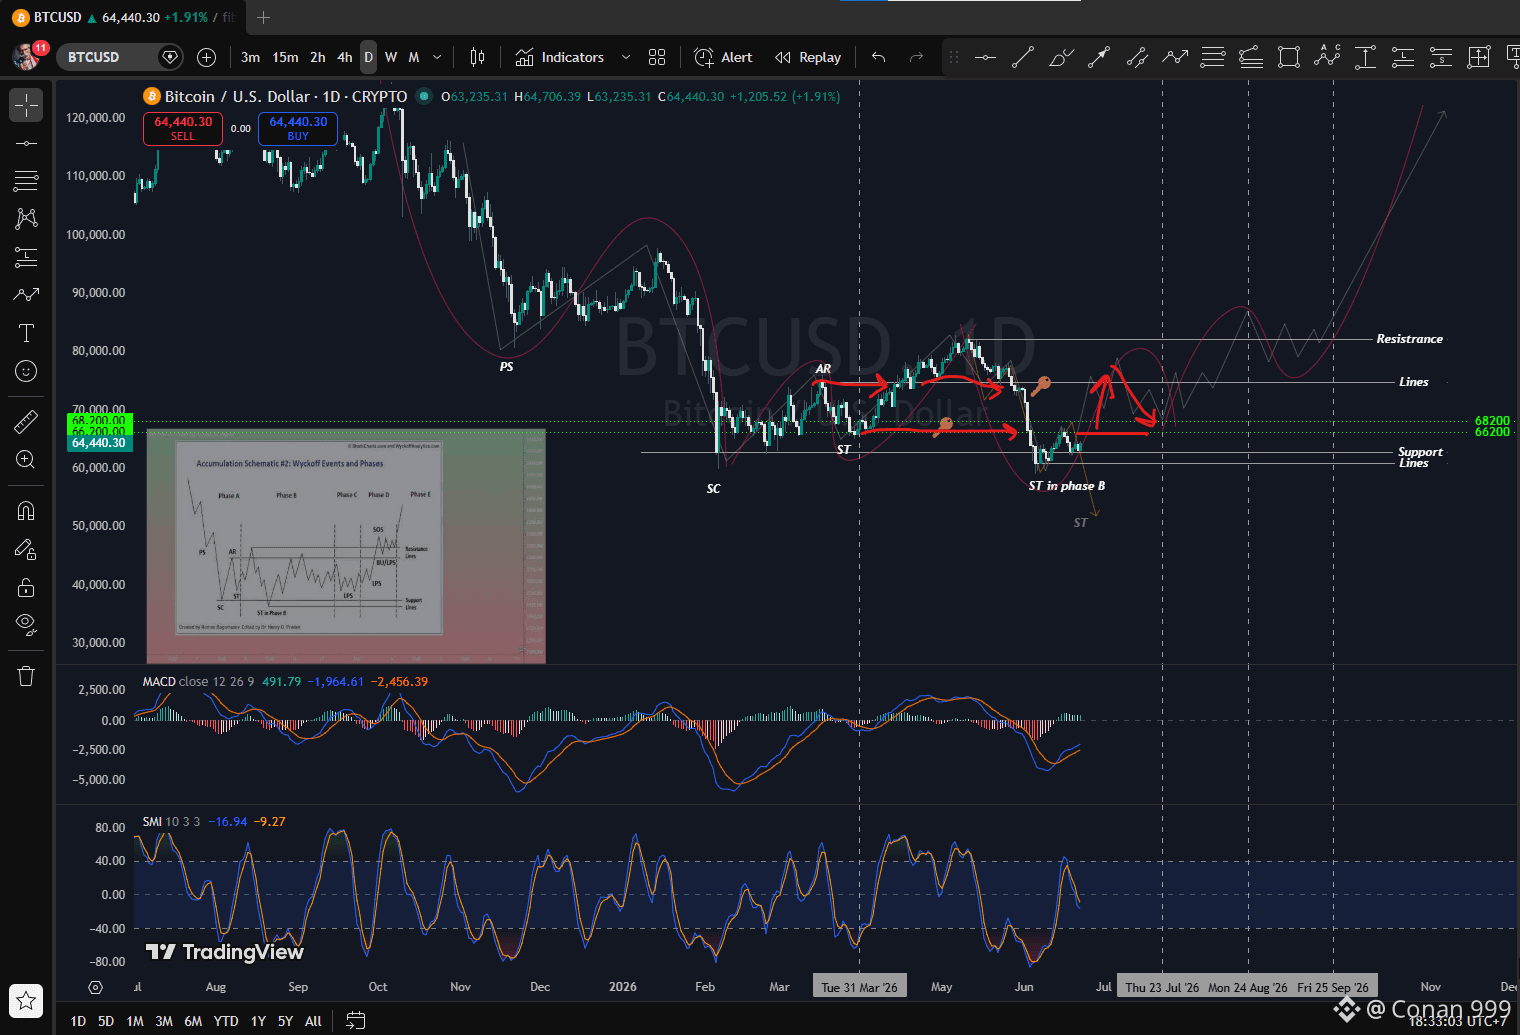
The player is day trade & the marker is wyckoff​ time. #bitcoin
·
--
Рост
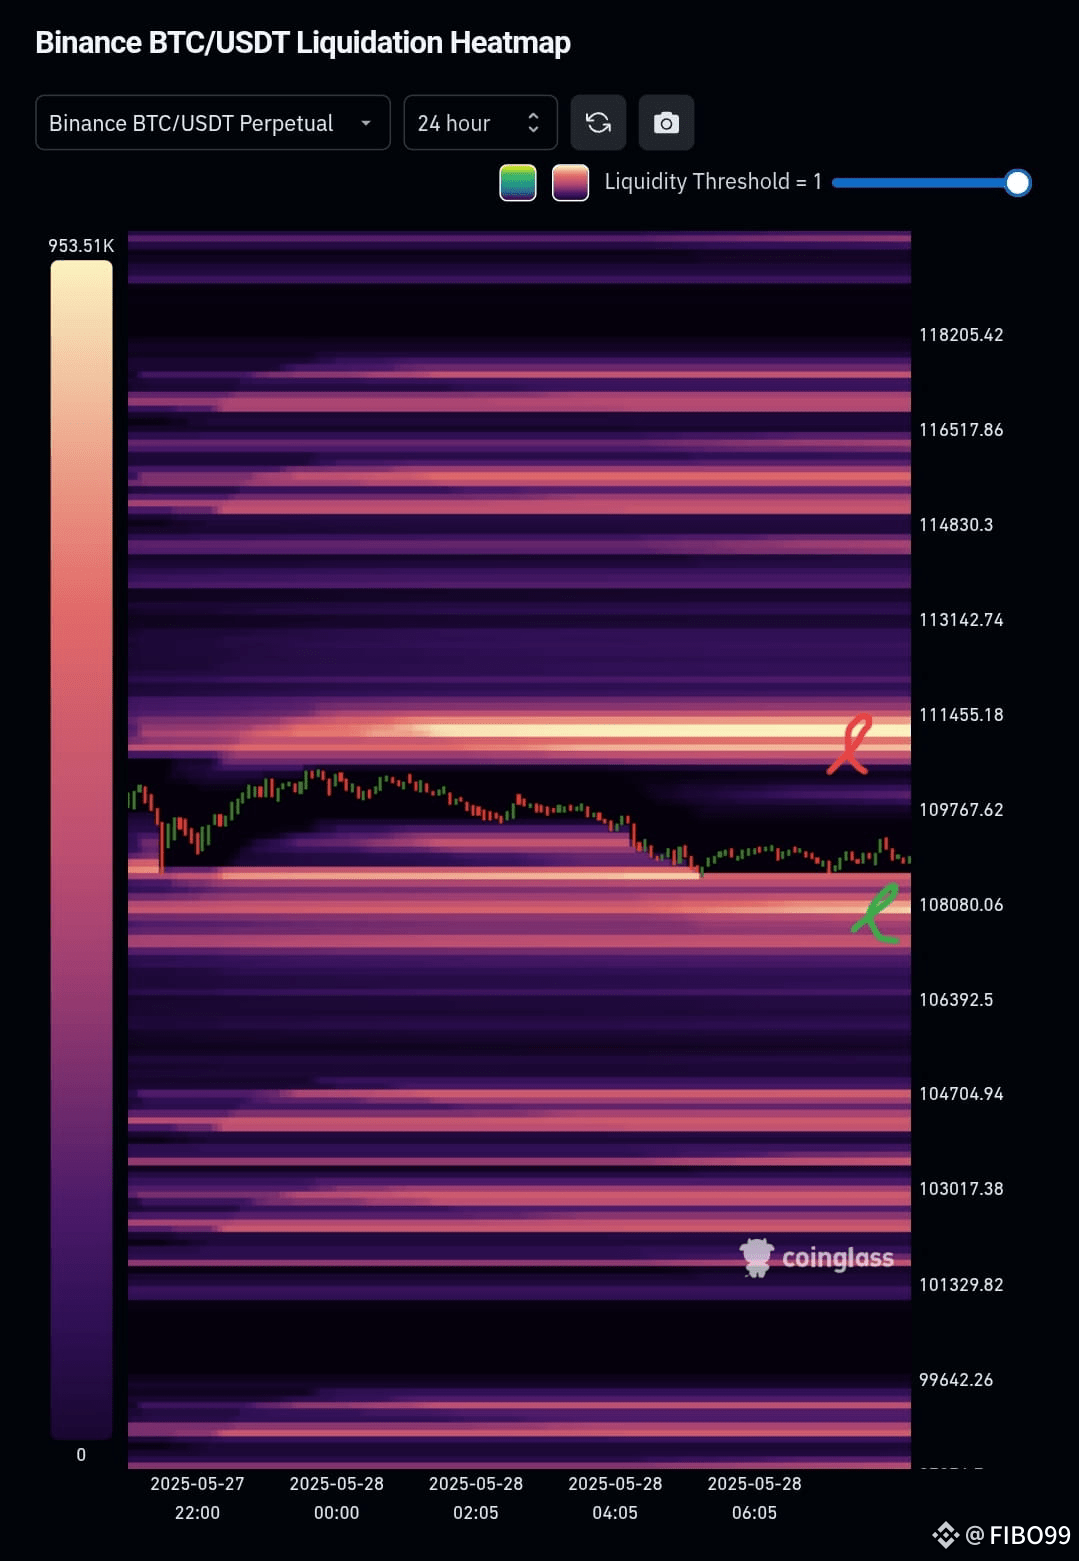
The market is facing Whale hunting. #bitcoin Liquidation​ short sell next $110,500
The market is facing Whale hunting.
#bitcoin Liquidation​ short sell next $110,500
·
--
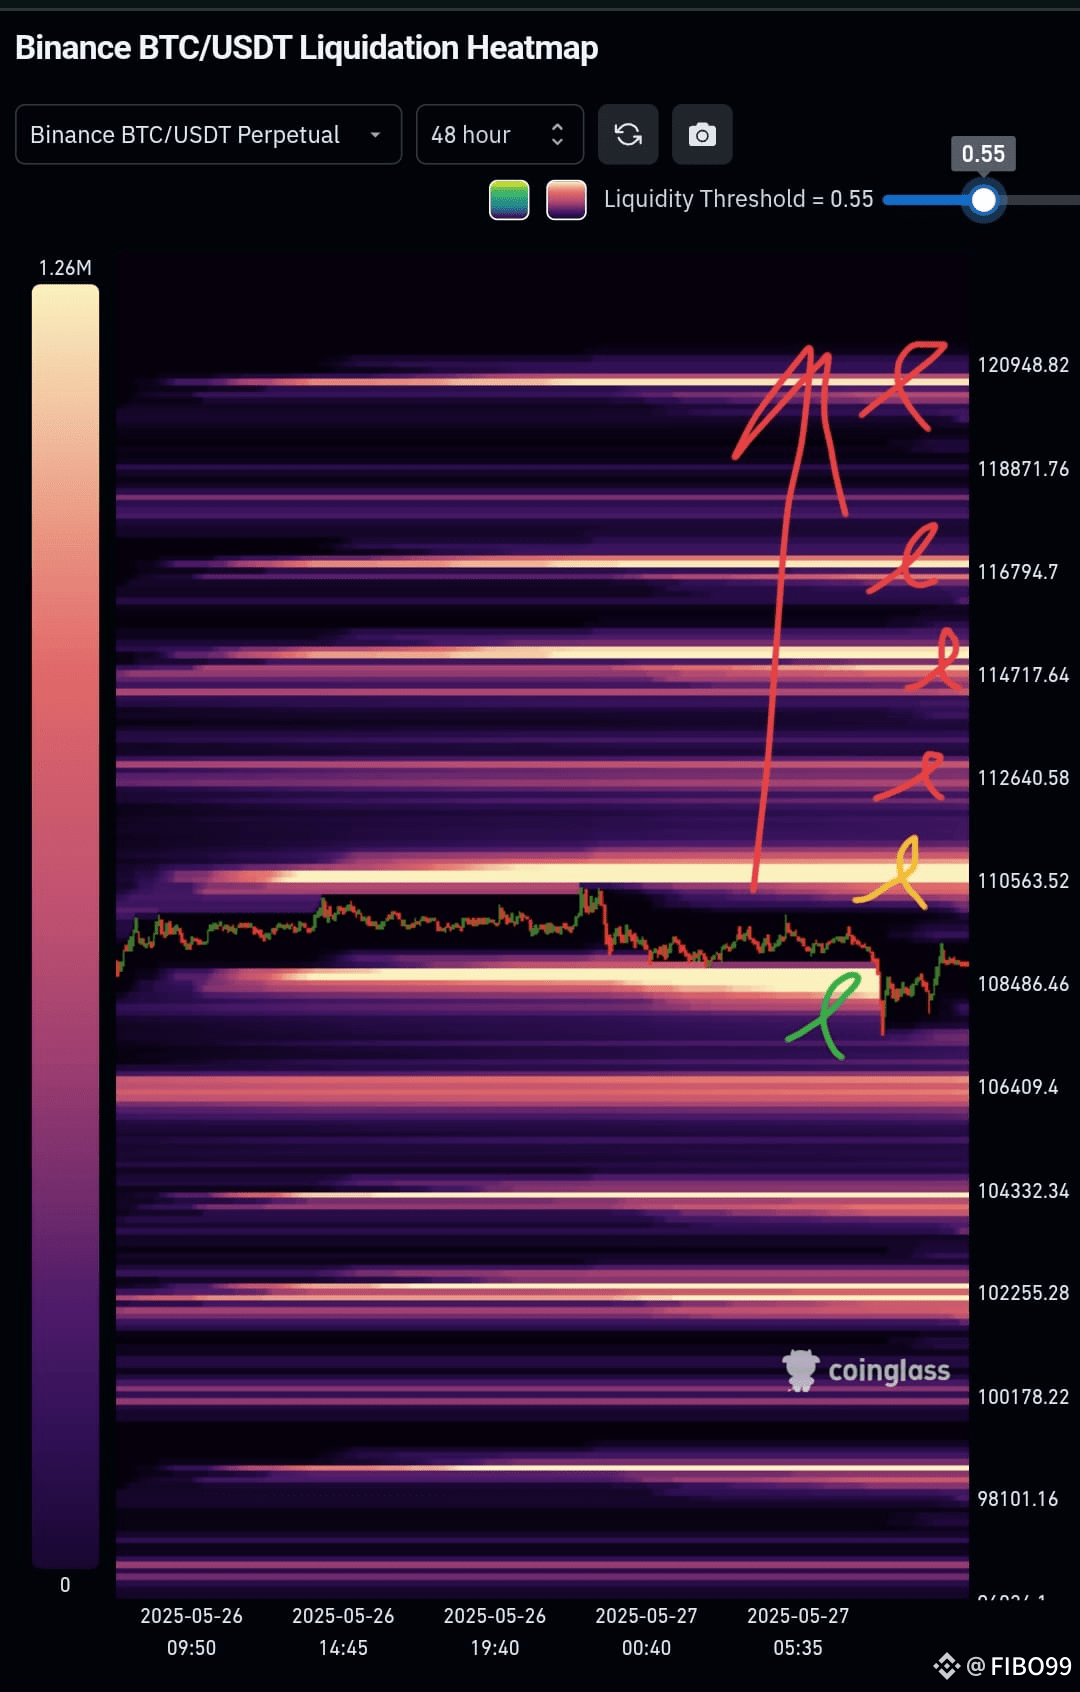
I need some time. Go to the all time high
FIBO99
·
--
Рост
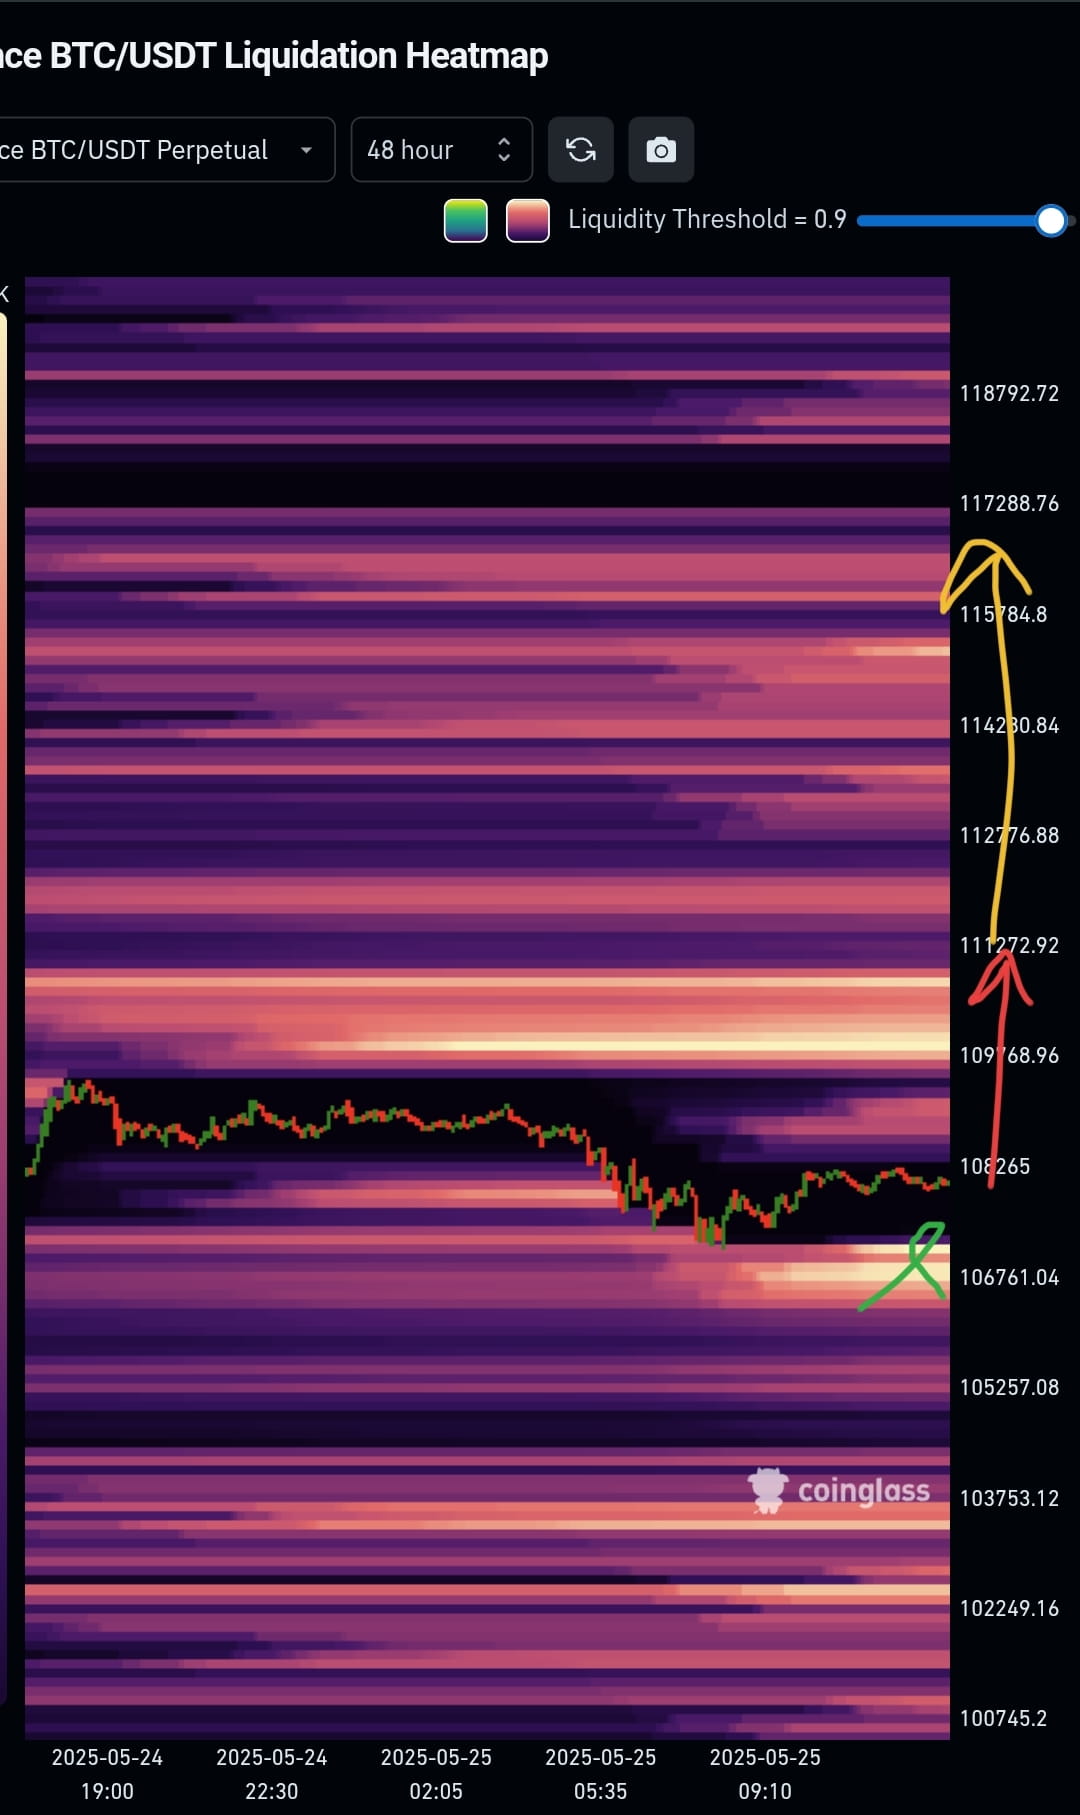
Heatmap Color #BTC

Bright yellow/white areas indicate high liquidity zones — zones where a lot of stop orders/liquidations may be triggered.

Darker areas indicate lower interest or liquidity.
Annotations:
Green Checkmark near $106,761: Likely indicates a strong support or accumulation area, where BTC has reacted or bounced.

Red Arrow at $111,272: Points to a key resistance or liquidation cluster — many short positions may get liquidated here if price moves up.

Yellow Arrow at $117,288: Indicates an even higher liquidity target, possibly another major resistance zone or whale target if momentum continues.

Interpretation:

If BTC continues up, it could:

Hit $111,272 and trigger liquidations, possibly gaining momentum.

Push toward $117,288 if that momentum is strong.

If BTC drops, the $106,761 level might be tested as support.
·
--
Рост
Heatmap Color #BTC Bright yellow/white areas indicate high liquidity zones — zones where a lot of stop orders/liquidations may be triggered. Darker areas indicate lower interest or liquidity. Annotations: Green Checkmark near $106,761: Likely indicates a strong support or accumulation area, where BTC has reacted or bounced. Red Arrow at $111,272: Points to a key resistance or liquidation cluster — many short positions may get liquidated here if price moves up. Yellow Arrow at $117,288: Indicates an even higher liquidity target, possibly another major resistance zone or whale target if momentum continues. Interpretation: If BTC continues up, it could: Hit $111,272 and trigger liquidations, possibly gaining momentum. Push toward $117,288 if that momentum is strong. If BTC drops, the $106,761 level might be tested as support.
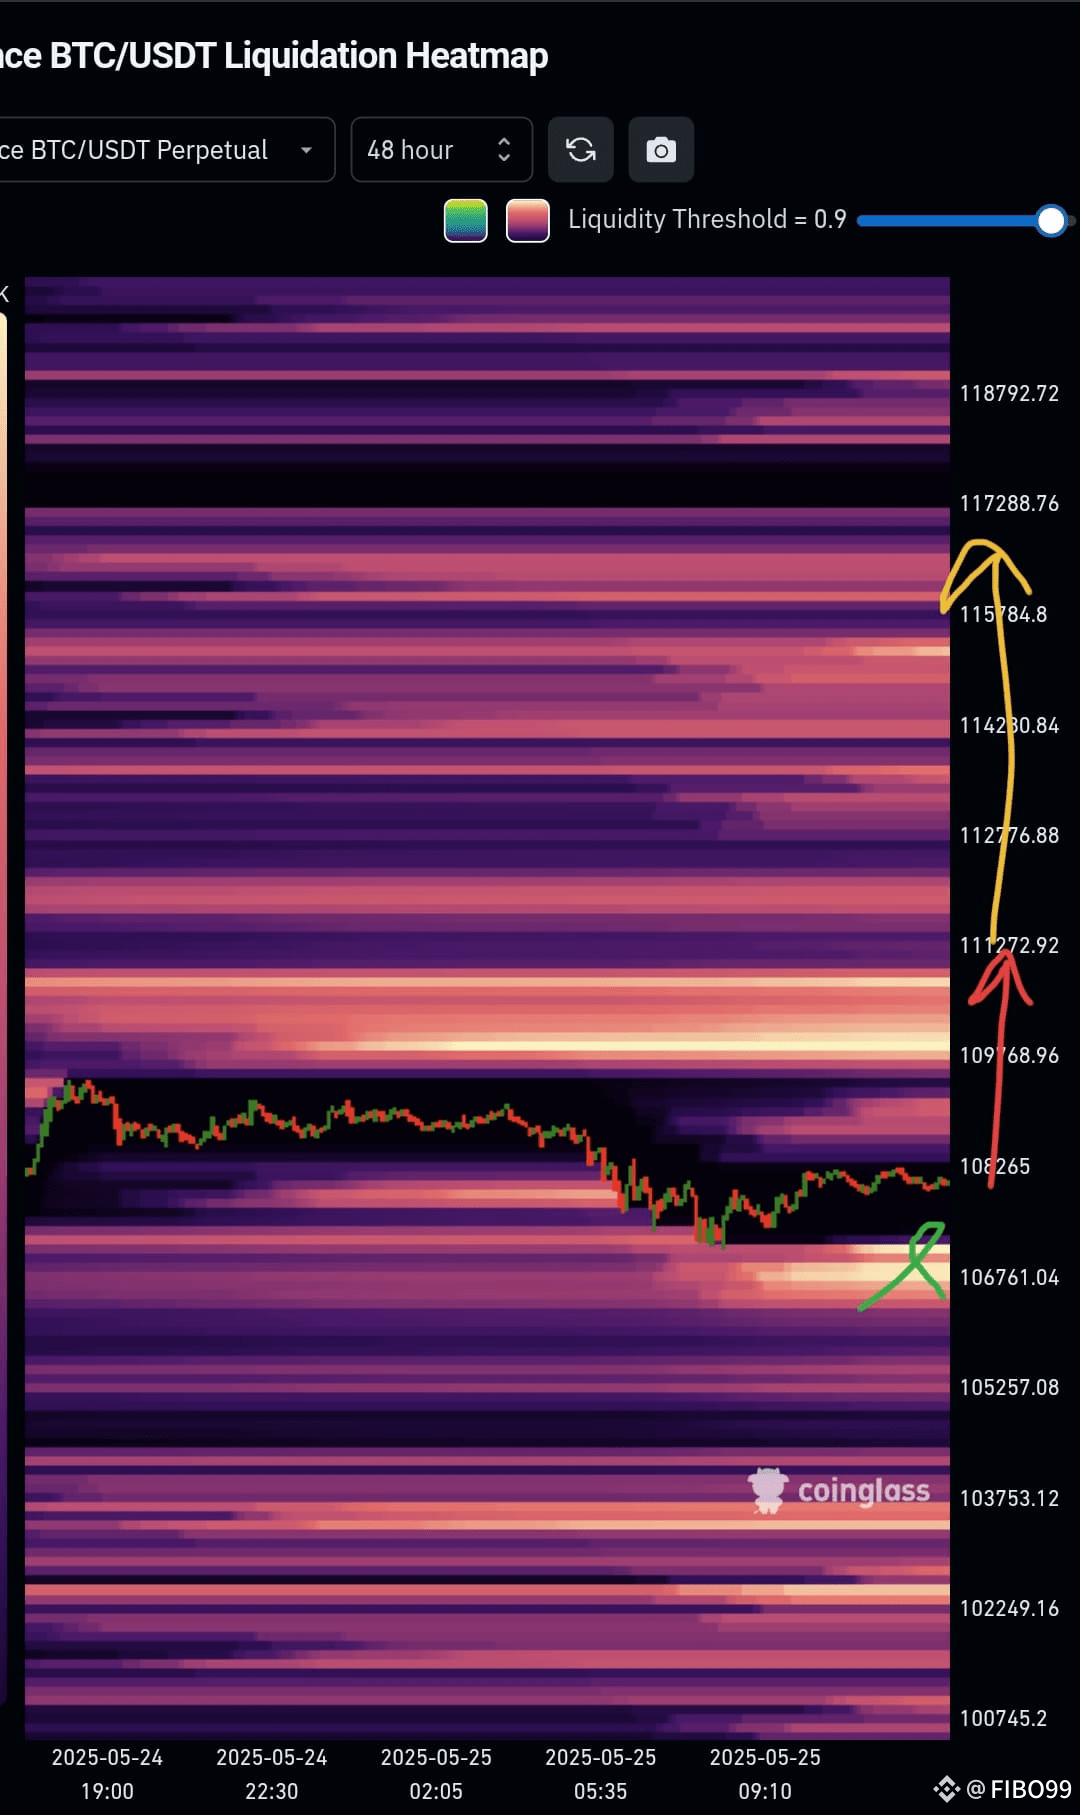
Heatmap Color #BTC

Bright yellow/white areas indicate high liquidity zones — zones where a lot of stop orders/liquidations may be triggered.

Darker areas indicate lower interest or liquidity.
Annotations:
Green Checkmark near $106,761: Likely indicates a strong support or accumulation area, where BTC has reacted or bounced.

Red Arrow at $111,272: Points to a key resistance or liquidation cluster — many short positions may get liquidated here if price moves up.

Yellow Arrow at $117,288: Indicates an even higher liquidity target, possibly another major resistance zone or whale target if momentum continues.

Interpretation:

If BTC continues up, it could:

Hit $111,272 and trigger liquidations, possibly gaining momentum.

Push toward $117,288 if that momentum is strong.

If BTC drops, the $106,761 level might be tested as support.
Войдите, чтобы посмотреть больше материала
Присоединяйтесь к пользователям криптовалют по всему миру на Binance Square
⚡️ Получайте новейшую и полезную информацию о криптоактивах.
💬 Нам доверяет крупнейшая в мире криптобиржа.
👍 Получите достоверные аналитические данные от верифицированных создателей контента.
Эл. почта/номер телефона
Структура веб-страницы
Настройки cookie
Правила и условия платформы