

IWantFries09
38 Публикации

IWantFries09
15 подписок(и/а)
13 подписчиков(а)
14 понравилось
Посты
Все
Цитирования


Cas Abbé
·
--
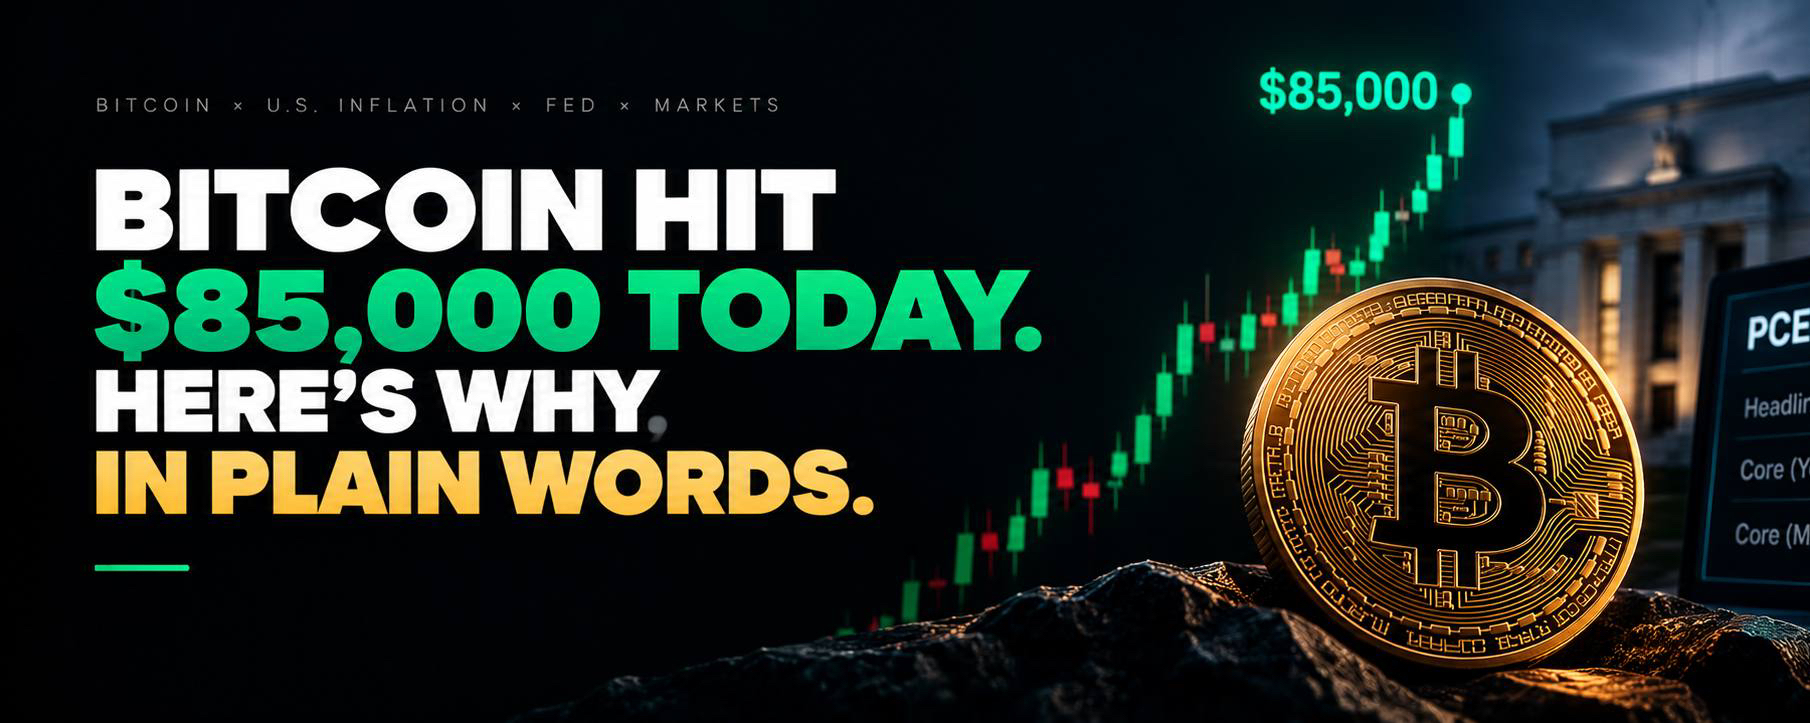
BITCOIN HIT $85,000 TODAY. HERE’S WHY AND WHAT’S NEXT
I was watching the charts and Bitcoin jumped fast. Within minutes of a big US inflation report, it went above $85,000. I want to explain what happened in simple words.
First, what is PCE?
PCE is a number that shows how fast prices are rising in the US. It is the inflation gauge the Federal Reserve (the Fed) watches most closely. When prices rise too fast, the Fed can raise interest rates to slow things down.
The numbers surprised people
The report came out this morning, and it was lower than experts expected.
• Yearly PCE inflation was 3.4%, while experts expected 3.7%.
• Core PCE, which leaves out food and energy, was 3.0%, while experts expected 3.3%.
• Core prices rose 0.2% in the month, against a forecast of 0.3%.
So prices are still rising, but more slowly than people feared.
Why did Bitcoin care?
Think of it this way. Higher interest rates make safe things, like government bonds, look better. That pulls money away from risky things, like Bitcoin. Lower rate fears do the opposite.
After the report, the chance of an October Fed rate hike fell to about 35%. The Fed already raised rates by 0.25 percentage points earlier this month, so traders were nervous about another hike.
Bond yields also dipped a little. The 10-year yield fell from about 5.234% to about 5.203%. That took a bit of pressure off Bitcoin.
What did the price do?
Bitcoin hit a high of $85,598.94. Before the report, it was trading around $83,000 to $84,000. More than $75 million of short bets were wiped out within an hour. A short is a bet that the price will fall. When the price rises instead, those traders are forced to buy back, and that pushes the price up even more.
But here is the honest part
The move did not hold. Bitcoin gave back some gains and settled near $84,000. I think that is worth knowing.
Also, 3.0% core inflation is still well above the Fed's 2% target. Consumer spending was strong too, and strong spending can keep prices from falling quickly. Some analysts also say a change in how the data is measured helped make the number look cooler.
What I am watching next
• Whether Bitcoin can get back above the $87,000 area.
• Friday's jobs report, the last big data release before the Fed meets.
• Whether the Fed really holds off on another hike.
Today was a good day for Bitcoin. But one report does not change the whole story. I will keep watching the data, and I hope you will too.
#BTC #BTC走势分析
First, what is PCE?
PCE is a number that shows how fast prices are rising in the US. It is the inflation gauge the Federal Reserve (the Fed) watches most closely. When prices rise too fast, the Fed can raise interest rates to slow things down.
The numbers surprised people
The report came out this morning, and it was lower than experts expected.
• Yearly PCE inflation was 3.4%, while experts expected 3.7%.
• Core PCE, which leaves out food and energy, was 3.0%, while experts expected 3.3%.
• Core prices rose 0.2% in the month, against a forecast of 0.3%.
So prices are still rising, but more slowly than people feared.
Why did Bitcoin care?
Think of it this way. Higher interest rates make safe things, like government bonds, look better. That pulls money away from risky things, like Bitcoin. Lower rate fears do the opposite.
After the report, the chance of an October Fed rate hike fell to about 35%. The Fed already raised rates by 0.25 percentage points earlier this month, so traders were nervous about another hike.
Bond yields also dipped a little. The 10-year yield fell from about 5.234% to about 5.203%. That took a bit of pressure off Bitcoin.
What did the price do?
Bitcoin hit a high of $85,598.94. Before the report, it was trading around $83,000 to $84,000. More than $75 million of short bets were wiped out within an hour. A short is a bet that the price will fall. When the price rises instead, those traders are forced to buy back, and that pushes the price up even more.
But here is the honest part
The move did not hold. Bitcoin gave back some gains and settled near $84,000. I think that is worth knowing.
Also, 3.0% core inflation is still well above the Fed's 2% target. Consumer spending was strong too, and strong spending can keep prices from falling quickly. Some analysts also say a change in how the data is measured helped make the number look cooler.
What I am watching next
• Whether Bitcoin can get back above the $87,000 area.
• Friday's jobs report, the last big data release before the Fed meets.
• Whether the Fed really holds off on another hike.
Today was a good day for Bitcoin. But one report does not change the whole story. I will keep watching the data, and I hope you will too.
#BTC #BTC走势分析

Zyn_trix
·
--
Рост$BTC — BITCOIN MARKET SETUP
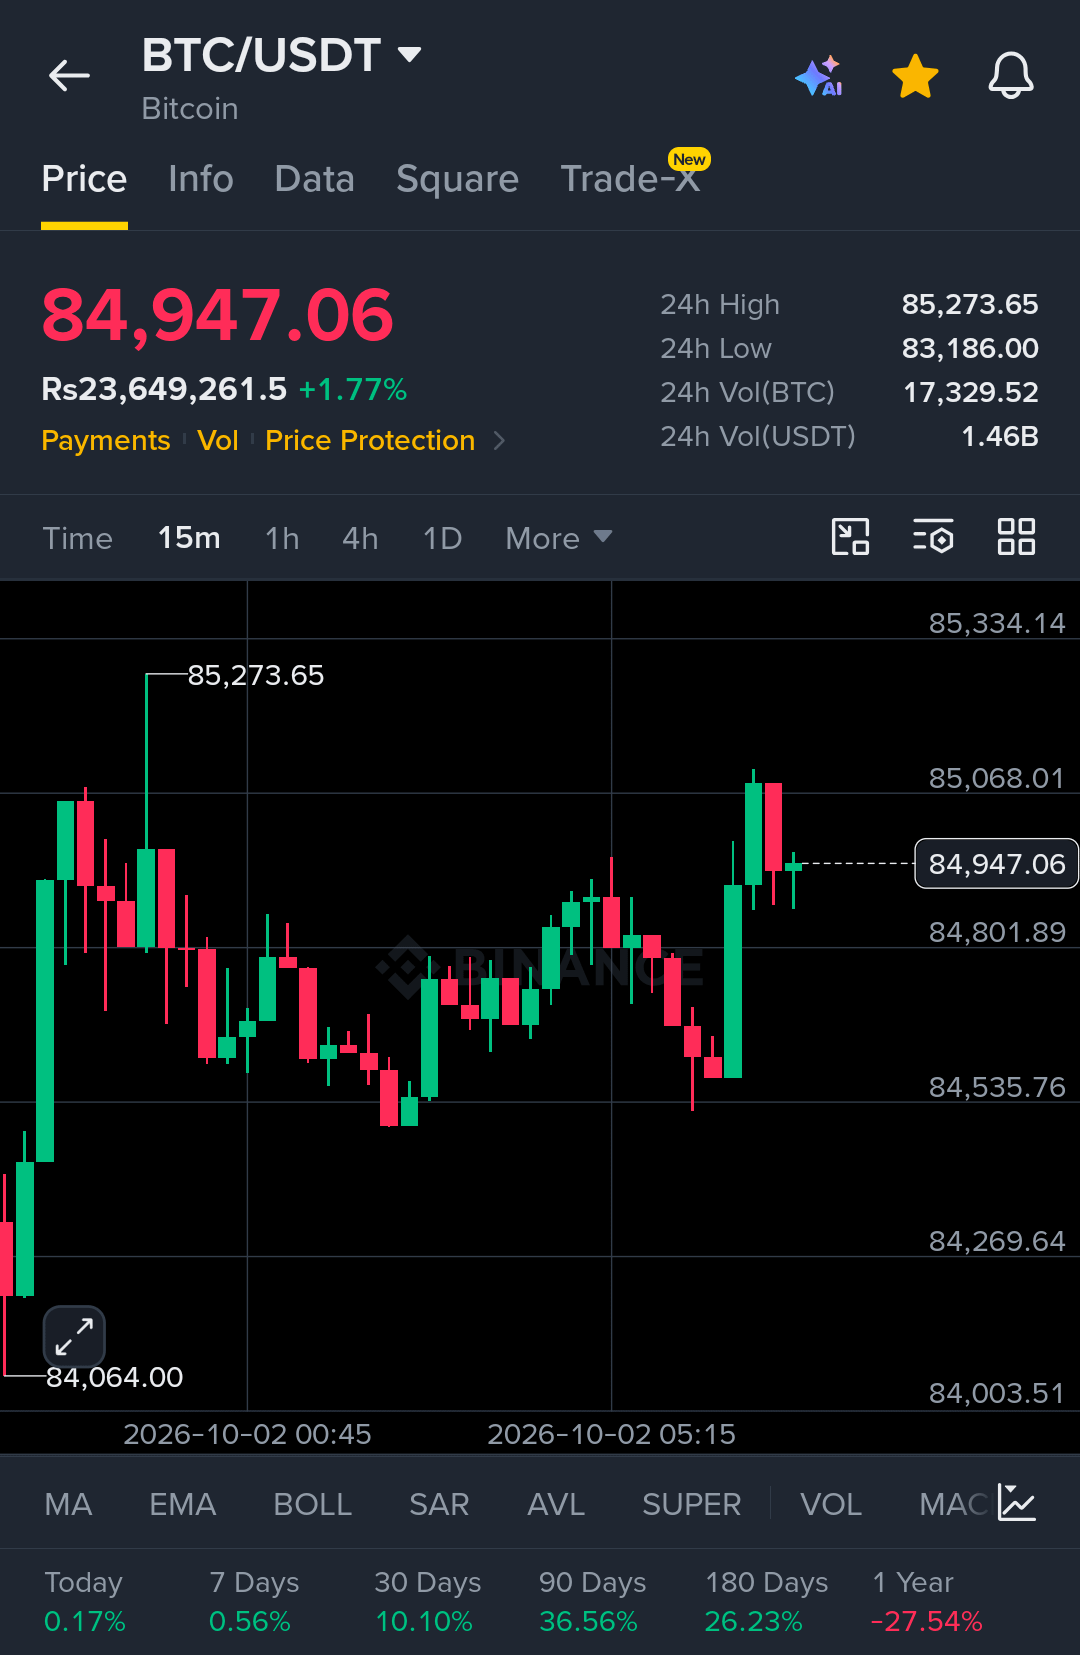
Bitcoin is holding near $84,947 after a strong recovery from the $84,535 area. The 15M chart shows fresh buying activity, with price pushing back toward the $85,068 resistance zone and recently testing $85,273.
Entry: $84,850 – $84,980
TP1: $85,270
TP2: $85,600
TP3: $86,000
SL: $84,500
Key levels are clearly defined, with $85,270 acting as the important nearby level to watch. Keep the position controlled and respect the stop-loss if the setup weakens.
Trade with a plan. Manage your risk.
Let's go and Trade now $BTC
Bitcoin is holding near $84,947 after a strong recovery from the $84,535 area. The 15M chart shows fresh buying activity, with price pushing back toward the $85,068 resistance zone and recently testing $85,273.
Entry: $84,850 – $84,980
TP1: $85,270
TP2: $85,600
TP3: $86,000
SL: $84,500
Key levels are clearly defined, with $85,270 acting as the important nearby level to watch. Keep the position controlled and respect the stop-loss if the setup weakens.
Trade with a plan. Manage your risk.
Let's go and Trade now $BTC


Sarat1991
·
--
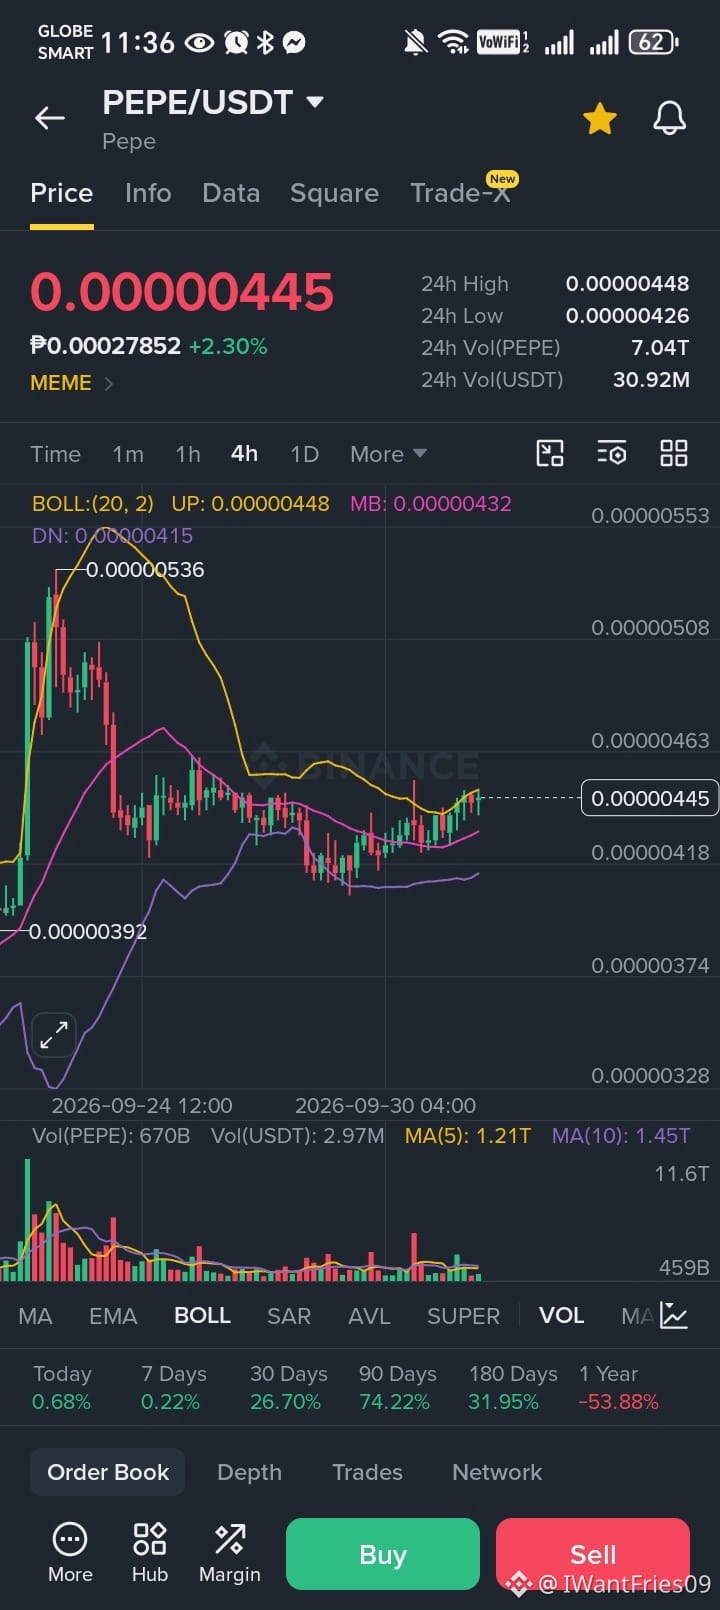
2026 MEME COIN PREDICTIONS.
$PEPE $SHIB $DOGE
#MEME #EtherGains70.9%InQ3 #US10YearYieldNears5.3%
$PEPE $SHIB $DOGE
#MEME #EtherGains70.9%InQ3 #US10YearYieldNears5.3%

CryptoAnix
·
--
Most people don't know
🐕 $SHIB DID ~69,000X.
🐸 $PEPE DID ~398,000X.
Let that sink in. 🤯
From their all-time lows to their all-time highs:
🔥 SHIB → ~6.9 MILLION%
🔥 PEPE → ~39.8 MILLION%
The crazy part?
Most people only notice a coin after it has already exploded. 👀
The real question is:
WHAT WILL BE THE NEXT MEMECOIN TO SHOCK THE MARKET? 🐸🚀
#SHIB
🐕 $SHIB DID ~69,000X.
🐸 $PEPE DID ~398,000X.
Let that sink in. 🤯
From their all-time lows to their all-time highs:
🔥 SHIB → ~6.9 MILLION%
🔥 PEPE → ~39.8 MILLION%
The crazy part?
Most people only notice a coin after it has already exploded. 👀
The real question is:
WHAT WILL BE THE NEXT MEMECOIN TO SHOCK THE MARKET? 🐸🚀
#SHIB



syed ali ahmed
·
--
$PEPE Coin Price Forecast ⚡🔥🚀
If you invest $ 1,000.00 in Pepe Coin today and hold until Jan 16, 2027, our prediction suggests you could see a potential profit of $ 1,778.87, reflecting a 177.89% ROI over the next 185 days.
The coin would be a profitable asset in the short term, even though it might have strong fundamentals.
Price Prediction 2026
According to the technical analysis of prices expected in 2026, the minimum cost of will be $0.00000452. The maximum level that the PEPE price can reach is $0.000002760. The average trading price is expected around $0.000002188.
Price Prediction 2027
After the analysis of the prices of in previous years, it is assumed that in 2027, the minimum price of will be around $0.00001402 The maximum expected PEPE price may be around $0.00002917. On average, the trading price might be $0.0002246 in 2026.
Price Prediction 2028
Based on the technical analysis by cryptocurrency experts regarding the prices of , in 2028, PEPE is expected to have the following minimum and maximum prices: about $0.0039 and $0.0046, respectively. The average expected trading cost is $0.0040.
Price Prediction 2029
The experts in the field of cryptocurrency have analyzed the prices of and their fluctuations during the previous years. It is assumed that in 2029, the minimum PEPE price might drop to $0.0056, while its maximum can reach $0.0067. On average, the trading cost will be around $0.0058.
Stay tuned for more updates ❤
#pepe
If you invest $ 1,000.00 in Pepe Coin today and hold until Jan 16, 2027, our prediction suggests you could see a potential profit of $ 1,778.87, reflecting a 177.89% ROI over the next 185 days.
The coin would be a profitable asset in the short term, even though it might have strong fundamentals.
Price Prediction 2026
According to the technical analysis of prices expected in 2026, the minimum cost of will be $0.00000452. The maximum level that the PEPE price can reach is $0.000002760. The average trading price is expected around $0.000002188.
Price Prediction 2027
After the analysis of the prices of in previous years, it is assumed that in 2027, the minimum price of will be around $0.00001402 The maximum expected PEPE price may be around $0.00002917. On average, the trading price might be $0.0002246 in 2026.
Price Prediction 2028
Based on the technical analysis by cryptocurrency experts regarding the prices of , in 2028, PEPE is expected to have the following minimum and maximum prices: about $0.0039 and $0.0046, respectively. The average expected trading cost is $0.0040.
Price Prediction 2029
The experts in the field of cryptocurrency have analyzed the prices of and their fluctuations during the previous years. It is assumed that in 2029, the minimum PEPE price might drop to $0.0056, while its maximum can reach $0.0067. On average, the trading cost will be around $0.0058.
Stay tuned for more updates ❤
#pepe


未來加密貨幣 06
·
--
$PEPE HOLD
PEPE is holding strong with buyers defending the current zone. Stay patient and watch for the next breakout.
HOLD $PEPE
$SUI
PEPE is holding strong with buyers defending the current zone. Stay patient and watch for the next breakout.
HOLD $PEPE
$SUI

CRX Crypto
·
--
$PEPE could surprise everyone 🐸🔥
Buy and hold $PEPE ✅
$1 dream is still alive 💪🚀
#pepe #crypto #memecoin🚀🚀🚀
Buy and hold $PEPE ✅
$1 dream is still alive 💪🚀
#pepe #crypto #memecoin🚀🚀🚀

Zyn_trix
·
--
Рост$PEPE — The frog is moving again.
Who caught $PEPE from my earlier call?
PEPE has been showing renewed momentum, with the token recently trading around the $0.0000044 area and a market cap around $1.8B. 24H trading volume remains hundreds of millions of dollars, showing that liquidity and market attention are still significant.
The bigger story is the community-driven meme narrative. PEPE remains one of the most closely watched meme assets, and recent whale-flow data showed more PEPE leaving tracked exchanges than entering them, although that flow alone does not guarantee future price appreciation.
And then there is the question everyone keeps asking:
Could ever reach $1?
With roughly 413–421 trillion tokens in circulation depending on the data source, a $1 PEPE would imply a market capitalization in the hundreds of trillions of dollars. That makes $1 an extremely speculative hypothetical rather than a realistic near-term target under today's supply structure.
That’s exactly why the interesting story is not simply "$1."
The real question is how far PEPE can reprice if meme-coin liquidity, Bitcoin strength, retail participation and social attention all accelerate together.
PEPE remains highly volatile and fundamentally different from utility-focused crypto assets. Its value is heavily tied to market demand, liquidity and the strength of its meme/community narrative.
The frog doesn't need a $1 price to make a major move.
The numbers will tell the story.
Who is still holding $PEPE
Who caught $PEPE from my earlier call?
PEPE has been showing renewed momentum, with the token recently trading around the $0.0000044 area and a market cap around $1.8B. 24H trading volume remains hundreds of millions of dollars, showing that liquidity and market attention are still significant.
The bigger story is the community-driven meme narrative. PEPE remains one of the most closely watched meme assets, and recent whale-flow data showed more PEPE leaving tracked exchanges than entering them, although that flow alone does not guarantee future price appreciation.
And then there is the question everyone keeps asking:
Could ever reach $1?
With roughly 413–421 trillion tokens in circulation depending on the data source, a $1 PEPE would imply a market capitalization in the hundreds of trillions of dollars. That makes $1 an extremely speculative hypothetical rather than a realistic near-term target under today's supply structure.
That’s exactly why the interesting story is not simply "$1."
The real question is how far PEPE can reprice if meme-coin liquidity, Bitcoin strength, retail participation and social attention all accelerate together.
PEPE remains highly volatile and fundamentally different from utility-focused crypto assets. Its value is heavily tied to market demand, liquidity and the strength of its meme/community narrative.
The frog doesn't need a $1 price to make a major move.
The numbers will tell the story.
Who is still holding $PEPE

ZyCrypto
·
--
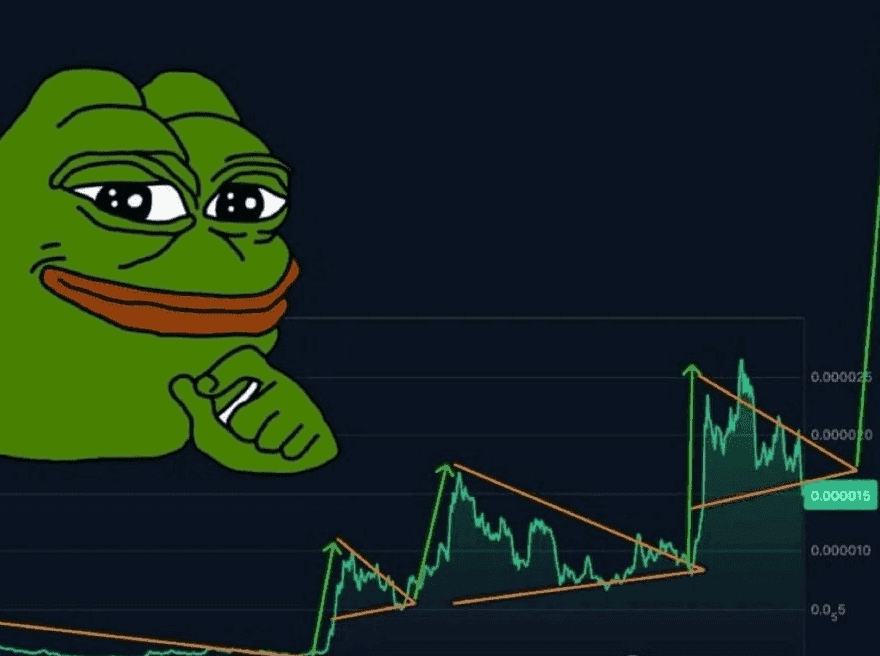
Renewed Whale Activity Puts PEPE Bulls Back in Focus At $0.0000044 — Here’s What’s Driving It
Pepe is drawing significant interest from traders entering the meme coin market, attracted by renewed whale participation. That is according to a revelation disclosed by market analyst Whale Factor. The expert shared data showing that PEPE has surged 42.7% in the last seven days, a strong uptick driven by whales re-entering the market.
The data also showed that renewed activity among large holders (whales) has enabled the asset to break through major resistance levels. The meme coin, inspired by the Frog ‘internet meme ’, is back in the spotlight, capturing strong trading activity.
Giants awakened amid price drop
Since August 24 last month, PEPE has fallen sharply, hitting a low of $0.00000320 and remaining in a downtrend. The drastic drop over the past two weeks was followed by a sudden rise, signaling that whales have been taking advantage of the dip to accumulate tokens in large numbers. With continued whale accumulation, the asset has recovered notably, aligning with the broader crypto market and attracting enthusiasm from retail traders.
After the recent sharp price drop, whales began buying large quantities at a discount. As a result, the ongoing accumulation pumped the price up and created FOMO by attracting retail investors into the market.
Since September 16, PEPE has been in an uptrend, rising from a low of $0.00000333 and reaching $0.0000046 by September 22 this week on Tuesday. Today, it trades at $0.0000046, up 22.6% and 30.8% over the past seven days and two weeks, suggesting increased buying activity as buyers expand their holdings for future growth.
PEPE gearing up for its next uptrend
The current development in the Pepe market is interesting. It’s intriguing because as whales buy large amounts of tokens, they not only drive the price up, but also force weak hands to panic-buy. And therefore, based on the ongoing engagement, PEPE appears to be preparing for the next big leap.
The asset is laying the foundation for its next rally, as on-chain analysis shows renewed whale accumulation, a potential PEPE ETF greenlight, and a possible massive token buyback initiative has been talked about across social media in recent days. The ETF buzz refers to an application filed by Canary Capital back on April 25, which awaits possible regulatory approval. Also, a token buyback development is being linked to a community proposal, which awaits confirmation and a timeline to be communicated by the Pepe team.
The data also showed that renewed activity among large holders (whales) has enabled the asset to break through major resistance levels. The meme coin, inspired by the Frog ‘internet meme ’, is back in the spotlight, capturing strong trading activity.
Giants awakened amid price drop
Since August 24 last month, PEPE has fallen sharply, hitting a low of $0.00000320 and remaining in a downtrend. The drastic drop over the past two weeks was followed by a sudden rise, signaling that whales have been taking advantage of the dip to accumulate tokens in large numbers. With continued whale accumulation, the asset has recovered notably, aligning with the broader crypto market and attracting enthusiasm from retail traders.
After the recent sharp price drop, whales began buying large quantities at a discount. As a result, the ongoing accumulation pumped the price up and created FOMO by attracting retail investors into the market.
Since September 16, PEPE has been in an uptrend, rising from a low of $0.00000333 and reaching $0.0000046 by September 22 this week on Tuesday. Today, it trades at $0.0000046, up 22.6% and 30.8% over the past seven days and two weeks, suggesting increased buying activity as buyers expand their holdings for future growth.
PEPE gearing up for its next uptrend
The current development in the Pepe market is interesting. It’s intriguing because as whales buy large amounts of tokens, they not only drive the price up, but also force weak hands to panic-buy. And therefore, based on the ongoing engagement, PEPE appears to be preparing for the next big leap.
The asset is laying the foundation for its next rally, as on-chain analysis shows renewed whale accumulation, a potential PEPE ETF greenlight, and a possible massive token buyback initiative has been talked about across social media in recent days. The ETF buzz refers to an application filed by Canary Capital back on April 25, which awaits possible regulatory approval. Also, a token buyback development is being linked to a community proposal, which awaits confirmation and a timeline to be communicated by the Pepe team.

Sarat1991
·
--
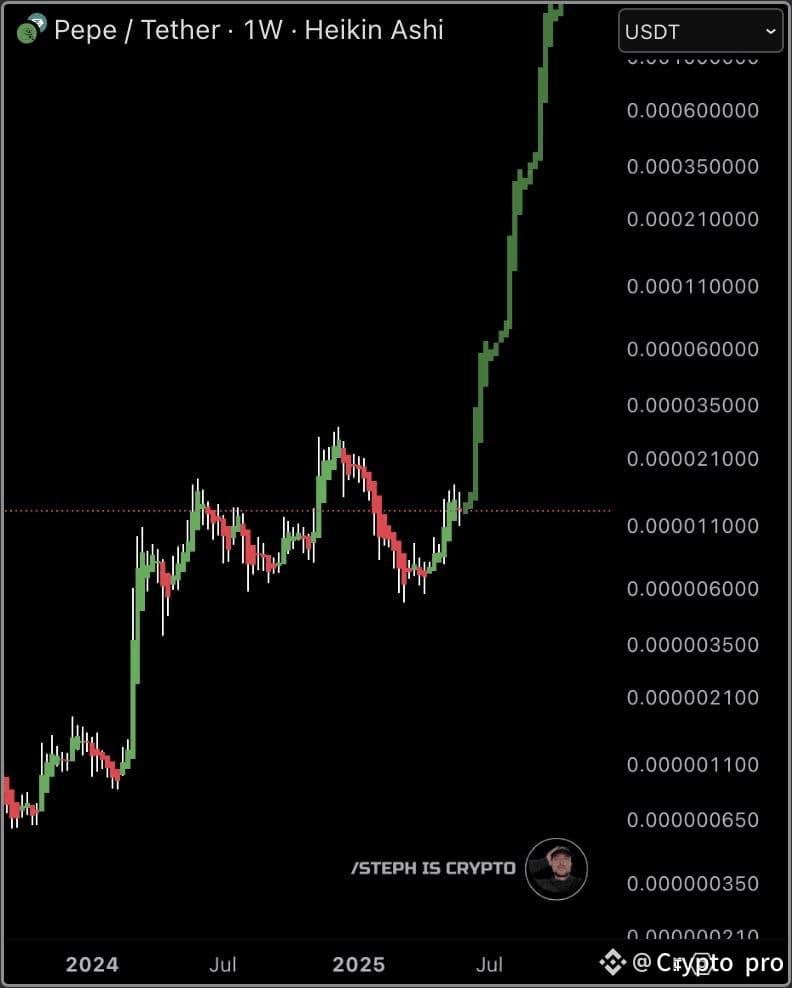
shib & pepe Coins Price Today September 30.
$PEPE $SHIB $DOGE
#PEPE #AltcoinSeasonIndexHoldsAbove60For5Days #USADPAdds90000JobsInSeptember #USCorePCEEasesTo3%InAugust #KospiPostsWorstQuarterSince2020
$PEPE $SHIB $DOGE
#PEPE #AltcoinSeasonIndexHoldsAbove60For5Days #USADPAdds90000JobsInSeptember #USCorePCEEasesTo3%InAugust #KospiPostsWorstQuarterSince2020



Shankar Khurana
·
--
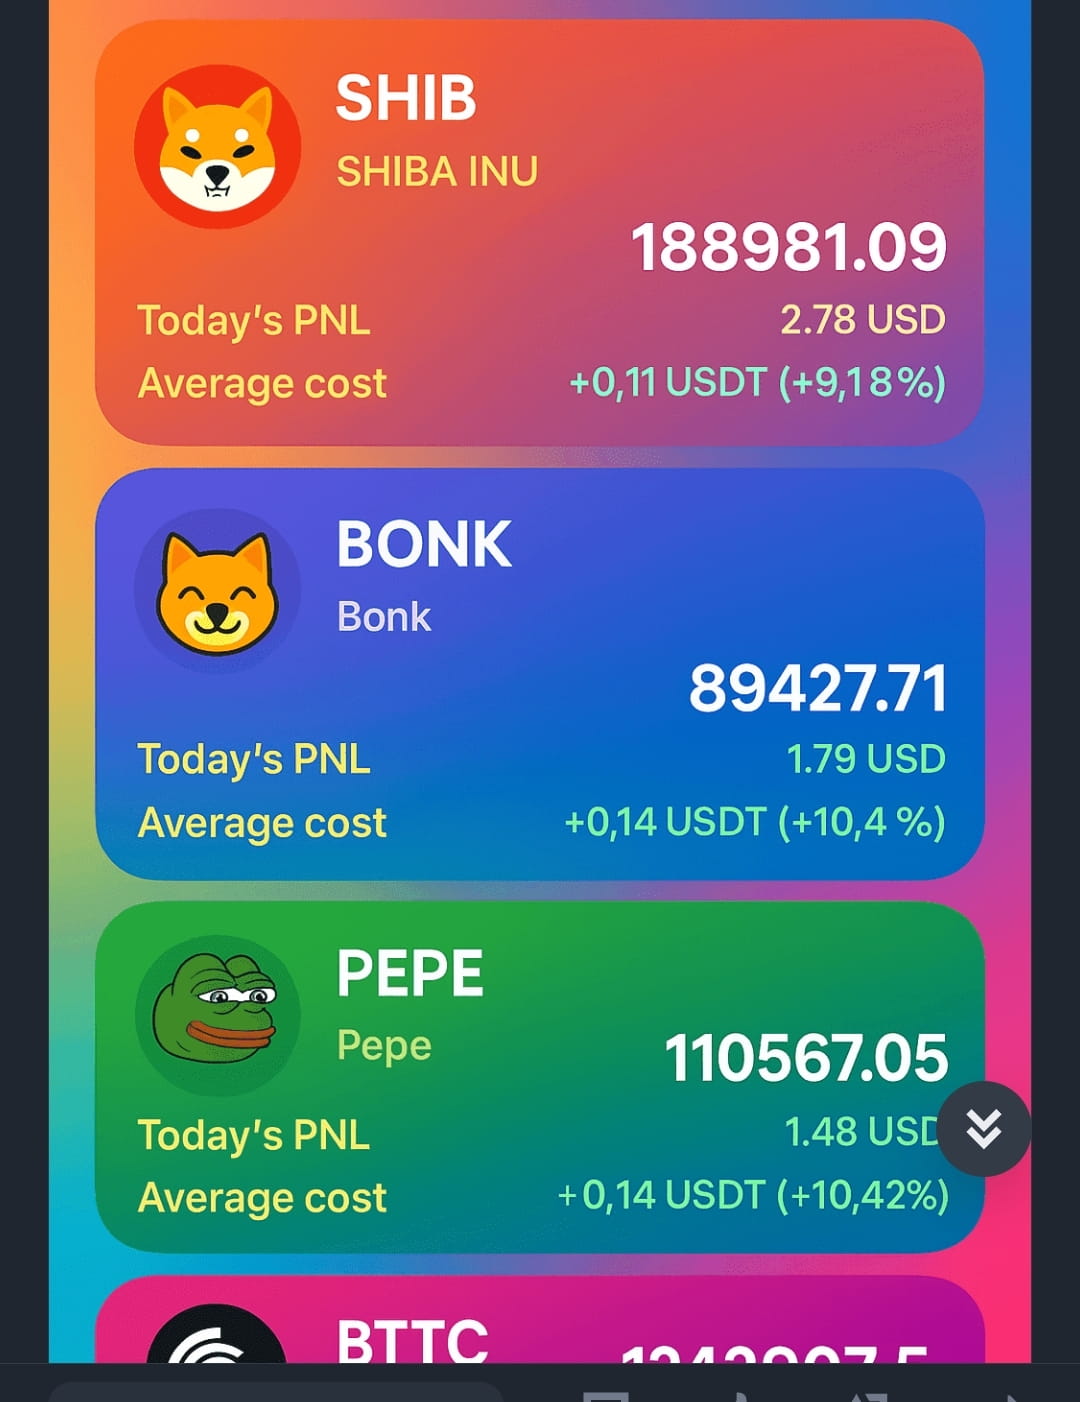
РостWho has received these tokens for free? Comment below
Who? $SHIB $BONK $PEPE #BTTC
Who? $SHIB $BONK $PEPE #BTTC

Adeel Ur Rehman Chaudhry
·
--
How to Buy the Dip in Trading — The Smart Way
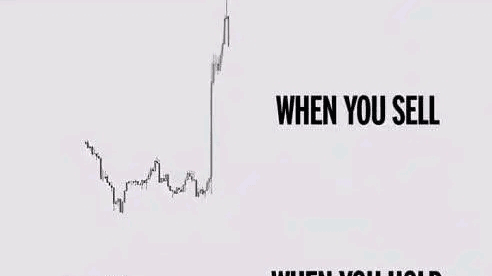
“Buy the dip” is one of the most popular strategies in the trading world—but also one of the most misunderstood. Done right, it can be a powerful way to accumulate assets at a discount and profit from rebounds. Done wrong, it can trap you in a losing trade as prices continue to fall.
So how do you actually buy the dip smartly? Let’s break it down.
1. Understand the Market Context
Not very dip is worth buying.
Before jumping in, ask:
Is this a short-term pullback in a strong trend?Or the start of a deeper correction or bear market
Use a mix of:
Technical analysis (trendlines, moving averages)Fundamentals (news, earnings, macro trends)Sentiment (fear/greed index, social volume)
The key is context. Don’t blindly buy a red candle—understand why the asset is dipping.
2. Identify Key Support Levels
Support levels are where prices often pause or bounce.
Look for:
Historical support zonesMoving averages (like 50-day or 200-day MA)Fibonacci retracement levelsVolume profile or order blocks
These zones act like magnets for buyers—if the asset holds here, it’s a solid dip-buying opportunity.
3. Confirm It’s a Dip, Not a Breakdown
A dip is temporary. A breakdown is a trend reversal. Know the difference.
Check indicators like:
RSI (Relative Strength Index) – is it oversold?MACD – any signs of bullish divergence or a crossover?
Also, watch the candlestick structure—look for signs of strength (hammers, bullish engulfing) before you jump in.
4. Scale Into Your Position
Timing the bottom is nearly impossible.
Instead of going all-in at once:
Use dollar-cost averaging (DCA)Buy in tranches as price dips into your target zoneKeep cash in reserve in case of further downside
This smooths out your entry and reduces risk.
5. Set a Stop-Loss
Risk management is non-negotiable.
Place a stop-loss just below your support level or invalidation point.
This way, if you're wrong, you limit your downside and live to trade another day.
Remember: Cut losses fast, let winners run.
6. Have an Exit Strategy
Don’t just plan your entry—plan your exit too.
Options include:
Predefined price targetsTrailing stop-losses to lock in profitsScaling out as price hits resistance zones
Greed kills profits. Stick to your plan.
Final Thoughts
Buying the dip isn’t about being lucky—it’s about being prepared. With a clear plan, proper tools, and strict discipline, it can be one of the most powerful plays in your trading toolkit.
Good luck, and trade safe!
$BTTC $TURBO me
So how do you actually buy the dip smartly? Let’s break it down.
1. Understand the Market Context
Not very dip is worth buying.
Before jumping in, ask:
Is this a short-term pullback in a strong trend?Or the start of a deeper correction or bear market
Use a mix of:
Technical analysis (trendlines, moving averages)Fundamentals (news, earnings, macro trends)Sentiment (fear/greed index, social volume)
The key is context. Don’t blindly buy a red candle—understand why the asset is dipping.
2. Identify Key Support Levels
Support levels are where prices often pause or bounce.
Look for:
Historical support zonesMoving averages (like 50-day or 200-day MA)Fibonacci retracement levelsVolume profile or order blocks
These zones act like magnets for buyers—if the asset holds here, it’s a solid dip-buying opportunity.
3. Confirm It’s a Dip, Not a Breakdown
A dip is temporary. A breakdown is a trend reversal. Know the difference.
Check indicators like:
RSI (Relative Strength Index) – is it oversold?MACD – any signs of bullish divergence or a crossover?
Also, watch the candlestick structure—look for signs of strength (hammers, bullish engulfing) before you jump in.
4. Scale Into Your Position
Timing the bottom is nearly impossible.
Instead of going all-in at once:
Use dollar-cost averaging (DCA)Buy in tranches as price dips into your target zoneKeep cash in reserve in case of further downside
This smooths out your entry and reduces risk.
5. Set a Stop-Loss
Risk management is non-negotiable.
Place a stop-loss just below your support level or invalidation point.
This way, if you're wrong, you limit your downside and live to trade another day.
Remember: Cut losses fast, let winners run.
6. Have an Exit Strategy
Don’t just plan your entry—plan your exit too.
Options include:
Predefined price targetsTrailing stop-losses to lock in profitsScaling out as price hits resistance zones
Greed kills profits. Stick to your plan.
Final Thoughts
Buying the dip isn’t about being lucky—it’s about being prepared. With a clear plan, proper tools, and strict discipline, it can be one of the most powerful plays in your trading toolkit.
Good luck, and trade safe!
$BTTC $TURBO me

James jam12 jon
·
--
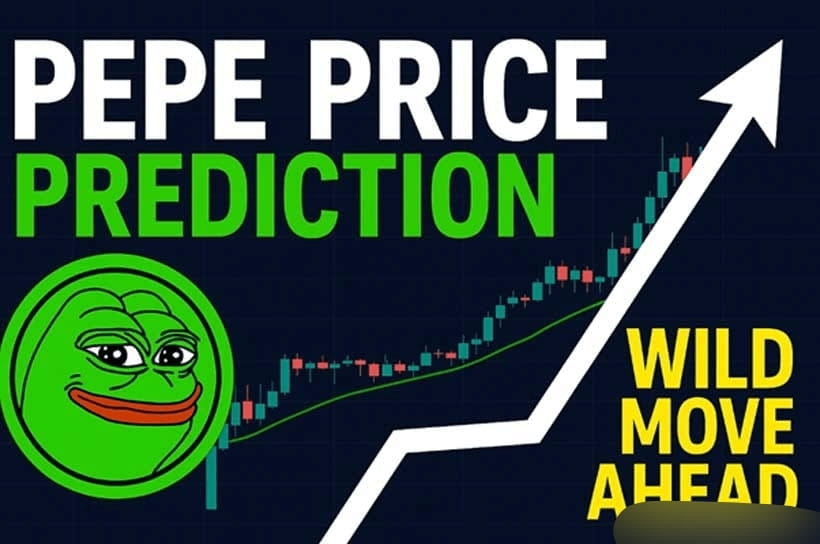
💥🚀🚀🚀$PEPE Coin Price Prediction💥🚀🚀🚀
Binance Rank: #29
Total & Circulating Supply: 420.69 Trillion PEPE
Current Market Cap: $3.74 Billion
All-Time High Price: $0.00002825
All-Time High Market Cap: $11.88 Billion
All-Time Low Price: $0.00000000001063
All-Time Low Market Cap: $4.47K
Future Price Projections:
At $0.0001, Market Cap = $42.06 Billion
At $0.001, Market Cap = $420.69 Billion
At $0.01, Market Cap = $4.206 Trillion
Can PEPE reach these heights? The numbers are bold — the community, even bolder.
#PEPECoin #MemeCoinSeason #CryptoPrediction #PEPEtoTheMoon
Binance Rank: #29
Total & Circulating Supply: 420.69 Trillion PEPE
Current Market Cap: $3.74 Billion
All-Time High Price: $0.00002825
All-Time High Market Cap: $11.88 Billion
All-Time Low Price: $0.00000000001063
All-Time Low Market Cap: $4.47K
Future Price Projections:
At $0.0001, Market Cap = $42.06 Billion
At $0.001, Market Cap = $420.69 Billion
At $0.01, Market Cap = $4.206 Trillion
Can PEPE reach these heights? The numbers are bold — the community, even bolder.
#PEPECoin #MemeCoinSeason #CryptoPrediction #PEPEtoTheMoon
HOSAM HASHEM
·
--
Рост$PEPE $FLOKI
تحليل وتقييم عملة PEPE & FLOKI
عودة القيمة السوقية للعملات الرقمية إلى 3 تريليون دولار... هذا هو السبب في أن PEPE و FLOKI قد لا يصلان إلى 0.0001 دولار أبدًا. الاستثمار فيها على المدى الطويل مضيعة للوقت لكن يمكن الاستفادة منها وجني ارباح على المدى القصير
يبلغ المعروض المتداول لـ PEPE وحده 421 تريليون دولار، بينما يبلغ المعروض ل FLOKI ـ 9.66 تريليون دولار.
هذا المعروض الهائل يجعل من رفع الأسعار أمرًا مستحيلًا. وكما هو الحال في الاقتصاد ، فإن زيادة العرض عن الطلب تُخفض السعر.
لكي يصل PEPE أو FLOKI إلى دولار واحد، يجب أن تساوي قيمتهما السوقية المعروض المتداول. بينما يبلغ المعروض المتداول لسوق العملات الرقمية بأكمله 3 تريليون دولار
تحليل وتقييم عملة PEPE & FLOKI
عودة القيمة السوقية للعملات الرقمية إلى 3 تريليون دولار... هذا هو السبب في أن PEPE و FLOKI قد لا يصلان إلى 0.0001 دولار أبدًا. الاستثمار فيها على المدى الطويل مضيعة للوقت لكن يمكن الاستفادة منها وجني ارباح على المدى القصير
يبلغ المعروض المتداول لـ PEPE وحده 421 تريليون دولار، بينما يبلغ المعروض ل FLOKI ـ 9.66 تريليون دولار.
هذا المعروض الهائل يجعل من رفع الأسعار أمرًا مستحيلًا. وكما هو الحال في الاقتصاد ، فإن زيادة العرض عن الطلب تُخفض السعر.
لكي يصل PEPE أو FLOKI إلى دولار واحد، يجب أن تساوي قيمتهما السوقية المعروض المتداول. بينما يبلغ المعروض المتداول لسوق العملات الرقمية بأكمله 3 تريليون دولار



Войдите, чтобы посмотреть больше материала