
mrWH
15 Публикации

mrWH
Отправить жалобу
Заблокировать пользователя
10 подписок(и/а)
0 подписчиков(а)
2 понравилось
Посты
·
--
{spot}(BNBUSDT)
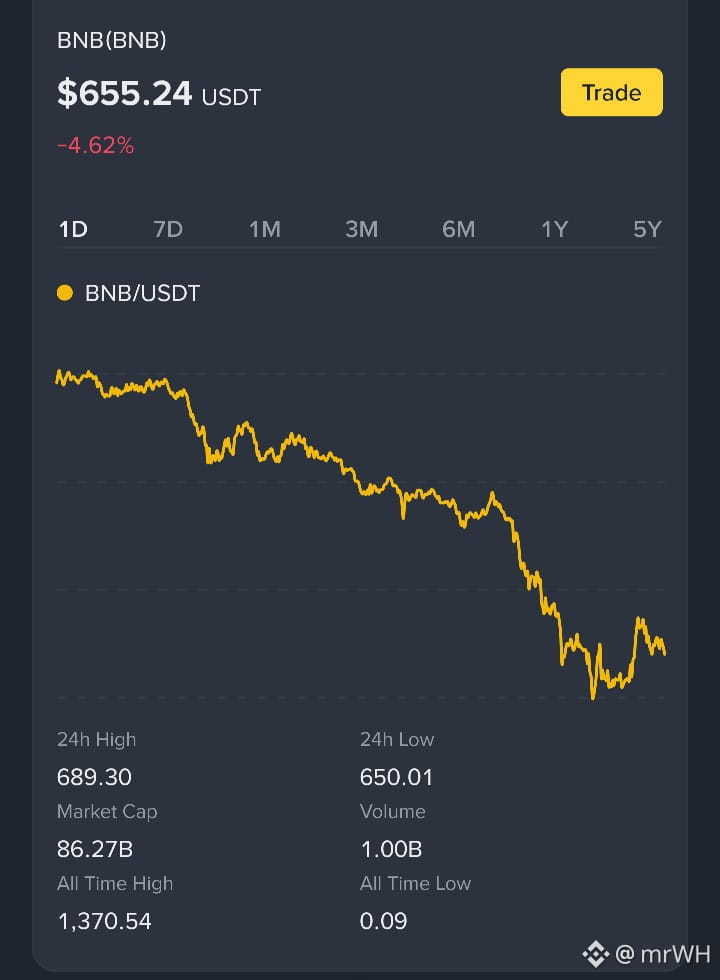
#BNB smart analysis — BNBUSDT
Executive view: The chart structure remains weak, although the latest 1-day move is nearly flat. BNB is trading below its key daily moving averages, while momentum indicators remain soft. Short-term oversold readings mean volatility can stay elevated; they do not establish a reversal.
Chart read
Live spot price: $655.50
24h range: $650.01–$689.30
4h chart: 59 closed candles, from Nov 2–12 UTC
Over that chart window, BNB moved from $699.25 to $654.57, a 6.39% decline.
The latest closed 4h candle was O $664.40 / H $665.24 / L $650.01 / C $654.57.
Recent performance from spot data: +0.15% over 1 day, −4.86% over 7 days, and −11.89% over 30 days.
Technical structure
Using the 1-day indicators:
BNB is below EMA 7: $689.06, EMA 25: $710.31, and EMA 99: $706.30.
The daily Bollinger lower band is $662.93; the live price is below it.
RSI 6: 33.06 and RSI 12: 36.75 show weak momentum, but not the extreme hourly readings in the stored research report.
MACD DIF: −2.2973, consistent with negative momentum.
Observed chart references are the recent low near $650.01, the daily lower band at $662.93, and the EMA cluster around $689–$710. These are historical reference levels, not trade instructions.
Flow and research context
The latest 4h large-order capital-flow block shows net inflow of 1,402.49 BNB.
The stored research report describes a different earlier snapshot with cumulative spot outflows above $25 million and large-order selling above $11.5 million in its final four-hour segment. Because the snapshots and timing differ, I would not merge them into one flow signal.
The report also recorded hourly RSI 6 at 5.39 and hourly RSI 12 at 14.55, indicating much more extreme short-term exhaustion at that report snapshot. The newer daily readings are less extreme.
Binance Square community poll
The limited Square poll shows:
Bearish: 218 of 379 votes, 57.5%
Bullish: 161 of 379 votes, 42.5%
This is a changing, limited community sample—not a measurement of overall market sentiment or a representative survey.
#BNB smart analysis — BNBUSDT
Executive view: The chart structure remains weak, although the latest 1-day move is nearly flat. BNB is trading below its key daily moving averages, while momentum indicators remain soft. Short-term oversold readings mean volatility can stay elevated; they do not establish a reversal.
Chart read
Live spot price: $655.50
24h range: $650.01–$689.30
4h chart: 59 closed candles, from Nov 2–12 UTC
Over that chart window, BNB moved from $699.25 to $654.57, a 6.39% decline.
The latest closed 4h candle was O $664.40 / H $665.24 / L $650.01 / C $654.57.
Recent performance from spot data: +0.15% over 1 day, −4.86% over 7 days, and −11.89% over 30 days.
Technical structure
Using the 1-day indicators:
BNB is below EMA 7: $689.06, EMA 25: $710.31, and EMA 99: $706.30.
The daily Bollinger lower band is $662.93; the live price is below it.
RSI 6: 33.06 and RSI 12: 36.75 show weak momentum, but not the extreme hourly readings in the stored research report.
MACD DIF: −2.2973, consistent with negative momentum.
Observed chart references are the recent low near $650.01, the daily lower band at $662.93, and the EMA cluster around $689–$710. These are historical reference levels, not trade instructions.
Flow and research context
The latest 4h large-order capital-flow block shows net inflow of 1,402.49 BNB.
The stored research report describes a different earlier snapshot with cumulative spot outflows above $25 million and large-order selling above $11.5 million in its final four-hour segment. Because the snapshots and timing differ, I would not merge them into one flow signal.
The report also recorded hourly RSI 6 at 5.39 and hourly RSI 12 at 14.55, indicating much more extreme short-term exhaustion at that report snapshot. The newer daily readings are less extreme.
Binance Square community poll
The limited Square poll shows:
Bearish: 218 of 379 votes, 57.5%
Bullish: 161 of 379 votes, 42.5%
This is a changing, limited community sample—not a measurement of overall market sentiment or a representative survey.
Executive view: The chart structure remains weak, although the latest 1-day move is nearly flat. BNB is trading below its key daily moving averages, while momentum indicators remain soft. Short-term oversold readings mean volatility can stay elevated; they do not establish a reversal.
Chart read
Live spot price: $655.50
24h range: $650.01–$689.30
4h chart: 59 closed candles, from Nov 2–12 UTC
Over that chart window, BNB moved from $699.25 to $654.57, a 6.39% decline.
The latest closed 4h candle was O $664.40 / H $665.24 / L $650.01 / C $654.57.
Recent performance from spot data: +0.15% over 1 day, −4.86% over 7 days, and −11.89% over 30 days.
Technical structure
Using the 1-day indicators:
BNB is below EMA 7: $689.06, EMA 25: $710.31, and EMA 99: $706.30.
The daily Bollinger lower band is $662.93; the live price is below it.
RSI 6: 33.06 and RSI 12: 36.75 show weak momentum, but not the extreme hourly readings in the stored research report.
MACD DIF: −2.2973, consistent with negative momentum.
Observed chart references are the recent low near $650.01, the daily lower band at $662.93, and the EMA cluster around $689–$710. These are historical reference levels, not trade instructions.
Flow and research context
The latest 4h large-order capital-flow block shows net inflow of 1,402.49 BNB.
The stored research report describes a different earlier snapshot with cumulative spot outflows above $25 million and large-order selling above $11.5 million in its final four-hour segment. Because the snapshots and timing differ, I would not merge them into one flow signal.
The report also recorded hourly RSI 6 at 5.39 and hourly RSI 12 at 14.55, indicating much more extreme short-term exhaustion at that report snapshot. The newer daily readings are less extreme.
Binance Square community poll
The limited Square poll shows:
Bearish: 218 of 379 votes, 57.5%
Bullish: 161 of 379 votes, 42.5%
This is a changing, limited community sample—not a measurement of overall market sentiment or a representative survey.
59
·
--
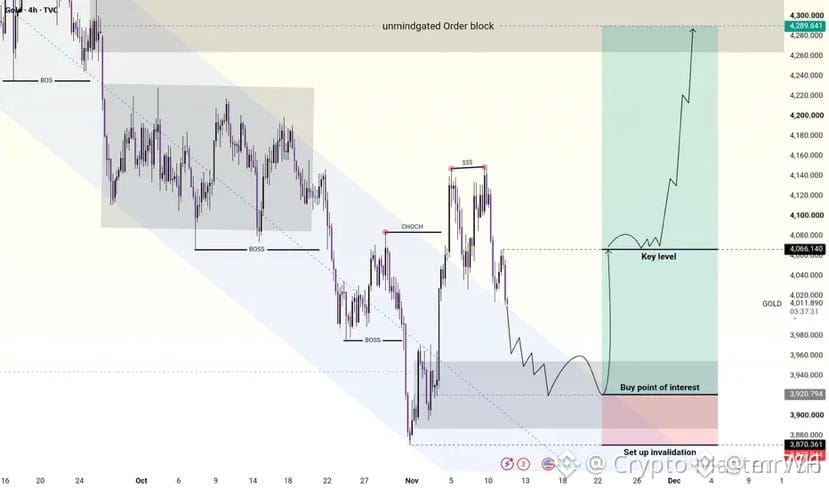
$XAU – Bullish Recovery Ahead? 3,000 Pips in Focus‼️
Attention Traders! Gold is showing bearish pressure near $4,012, with a potential buying opportunity around the $3,920–$3,950 support zone.
If buyers defend this area and reclaim $4,066, Gold could recover toward $4,200–$4,290. A break below $3,870 would weaken the bullish outlook.
What do you think, Fam? Is Gold preparing for a major comeback???
{future}(XAUUSDT)
$XAU – Bullish Recovery Ahead? 3,000 Pips in Focus‼️
Attention Traders! Gold is showing bearish pressure near $4,012, with a potential buying opportunity around the $3,920–$3,950 support zone.
If buyers defend this area and reclaim $4,066, Gold could recover toward $4,200–$4,290. A break below $3,870 would weaken the bullish outlook.
What do you think, Fam? Is Gold preparing for a major comeback???
Attention Traders! Gold is showing bearish pressure near $4,012, with a potential buying opportunity around the $3,920–$3,950 support zone.
If buyers defend this area and reclaim $4,066, Gold could recover toward $4,200–$4,290. A break below $3,870 would weaken the bullish outlook.
What do you think, Fam? Is Gold preparing for a major comeback???
28
·
--
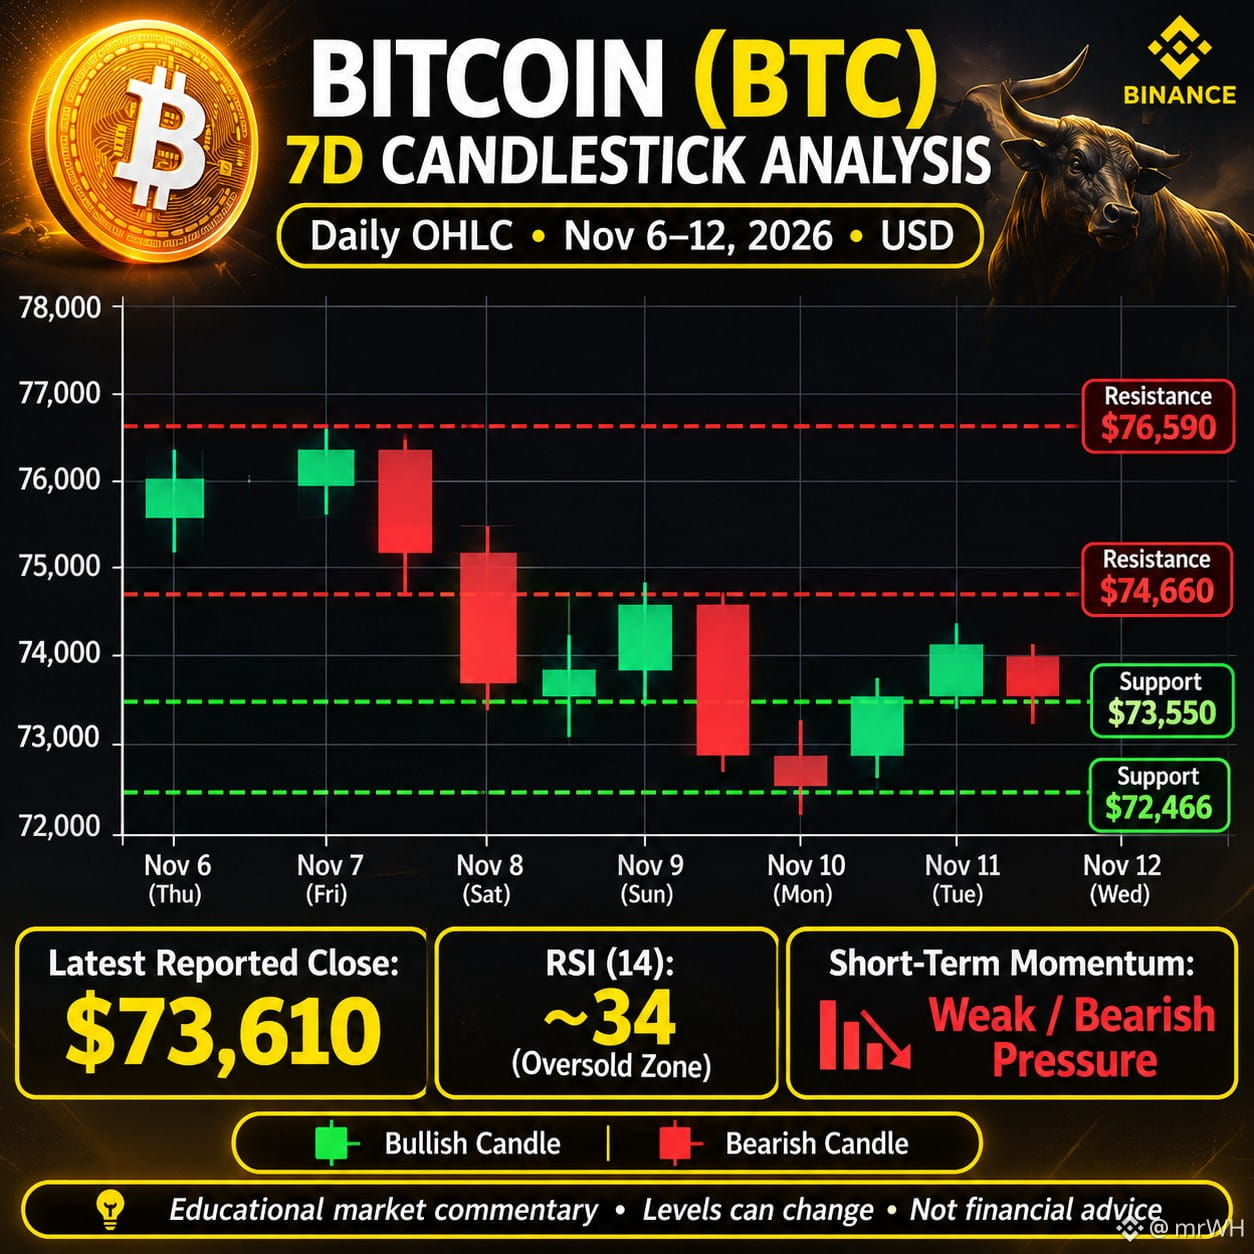
$BTC is facing selling pressure around $73,600. The short-term trend remains weak, with price trading below most major daily moving averages. RSI near 34 suggests weak momentum, although a short-term rebound remains possible.
Key technical levels
Support 1: $73,550
Support 2: $72,466
Resistance 1: $74,660
Resistance 2: $76,590
A sustained move above $74,660 could improve the short-term outlook, while a break below $73,550 could increase downside pressure.
#BTC #AnthropicRejectsIPODelayValuationinQuestion
{spot}(BTCUSDT)
$BTC is facing selling pressure around $73,600. The short-term trend remains weak, with price trading below most major daily moving averages. RSI near 34 suggests weak momentum, although a short-term rebound remains possible.
Key technical levels
Support 1: $73,550
Support 2: $72,466
Resistance 1: $74,660
Resistance 2: $76,590
A sustained move above $74,660 could improve the short-term outlook, while a break below $73,550 could increase downside pressure.
#BTC #AnthropicRejectsIPODelayValuationinQuestion
Key technical levels
Support 1: $73,550
Support 2: $72,466
Resistance 1: $74,660
Resistance 2: $76,590
A sustained move above $74,660 could improve the short-term outlook, while a break below $73,550 could increase downside pressure.
#BTC #AnthropicRejectsIPODelayValuationinQuestion
44
·
--
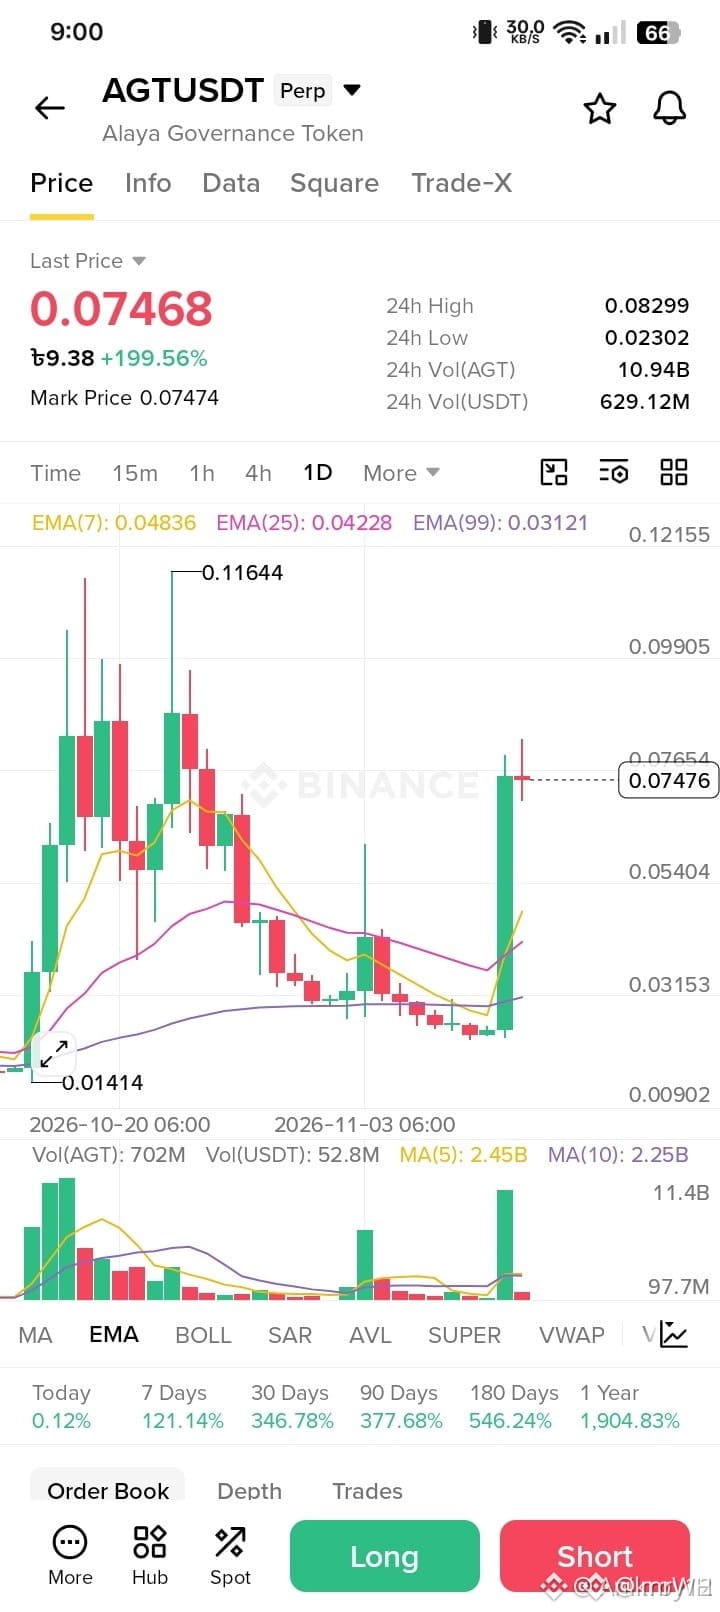
🚨 $AGT — DON'T IGNORE THE MARKET SIGNAL! 📉⚠️
What is happening with $AGT ? 👀
A sudden pump doesn't always mean a strong recovery. Sometimes the market moves up fast, then surprises everyone with a sharp correction! ☠️
Is this a real bullish move, or just a temporary pump before another drop? 🤔
Stay alert, protect your profits, and never make decisions based on hype alone.
💬 What's your opinion on $AGT ?
Are you BULLISH or BEARISH?
@IJ @JJ__ @_BH @hd @I_G
Let's discuss! 🔥
#AGT #CryptoMarket #trading #BinanceSquareFamily #AnthropicRejectsIPODelayValuationinQuestion
{spot}(TRXUSDT)
{future}(AGTUSDT)
{spot}(PEPEUSDT)
🚨 $AGT — DON'T IGNORE THE MARKET SIGNAL! 📉⚠️
What is happening with $AGT ? 👀
A sudden pump doesn't always mean a strong recovery. Sometimes the market moves up fast, then surprises everyone with a sharp correction! ☠️
Is this a real bullish move, or just a temporary pump before another drop? 🤔
Stay alert, protect your profits, and never make decisions based on hype alone.
💬 What's your opinion on $AGT ?
Are you BULLISH or BEARISH?
@IJ @JJ__ @_BH @hd @I_G
Let's discuss! 🔥
#AGT #CryptoMarket #trading #BinanceSquareFamily #AnthropicRejectsIPODelayValuationinQuestion
What is happening with $AGT ? 👀
A sudden pump doesn't always mean a strong recovery. Sometimes the market moves up fast, then surprises everyone with a sharp correction! ☠️
Is this a real bullish move, or just a temporary pump before another drop? 🤔
Stay alert, protect your profits, and never make decisions based on hype alone.
💬 What's your opinion on $AGT ?
Are you BULLISH or BEARISH?
@IJ @JJ__ @_BH @hd @I_G
Let's discuss! 🔥
#AGT #CryptoMarket #trading #BinanceSquareFamily #AnthropicRejectsIPODelayValuationinQuestion

53
·
--
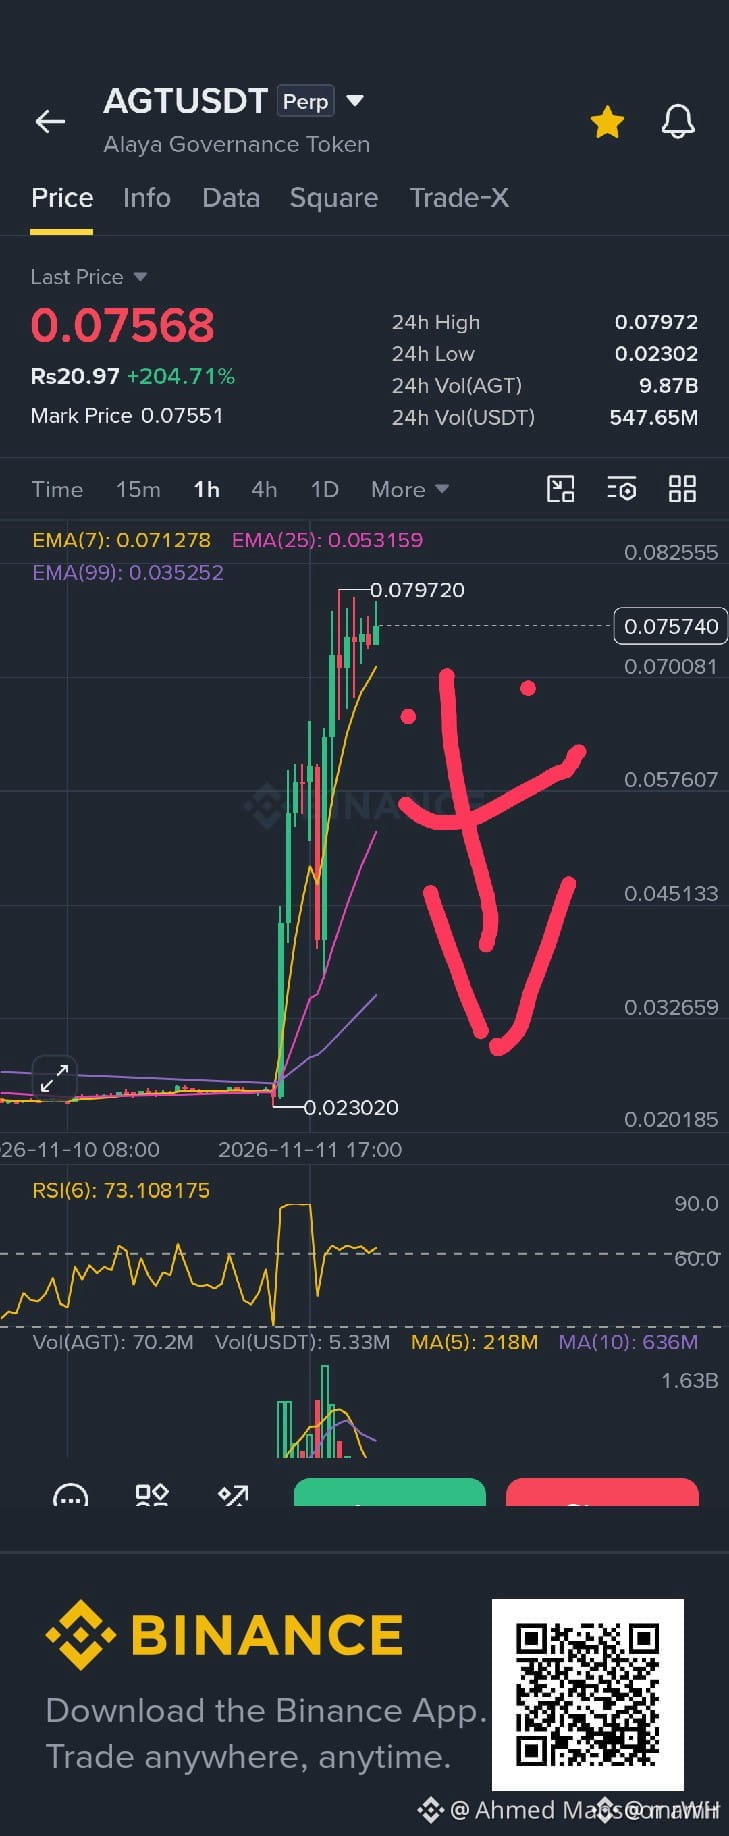
$AGT no power leftover from here any time this coin is going back 🔙 to 🏠 home 🏡🏡
lets drop him to his home with me short this
$AGT
#BinanceSquareTalks #AGT
{future}(AGTUSDT)
$AGT no power leftover from here any time this coin is going back 🔙 to 🏠 home 🏡🏡
lets drop him to his home with me short this
$AGT
#BinanceSquareTalks #AGT
lets drop him to his home with me short this
$AGT
#BinanceSquareTalks #AGT
76
·
--
CPI at 0.4% Broke Bitcoin’s $73,000 Floor. What Happens if the Fed Goes Bigger? X
{spot}(BTCUSDT)
CPI at 0.4% Broke Bitcoin’s $73,000 Floor. What Happens if the Fed Goes Bigger? X
70
·
--
Everyone is talking about Anthropic's IPO right now, but honestly, 1$ Trillion+ valuation in this market feels insane to me 🤯
Tech stocks just got battered this week and Nasdaq took a heavy hit, yet Anthropic is aiming for a record-breaking debut on Nasdaq.
On one side, revenue growth is massive. On the other side, data-center infrastructure costs are eating up margins fast and regulators are watching closely.
I'm torn on this one—does this turn out like the SpaceX listing momentum, or do we see a massive reality check on day one?
What’s your play here, long term hold or quick short? Drop your thoughts below 👇 $ANTHROPIC | $SPCX
{future}(ANTHROPICUSDT)
{future}(SPCXUSDT)
#AnthropicIPO进展
Everyone is talking about Anthropic's IPO right now, but honestly, 1$ Trillion+ valuation in this market feels insane to me 🤯
Tech stocks just got battered this week and Nasdaq took a heavy hit, yet Anthropic is aiming for a record-breaking debut on Nasdaq.
On one side, revenue growth is massive. On the other side, data-center infrastructure costs are eating up margins fast and regulators are watching closely.
I'm torn on this one—does this turn out like the SpaceX listing momentum, or do we see a massive reality check on day one?
What’s your play here, long term hold or quick short? Drop your thoughts below 👇 $ANTHROPIC | $SPCX
#AnthropicIPO进展
Tech stocks just got battered this week and Nasdaq took a heavy hit, yet Anthropic is aiming for a record-breaking debut on Nasdaq.
On one side, revenue growth is massive. On the other side, data-center infrastructure costs are eating up margins fast and regulators are watching closely.
I'm torn on this one—does this turn out like the SpaceX listing momentum, or do we see a massive reality check on day one?
What’s your play here, long term hold or quick short? Drop your thoughts below 👇 $ANTHROPIC | $SPCX
#AnthropicIPO进展

25
·
--
Let’s see if $SOL can drop to $75 again by tomorrow morning this time. What do you think?
{spot}(SOLUSDT)
Let’s see if $SOL can drop to $75 again by tomorrow morning this time. What do you think?
1
1
201
·
--
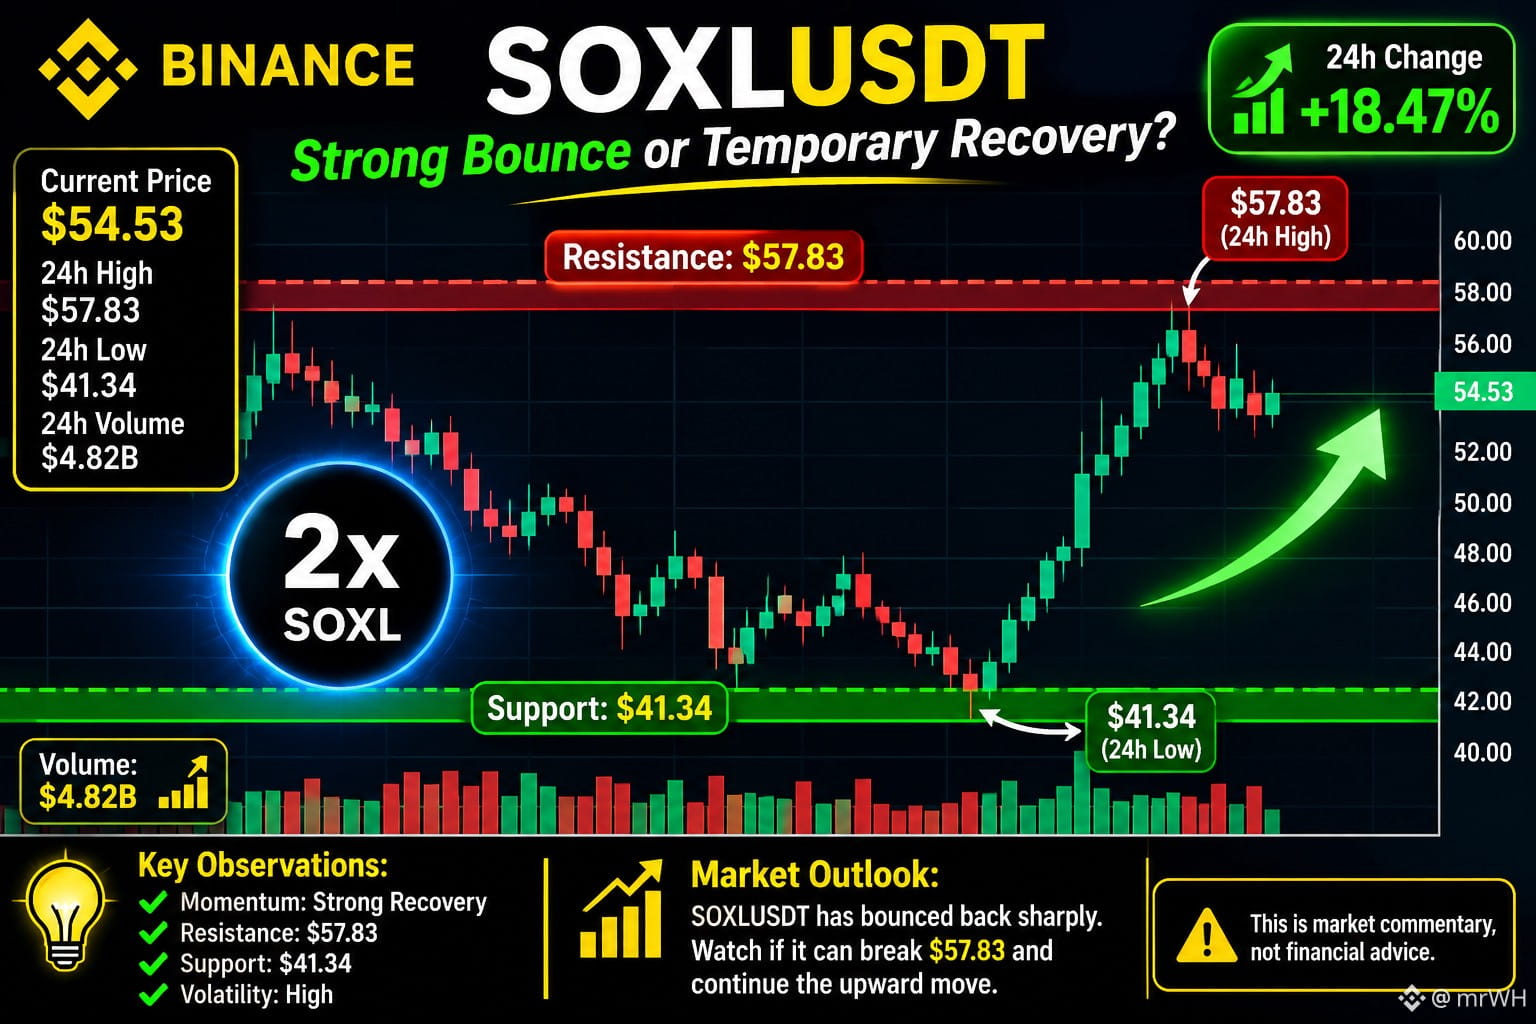
🚀 SOXLUSDT – Strong Bounce or Temporary Recovery?
SOXLUSDT is showing a sharp recovery, gaining approximately 18.47% in 24 hours. However, recent volatility and selling pressure make the next price movement important.
📊 Market Analysis – November 10, 2026
Current Price: $54.53
24H High: $57.83
24H Low: $41.34
24H Change: +18.47%
24H Volume: $4.82B
Key Observations:
Momentum: Strong recovery
Resistance: $57.83
Support: $41.34
Volatility: High
{future}(SOXLUSDT)
🚀 SOXLUSDT – Strong Bounce or Temporary Recovery?
SOXLUSDT is showing a sharp recovery, gaining approximately 18.47% in 24 hours. However, recent volatility and selling pressure make the next price movement important.
📊 Market Analysis – November 10, 2026
Current Price: $54.53
24H High: $57.83
24H Low: $41.34
24H Change: +18.47%
24H Volume: $4.82B
Key Observations:
Momentum: Strong recovery
Resistance: $57.83
Support: $41.34
Volatility: High
SOXLUSDT is showing a sharp recovery, gaining approximately 18.47% in 24 hours. However, recent volatility and selling pressure make the next price movement important.
📊 Market Analysis – November 10, 2026
Current Price: $54.53
24H High: $57.83
24H Low: $41.34
24H Change: +18.47%
24H Volume: $4.82B
Key Observations:
Momentum: Strong recovery
Resistance: $57.83
Support: $41.34
Volatility: High
362
·
--
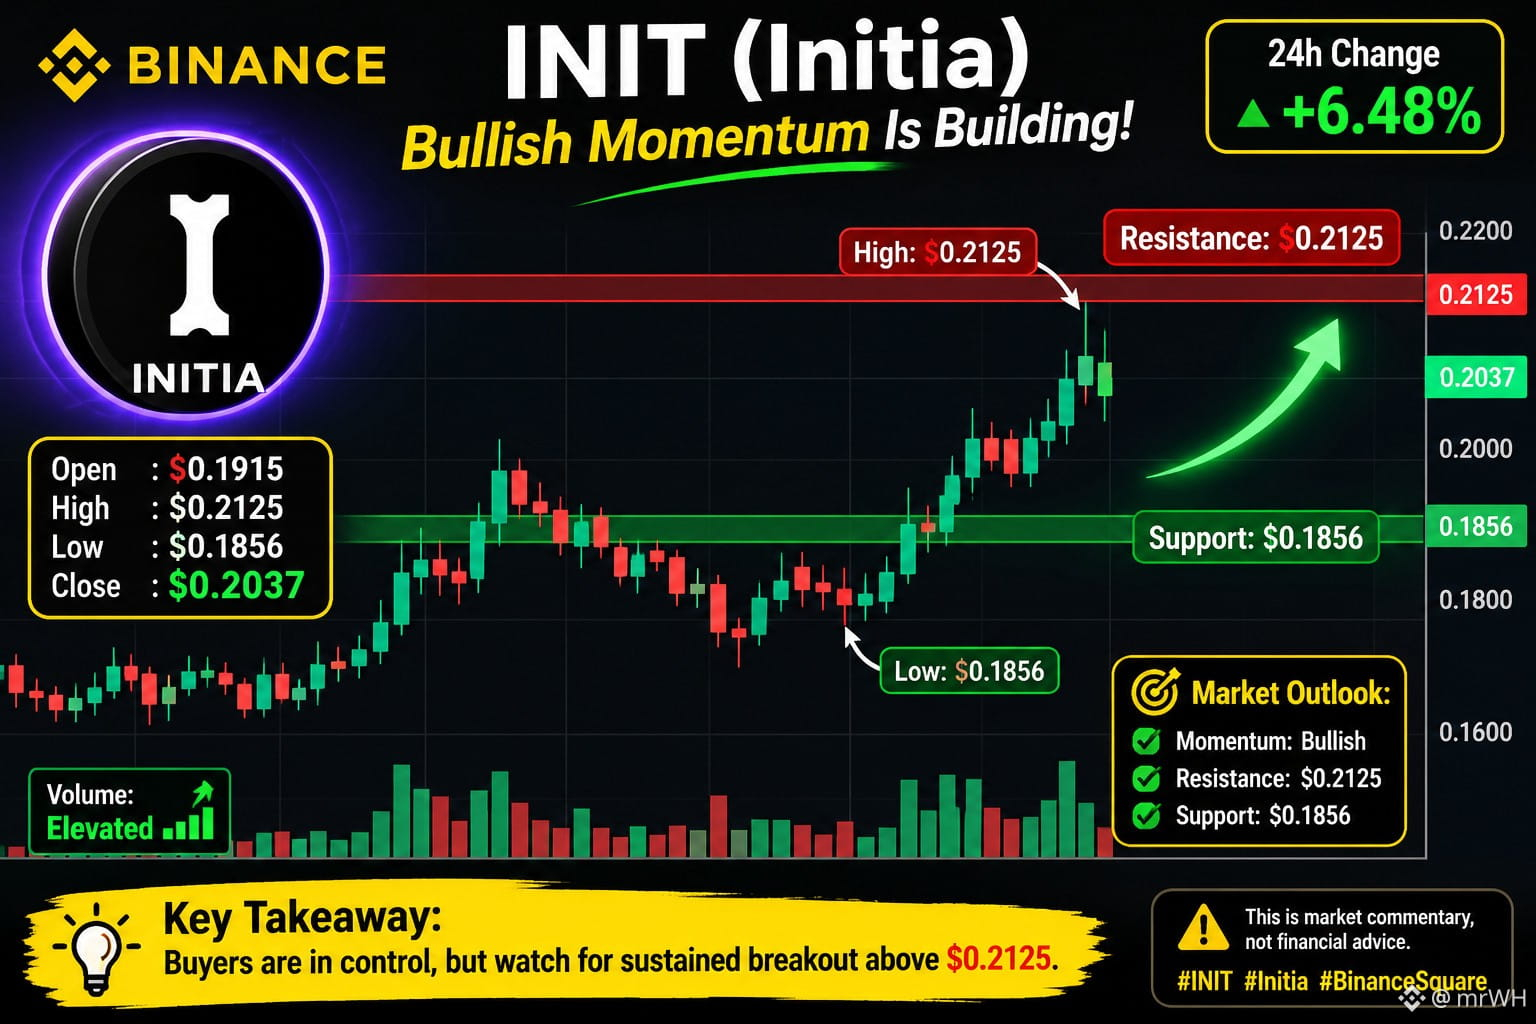
🚀 INIT (Initia) – Bullish Momentum Is Building!
INIT is showing strong bullish momentum, with increased trading activity and a sharp price recovery.
📊 Daily Candlestick Analysis (Nov 10)
Open: $0.1915
High: $0.2125
Low: $0.1856
Close: $0.2037
Daily Change: +6.48%
Market Outlook:
Momentum: Bullish
Resistance: $0.2125
Support: $0.1856
Volume: Elevated
{spot}(INITUSDT)
🚀 INIT (Initia) – Bullish Momentum Is Building!
INIT is showing strong bullish momentum, with increased trading activity and a sharp price recovery.
📊 Daily Candlestick Analysis (Nov 10)
Open: $0.1915
High: $0.2125
Low: $0.1856
Close: $0.2037
Daily Change: +6.48%
Market Outlook:
Momentum: Bullish
Resistance: $0.2125
Support: $0.1856
Volume: Elevated
INIT is showing strong bullish momentum, with increased trading activity and a sharp price recovery.
📊 Daily Candlestick Analysis (Nov 10)
Open: $0.1915
High: $0.2125
Low: $0.1856
Close: $0.2037
Daily Change: +6.48%
Market Outlook:
Momentum: Bullish
Resistance: $0.2125
Support: $0.1856
Volume: Elevated
166
·
--
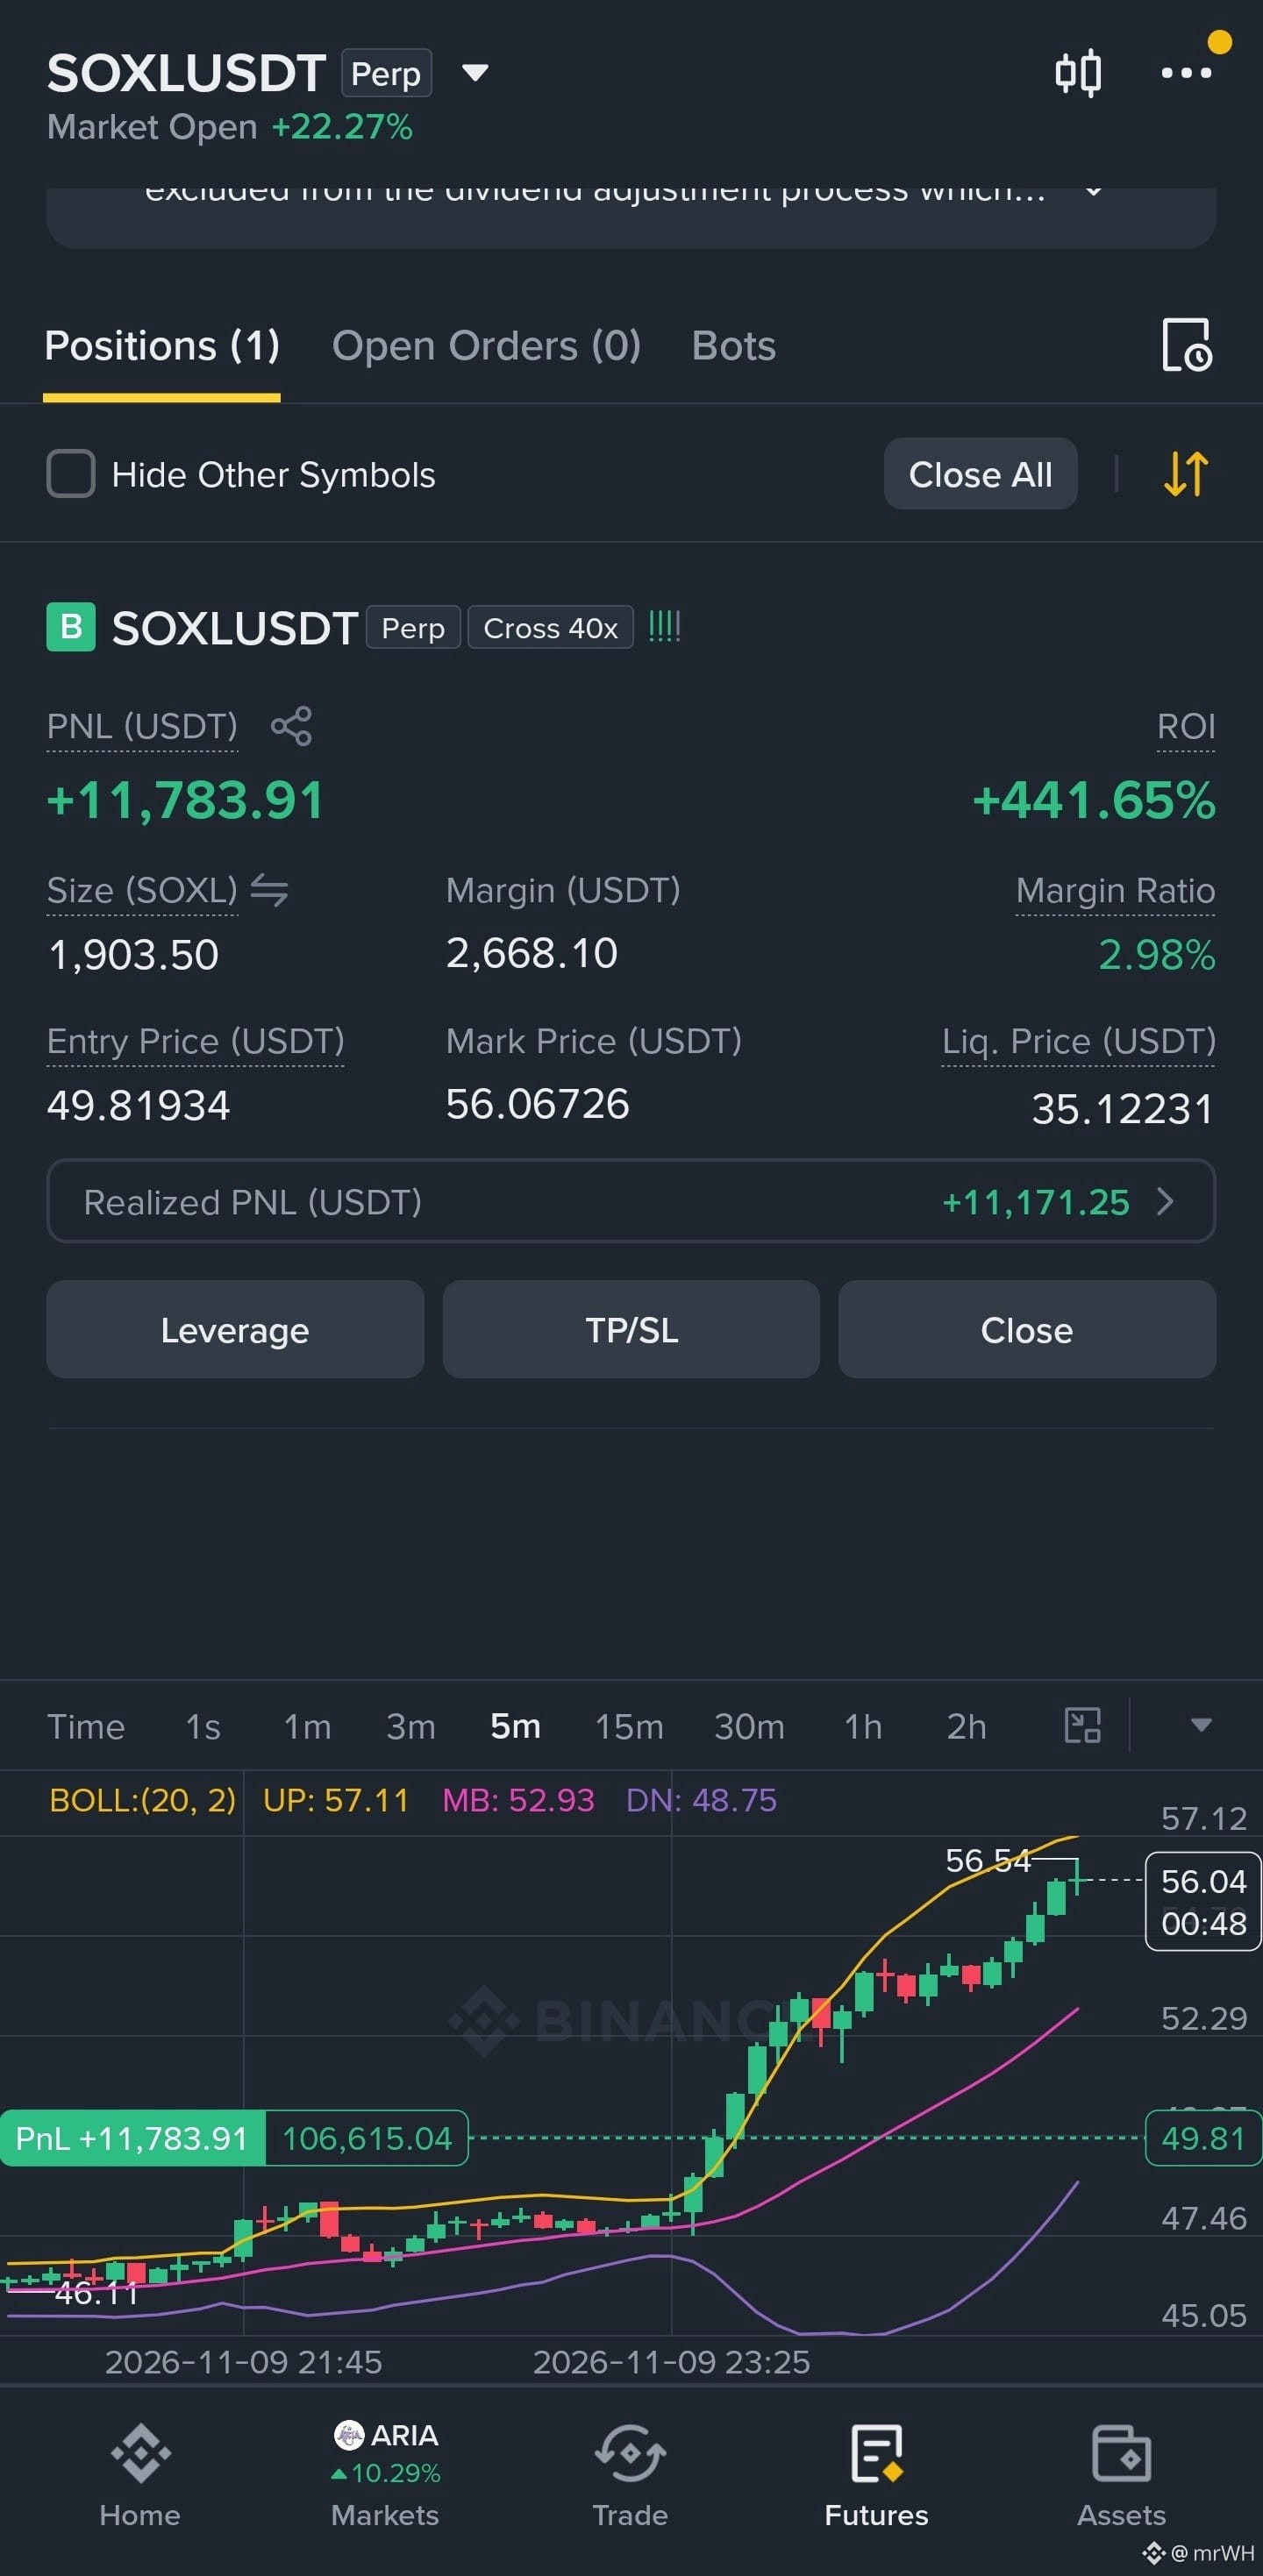
$SOXL I said I would take revenge for the losses I incurred earlier today!!?! 😉 I took 50% profit first.
{future}(SOXLUSDT)
$SOXL I said I would take revenge for the losses I incurred earlier today!!?! 😉 I took 50% profit first.
105
Войдите, чтобы посмотреть больше материала
Присоединяйтесь к пользователям криптовалют по всему миру на Binance Square
⚡️ Получайте новейшую и полезную информацию о криптоактивах.
💬 Нам доверяет крупнейшая в мире криптобиржа.
👍 Получите достоверные аналитические данные от верифицированных создателей контента.
Эл. почта/номер телефона
В тренде
HuangExitNvidiaStrategyInFocus
Просмотров: 108,837
1,179 обсуждают
STOCKS | Nvidia’s Jensen Huang Resigns, Colette Kress Named as Interim CEO
Binance News
·Лайков: 32
·Просмотров: 38.3k
AnthropicRejectsIPODelayValuationinQuestion
Просмотров: 717,560
5,399 обсуждают
HedgeFundsCMEBitcoinNetShortsFall89%
Просмотров: 1,204
46 обсуждают