

The Market Analyser
201 Публикации

The Market Analyser
Отправить жалобу
Заблокировать пользователя
🎯 Catching Institutional Trends with my 4-Indicator Strategy. Lose the noise, trade the facts. Drop your stuck coins below for a raw review! 👇
Открытая сделка
Трейдер с частыми сделками
2.7 г
16 подписок(и/а)
3.2K+ подписчиков(а)
2.4K+ понравилось
Посты
Портфель
Все
Цитирования
🚨 $CLUSDT Retesting the Breakout Zone! A Perfect Bull Trap or the Last Chance to Entry? 🛢️🔥
🚨 $CLUSDT Retesting the Breakout Zone! A Perfect Bull Trap or the Last Chance to Entry? 🛢️🔥
The Market Analyser
·
--
🚨 $CLUSDT Retesting the Breakout Zone! A Perfect Bull Trap or the Last Chance to Entry? 🛢️🔥
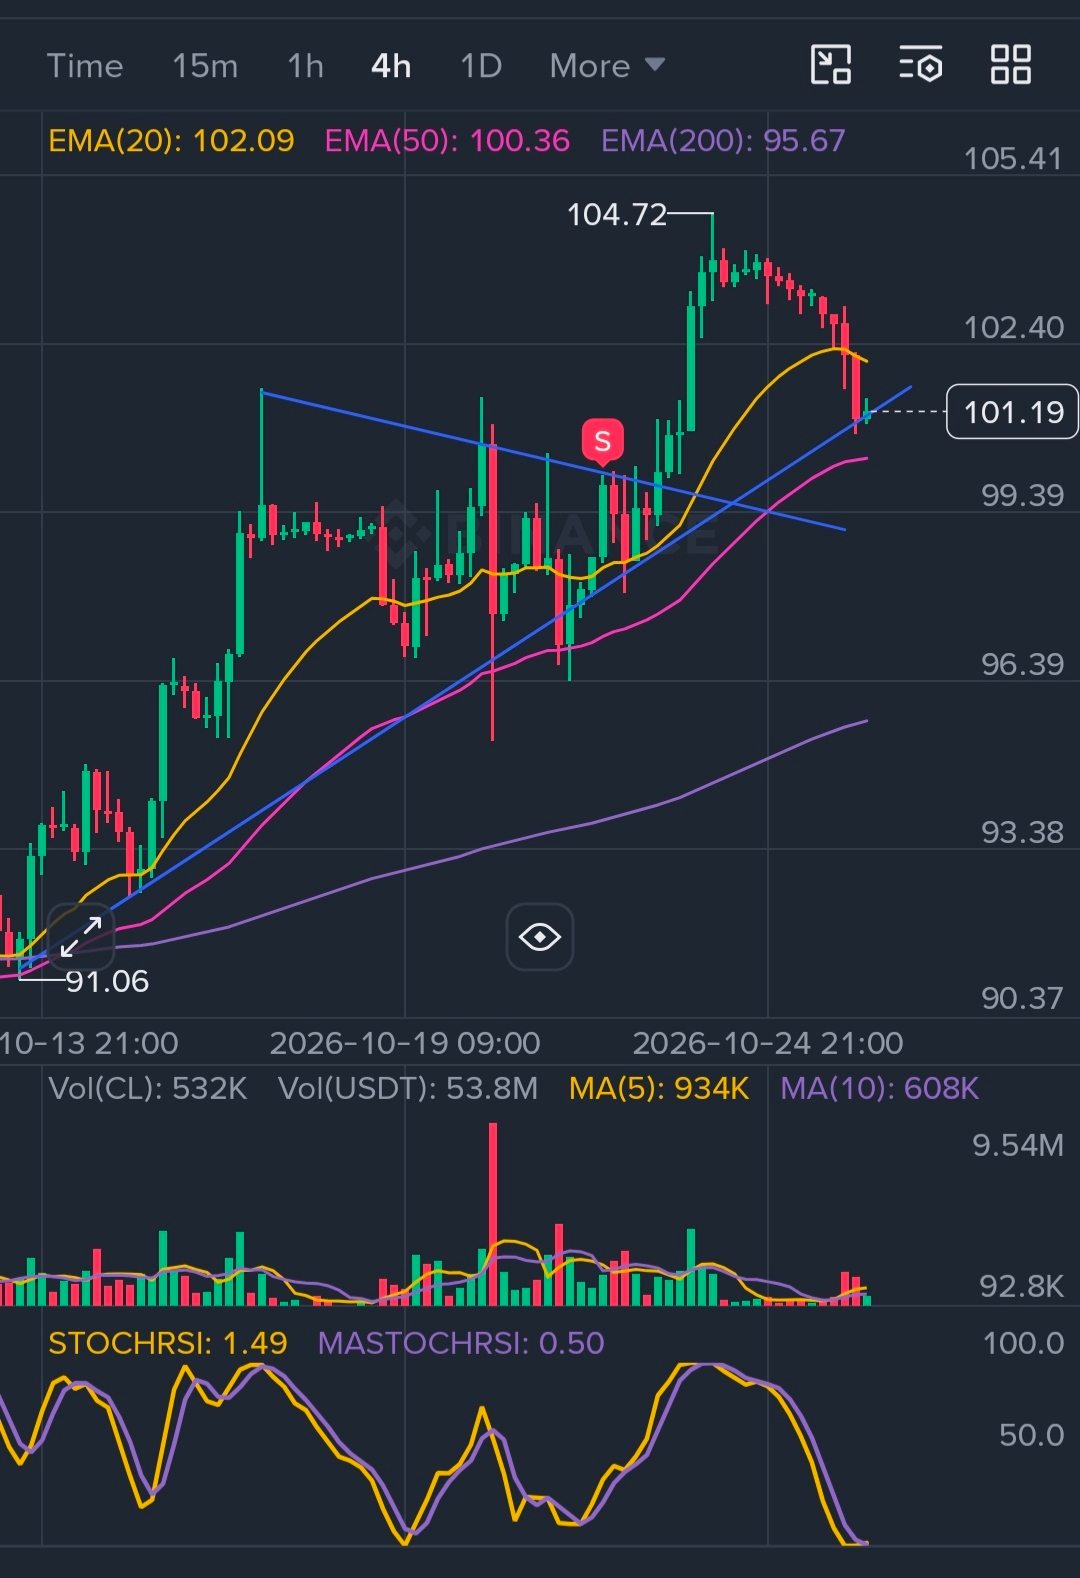
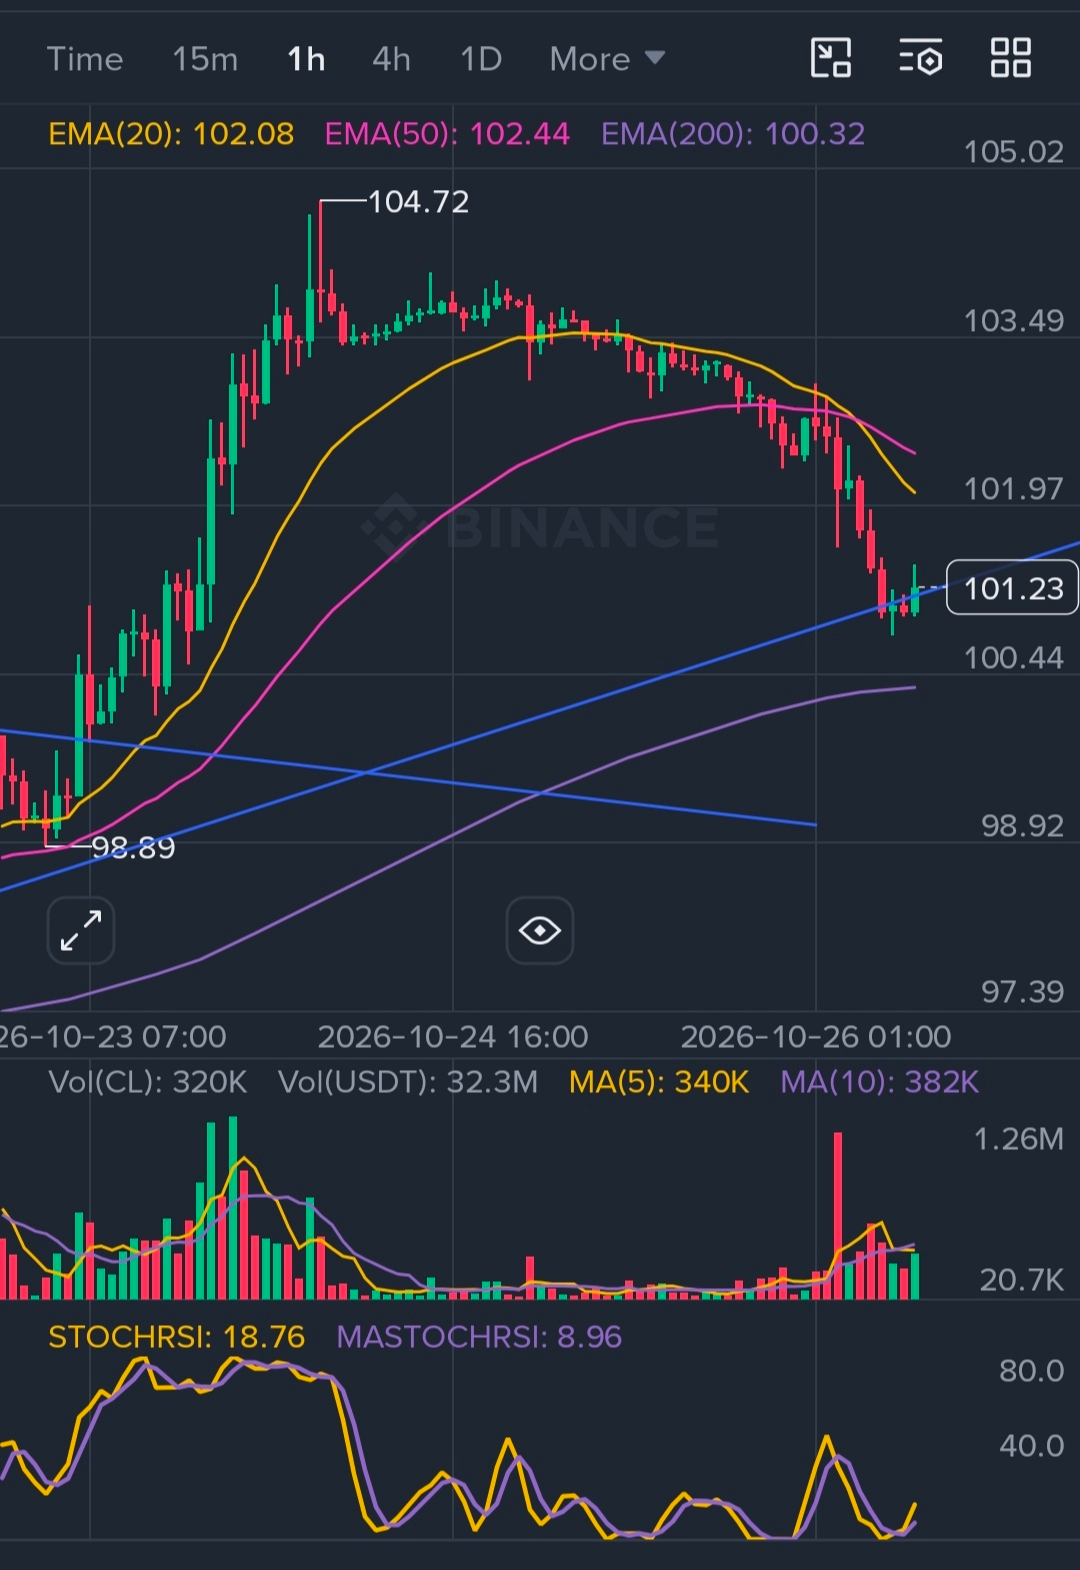
After hitting a massive high of $104.72, CLUSDT Perpetual has pulled back down to $101.23. Retail traders are starting to panic thinking the pump is over, but smart money knows this is a classic structure play! Let's check my 4-Indicator Strategy for the raw facts:
🔹 The Macro Retest (4H Frame): This is textbook trading. After breaking out of the giant symmetrical triangle, the price is coming back down to test the breakout trendline as new support. The price is catching a perfect cushion right above the 4H EMA 50 ($100.36) and the undefeated Daily/4H EMA 200 ($95.67). The macro bullish cycle is completely intact.
🔹 The Short-Term Squeeze (1H Frame): On the hourly frame, CLUSDT is sliding down to test the critical 1H EMA 200 ($100.32) support wall. Volume is slowing down during this dip, which confirms that sellers are running out of aggressive power.
🔹 The Secret Oversold Confluence (StochRSI): This data is absolutely beautiful for buyers:
• 1H StochRSI: 18.76 (Oversold Zone)
• 4H StochRSI: 1.49 (Max Oversold Floor!)
• Verdict: Both timeframes are completely drained of selling power. A massive, high-probability Relief Bounce is mathematically loading from this exact coordinate!
🎯 The Game Plan:
• 🛒 The Loading Zone: Layering long entries around $100.40 - $101.20 gives an incredible risk-to-reward setup as we are buying right on the multi-indicator floor.
• 🚀 Targets: First target back to $102.80, followed by a macro continuation target of $104.50+.
• 🛑 Risk Cover: A clean 4H candle close below the $99.80 invalidate the setup.
💬 Let's settle this in the comments box right now:
📊 Is this dip a BUY or a temporary fake before a massive dump?
1️⃣ Comment 'BUY THE DIP' if you think $100 holds and we head to $105!
2️⃣ Comment 'STAY AWAY' if you think Crude Oil is crashing back to $98!
#CLUSDT #crudeoil #TechnicalAnalysis #BuyTheDip #TradingSignals $CL
1
73
🚨 $CLUSDT Retesting the Breakout Zone! A Perfect Bull Trap or the Last Chance to Entry? 🛢️🔥
After hitting a massive high of $104.72, CLUSDT Perpetual has pulled back down to $101.23. Retail traders are starting to panic thinking the pump is over, but smart money knows this is a classic structure play! Let's check my 4-Indicator Strategy for the raw facts:
🔹 The Macro Retest (4H Frame): This is textbook trading. After breaking out of the giant symmetrical triangle, the price is coming back down to test the breakout trendline as new support. The price is catching a perfect cushion right above the 4H EMA 50 ($100.36) and the undefeated Daily/4H EMA 200 ($95.67). The macro bullish cycle is completely intact.
🔹 The Short-Term Squeeze (1H Frame): On the hourly frame, CLUSDT is sliding down to test the critical 1H EMA 200 ($100.32) support wall. Volume is slowing down during this dip, which confirms that sellers are running out of aggressive power.
🔹 The Secret Oversold Confluence (StochRSI): This data is absolutely beautiful for buyers:
• 1H StochRSI: 18.76 (Oversold Zone)
• 4H StochRSI: 1.49 (Max Oversold Floor!)
• Verdict: Both timeframes are completely drained of selling power. A massive, high-probability Relief Bounce is mathematically loading from this exact coordinate!
🎯 The Game Plan:
• 🛒 The Loading Zone: Layering long entries around $100.40 - $101.20 gives an incredible risk-to-reward setup as we are buying right on the multi-indicator floor.
• 🚀 Targets: First target back to $102.80, followed by a macro continuation target of $104.50+.
• 🛑 Risk Cover: A clean 4H candle close below the $99.80 invalidate the setup.
💬 Let's settle this in the comments box right now:
📊 Is this dip a BUY or a temporary fake before a massive dump?
1️⃣ Comment 'BUY THE DIP' if you think $100 holds and we head to $105!
2️⃣ Comment 'STAY AWAY' if you think Crude Oil is crashing back to $98!
#CLUSDT #crudeoil #TechnicalAnalysis #BuyTheDip #TradingSignals $CL
{future}(CLUSDT)
🚨 $CLUSDT Retesting the Breakout Zone! A Perfect Bull Trap or the Last Chance to Entry? 🛢️🔥
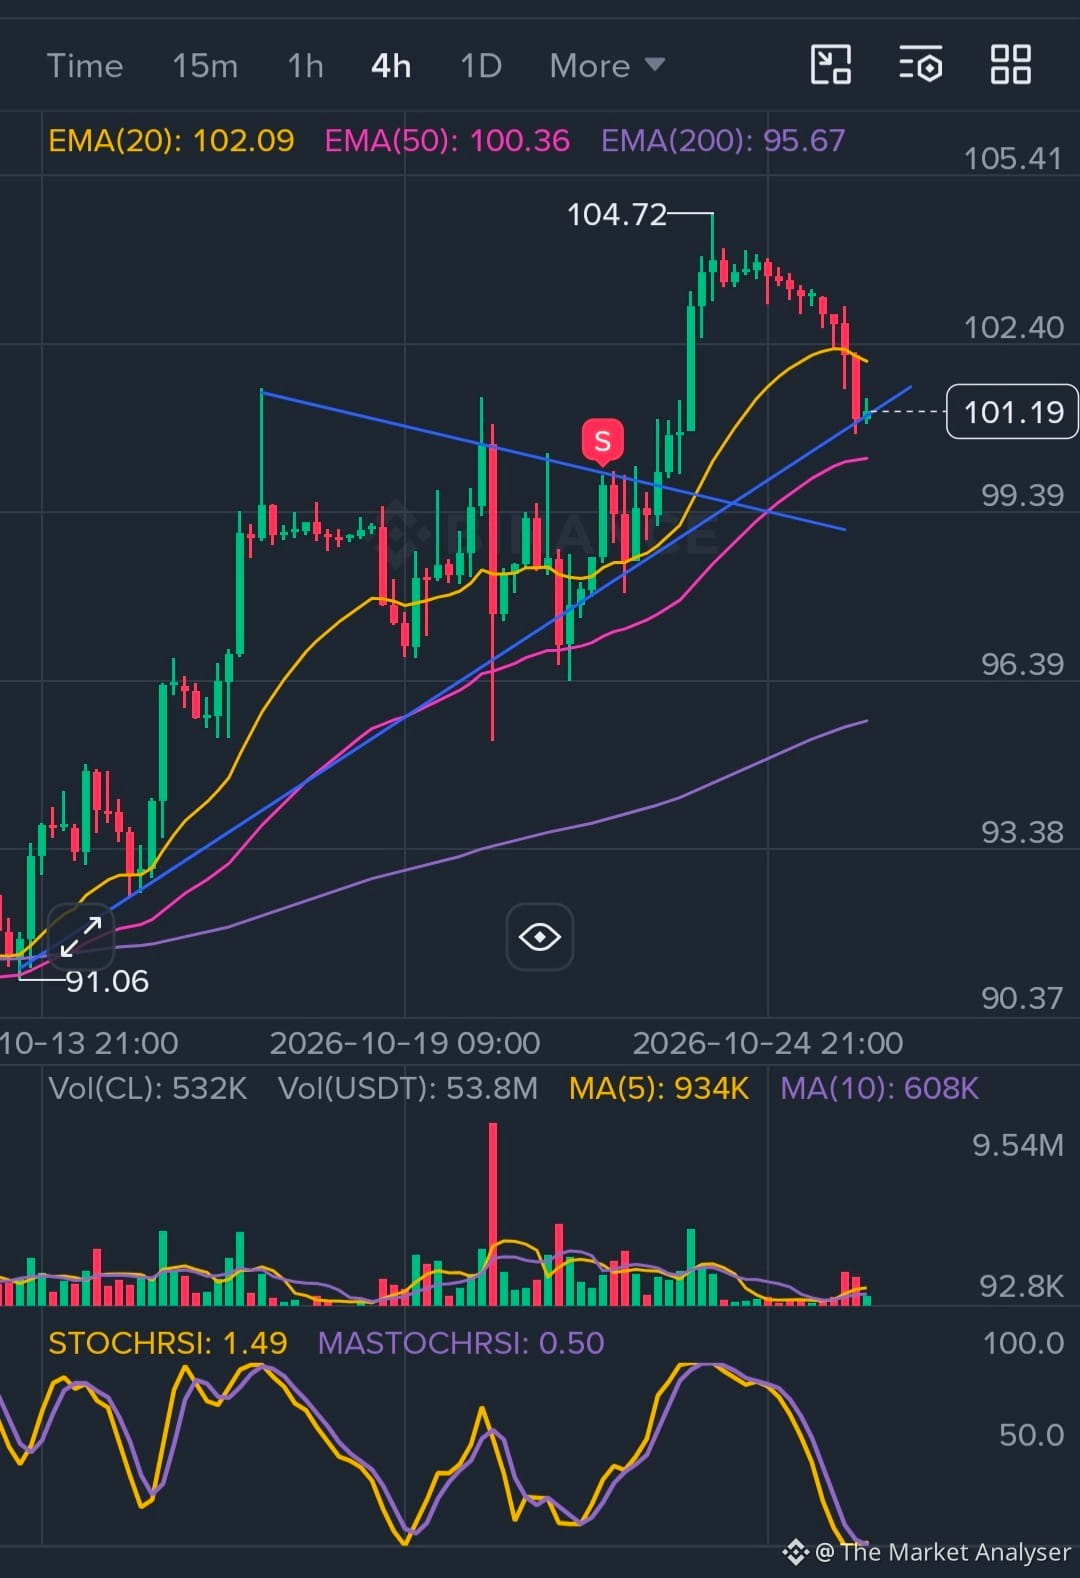
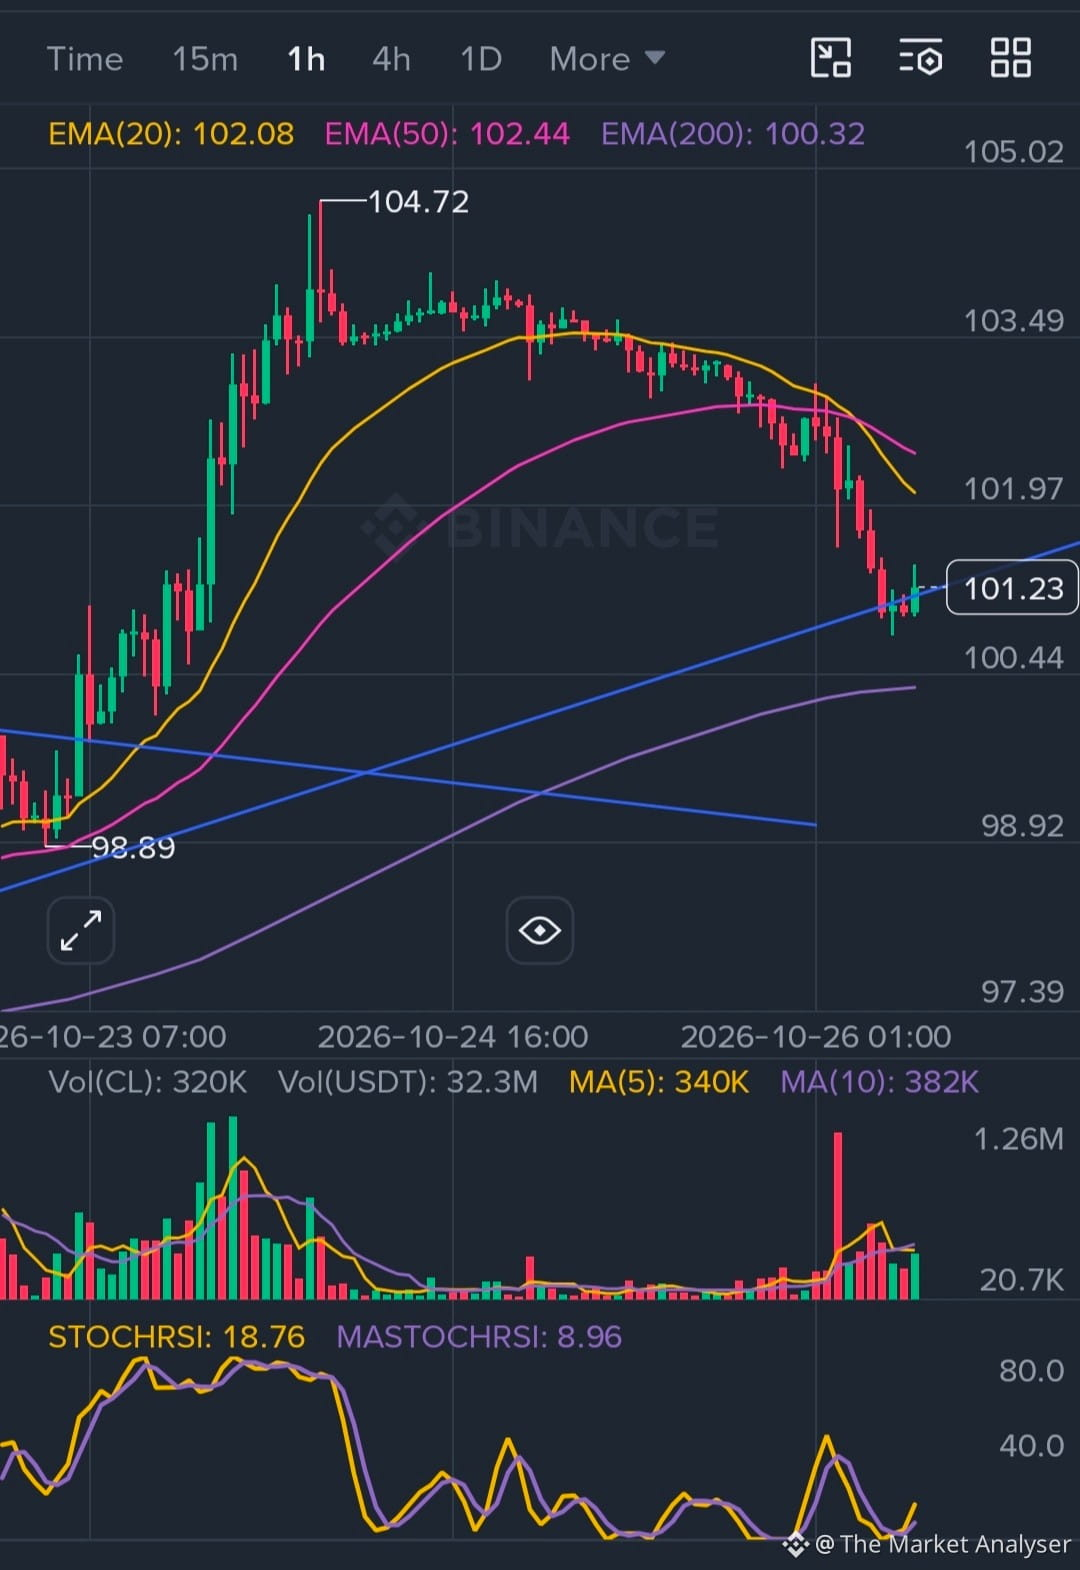
After hitting a massive high of $104.72, CLUSDT Perpetual has pulled back down to $101.23. Retail traders are starting to panic thinking the pump is over, but smart money knows this is a classic structure play! Let's check my 4-Indicator Strategy for the raw facts:
🔹 The Macro Retest (4H Frame): This is textbook trading. After breaking out of the giant symmetrical triangle, the price is coming back down to test the breakout trendline as new support. The price is catching a perfect cushion right above the 4H EMA 50 ($100.36) and the undefeated Daily/4H EMA 200 ($95.67). The macro bullish cycle is completely intact.
🔹 The Short-Term Squeeze (1H Frame): On the hourly frame, CLUSDT is sliding down to test the critical 1H EMA 200 ($100.32) support wall. Volume is slowing down during this dip, which confirms that sellers are running out of aggressive power.
🔹 The Secret Oversold Confluence (StochRSI): This data is absolutely beautiful for buyers:
• 1H StochRSI: 18.76 (Oversold Zone)
• 4H StochRSI: 1.49 (Max Oversold Floor!)
• Verdict: Both timeframes are completely drained of selling power. A massive, high-probability Relief Bounce is mathematically loading from this exact coordinate!
🎯 The Game Plan:
• 🛒 The Loading Zone: Layering long entries around $100.40 - $101.20 gives an incredible risk-to-reward setup as we are buying right on the multi-indicator floor.
• 🚀 Targets: First target back to $102.80, followed by a macro continuation target of $104.50+.
• 🛑 Risk Cover: A clean 4H candle close below the $99.80 invalidate the setup.
💬 Let's settle this in the comments box right now:
📊 Is this dip a BUY or a temporary fake before a massive dump?
1️⃣ Comment 'BUY THE DIP' if you think $100 holds and we head to $105!
2️⃣ Comment 'STAY AWAY' if you think Crude Oil is crashing back to $98!
#CLUSDT #crudeoil #TechnicalAnalysis #BuyTheDip #TradingSignals $CL
1
1
1
535
🚨 IRYS crashed -44% today! Pure bloodbath or the ultimate millionaire-maker dip? 🩸😱
🚨 IRYS crashed -44% today! Pure bloodbath or the ultimate millionaire-maker dip? 🩸😱
The Market Analyser
·
--
🚨 IRYS crashed -44% today! Pure bloodbath or the ultimate millionaire-maker dip? 🩸😱
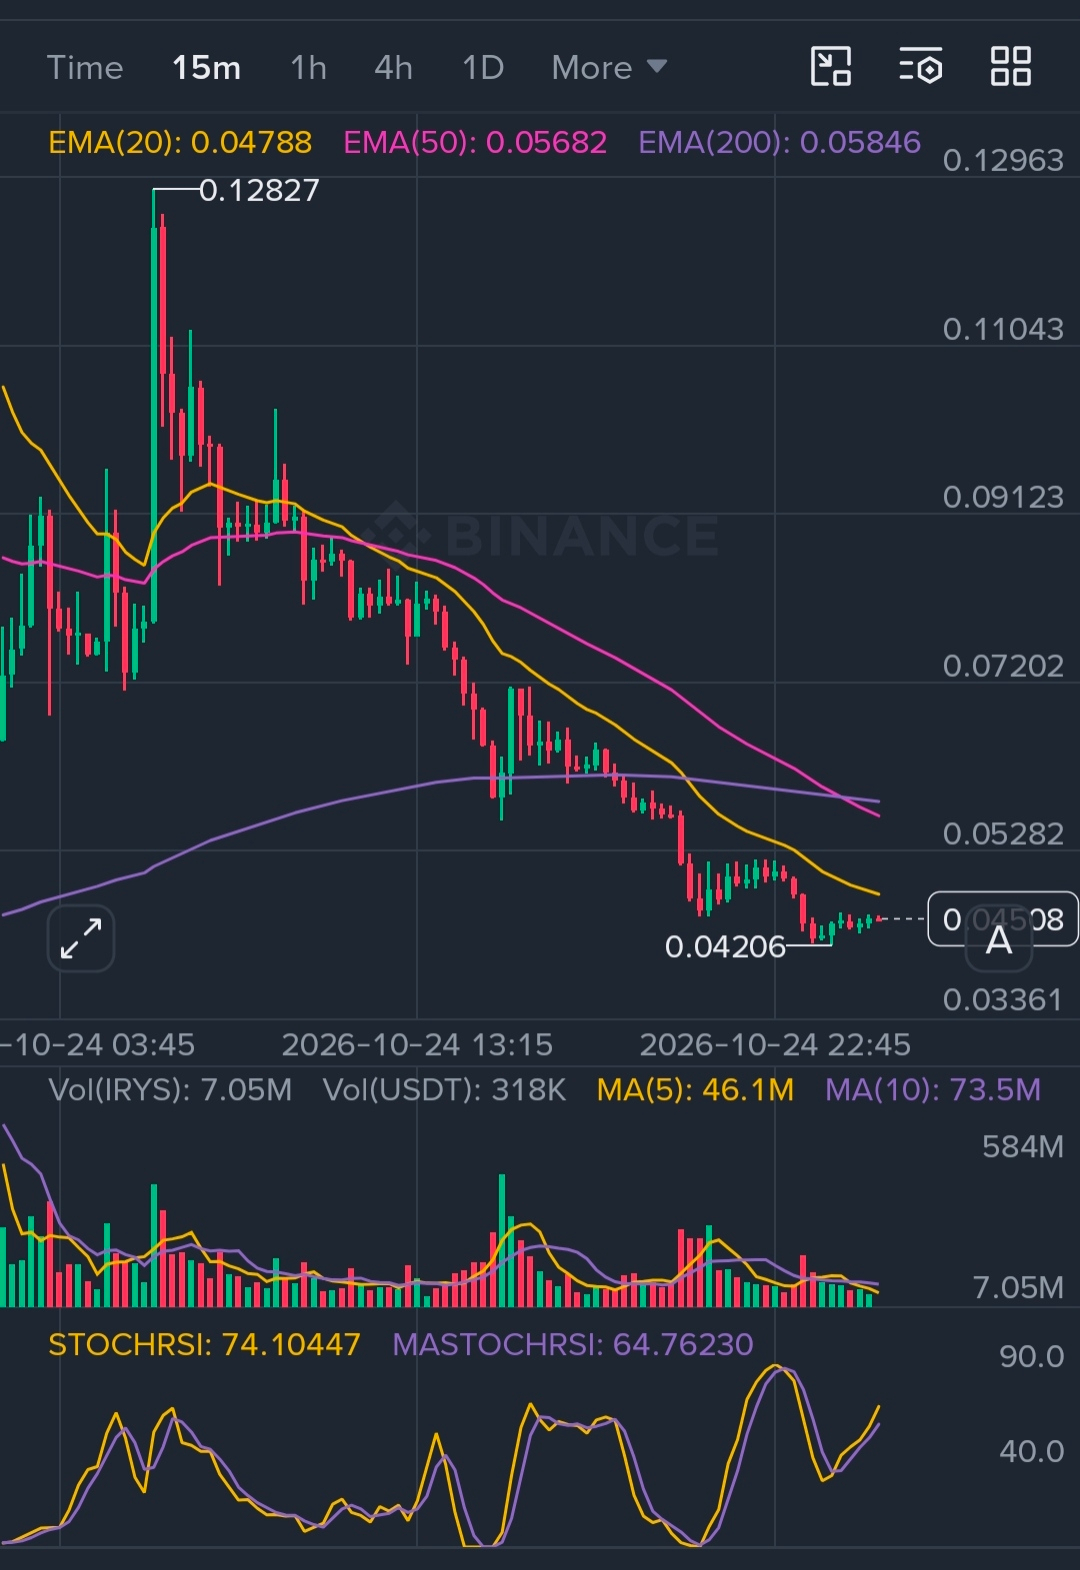
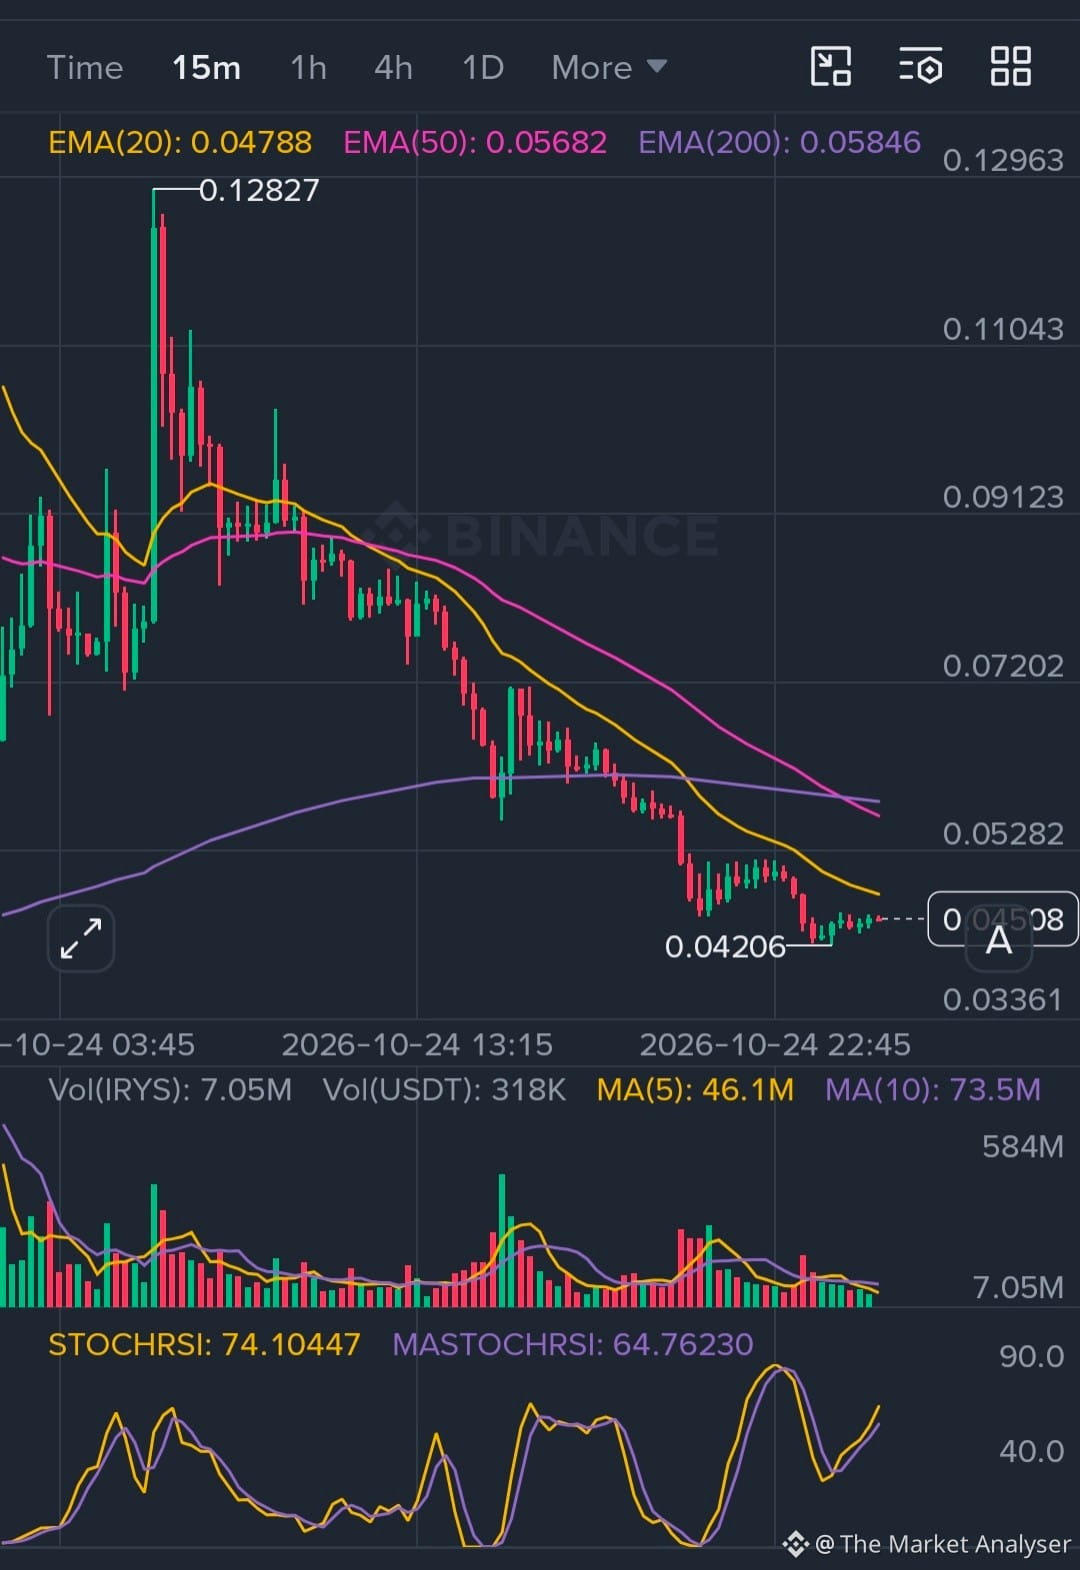
🚫Stop whatever you are doing and look at IRYS/USDT Perpetual. The market has absolutely destroyed the buyers today, dumping from $0.12827 straight down to $0.04509! Panic is at its peak, but before you make an emotional move, let’s apply my 4-Indicator Strategy to see the hidden trap:
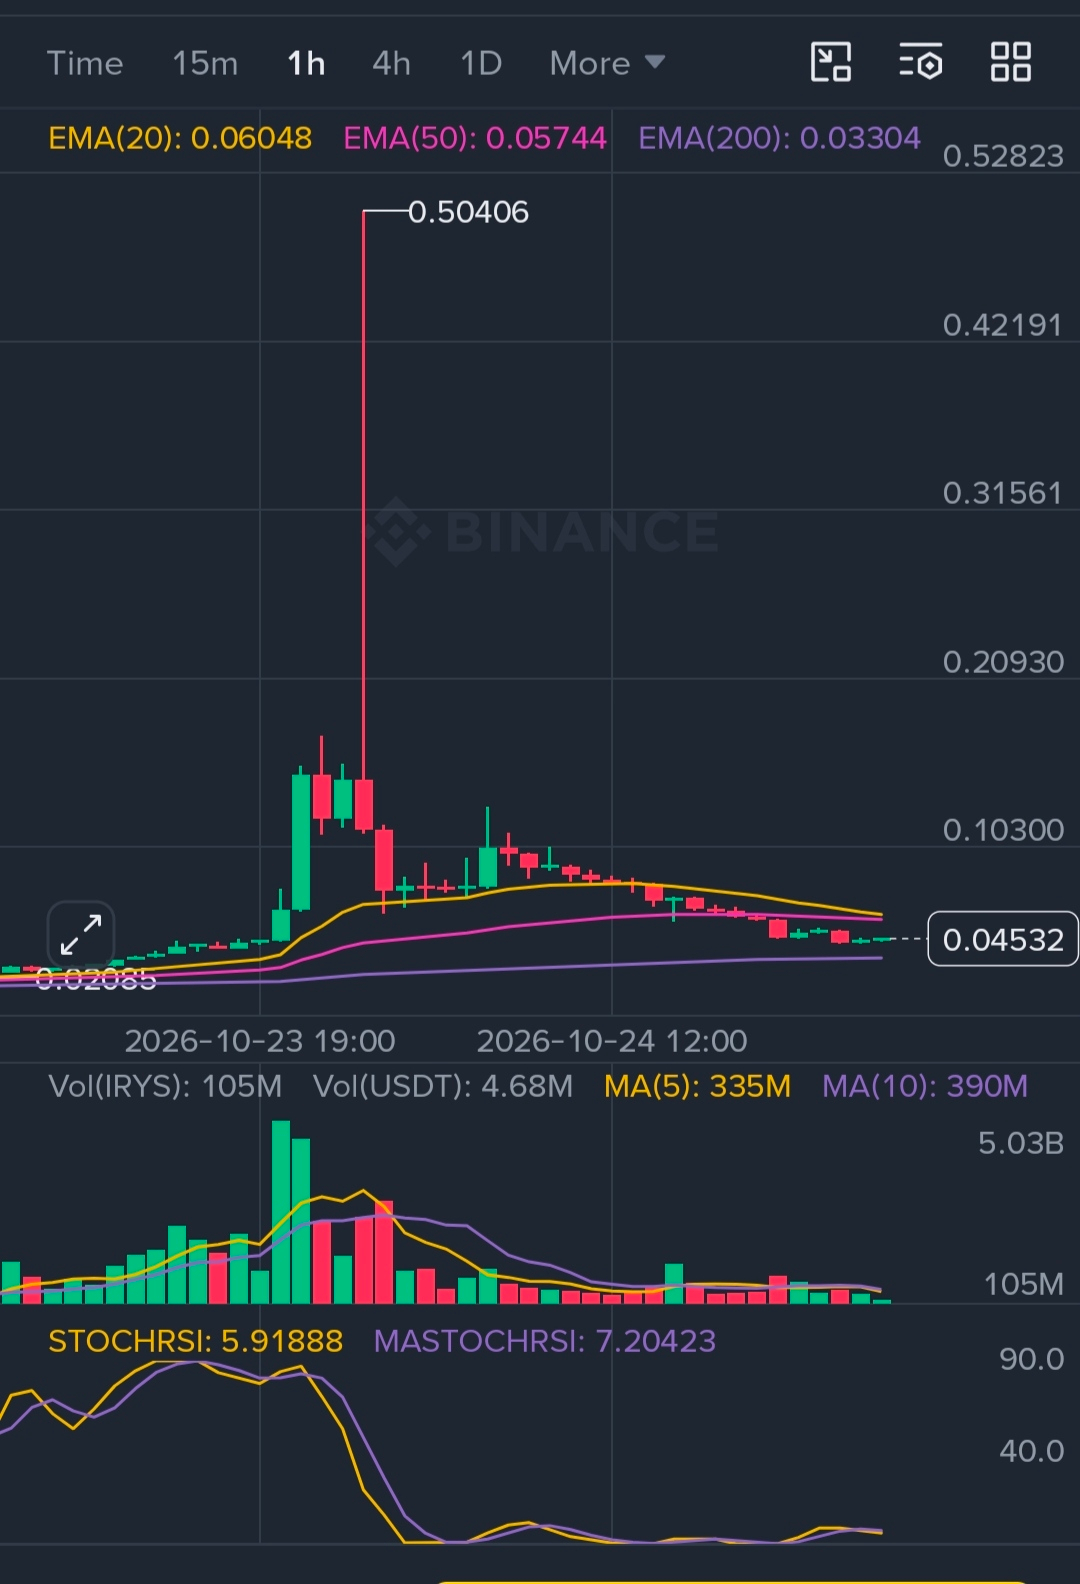
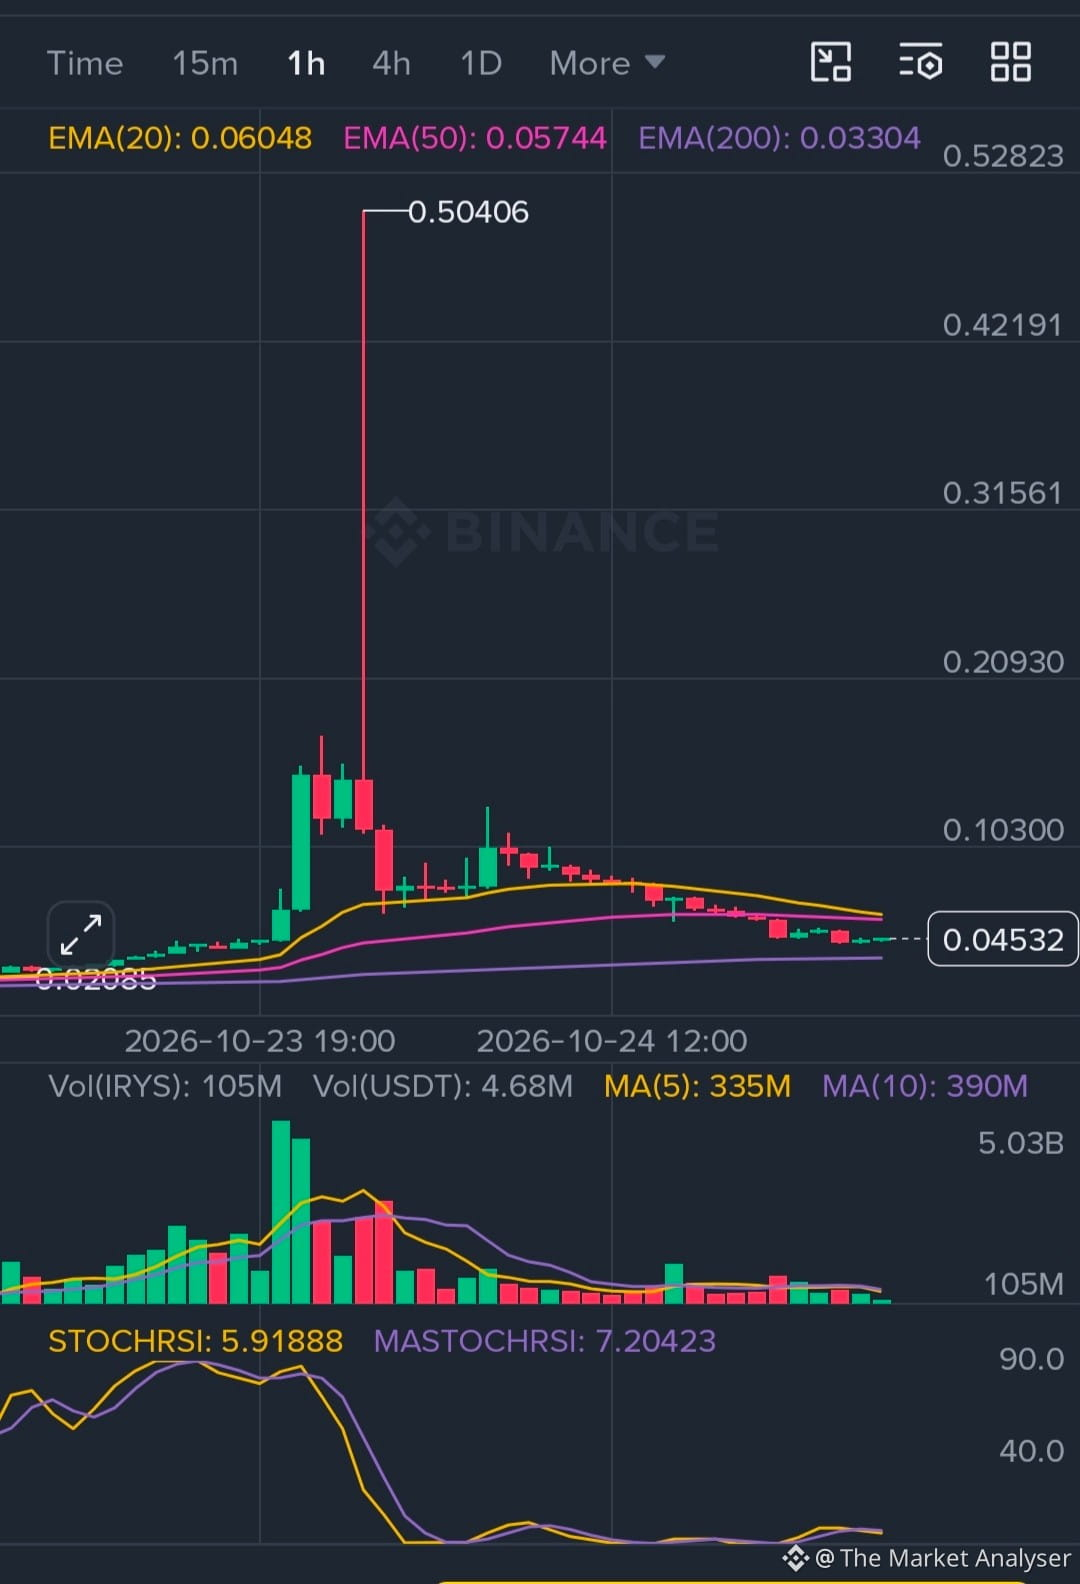
⚡🔹 1️⃣ EMA 200 Trend Filter: On the 1H chart, a massive Bearish Crossover has happened. Price is trading below the EMA 200 ($0.058), which means the mid-term momentum is fully in the hands of the market-shorters (Bears).
⚡🔹 2️⃣ EMA 20 & 50 Dynamic Caps: On the 15M frame, the EMA 20 ($0.04788) and EMA 50 ($0.05682) are creating a brutal downward ceiling. Every single tiny bounce is being aggressively rejected by these lines.
⚡🔹 3️⃣ The StochRSI Secret (The Only Hope): Look closely at the divergence!
15M StochRSI: 74.10 (Rising, trying to local bounce).
1H StochRSI: 5.91 (Max Oversold Floor!)
⚡What this means: On the hourly frame, the sellers are completely exhausted. A violent, rapid Relief Bounce (Short Squeeze) is mathematically loading very soon!
🎯 My Exact Execution Plan:
🛒 The Entry Zone: Chasing it right here is risky. But keeping limit orders near the local low support zone ($0.04200 - $0.04350) with high volume confirmation gives a massive Risk-to-Reward ratio for a fast scalp bounce target of $0.05200.
🛑 Strict Risk Limit: If it closes a 1H candle below $0.04000, cut the trade instantly.
💬 Let’s settle this in the comments box right now:
🔥 Are you brave enough to buy this blood?
1️⃣ Type 'BUY' if you think a massive +30% relief bounce is coming today!
2️⃣ Type 'RUN' if you think this project is going to zero!
Drop your active loss or entry prices below, let's track this live! 👇
#IRYS #cryptocrash #TopLoser #tradingStrategy #TechnicalAnalysis $IRYS
1
272
🚨 IRYS crashed -44% today! Pure bloodbath or the ultimate millionaire-maker dip? 🩸😱
🚫Stop whatever you are doing and look at IRYS/USDT Perpetual. The market has absolutely destroyed the buyers today, dumping from $0.12827 straight down to $0.04509! Panic is at its peak, but before you make an emotional move, let’s apply my 4-Indicator Strategy to see the hidden trap:
⚡🔹 1️⃣ EMA 200 Trend Filter: On the 1H chart, a massive Bearish Crossover has happened. Price is trading below the EMA 200 ($0.058), which means the mid-term momentum is fully in the hands of the market-shorters (Bears).
⚡🔹 2️⃣ EMA 20 & 50 Dynamic Caps: On the 15M frame, the EMA 20 ($0.04788) and EMA 50 ($0.05682) are creating a brutal downward ceiling. Every single tiny bounce is being aggressively rejected by these lines.
⚡🔹 3️⃣ The StochRSI Secret (The Only Hope): Look closely at the divergence!
15M StochRSI: 74.10 (Rising, trying to local bounce).
1H StochRSI: 5.91 (Max Oversold Floor!)
⚡What this means: On the hourly frame, the sellers are completely exhausted. A violent, rapid Relief Bounce (Short Squeeze) is mathematically loading very soon!
🎯 My Exact Execution Plan:
🛒 The Entry Zone: Chasing it right here is risky. But keeping limit orders near the local low support zone ($0.04200 - $0.04350) with high volume confirmation gives a massive Risk-to-Reward ratio for a fast scalp bounce target of $0.05200.
🛑 Strict Risk Limit: If it closes a 1H candle below $0.04000, cut the trade instantly.
💬 Let’s settle this in the comments box right now:
🔥 Are you brave enough to buy this blood?
1️⃣ Type 'BUY' if you think a massive +30% relief bounce is coming today!
2️⃣ Type 'RUN' if you think this project is going to zero!
Drop your active loss or entry prices below, let's track this live! 👇
#IRYS #cryptocrash #TopLoser #tradingStrategy #TechnicalAnalysis $IRYS
{future}(IRYSUSDT)
🚨 IRYS crashed -44% today! Pure bloodbath or the ultimate millionaire-maker dip? 🩸😱
🚫Stop whatever you are doing and look at IRYS/USDT Perpetual. The market has absolutely destroyed the buyers today, dumping from $0.12827 straight down to $0.04509! Panic is at its peak, but before you make an emotional move, let’s apply my 4-Indicator Strategy to see the hidden trap:
⚡🔹 1️⃣ EMA 200 Trend Filter: On the 1H chart, a massive Bearish Crossover has happened. Price is trading below the EMA 200 ($0.058), which means the mid-term momentum is fully in the hands of the market-shorters (Bears).
⚡🔹 2️⃣ EMA 20 & 50 Dynamic Caps: On the 15M frame, the EMA 20 ($0.04788) and EMA 50 ($0.05682) are creating a brutal downward ceiling. Every single tiny bounce is being aggressively rejected by these lines.
⚡🔹 3️⃣ The StochRSI Secret (The Only Hope): Look closely at the divergence!
15M StochRSI: 74.10 (Rising, trying to local bounce).
1H StochRSI: 5.91 (Max Oversold Floor!)
⚡What this means: On the hourly frame, the sellers are completely exhausted. A violent, rapid Relief Bounce (Short Squeeze) is mathematically loading very soon!
🎯 My Exact Execution Plan:
🛒 The Entry Zone: Chasing it right here is risky. But keeping limit orders near the local low support zone ($0.04200 - $0.04350) with high volume confirmation gives a massive Risk-to-Reward ratio for a fast scalp bounce target of $0.05200.
🛑 Strict Risk Limit: If it closes a 1H candle below $0.04000, cut the trade instantly.
💬 Let’s settle this in the comments box right now:
🔥 Are you brave enough to buy this blood?
1️⃣ Type 'BUY' if you think a massive +30% relief bounce is coming today!
2️⃣ Type 'RUN' if you think this project is going to zero!
Drop your active loss or entry prices below, let's track this live! 👇
#IRYS #cryptocrash #TopLoser #tradingStrategy #TechnicalAnalysis $IRYS
1
1
1
398
🚨"Is Bitcoin dropping back to $76k? Read my 4-Indicator breakdown before opening your next trade!"👽
🚨"Is Bitcoin dropping back to $76k? Read my 4-Indicator breakdown before opening your next trade!"👽
The Market Analyser
·
--
🚨"Is Bitcoin dropping back to $76k? Read my 4-Indicator breakdown before opening your next trade!⚠️
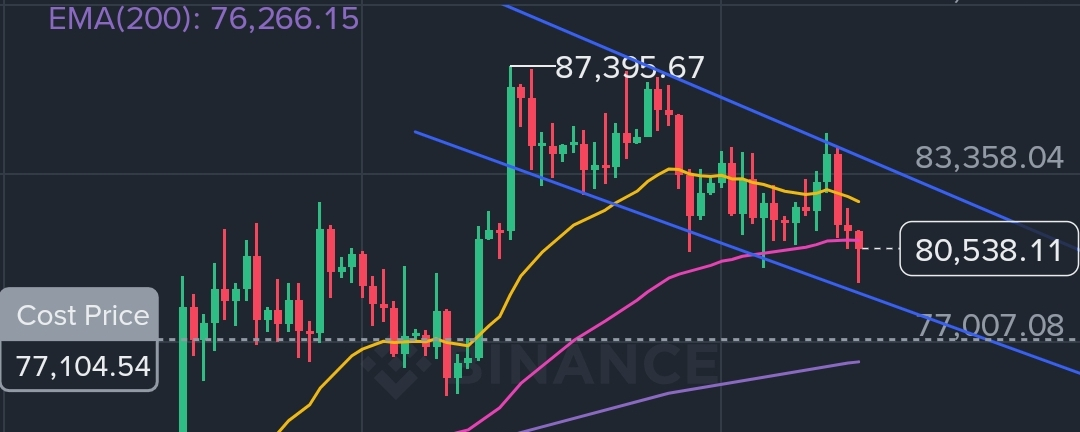
The crypto king Bitcoin ($BTC) is currently battling right at the $80,518 mark. Bears are trying hard to push it down while bulls are holding the line. Let’s dissect the structural reality using my 4-Indicator Strategy:
🔹 The Macro Channel (1D Frame): On the daily chart, Bitcoin is cleanly sliding inside a broad Descending Channel since its top at $87,395.67. The good news? We are currently sitting right on the channel's bottom support boundary. Furthermore, the daily EMA 200 ($76,266) remains undefeated, safeguarding the long-term bullish cycle.
🔹 The Short-Term Compression (1H Frame): On the intra-day frame, BTC managed a quick relief bounce from $79,220. However, it is facing heavy static resistance under the 1H EMA 20 ($80,645) and EMA 50 ($81,161). The short-term dynamic bias remains bearish as long as we are trading below the 1H EMA 200 ($81,977).
🔹 The StochRSI Divergence Setup: This is a classic setup to watch:
• 1D StochRSI: Sitting at 0.00 (Max Oversold Floor) — Sellers are mathematically hitting a wall on the macro frame.
• 1H StochRSI: Flying high at 93.30 (Max Overbought) — The local intra-day relief rally is heavily overextended and needs to breathe.
🎯 The Strategic Game Plan:
• 🛒 The Accumulation Zone: For mid-term spot buyers, loading up heavily around the $78,500 - $79,500 channel support zone offers an exceptional risk-to-reward ratio.
• 🚀 The Breakout Trigger: Scalp long positions will trigger aggressively once BTC breaks and closes a 1H candle above $81,200, targeting $82,700+.
• 🛑 The Risk Limit: A daily candle closing below $76,000 completely invalidates the current macro structure.
💬 Let’s see who is smart trading this zone:
📊 What is your target for Bitcoin by the end of this week?
1️⃣ Comment 'PUMP' if $80K holds and we run to $85K!
2️⃣ Comment 'DUMP' if we break below $78K next!
Drop your active trade entries or charts below! 👇
#BTC #bitcoin #CryptoAnalysis #TechnicalAnalysis #TradingSignals
1
28
Статья
🚨"Is Bitcoin dropping back to $76k? Read my 4-Indicator breakdown before opening your next trade!⚠️The crypto king Bitcoin ($BTC) is currently battling right at the $80,518 mark. Bears are trying hard to push it down while bulls are holding the line. Let’s dissect the structural reality using my 4-Indicator Strategy:
🔹 The Macro Channel (1D Frame): On the daily chart, Bitcoin is cleanly sliding inside a broad Descending Channel since its top at $87,395.67. The good news? We are currently sitting right on the channel's bottom support boundary. Furthermore, the daily EMA 200 ($76,266) remains undefeated, safeguarding the long-term bullish cycle.
🔹 The Short-Term Compression (1H Frame): On the intra-day frame, BTC managed a quick relief bounce from $79,220. However, it is facing heavy static resistance under the 1H EMA 20 ($80,645) and EMA 50 ($81,161). The short-term dynamic bias remains bearish as long as we are trading below the 1H EMA 200 ($81,977).
🔹 The StochRSI Divergence Setup: This is a classic setup to watch:
• 1D StochRSI: Sitting at 0.00 (Max Oversold Floor) — Sellers are mathematically hitting a wall on the macro frame.
• 1H StochRSI: Flying high at 93.30 (Max Overbought) — The local intra-day relief rally is heavily overextended and needs to breathe.
🎯 The Strategic Game Plan:
• 🛒 The Accumulation Zone: For mid-term spot buyers, loading up heavily around the $78,500 - $79,500 channel support zone offers an exceptional risk-to-reward ratio.
• 🚀 The Breakout Trigger: Scalp long positions will trigger aggressively once BTC breaks and closes a 1H candle above $81,200, targeting $82,700+.
• 🛑 The Risk Limit: A daily candle closing below $76,000 completely invalidates the current macro structure.
💬 Let’s see who is smart trading this zone:
📊 What is your target for Bitcoin by the end of this week?
1️⃣ Comment 'PUMP' if $80K holds and we run to $85K!
2️⃣ Comment 'DUMP' if we break below $78K next!
Drop your active trade entries or charts below! 👇
#BTC #bitcoin #CryptoAnalysis #TechnicalAnalysis #TradingSignals
🚨"Is Bitcoin dropping back to $76k? Read my 4-Indicator breakdown before opening your next trade!⚠️
The crypto king Bitcoin ($BTC) is currently battling right at the $80,518 mark. Bears are trying hard to push it down while bulls are holding the line. Let’s dissect the structural reality using my 4-Indicator Strategy:
🔹 The Macro Channel (1D Frame): On the daily chart, Bitcoin is cleanly sliding inside a broad Descending Channel since its top at $87,395.67. The good news? We are currently sitting right on the channel's bottom support boundary. Furthermore, the daily EMA 200 ($76,266) remains undefeated, safeguarding the long-term bullish cycle.
🔹 The Short-Term Compression (1H Frame): On the intra-day frame, BTC managed a quick relief bounce from $79,220. However, it is facing heavy static resistance under the 1H EMA 20 ($80,645) and EMA 50 ($81,161). The short-term dynamic bias remains bearish as long as we are trading below the 1H EMA 200 ($81,977).
🔹 The StochRSI Divergence Setup: This is a classic setup to watch:
• 1D StochRSI: Sitting at 0.00 (Max Oversold Floor) — Sellers are mathematically hitting a wall on the macro frame.
• 1H StochRSI: Flying high at 93.30 (Max Overbought) — The local intra-day relief rally is heavily overextended and needs to breathe.
🎯 The Strategic Game Plan:
• 🛒 The Accumulation Zone: For mid-term spot buyers, loading up heavily around the $78,500 - $79,500 channel support zone offers an exceptional risk-to-reward ratio.
• 🚀 The Breakout Trigger: Scalp long positions will trigger aggressively once BTC breaks and closes a 1H candle above $81,200, targeting $82,700+.
• 🛑 The Risk Limit: A daily candle closing below $76,000 completely invalidates the current macro structure.
💬 Let’s see who is smart trading this zone:
📊 What is your target for Bitcoin by the end of this week?
1️⃣ Comment 'PUMP' if $80K holds and we run to $85K!
2️⃣ Comment 'DUMP' if we break below $78K next!
Drop your active trade entries or charts below! 👇
#BTC #bitcoin #CryptoAnalysis #TechnicalAnalysis #TradingSignals
🔹 The Macro Channel (1D Frame): On the daily chart, Bitcoin is cleanly sliding inside a broad Descending Channel since its top at $87,395.67. The good news? We are currently sitting right on the channel's bottom support boundary. Furthermore, the daily EMA 200 ($76,266) remains undefeated, safeguarding the long-term bullish cycle.
🔹 The Short-Term Compression (1H Frame): On the intra-day frame, BTC managed a quick relief bounce from $79,220. However, it is facing heavy static resistance under the 1H EMA 20 ($80,645) and EMA 50 ($81,161). The short-term dynamic bias remains bearish as long as we are trading below the 1H EMA 200 ($81,977).
🔹 The StochRSI Divergence Setup: This is a classic setup to watch:
• 1D StochRSI: Sitting at 0.00 (Max Oversold Floor) — Sellers are mathematically hitting a wall on the macro frame.
• 1H StochRSI: Flying high at 93.30 (Max Overbought) — The local intra-day relief rally is heavily overextended and needs to breathe.
🎯 The Strategic Game Plan:
• 🛒 The Accumulation Zone: For mid-term spot buyers, loading up heavily around the $78,500 - $79,500 channel support zone offers an exceptional risk-to-reward ratio.
• 🚀 The Breakout Trigger: Scalp long positions will trigger aggressively once BTC breaks and closes a 1H candle above $81,200, targeting $82,700+.
• 🛑 The Risk Limit: A daily candle closing below $76,000 completely invalidates the current macro structure.
💬 Let’s see who is smart trading this zone:
📊 What is your target for Bitcoin by the end of this week?
1️⃣ Comment 'PUMP' if $80K holds and we run to $85K!
2️⃣ Comment 'DUMP' if we break below $78K next!
Drop your active trade entries or charts below! 👇
#BTC #bitcoin #CryptoAnalysis #TechnicalAnalysis #TradingSignals
1
1
1
272
🚨 $TRUMP Bleeding -6%! Is This a Massive Election Hype Discount or a Dead End? 📉🇺🇸
The Politi-fi sector is getting wild as TRUMPUSDT Perpetual slides down to $1.665. While the political hype is peak outside, the charts are telling a very strict and unemotional story. Here is a breakdown using my 4-Indicator Strategy:
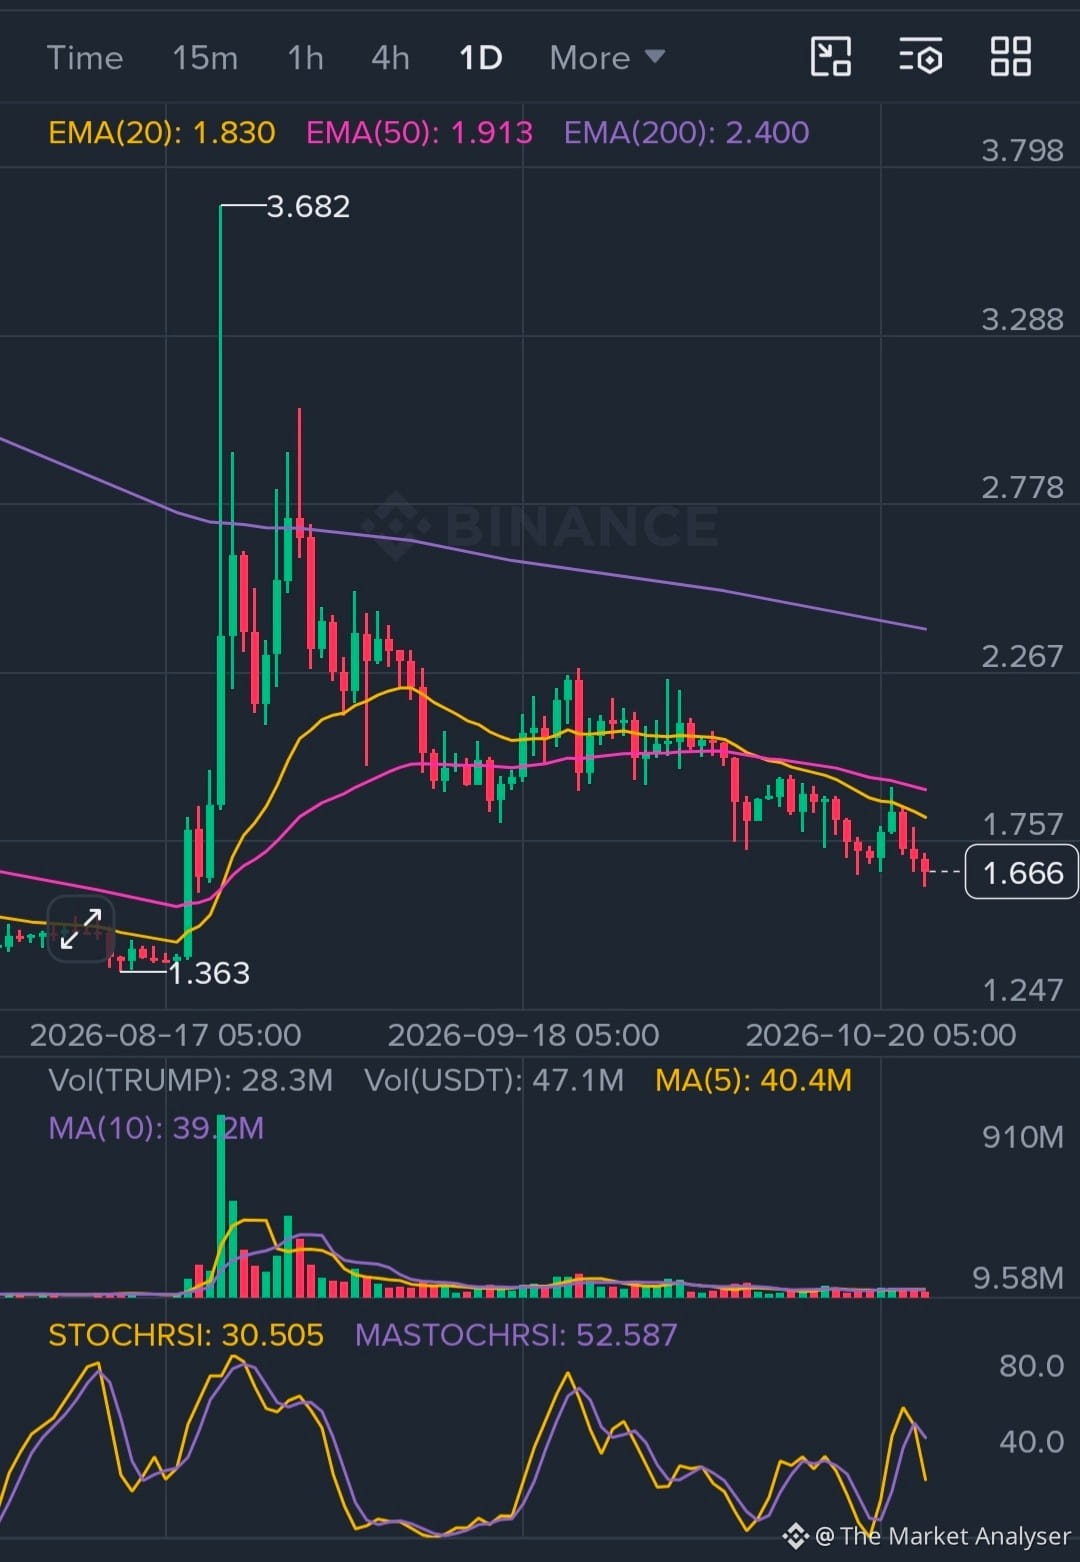
🔹 The Macro Reality (1D Frame): The daily chart is clearly in a bears' playground. Ever since dropping from $3.682, the price has failed to hold any major support lines. It is currently trading well below the Daily EMA 200 ($2.400) and EMA 50 ($1.913), making those areas massive resistance walls for any major reversal.
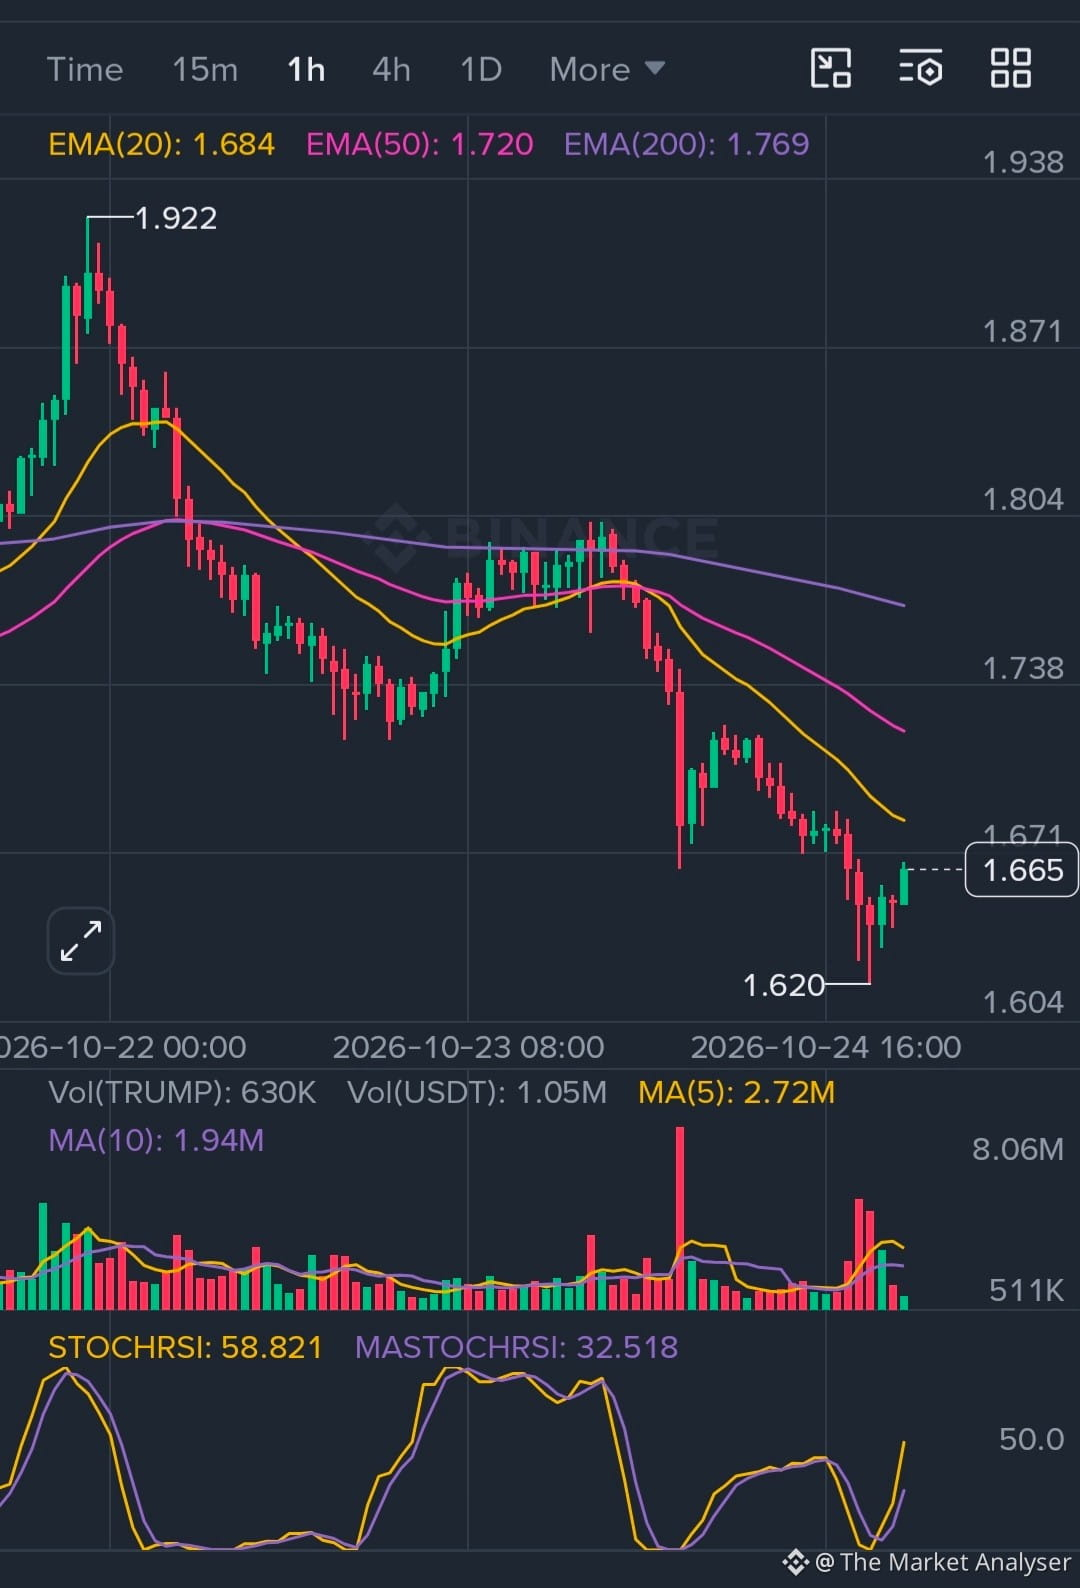
🔹 The Short-Term Squeeze (1H Frame): On the hourly chart, $TRUMP is sliding inside a strict descending compressed channel. After tagging a local low of $1.620, we are seeing a minor volume cluster trying to defend the floor.
🔹 My 4-Indicator Strategy Checklist:
1️⃣ EMA 200 Filter: Strictly Bearish bias on both Daily and 1H frames.
2️⃣ EMA 20 & 50: Acting as dynamic local caps around $1.684 - $1.720. We need an hourly candle close above $1.720 to spark any dynamic life.
3️⃣ StochRSI: Daily StochRSI is sitting down at 30.50 while 1H is recovering at 58.82. The energy is heavily coiled up for an imminent expansion move.
🎯 The Strategic Trade Set-up:
⚠️ The Safe Play: Avoid catching this falling knife right here. Wait for a clean 1H breakout and close above the 1H EMA 50 ($1.720) to scalp a quick long back to $1.850 - $1.900.
🚨 The Danger Zone: If the buyers fail to hold $1.600, the next major psychological support is all the way down at $1.360! Tight stop-losses are non-negotiable here.
💬 Let’s vote in the comments:
🔥 Where is $TRUMP heading next before the final countdown?
1️⃣ Comment 'BOUNCE' if you are buying this dip for a massive rally!
2️⃣ Comment 'DUMP' if you think it's breaking below $1.50 soon!
Share your entry plans below, let's track this together👇
#TRUMP #PolitiFi #TechnicalAnalysis #memecoins #TradingSignals
{spot}(TRUMPUSDT)
🚨 $TRUMP Bleeding -6%! Is This a Massive Election Hype Discount or a Dead End? 📉🇺🇸
The Politi-fi sector is getting wild as TRUMPUSDT Perpetual slides down to $1.665. While the political hype is peak outside, the charts are telling a very strict and unemotional story. Here is a breakdown using my 4-Indicator Strategy:
🔹 The Macro Reality (1D Frame): The daily chart is clearly in a bears' playground. Ever since dropping from $3.682, the price has failed to hold any major support lines. It is currently trading well below the Daily EMA 200 ($2.400) and EMA 50 ($1.913), making those areas massive resistance walls for any major reversal.
🔹 The Short-Term Squeeze (1H Frame): On the hourly chart, $TRUMP is sliding inside a strict descending compressed channel. After tagging a local low of $1.620, we are seeing a minor volume cluster trying to defend the floor.
🔹 My 4-Indicator Strategy Checklist:
1️⃣ EMA 200 Filter: Strictly Bearish bias on both Daily and 1H frames.
2️⃣ EMA 20 & 50: Acting as dynamic local caps around $1.684 - $1.720. We need an hourly candle close above $1.720 to spark any dynamic life.
3️⃣ StochRSI: Daily StochRSI is sitting down at 30.50 while 1H is recovering at 58.82. The energy is heavily coiled up for an imminent expansion move.
🎯 The Strategic Trade Set-up:
⚠️ The Safe Play: Avoid catching this falling knife right here. Wait for a clean 1H breakout and close above the 1H EMA 50 ($1.720) to scalp a quick long back to $1.850 - $1.900.
🚨 The Danger Zone: If the buyers fail to hold $1.600, the next major psychological support is all the way down at $1.360! Tight stop-losses are non-negotiable here.
💬 Let’s vote in the comments:
🔥 Where is $TRUMP heading next before the final countdown?
1️⃣ Comment 'BOUNCE' if you are buying this dip for a massive rally!
2️⃣ Comment 'DUMP' if you think it's breaking below $1.50 soon!
Share your entry plans below, let's track this together👇
#TRUMP #PolitiFi #TechnicalAnalysis #memecoins #TradingSignals
1
1
347
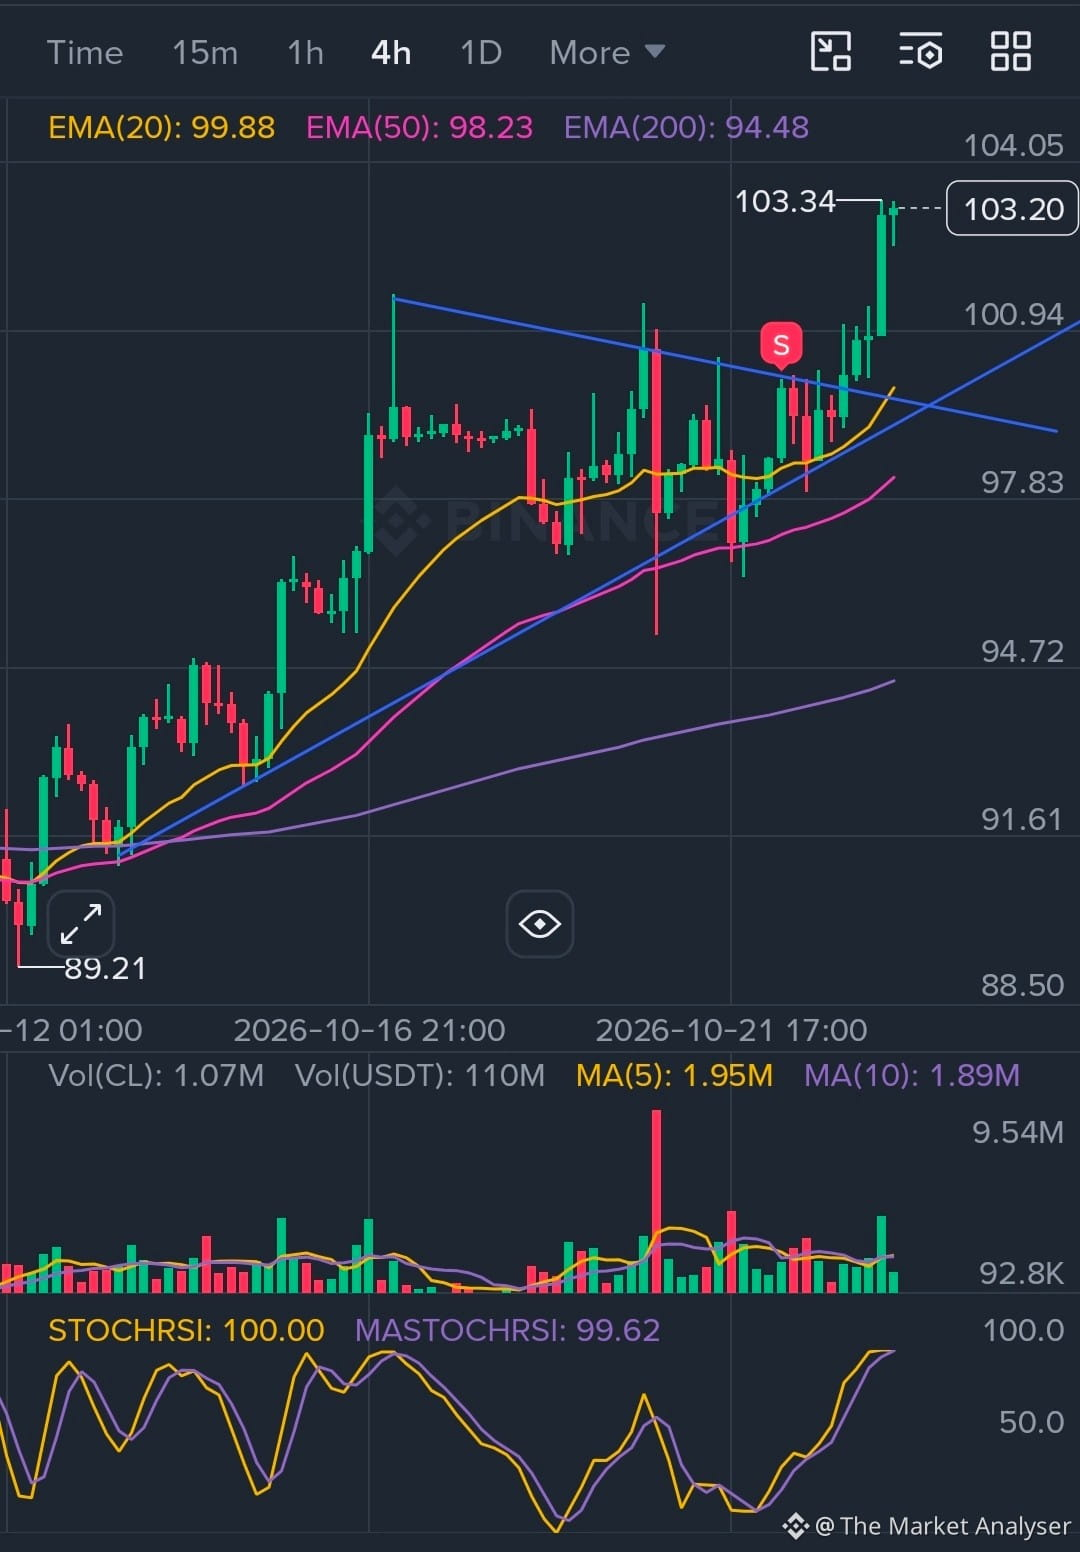
🚨 $CLUSDT Triangle Breakout Target Smashed! What’s Next for Crude Oil? 🚀🛢️
💥If you followed my technical analysis yesterday, you should be sitting in massive profits right now! 🤑
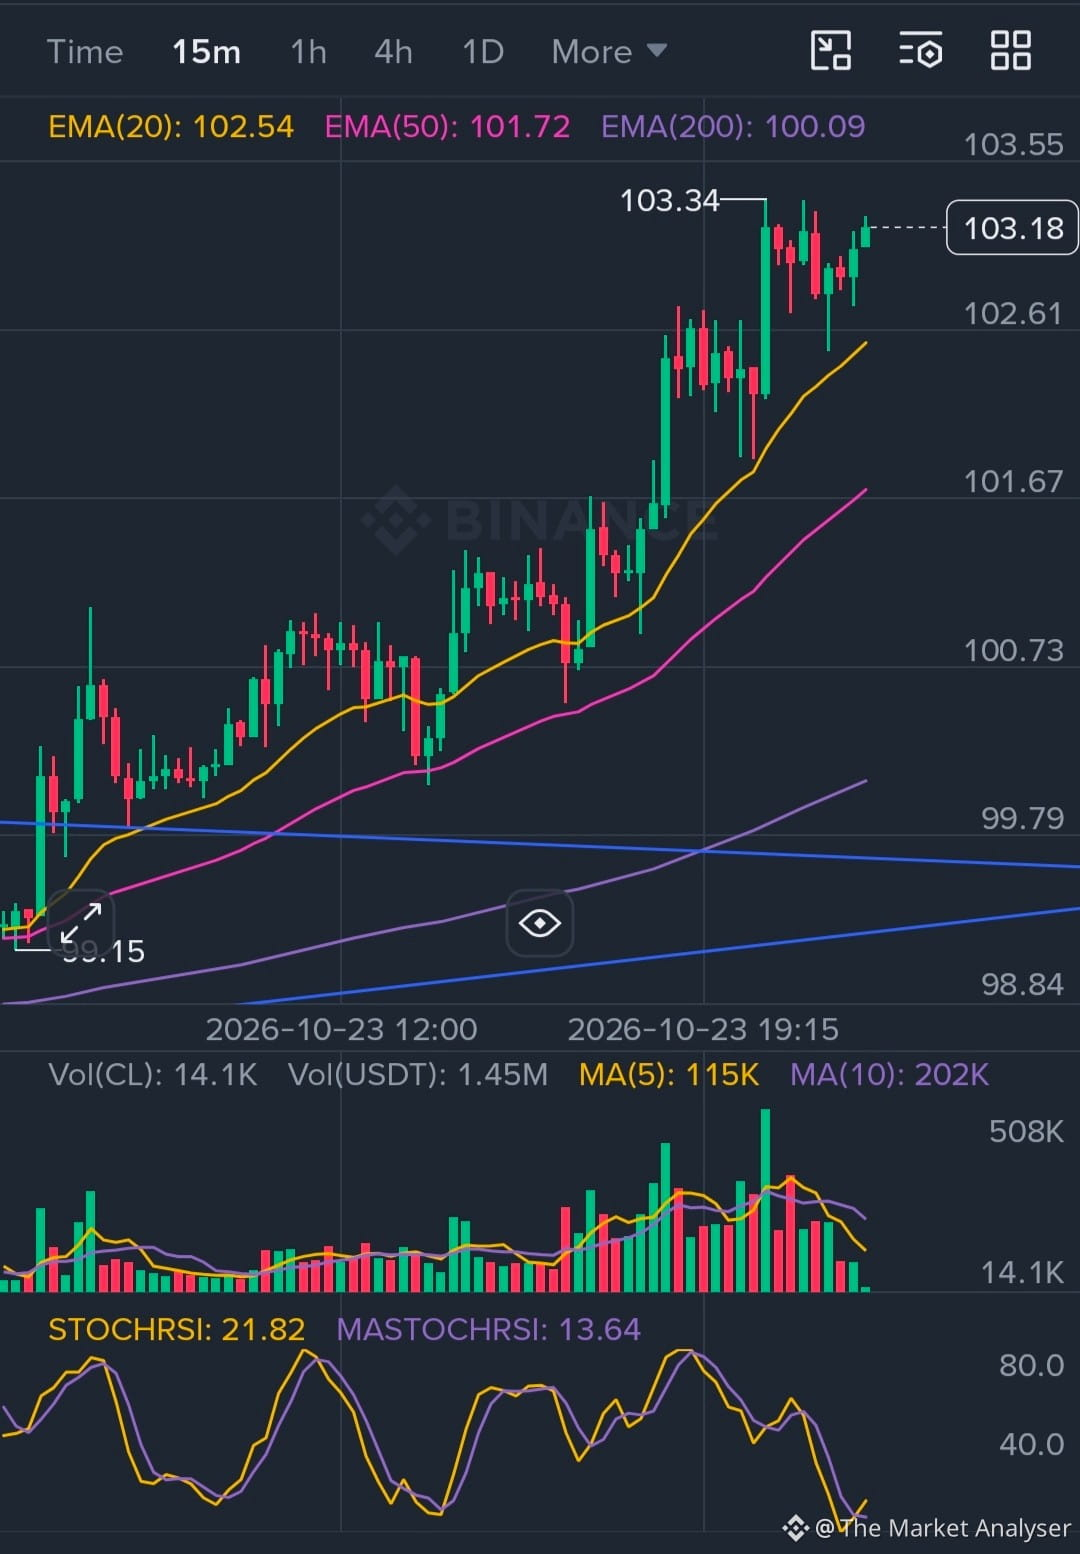
💥We predicted the Symmetrical Triangle Squeeze perfectly, and $CLUSDT just exploded exactly as planned, hitting a high of $103.34! 🎯🔥
💥Now, the macro trend has shifted violently, but where is the next big move hiding? Let’s re-analyze the new structures using my signature 4-Indicator Strategy:
💥🔹 The Big Picture (4H Frame): The daily/4H structure is purely institutional now. Price is trading far above the 4H EMA 200 ($94.48). The massive breakout has successfully cleared all major resistance levels, completely invalidating the bear cases for now.
💥🔹 The Fuel Check (15M Frame): This is where the magic happens. After the big pump to $103.34, the price did not dump; instead, it is consolidating sideways, holding strictly above the 15M EMA 20 ($102.54).
💥🔹 StochRSI Divergence: Look closely at the data! While the 4H momentum is maxed out at 100, the 15M StochRSI has fully reset to 21.82 (Oversold). This indicates that the local profit-taking phase is over, and the market is refueling for another leg up.
🎯 The Next Trading Plan:
🚀 The Continuation Play: A clean 15M breakout candle closing above $103.40 will send $CLUSDT straight into the $104.50 - $105.00 psychological zones.
🛡️ The Re-entry Zone: If we get a tiny minor dip toward $102.30 - $102.50 (15M EMA 20), it will be a high-probability loading zone for long scalpers.
🛑 Risk Cover: A breakdown back below $101.50 signals a deeper retracement.
💬 Let’s celebrate in the comments section!
💰 Did you make money on yesterday's triangle breakout call?
1️⃣ Comment 'YES' if you captured the massive green candle!
2️⃣ Comment 'MISSED' if you missed the train and want the next entry!
⚡Drop your active profit screenshots or targets below! 👇
#CLUSDT #CrudeOil #TechnicalAnalysis #Breakout #TradingSignals $CL
{future}(CLUSDT)
🚨 $CLUSDT Triangle Breakout Target Smashed! What’s Next for Crude Oil? 🚀🛢️
💥If you followed my technical analysis yesterday, you should be sitting in massive profits right now! 🤑
💥We predicted the Symmetrical Triangle Squeeze perfectly, and $CLUSDT just exploded exactly as planned, hitting a high of $103.34! 🎯🔥
💥Now, the macro trend has shifted violently, but where is the next big move hiding? Let’s re-analyze the new structures using my signature 4-Indicator Strategy:
💥🔹 The Big Picture (4H Frame): The daily/4H structure is purely institutional now. Price is trading far above the 4H EMA 200 ($94.48). The massive breakout has successfully cleared all major resistance levels, completely invalidating the bear cases for now.
💥🔹 The Fuel Check (15M Frame): This is where the magic happens. After the big pump to $103.34, the price did not dump; instead, it is consolidating sideways, holding strictly above the 15M EMA 20 ($102.54).
💥🔹 StochRSI Divergence: Look closely at the data! While the 4H momentum is maxed out at 100, the 15M StochRSI has fully reset to 21.82 (Oversold). This indicates that the local profit-taking phase is over, and the market is refueling for another leg up.
🎯 The Next Trading Plan:
🚀 The Continuation Play: A clean 15M breakout candle closing above $103.40 will send $CLUSDT straight into the $104.50 - $105.00 psychological zones.
🛡️ The Re-entry Zone: If we get a tiny minor dip toward $102.30 - $102.50 (15M EMA 20), it will be a high-probability loading zone for long scalpers.
🛑 Risk Cover: A breakdown back below $101.50 signals a deeper retracement.
💬 Let’s celebrate in the comments section!
💰 Did you make money on yesterday's triangle breakout call?
1️⃣ Comment 'YES' if you captured the massive green candle!
2️⃣ Comment 'MISSED' if you missed the train and want the next entry!
⚡Drop your active profit screenshots or targets below! 👇
#CLUSDT #CrudeOil #TechnicalAnalysis #Breakout #TradingSignals $CL
1
1
446
🚨 $ALT Dumped -37%! Is This the Ultimate Buying Dip or a Falling Knife? 🩸📉
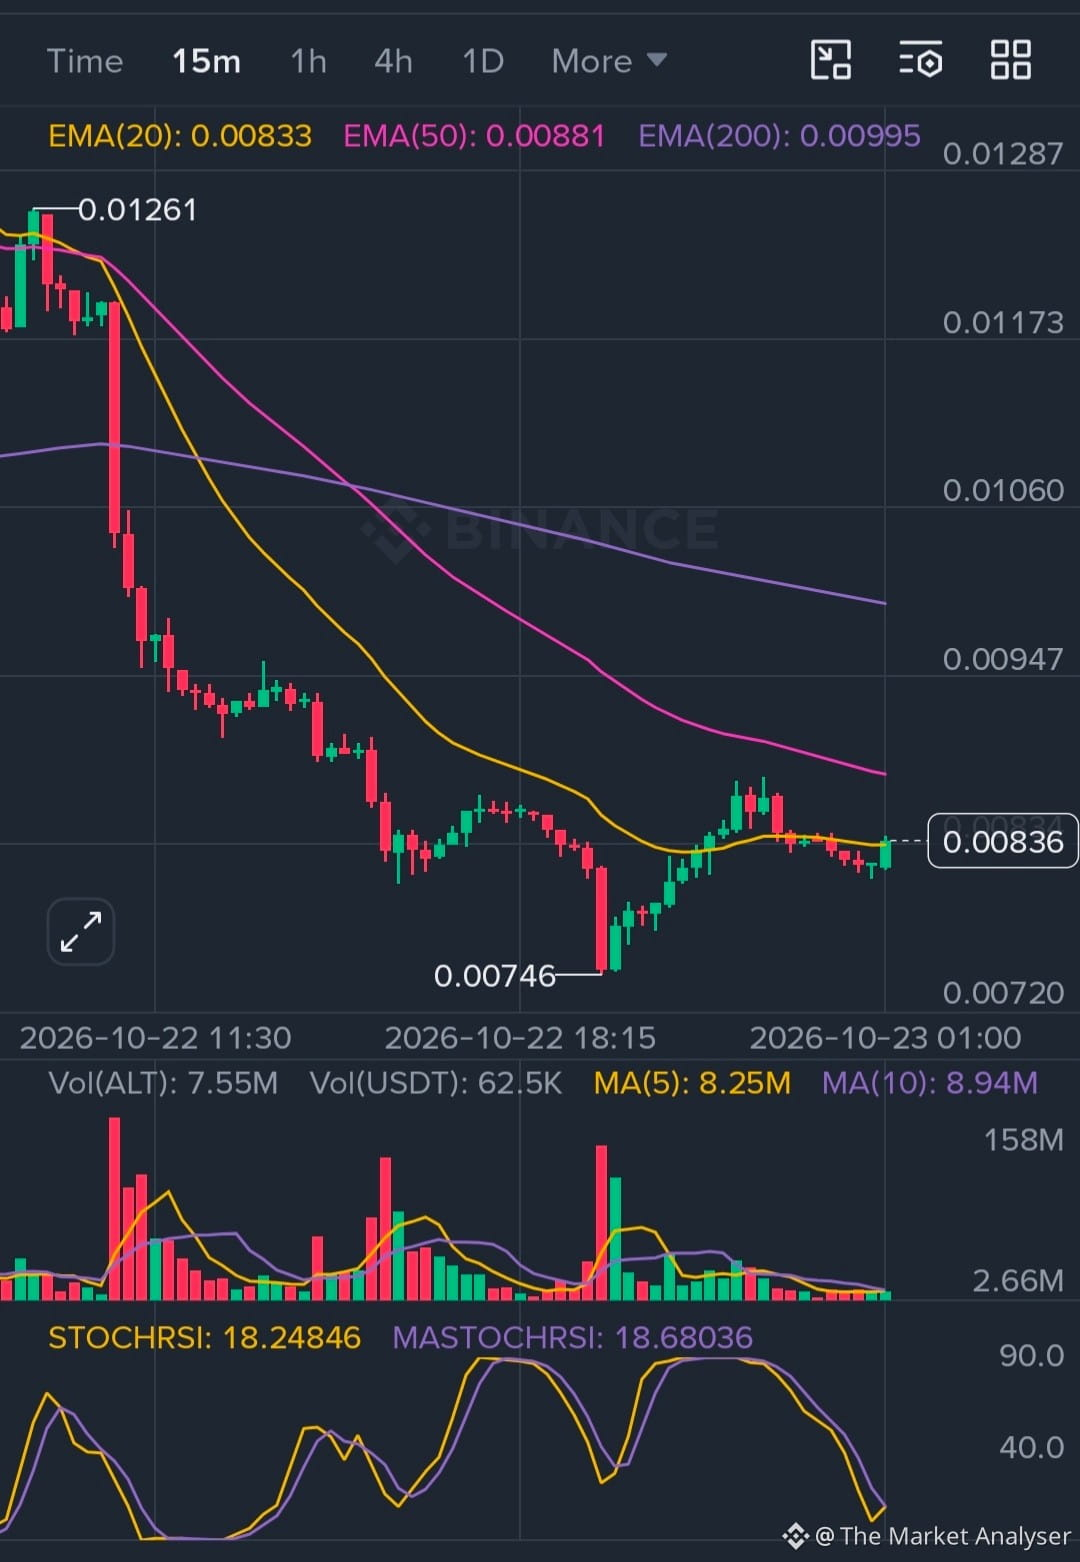
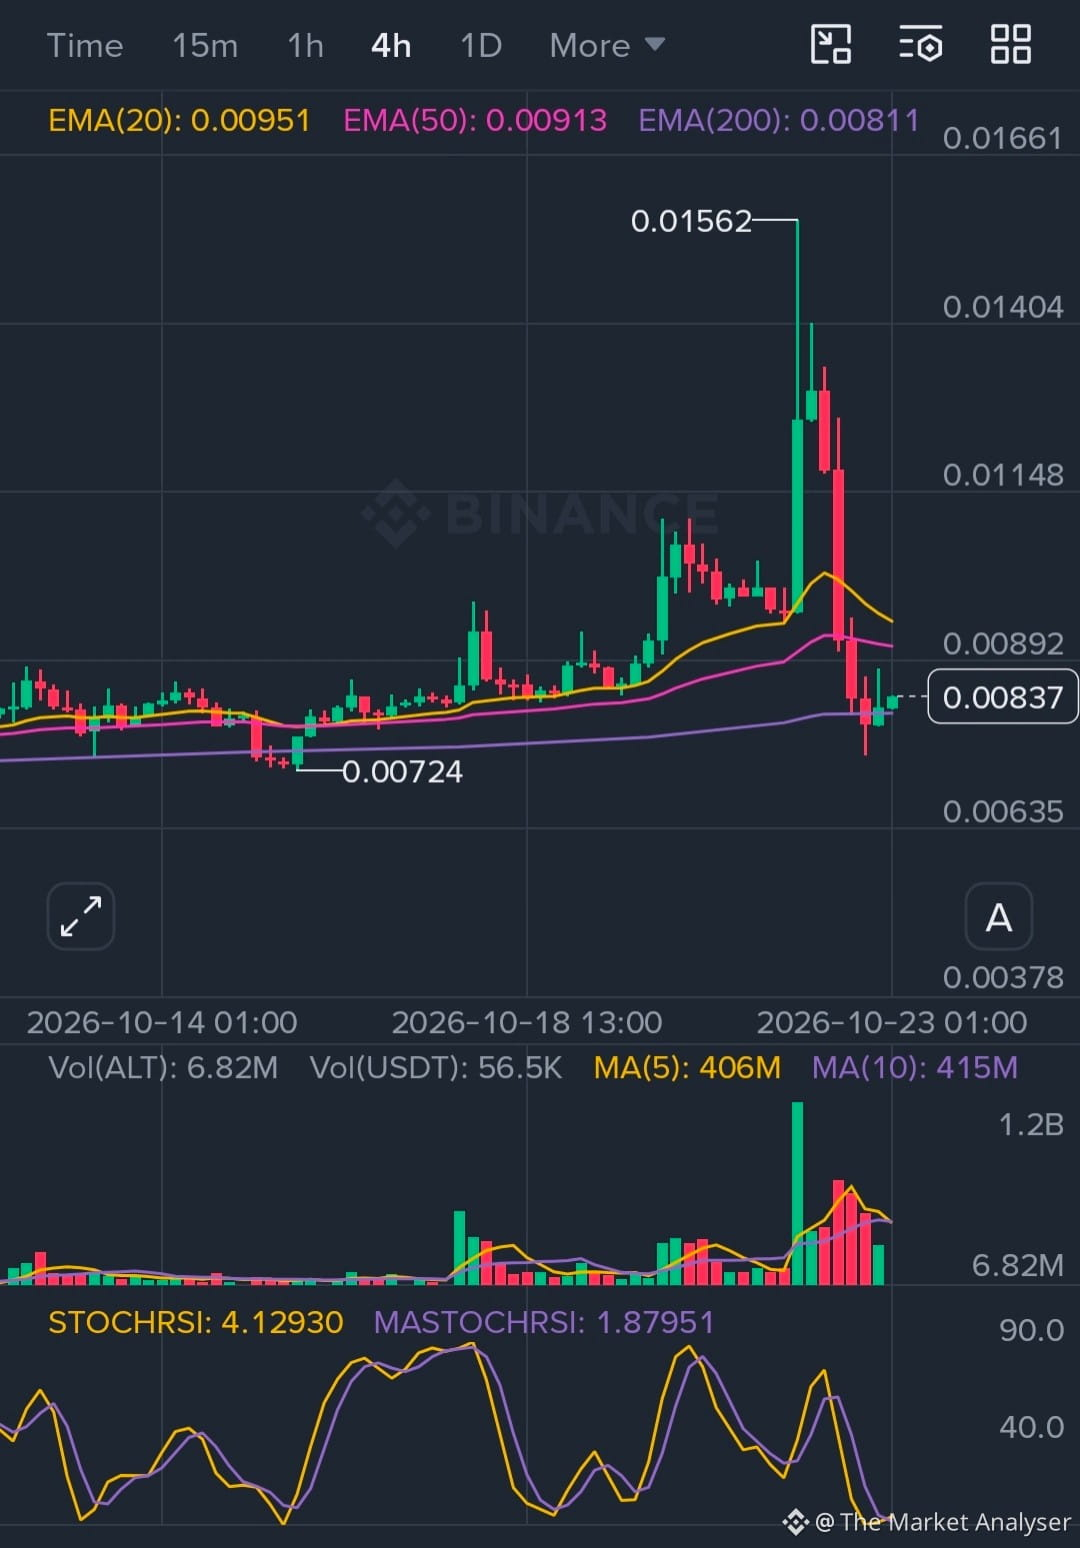
🔥AltLayer ($ALT) has completely wiped out its recent gains, crashing from $0.01562 straight down to $0.00837! Retail traders are panicking, but smart money is watching one specific indicator right now. Here is what my 4-Indicator Strategy reveals:
💥🔹 The Macro Support (4H Frame): Despite the heavy bloodbath, $ALT is currently testing its most critical trend line—the 4H EMA 200 ($0.00811). If the bulls fail to defend this level, the macro bullish structure is officially dead.
💥🔹 The Technical Breakdown (15M Frame): Short-term momentum is strongly bearish, trading well below the 15M EMA 200 ($0.00995). We also have a bearish crossover between the EMA 20 and EMA 50, keeping local caps on any fast recovery.
💥🔹 The Hidden Bullish Trigger (StochRSI): This is where it gets interesting! Look at the StochRSI on both timeframes:
⚡• 15M StochRSI: 18.24 (Heavily Oversold)
⚡• 4H StochRSI: 4.12 (Extremely Oversold)
⚡• Interpretation: Sellers are running out of fuel. A sharp, violent relief bounce is mathematically loading from this bottom zone!
🎯 The Execution Plan:
• 🛒 The Long Aggressive Entry: Layering limit orders right above the 4H EMA 200 zone ($0.00815 - $0.00835) offers a very high risk-to-reward ratio for a quick scalp bounce target of $0.00950.
• 🛑 Strict Risk Management: A clear 4H candle close below $0.00790 invalidates this setup instantly.
💬 Let’s see who has the diamond hands here:
🩸 Are you buying this blood, or are you too scared?
1️⃣ Comment 'BUY' if you are loading up near the EMA 200 floor!
2️⃣ Comment 'PASS' because you think it’s going to zero!
Drop your average buy entries below! 👇
#ALT #AltLayer #cryptocrash #TechnicalAnalysis #TradingSignals
$ALT
{future}(ALTUSDT)
🚨 $ALT Dumped -37%! Is This the Ultimate Buying Dip or a Falling Knife? 🩸📉
🔥AltLayer ($ALT ) has completely wiped out its recent gains, crashing from $0.01562 straight down to $0.00837! Retail traders are panicking, but smart money is watching one specific indicator right now. Here is what my 4-Indicator Strategy reveals:
💥🔹 The Macro Support (4H Frame): Despite the heavy bloodbath, $ALT is currently testing its most critical trend line—the 4H EMA 200 ($0.00811). If the bulls fail to defend this level, the macro bullish structure is officially dead.
💥🔹 The Technical Breakdown (15M Frame): Short-term momentum is strongly bearish, trading well below the 15M EMA 200 ($0.00995). We also have a bearish crossover between the EMA 20 and EMA 50, keeping local caps on any fast recovery.
💥🔹 The Hidden Bullish Trigger (StochRSI): This is where it gets interesting! Look at the StochRSI on both timeframes:
⚡• 15M StochRSI: 18.24 (Heavily Oversold)
⚡• 4H StochRSI: 4.12 (Extremely Oversold)
⚡• Interpretation: Sellers are running out of fuel. A sharp, violent relief bounce is mathematically loading from this bottom zone!
🎯 The Execution Plan:
• 🛒 The Long Aggressive Entry: Layering limit orders right above the 4H EMA 200 zone ($0.00815 - $0.00835) offers a very high risk-to-reward ratio for a quick scalp bounce target of $0.00950.
• 🛑 Strict Risk Management: A clear 4H candle close below $0.00790 invalidates this setup instantly.
💬 Let’s see who has the diamond hands here:
🩸 Are you buying this blood, or are you too scared?
1️⃣ Comment 'BUY' if you are loading up near the EMA 200 floor!
2️⃣ Comment 'PASS' because you think it’s going to zero!
Drop your average buy entries below! 👇
#ALT #AltLayer #cryptocrash #TechnicalAnalysis #TradingSignals
$ALT
1
1
369
🚨 $CLUSDT Squeezing Hard! A Massive Move Is Loading... Are You Ready? 🛢️⚠️
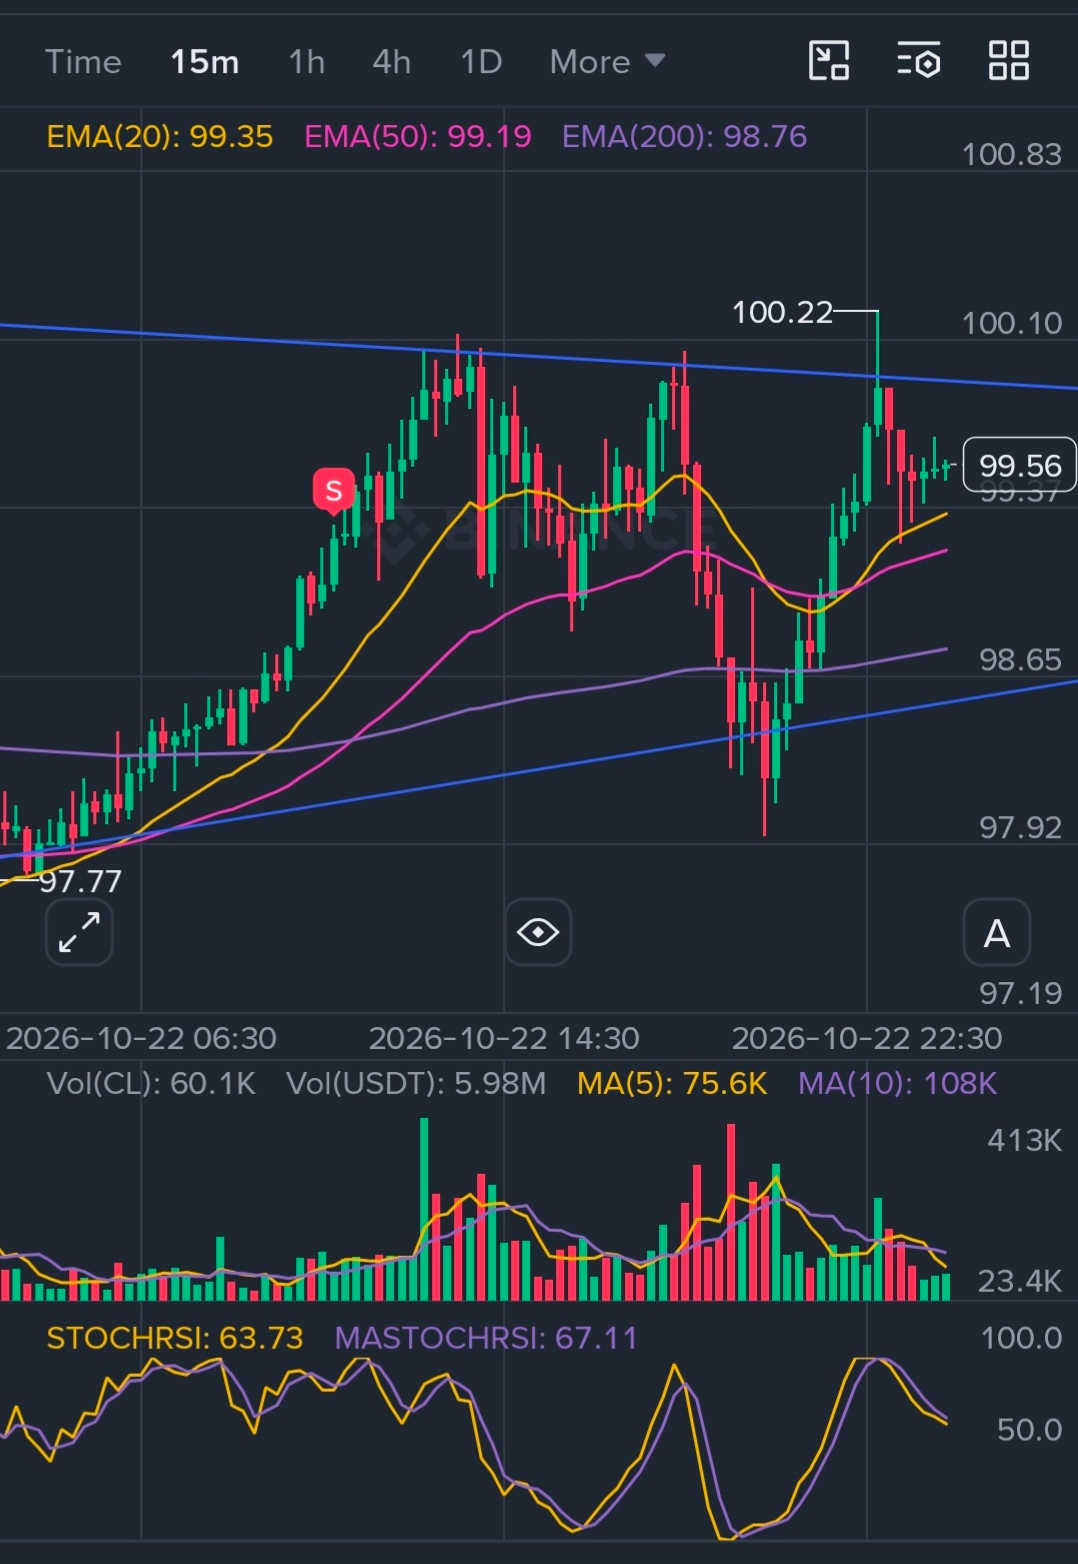
🔥Look at the charts of CLUSDT Perpetual. The market is preparing for a massive explosive move, and retail traders need to be extremely careful right now! Here is a clean look using my personal 4-Indicator Strategy:
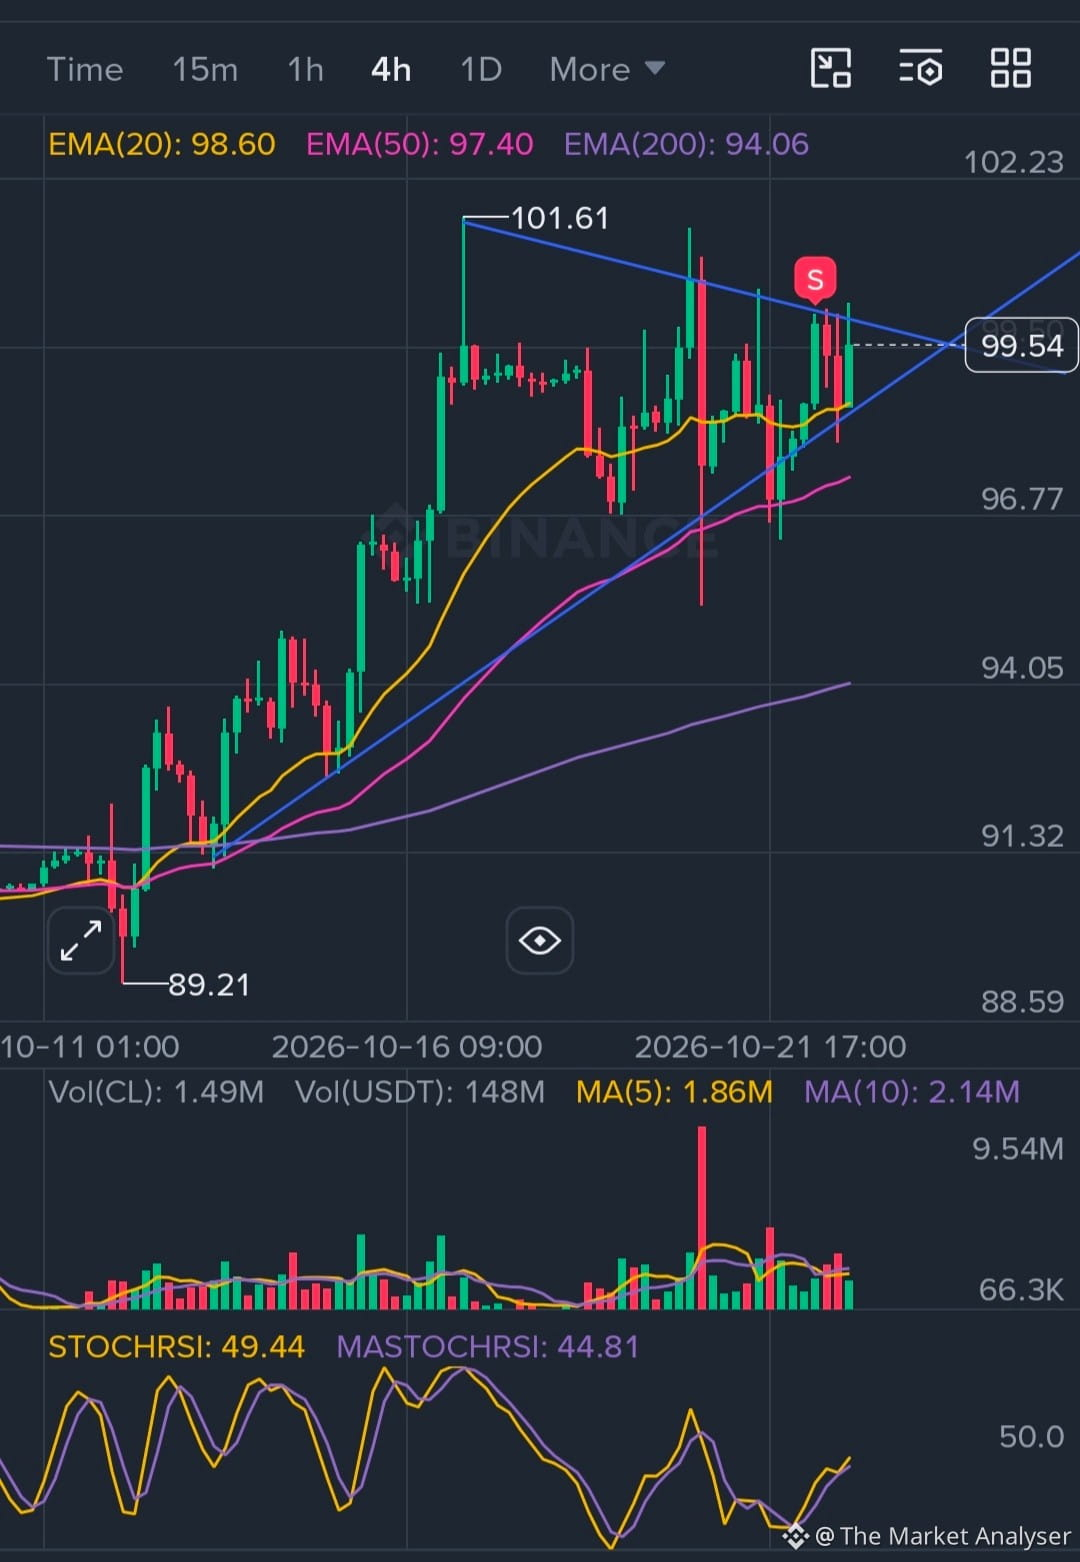
💥🔹 The Big Pattern (4H Frame): A massive Symmetrical Triangle has formed. The price is currently squeezing right at the edge of the triangle around $99.54. Historically, when a triangle squeezes this tight, a 4% to 5% violent move follows.
💥🔹 My 4-Indicator Strategy Check:
1️⃣ EMA 200 Trend Filter: Price is safely trading ABOVE the 4H EMA 200 ($94.06) and 15M EMA 200 ($98.76). Trend bias is Bullish.
2️⃣ EMA 20 & 50 Confluence: On the 15M frame, EMA 20 ($99.35) is holding beautifully above EMA 50 ($99.19), acting as dynamic support.
3️⃣ StochRSI Momentum: Sitting neutral at 63.73, leaving plenty of room for an upside rally if the breakout succeeds.
4️⃣ Volume: Volume is currently drying up—which perfectly confirms the triangle squeeze before the big explosion.
🎯 The Game Plan:
• 🚀 Bullish Breakout: A solid 1H candle close above $100.25 triggers a fast rally to $101.60 and $103.00.
• 📉 Bearish Breakdown: If we lose the EMA 20/50 support zone and break below $98.60, expect a dump back to $96.70.
⚠️ Rule of Thumb: Do not chase the middle zone. Wait for the triangle breakout confirmation!
💬 Let’s vote in the comments section:
💥 Where is $CLUSDT going next?
1️⃣ Comment 'PUMP' if you think it breaks $101+ today!
2️⃣ Comment 'DUMP' if this is a giant bull trap!
⚡Drop your current active positions below! 👇
#CLUSDT #CrudeOil #TechnicalAnalysis #ChartPatterns #tradingStrategy $CL
{future}(CLUSDT)
🚨 $CLUSDT Squeezing Hard! A Massive Move Is Loading... Are You Ready? 🛢️⚠️
🔥Look at the charts of CLUSDT Perpetual. The market is preparing for a massive explosive move, and retail traders need to be extremely careful right now! Here is a clean look using my personal 4-Indicator Strategy:
💥🔹 The Big Pattern (4H Frame): A massive Symmetrical Triangle has formed. The price is currently squeezing right at the edge of the triangle around $99.54. Historically, when a triangle squeezes this tight, a 4% to 5% violent move follows.
💥🔹 My 4-Indicator Strategy Check:
1️⃣ EMA 200 Trend Filter: Price is safely trading ABOVE the 4H EMA 200 ($94.06) and 15M EMA 200 ($98.76). Trend bias is Bullish.
2️⃣ EMA 20 & 50 Confluence: On the 15M frame, EMA 20 ($99.35) is holding beautifully above EMA 50 ($99.19), acting as dynamic support.
3️⃣ StochRSI Momentum: Sitting neutral at 63.73, leaving plenty of room for an upside rally if the breakout succeeds.
4️⃣ Volume: Volume is currently drying up—which perfectly confirms the triangle squeeze before the big explosion.
🎯 The Game Plan:
• 🚀 Bullish Breakout: A solid 1H candle close above $100.25 triggers a fast rally to $101.60 and $103.00.
• 📉 Bearish Breakdown: If we lose the EMA 20/50 support zone and break below $98.60, expect a dump back to $96.70.
⚠️ Rule of Thumb: Do not chase the middle zone. Wait for the triangle breakout confirmation!
💬 Let’s vote in the comments section:
💥 Where is $CLUSDT going next?
1️⃣ Comment 'PUMP' if you think it breaks $101+ today!
2️⃣ Comment 'DUMP' if this is a giant bull trap!
⚡Drop your current active positions below! 👇
#CLUSDT #CrudeOil #TechnicalAnalysis #ChartPatterns #tradingStrategy $CL
1
1
250
🚨 Be Honest: Did you catch this $ALT pump, or are you holding the bag at the top? 📉
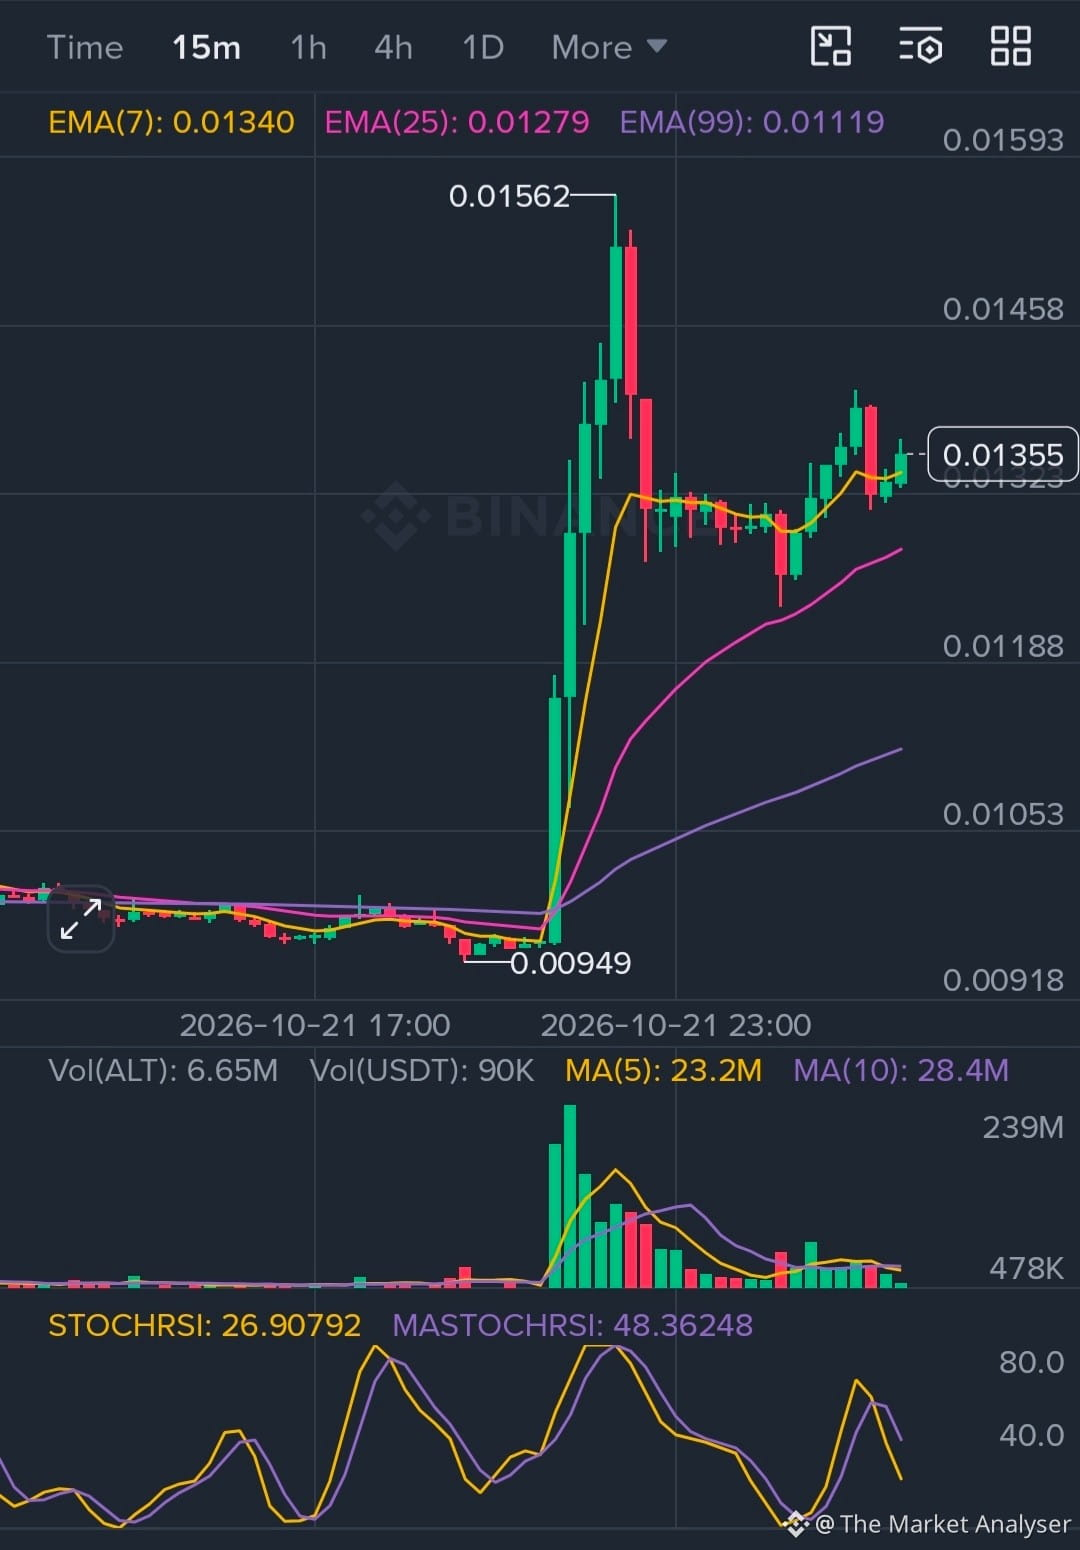
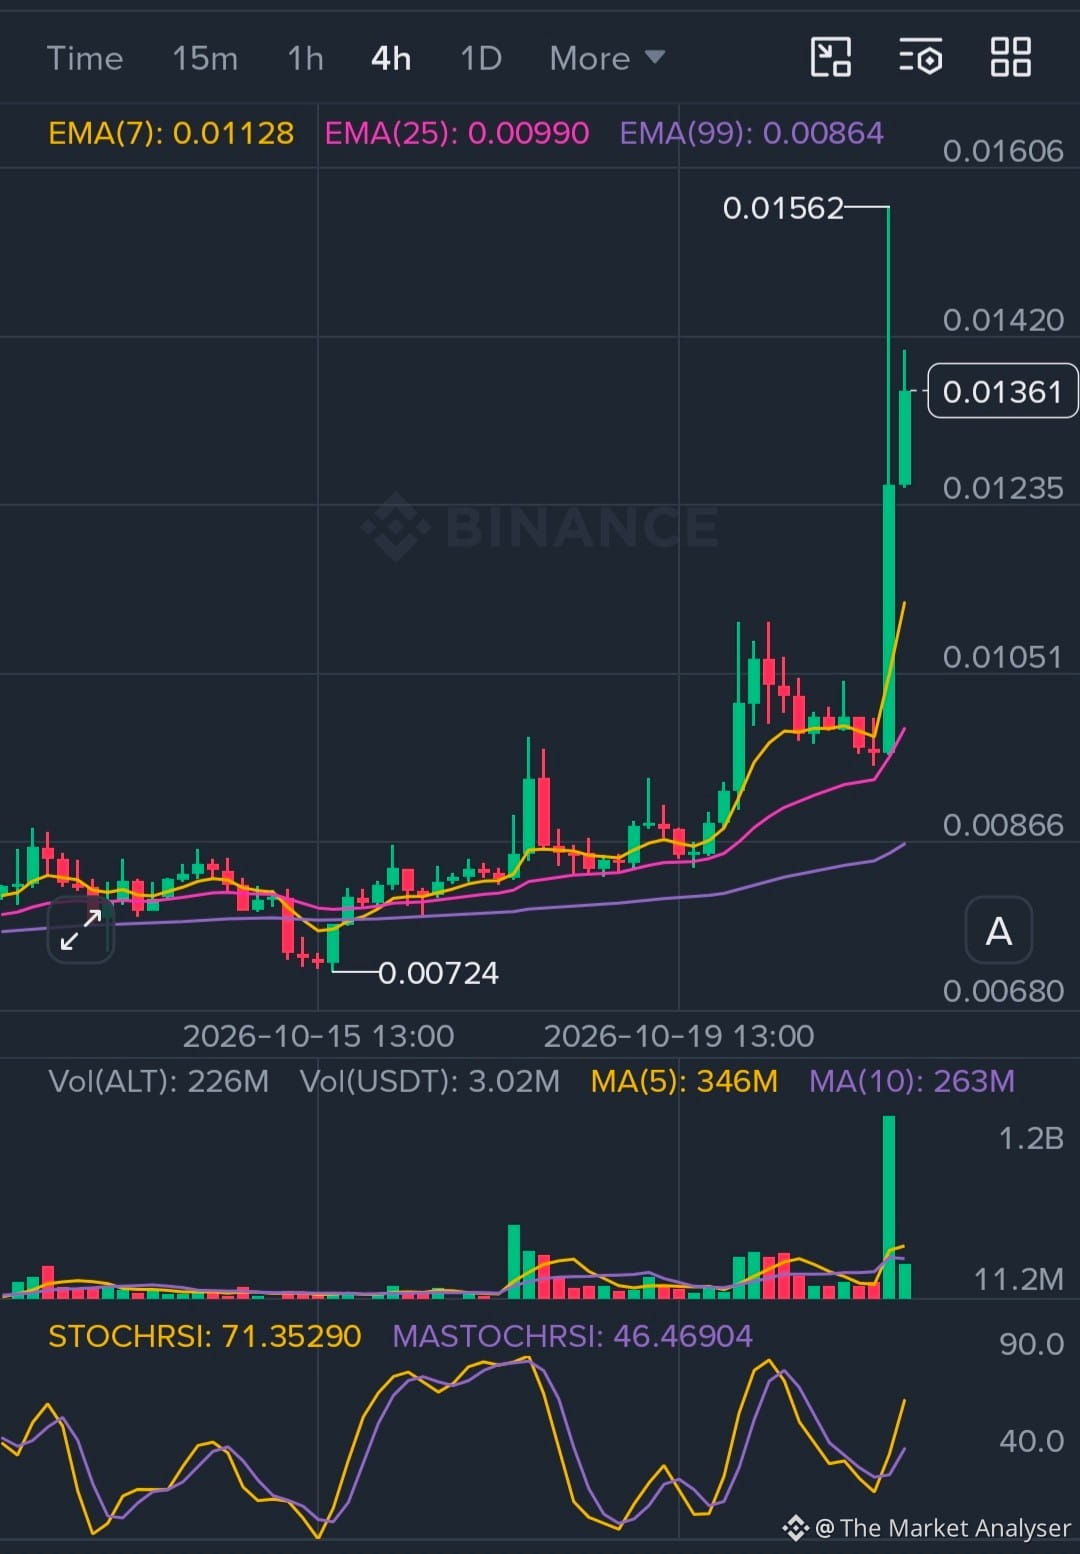
💥AltLayer ($ALT) is currently up +39%, trading around $0.01361 after explosive buying volume! The charts look absolutely wild, but before you FOMO in, let’s look at the reality of the numbers:
💥🔹 The 4H Macro View: We just witnessed a massive big-candle breaking out from the $0.00724 bottom. It confidently smashed through all major EMAs (7, 25, 99). However, a vertical move like this usually needs to breathe.
💥🔹 The 15M Micro View: After hitting a local high of $0.01562, price is consolidating. The 15M StochRSI has cooled down heavily to 26.90 (near oversold), while the price is holding above the EMA(7) at $0.01340. This shows that buyers are actively defending the dip.
🚧 Key Levels to Watch:
• Support Zone: $0.01280 - $0.01340 (Crucial for the next leg up).
• Resistance Zone: $0.01560 (Breaking this leads to price discovery).
⚠️ My Plan: Chasing a +39% green candle is how most retail traders lose money. I am waiting to see if the 15m frame builds a solid base around $0.01300 before looking for any scalping entries.
💬 Let’s settle this in the comments:
1️⃣ Option A: This is a fake-out, it's going back to $0.0100!
2️⃣ Option B: Re-fueling right now, next stop is $0.0180!
Where did you enter? Drop your entries below! 👇
#ALT #AltLayer #TopGainer #FOMO #TechnicalAnalysis
$ALT
{spot}(ALTUSDT)
🚨 Be Honest: Did you catch this $ALT pump, or are you holding the bag at the top? 📉
💥AltLayer ($ALT ) is currently up +39%, trading around $0.01361 after explosive buying volume! The charts look absolutely wild, but before you FOMO in, let’s look at the reality of the numbers:
💥🔹 The 4H Macro View: We just witnessed a massive big-candle breaking out from the $0.00724 bottom. It confidently smashed through all major EMAs (7, 25, 99). However, a vertical move like this usually needs to breathe.
💥🔹 The 15M Micro View: After hitting a local high of $0.01562, price is consolidating. The 15M StochRSI has cooled down heavily to 26.90 (near oversold), while the price is holding above the EMA(7) at $0.01340. This shows that buyers are actively defending the dip.
🚧 Key Levels to Watch:
• Support Zone: $0.01280 - $0.01340 (Crucial for the next leg up).
• Resistance Zone: $0.01560 (Breaking this leads to price discovery).
⚠️ My Plan: Chasing a +39% green candle is how most retail traders lose money. I am waiting to see if the 15m frame builds a solid base around $0.01300 before looking for any scalping entries.
💬 Let’s settle this in the comments:
1️⃣ Option A: This is a fake-out, it's going back to $0.0100!
2️⃣ Option B: Re-fueling right now, next stop is $0.0180!
Where did you enter? Drop your entries below! 👇
#ALT #AltLayer #TopGainer #FOMO #TechnicalAnalysis
$ALT
2
1
322
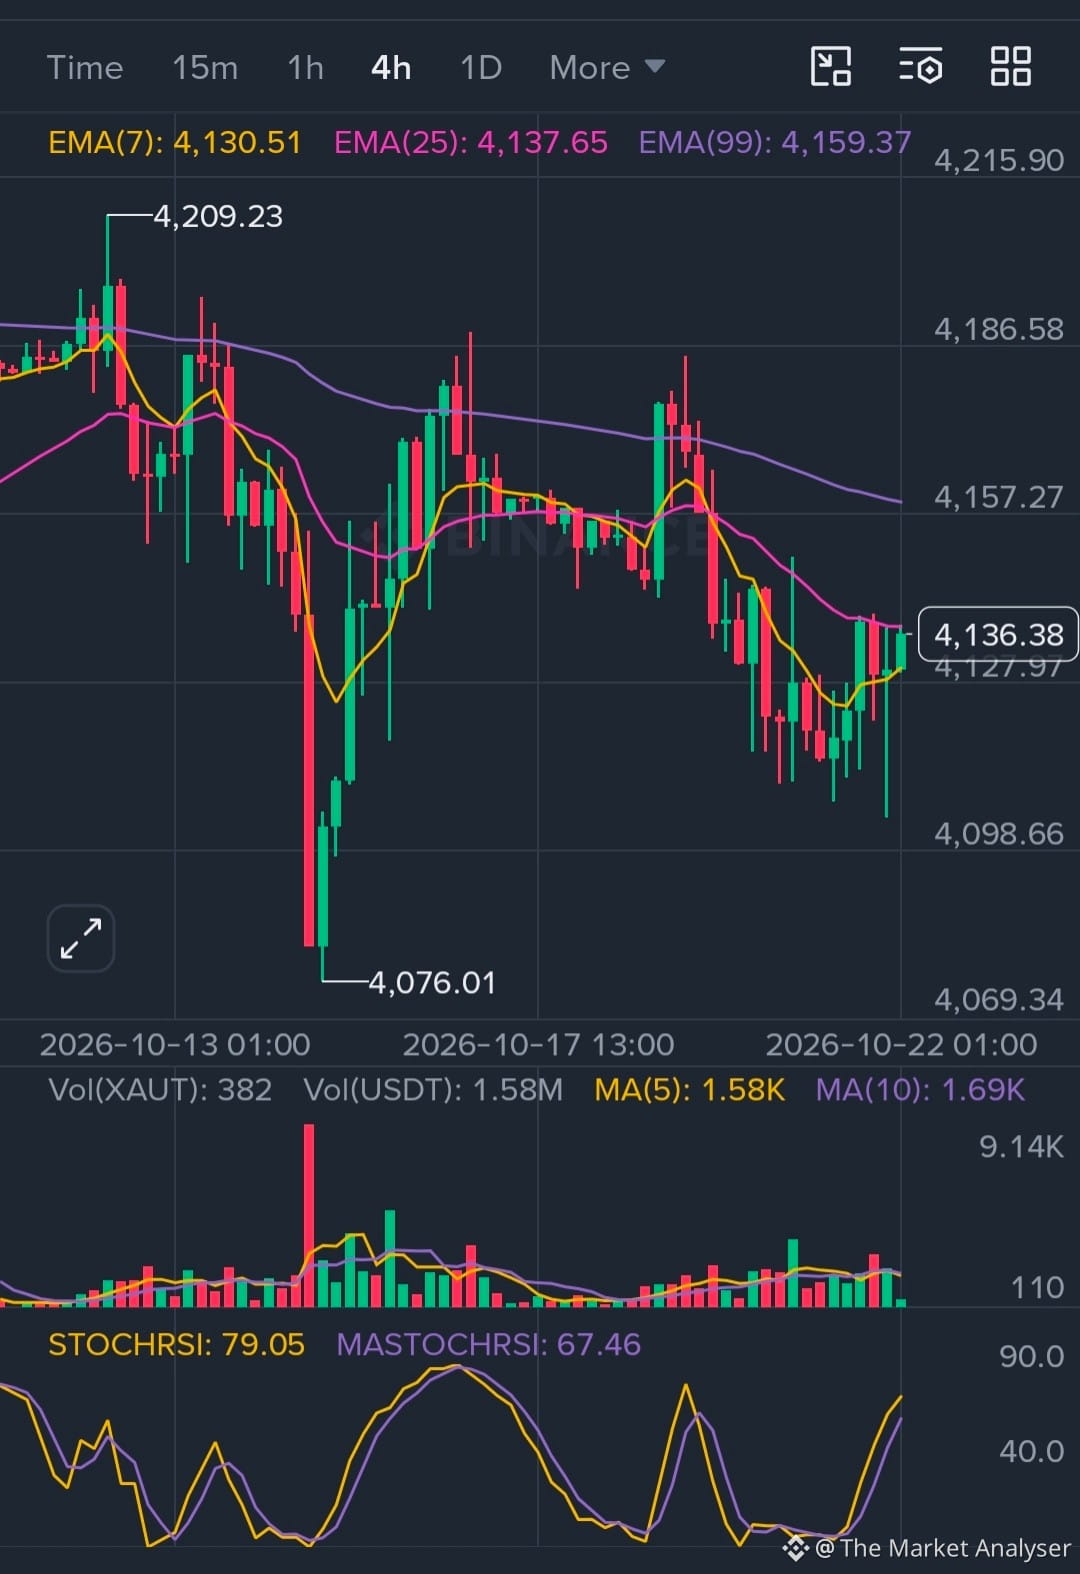
💥 Tether Gold ($XAUT) Technical Update: Rebound Underway, Can It Reclaim $4,160? 🪙✨
{future}(XAUTUSDT)
💥Analyzing the 4H and 15M frames for XAUT/USDT, here is a data-driven outlook for the next move:
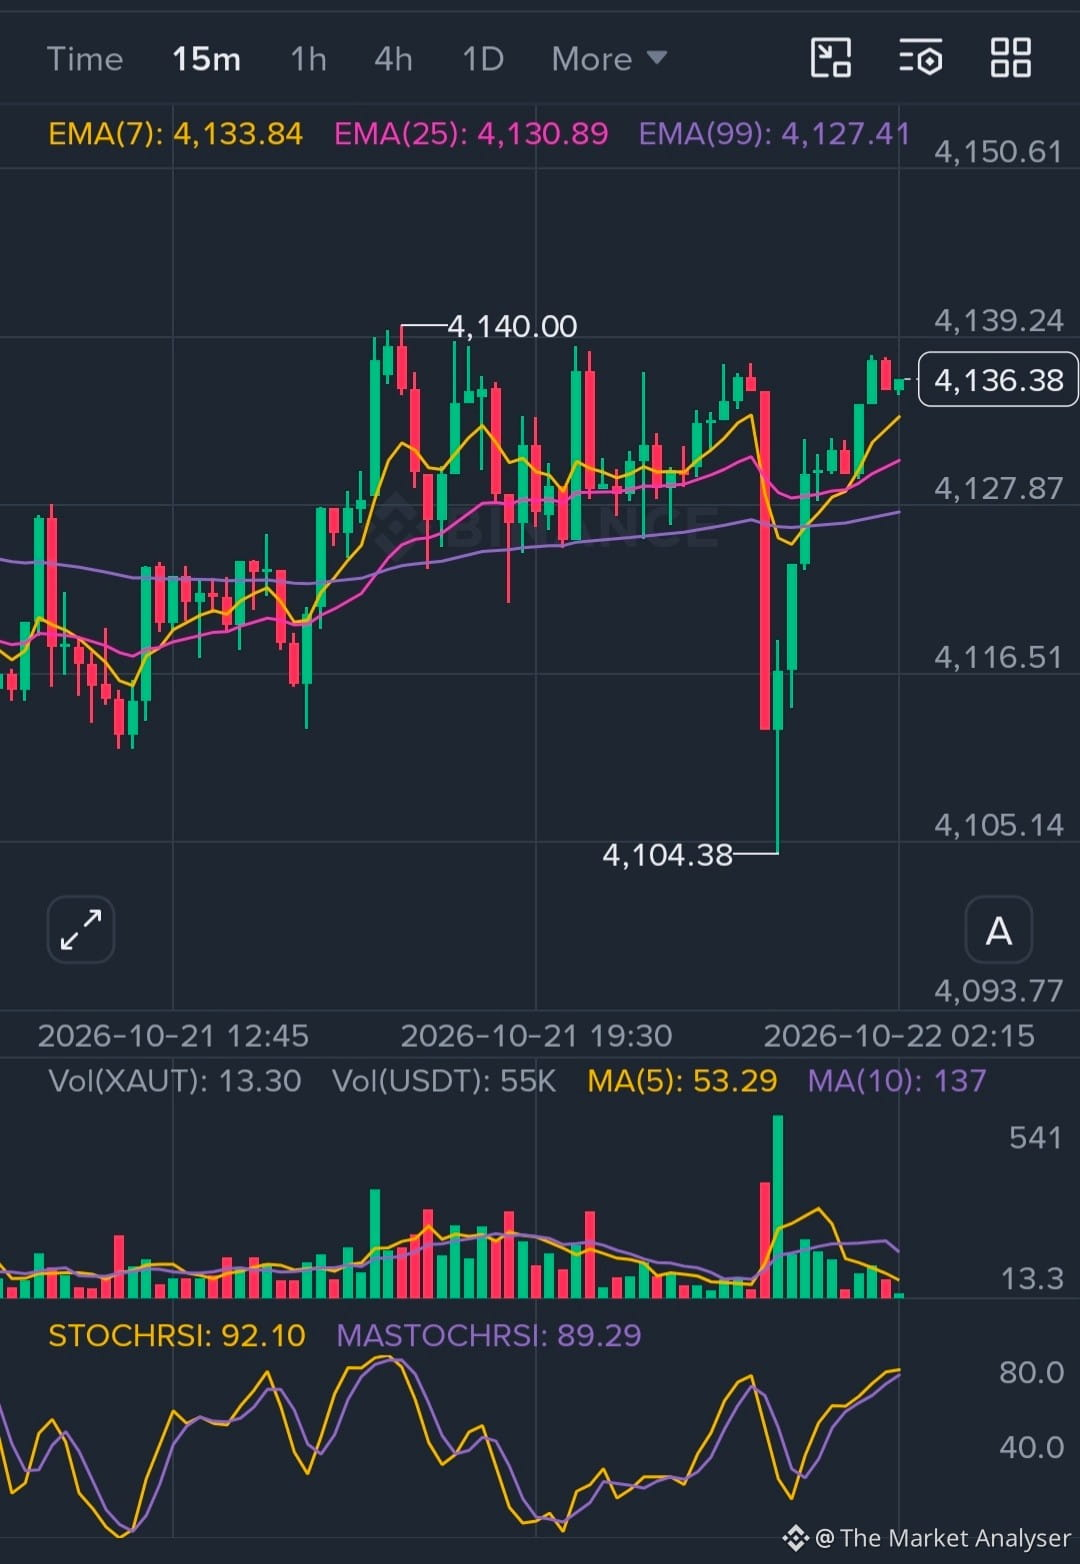
💥🔹 Macro Outlook (4H): After a steep correction from the peak of $4,209.23 down to $4,076.01, XAUT has established a firm bottom. The price is currently testing the 4H EMA(25) at $4,136.38. A weekly close or solid candle close above this zone shifts control back to the bulls.
💥🔹 Micro Momentum (15M): Extremely bullish short-term structure! Price has successfully reclaimed all major EMAs (7, 25, & 99) after bouncing from $4,104.38. Volume is supporting the move, though StochRSI at 92.10 suggests a brief local cool-off or consolidation could occur before the next leg up.
🎯 Key Trading Levels:
• 🚧 Immediate Resistance: $4,140 (recent local high) and $4,160 (4H EMA 99 zone). Reclaiming $4,160 opens the doors for a retest of $4,200+.
• 🛡️ Crucial Support: $4,127 - $4,130 (15M EMA confluence). Losing this could push the price back to test $4,104.
💡 Strategic Take: The path of least resistance looks upwards, but due to overbought indicators on the 15M frame, avoid chasing green candles. Look for minor dips towards $4,130 to build long positions with a tight stop-loss below $4,125.
🚫Disclaimer: Not financial advice. Always manage your risk responsibly.
#XAUT #GOLD #TechnicalAnalysis #TradingSignals #CryptoGold
$XAUT
💥 Tether Gold ($XAUT ) Technical Update: Rebound Underway, Can It Reclaim $4,160? 🪙✨
💥Analyzing the 4H and 15M frames for XAUT/USDT, here is a data-driven outlook for the next move:
💥🔹 Macro Outlook (4H): After a steep correction from the peak of $4,209.23 down to $4,076.01, XAUT has established a firm bottom. The price is currently testing the 4H EMA(25) at $4,136.38. A weekly close or solid candle close above this zone shifts control back to the bulls.
💥🔹 Micro Momentum (15M): Extremely bullish short-term structure! Price has successfully reclaimed all major EMAs (7, 25, & 99) after bouncing from $4,104.38. Volume is supporting the move, though StochRSI at 92.10 suggests a brief local cool-off or consolidation could occur before the next leg up.
🎯 Key Trading Levels:
• 🚧 Immediate Resistance: $4,140 (recent local high) and $4,160 (4H EMA 99 zone). Reclaiming $4,160 opens the doors for a retest of $4,200+.
• 🛡️ Crucial Support: $4,127 - $4,130 (15M EMA confluence). Losing this could push the price back to test $4,104.
💡 Strategic Take: The path of least resistance looks upwards, but due to overbought indicators on the 15M frame, avoid chasing green candles. Look for minor dips towards $4,130 to build long positions with a tight stop-loss below $4,125.
🚫Disclaimer: Not financial advice. Always manage your risk responsibly.
#XAUT #GOLD #TechnicalAnalysis #TradingSignals #CryptoGold
$XAUT
1
1
173
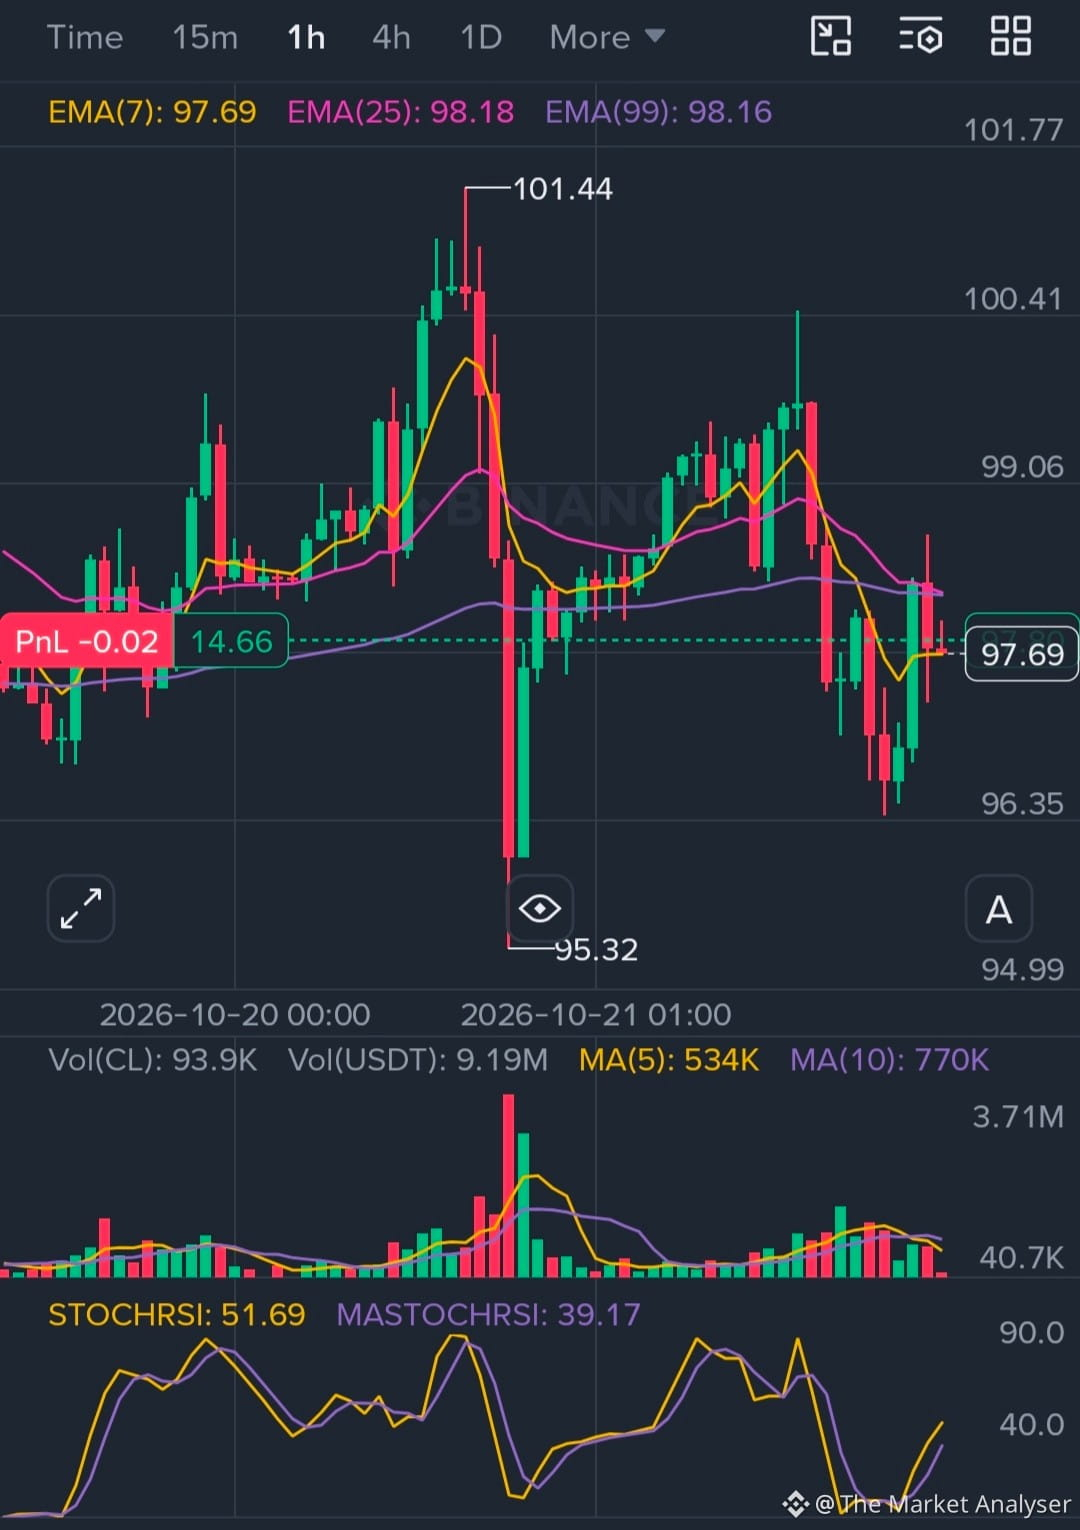
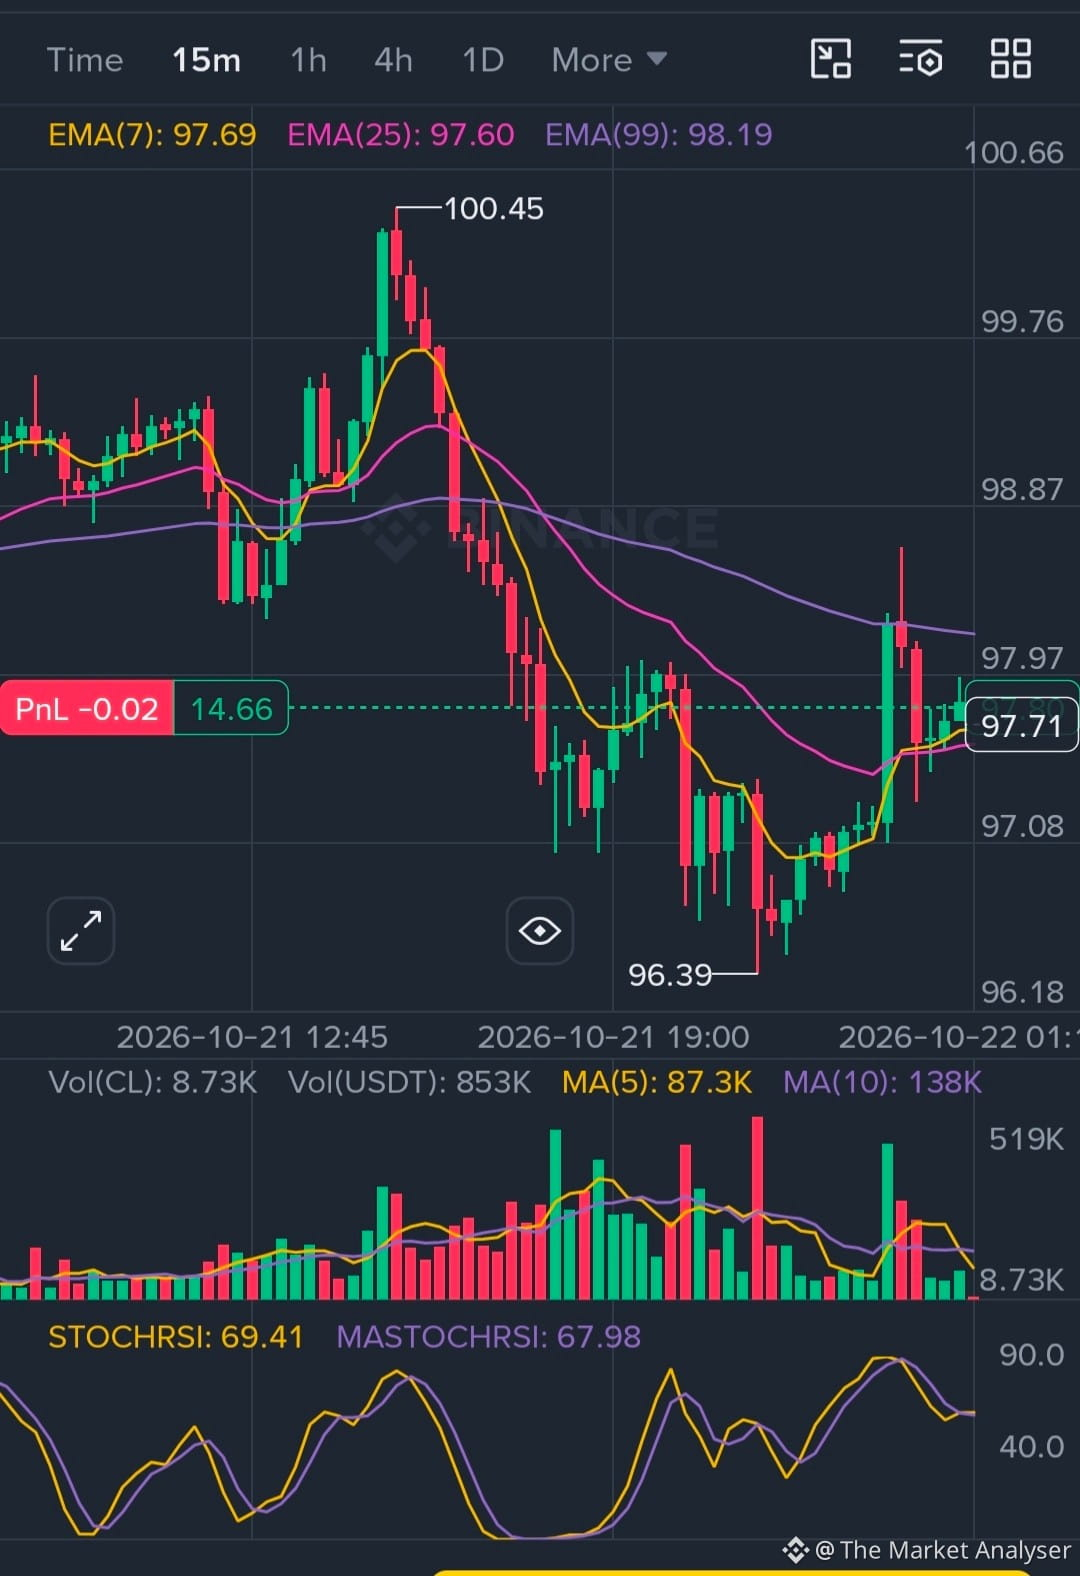
💥 WTI Crude Oil ($CLUSDT) Update: Recovery Mode or Another Trap? 🛢️
💥Analyzing the 1H and 15M charts for CLUSDT Perpetual, here is what the data suggests for the next immediate move:
💥🔹 The Big Picture (1H): After a sharp rejection from $101.44 down to $95.32, the market is attempting a relief rally. However, price remains capped below the key EMAs (25 & 99), indicating underlying bearish pressure on macro frames.
💥🔹 Short-Term Momentum (15M): We are seeing a local bullish structure. Price has reclaimed the 15M EMA(7) and EMA(25), sitting around $97.71. StochRSI is rising (69.41), showing active buying volume coming in at lower levels.
🎯 Trading Plan & Key Levels:
• 🚧 Immediate Resistance: $98.00 - $98.20 (Zone of 15M EMA 99). A clean breakout above this triggers a fast move towards $99.00+.
• 🛡️ Key Support: $97.00 - $96.40. If this breaks, expect a retest of the recent lows near $95.30.
💡 Verdict: Scalpers can look for quick longs if $97.70 holds, targeting $98.20. Aggressive traders should wait for a confirmed break above $98.20 or a rejection pattern to short back to $96.50. Always manage your risk with tight stop-losses!
🚫Disclaimer: Not financial advice. Trade at your own risk.
#CLUSDT #CrudeOil #TechnicalAnalysis #cryptotrading #TradingSignals
$CL
1
2
319
·
--
Падение
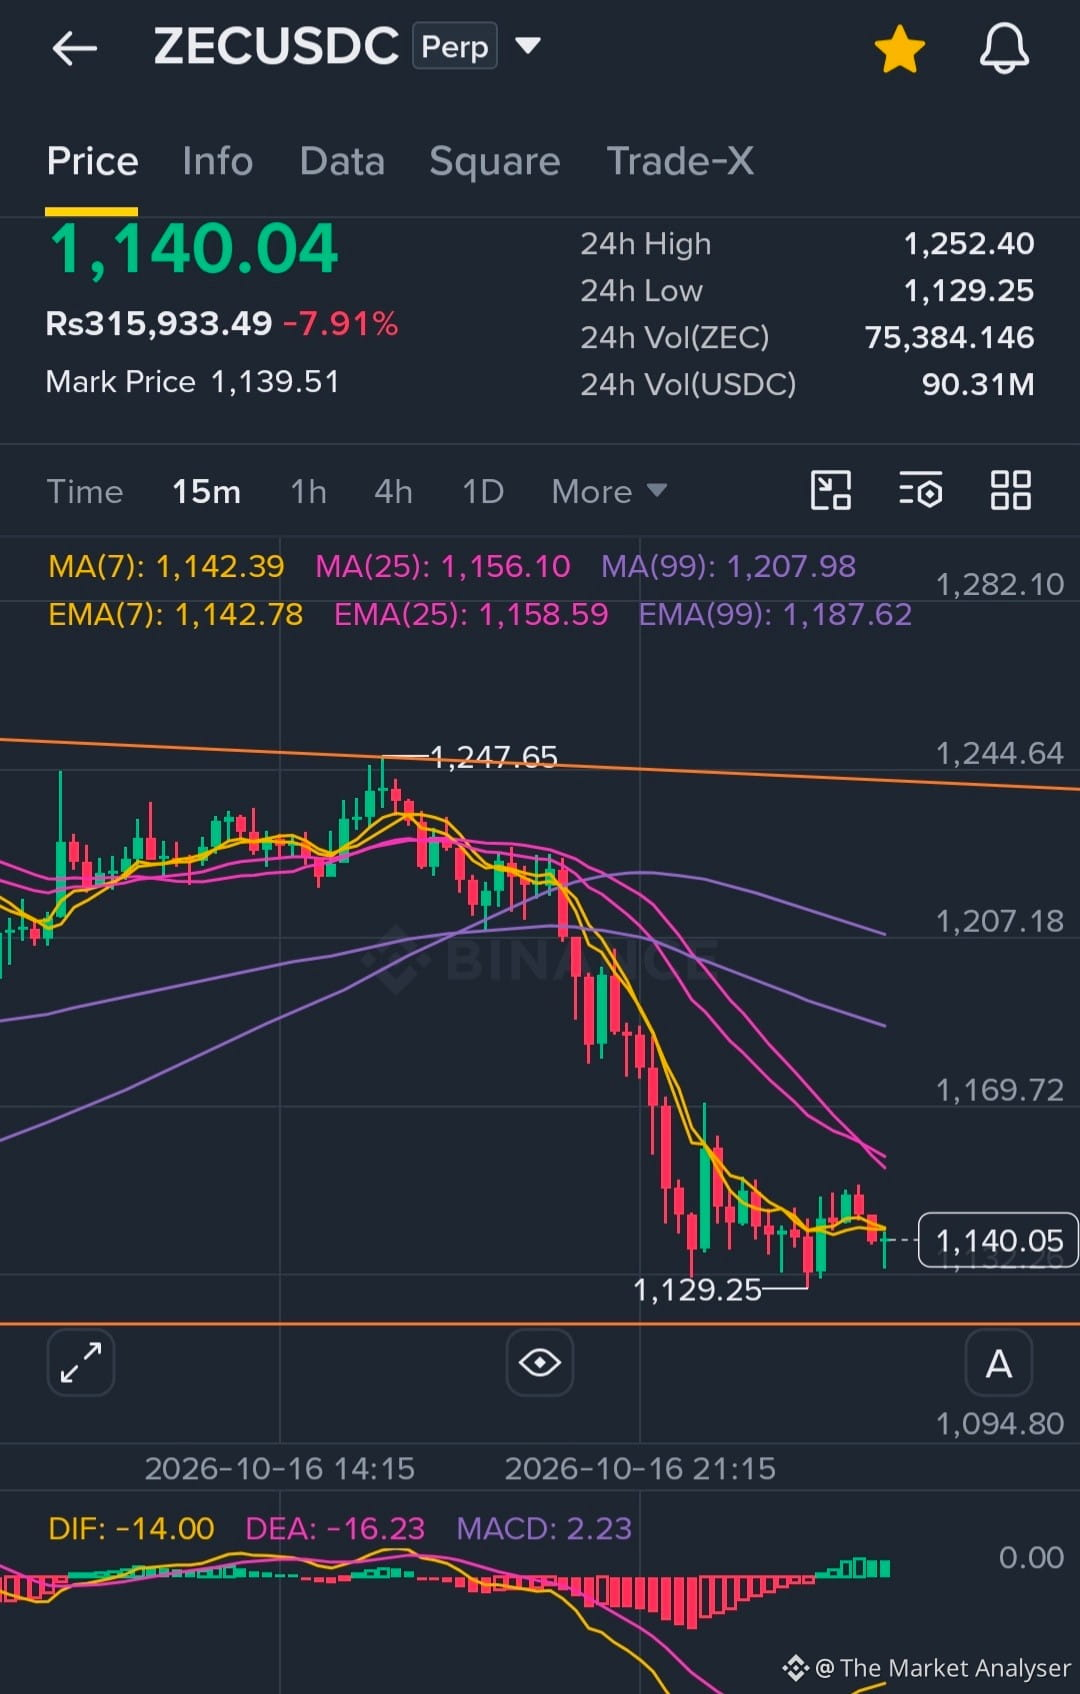
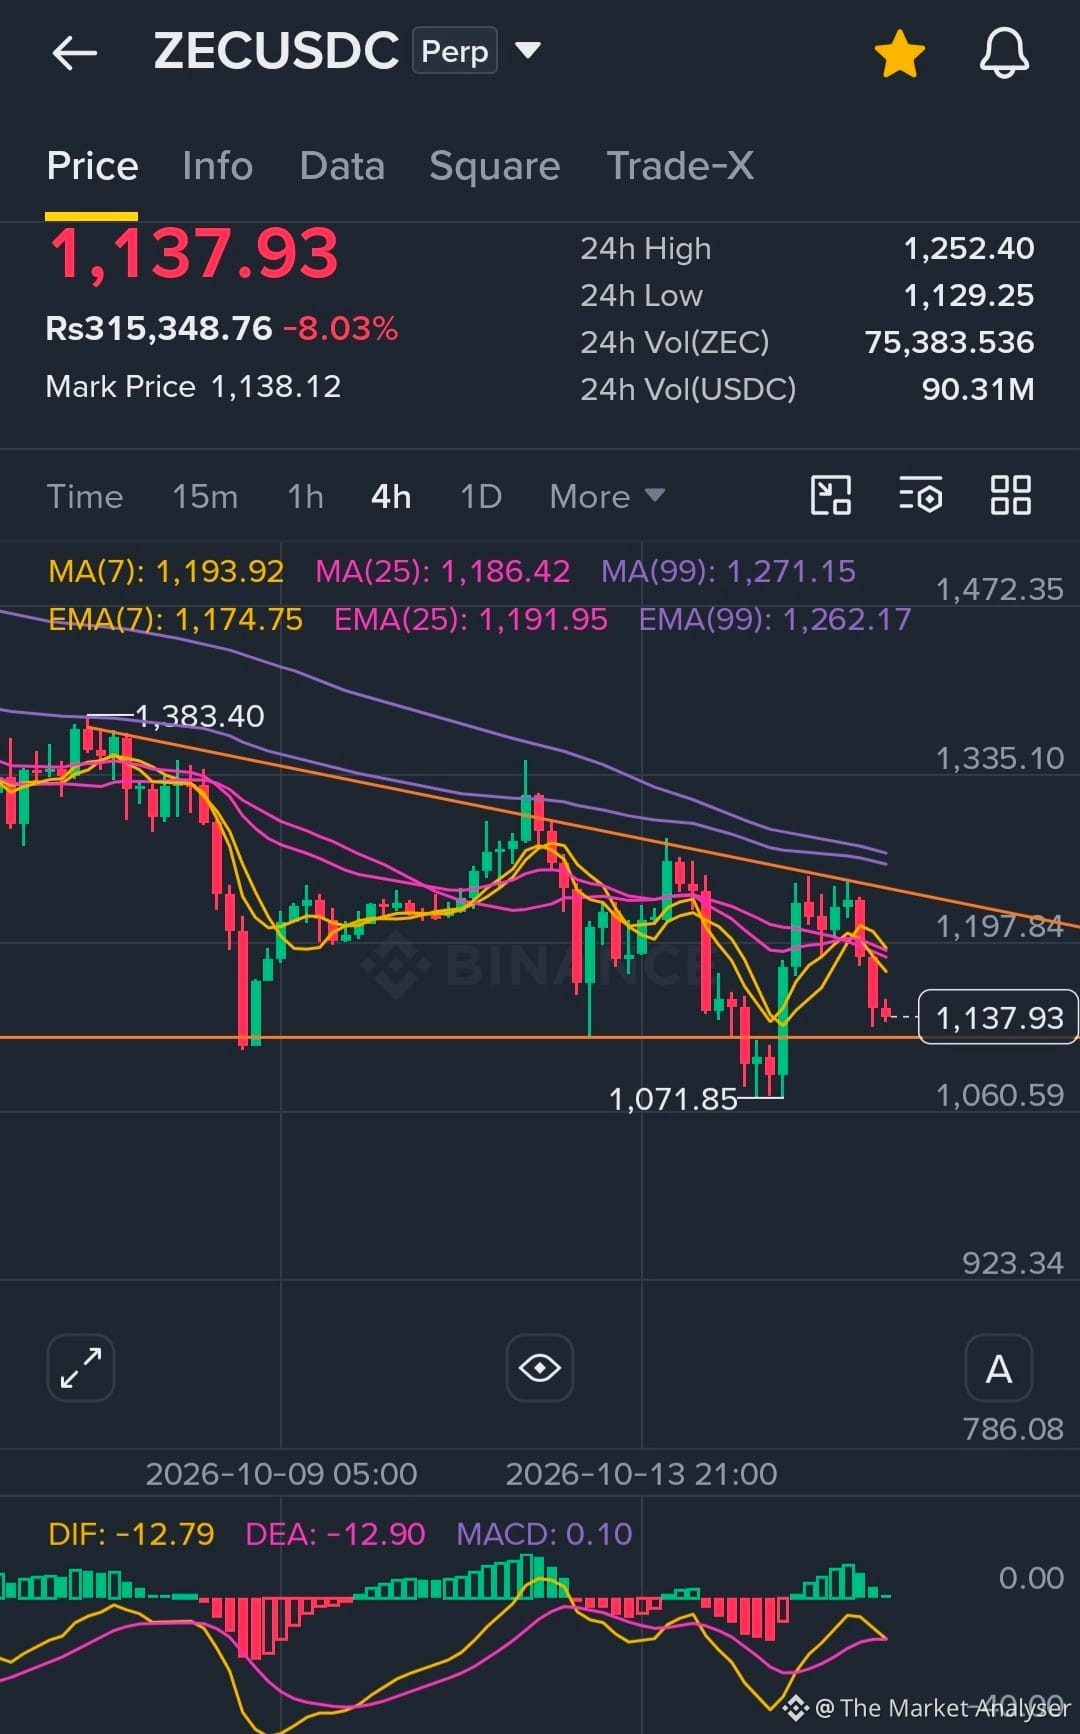
🔥#ZEC ($ZEC ) Technical Analysis & Trade Setup : Bearish Trend Persistent! 📉
ZEC/USDC is exhibiting strong bearish characteristics on macro horizons after experiencing a deep correction down to its recent local lows. Here is the operational trading breakdown:
💥Market Analysis💥
Trend Context: Structure remains heavily bearish on the 4H frame. Price action is trapped under solid overhead resistance established by the 7, 25, and 99 Moving Averages.
Momentum Checks: The 15M MACD is showing a minor short-term bullish tick due to oversold conditions, bringing a temporary relief bounce. However, macro volume patterns continue to support sellers on rallies.
💡 Trading Setup (Short Opportunity):
🎯 Optimal Entry: 1,155.00 - 1,175.00 (On local bounce)
🚀 Take Profit 1: 1,129.25
🚀 Take Profit 2: 1,072.00
🛡️ Stop Loss: 1,210.00 (Above major resistance ceiling)
Trade safe, manage your margin sizes, and practice strict risk parameters!
Are you playing the relief bounce or shorting the breakdown? Drop your thoughts below! 👇
#CryptoTrading #ZECUSDC #TechnicalAnalysis #ShortSignals #FuturesTrading $ZEC
1
1
382
·
--
Рост
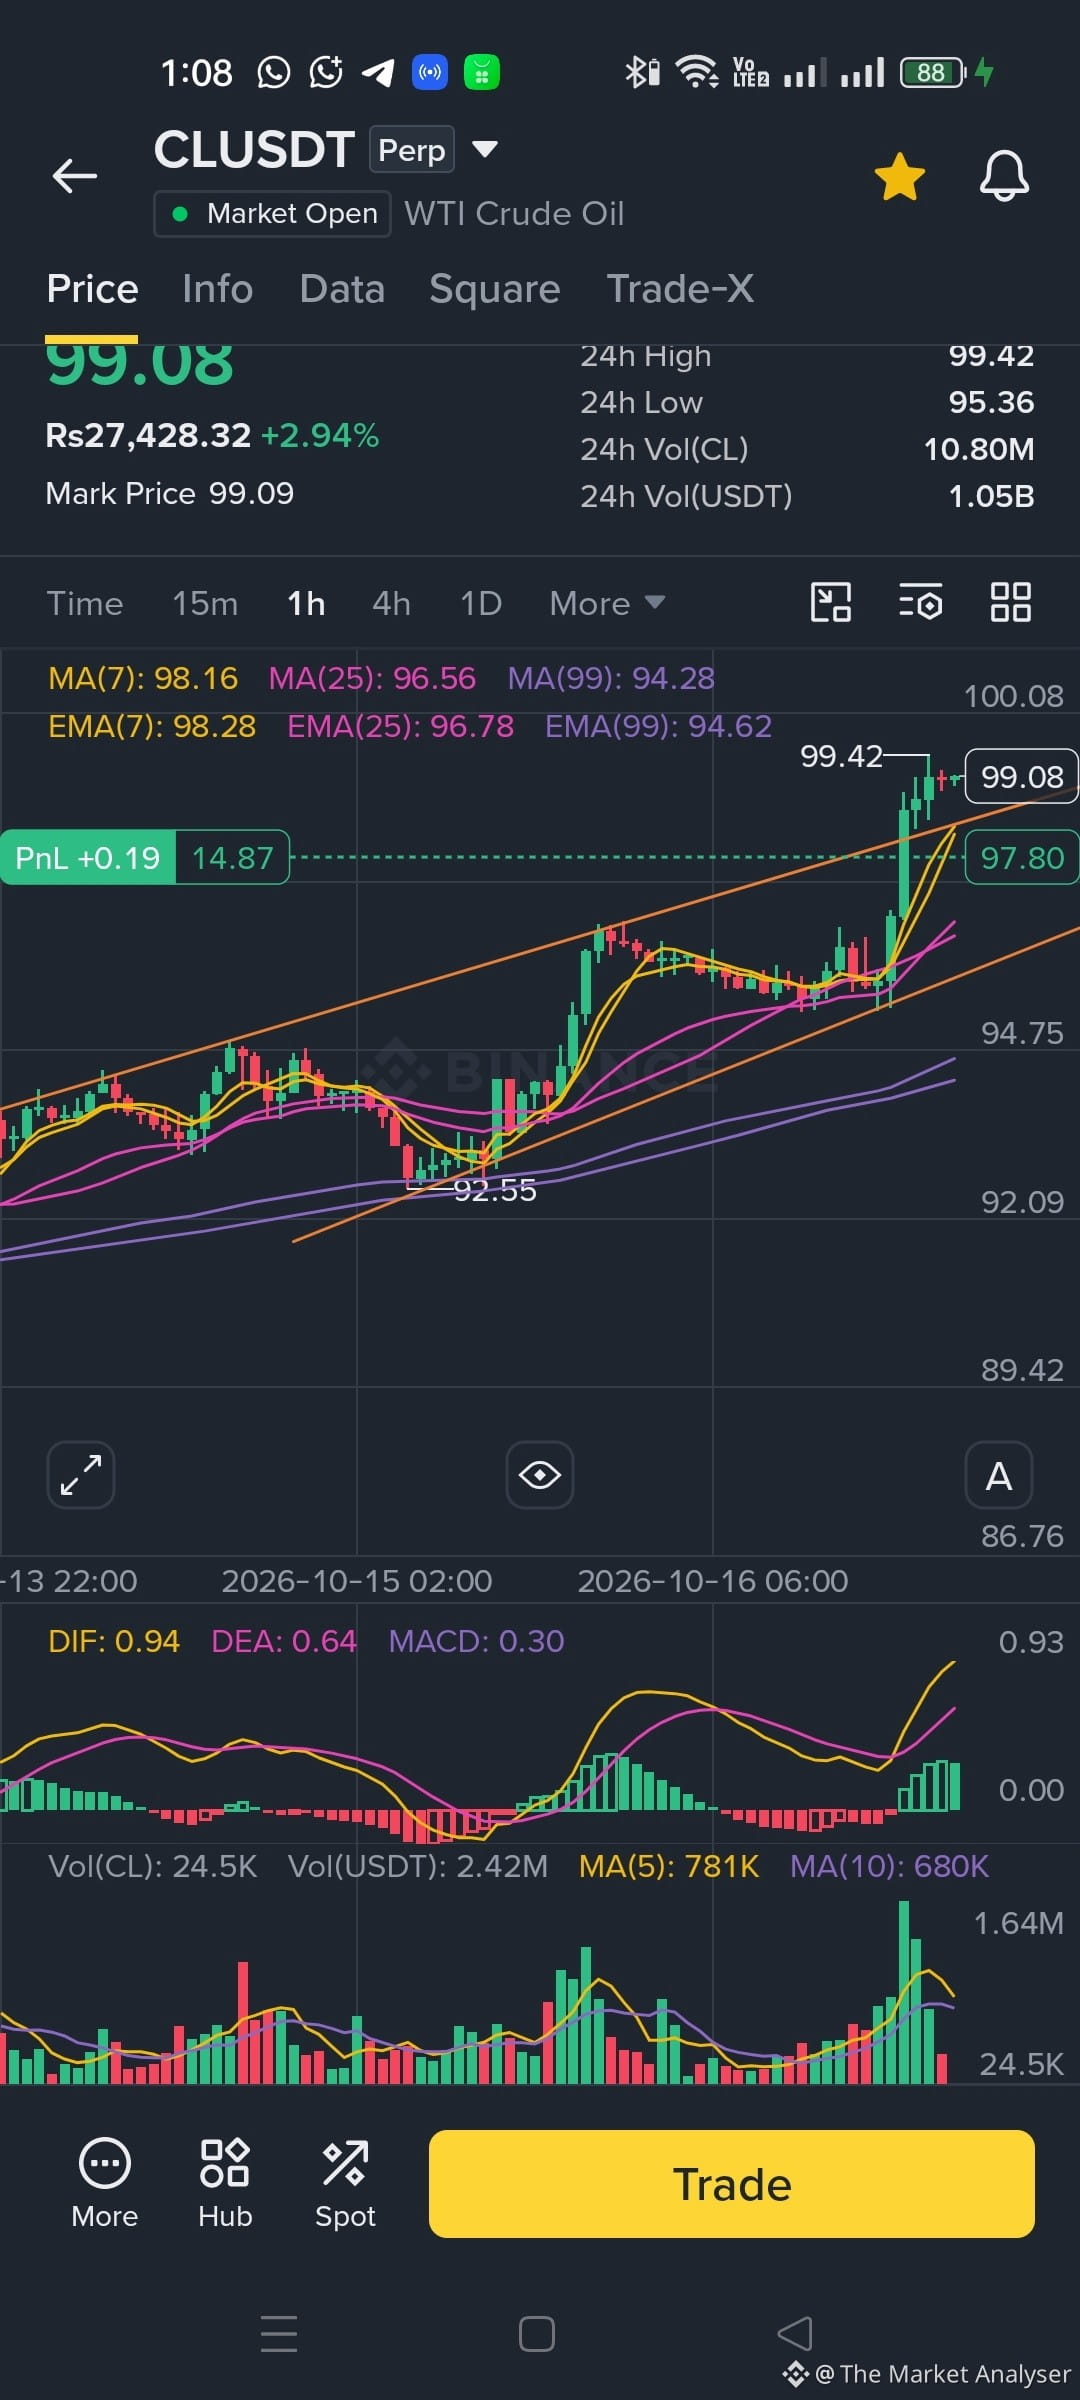
🚀 #WTI Crude Oil ($CLUSDT) Technical Update + Signal Breakout Active! 🔥
WTI Crude Oil futures on Binance are showing strong bullish momentum after breaking out of the recent consolidation zone. Here is a clean trading setup based on the current 1H and 15M structures:
🔹 Market Analysis:
Trend: The price is holding firmly above the 7 MA and 25 MA lines, confirming buyers are in absolute control.
Momentum: 1H MACD maintains a healthy bullish alignment, while the 15M chart shows a brief, healthy cooling-off phase for optimal entries.
💡 Trading Setup (Long):
🎯 Entry Range: 98.60 - 99.10
🚀 Take Profit 1: 99.42
🚀 Take Profit 2: 100.20
🛡️ Stop Loss: 97.30 (Below key H1 support)
Always manage your risk according to your account size and leverage!
What are your targets for this move? Let's discuss in the comments! 👇
#CryptoTrading #crudeoil #TechnicalAnalysiss #TradingSignals📞📞📞👇 #FuturesTrading $CL

1
1
413
🚀 WAL/USDT Macro Breakout: Explosive Volatility on Top Gainer! 🚀
💥Traders! The Market Analyser is tracking an absolute monster move on Walrus (WAL). It has stormed into the top gainers list, surging +58.34% today to trade at $0.06047.
📊Technical Blueprint
💥The Macro Awakening (1w Chart): After bleeding heavily from its historical high near $0.37200 to a long-term bottom at $0.02000, WAL has spend months accumulating. Today's massive candle marks a decisive breakout above the weekly EMA(7) at $0.04026 and MA(25) at $0.03934.
💥Parabolic Momentum (4h Chart): Price has expanded rapidly into vertical price discovery mode. It tapped a local high of $0.06428 and is holding tightly right above the upper bands.
💥Moving Average Confluence: On the 4h timeframe, the price is trading deep into bullish territory, way above the EMA(7) at $0.04988 and EMA(25) at $0.04202.
💥MACD & Volume Blast: The 1w MACD histogram has cleanly flipped positive (green bars), printing a strong bullish momentum value of 0.00734. This is heavily backed by a massive volume expansion of 696.91M WAL traded today!
💡 Actionable Trade Setup
🟢 The Strategic Dip-Buy (Long Entry):
Do not FOMO blindly into a vertical candle. High-volatility top gainers tend to experience violent intraday profit-taking flushes. Look to build long positions on pullbacks into the solid 4h support cushion between $0.05200 and $0.04900 (overlapping with the 4h EMA 7 line).
Targets: $0.06600 ➡️ $0.07600 ➡️ $0.09500 (Next major weekly resistance pool).
Invalidation (Stop-Loss): Decisive 4-Hour candle close below $0.04100 (EMA 25 invalidation).
🔴 The Over-Extended Warning:
If the price fails to defend the $0.04500 zone on a deep rejection, the vertical momentum stalls, pointing to a slow drift back to retest the structural baseline at $0.03711 (4h EMA 99).
Disclaimer: This analysis is for educational purposes. Top-gaining altcoins feature extreme volatility. Practice strict risk management, rules.
#walrus #WALUSDT #CryptoAnalysis #TechnicalAnalysis #Write2Earn
$WAL

1
1
482
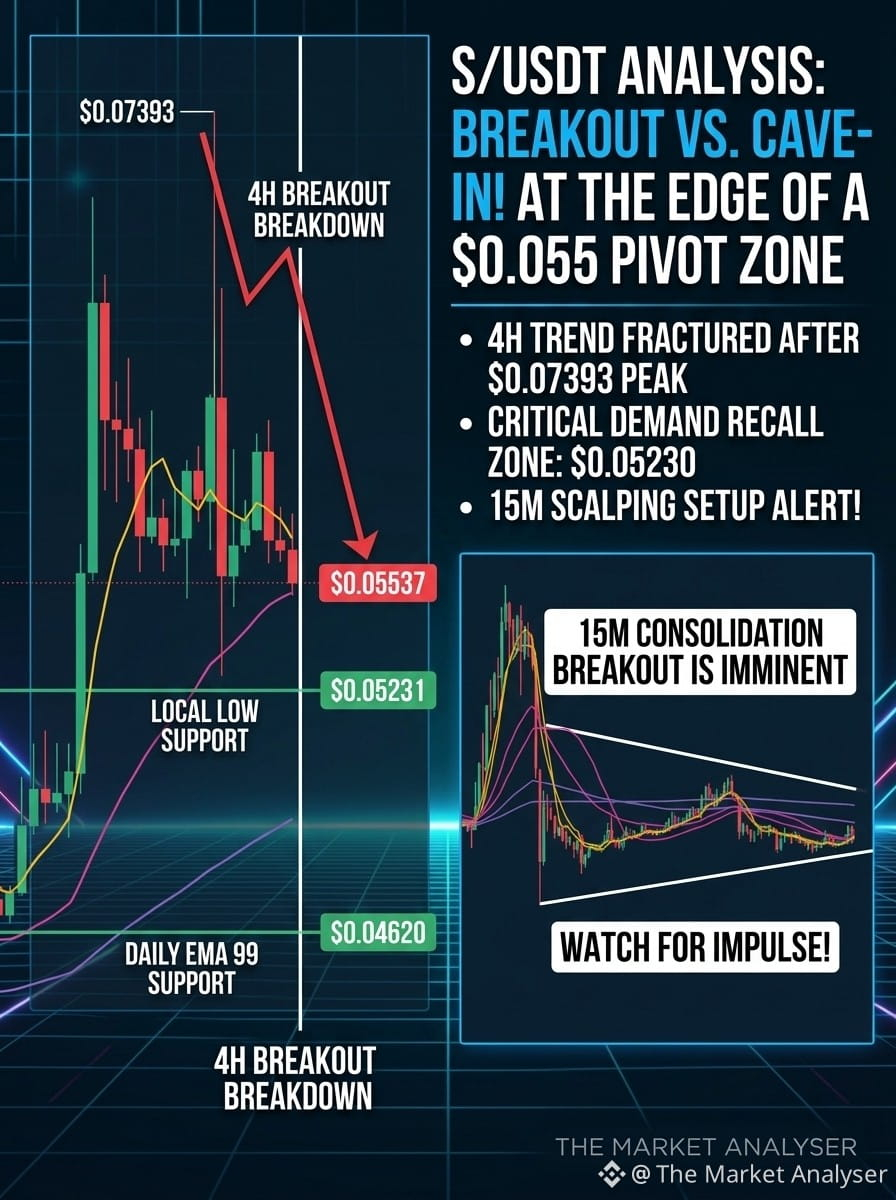
🚀 S/USDT High-Alert: Aggressive Shakeout Approaching High-Probability Demand Zone! 🚀
Free signal 🤑
Traders! The Market Analyser is locking eyes on an intense corrective structure on Sonic (S). After hitting a local macro high of $0.07393, the token is undergoing a sharp -19.81% pullback, hovering right at $0.05537.
A highly actionable trade setup is developing across the 4-Hour (4H) and 15-Minute (15m) charts. Here is your quick, high-impact breakdown:
📊 The Technical Blueprint
• The Pullback Structure: On the 4H chart, the aggressive sell-off has pushed price straight into the EMA(25) at $0.05464 and MA(25) at $0.05534. This immediate zone is acting as critical horizontal support.
• 15-Minute Compression: The
lower-timeframe chart indicates structural exhaustion. S is heavily compressing inside a tight consolidation corridor right above the local flash low of $0.05231.
• MACD State: The 4H MACD line is curling down toward the zero baseline, printing red histogram bars. This suggests near-term momentum rests with sellers, but the velocity of the drop is rapidly decreasing near structural floors.
• Healthy Consolidation: Despite the heavy intraday slide, the long-term EMA(99) sits safely below at $0.04620, confirming that the structural macro uptrend remains entirely intact.
💡 Actionable Trade Setup / The Signal:
🟢 The Long (Buy) Trigger:
The range between $0.05450 and $0.05250 offers a premium risk-to-reward buy-the-dip zone. If bulls successfully defend this confluence floor and print an hourly reversal candle, look for an explosive relief bounce.
• Immediate Targets: $0.05950 ➡️ $0.06300
• Invalidation (Stop-Loss): Decisive 4H candle close below $0.05150.
🔴 The Breakdown Play:
Failing to hold the $0.05231 floor invalidates the immediate bounce thesis, risking an algorithmic stop-run down toward the macro target at $0.04620 (4H EMA 99).
📌 What's your strategy?
#SONİC #SUSDT #CryptoAnalysis #TechnicalAnalysis #Write2Earn $S
1
1
735
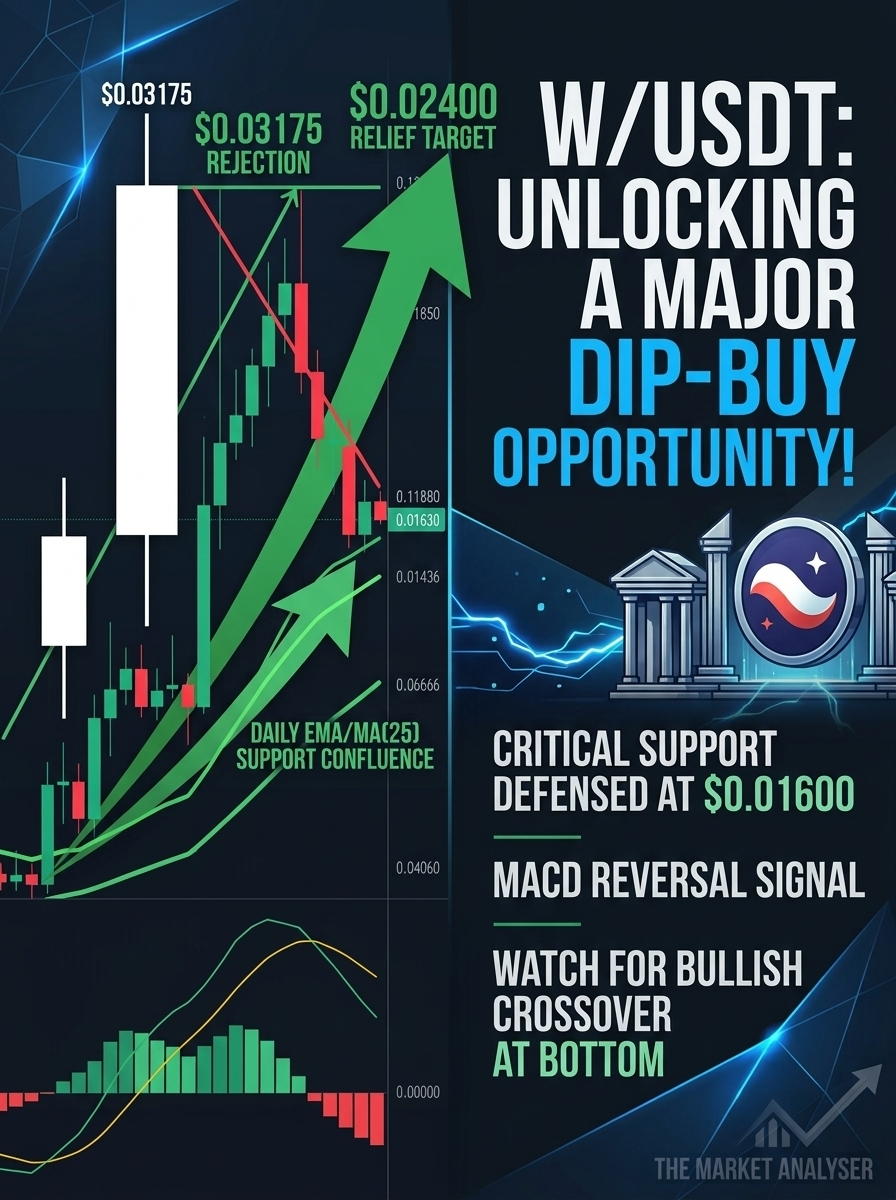
🚀 W/USDT Alert: Massive Flash Crash Testing Vital Daily Support! 🚀
Traders! The Market Analyser is on high alert as W ( Wormhole ) experiences a massive -22.12% flush, dropping price down to $0.01630. Let's break down the 1-Day (1D) macro trend and 4-Hour (4H) execution levels to find the bounce play:
📊 The Technical Breakdown
The Flush: After peaking near the heavy $0.03175 resistance, aggressive distribution triggered a sharp cascade into underlying liquidity.
• Core Dynamic Support: On the 1D chart, price is fighting to defend the critical EMA(25) at $0.01481 and MA(25) at $0.01436.
• 4-Hour Exhaustion: On the 4H chart, price has sliced below short-term EMAs, but is tightly compressing against the long-term EMA(99) at $0.01627
• MACD Divergence: The 1D MACD lines are still held in a bullish configuration despite the drop, showing this could be a heavy liquidation flush rather than a total trend death.
💡 Actionable Trade Scenarios:
🔴 Bearish Continuation:
If the 4H/1D candles close decisively below $0.01400, the breakout structure fails entirely. Expect a deeper capitulation back to the baseline accumulation zone near $0.01049 (Daily MA 99).
🟢 Bullish Dip-Buy Setup:
The current zone between $0.01600 - $0.01450 represents massive structural confluence. A confirmed bounce here offers an excellent risk-to-reward long entry, targeting a swift relief rally back up to $0.01970 and potentially $0.02400.
📌 What's your plan? Are you catching the knife at this macro support, or waiting for a cleaner bounce confirmation? Comment below!
👇 Comment your target coin for the next quick setup!
#Wormhole #wusdt #CryptoAnalysis #TechnicalAnalysis #Write2Earn
$W
1
3
652
Статья
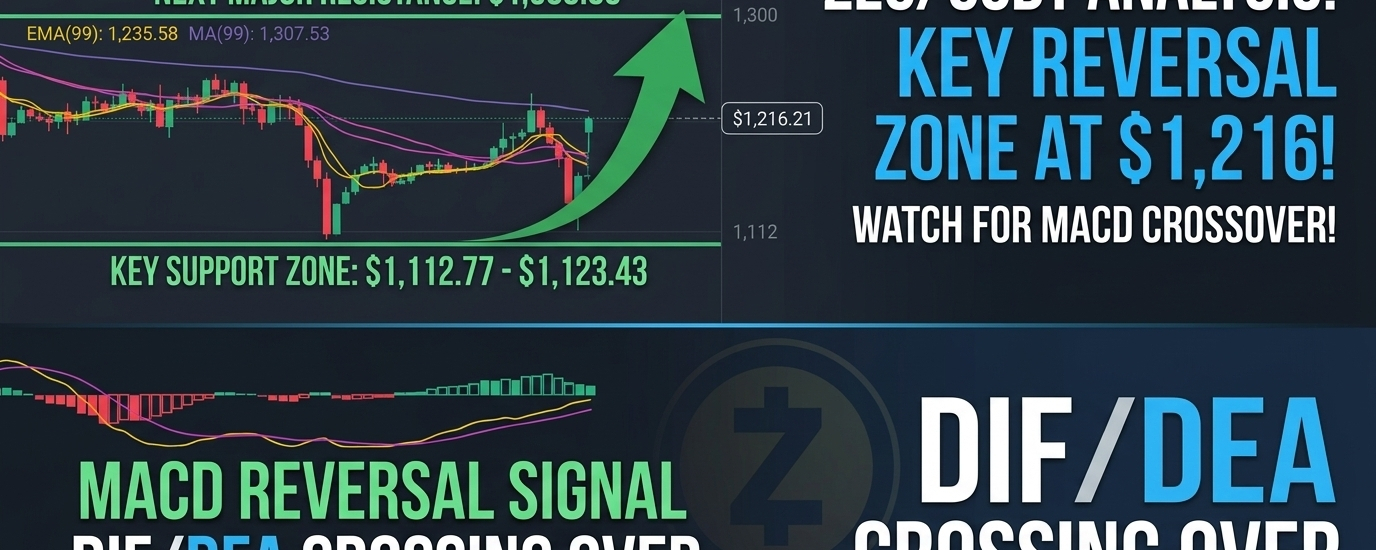
⚡ ZEC/USDT Technical Analysis: Critical Retest of Local Bottom! ⚡Traders! The Market Analyser is tracking a decisive structural test on Zcash (ZEC). The privacy token is experiencing a sharp pullback of -5.53%, trading right at $1,216.21.
This 4-Hour (4H) execution chart reveals an aggressive battle between buyers and sellers at a major historical confluence zone. Here is your sharp, scannable breakdown:
📊 The Technical Structure (4-Hour Chart)
The Price Rejection: ZEC recently attempted a bullish recovery, but faced steep resistance just below the $1,300 structural wall. This distribution has pushed price into a descending multi-candle cascade.
Moving Averages (EMA & MA) Breakdown:
Price has slipped directly beneath the short-term EMA(7) at $1,230.58 and the medium-term MA(25) at $1,237.65.
The long-term EMA(99) sits way overhead at $1,307.53, indicating that the macro trend on this timeframe remains under bearish control.
MACD Indicator (Bearish Momentum): A clear bearish crossover has locked in on the MACD. The lines are curling downwards under the zero plane, with red histogram bars expanding to show that near-term selling pressure is accelerating.
Volume Activity: Trading volume is holding strong at 218.04M USDT. A sharp green volume spike is trying to print on the current candle, signaling that buyers are actively trying to step in and defend this level.
💡 Actionable Trade Scenarios & Key Levels:
🔴 The Bearish Continuation:
Watch the critical psychological floor at $1,123 - $1,112 (the recent local low). If the 4H candle fails to hold the current cluster and breaks below $1,112, it will trigger a major stop-loss hunt, opening the gates down to $1,050.
🟢 The Bullish Bounce Setup:
The current zone represents a high-probability demand pocket. If the bulls can print a clear 4H reversal candle right here, expect a fast relief rally back up to retest the immediate dynamic resistance at $1,245 (MA 7) and an extended target toward $1,300.
📌 What's your move?
Are you scaling into long positions at this support, or are you waiting for a confirmed breakdown to short ZEC to new lows? Drop your trading bias in the comments below!
👇 Comment the next ticker you want mapped out on the charts!
Disclaimer: This analysis is for educational purposes only. Always implement strict capital protection and risk management.
#Zcash #ZECUSDT #CryptoAnalysis #TechnicalAnalysis #Write2Earn
⚡ ZEC/USDT Technical Analysis: Critical Retest of Local Bottom! ⚡
Traders! The Market Analyser is tracking a decisive structural test on Zcash (ZEC). The privacy token is experiencing a sharp pullback of -5.53%, trading right at $1,216.21.
This 4-Hour (4H) execution chart reveals an aggressive battle between buyers and sellers at a major historical confluence zone. Here is your sharp, scannable breakdown:
📊 The Technical Structure (4-Hour Chart)
The Price Rejection: ZEC recently attempted a bullish recovery, but faced steep resistance just below the $1,300 structural wall. This distribution has pushed price into a descending multi-candle cascade.
Moving Averages (EMA & MA) Breakdown:
Price has slipped directly beneath the short-term EMA(7) at $1,230.58 and the medium-term MA(25) at $1,237.65.
The long-term EMA(99) sits way overhead at $1,307.53, indicating that the macro trend on this timeframe remains under bearish control.
MACD Indicator (Bearish Momentum): A clear bearish crossover has locked in on the MACD. The lines are curling downwards under the zero plane, with red histogram bars expanding to show that near-term selling pressure is accelerating.
Volume Activity: Trading volume is holding strong at 218.04M USDT. A sharp green volume spike is trying to print on the current candle, signaling that buyers are actively trying to step in and defend this level.
💡 Actionable Trade Scenarios & Key Levels:
🔴 The Bearish Continuation:
Watch the critical psychological floor at $1,123 - $1,112 (the recent local low). If the 4H candle fails to hold the current cluster and breaks below $1,112, it will trigger a major stop-loss hunt, opening the gates down to $1,050.
🟢 The Bullish Bounce Setup:
The current zone represents a high-probability demand pocket. If the bulls can print a clear 4H reversal candle right here, expect a fast relief rally back up to retest the immediate dynamic resistance at $1,245 (MA 7) and an extended target toward $1,300.
📌 What's your move?
Are you scaling into long positions at this support, or are you waiting for a confirmed breakdown to short ZEC to new lows? Drop your trading bias in the comments below!
👇 Comment the next ticker you want mapped out on the charts!
Disclaimer: This analysis is for educational purposes only. Always implement strict capital protection and risk management.
#Zcash #ZECUSDT #CryptoAnalysis #TechnicalAnalysis #Write2Earn
1
591
·
--
Рост
🚀 STRK/USDT Analysis: Critical Rejection Testing Core Support! 🚀
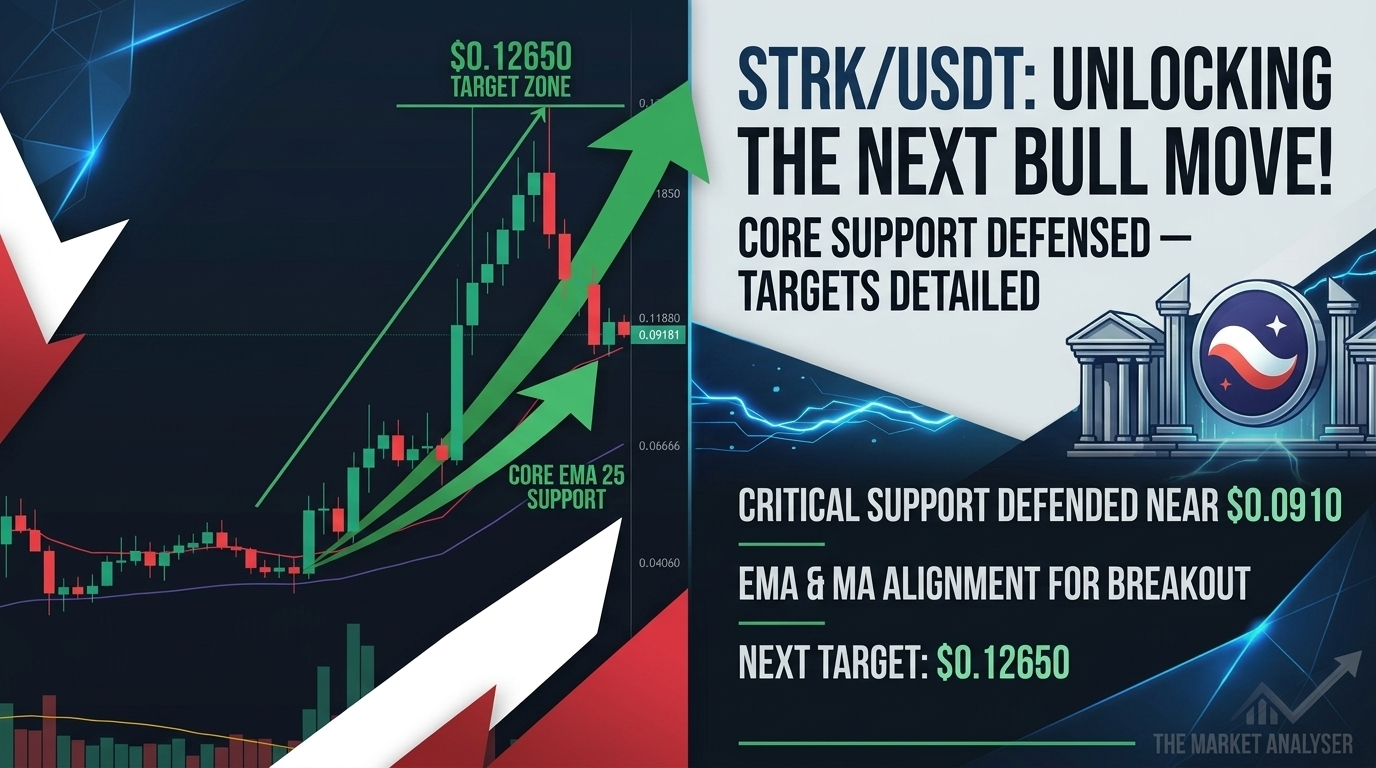
💥Traders! The Market Analyser is mapping out a massive intraday shakeout on Starknet Token (STRK). After an aggressive rally, price has faced a heavy -19.76% correction, plunging to $0.09181.
⚡This 4-Hour (4H) chart structure is sitting right at a make-or-break pivot level. Here is your quick, high-impact breakdown:
📊 Technical Snapshot (4-Hour Chart)
⚡The Rejection: STRK topped out at a local high of $0.12650 before aggressive profit-taking triggered a steep multi-candle cascade.
⚡EMA & MA Support Confluence: Price has sliced through the short-term EMA(7) but is currently battling to defend the vital EMA(25) at $0.09161 and MA(25) at $0.09124. This is the ultimate bull/bear battlefield.
⚡MACD Status: Momentum is shifting bearish in the short term. A bearish crossover has locked in, and the histogram is expanding into red territory, flashing a clear warning sign.
💡 Actionable Trade Scenarios:
🔴 Bearish / Breakdown:
If the 4H candle closes decisively below the $0.08970 low, the immediate bullish structure breaks down. Expect a rapid slide to retest the next heavy accumulation base at $0.06480 (EMA 99 support zone).
🟢 Bullish / Bounce:
If buyers successfully defend this immediate $0.09100 horizontal area, expect a sharp relief bounce back up toward the local dynamic resistance at $0.09910 (EMA 7), with extensions back to $0.11800.
📌 What's your plan? Buying the dip here or waiting for lower targets? Drop your thoughts in the comments!
👇 Comment your target coin next!
#Starknet #STRKUSDT #CryptoAnalysis #TechnicalAnalysis #Write2Earn
$STRK 🤯
1
2
667
Войдите, чтобы посмотреть больше материала
Присоединяйтесь к пользователям криптовалют по всему миру на Binance Square
⚡️ Получайте новейшую и полезную информацию о криптоактивах.
💬 Нам доверяет крупнейшая в мире криптобиржа.
👍 Получите достоверные аналитические данные от верифицированных создателей контента.
Эл. почта/номер телефона
В тренде
FedWatch
Просмотров: 16.1M
37,706 обсуждают
ФРС США оставила ставку без изменений, но Уорш не исключает повышение в декабре
BorisBorissss
·Лайков: 3
·Просмотров: 2.4k
Nasdaq100FuturesFall0.9%
Просмотров: 1,049
48 обсуждают
BitcoinCore32.1RaisesPeerConnectionLimit
Просмотров: 14,868
390 обсуждают