
Papon_0312
21 Публикации

Papon_0312
Отправить жалобу
Заблокировать пользователя
3 подписок(и/а)
1 подписчиков(а)
2 понравилось
Посты
·
--
🚨 **$ETH /USDT Market Update: Is This the Ultimate Dip or More Downside Ahead?** 📉[span_0](start_span)[span_0](end_span)
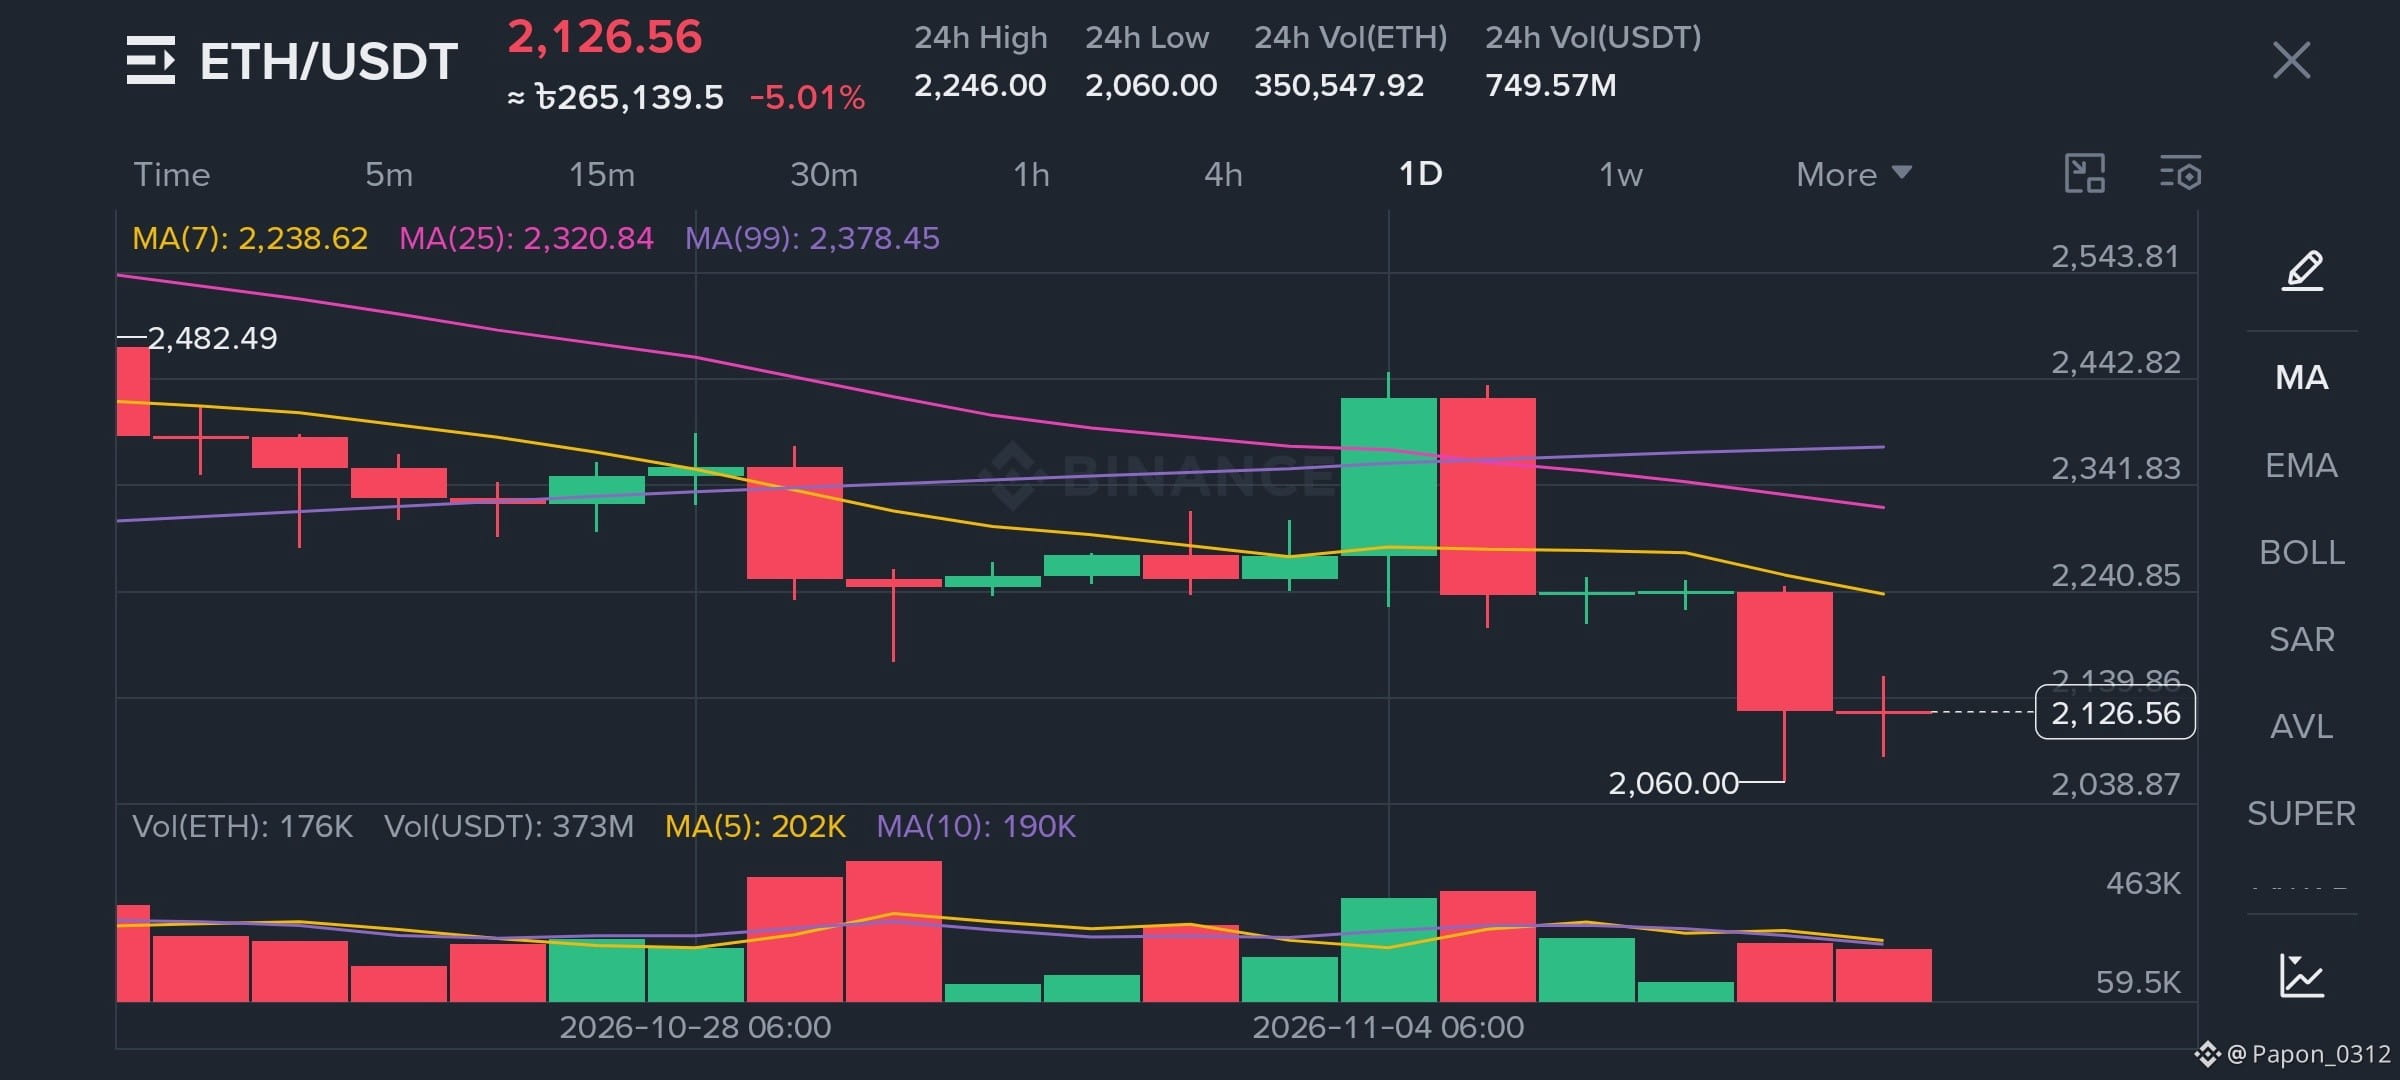
Ethereum ($ETH ) is currently trading at **$2,126.56**, marking a notable **-5.01%** drop in the past 24 hours[span_1](start_span)[span_1](end_span). The daily chart shows a sharp correction after touching a 24h high of **$2,246.00**, hitting a low of **$2,060.00**[span_2](start_span)[span_2](end_span).
📊 **Key Technical Levels to Watch:**
* **Current Price:** $2,126.56[span_3](start_span)[span_3](end_span)
* **24h Low (Support Zone):** $2,060.00[span_4](start_span)[span_4](end_span)
* **24h High (Resistance):** $2,246.00[span_5](start_span)[span_5](end_span)
* **Moving Averages (MA):** MA(7) is around $2,238.62, MA(25) at $2,320.84, and MA(99) near $2,378.45[span_6](start_span)[span_6](end_span), showing strong bearish pressure in the short term as the price trades below key averages.
💡 **What's your strategy?**
Are you buying this dip, waiting for a stronger support confirmation, or staying on the sidelines? Let’s discuss in the comments below! 👇
#Ethereum #ETH #CryptoUpdate #BinanceSquare #cryptotrading #MarketDips
🚨 **$ETH /USDT Market Update: Is This the Ultimate Dip or More Downside Ahead?** 📉[span_0](start_span)[span_0](end_span)
Ethereum ($ETH ) is currently trading at **$2,126.56**, marking a notable **-5.01%** drop in the past 24 hours[span_1](start_span)[span_1](end_span). The daily chart shows a sharp correction after touching a 24h high of **$2,246.00**, hitting a low of **$2,060.00**[span_2](start_span)[span_2](end_span).
📊 **Key Technical Levels to Watch:**
* **Current Price:** $2,126.56[span_3](start_span)[span_3](end_span)
* **24h Low (Support Zone):** $2,060.00[span_4](start_span)[span_4](end_span)
* **24h High (Resistance):** $2,246.00[span_5](start_span)[span_5](end_span)
* **Moving Averages (MA):** MA(7) is around $2,238.62, MA(25) at $2,320.84, and MA(99) near $2,378.45[span_6](start_span)[span_6](end_span), showing strong bearish pressure in the short term as the price trades below key averages.
💡 **What's your strategy?**
Are you buying this dip, waiting for a stronger support confirmation, or staying on the sidelines? Let’s discuss in the comments below! 👇
#Ethereum #ETH #CryptoUpdate #BinanceSquare #cryptotrading #MarketDips
Ethereum ($ETH ) is currently trading at **$2,126.56**, marking a notable **-5.01%** drop in the past 24 hours[span_1](start_span)[span_1](end_span). The daily chart shows a sharp correction after touching a 24h high of **$2,246.00**, hitting a low of **$2,060.00**[span_2](start_span)[span_2](end_span).
📊 **Key Technical Levels to Watch:**
* **Current Price:** $2,126.56[span_3](start_span)[span_3](end_span)
* **24h Low (Support Zone):** $2,060.00[span_4](start_span)[span_4](end_span)
* **24h High (Resistance):** $2,246.00[span_5](start_span)[span_5](end_span)
* **Moving Averages (MA):** MA(7) is around $2,238.62, MA(25) at $2,320.84, and MA(99) near $2,378.45[span_6](start_span)[span_6](end_span), showing strong bearish pressure in the short term as the price trades below key averages.
💡 **What's your strategy?**
Are you buying this dip, waiting for a stronger support confirmation, or staying on the sidelines? Let’s discuss in the comments below! 👇
#Ethereum #ETH #CryptoUpdate #BinanceSquare #cryptotrading #MarketDips
93
·
--
🚀 $AAVE /USDT Market Update! 📈
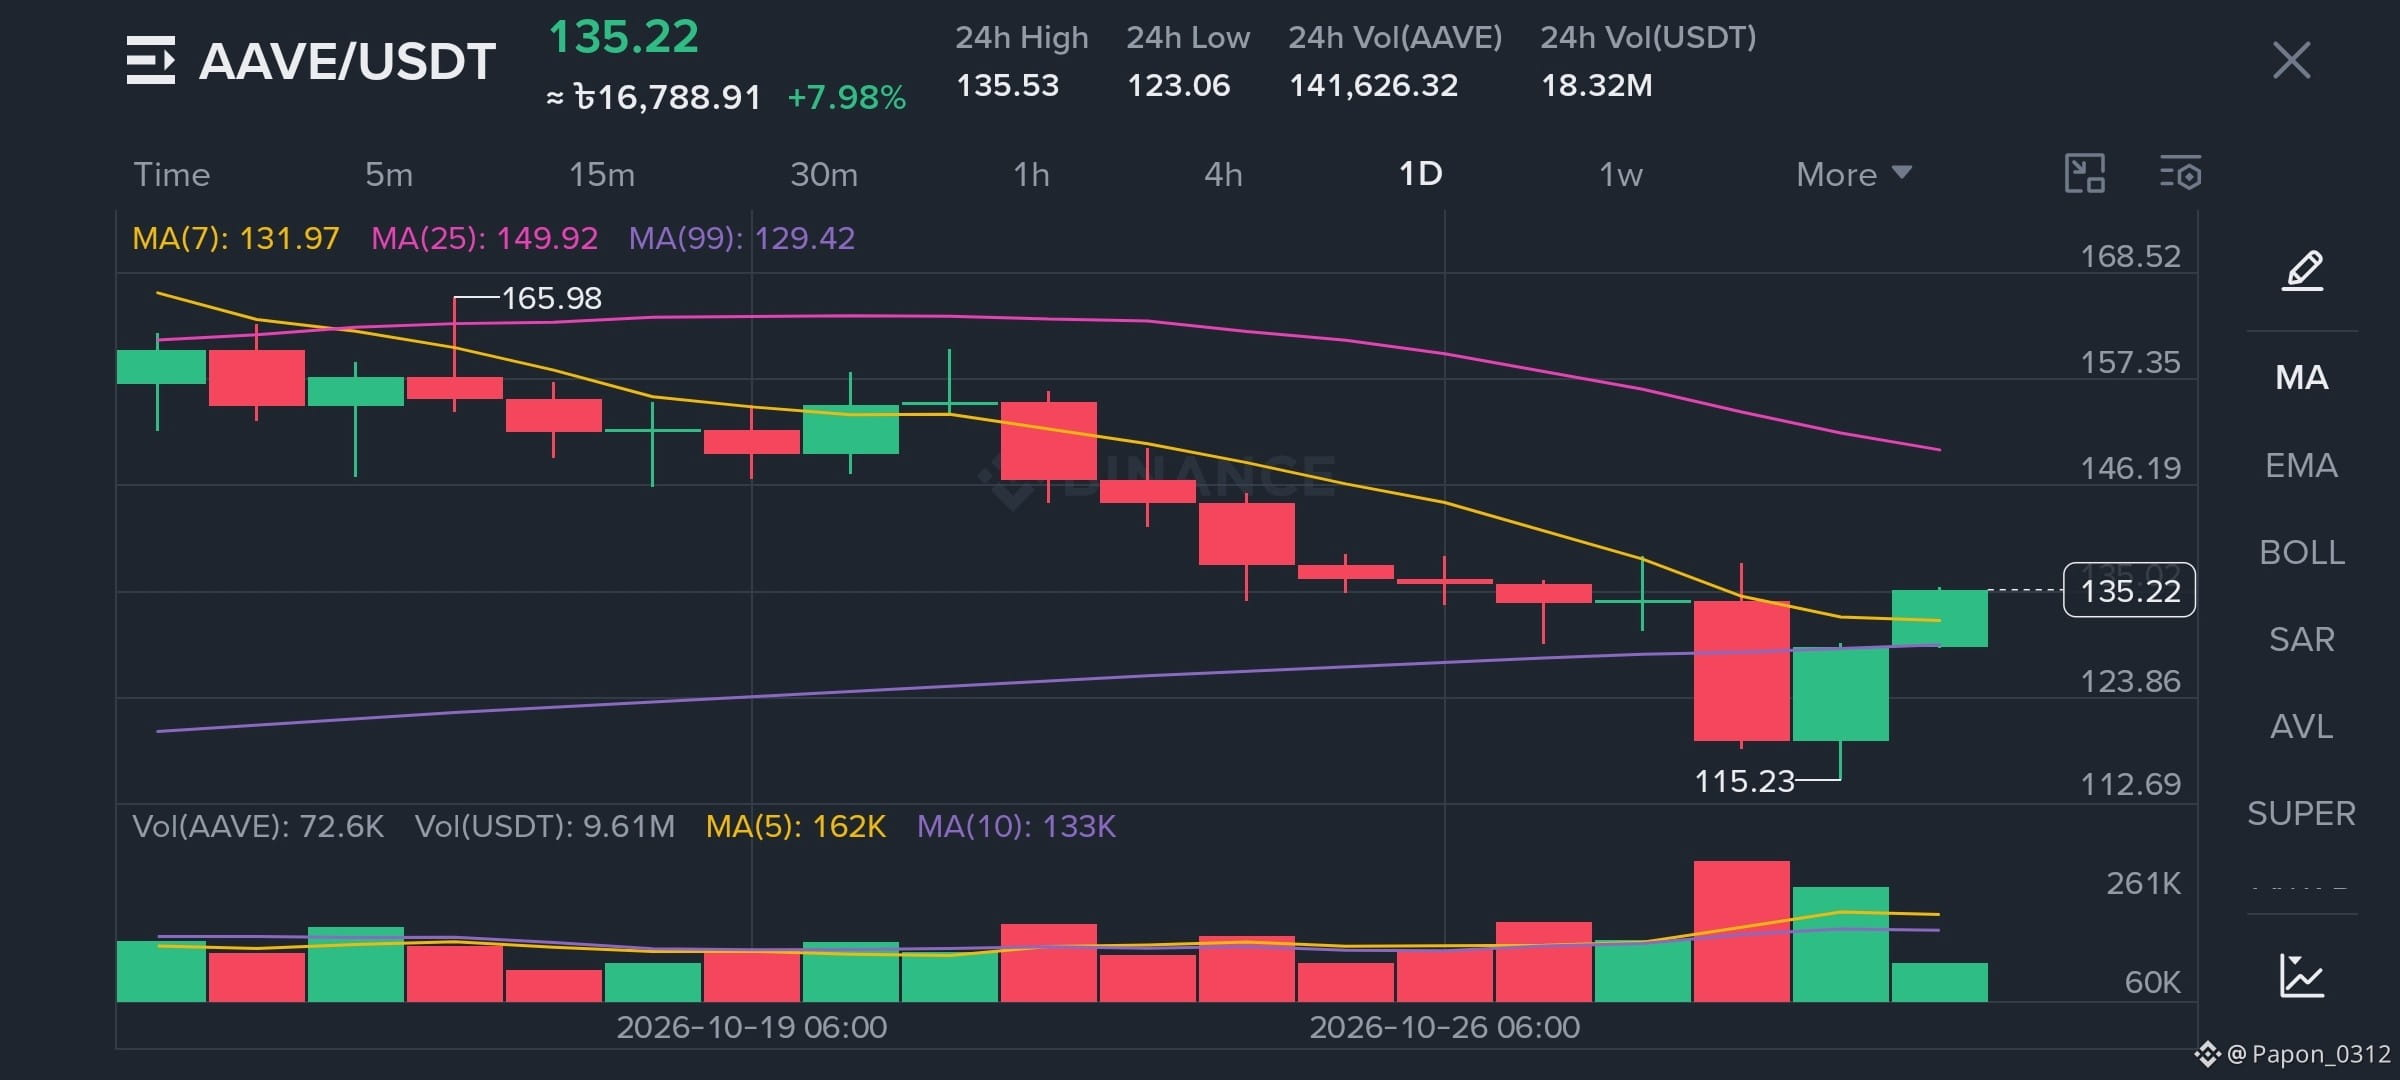
Looking at the 1D chart, AAVE is showing a strong rebound after hitting a low around 115.23, currently trading at 135.22 with an impressive +7.98% gain today! 💡
Key highlights from the chart:
* Current Price: $135.22 (≈ ৳16,788.91)[span_1](start_span)[span_1](end_span)
* 24h High / Low: $135.53 / $123.06[span_2](start_span)[span_2](end_span)
* Momentum is showing signs of recovery with active green candles following the previous dip.
Are you bullish on AAVE for the upcoming sessions? Let's discuss in the comments! 👇
#AAVE.智能策略库🏆🏆 #CryptoTrading #BinanceSquare #CryptoAnalysis #Altcoins
🚀 $AAVE /USDT Market Update! 📈
Looking at the 1D chart, AAVE is showing a strong rebound after hitting a low around 115.23, currently trading at 135.22 with an impressive +7.98% gain today! 💡
Key highlights from the chart:
* Current Price: $135.22 (≈ ৳16,788.91)[span_1](start_span)[span_1](end_span)
* 24h High / Low: $135.53 / $123.06[span_2](start_span)[span_2](end_span)
* Momentum is showing signs of recovery with active green candles following the previous dip.
Are you bullish on AAVE for the upcoming sessions? Let's discuss in the comments! 👇
#AAVE.智能策略库🏆🏆 #CryptoTrading #BinanceSquare #CryptoAnalysis #Altcoins
Looking at the 1D chart, AAVE is showing a strong rebound after hitting a low around 115.23, currently trading at 135.22 with an impressive +7.98% gain today! 💡
Key highlights from the chart:
* Current Price: $135.22 (≈ ৳16,788.91)[span_1](start_span)[span_1](end_span)
* 24h High / Low: $135.53 / $123.06[span_2](start_span)[span_2](end_span)
* Momentum is showing signs of recovery with active green candles following the previous dip.
Are you bullish on AAVE for the upcoming sessions? Let's discuss in the comments! 👇
#AAVE.智能策略库🏆🏆 #CryptoTrading #BinanceSquare #CryptoAnalysis #Altcoins
118
·
--
🚀 Stepping deeper into the crypto world! Finally bought my first Bitcoin ($BTC )! 🪙🔥
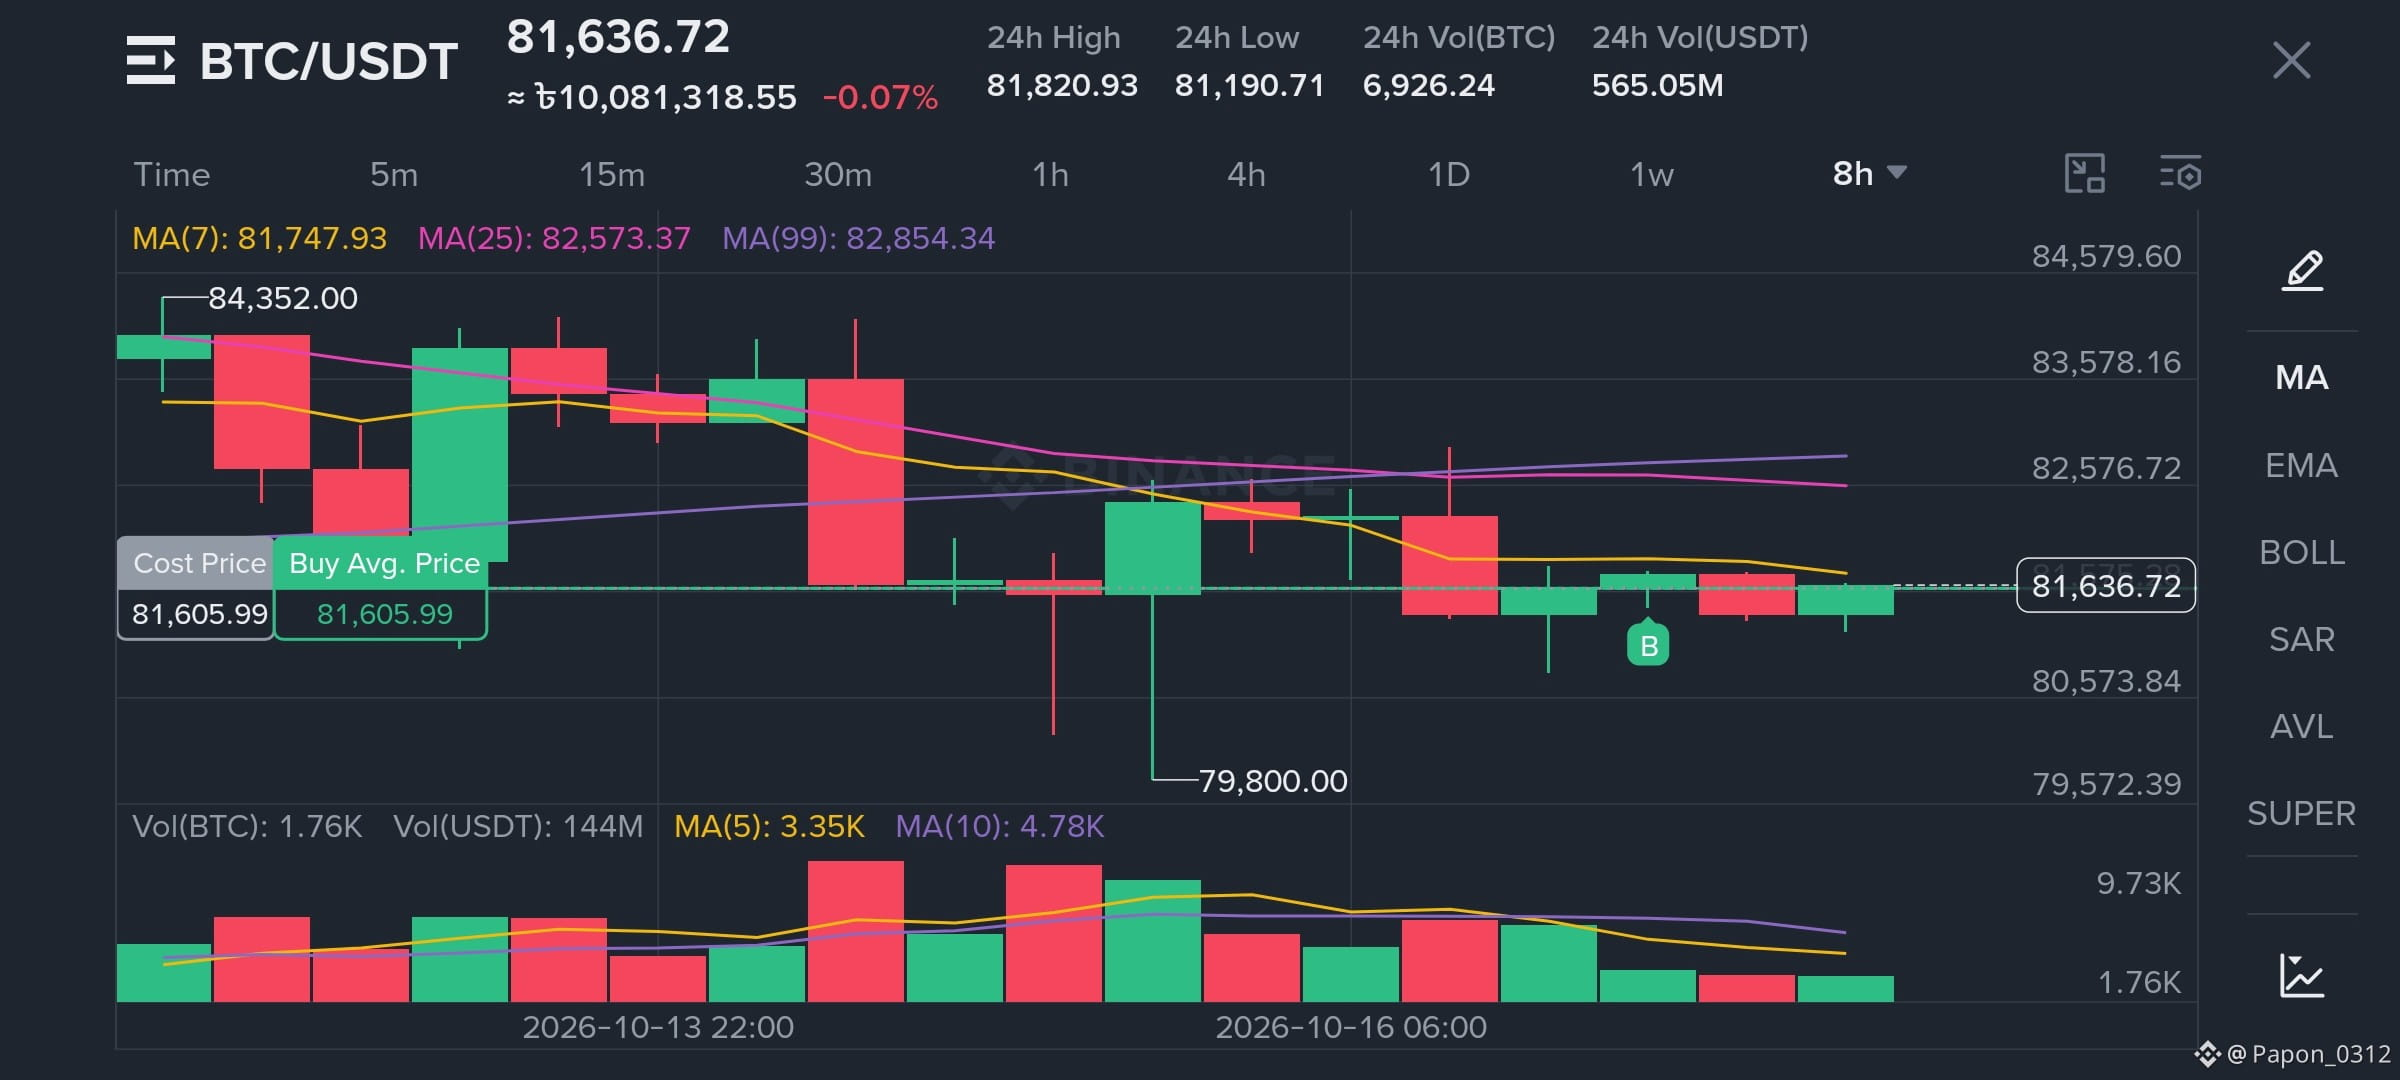
After analyzing charts and candle patterns, I've officially started my real crypto trading journey. Set my buy average price at 81,605.99 USDT on the chart and officially joined the Bitcoin holder club[span_0](start_span)[span_0](end_span)!
Markets will have ups and downs, but with solid analysis and patience, I'm planning to go a long way.
What are your thoughts on this crypto market move? Which coin are you holding right now? Let me know in the comments! 👇
#Bitcoin #BTC #CryptoTrading #BinanceSquare #CryptoJourney #SpotTrading
🚀 Stepping deeper into the crypto world! Finally bought my first Bitcoin ($BTC )! 🪙🔥
After analyzing charts and candle patterns, I've officially started my real crypto trading journey. Set my buy average price at 81,605.99 USDT on the chart and officially joined the Bitcoin holder club[span_0](start_span)[span_0](end_span)!
Markets will have ups and downs, but with solid analysis and patience, I'm planning to go a long way.
What are your thoughts on this crypto market move? Which coin are you holding right now? Let me know in the comments! 👇
#Bitcoin #BTC #CryptoTrading #BinanceSquare #CryptoJourney #SpotTrading
After analyzing charts and candle patterns, I've officially started my real crypto trading journey. Set my buy average price at 81,605.99 USDT on the chart and officially joined the Bitcoin holder club[span_0](start_span)[span_0](end_span)!
Markets will have ups and downs, but with solid analysis and patience, I'm planning to go a long way.
What are your thoughts on this crypto market move? Which coin are you holding right now? Let me know in the comments! 👇
#Bitcoin #BTC #CryptoTrading #BinanceSquare #CryptoJourney #SpotTrading
81
·
--
🚀 Discipline & Patience Always Pay Off in Crypto! 📈
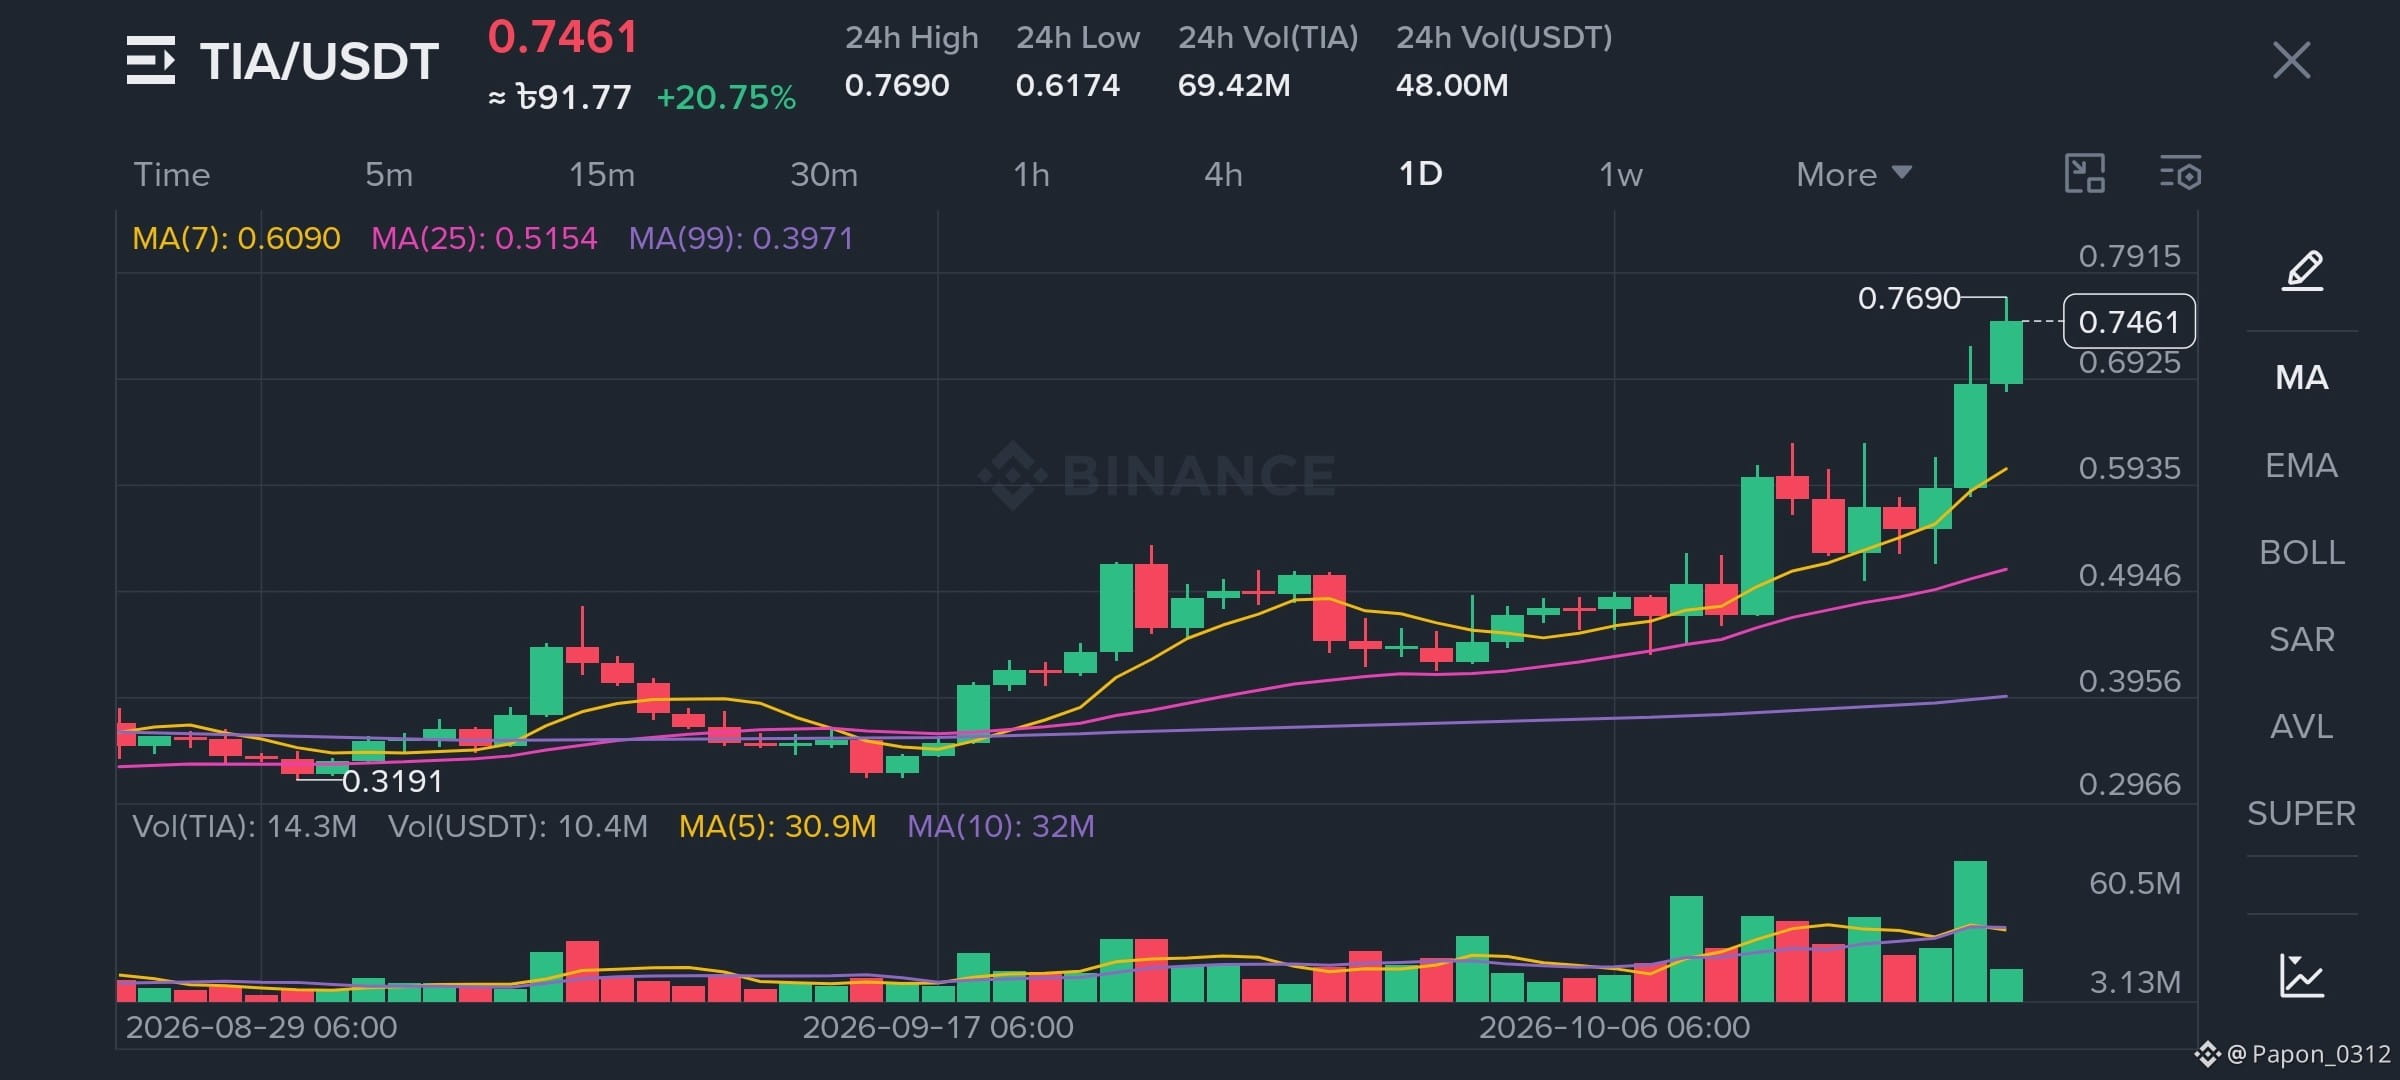
Check out this strong breakout on $TIA /USDT (+20.75%)! 🟢🔥
In crypto trading, market dips test your emotional control, but proper strategy and patience build real progress. Traders who analyze key indicators and maintain strict risk management position themselves for these exact moments.
📊 $TIA /USDT Key Stats:
• Current Price: $0.7461
• 24h High: $0.7690
• 24h Vol: 69.42M TIA / 48.00M USDT
• Moving averages (MA7/MA25/MA99) confirming strong bullish continuation!
💡 Key Takeaways for Traders:
1. Avoid trading based on FOMO or emotions.
2. Stick strictly to your risk management plan.
3. Trust your technical analysis and wait for clear setups.
The market rewards discipline over noise. Stay focused and keep building! 💪✨
#Binance #CryptoTrading #TIA #CryptoMotivation #TechnicalAnalysis #Bullish #TraderLife
🚀 Discipline & Patience Always Pay Off in Crypto! 📈
Check out this strong breakout on $TIA /USDT (+20.75%)! 🟢🔥
In crypto trading, market dips test your emotional control, but proper strategy and patience build real progress. Traders who analyze key indicators and maintain strict risk management position themselves for these exact moments.
📊 $TIA /USDT Key Stats:
• Current Price: $0.7461
• 24h High: $0.7690
• 24h Vol: 69.42M TIA / 48.00M USDT
• Moving averages (MA7/MA25/MA99) confirming strong bullish continuation!
💡 Key Takeaways for Traders:
1. Avoid trading based on FOMO or emotions.
2. Stick strictly to your risk management plan.
3. Trust your technical analysis and wait for clear setups.
The market rewards discipline over noise. Stay focused and keep building! 💪✨
#Binance #CryptoTrading #TIA #CryptoMotivation #TechnicalAnalysis #Bullish #TraderLife
Check out this strong breakout on $TIA /USDT (+20.75%)! 🟢🔥
In crypto trading, market dips test your emotional control, but proper strategy and patience build real progress. Traders who analyze key indicators and maintain strict risk management position themselves for these exact moments.
📊 $TIA /USDT Key Stats:
• Current Price: $0.7461
• 24h High: $0.7690
• 24h Vol: 69.42M TIA / 48.00M USDT
• Moving averages (MA7/MA25/MA99) confirming strong bullish continuation!
💡 Key Takeaways for Traders:
1. Avoid trading based on FOMO or emotions.
2. Stick strictly to your risk management plan.
3. Trust your technical analysis and wait for clear setups.
The market rewards discipline over noise. Stay focused and keep building! 💪✨
#Binance #CryptoTrading #TIA #CryptoMotivation #TechnicalAnalysis #Bullish #TraderLife
148
·
--
📊 $GRAM /USDT Technical Analysis (1D Chart) 🚀
Price Current Action:
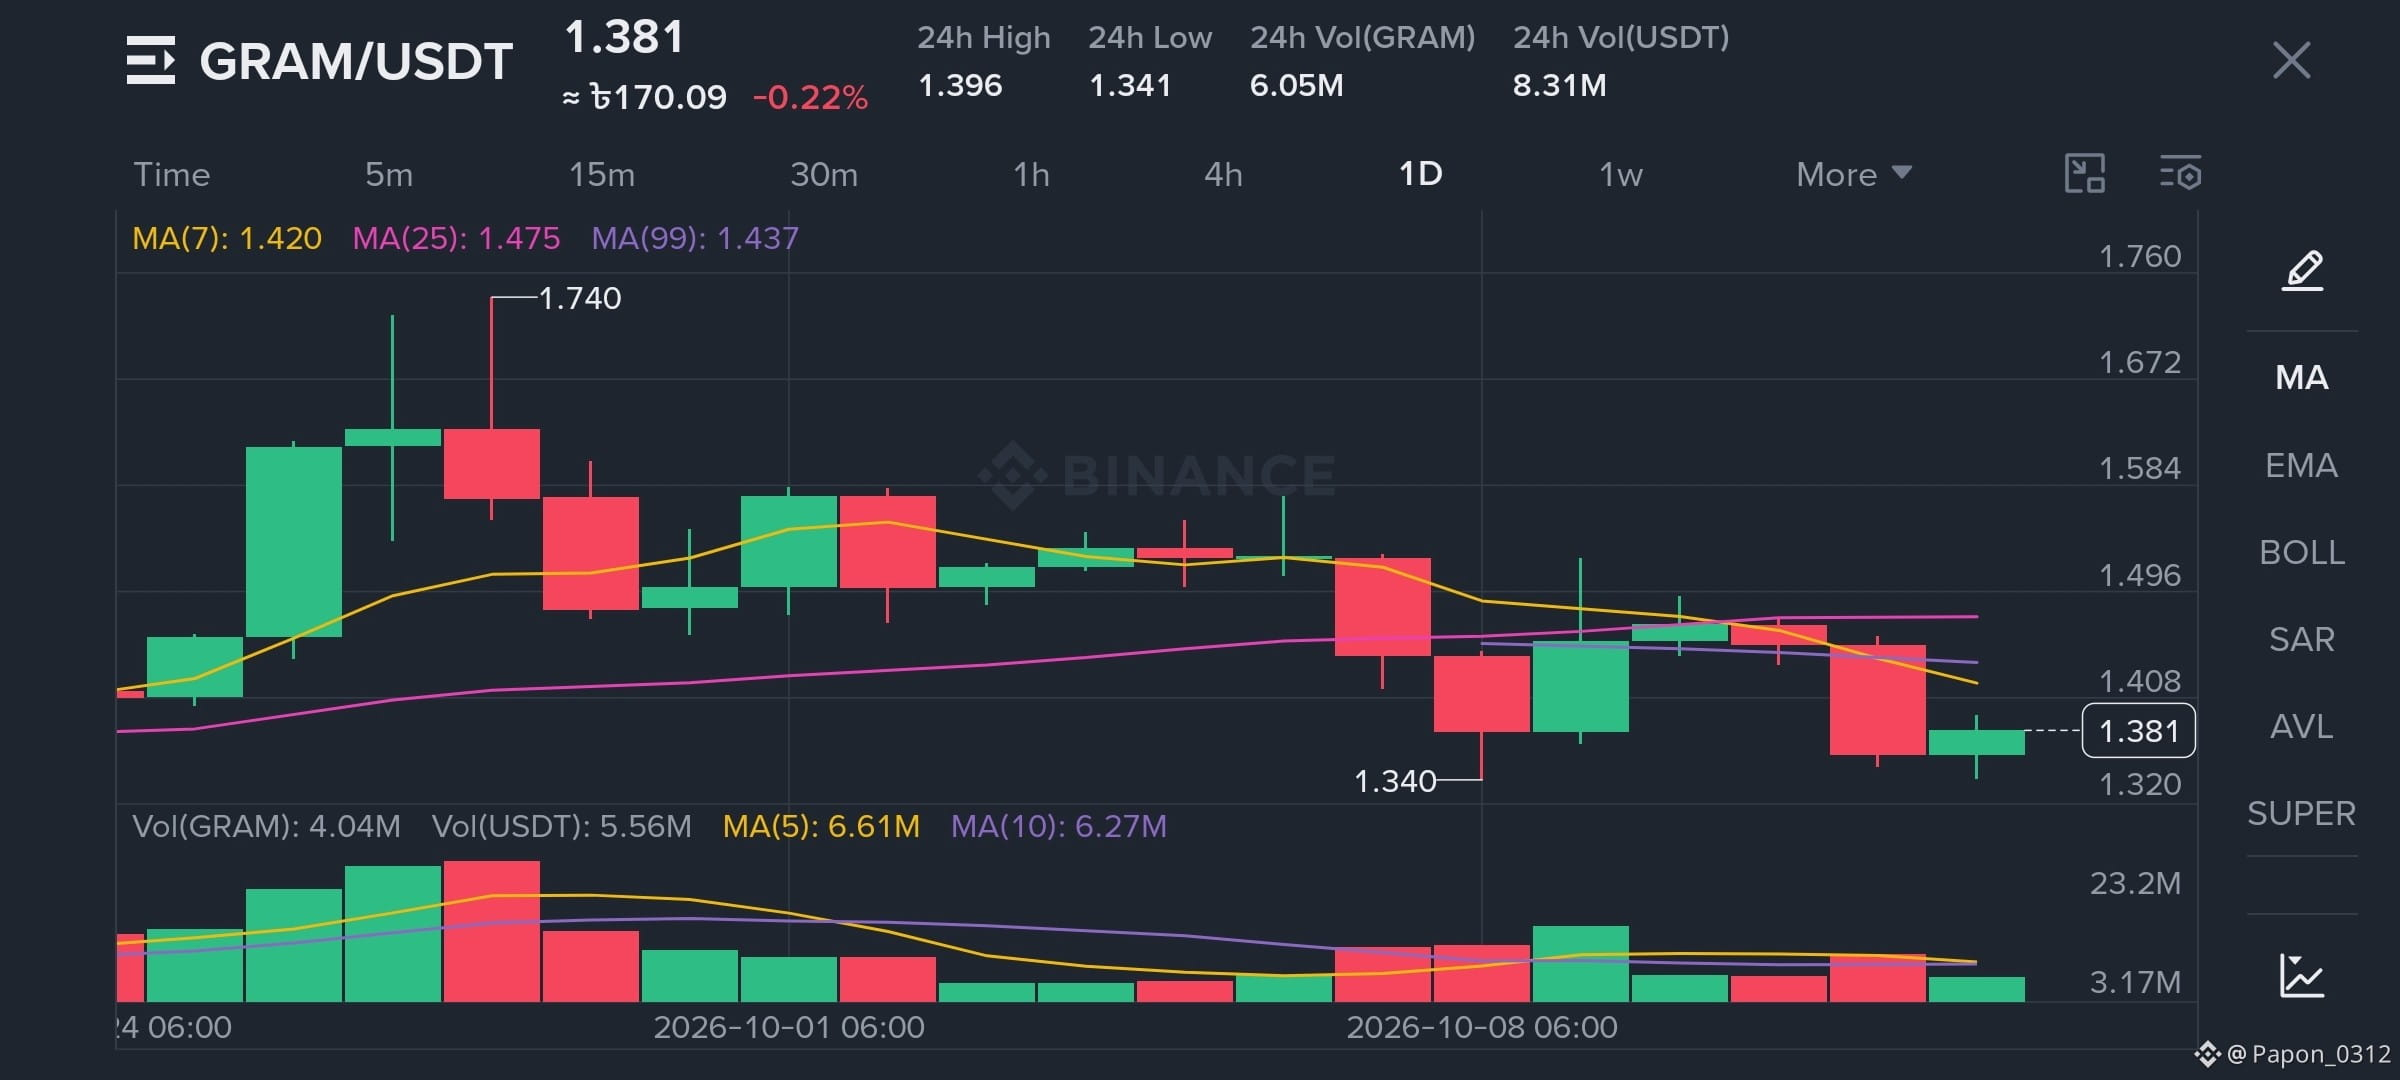
$GRAM is currently trading around $1.381, consolidating near its local support level.
Key Technical Levels to Watch:
📍 Immediate Support: $1.340
📍 Resistance Levels: $1.420 (MA7) & $1.475 (MA25)
💡 Technical Overview:
The price is moving below the moving averages (MA7, MA25, MA99), indicating short-term weakness/consolidation. However, holding above the $1.340 support zone could trigger a quick bounce back towards $1.420+.
Trade Smart & Always Manage Your Risk! 🛡️
#GRAM #CryptoAnalysis #BİNANCESQUARE #CryptoTrading #TradingSignals
📊 $GRAM /USDT Technical Analysis (1D Chart) 🚀
Price Current Action:
$GRAM is currently trading around $1.381, consolidating near its local support level.
Key Technical Levels to Watch:
📍 Immediate Support: $1.340
📍 Resistance Levels: $1.420 (MA7) & $1.475 (MA25)
💡 Technical Overview:
The price is moving below the moving averages (MA7, MA25, MA99), indicating short-term weakness/consolidation. However, holding above the $1.340 support zone could trigger a quick bounce back towards $1.420+.
Trade Smart & Always Manage Your Risk! 🛡️
#GRAM #CryptoAnalysis #BİNANCESQUARE #CryptoTrading #TradingSignals
Price Current Action:
$GRAM is currently trading around $1.381, consolidating near its local support level.
Key Technical Levels to Watch:
📍 Immediate Support: $1.340
📍 Resistance Levels: $1.420 (MA7) & $1.475 (MA25)
💡 Technical Overview:
The price is moving below the moving averages (MA7, MA25, MA99), indicating short-term weakness/consolidation. However, holding above the $1.340 support zone could trigger a quick bounce back towards $1.420+.
Trade Smart & Always Manage Your Risk! 🛡️
#GRAM #CryptoAnalysis #BİNANCESQUARE #CryptoTrading #TradingSignals
404
·
--
🚀$BNB /USDT Technical Analysis (1D Chart)
BNB is currently showing a nice recovery after testing lower support levels. Here is a quick breakdown of the daily chart:
📊 Current Price Action:
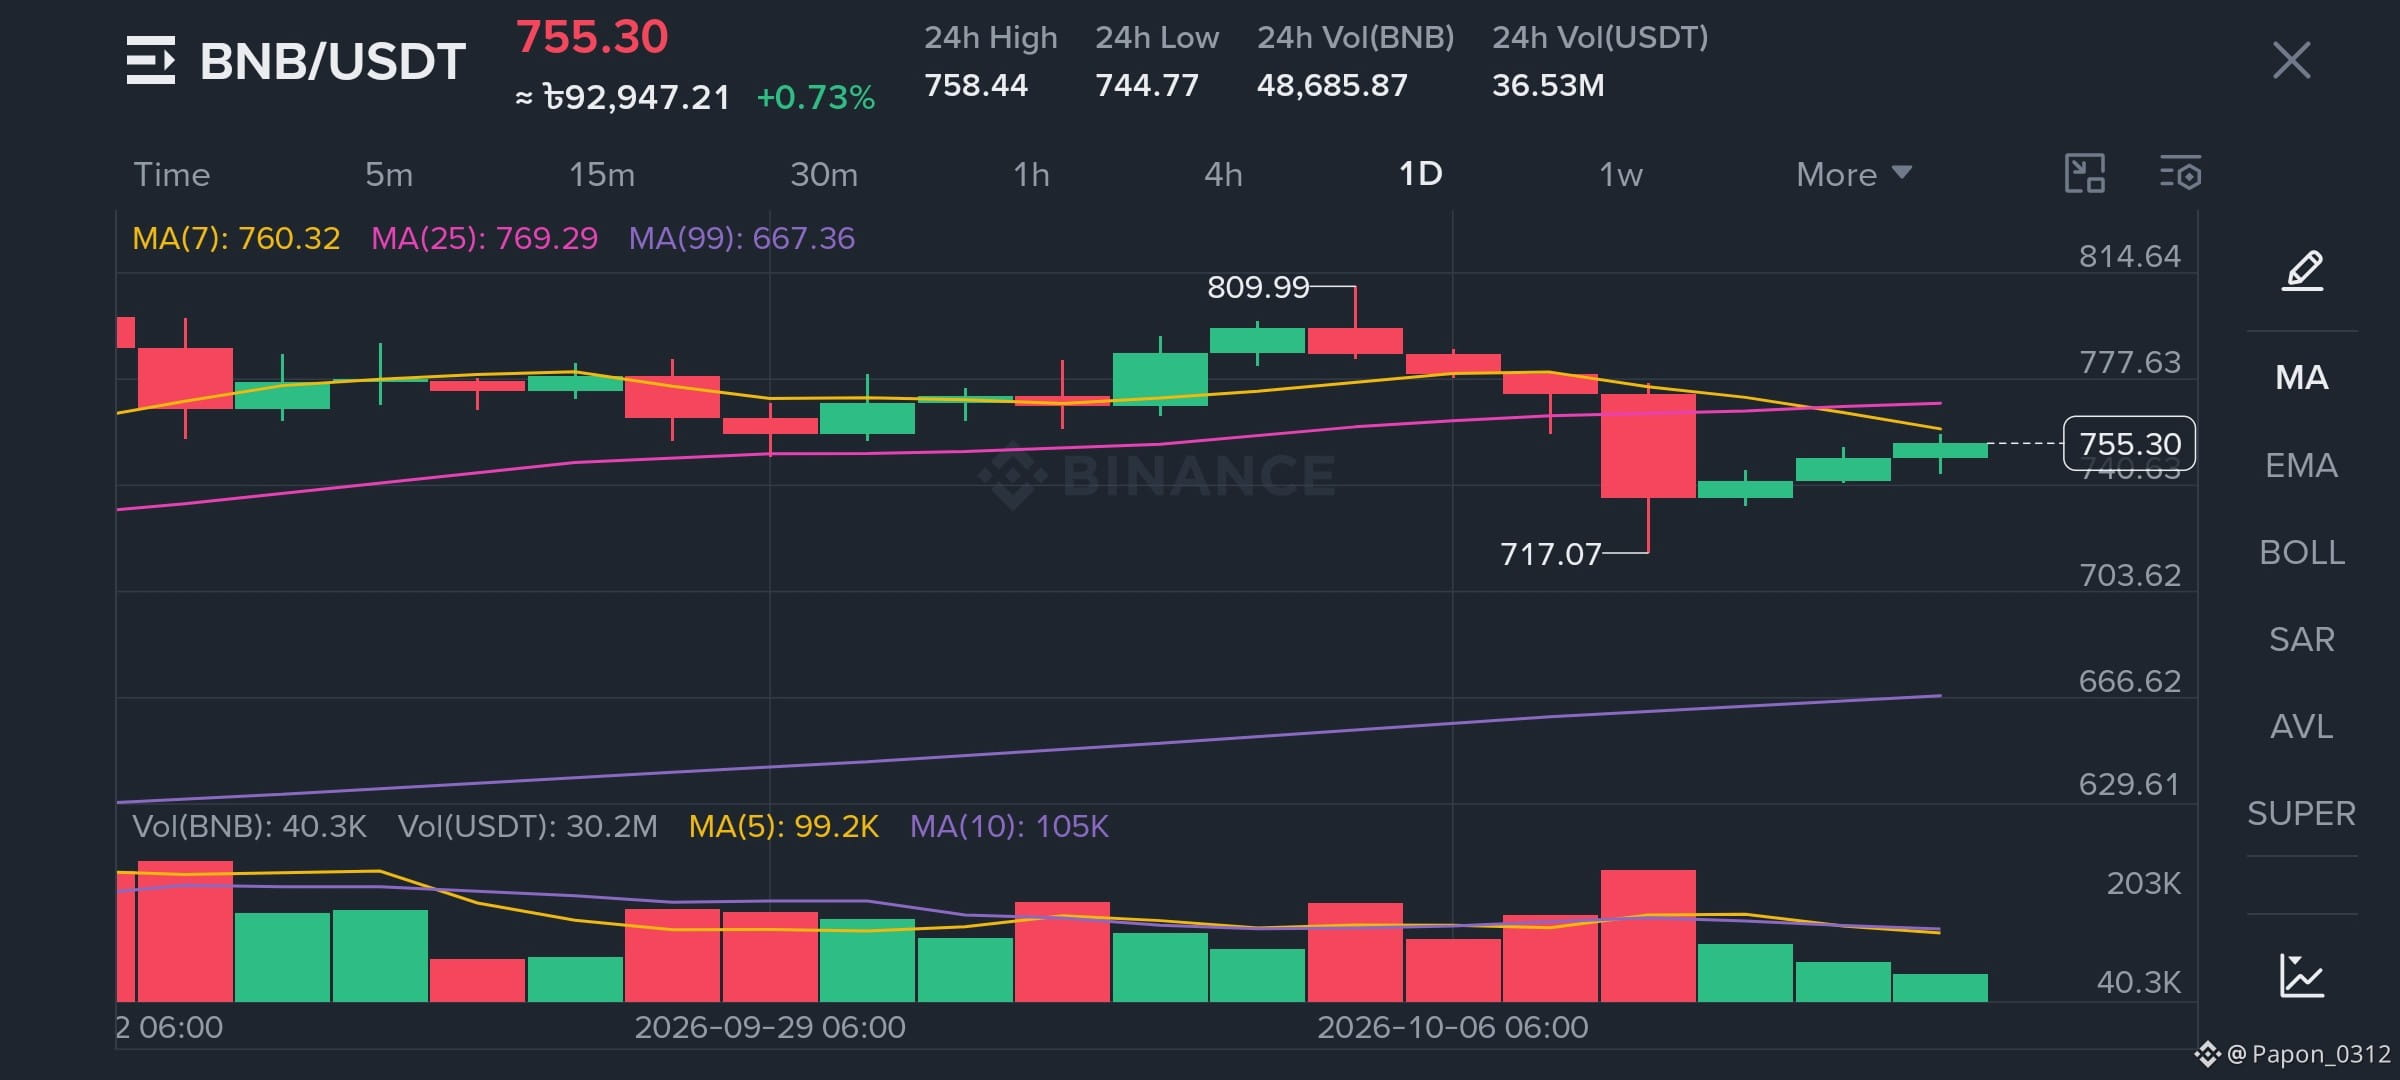
• Price: $755.30 (+0.73%)
• 24h High: $758.44 | 24h Low: $744.77
• Key Resistance: $809.99
• Recent Low / Support: $717.07
📈 Technical Overview:
After a recent pullback down to $717.07, $BNB has rebounded nicely with 4 consecutive green daily candles, signaling strong buying interest near the support zone.
• MA(7): $760.32 (Immediate short-term resistance)
• MA(25): $769.29
• MA(99): $667.36 (Strong long-term support base)
💡 Outlook:
If $BNB manages to break and close above the MA(7) and MA(25) resistance levels (~$760–$770), we could see a retest of the recent peak at $809.99+. However, keeping an eye on market volume is crucial as we approach these moving average hurdles.
What are your thoughts on BNB's next move? Are we breaking $800 soon? Let's discuss in the comments! 👇
#BNB #CryptoAnalysis #BİNANCE #BNBUSDT #TradingView #CryptoTrading
🚀$BNB /USDT Technical Analysis (1D Chart)
BNB is currently showing a nice recovery after testing lower support levels. Here is a quick breakdown of the daily chart:
📊 Current Price Action:
• Price: $755.30 (+0.73%)
• 24h High: $758.44 | 24h Low: $744.77
• Key Resistance: $809.99
• Recent Low / Support: $717.07
📈 Technical Overview:
After a recent pullback down to $717.07, $BNB has rebounded nicely with 4 consecutive green daily candles, signaling strong buying interest near the support zone.
• MA(7): $760.32 (Immediate short-term resistance)
• MA(25): $769.29
• MA(99): $667.36 (Strong long-term support base)
💡 Outlook:
If $BNB manages to break and close above the MA(7) and MA(25) resistance levels (~$760–$770), we could see a retest of the recent peak at $809.99+. However, keeping an eye on market volume is crucial as we approach these moving average hurdles.
What are your thoughts on BNB's next move? Are we breaking $800 soon? Let's discuss in the comments! 👇
#BNB #CryptoAnalysis #BİNANCE #BNBUSDT #TradingView #CryptoTrading
BNB is currently showing a nice recovery after testing lower support levels. Here is a quick breakdown of the daily chart:
📊 Current Price Action:
• Price: $755.30 (+0.73%)
• 24h High: $758.44 | 24h Low: $744.77
• Key Resistance: $809.99
• Recent Low / Support: $717.07
📈 Technical Overview:
After a recent pullback down to $717.07, $BNB has rebounded nicely with 4 consecutive green daily candles, signaling strong buying interest near the support zone.
• MA(7): $760.32 (Immediate short-term resistance)
• MA(25): $769.29
• MA(99): $667.36 (Strong long-term support base)
💡 Outlook:
If $BNB manages to break and close above the MA(7) and MA(25) resistance levels (~$760–$770), we could see a retest of the recent peak at $809.99+. However, keeping an eye on market volume is crucial as we approach these moving average hurdles.
What are your thoughts on BNB's next move? Are we breaking $800 soon? Let's discuss in the comments! 👇
#BNB #CryptoAnalysis #BİNANCE #BNBUSDT #TradingView #CryptoTrading
79
·
--
🚀 $ADA /USDT Market Overview & Technical Analysis
📊 Pair: $ADA /USDT
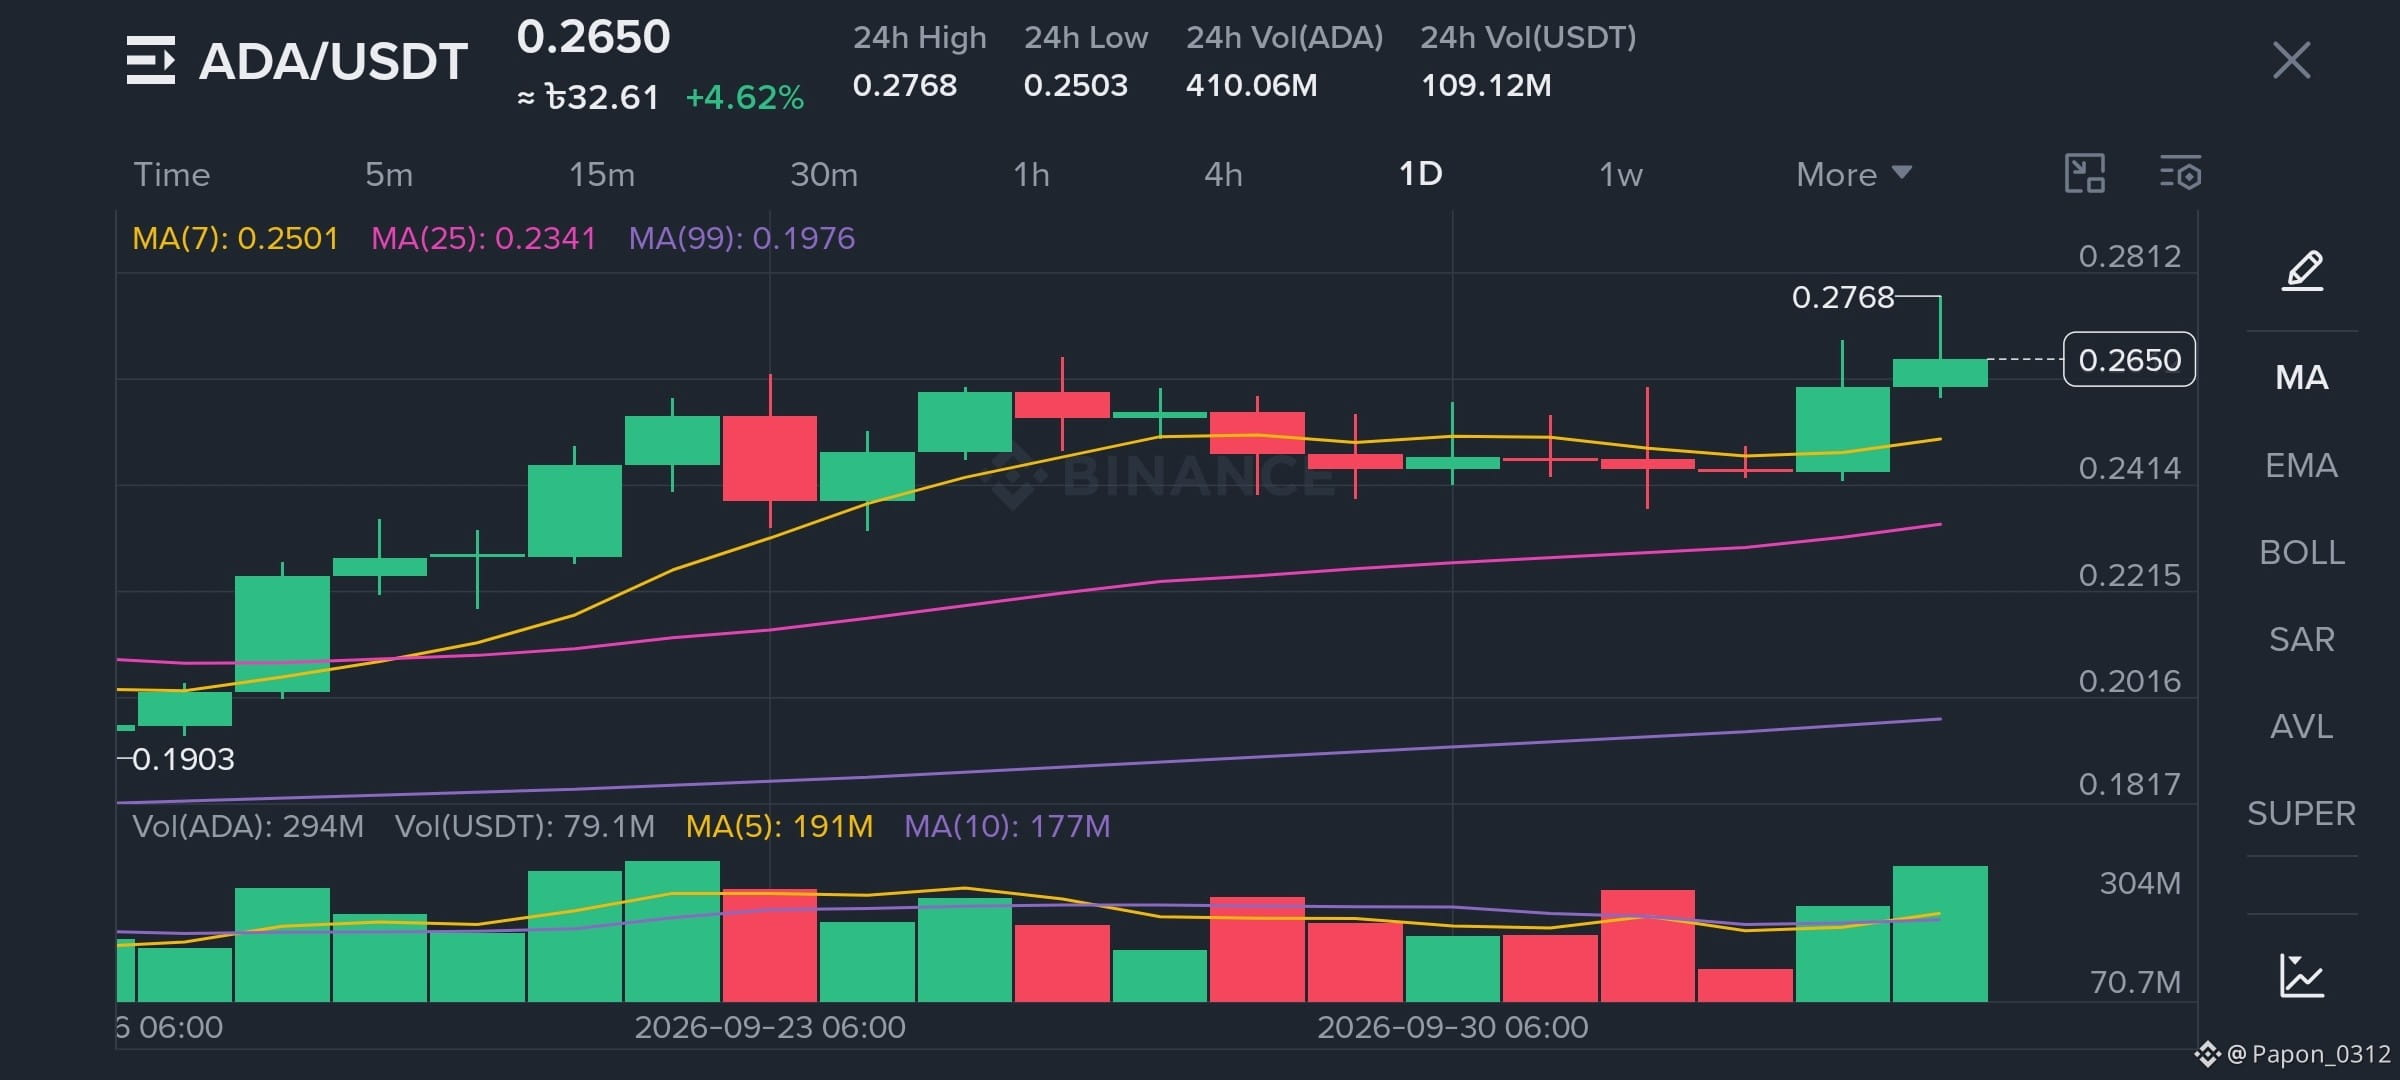
💰 Current Price: 0.2650 (+4.62%)
📈 24h High: 0.2768 | 📉 24h Low: 0.2503
📊 24h Volume (ADA): 410.06M
💵 24h Volume (USDT): 109.12M
🔍 Technical Indicators Breakdown (1D Chart):
• MA(7): 0.2501 (Strong short-term bullish signal)
• MA(25): 0.2341 (Medium-term support level)
• MA(99): 0.1976 (Long-term baseline support)
📈 Key Analysis:
ADA is demonstrating solid bullish momentum, trading well above all key Moving Averages (7, 25, and 99). The strong green candle accompanied by a healthy increase in volume signals strong buying interest.
🎯 Key Resistance: 0.2768 (24h High)
🛡️ Key Support: 0.2500 - 0.2503
💡 Sentiment: Bullish momentum continues as long as price holds above the MA(7) level at 0.2
#ADA #Cardano #USDT #ADACardano #TradingSignals
🚀 $ADA /USDT Market Overview & Technical Analysis
📊 Pair: $ADA /USDT
💰 Current Price: 0.2650 (+4.62%)
📈 24h High: 0.2768 | 📉 24h Low: 0.2503
📊 24h Volume (ADA): 410.06M
💵 24h Volume (USDT): 109.12M
🔍 Technical Indicators Breakdown (1D Chart):
• MA(7): 0.2501 (Strong short-term bullish signal)
• MA(25): 0.2341 (Medium-term support level)
• MA(99): 0.1976 (Long-term baseline support)
📈 Key Analysis:
ADA is demonstrating solid bullish momentum, trading well above all key Moving Averages (7, 25, and 99). The strong green candle accompanied by a healthy increase in volume signals strong buying interest.
🎯 Key Resistance: 0.2768 (24h High)
🛡️ Key Support: 0.2500 - 0.2503
💡 Sentiment: Bullish momentum continues as long as price holds above the MA(7) level at 0.2
#ADA #Cardano #USDT #ADACardano #TradingSignals
📊 Pair: $ADA /USDT
💰 Current Price: 0.2650 (+4.62%)
📈 24h High: 0.2768 | 📉 24h Low: 0.2503
📊 24h Volume (ADA): 410.06M
💵 24h Volume (USDT): 109.12M
🔍 Technical Indicators Breakdown (1D Chart):
• MA(7): 0.2501 (Strong short-term bullish signal)
• MA(25): 0.2341 (Medium-term support level)
• MA(99): 0.1976 (Long-term baseline support)
📈 Key Analysis:
ADA is demonstrating solid bullish momentum, trading well above all key Moving Averages (7, 25, and 99). The strong green candle accompanied by a healthy increase in volume signals strong buying interest.
🎯 Key Resistance: 0.2768 (24h High)
🛡️ Key Support: 0.2500 - 0.2503
💡 Sentiment: Bullish momentum continues as long as price holds above the MA(7) level at 0.2
#ADA #Cardano #USDT #ADACardano #TradingSignals
86
·
--
🚀 $ETH Technical Analysis: Is Ethereum Preparing for the Next Big Move? 🚀
Ethereum ($ETH ) is currently showing strong bullish momentum on the 1-Day chart! Here’s a quick breakdown of the current market structure:
📊 Key Technical Levels:
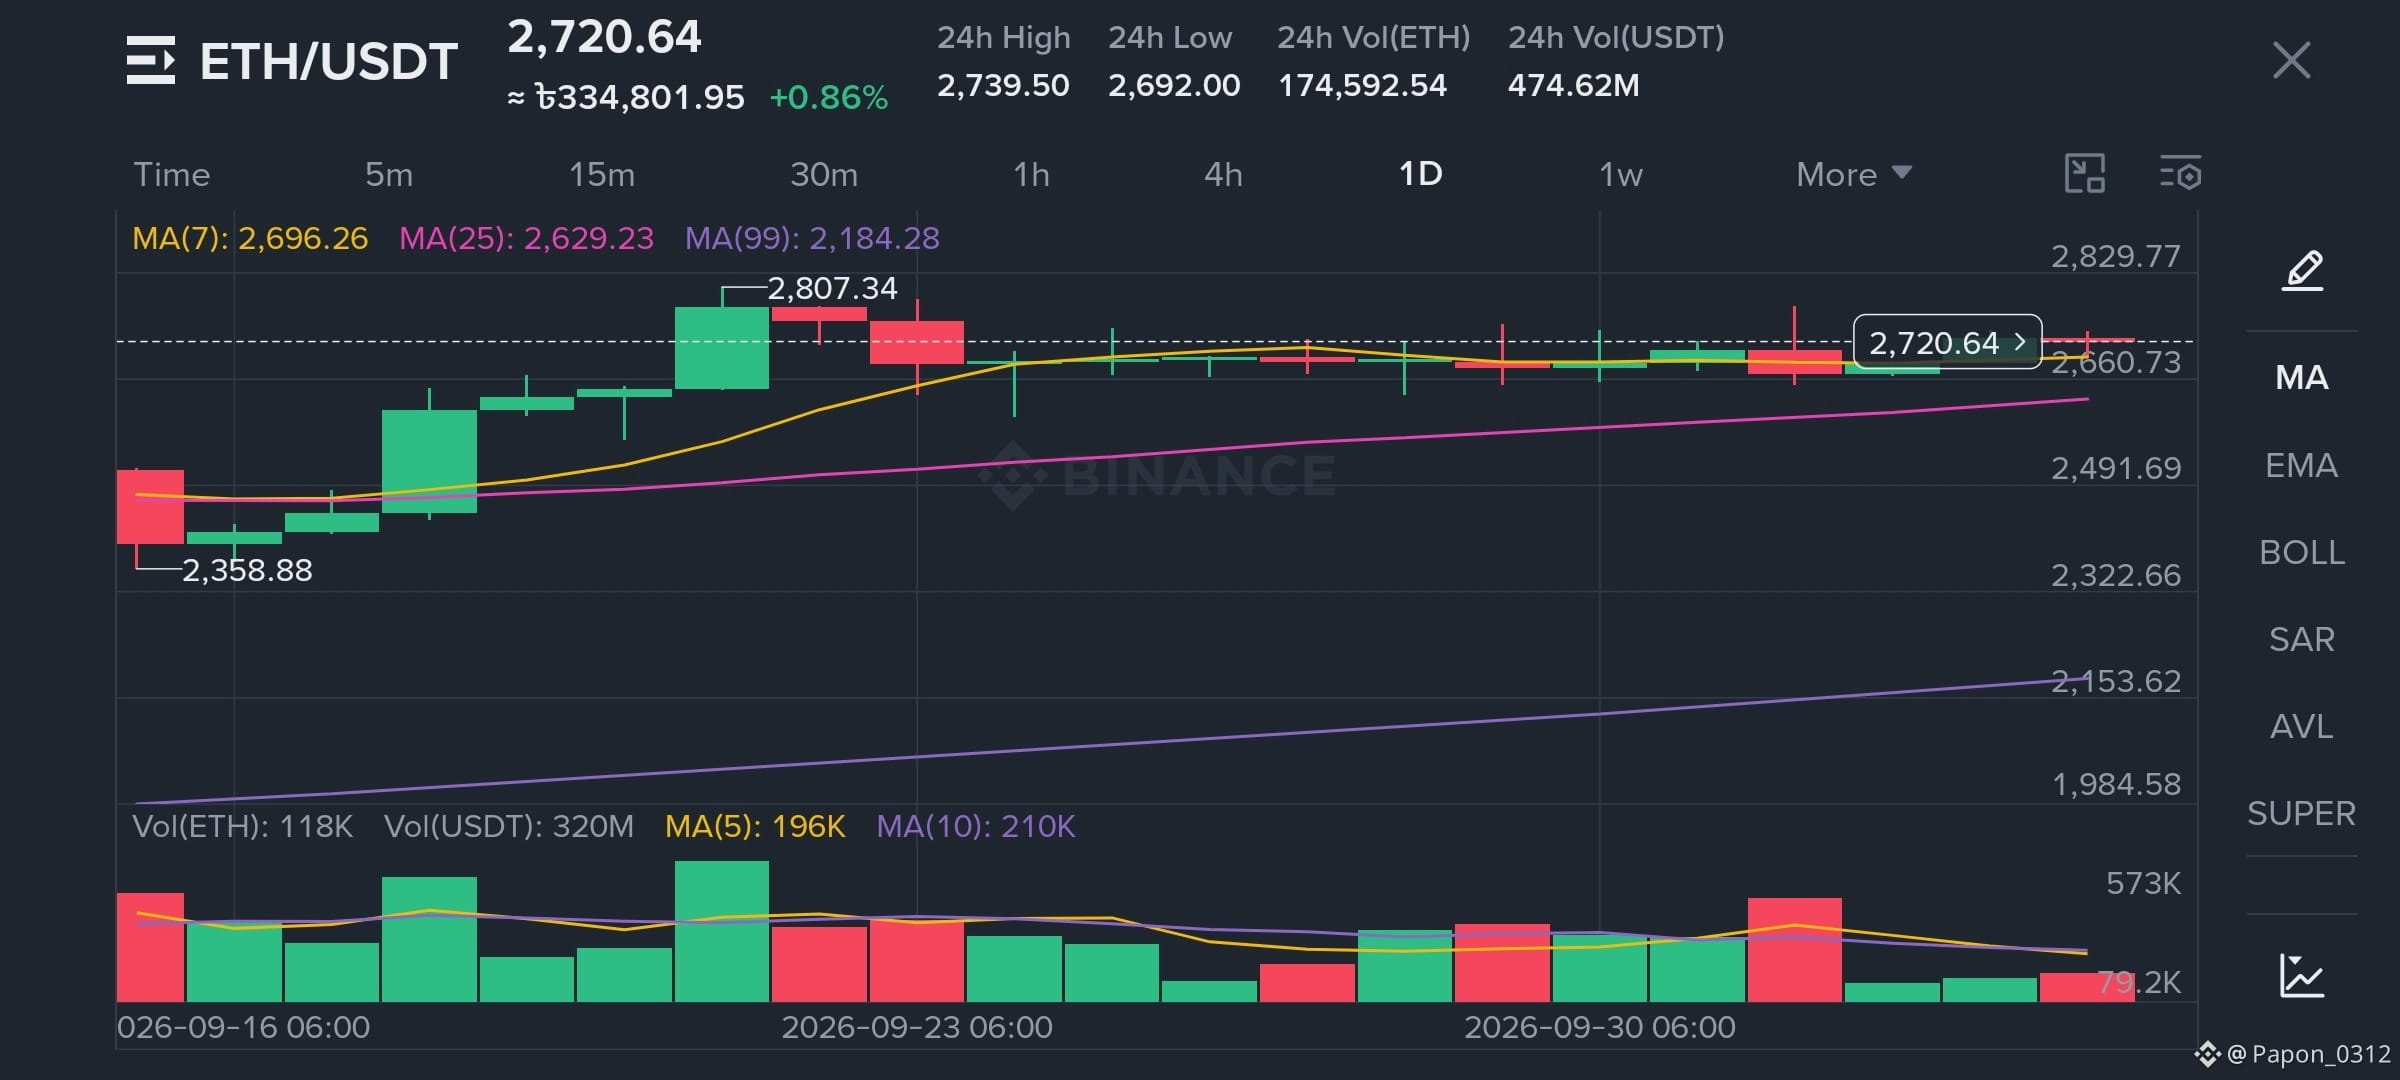
• Current Price: $2,720.64 (+0.86%)[span_0](start_span)[span_0](end_span)
• 24h High: $2,739.50[span_1](start_span)[span_1](end_span)
• 24h Low: $2,692.00[span_2](start_span)[span_2](end_span)
• Immediate Resistance: $2,807.34[span_3](start_span)[span_3](end_span)
• Key Support (MA7): $2,696.26[span_4](start_span)[span_4](end_span)
• Strong Support (MA25): $2,629.23[span_5](start_span)[span_5](end_span)
🔍 Market Analysis:
1️⃣ Moving Averages Alignment: ETH is currently trading nicely above both its 7-day MA ($2,696.26) and 25-day MA ($2,629.23)[span_6](start_span)[span_6](end_span). The short-term trend remains healthy and bullish as long as price holds above $2,690.
2️⃣ Consolidation Zone: After hitting the high of $2,807.34[span_7](start_span)[span_7](end_span), $ETH has been consolidating sideways, building strong support around the $2,700 level.
3️⃣ Volume Check: 24h trading volume is at 174.59K ETH ($474.62M USDT)[span_8](start_span)[span_8](end_span), showing stable interest from buyers.
🎯 What's Next?
• If ETH breaks and holds above $2,750, we could see a quick retest of $2,807 and potentially push towards $2,900+.
• If a pull-back occurs, the $2,630–$2,690 zone acts as strong buying support.
What are your thoughts on Ethereum's next direction? Are you Holding or Taking Profit? Let me know in the comments below! 👇
#ETH #Ethereum #CryptoAnalysis" #BinanceSquare #TechnicalAnalysis
🚀 $ETH Technical Analysis: Is Ethereum Preparing for the Next Big Move? 🚀
Ethereum ($ETH ) is currently showing strong bullish momentum on the 1-Day chart! Here’s a quick breakdown of the current market structure:
📊 Key Technical Levels:
• Current Price: $2,720.64 (+0.86%)[span_0](start_span)[span_0](end_span)
• 24h High: $2,739.50[span_1](start_span)[span_1](end_span)
• 24h Low: $2,692.00[span_2](start_span)[span_2](end_span)
• Immediate Resistance: $2,807.34[span_3](start_span)[span_3](end_span)
• Key Support (MA7): $2,696.26[span_4](start_span)[span_4](end_span)
• Strong Support (MA25): $2,629.23[span_5](start_span)[span_5](end_span)
🔍 Market Analysis:
1️⃣ Moving Averages Alignment: ETH is currently trading nicely above both its 7-day MA ($2,696.26) and 25-day MA ($2,629.23)[span_6](start_span)[span_6](end_span). The short-term trend remains healthy and bullish as long as price holds above $2,690.
2️⃣ Consolidation Zone: After hitting the high of $2,807.34[span_7](start_span)[span_7](end_span), $ETH has been consolidating sideways, building strong support around the $2,700 level.
3️⃣ Volume Check: 24h trading volume is at 174.59K ETH ($474.62M USDT)[span_8](start_span)[span_8](end_span), showing stable interest from buyers.
🎯 What's Next?
• If ETH breaks and holds above $2,750, we could see a quick retest of $2,807 and potentially push towards $2,900+.
• If a pull-back occurs, the $2,630–$2,690 zone acts as strong buying support.
What are your thoughts on Ethereum's next direction? Are you Holding or Taking Profit? Let me know in the comments below! 👇
#ETH #Ethereum #CryptoAnalysis" #BinanceSquare #TechnicalAnalysis
Ethereum ($ETH ) is currently showing strong bullish momentum on the 1-Day chart! Here’s a quick breakdown of the current market structure:
📊 Key Technical Levels:
• Current Price: $2,720.64 (+0.86%)[span_0](start_span)[span_0](end_span)
• 24h High: $2,739.50[span_1](start_span)[span_1](end_span)
• 24h Low: $2,692.00[span_2](start_span)[span_2](end_span)
• Immediate Resistance: $2,807.34[span_3](start_span)[span_3](end_span)
• Key Support (MA7): $2,696.26[span_4](start_span)[span_4](end_span)
• Strong Support (MA25): $2,629.23[span_5](start_span)[span_5](end_span)
🔍 Market Analysis:
1️⃣ Moving Averages Alignment: ETH is currently trading nicely above both its 7-day MA ($2,696.26) and 25-day MA ($2,629.23)[span_6](start_span)[span_6](end_span). The short-term trend remains healthy and bullish as long as price holds above $2,690.
2️⃣ Consolidation Zone: After hitting the high of $2,807.34[span_7](start_span)[span_7](end_span), $ETH has been consolidating sideways, building strong support around the $2,700 level.
3️⃣ Volume Check: 24h trading volume is at 174.59K ETH ($474.62M USDT)[span_8](start_span)[span_8](end_span), showing stable interest from buyers.
🎯 What's Next?
• If ETH breaks and holds above $2,750, we could see a quick retest of $2,807 and potentially push towards $2,900+.
• If a pull-back occurs, the $2,630–$2,690 zone acts as strong buying support.
What are your thoughts on Ethereum's next direction? Are you Holding or Taking Profit? Let me know in the comments below! 👇
#ETH #Ethereum #CryptoAnalysis" #BinanceSquare #TechnicalAnalysis
86
·
--
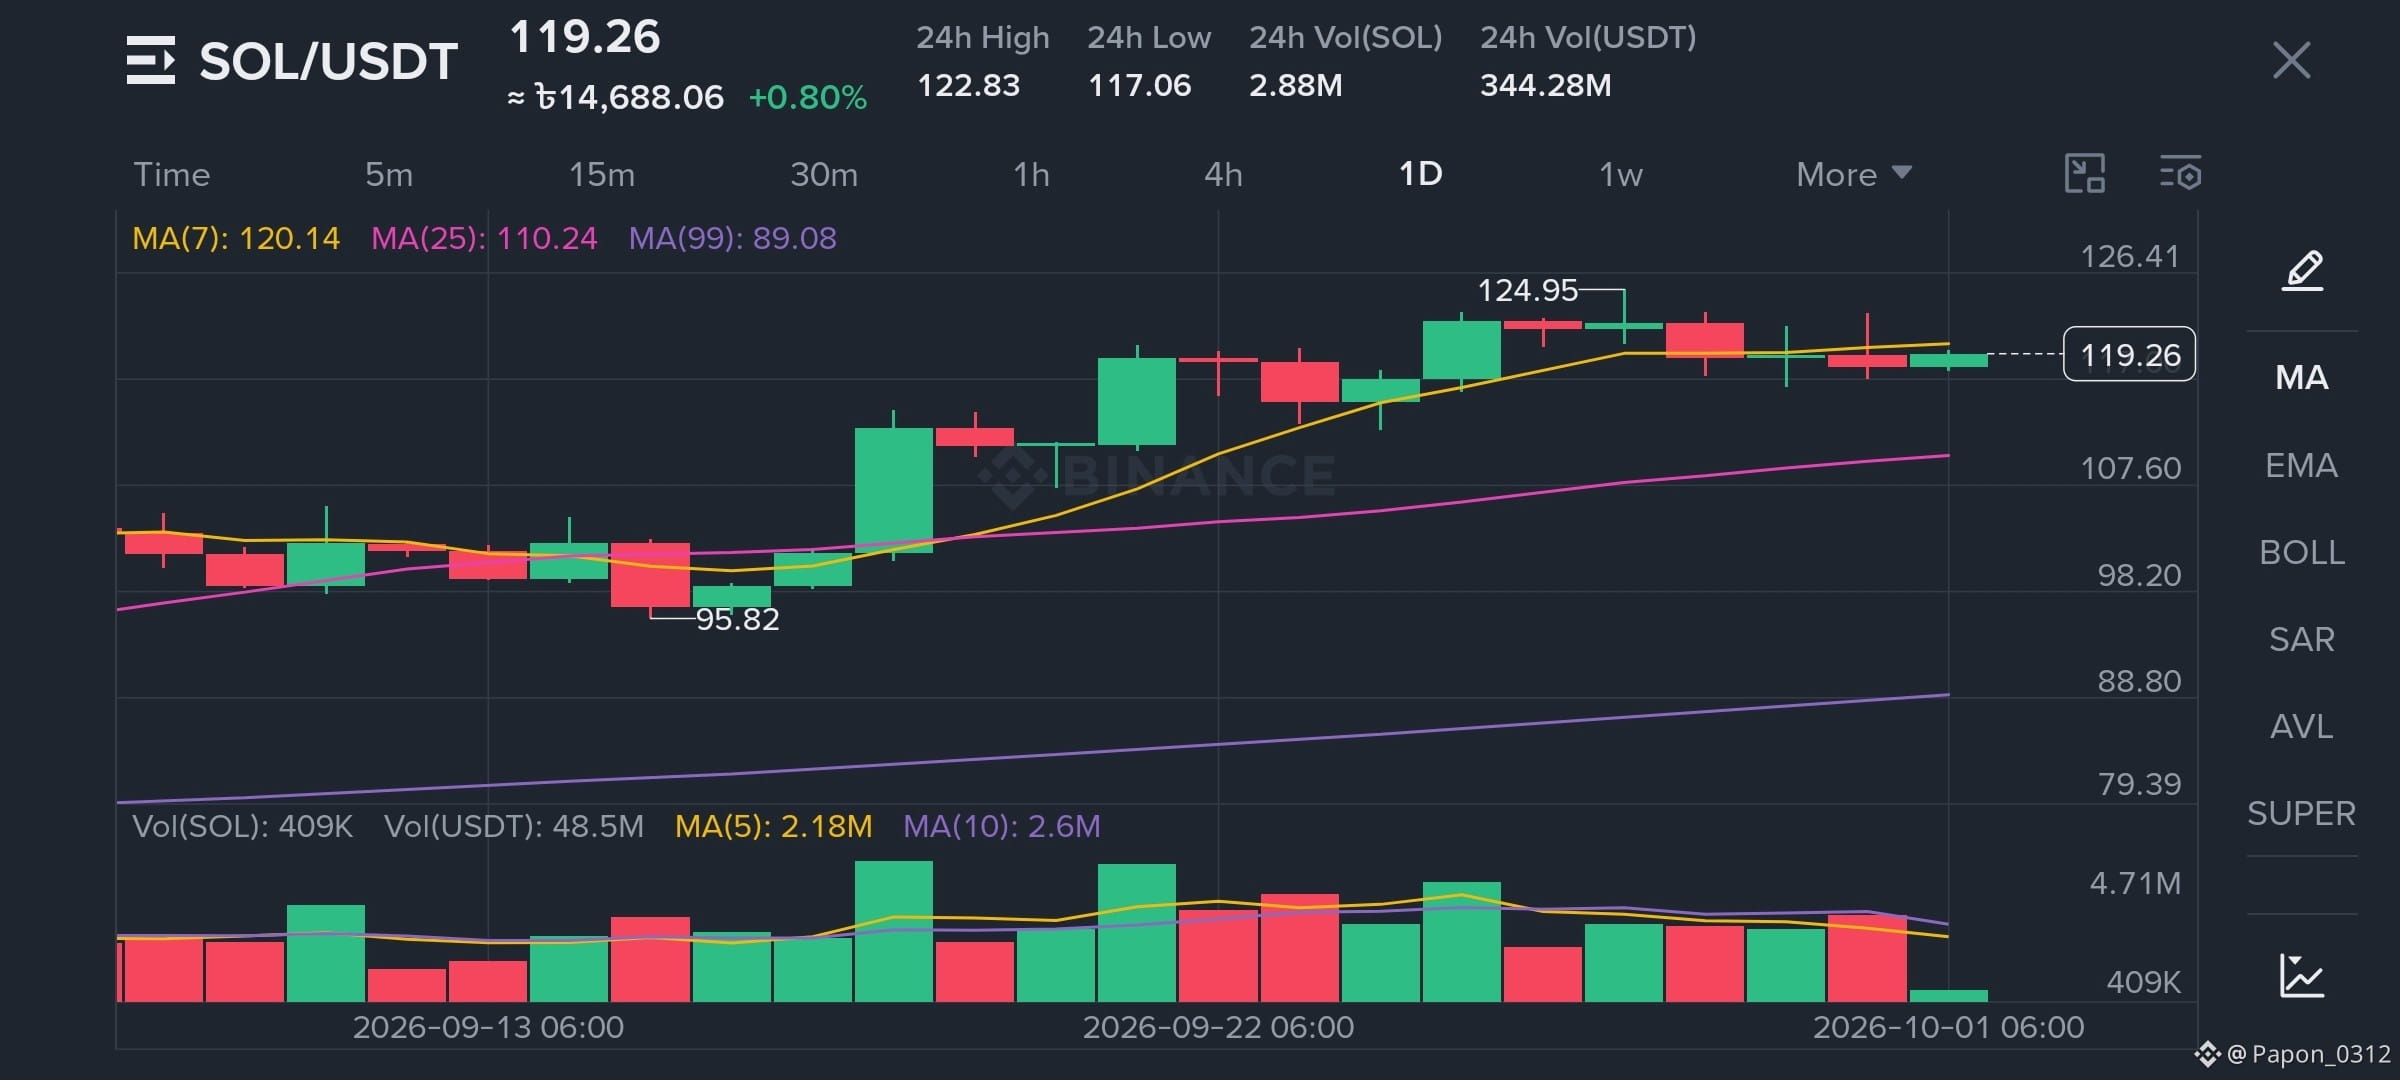
🚀 $SOL /USDT Daily Analysis: Consolidation Near Resistance! 🚀
Solana ($SOL ) is currently trading around $119.26 (+0.80%), demonstrating solid resilience and holding steady after its recent upward momentum from the $95.82 low.
📊 Key Technical Highlights:
• Current Price: $119.26
• 24h High / Low: $122.83 / $117.06
• Moving Averages:
- MA(7): $120.14 (Short-term resistance)
- MA(25): $110.24 (Strong Dynamic Support)
- MA(99): $89.08 (Long-term Bullish Trend Base)
🔍 What's Next for SOL?
1️⃣ Resistance Level: The immediate resistance sits around $120.14 (MA-7) and the recent swing high at $124.95. A clean daily candle close above $125 could trigger a strong continuation towards $130+.
2️⃣ Support Level: On the downside, the MA(25) at $110.24 serves as robust support, keeping the medium-term structure healthy.
⚡ Trading Sentiment:
Price action shows steady consolidation. Buyers are holding ground above key moving averages. Keep an eye on the volume break for the next big move!
What’s your short-term target for $SOL ? Are you Bullish or Bearish? Let’s discuss below! 👇
#Solana #SOL #CryptoAnalysis #BinanceSquare #Trading
🚀 $SOL /USDT Daily Analysis: Consolidation Near Resistance! 🚀
Solana ($SOL ) is currently trading around $119.26 (+0.80%), demonstrating solid resilience and holding steady after its recent upward momentum from the $95.82 low.
📊 Key Technical Highlights:
• Current Price: $119.26
• 24h High / Low: $122.83 / $117.06
• Moving Averages:
- MA(7): $120.14 (Short-term resistance)
- MA(25): $110.24 (Strong Dynamic Support)
- MA(99): $89.08 (Long-term Bullish Trend Base)
🔍 What's Next for SOL?
1️⃣ Resistance Level: The immediate resistance sits around $120.14 (MA-7) and the recent swing high at $124.95. A clean daily candle close above $125 could trigger a strong continuation towards $130+.
2️⃣ Support Level: On the downside, the MA(25) at $110.24 serves as robust support, keeping the medium-term structure healthy.
⚡ Trading Sentiment:
Price action shows steady consolidation. Buyers are holding ground above key moving averages. Keep an eye on the volume break for the next big move!
What’s your short-term target for $SOL ? Are you Bullish or Bearish? Let’s discuss below! 👇
#Solana #SOL #CryptoAnalysis #BinanceSquare #Trading
Solana ($SOL ) is currently trading around $119.26 (+0.80%), demonstrating solid resilience and holding steady after its recent upward momentum from the $95.82 low.
📊 Key Technical Highlights:
• Current Price: $119.26
• 24h High / Low: $122.83 / $117.06
• Moving Averages:
- MA(7): $120.14 (Short-term resistance)
- MA(25): $110.24 (Strong Dynamic Support)
- MA(99): $89.08 (Long-term Bullish Trend Base)
🔍 What's Next for SOL?
1️⃣ Resistance Level: The immediate resistance sits around $120.14 (MA-7) and the recent swing high at $124.95. A clean daily candle close above $125 could trigger a strong continuation towards $130+.
2️⃣ Support Level: On the downside, the MA(25) at $110.24 serves as robust support, keeping the medium-term structure healthy.
⚡ Trading Sentiment:
Price action shows steady consolidation. Buyers are holding ground above key moving averages. Keep an eye on the volume break for the next big move!
What’s your short-term target for $SOL ? Are you Bullish or Bearish? Let’s discuss below! 👇
#Solana #SOL #CryptoAnalysis #BinanceSquare #Trading
103
·
--
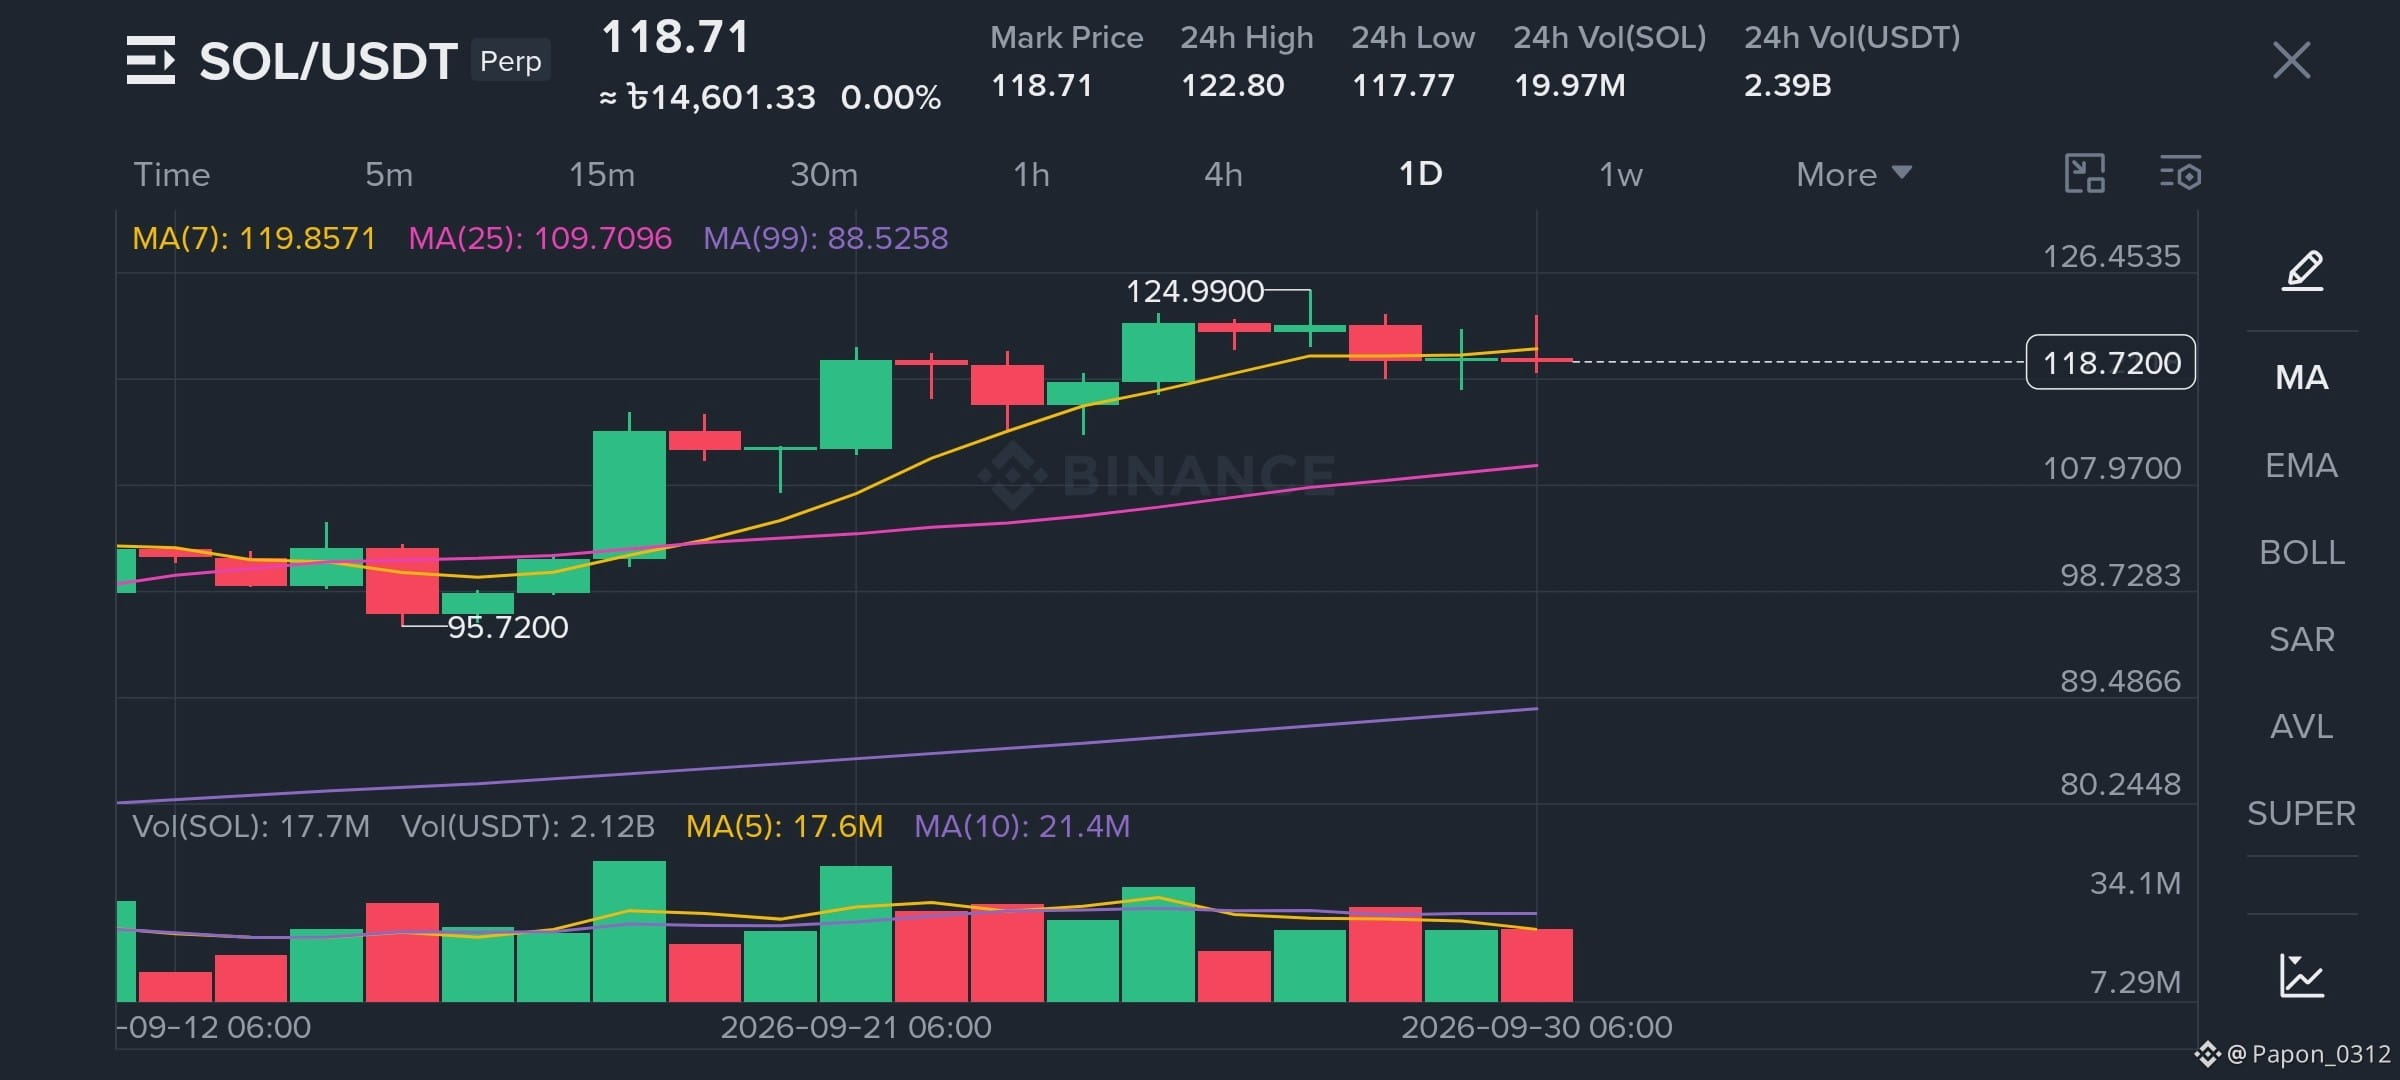
🚨 $SOL /USDT Daily Technical Update: Consolidation Before the Next Big Move? 🚨
Solana ($SOL ) is currently trading around $118.7, consolidating after testing the $125 resistance level. Let’s break down what the 1D chart is telling us! 📊
🔍 Key Technical Highlights:
1️⃣ Price Action & Trend:
SOL recently surged from its recent low of $95.72 up to a local high of $124.99. Currently, it's taking a breather and forming a consolidation zone near $118 - $120.
2️⃣ Moving Averages Breakdown:
• MA(7) [Yellow]: ~$119.85 – Price is trading right around this short-term moving average, showing slight indecision.
• MA(25) [Purple]: ~$109.70 – Serves as a strong immediate support zone.
• MA(99) [Blue]: ~$88.52 – Major macro support line keeping the broader trend healthy.
3️⃣ Volume & Sentiment:
Trading volume remains steady with 24h Vol(SOL) around 19.97M ($2.39B USDT). Buyers are defending the $115–$118 range well, but a clear daily candle close above $125 is needed to trigger a bullish breakout towards $130+.
🎯 Crucial Levels to Watch:
• Immediate Support: $115.00 – $109.70
• Key Resistance: $125.00 – $126.50
💬 What’s your play on $SOL right now? Are you buying the dip or waiting for a breakout above $125? Let me know in the comments below! 👇
#SOL #Solana #CryptoAnalysis #BinanceSquare #Trading
🚨 $SOL /USDT Daily Technical Update: Consolidation Before the Next Big Move? 🚨
Solana ($SOL ) is currently trading around $118.7, consolidating after testing the $125 resistance level. Let’s break down what the 1D chart is telling us! 📊
🔍 Key Technical Highlights:
1️⃣ Price Action & Trend:
SOL recently surged from its recent low of $95.72 up to a local high of $124.99. Currently, it's taking a breather and forming a consolidation zone near $118 - $120.
2️⃣ Moving Averages Breakdown:
• MA(7) [Yellow]: ~$119.85 – Price is trading right around this short-term moving average, showing slight indecision.
• MA(25) [Purple]: ~$109.70 – Serves as a strong immediate support zone.
• MA(99) [Blue]: ~$88.52 – Major macro support line keeping the broader trend healthy.
3️⃣ Volume & Sentiment:
Trading volume remains steady with 24h Vol(SOL) around 19.97M ($2.39B USDT). Buyers are defending the $115–$118 range well, but a clear daily candle close above $125 is needed to trigger a bullish breakout towards $130+.
🎯 Crucial Levels to Watch:
• Immediate Support: $115.00 – $109.70
• Key Resistance: $125.00 – $126.50
💬 What’s your play on $SOL right now? Are you buying the dip or waiting for a breakout above $125? Let me know in the comments below! 👇
#SOL #Solana #CryptoAnalysis #BinanceSquare #Trading
Solana ($SOL ) is currently trading around $118.7, consolidating after testing the $125 resistance level. Let’s break down what the 1D chart is telling us! 📊
🔍 Key Technical Highlights:
1️⃣ Price Action & Trend:
SOL recently surged from its recent low of $95.72 up to a local high of $124.99. Currently, it's taking a breather and forming a consolidation zone near $118 - $120.
2️⃣ Moving Averages Breakdown:
• MA(7) [Yellow]: ~$119.85 – Price is trading right around this short-term moving average, showing slight indecision.
• MA(25) [Purple]: ~$109.70 – Serves as a strong immediate support zone.
• MA(99) [Blue]: ~$88.52 – Major macro support line keeping the broader trend healthy.
3️⃣ Volume & Sentiment:
Trading volume remains steady with 24h Vol(SOL) around 19.97M ($2.39B USDT). Buyers are defending the $115–$118 range well, but a clear daily candle close above $125 is needed to trigger a bullish breakout towards $130+.
🎯 Crucial Levels to Watch:
• Immediate Support: $115.00 – $109.70
• Key Resistance: $125.00 – $126.50
💬 What’s your play on $SOL right now? Are you buying the dip or waiting for a breakout above $125? Let me know in the comments below! 👇
#SOL #Solana #CryptoAnalysis #BinanceSquare #Trading
78
·
--
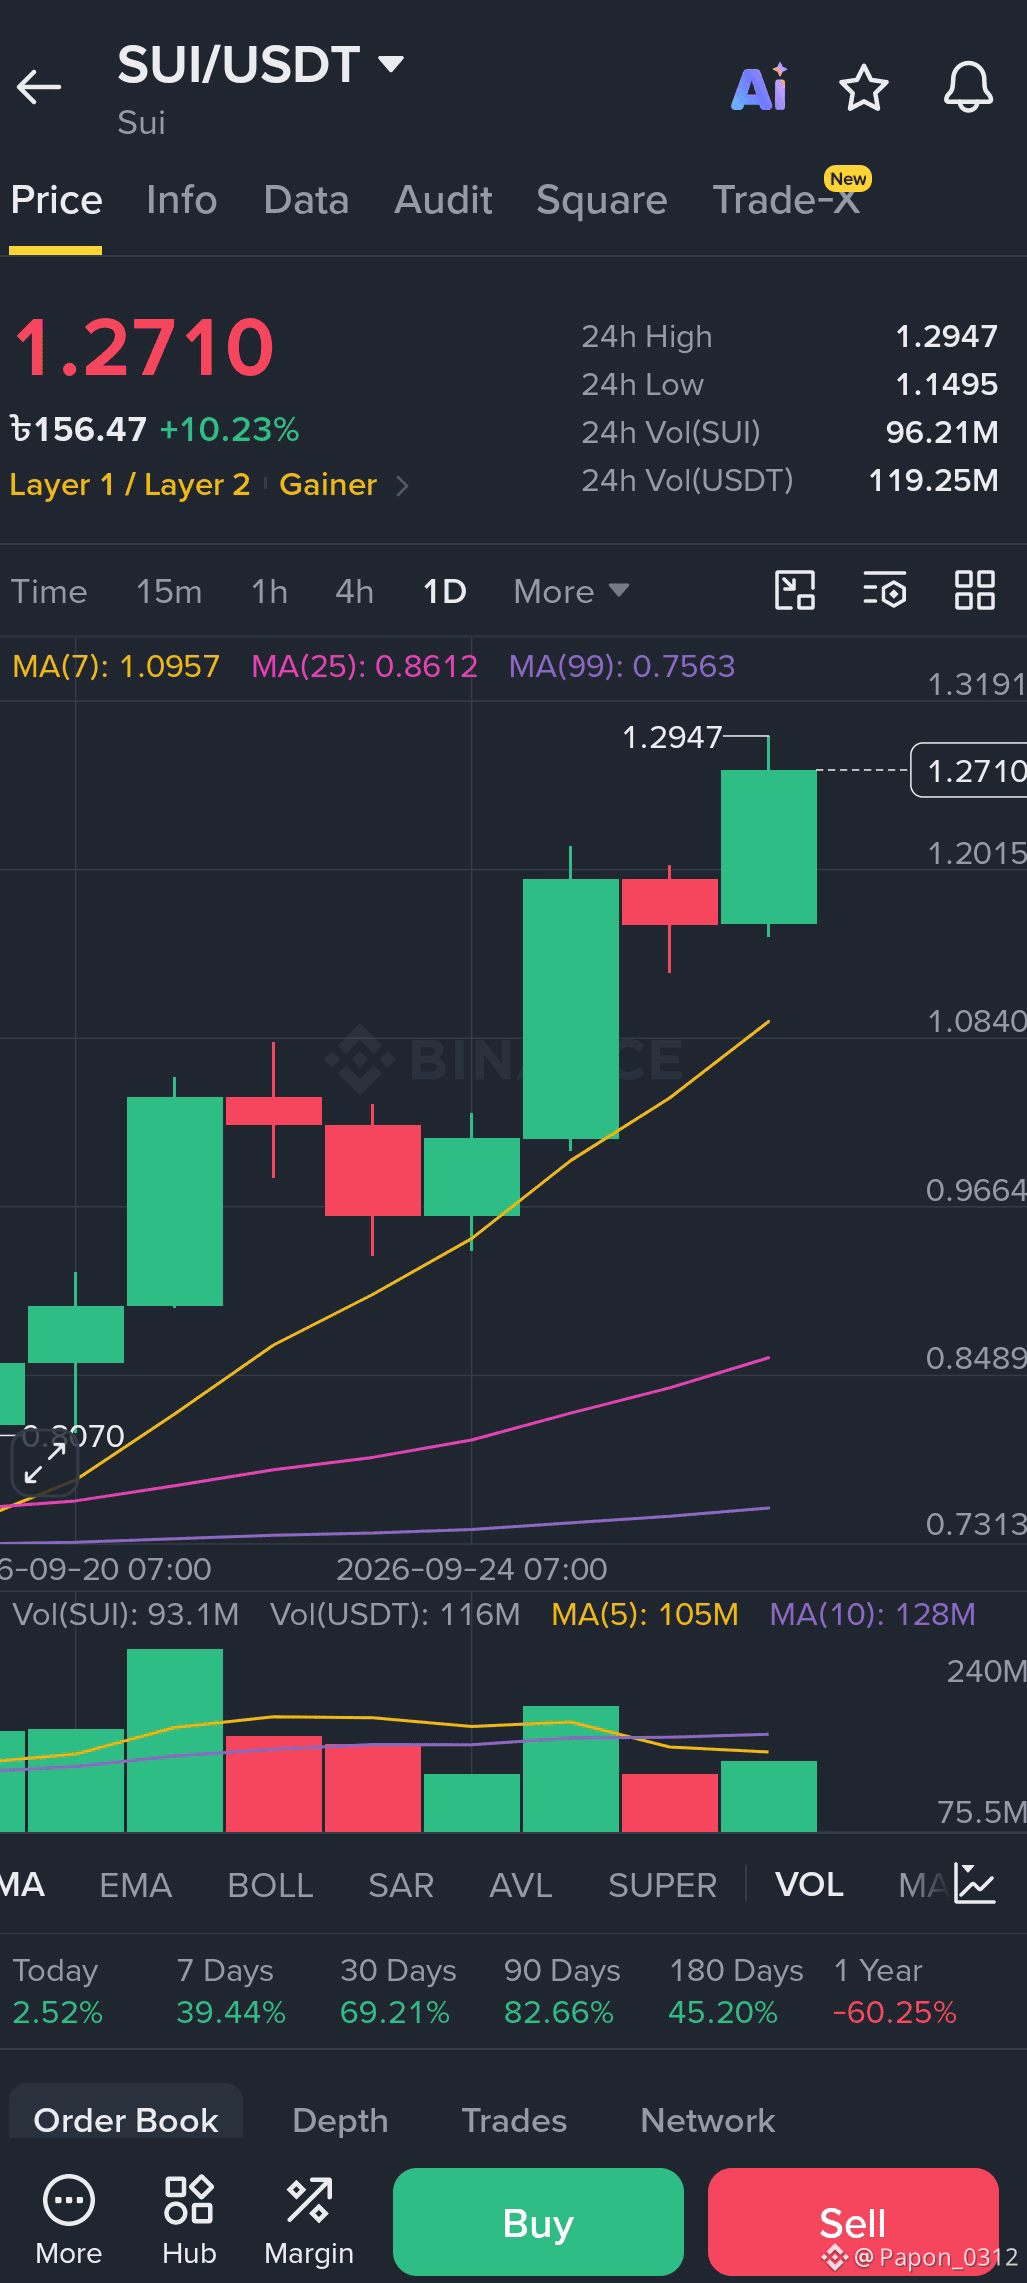
🚀 $SUI /USDT is on a Strong Bullish Run! 🔥
$SUI is showing massive momentum in the market right now!
📊 Market Highlights:
• Current Price: $1.2710
• 24h Gain: +10.23% 📈
• 24h High: $1.2947
• 24h Low: $1.1495
With a 39.44% gain over the last 7 days and 69.21% over the last 30 days, SUI is proving to be a top performer in Layer 1! The daily chart shows solid support above key Moving Averages (MA 7/25/99), signaling strong bullish sentiment.
What's your price prediction? Do you think SUI will cross $1.50 next? Let me know in the comments! 👇
#SUI #USDT #CryptoTrading. #BinanceSquare #CryptoNews #Bullish #Altcoins
🚀 $SUI /USDT is on a Strong Bullish Run! 🔥
$SUI is showing massive momentum in the market right now!
📊 Market Highlights:
• Current Price: $1.2710
• 24h Gain: +10.23% 📈
• 24h High: $1.2947
• 24h Low: $1.1495
With a 39.44% gain over the last 7 days and 69.21% over the last 30 days, SUI is proving to be a top performer in Layer 1! The daily chart shows solid support above key Moving Averages (MA 7/25/99), signaling strong bullish sentiment.
What's your price prediction? Do you think SUI will cross $1.50 next? Let me know in the comments! 👇
#SUI #USDT #CryptoTrading. #BinanceSquare #CryptoNews #Bullish #Altcoins
$SUI is showing massive momentum in the market right now!
📊 Market Highlights:
• Current Price: $1.2710
• 24h Gain: +10.23% 📈
• 24h High: $1.2947
• 24h Low: $1.1495
With a 39.44% gain over the last 7 days and 69.21% over the last 30 days, SUI is proving to be a top performer in Layer 1! The daily chart shows solid support above key Moving Averages (MA 7/25/99), signaling strong bullish sentiment.
What's your price prediction? Do you think SUI will cross $1.50 next? Let me know in the comments! 👇
#SUI #USDT #CryptoTrading. #BinanceSquare #CryptoNews #Bullish #Altcoins
155
·
--
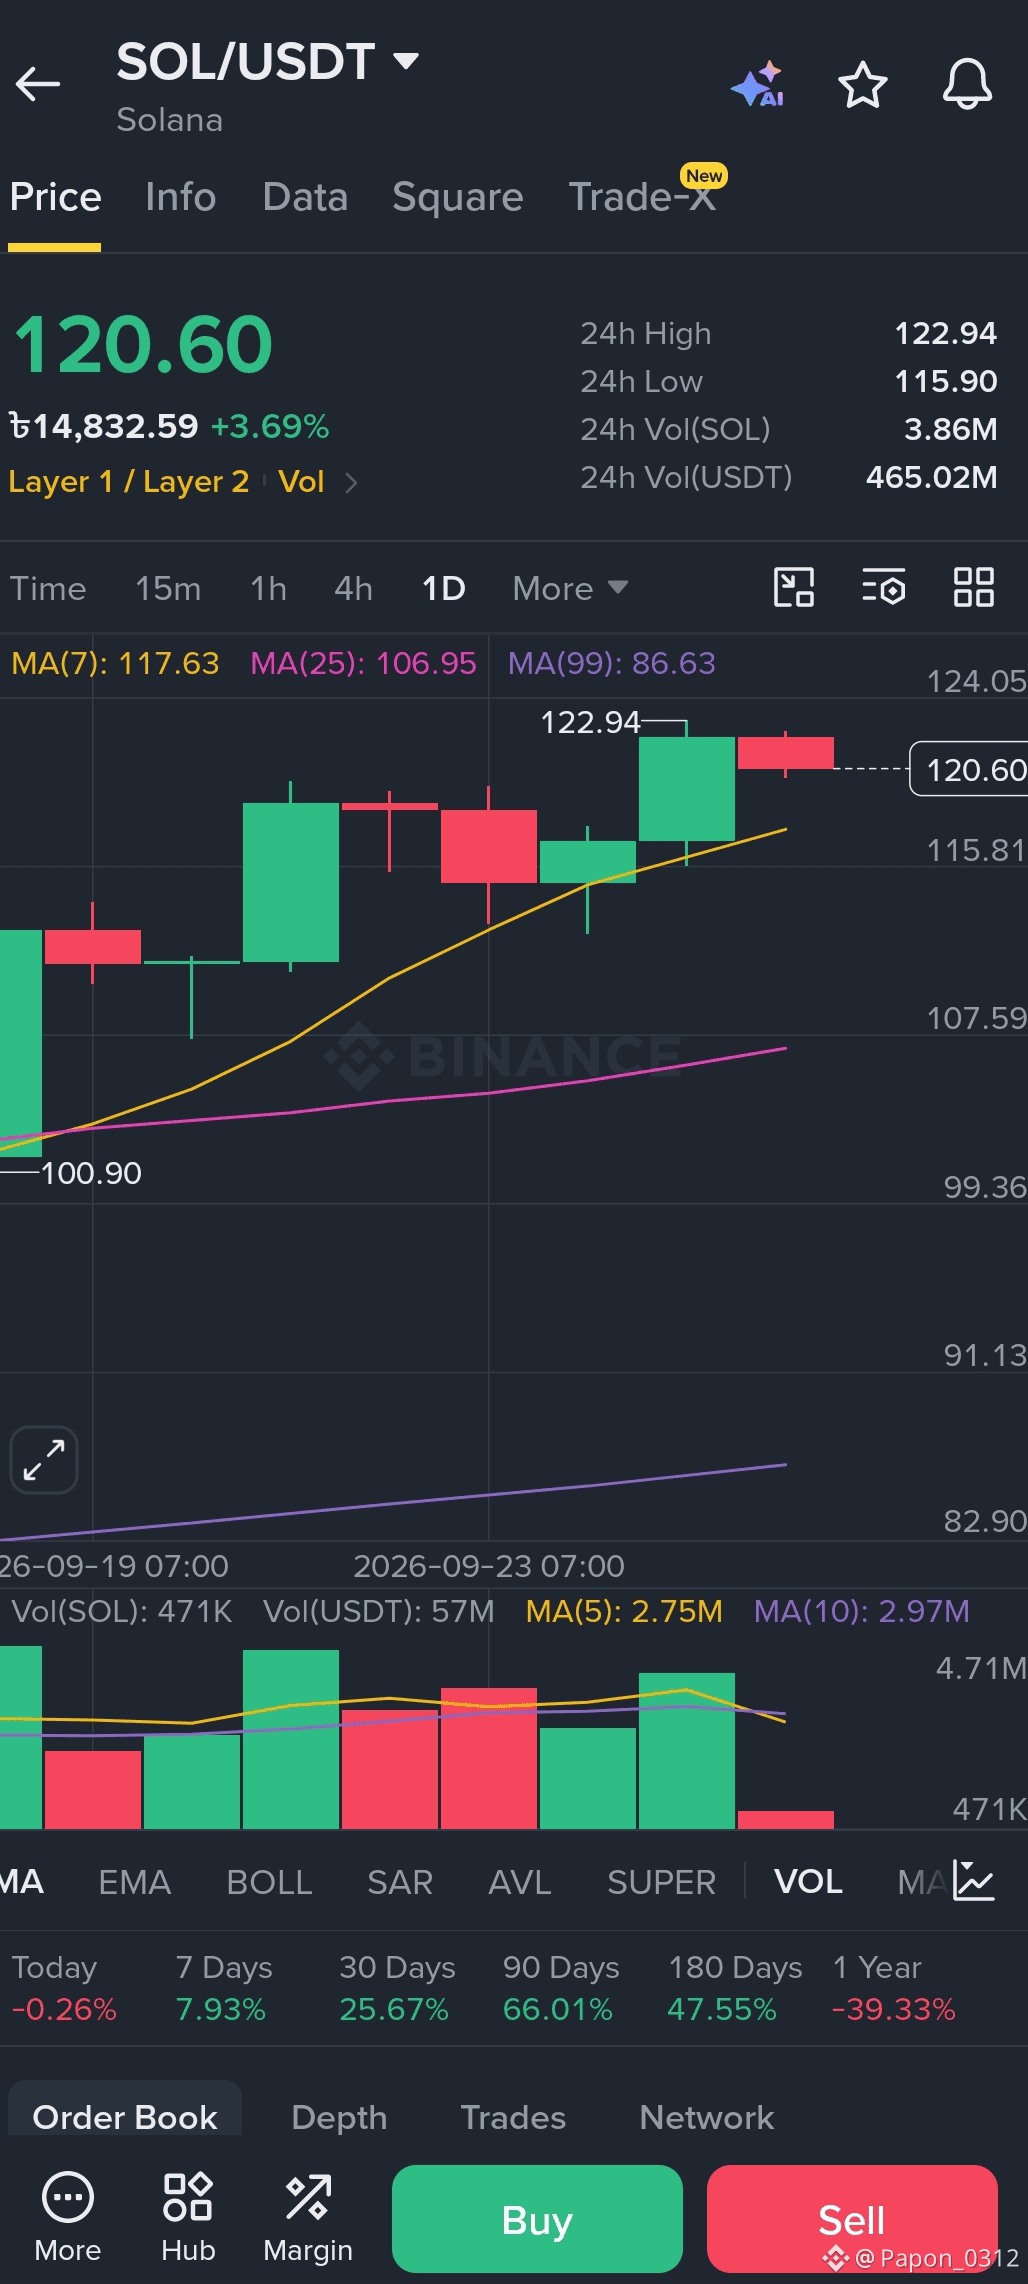
🚀 $SOL On The Move: Key Levels & Analysis 📊
Solana (SOL/USDT) has shown a strong recovery from the $100.90 support zone and is currently trading around $120.60, marking a +3.69% gain in 24 hours.
🔍 Technical Highlights:
• Moving Averages: The MA(7) at $117.63 is trending above MA(25) and MA(99), reflecting solid bullish momentum on the daily chart.
• Key Levels: SOL recently tested resistance at $122.94. Holding support above the $115–$117 range could pave the way for further upside.
• Volume: Trading volume remains healthy, signaling strong buyer interest.
💡 Strategy Note:
Dips near support could offer good risk-to-reward entry points for short-to-medium term trades. Always manage your risk and set proper Stop-Loss orders before entering.
What’s your prediction for SOL? Will we see a breakout soon? Drop your thoughts below! 👇
#Crypto #BinanceSquare #Solana #SOL #TechnicalAnalysis #CryptoTrading
🚀 $SOL On The Move: Key Levels & Analysis 📊
Solana (SOL/USDT) has shown a strong recovery from the $100.90 support zone and is currently trading around $120.60, marking a +3.69% gain in 24 hours.
🔍 Technical Highlights:
• Moving Averages: The MA(7) at $117.63 is trending above MA(25) and MA(99), reflecting solid bullish momentum on the daily chart.
• Key Levels: SOL recently tested resistance at $122.94. Holding support above the $115–$117 range could pave the way for further upside.
• Volume: Trading volume remains healthy, signaling strong buyer interest.
💡 Strategy Note:
Dips near support could offer good risk-to-reward entry points for short-to-medium term trades. Always manage your risk and set proper Stop-Loss orders before entering.
What’s your prediction for SOL? Will we see a breakout soon? Drop your thoughts below! 👇
#Crypto #BinanceSquare #Solana #SOL #TechnicalAnalysis #CryptoTrading
Solana (SOL/USDT) has shown a strong recovery from the $100.90 support zone and is currently trading around $120.60, marking a +3.69% gain in 24 hours.
🔍 Technical Highlights:
• Moving Averages: The MA(7) at $117.63 is trending above MA(25) and MA(99), reflecting solid bullish momentum on the daily chart.
• Key Levels: SOL recently tested resistance at $122.94. Holding support above the $115–$117 range could pave the way for further upside.
• Volume: Trading volume remains healthy, signaling strong buyer interest.
💡 Strategy Note:
Dips near support could offer good risk-to-reward entry points for short-to-medium term trades. Always manage your risk and set proper Stop-Loss orders before entering.
What’s your prediction for SOL? Will we see a breakout soon? Drop your thoughts below! 👇
#Crypto #BinanceSquare #Solana #SOL #TechnicalAnalysis #CryptoTrading
102
·
--
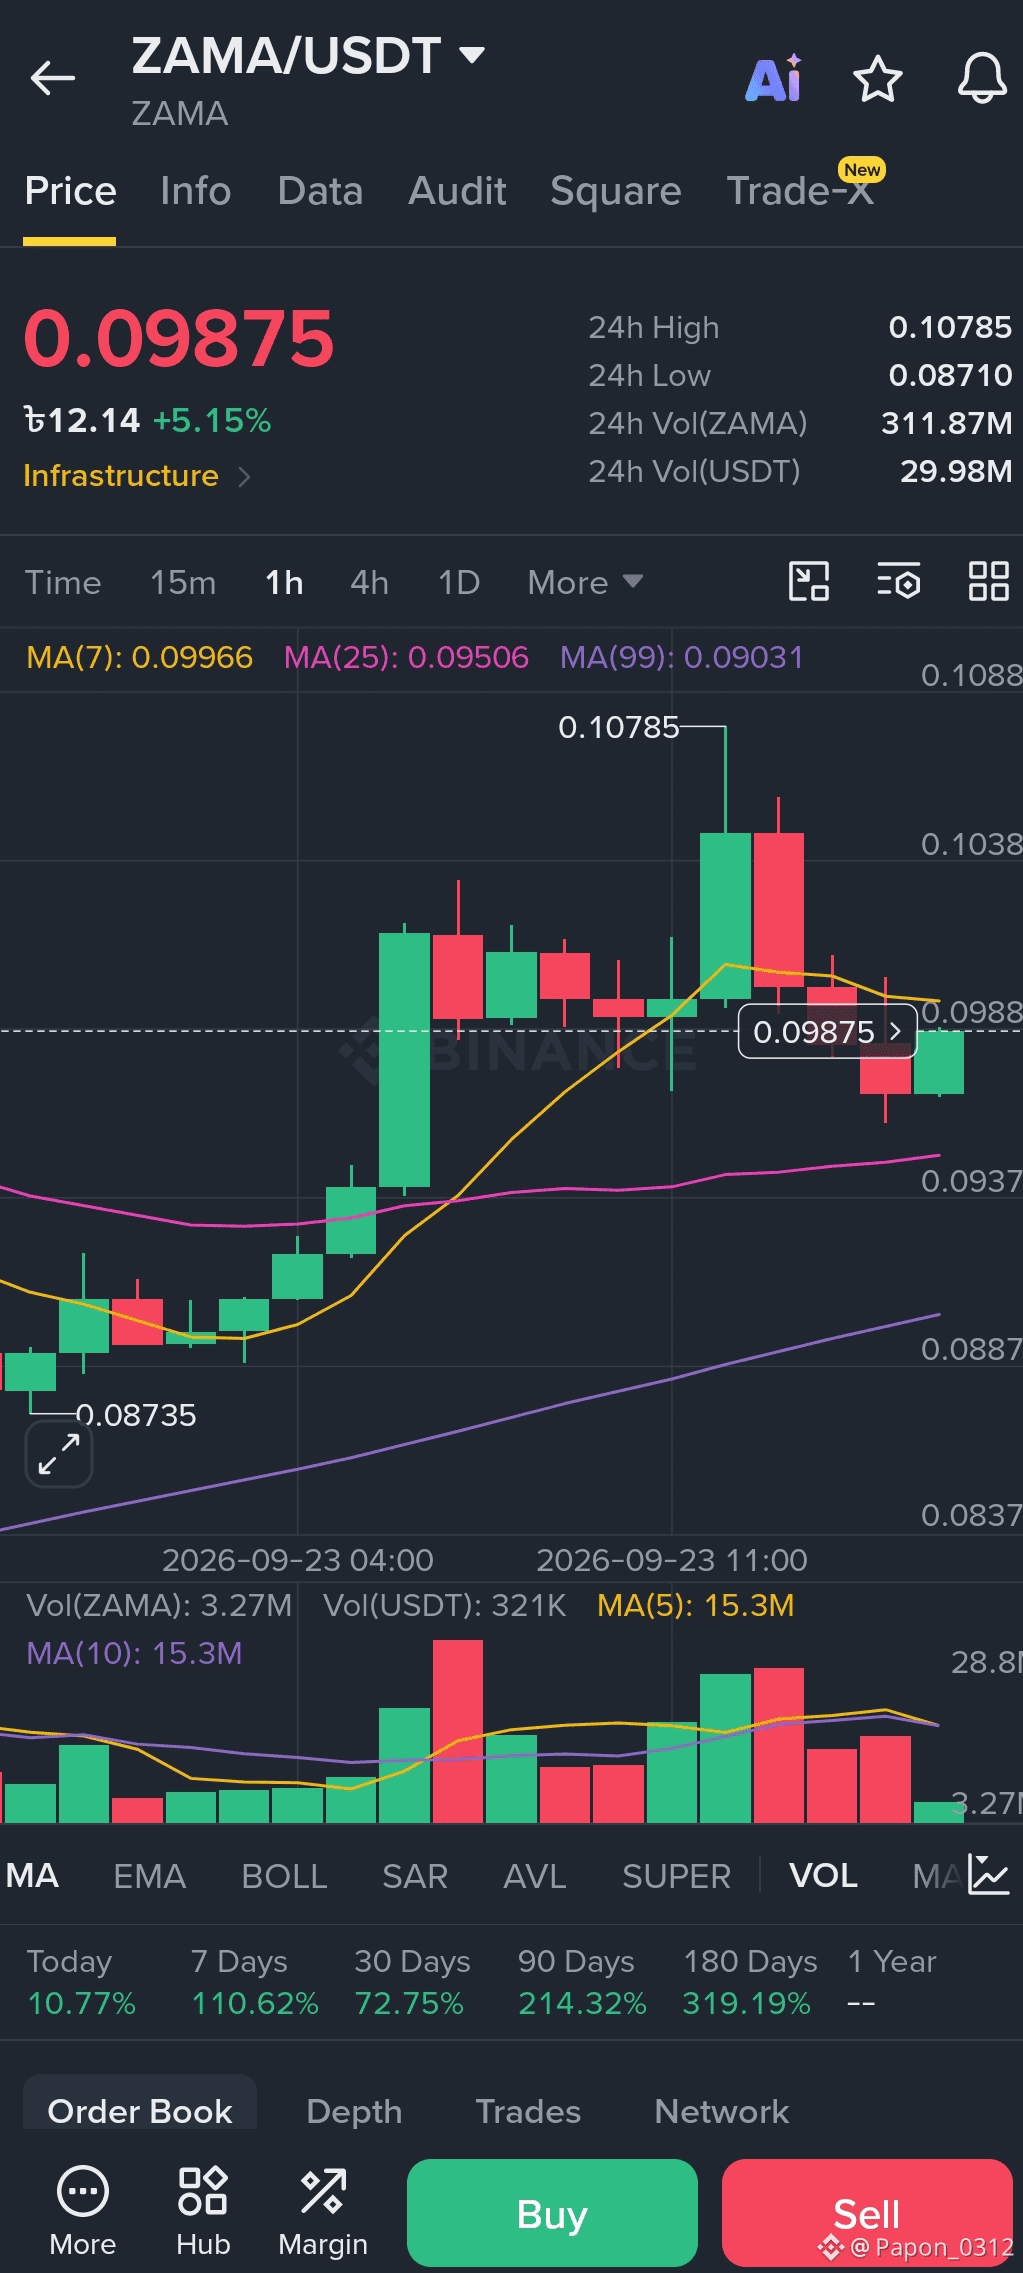
Is $ZAMA coin ($ZAMA ) Ready for the Next Big Move? 🚀📊
Crypto markets are all about catching the right momentum before the rest of the crowd notices. $ZAMA has been getting a lot of attention lately, but smart traders always analyze before taking action!
Here is what I'm watching closely:
1️⃣ Price Action & Volume: Looking for strong support levels and sudden volume spikes.
2️⃣ Community Sentiment: Hype brings volatility, but utility brings long-term value.
3️⃣ Risk Management: Never FOMO in without a solid entry plan and stop-loss.
💡 What is your take on $Zama right now? Are you holding, buying the dip, or waiting on the sidelines?
Drop your price predictions below! 👇
#zama #CryptoTrading #Altcoins👀🚀 #BinanceSquare #cryptocommunity#TradingStrategy
Is $ZAMA coin ($ZAMA ) Ready for the Next Big Move? 🚀📊
Crypto markets are all about catching the right momentum before the rest of the crowd notices. $ZAMA has been getting a lot of attention lately, but smart traders always analyze before taking action!
Here is what I'm watching closely:
1️⃣ Price Action & Volume: Looking for strong support levels and sudden volume spikes.
2️⃣ Community Sentiment: Hype brings volatility, but utility brings long-term value.
3️⃣ Risk Management: Never FOMO in without a solid entry plan and stop-loss.
💡 What is your take on $Zama right now? Are you holding, buying the dip, or waiting on the sidelines?
Drop your price predictions below! 👇
#zama #CryptoTrading #Altcoins👀🚀 #BinanceSquare #cryptocommunity#TradingStrategy
Crypto markets are all about catching the right momentum before the rest of the crowd notices. $ZAMA has been getting a lot of attention lately, but smart traders always analyze before taking action!
Here is what I'm watching closely:
1️⃣ Price Action & Volume: Looking for strong support levels and sudden volume spikes.
2️⃣ Community Sentiment: Hype brings volatility, but utility brings long-term value.
3️⃣ Risk Management: Never FOMO in without a solid entry plan and stop-loss.
💡 What is your take on $Zama right now? Are you holding, buying the dip, or waiting on the sidelines?
Drop your price predictions below! 👇
#zama #CryptoTrading #Altcoins👀🚀 #BinanceSquare #cryptocommunity#TradingStrategy
270
·
--
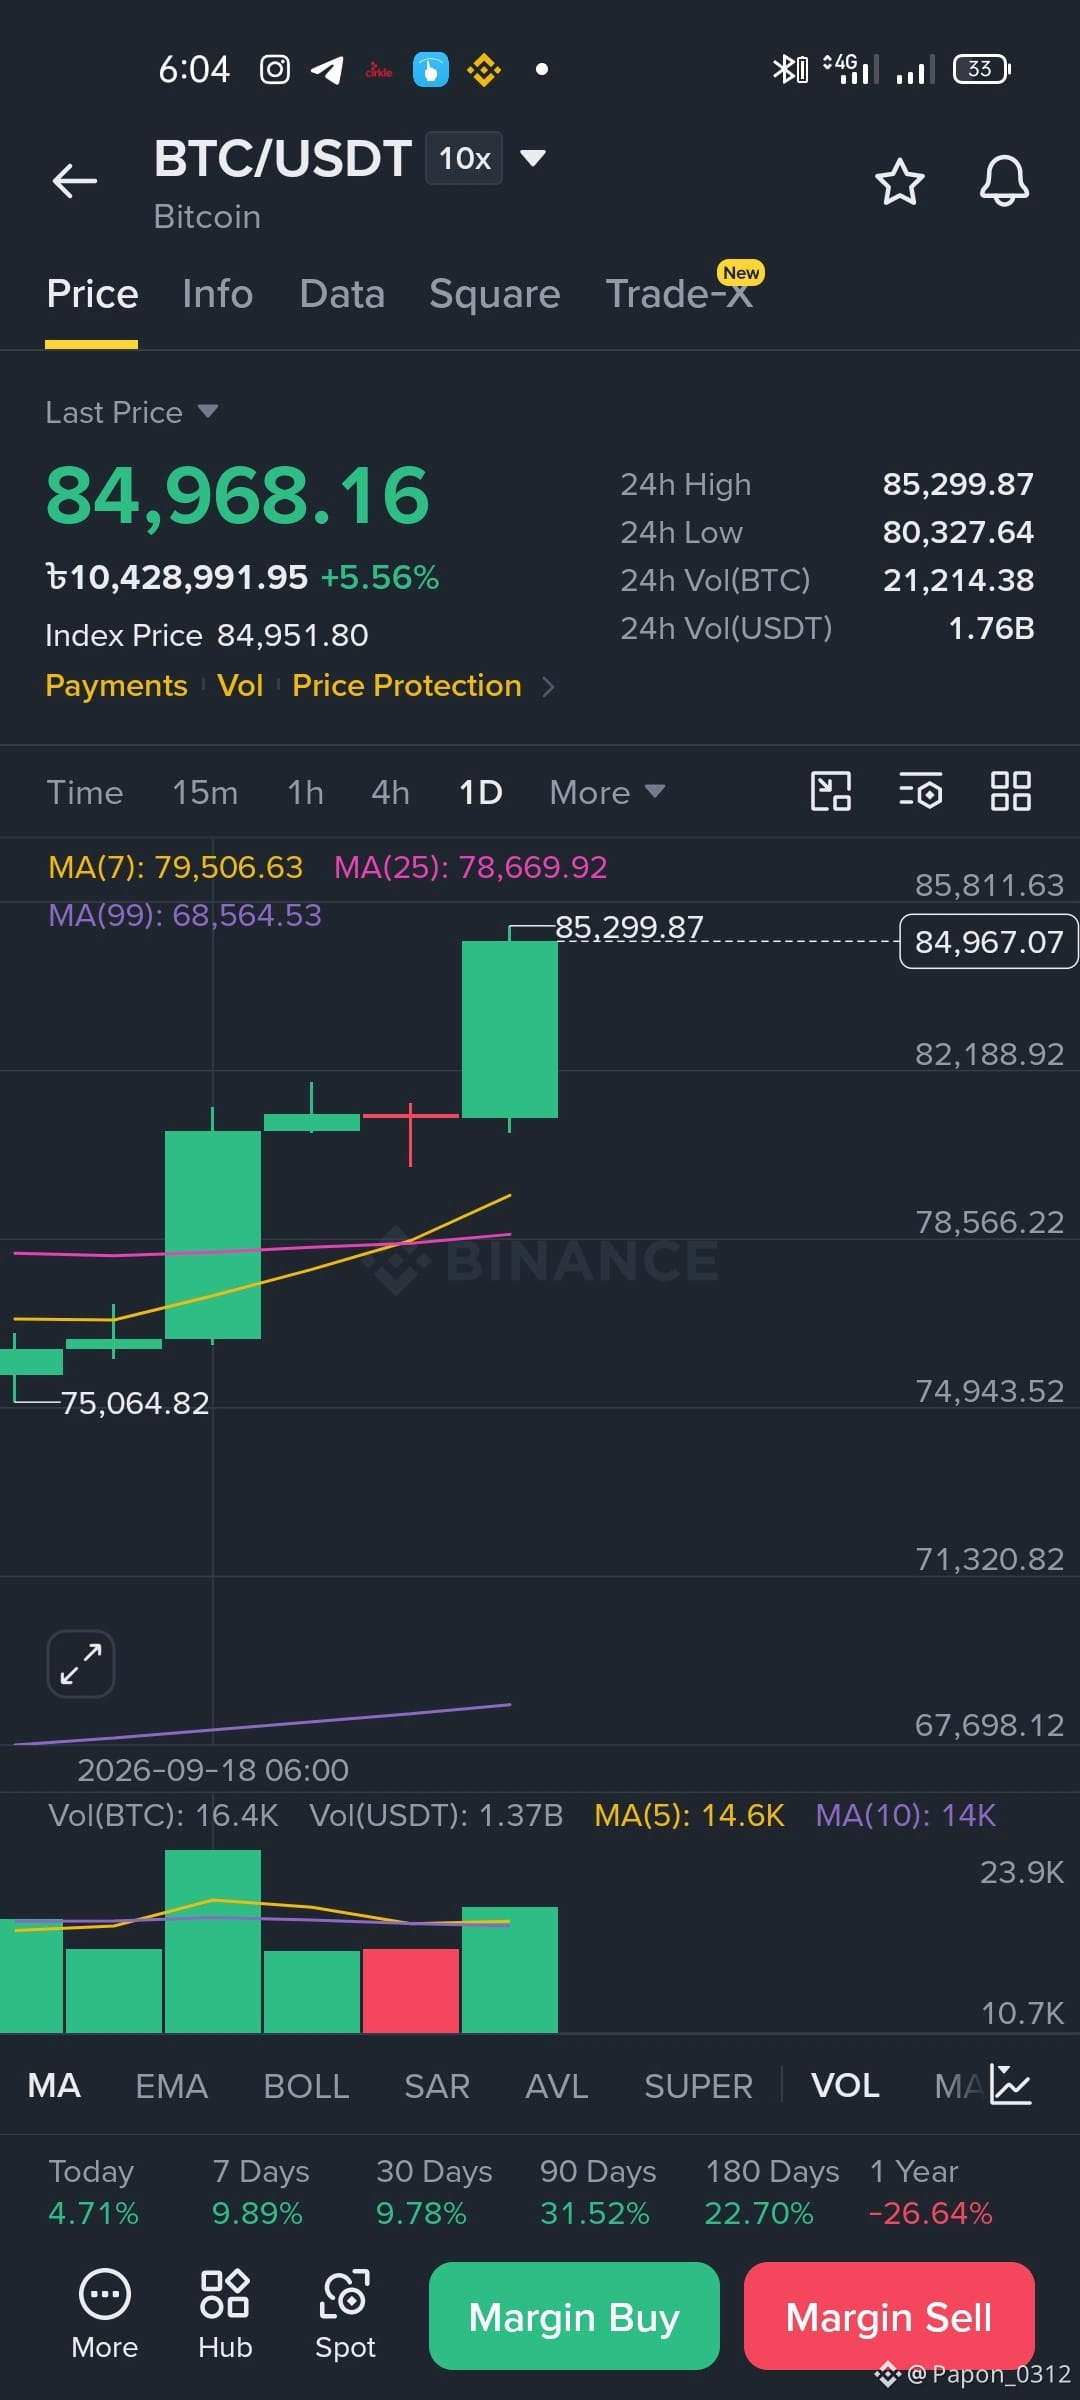
$BTC is showing strong bullish momentum today! 🚀📈
Current market setup is looking healthy. Continuous patience and solid strategy always pay off in crypto.
Are you currently holding $BTC or waiting for the next dip? Share your strategy below! 👇
#BinanceSquare #cryptocomunity #Bitcoin #BTC #Trading #Bullish
$BTC is showing strong bullish momentum today! 🚀📈
Current market setup is looking healthy. Continuous patience and solid strategy always pay off in crypto.
Are you currently holding $BTC or waiting for the next dip? Share your strategy below! 👇
#BinanceSquare #cryptocomunity #Bitcoin #BTC #Trading #Bullish
Current market setup is looking healthy. Continuous patience and solid strategy always pay off in crypto.
Are you currently holding $BTC or waiting for the next dip? Share your strategy below! 👇
#BinanceSquare #cryptocomunity #Bitcoin #BTC #Trading #Bullish
95
·
--
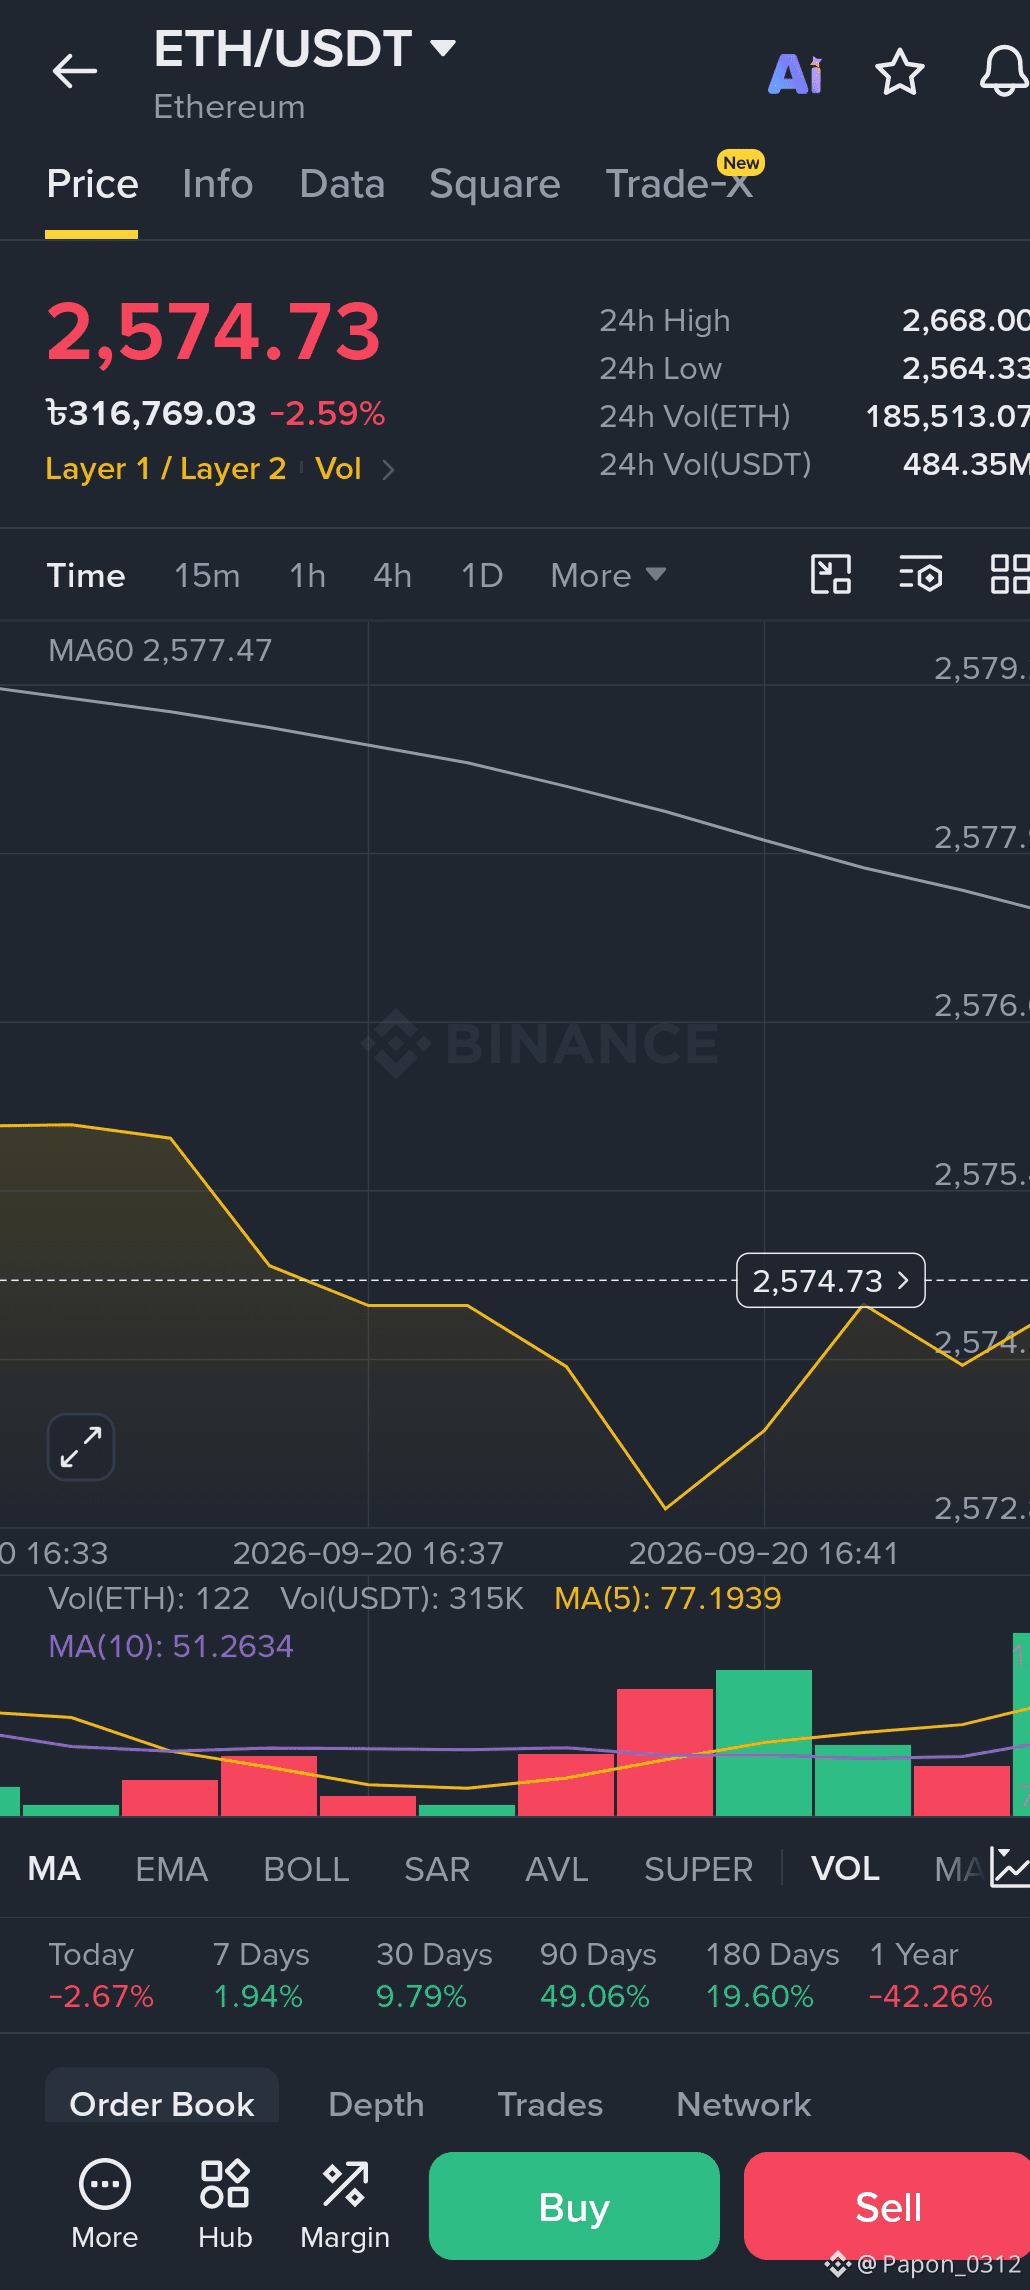
📌 ETH/USDT Market Update & Chart Analysis 📉📈
Hello everyone! Here is a brief look at the current ETH/USDT market chart[span_0](start_span)[span_0](end_span):
🔹 Current Market Situation:
Ethereum (ETH) is currently trading around $2,574.73, showing a drop of about -2.59% over the last 24 hours[span_1](start_span)[span_1](end_span). The 24-hour low was $2,564.33 and the high reached $2,668.00[span_2](start_span)[span_2](end_span).
🔹 Key Key Takeaways from the Chart:
1. Short-Term Downtrend: The price line indicates recent downward pressure[span_3](start_span)[span_3](end_span).
2. Moving Average (MA60): The upper line ($2,577.47) reflects current resistance levels[span_4](start_span)[span_4](end_span).
3. Trading Volume (VOL): The volume bars at the bottom show active competition between buyers and sellers[span_5](start_span)[span_5](end_span).
💡 Trading Tip:
In a dipping or sideways market, patience is key. Wait for clear support levels and always apply proper risk management with a stop-loss.
What do you think? Will ETH rebound from here or test lower supports? Share your thoughts below! 👇
#ETH #Crypto #BinanceSquare #TradingTips #Ethereum
📌 ETH/USDT Market Update & Chart Analysis 📉📈
Hello everyone! Here is a brief look at the current ETH/USDT market chart[span_0](start_span)[span_0](end_span):
🔹 Current Market Situation:
Ethereum (ETH) is currently trading around $2,574.73, showing a drop of about -2.59% over the last 24 hours[span_1](start_span)[span_1](end_span). The 24-hour low was $2,564.33 and the high reached $2,668.00[span_2](start_span)[span_2](end_span).
🔹 Key Key Takeaways from the Chart:
1. Short-Term Downtrend: The price line indicates recent downward pressure[span_3](start_span)[span_3](end_span).
2. Moving Average (MA60): The upper line ($2,577.47) reflects current resistance levels[span_4](start_span)[span_4](end_span).
3. Trading Volume (VOL): The volume bars at the bottom show active competition between buyers and sellers[span_5](start_span)[span_5](end_span).
💡 Trading Tip:
In a dipping or sideways market, patience is key. Wait for clear support levels and always apply proper risk management with a stop-loss.
What do you think? Will ETH rebound from here or test lower supports? Share your thoughts below! 👇
#ETH #Crypto #BinanceSquare #TradingTips #Ethereum
Hello everyone! Here is a brief look at the current ETH/USDT market chart[span_0](start_span)[span_0](end_span):
🔹 Current Market Situation:
Ethereum (ETH) is currently trading around $2,574.73, showing a drop of about -2.59% over the last 24 hours[span_1](start_span)[span_1](end_span). The 24-hour low was $2,564.33 and the high reached $2,668.00[span_2](start_span)[span_2](end_span).
🔹 Key Key Takeaways from the Chart:
1. Short-Term Downtrend: The price line indicates recent downward pressure[span_3](start_span)[span_3](end_span).
2. Moving Average (MA60): The upper line ($2,577.47) reflects current resistance levels[span_4](start_span)[span_4](end_span).
3. Trading Volume (VOL): The volume bars at the bottom show active competition between buyers and sellers[span_5](start_span)[span_5](end_span).
💡 Trading Tip:
In a dipping or sideways market, patience is key. Wait for clear support levels and always apply proper risk management with a stop-loss.
What do you think? Will ETH rebound from here or test lower supports? Share your thoughts below! 👇
#ETH #Crypto #BinanceSquare #TradingTips #Ethereum
76
·
--
Protect Your Capital Before Chasing Profits 🧠💰
Most people enter crypto asking, "How much will I make tomorrow?"
The reality? The market doesn't just test your luck—it tests your patience and discipline.
Here are 3 rules I stand by:
1️⃣ Control Greed: Taking small, consistent profits beats waiting for unrealistic 100x gains.
2️⃣ Use Stop-Loss: A stop-loss isn't a loss; it's the armor that keeps you in the game.
3️⃣ Stop Fear Selling: Panic selling during market dips turns temporary losses into permanent ones.
💡 Remember: Opportunities come every day, but only if you still have capital left to trade.
What is your #1 golden rule in trading? Drop your thoughts below! 👇
#Binance #CryptoMindset #TradingTips" #BTC
Protect Your Capital Before Chasing Profits 🧠💰
Most people enter crypto asking, "How much will I make tomorrow?"
The reality? The market doesn't just test your luck—it tests your patience and discipline.
Here are 3 rules I stand by:
1️⃣ Control Greed: Taking small, consistent profits beats waiting for unrealistic 100x gains.
2️⃣ Use Stop-Loss: A stop-loss isn't a loss; it's the armor that keeps you in the game.
3️⃣ Stop Fear Selling: Panic selling during market dips turns temporary losses into permanent ones.
💡 Remember: Opportunities come every day, but only if you still have capital left to trade.
What is your #1 golden rule in trading? Drop your thoughts below! 👇
#Binance #CryptoMindset #TradingTips" #BTC
Most people enter crypto asking, "How much will I make tomorrow?"
The reality? The market doesn't just test your luck—it tests your patience and discipline.
Here are 3 rules I stand by:
1️⃣ Control Greed: Taking small, consistent profits beats waiting for unrealistic 100x gains.
2️⃣ Use Stop-Loss: A stop-loss isn't a loss; it's the armor that keeps you in the game.
3️⃣ Stop Fear Selling: Panic selling during market dips turns temporary losses into permanent ones.
💡 Remember: Opportunities come every day, but only if you still have capital left to trade.
What is your #1 golden rule in trading? Drop your thoughts below! 👇
#Binance #CryptoMindset #TradingTips" #BTC
138
·
--
:
🚀 Bitcoin ($BTC) Market Update & Quick Thoughts!
Bitcoin is showing strong momentum right now. As we keep a close eye on the market, key support and resistance levels will decide the next big move.
What is your strategy for $BTC today? Are you holding for the long run or trading the short swings? Let’s discuss in the comments! 👇
#Crypto #Bitcoin❗ #BinanceSquare #TradeSmart #BTCUSDT
:
🚀 Bitcoin ($BTC) Market Update & Quick Thoughts!
Bitcoin is showing strong momentum right now. As we keep a close eye on the market, key support and resistance levels will decide the next big move.
What is your strategy for $BTC today? Are you holding for the long run or trading the short swings? Let’s discuss in the comments! 👇
#Crypto #Bitcoin❗ #BinanceSquare #TradeSmart #BTCUSDT
🚀 Bitcoin ($BTC) Market Update & Quick Thoughts!
Bitcoin is showing strong momentum right now. As we keep a close eye on the market, key support and resistance levels will decide the next big move.
What is your strategy for $BTC today? Are you holding for the long run or trading the short swings? Let’s discuss in the comments! 👇
#Crypto #Bitcoin❗ #BinanceSquare #TradeSmart #BTCUSDT
84
·
--
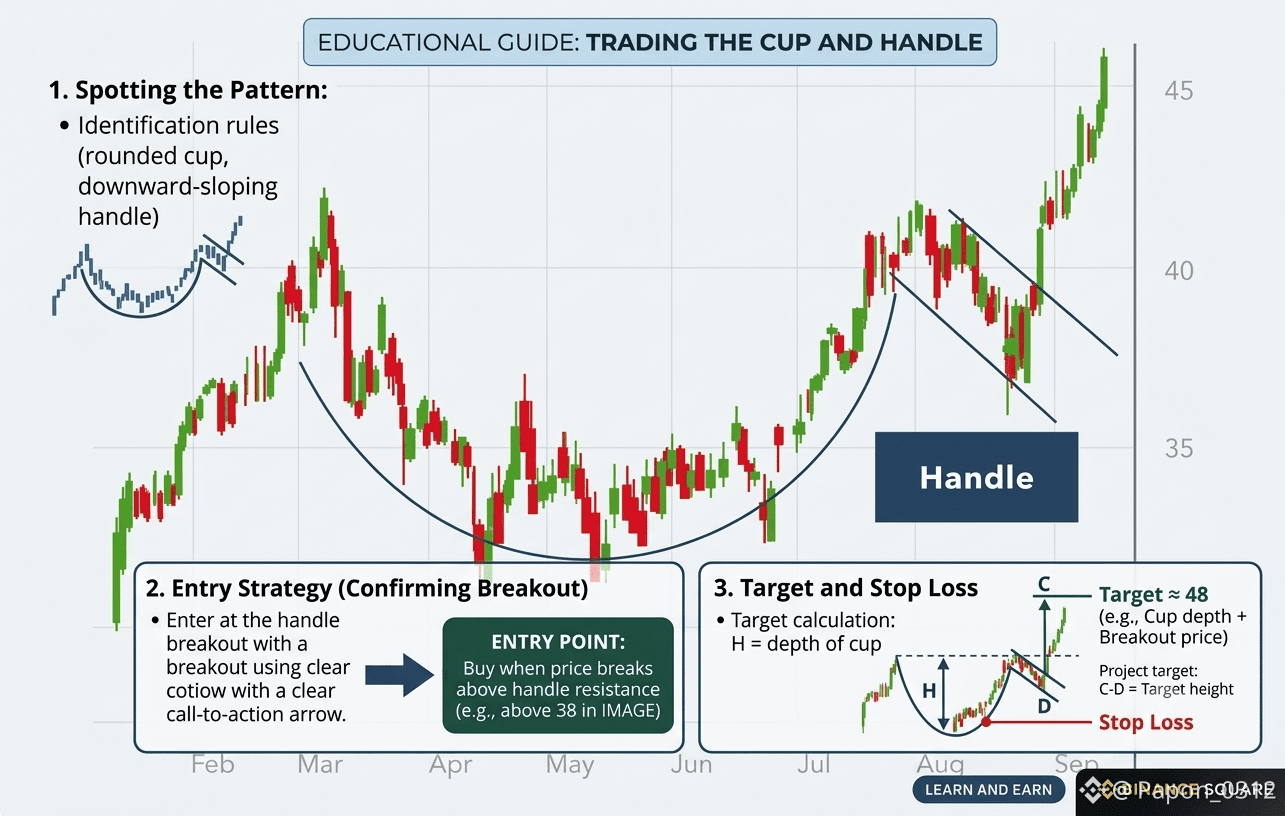
📊 Understanding Chart Patterns: The Cup and Handle ☕📈
The "Cup and Handle" is one of the most reliable bullish continuation patterns in crypto trading!
Key Takeaways:
1️⃣ The Cup: A 'U' shaped price consolidation.
2️⃣ The Handle: A brief downward drift/pullback following the cup.
3️⃣ The Breakout: A strong move upward past the resistance line!
Always wait for a confirmed breakout before taking entry. Stay disciplined and trade with proper risk management! 🛡️
What chart pattern do you use the most? Let me know in the comments! 👇
#CryptoTrading #TechnicalAnalysis #ChartPatterns #BinanceSquare #Write2Earn
📊 Understanding Chart Patterns: The Cup and Handle ☕📈
The "Cup and Handle" is one of the most reliable bullish continuation patterns in crypto trading!
Key Takeaways:
1️⃣ The Cup: A 'U' shaped price consolidation.
2️⃣ The Handle: A brief downward drift/pullback following the cup.
3️⃣ The Breakout: A strong move upward past the resistance line!
Always wait for a confirmed breakout before taking entry. Stay disciplined and trade with proper risk management! 🛡️
What chart pattern do you use the most? Let me know in the comments! 👇
#CryptoTrading #TechnicalAnalysis #ChartPatterns #BinanceSquare #Write2Earn
The "Cup and Handle" is one of the most reliable bullish continuation patterns in crypto trading!
Key Takeaways:
1️⃣ The Cup: A 'U' shaped price consolidation.
2️⃣ The Handle: A brief downward drift/pullback following the cup.
3️⃣ The Breakout: A strong move upward past the resistance line!
Always wait for a confirmed breakout before taking entry. Stay disciplined and trade with proper risk management! 🛡️
What chart pattern do you use the most? Let me know in the comments! 👇
#CryptoTrading #TechnicalAnalysis #ChartPatterns #BinanceSquare #Write2Earn
105
Войдите, чтобы посмотреть больше материала
Присоединяйтесь к пользователям криптовалют по всему миру на Binance Square
⚡️ Получайте новейшую и полезную информацию о криптоактивах.
💬 Нам доверяет крупнейшая в мире криптобиржа.
👍 Получите достоверные аналитические данные от верифицированных создателей контента.
Эл. почта/номер телефона
В тренде
NvidiaEarningsTonight:AIStocks’NextMove?
Просмотров: 83,567
1,058 обсуждают
Nvidia Earnings Day: Interim CEO's First Appearance — Can the AI Story Hold?
Binance News
·Лайков: 17
·Просмотров: 7.9k
A Packed Week of Earnings and Data Tests Markets
Просмотров: 127,502
626 обсуждают
AnthropicIPOTestsInvestorAppetiteForAI
Просмотров: 284,391
2,715 обсуждают