
X_ PROFESSOR
2 Публикации

X_ PROFESSOR
Отправить жалобу
Заблокировать пользователя
0 подписок(и/а)
1 подписчиков(а)
1 понравилось
Посты
·
--
$XRP
{spot}(XRPUSDT)
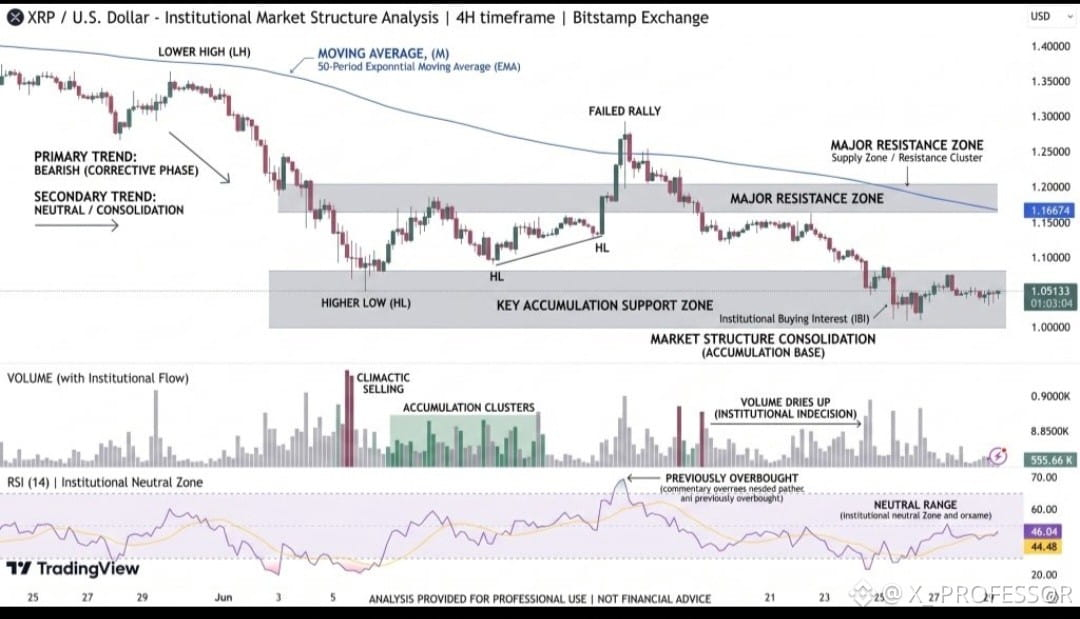
lost about 16% in October and was still trading below its four main moving averages in early November. The bounce attempts keep stalling under resistance. (coinedition)
Levels to watch
Support: $1.05 to $1.10, with the next band at $0.90 to $0.95 if $1.05 closes broken on the daily chart. (coincentral)
Resistance: $1.20 first, then $1.25 to $1.30, then $1.35. (coincentral)
Flows are mixed. Whale wallets bought about 65 million XRP over four days, but US spot XRP ETFs saw roughly $10.4 million in net outflows on November 9. (coincentral)
Scenarios
Bullish: a hold above $1.05 plus a daily close over $1.20 opens a move toward $1.25 to $1.30.
Bearish: a daily close under $1.05 puts $0.90 to $0.95 in play.
The sources conflict on exact levels and dates, so check a live chart such as TradingView before acting. This is not financial advice.#WhatWillDriveCryptoandStocks’NextRebound? #USPPIMissMayEaseBTCPressure #TradFiForBeginners #BitcoinCoreDisclosesTorTrafficVulnerability
$XRP
lost about 16% in October and was still trading below its four main moving averages in early November. The bounce attempts keep stalling under resistance. (coinedition)
Levels to watch
Support: $1.05 to $1.10, with the next band at $0.90 to $0.95 if $1.05 closes broken on the daily chart. (coincentral)
Resistance: $1.20 first, then $1.25 to $1.30, then $1.35. (coincentral)
Flows are mixed. Whale wallets bought about 65 million XRP over four days, but US spot XRP ETFs saw roughly $10.4 million in net outflows on November 9. (coincentral)
Scenarios
Bullish: a hold above $1.05 plus a daily close over $1.20 opens a move toward $1.25 to $1.30.
Bearish: a daily close under $1.05 puts $0.90 to $0.95 in play.
The sources conflict on exact levels and dates, so check a live chart such as TradingView before acting. This is not financial advice.#WhatWillDriveCryptoandStocks’NextRebound? #USPPIMissMayEaseBTCPressure #TradFiForBeginners #BitcoinCoreDisclosesTorTrafficVulnerability
lost about 16% in October and was still trading below its four main moving averages in early November. The bounce attempts keep stalling under resistance. (coinedition)
Levels to watch
Support: $1.05 to $1.10, with the next band at $0.90 to $0.95 if $1.05 closes broken on the daily chart. (coincentral)
Resistance: $1.20 first, then $1.25 to $1.30, then $1.35. (coincentral)
Flows are mixed. Whale wallets bought about 65 million XRP over four days, but US spot XRP ETFs saw roughly $10.4 million in net outflows on November 9. (coincentral)
Scenarios
Bullish: a hold above $1.05 plus a daily close over $1.20 opens a move toward $1.25 to $1.30.
Bearish: a daily close under $1.05 puts $0.90 to $0.95 in play.
The sources conflict on exact levels and dates, so check a live chart such as TradingView before acting. This is not financial advice.#WhatWillDriveCryptoandStocks’NextRebound? #USPPIMissMayEaseBTCPressure #TradFiForBeginners #BitcoinCoreDisclosesTorTrafficVulnerability
1
299
·
--
Bitcoin ($BTC
{spot}(BTCUSDT)
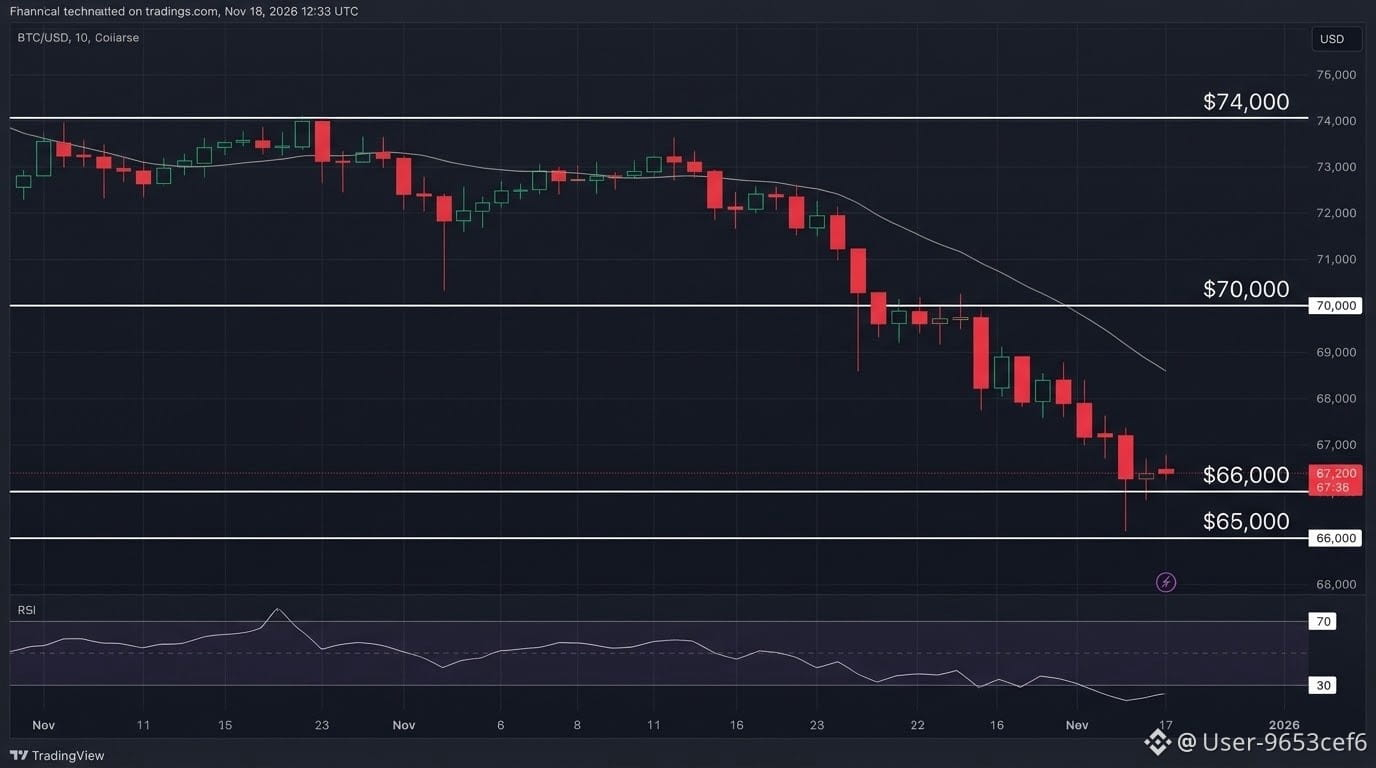
#WhatWillDriveCryptoandStocks’NextRebound? #USPPIMissMayEaseBTCPressure #TradFiForBeginners ) is experiencing a sharp corrective selloff, trading near $67,200 (approx. PKR 18.59 million) as of November 14, 2026. After failing to hold the psychological $70,000 threshold earlier this week, BTC has dropped over 10% since the start of November and is down roughly 23.8% year-to-date.
Technical Overview
Trend Structure: Short-term and daily market structures are decisively bearish. BTC broke down from a short-term bull flag and slipped below its 200-day simple moving average (around $73,200) and the $70,000 psychological support level.
Momentum (RSI): The daily Relative Strength Index (RSI) has dipped below 30, signaling strong downward momentum alongside oversold conditions that could trigger a short-term relief bounce.
Key Macro & Market Drivers
Hawkish Federal Reserve Expectations: Hotter-than-expected U.S. CPI inflation readings have revived expectations that the Fed may raise rates further or hold them higher for longer, pressuring zero-yielding assets like Bitcoin.
Institutional Outflows & Liquidations: U.S. spot Bitcoin ETFs recorded approximately $1.28 billion in weekly net outflows, accompanied by over $1 billion in leveraged long liquidations.
Regulatory & Equity Headwinds: Gridlock risks surrounding the U.S. CLARITY Act following the midterm elections and broader volatility in tech/AI equities have dampened institutional risk appetite.
Scenarios to Watch
Bearish Continuation: If buyers fail to defend the $66,000 floor on a daily close, selling pressure will likely test $65,000 and potentially expose the $60,000 demand zone.
Relief Bounce / Stabilization: Given oversold RSI readings, a short-covering bounce is possible. Bulls must reclaim $70,000 to halt immediate downside momentum, though a broader trend reversal requires br#eaking back above $74,00
Bitcoin ($BTC
#WhatWillDriveCryptoandStocks’NextRebound? #USPPIMissMayEaseBTCPressure #TradFiForBeginners ) is experiencing a sharp corrective selloff, trading near $67,200 (approx. PKR 18.59 million) as of November 14, 2026. After failing to hold the psychological $70,000 threshold earlier this week, BTC has dropped over 10% since the start of November and is down roughly 23.8% year-to-date.
Technical Overview
Trend Structure: Short-term and daily market structures are decisively bearish. BTC broke down from a short-term bull flag and slipped below its 200-day simple moving average (around $73,200) and the $70,000 psychological support level.
Momentum (RSI): The daily Relative Strength Index (RSI) has dipped below 30, signaling strong downward momentum alongside oversold conditions that could trigger a short-term relief bounce.
Key Macro & Market Drivers
Hawkish Federal Reserve Expectations: Hotter-than-expected U.S. CPI inflation readings have revived expectations that the Fed may raise rates further or hold them higher for longer, pressuring zero-yielding assets like Bitcoin.
Institutional Outflows & Liquidations: U.S. spot Bitcoin ETFs recorded approximately $1.28 billion in weekly net outflows, accompanied by over $1 billion in leveraged long liquidations.
Regulatory & Equity Headwinds: Gridlock risks surrounding the U.S. CLARITY Act following the midterm elections and broader volatility in tech/AI equities have dampened institutional risk appetite.
Scenarios to Watch
Bearish Continuation: If buyers fail to defend the $66,000 floor on a daily close, selling pressure will likely test $65,000 and potentially expose the $60,000 demand zone.
Relief Bounce / Stabilization: Given oversold RSI readings, a short-covering bounce is possible. Bulls must reclaim $70,000 to halt immediate downside momentum, though a broader trend reversal requires br#eaking back above $74,00
#WhatWillDriveCryptoandStocks’NextRebound? #USPPIMissMayEaseBTCPressure #TradFiForBeginners ) is experiencing a sharp corrective selloff, trading near $67,200 (approx. PKR 18.59 million) as of November 14, 2026. After failing to hold the psychological $70,000 threshold earlier this week, BTC has dropped over 10% since the start of November and is down roughly 23.8% year-to-date.
Technical Overview
Trend Structure: Short-term and daily market structures are decisively bearish. BTC broke down from a short-term bull flag and slipped below its 200-day simple moving average (around $73,200) and the $70,000 psychological support level.
Momentum (RSI): The daily Relative Strength Index (RSI) has dipped below 30, signaling strong downward momentum alongside oversold conditions that could trigger a short-term relief bounce.
Key Macro & Market Drivers
Hawkish Federal Reserve Expectations: Hotter-than-expected U.S. CPI inflation readings have revived expectations that the Fed may raise rates further or hold them higher for longer, pressuring zero-yielding assets like Bitcoin.
Institutional Outflows & Liquidations: U.S. spot Bitcoin ETFs recorded approximately $1.28 billion in weekly net outflows, accompanied by over $1 billion in leveraged long liquidations.
Regulatory & Equity Headwinds: Gridlock risks surrounding the U.S. CLARITY Act following the midterm elections and broader volatility in tech/AI equities have dampened institutional risk appetite.
Scenarios to Watch
Bearish Continuation: If buyers fail to defend the $66,000 floor on a daily close, selling pressure will likely test $65,000 and potentially expose the $60,000 demand zone.
Relief Bounce / Stabilization: Given oversold RSI readings, a short-covering bounce is possible. Bulls must reclaim $70,000 to halt immediate downside momentum, though a broader trend reversal requires br#eaking back above $74,00
136
Войдите, чтобы посмотреть больше материала
Присоединяйтесь к пользователям криптовалют по всему миру на Binance Square
⚡️ Получайте новейшую и полезную информацию о криптоактивах.
💬 Нам доверяет крупнейшая в мире криптобиржа.
👍 Получите достоверные аналитические данные от верифицированных создателей контента.
Эл. почта/номер телефона
В тренде
A Packed Week of Earnings and Data Tests Markets
Просмотров: 19,513
173 обсуждают
🚨🇺🇸 BIG WEEK AHEAD FOR THE MARKETS!
Markets are pricing in a Fed rate hike in December and $BTC could see some big moves next week.
Here's what's coming:
• Monday: Fed Chair Warsh speaks
• Tuesday: US Retail Sales + $NVDA earnings
• Wednesday: FOMC Minutes
• Thursday: Jobless Claims + Philly Fed Index
• Friday: Consumer Sentiment + Fed speeches
All eyes on $BTC as another important week begins.
#bitcoin
Mookie
·Лайков: 7
·Просмотров: 3.9k
AnthropicIPOTestsInvestorAppetiteForAI
Просмотров: 16,018
371 обсуждают
HuangReportedlyConsidersReturnToNvidia
Просмотров: 38,111
537 обсуждают