
CM_SUNNY
7.2k Публикации

CM_SUNNY
Отправить жалобу
Заблокировать пользователя
“Discipline builds destiny | Becoming better every day as a trader and as a person | Patience, mindset & consistency are my strengths | X: @sunnyncba45
Открытая сделка
Трейдер с регулярными сделками
11.4 мес.
1.0K+ подписок(и/а)
18.9K+ подписчиков(а)
9.4K+ понравилось
Посты
Портфель
Все
Цитирования
Видео
Активно
·
--
$BTW — Range Breakout Watch
Market Overview:
Bitway is around $0.435, with a 24h range of approximately $0.3824–$0.4528 and a 7-day range of $0.3751–$0.4843. Current 24h volume is above $21M, while the recent historical structure shows repeated trading around the $0.40 area.
coingecko.com +2
Key Support:
S1: $0.410
S2: $0.382
Major: $0.375
Key Resistance:
R1: $0.453
R2: $0.484
R3: $0.550
Next Move:
BTW needs to clear $0.453 first. A confirmed breakout could send price toward $0.484 and then $0.55. A rejection followed by a loss of $0.410 would shift attention back toward $0.382.
Trade Targets:
TG1: $0.453
TG2: $0.484
TG3: $0.550
Short-Term: Bullish above $0.410.
Mid-Term: A sustained break of $0.484 would signal a stronger recovery toward the $0.55 region.
Pro Tip: The cleanest setup is a breakout above $0.453 followed by a retest that holds rather than buying directly into resistance.
$BTW — Range Breakout Watch
Market Overview:
Bitway is around $0.435, with a 24h range of approximately $0.3824–$0.4528 and a 7-day range of $0.3751–$0.4843. Current 24h volume is above $21M, while the recent historical structure shows repeated trading around the $0.40 area.
coingecko.com +2
Key Support:
S1: $0.410
S2: $0.382
Major: $0.375
Key Resistance:
R1: $0.453
R2: $0.484
R3: $0.550
Next Move:
BTW needs to clear $0.453 first. A confirmed breakout could send price toward $0.484 and then $0.55. A rejection followed by a loss of $0.410 would shift attention back toward $0.382.
Trade Targets:
TG1: $0.453
TG2: $0.484
TG3: $0.550
Short-Term: Bullish above $0.410.
Mid-Term: A sustained break of $0.484 would signal a stronger recovery toward the $0.55 region.
Pro Tip: The cleanest setup is a breakout above $0.453 followed by a retest that holds rather than buying directly into resistance.
Market Overview:
Bitway is around $0.435, with a 24h range of approximately $0.3824–$0.4528 and a 7-day range of $0.3751–$0.4843. Current 24h volume is above $21M, while the recent historical structure shows repeated trading around the $0.40 area.
coingecko.com +2
Key Support:
S1: $0.410
S2: $0.382
Major: $0.375
Key Resistance:
R1: $0.453
R2: $0.484
R3: $0.550
Next Move:
BTW needs to clear $0.453 first. A confirmed breakout could send price toward $0.484 and then $0.55. A rejection followed by a loss of $0.410 would shift attention back toward $0.382.
Trade Targets:
TG1: $0.453
TG2: $0.484
TG3: $0.550
Short-Term: Bullish above $0.410.
Mid-Term: A sustained break of $0.484 would signal a stronger recovery toward the $0.55 region.
Pro Tip: The cleanest setup is a breakout above $0.453 followed by a retest that holds rather than buying directly into resistance.
144
·
--
$CLO — Recovery Breakout
Market Overview:
Yei Finance is around $0.1404, up roughly 17.6% over 24h and more than 56% over 7 days, with approximately $7.7M daily volume. The current 24h range is roughly $0.1118–$0.1465.
coingecko.com
The chart is recovering aggressively, but $0.1465 is the immediate ceiling.
Key Support:
S1: $0.132
S2: $0.120
Major: $0.112
Key Resistance:
R1: $0.1465
R2: $0.160
R3: $0.180
Next Move:
A clean break above $0.1465 would confirm continuation and put $0.16 into focus. If price loses $0.132, expect a deeper retest toward $0.12.
Trade Targets:
TG1: $0.1465
TG2: $0.160
TG3: $0.180
Short-Term: Bullish while $0.132 holds.
Mid-Term: $0.16–$0.18 becomes the next major expansion zone if momentum persists.
Pro Tip: Watch volume during the $0.1465 breakout. Price breaking resistance without volume is less convincing.
$CLO — Recovery Breakout
Market Overview:
Yei Finance is around $0.1404, up roughly 17.6% over 24h and more than 56% over 7 days, with approximately $7.7M daily volume. The current 24h range is roughly $0.1118–$0.1465.
coingecko.com
The chart is recovering aggressively, but $0.1465 is the immediate ceiling.
Key Support:
S1: $0.132
S2: $0.120
Major: $0.112
Key Resistance:
R1: $0.1465
R2: $0.160
R3: $0.180
Next Move:
A clean break above $0.1465 would confirm continuation and put $0.16 into focus. If price loses $0.132, expect a deeper retest toward $0.12.
Trade Targets:
TG1: $0.1465
TG2: $0.160
TG3: $0.180
Short-Term: Bullish while $0.132 holds.
Mid-Term: $0.16–$0.18 becomes the next major expansion zone if momentum persists.
Pro Tip: Watch volume during the $0.1465 breakout. Price breaking resistance without volume is less convincing.
Market Overview:
Yei Finance is around $0.1404, up roughly 17.6% over 24h and more than 56% over 7 days, with approximately $7.7M daily volume. The current 24h range is roughly $0.1118–$0.1465.
coingecko.com
The chart is recovering aggressively, but $0.1465 is the immediate ceiling.
Key Support:
S1: $0.132
S2: $0.120
Major: $0.112
Key Resistance:
R1: $0.1465
R2: $0.160
R3: $0.180
Next Move:
A clean break above $0.1465 would confirm continuation and put $0.16 into focus. If price loses $0.132, expect a deeper retest toward $0.12.
Trade Targets:
TG1: $0.1465
TG2: $0.160
TG3: $0.180
Short-Term: Bullish while $0.132 holds.
Mid-Term: $0.16–$0.18 becomes the next major expansion zone if momentum persists.
Pro Tip: Watch volume during the $0.1465 breakout. Price breaking resistance without volume is less convincing.
113
·
--
$MARSCOIN — Explosive Momentum
Market Overview:
MarsCoin is currently around $0.075, with approximately $21M futures volume and $1M+ spot volume in the latest data. It recently printed an all-time high around $0.08725, while the 7-day range extends from roughly $0.03055 to $0.08725.
coinglass.com +1
This is a high-volatility momentum chart, so the key question is whether buyers can reclaim the recent high.
Key Support:
S1: $0.070
S2: $0.060
Major: $0.050
Key Resistance:
R1: $0.080
R2: $0.087–$0.090
R3: $0.100
Next Move:
A decisive break above $0.087–$0.090 could establish price discovery toward $0.10. Rejection from that zone would make $0.070 the first important test.
Trade Targets:
TG1: $0.080
TG2: $0.090
TG3: $0.100
Short-Term: Bullish above $0.070.
Mid-Term: Above $0.090, momentum could remain strong; below $0.060, the structure weakens materially.
Pro Tip: Futures activity is much larger than spot activity, so leverage-driven volatility can be significant.
coinglass.com
$MARSCOIN — Explosive Momentum
Market Overview:
MarsCoin is currently around $0.075, with approximately $21M futures volume and $1M+ spot volume in the latest data. It recently printed an all-time high around $0.08725, while the 7-day range extends from roughly $0.03055 to $0.08725.
coinglass.com +1
This is a high-volatility momentum chart, so the key question is whether buyers can reclaim the recent high.
Key Support:
S1: $0.070
S2: $0.060
Major: $0.050
Key Resistance:
R1: $0.080
R2: $0.087–$0.090
R3: $0.100
Next Move:
A decisive break above $0.087–$0.090 could establish price discovery toward $0.10. Rejection from that zone would make $0.070 the first important test.
Trade Targets:
TG1: $0.080
TG2: $0.090
TG3: $0.100
Short-Term: Bullish above $0.070.
Mid-Term: Above $0.090, momentum could remain strong; below $0.060, the structure weakens materially.
Pro Tip: Futures activity is much larger than spot activity, so leverage-driven volatility can be significant.
coinglass.com
Market Overview:
MarsCoin is currently around $0.075, with approximately $21M futures volume and $1M+ spot volume in the latest data. It recently printed an all-time high around $0.08725, while the 7-day range extends from roughly $0.03055 to $0.08725.
coinglass.com +1
This is a high-volatility momentum chart, so the key question is whether buyers can reclaim the recent high.
Key Support:
S1: $0.070
S2: $0.060
Major: $0.050
Key Resistance:
R1: $0.080
R2: $0.087–$0.090
R3: $0.100
Next Move:
A decisive break above $0.087–$0.090 could establish price discovery toward $0.10. Rejection from that zone would make $0.070 the first important test.
Trade Targets:
TG1: $0.080
TG2: $0.090
TG3: $0.100
Short-Term: Bullish above $0.070.
Mid-Term: Above $0.090, momentum could remain strong; below $0.060, the structure weakens materially.
Pro Tip: Futures activity is much larger than spot activity, so leverage-driven volatility can be significant.
coinglass.com
158
·
--
$UAI — High-Momentum Breakout
Market Overview:
UAI is trading around $0.55068 in your screenshot after a roughly 44% 24h move. That puts the coin in a momentum phase, but also means volatility and profit-taking risk are elevated.
Key Support:
S1: $0.520
S2: $0.480
Major: $0.430–$0.450
Key Resistance:
R1: $0.580
R2: $0.630
R3: $0.700
Next Move:
The $0.58 area is the first important breakout test. Holding above it can open the path toward $0.63 and potentially $0.70. Failure to reclaim $0.58 could send price back toward the $0.52–$0.48 support zone.
Trade Targets:
TG1: $0.580
TG2: $0.630
TG3: $0.700
Short-Term: Bullish above $0.52.
Mid-Term: The structure becomes considerably stronger if $0.63 converts into support.
Pro Tip: After a 40%+ daily move, confirmation is more important than entry speed.
$UAI — High-Momentum Breakout
Market Overview:
UAI is trading around $0.55068 in your screenshot after a roughly 44% 24h move. That puts the coin in a momentum phase, but also means volatility and profit-taking risk are elevated.
Key Support:
S1: $0.520
S2: $0.480
Major: $0.430–$0.450
Key Resistance:
R1: $0.580
R2: $0.630
R3: $0.700
Next Move:
The $0.58 area is the first important breakout test. Holding above it can open the path toward $0.63 and potentially $0.70. Failure to reclaim $0.58 could send price back toward the $0.52–$0.48 support zone.
Trade Targets:
TG1: $0.580
TG2: $0.630
TG3: $0.700
Short-Term: Bullish above $0.52.
Mid-Term: The structure becomes considerably stronger if $0.63 converts into support.
Pro Tip: After a 40%+ daily move, confirmation is more important than entry speed.
Market Overview:
UAI is trading around $0.55068 in your screenshot after a roughly 44% 24h move. That puts the coin in a momentum phase, but also means volatility and profit-taking risk are elevated.
Key Support:
S1: $0.520
S2: $0.480
Major: $0.430–$0.450
Key Resistance:
R1: $0.580
R2: $0.630
R3: $0.700
Next Move:
The $0.58 area is the first important breakout test. Holding above it can open the path toward $0.63 and potentially $0.70. Failure to reclaim $0.58 could send price back toward the $0.52–$0.48 support zone.
Trade Targets:
TG1: $0.580
TG2: $0.630
TG3: $0.700
Short-Term: Bullish above $0.52.
Mid-Term: The structure becomes considerably stronger if $0.63 converts into support.
Pro Tip: After a 40%+ daily move, confirmation is more important than entry speed.
121
·
--
$DOYR — Momentum Breakout Setup
Market Overview:
DOYR is showing the strongest momentum in the group. It is around $0.000461, up roughly 52% in 24h, with 24h volume above $1.3M. The key point is that volume has exploded compared with the previous sessions, confirming that the move has attracted fresh activity.
coingecko.com +1
Key Support:
S1: $0.000420
S2: $0.000380
Major: $0.000300–$0.000320
Key Resistance:
R1: $0.000513
R2: $0.000550
R3: $0.000620
Next Move:
The immediate battle is around $0.00050–$0.000513. A clean breakout with strong volume can extend the momentum, while rejection here could produce a sharp pullback toward $0.00042.
Trade Targets:
TG1: $0.000513
TG2: $0.000550
TG3: $0.000620
Short-Term: Bullish while $0.000420 holds.
Mid-Term: A sustained move above $0.000513 would significantly improve the structure.
Pro Tip: Don't chase a vertical candle. The cleaner setup is a breakout followed by a successful retest.
$DOYR — Momentum Breakout Setup
Market Overview:
DOYR is showing the strongest momentum in the group. It is around $0.000461, up roughly 52% in 24h, with 24h volume above $1.3M. The key point is that volume has exploded compared with the previous sessions, confirming that the move has attracted fresh activity.
coingecko.com +1
Key Support:
S1: $0.000420
S2: $0.000380
Major: $0.000300–$0.000320
Key Resistance:
R1: $0.000513
R2: $0.000550
R3: $0.000620
Next Move:
The immediate battle is around $0.00050–$0.000513. A clean breakout with strong volume can extend the momentum, while rejection here could produce a sharp pullback toward $0.00042.
Trade Targets:
TG1: $0.000513
TG2: $0.000550
TG3: $0.000620
Short-Term: Bullish while $0.000420 holds.
Mid-Term: A sustained move above $0.000513 would significantly improve the structure.
Pro Tip: Don't chase a vertical candle. The cleaner setup is a breakout followed by a successful retest.
Market Overview:
DOYR is showing the strongest momentum in the group. It is around $0.000461, up roughly 52% in 24h, with 24h volume above $1.3M. The key point is that volume has exploded compared with the previous sessions, confirming that the move has attracted fresh activity.
coingecko.com +1
Key Support:
S1: $0.000420
S2: $0.000380
Major: $0.000300–$0.000320
Key Resistance:
R1: $0.000513
R2: $0.000550
R3: $0.000620
Next Move:
The immediate battle is around $0.00050–$0.000513. A clean breakout with strong volume can extend the momentum, while rejection here could produce a sharp pullback toward $0.00042.
Trade Targets:
TG1: $0.000513
TG2: $0.000550
TG3: $0.000620
Short-Term: Bullish while $0.000420 holds.
Mid-Term: A sustained move above $0.000513 would significantly improve the structure.
Pro Tip: Don't chase a vertical candle. The cleaner setup is a breakout followed by a successful retest.
1
170
·
--
Рост
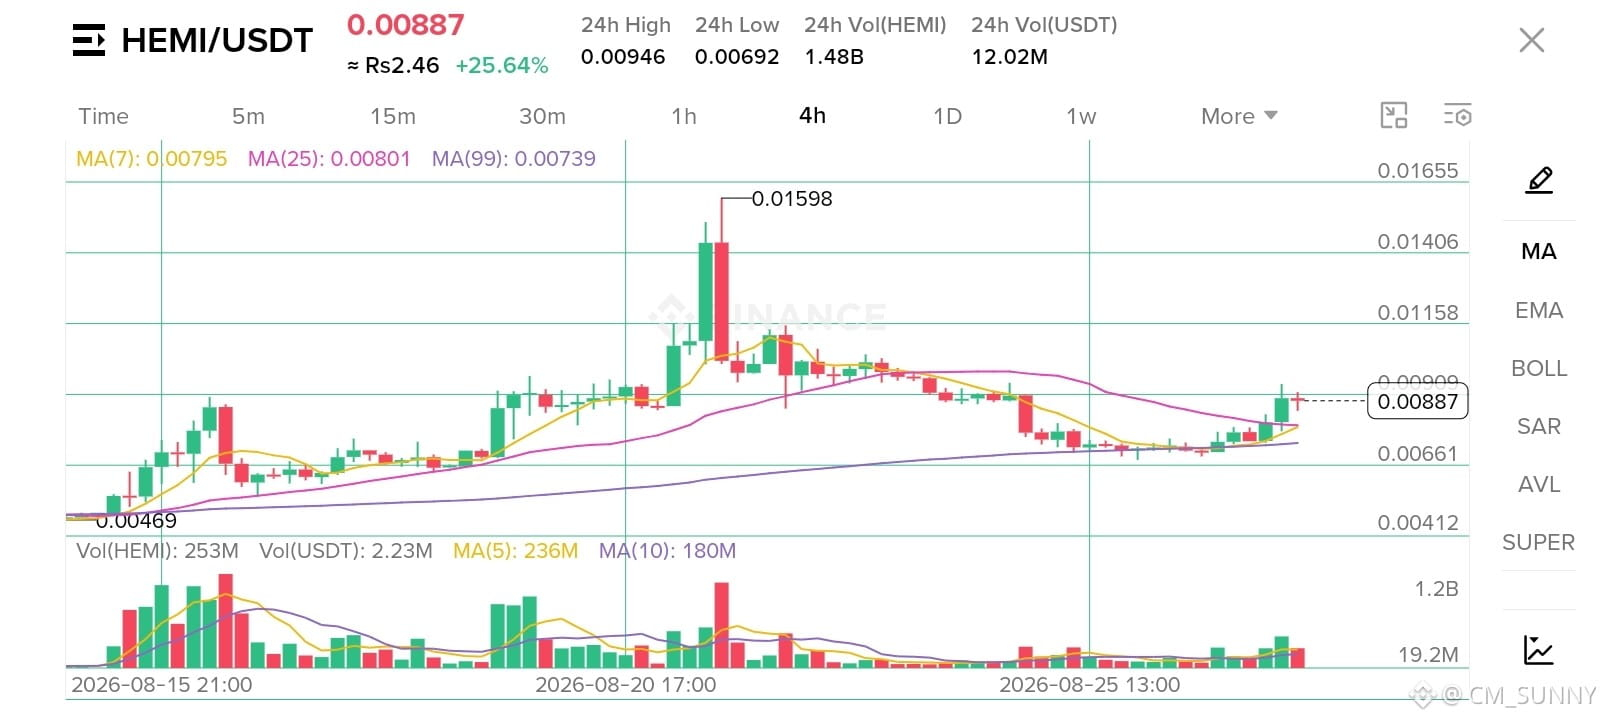
$HEMI is currently showing a cautiously bullish short-term structure, trading around $0.0079 after recovering from the $0.0069–$0.0072 area. Recent data shows improving altcoin momentum, with HEMI gaining alongside broader rotation into smaller-cap assets. Its RSI around 56 suggests momentum is positive but not yet overbought, leaving room for another move if buying volume remains strong.
The immediate support zone sits around $0.0071–$0.0072. If this level holds, buyers could attempt another push toward $0.0081, which is the first major resistance. Above that, $0.00845 and $0.0090–$0.0091 become the next upside barriers. A decisive breakout above $0.0091 with strong volume would strengthen the bullish setup and potentially open the path toward the $0.0100 psychological level.
On the downside, losing $0.0071 could expose $0.00655, followed by stronger structural support near $0.0062. The ideal trading opportunity is during a confirmed breakout with rising volume or a controlled pullback that successfully holds $0.0071–$0.0072. Avoid chasing sudden spikes; confirmation through a 4-hour or daily close is preferable.
$HEMI is currently showing a cautiously bullish short-term structure, trading around $0.0079 after recovering from the $0.0069–$0.0072 area. Recent data shows improving altcoin momentum, with HEMI gaining alongside broader rotation into smaller-cap assets. Its RSI around 56 suggests momentum is positive but not yet overbought, leaving room for another move if buying volume remains strong.
The immediate support zone sits around $0.0071–$0.0072. If this level holds, buyers could attempt another push toward $0.0081, which is the first major resistance. Above that, $0.00845 and $0.0090–$0.0091 become the next upside barriers. A decisive breakout above $0.0091 with strong volume would strengthen the bullish setup and potentially open the path toward the $0.0100 psychological level.
On the downside, losing $0.0071 could expose $0.00655, followed by stronger structural support near $0.0062. The ideal trading opportunity is during a confirmed breakout with rising volume or a controlled pullback that successfully holds $0.0071–$0.0072. Avoid chasing sudden spikes; confirmation through a 4-hour or daily close is preferable.
The immediate support zone sits around $0.0071–$0.0072. If this level holds, buyers could attempt another push toward $0.0081, which is the first major resistance. Above that, $0.00845 and $0.0090–$0.0091 become the next upside barriers. A decisive breakout above $0.0091 with strong volume would strengthen the bullish setup and potentially open the path toward the $0.0100 psychological level.
On the downside, losing $0.0071 could expose $0.00655, followed by stronger structural support near $0.0062. The ideal trading opportunity is during a confirmed breakout with rising volume or a controlled pullback that successfully holds $0.0071–$0.0072. Avoid chasing sudden spikes; confirmation through a 4-hour or daily close is preferable.
109
·
--
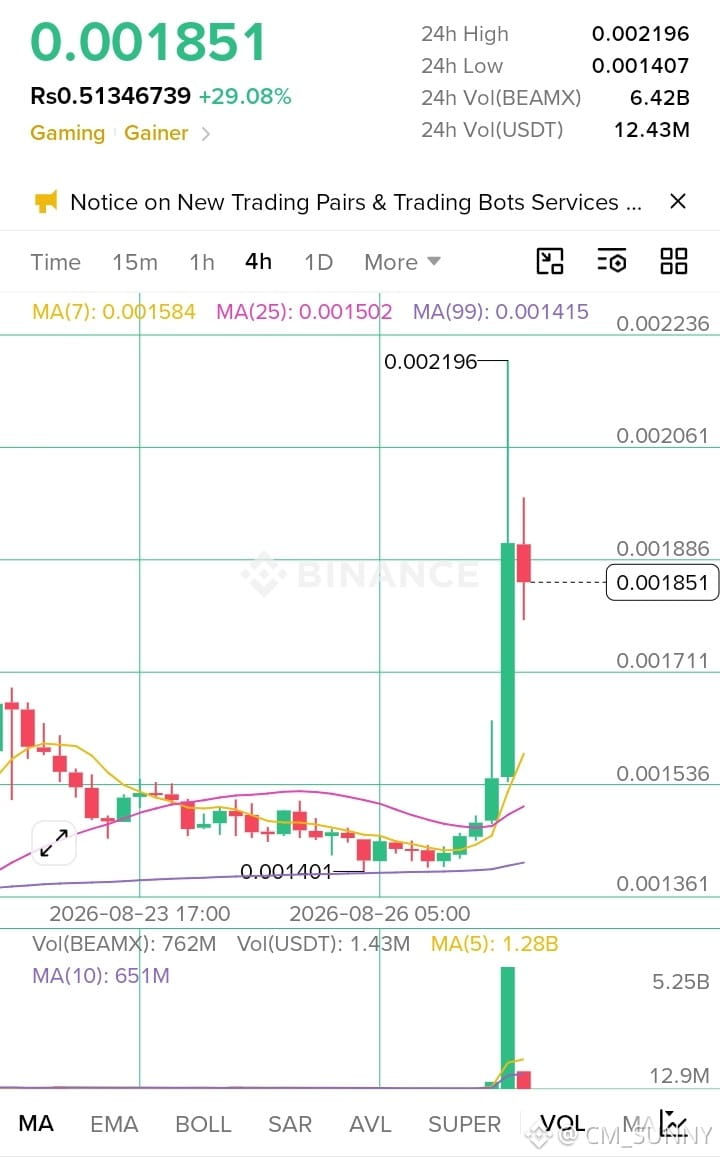
$BEAMX is showing a volatile recovery structure, with the token recently trading around $0.0016 after moving sharply higher from the $0.0012–$0.0013 area. Recent data shows strong short-term momentum, while the broader trend remains fragile: TradingView reports BEAMX still down substantially over the longer term, despite a recent weekly recovery.
The first major support zone is $0.00145–$0.00150, where recent trading has repeatedly found buyers. Below that, $0.00135–$0.00140 is an important secondary support, while $0.00120–$0.00125 represents a deeper structural floor based on June–August lows. Resistance is concentrated around $0.00160–$0.00170; a decisive breakout above $0.00170 could open the way toward $0.00190–$0.00210.
Technically, BEAMX is attempting to transition from consolidation into recovery, but confirmation requires sustained volume and a daily close above resistance. The better trading window is during periods of strong liquidity, preferably after a confirmed breakout or a controlled retest of support rather than chasing a sudden spike. Given the recent volatility and Binance margin-pair delisting news, risk management and tight invalidation levels are particularly important.
#Write2Earn
$BEAMX is showing a volatile recovery structure, with the token recently trading around $0.0016 after moving sharply higher from the $0.0012–$0.0013 area. Recent data shows strong short-term momentum, while the broader trend remains fragile: TradingView reports BEAMX still down substantially over the longer term, despite a recent weekly recovery.
The first major support zone is $0.00145–$0.00150, where recent trading has repeatedly found buyers. Below that, $0.00135–$0.00140 is an important secondary support, while $0.00120–$0.00125 represents a deeper structural floor based on June–August lows. Resistance is concentrated around $0.00160–$0.00170; a decisive breakout above $0.00170 could open the way toward $0.00190–$0.00210.
Technically, BEAMX is attempting to transition from consolidation into recovery, but confirmation requires sustained volume and a daily close above resistance. The better trading window is during periods of strong liquidity, preferably after a confirmed breakout or a controlled retest of support rather than chasing a sudden spike. Given the recent volatility and Binance margin-pair delisting news, risk management and tight invalidation levels are particularly important.
#Write2Earn
The first major support zone is $0.00145–$0.00150, where recent trading has repeatedly found buyers. Below that, $0.00135–$0.00140 is an important secondary support, while $0.00120–$0.00125 represents a deeper structural floor based on June–August lows. Resistance is concentrated around $0.00160–$0.00170; a decisive breakout above $0.00170 could open the way toward $0.00190–$0.00210.
Technically, BEAMX is attempting to transition from consolidation into recovery, but confirmation requires sustained volume and a daily close above resistance. The better trading window is during periods of strong liquidity, preferably after a confirmed breakout or a controlled retest of support rather than chasing a sudden spike. Given the recent volatility and Binance margin-pair delisting news, risk management and tight invalidation levels are particularly important.
#Write2Earn
186
·
--
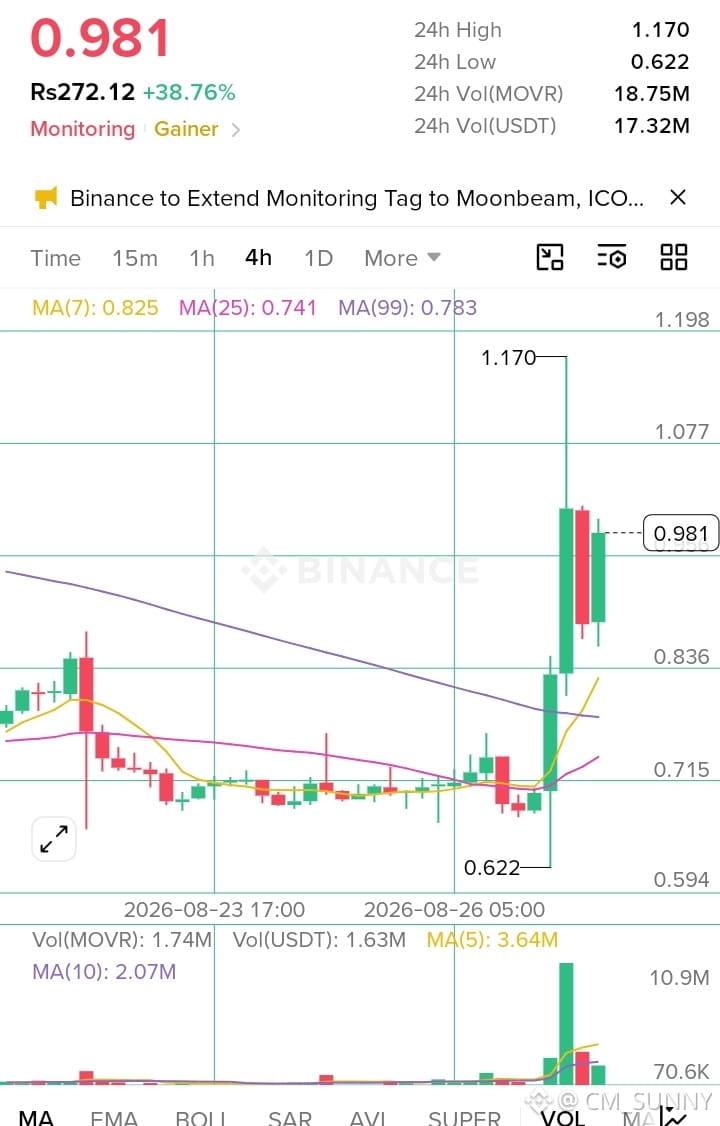
Movement ($MOVE ) is showing a high-volatility recovery structure, with price recently moving from the $0.0060–$0.0065 area toward $0.0100 before retracing. The key question now is whether buyers can defend the current support zone and rebuild momentum.
The first major support sits around $0.0080–$0.0081. Holding this area would keep the short-term bullish structure intact. Below that, $0.0074–$0.0076 is the next important support, while $0.0072 represents a critical structural level. A sustained break below $0.0072 could expose the deeper $0.0062–$0.0065 region.
On the upside, $0.0088–$0.0090 is the first resistance. A strong breakout above this zone could open a move toward $0.0093–$0.0095. The major resistance remains around $0.0098–$0.01015, where previous selling pressure appeared.
The ideal trading approach is to avoid entering in the middle of the range. A cleaner long setup would be a confirmed bounce from $0.0080 with increasing volume, or a breakout above $0.0090 followed by a successful retest.
Overall, MOVE remains cautiously bullish above $0.0080, but confirmation is needed. Watch volume closely: strong volume on a resistance breakout would strengthen the bullish case, while heavy selling below $0.0080 would shift momentum bearish.
#Write2Earn #DollarPostsBiggestGainInNearlyFourWeeks
Movement ($MOVE ) is showing a high-volatility recovery structure, with price recently moving from the $0.0060–$0.0065 area toward $0.0100 before retracing. The key question now is whether buyers can defend the current support zone and rebuild momentum.
The first major support sits around $0.0080–$0.0081. Holding this area would keep the short-term bullish structure intact. Below that, $0.0074–$0.0076 is the next important support, while $0.0072 represents a critical structural level. A sustained break below $0.0072 could expose the deeper $0.0062–$0.0065 region.
On the upside, $0.0088–$0.0090 is the first resistance. A strong breakout above this zone could open a move toward $0.0093–$0.0095. The major resistance remains around $0.0098–$0.01015, where previous selling pressure appeared.
The ideal trading approach is to avoid entering in the middle of the range. A cleaner long setup would be a confirmed bounce from $0.0080 with increasing volume, or a breakout above $0.0090 followed by a successful retest.
Overall, MOVE remains cautiously bullish above $0.0080, but confirmation is needed. Watch volume closely: strong volume on a resistance breakout would strengthen the bullish case, while heavy selling below $0.0080 would shift momentum bearish.
#Write2Earn #DollarPostsBiggestGainInNearlyFourWeeks
The first major support sits around $0.0080–$0.0081. Holding this area would keep the short-term bullish structure intact. Below that, $0.0074–$0.0076 is the next important support, while $0.0072 represents a critical structural level. A sustained break below $0.0072 could expose the deeper $0.0062–$0.0065 region.
On the upside, $0.0088–$0.0090 is the first resistance. A strong breakout above this zone could open a move toward $0.0093–$0.0095. The major resistance remains around $0.0098–$0.01015, where previous selling pressure appeared.
The ideal trading approach is to avoid entering in the middle of the range. A cleaner long setup would be a confirmed bounce from $0.0080 with increasing volume, or a breakout above $0.0090 followed by a successful retest.
Overall, MOVE remains cautiously bullish above $0.0080, but confirmation is needed. Watch volume closely: strong volume on a resistance breakout would strengthen the bullish case, while heavy selling below $0.0080 would shift momentum bearish.
#Write2Earn #DollarPostsBiggestGainInNearlyFourWeeks
224
·
--
The Death of the Glass House: Why I’m Bet-it-All Bullish on the Zero-Knowledge Financial Revolution
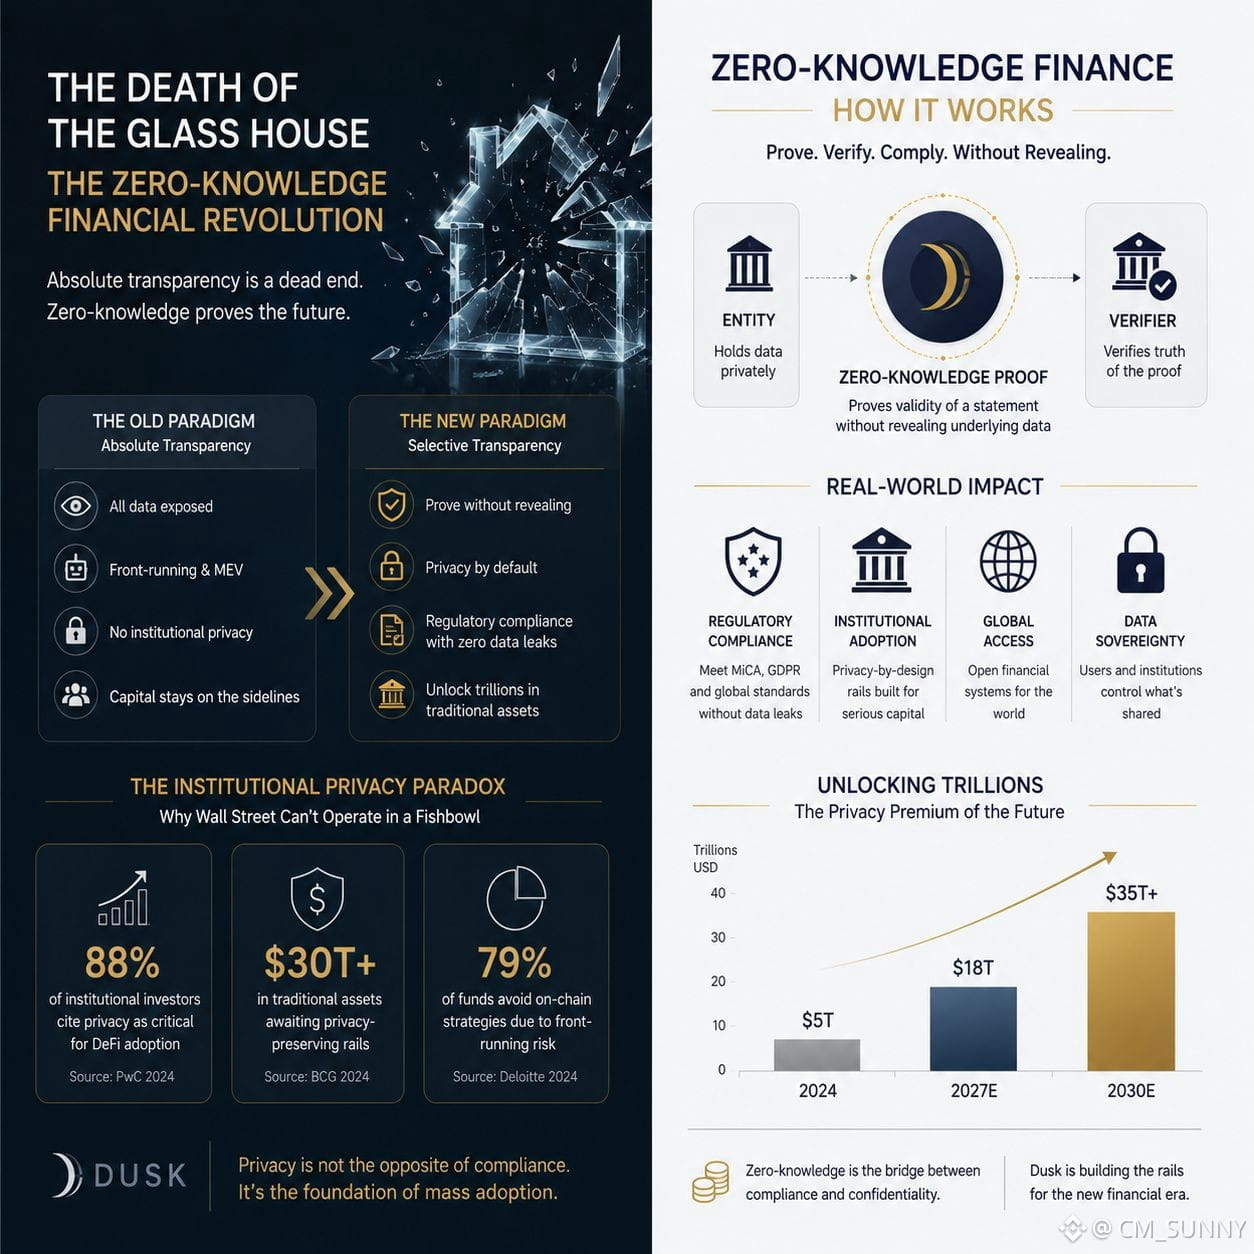
@Dusk_Foundation I’ve watched the crypto narrative fracture over a naive obsession with absolute transparency, watching institutional capital sit firmly on the sidelines because zero privacy is an absolute dealbreaker for serious money. I realized early on that Wall Street funds can’t survive in a fishbowl where bots front-run their moves and corporate treasuries leak trade secrets to every hungry competitor. That is precisely why I view Dusk as the ultimate bridge forward, fundamentally shattering the false choice between total surveillance and rogue anonymity. By leveraging zero-knowledge proofs, I can now see a future where entities prove strict regulatory compliance under MiCA and GDPR without revealing a single byte of sensitive data. I am convinced that selective transparency is the exact missing key required to unlock trillions in traditional assets, turning legal compliance from an existential headache into an automated, privacy-preserving powerhouse that finally makes decentralized finance viable for the global economy.
#dusk $DUSK $BMT #TMXFinance
The Death of the Glass House: Why I’m Bet-it-All Bullish on the Zero-Knowledge Financial Revolution
@Dusk I’ve watched the crypto narrative fracture over a naive obsession with absolute transparency, watching institutional capital sit firmly on the sidelines because zero privacy is an absolute dealbreaker for serious money. I realized early on that Wall Street funds can’t survive in a fishbowl where bots front-run their moves and corporate treasuries leak trade secrets to every hungry competitor. That is precisely why I view Dusk as the ultimate bridge forward, fundamentally shattering the false choice between total surveillance and rogue anonymity. By leveraging zero-knowledge proofs, I can now see a future where entities prove strict regulatory compliance under MiCA and GDPR without revealing a single byte of sensitive data. I am convinced that selective transparency is the exact missing key required to unlock trillions in traditional assets, turning legal compliance from an existential headache into an automated, privacy-preserving powerhouse that finally makes decentralized finance viable for the global economy.
#dusk $DUSK $BMT #TMXFinance
@Dusk I’ve watched the crypto narrative fracture over a naive obsession with absolute transparency, watching institutional capital sit firmly on the sidelines because zero privacy is an absolute dealbreaker for serious money. I realized early on that Wall Street funds can’t survive in a fishbowl where bots front-run their moves and corporate treasuries leak trade secrets to every hungry competitor. That is precisely why I view Dusk as the ultimate bridge forward, fundamentally shattering the false choice between total surveillance and rogue anonymity. By leveraging zero-knowledge proofs, I can now see a future where entities prove strict regulatory compliance under MiCA and GDPR without revealing a single byte of sensitive data. I am convinced that selective transparency is the exact missing key required to unlock trillions in traditional assets, turning legal compliance from an existential headache into an automated, privacy-preserving powerhouse that finally makes decentralized finance viable for the global economy.
#dusk $DUSK $BMT #TMXFinance

1
3
269
·
--
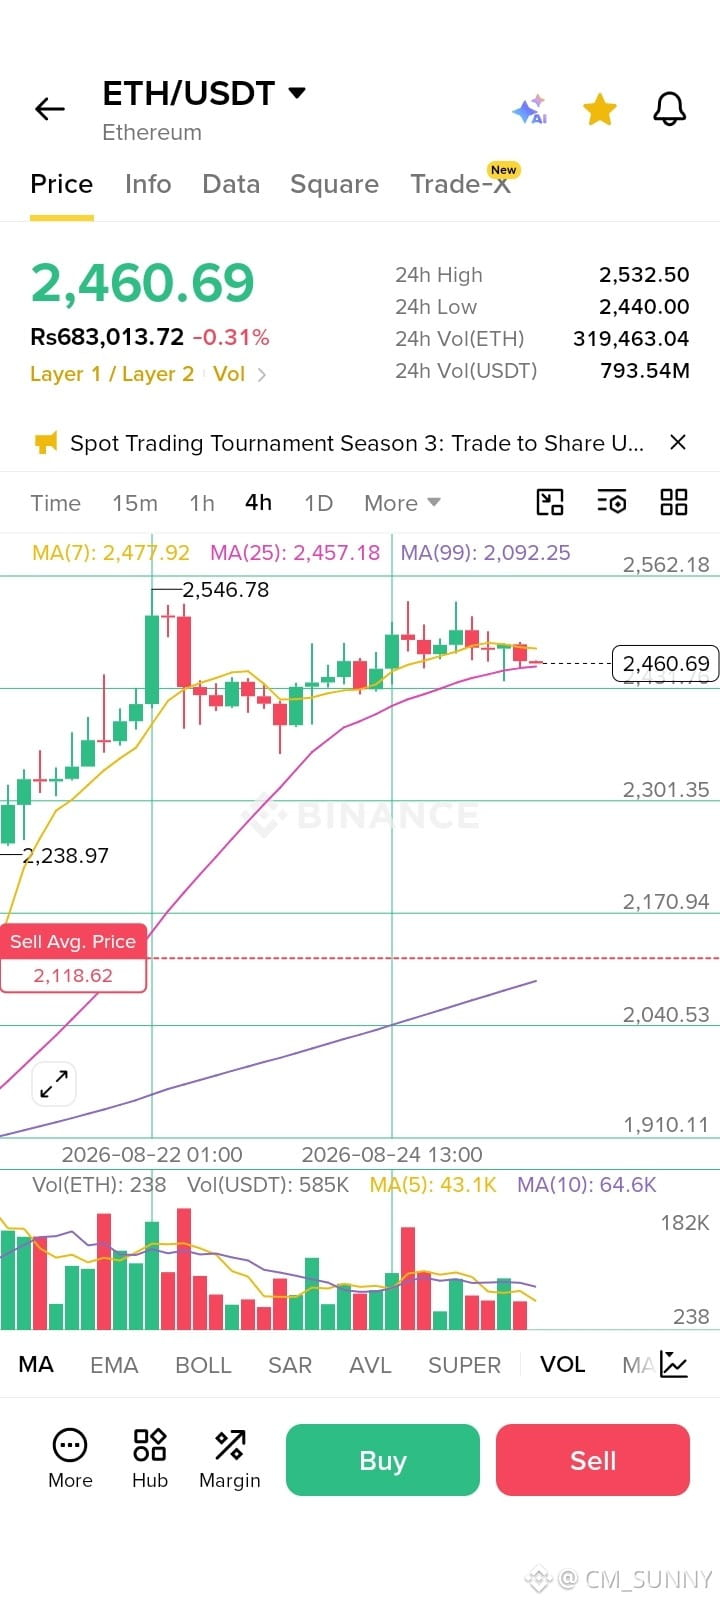
$ETH Technical Analysis — Late August 2026*
Based on the 4H ETH/USDT chart you shared, Ethereum is currently trading at *$2,460.69*, down -0.31% on the day after rejecting near the $2,532.50 24h high. The overall trend remains bullish but momentum is cooling.
Price is consolidating right between the short-term MAs. *MA(7) at $2,477.92* and *MA(25) at $2,457.18* are squeezing together, while *MA(99) at $2,092.25* sits far below and continues to slope up — that confirms the larger uptrend from the $2,238.97 low is still intact. Volume has been declining since the $2,546.78 peak, which shows buyers are taking a pause, not reversing yet.
*Key support*: $2,440.00 is the immediate 24h low. A break under that puts $2,301.35 in play, which was the last swing base before the rally. Deeper demand sits near $2,170-$2,040, where the MA(99) trendline is catching up.
*Key resistance*: $2,546.78 is the recent high. A clean 4H close above that with volume expanding above the MA(10) 64.6K level would open a move toward $2,562+ and a retest of the $2,600 zone.
*Ideal time to trade*: I watch ETH most closely during 9:30am-12:00pm ET and 8:00pm-11:00pm ET. That’s when US + Asia overlap drives volume and breakouts tend to follow through. For longs, wait for a bounce off $2,440 with RSI turning up. For shorts, look for a rejection at $2,546 with volume dropping.
#Write2Earn
$ETH Technical Analysis — Late August 2026*
Based on the 4H ETH/USDT chart you shared, Ethereum is currently trading at *$2,460.69*, down -0.31% on the day after rejecting near the $2,532.50 24h high. The overall trend remains bullish but momentum is cooling.
Price is consolidating right between the short-term MAs. *MA(7) at $2,477.92* and *MA(25) at $2,457.18* are squeezing together, while *MA(99) at $2,092.25* sits far below and continues to slope up — that confirms the larger uptrend from the $2,238.97 low is still intact. Volume has been declining since the $2,546.78 peak, which shows buyers are taking a pause, not reversing yet.
*Key support*: $2,440.00 is the immediate 24h low. A break under that puts $2,301.35 in play, which was the last swing base before the rally. Deeper demand sits near $2,170-$2,040, where the MA(99) trendline is catching up.
*Key resistance*: $2,546.78 is the recent high. A clean 4H close above that with volume expanding above the MA(10) 64.6K level would open a move toward $2,562+ and a retest of the $2,600 zone.
*Ideal time to trade*: I watch ETH most closely during 9:30am-12:00pm ET and 8:00pm-11:00pm ET. That’s when US + Asia overlap drives volume and breakouts tend to follow through. For longs, wait for a bounce off $2,440 with RSI turning up. For shorts, look for a rejection at $2,546 with volume dropping.
#Write2Earn
Based on the 4H ETH/USDT chart you shared, Ethereum is currently trading at *$2,460.69*, down -0.31% on the day after rejecting near the $2,532.50 24h high. The overall trend remains bullish but momentum is cooling.
Price is consolidating right between the short-term MAs. *MA(7) at $2,477.92* and *MA(25) at $2,457.18* are squeezing together, while *MA(99) at $2,092.25* sits far below and continues to slope up — that confirms the larger uptrend from the $2,238.97 low is still intact. Volume has been declining since the $2,546.78 peak, which shows buyers are taking a pause, not reversing yet.
*Key support*: $2,440.00 is the immediate 24h low. A break under that puts $2,301.35 in play, which was the last swing base before the rally. Deeper demand sits near $2,170-$2,040, where the MA(99) trendline is catching up.
*Key resistance*: $2,546.78 is the recent high. A clean 4H close above that with volume expanding above the MA(10) 64.6K level would open a move toward $2,562+ and a retest of the $2,600 zone.
*Ideal time to trade*: I watch ETH most closely during 9:30am-12:00pm ET and 8:00pm-11:00pm ET. That’s when US + Asia overlap drives volume and breakouts tend to follow through. For longs, wait for a bounce off $2,440 with RSI turning up. For shorts, look for a rejection at $2,546 with volume dropping.
#Write2Earn
96
·
--
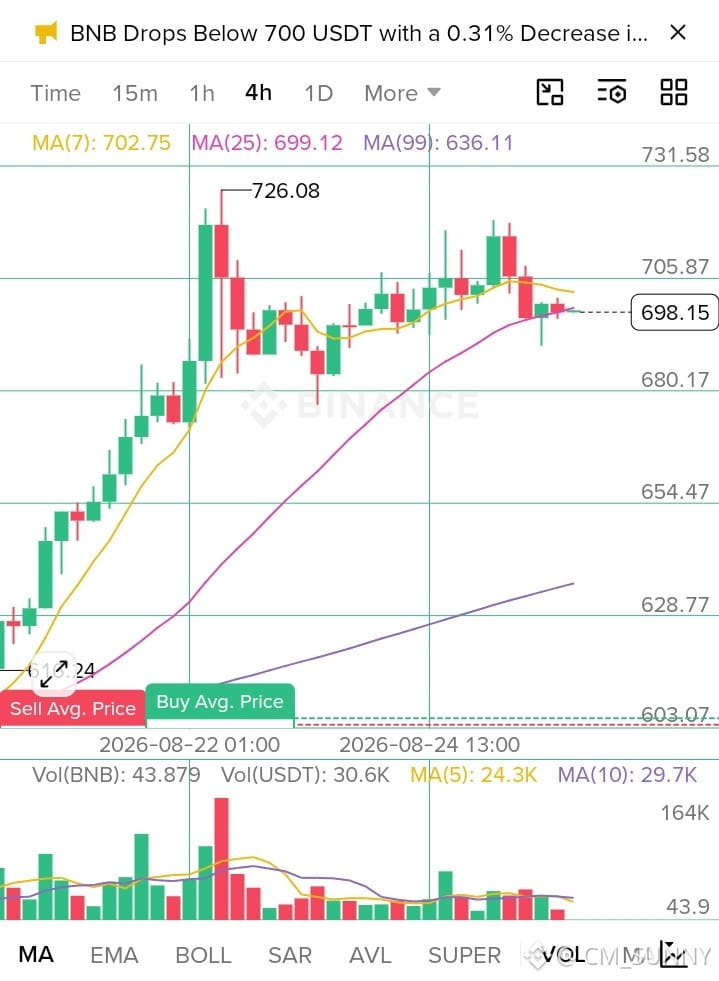
$BNB Technical Analysis — Late August 2026*
i’ve been tracking BNB as it rotates between exchange-driven demand and broader altcoin momentum. After tagging $620 in early July, BNB pulled back and has spent the last few weeks building a base. The current trend is neutral to slightly bullish, with volume picking up on dips and thinning near resistance — a classic coiling setup.
Price right now is hovering around $585. *Key support* is a strong zone at $560-$565. That’s where the 50-day EMA meets the July swing low, and buyers have defended it twice in August. Under that, the next real demand area is $525, the June breakout level and 200-day SMA.
*Key resistance* sits at $605-$612. It’s the August highs plus the descending trendline from the July peak. A daily close above $612 with volume would flip structure and target $640-$650 next, which was the Q2 distribution area. Above $650 and we’re looking at a run toward the $680 all-time region.
For trading, the ideal window is during BSC/Binance ecosystem news and the first hour after US market open, 9:30am-10:30am ET. That’s when spot + futures flow aligns and breakouts tend to follow through.
I’d look for longs on a 4H bounce off $565 with RSI reclaiming 55, and shorts on a rejection at $612 with a wick and volume drop. Keep stops tight — BNB is range-bound until it clears $612.
$BNB Technical Analysis — Late August 2026*
i’ve been tracking BNB as it rotates between exchange-driven demand and broader altcoin momentum. After tagging $620 in early July, BNB pulled back and has spent the last few weeks building a base. The current trend is neutral to slightly bullish, with volume picking up on dips and thinning near resistance — a classic coiling setup.
Price right now is hovering around $585. *Key support* is a strong zone at $560-$565. That’s where the 50-day EMA meets the July swing low, and buyers have defended it twice in August. Under that, the next real demand area is $525, the June breakout level and 200-day SMA.
*Key resistance* sits at $605-$612. It’s the August highs plus the descending trendline from the July peak. A daily close above $612 with volume would flip structure and target $640-$650 next, which was the Q2 distribution area. Above $650 and we’re looking at a run toward the $680 all-time region.
For trading, the ideal window is during BSC/Binance ecosystem news and the first hour after US market open, 9:30am-10:30am ET. That’s when spot + futures flow aligns and breakouts tend to follow through.
I’d look for longs on a 4H bounce off $565 with RSI reclaiming 55, and shorts on a rejection at $612 with a wick and volume drop. Keep stops tight — BNB is range-bound until it clears $612.
i’ve been tracking BNB as it rotates between exchange-driven demand and broader altcoin momentum. After tagging $620 in early July, BNB pulled back and has spent the last few weeks building a base. The current trend is neutral to slightly bullish, with volume picking up on dips and thinning near resistance — a classic coiling setup.
Price right now is hovering around $585. *Key support* is a strong zone at $560-$565. That’s where the 50-day EMA meets the July swing low, and buyers have defended it twice in August. Under that, the next real demand area is $525, the June breakout level and 200-day SMA.
*Key resistance* sits at $605-$612. It’s the August highs plus the descending trendline from the July peak. A daily close above $612 with volume would flip structure and target $640-$650 next, which was the Q2 distribution area. Above $650 and we’re looking at a run toward the $680 all-time region.
For trading, the ideal window is during BSC/Binance ecosystem news and the first hour after US market open, 9:30am-10:30am ET. That’s when spot + futures flow aligns and breakouts tend to follow through.
I’d look for longs on a 4H bounce off $565 with RSI reclaiming 55, and shorts on a rejection at $612 with a wick and volume drop. Keep stops tight — BNB is range-bound until it clears $612.
75
·
--
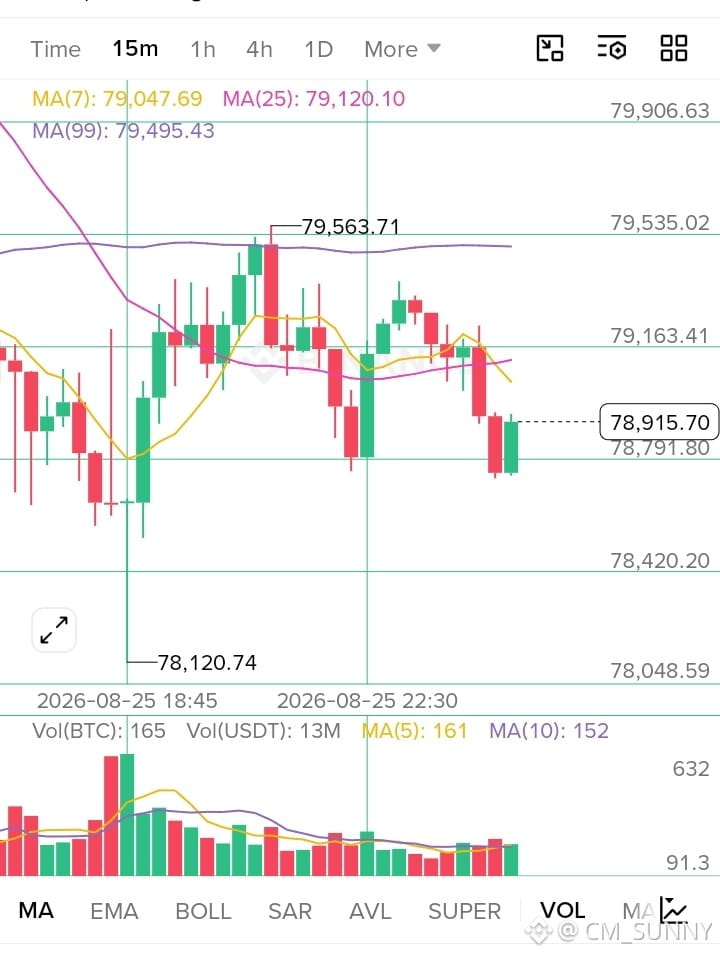
$BTC Technical Analysis — Late August 2026*
i’ve been watching BTC consolidate after the July push toward the $74k-$76k range. The latest market trend is a compression between profit-taking from ETF inflows and renewed institutional bids ahead of Q4. Volume has thinned on spot but picked up in futures, which usually precedes a directional move.
Right now BTC is trading around the $67,800 zone. *Key support* sits at $65,200 — that’s the 50-day EMA and where buyers stepped in twice this month. Lose that and the next real demand pocket is $61,900, the June swing low and the top of the previous range. *Key resistance* is a cluster at $70,400-$71,100. It’s the descending trendline from July’s high plus the 200-day VWAP. A clean break with volume above $71.1k opens a run toward $74,600, and if momentum holds, a retest of the $76,000 all-time area.
For trading, the ideal window has been the first 2 hours after US equity open, 9:30am-11:30am ET. That’s when ETF flows and macro data hit and volatility expands. I also like the 4-hour close: wait for a 4H candle to close above $71.1k with RSI >60 and rising volume before flipping long. For shorts, a rejection at $70.4k with a wick and declining RSI is the cleaner setup.
Risk management matters more than timing here. BTC is range-bound until it picks a side, so tight stops and taking partials near resistance keeps you from getting chopped.
#Write2Earn #BTC☀
$BTC Technical Analysis — Late August 2026*
i’ve been watching BTC consolidate after the July push toward the $74k-$76k range. The latest market trend is a compression between profit-taking from ETF inflows and renewed institutional bids ahead of Q4. Volume has thinned on spot but picked up in futures, which usually precedes a directional move.
Right now BTC is trading around the $67,800 zone. *Key support* sits at $65,200 — that’s the 50-day EMA and where buyers stepped in twice this month. Lose that and the next real demand pocket is $61,900, the June swing low and the top of the previous range. *Key resistance* is a cluster at $70,400-$71,100. It’s the descending trendline from July’s high plus the 200-day VWAP. A clean break with volume above $71.1k opens a run toward $74,600, and if momentum holds, a retest of the $76,000 all-time area.
For trading, the ideal window has been the first 2 hours after US equity open, 9:30am-11:30am ET. That’s when ETF flows and macro data hit and volatility expands. I also like the 4-hour close: wait for a 4H candle to close above $71.1k with RSI >60 and rising volume before flipping long. For shorts, a rejection at $70.4k with a wick and declining RSI is the cleaner setup.
Risk management matters more than timing here. BTC is range-bound until it picks a side, so tight stops and taking partials near resistance keeps you from getting chopped.
#Write2Earn #BTC☀
i’ve been watching BTC consolidate after the July push toward the $74k-$76k range. The latest market trend is a compression between profit-taking from ETF inflows and renewed institutional bids ahead of Q4. Volume has thinned on spot but picked up in futures, which usually precedes a directional move.
Right now BTC is trading around the $67,800 zone. *Key support* sits at $65,200 — that’s the 50-day EMA and where buyers stepped in twice this month. Lose that and the next real demand pocket is $61,900, the June swing low and the top of the previous range. *Key resistance* is a cluster at $70,400-$71,100. It’s the descending trendline from July’s high plus the 200-day VWAP. A clean break with volume above $71.1k opens a run toward $74,600, and if momentum holds, a retest of the $76,000 all-time area.
For trading, the ideal window has been the first 2 hours after US equity open, 9:30am-11:30am ET. That’s when ETF flows and macro data hit and volatility expands. I also like the 4-hour close: wait for a 4H candle to close above $71.1k with RSI >60 and rising volume before flipping long. For shorts, a rejection at $70.4k with a wick and declining RSI is the cleaner setup.
Risk management matters more than timing here. BTC is range-bound until it picks a side, so tight stops and taking partials near resistance keeps you from getting chopped.
#Write2Earn #BTC☀
189
·
--
Рост
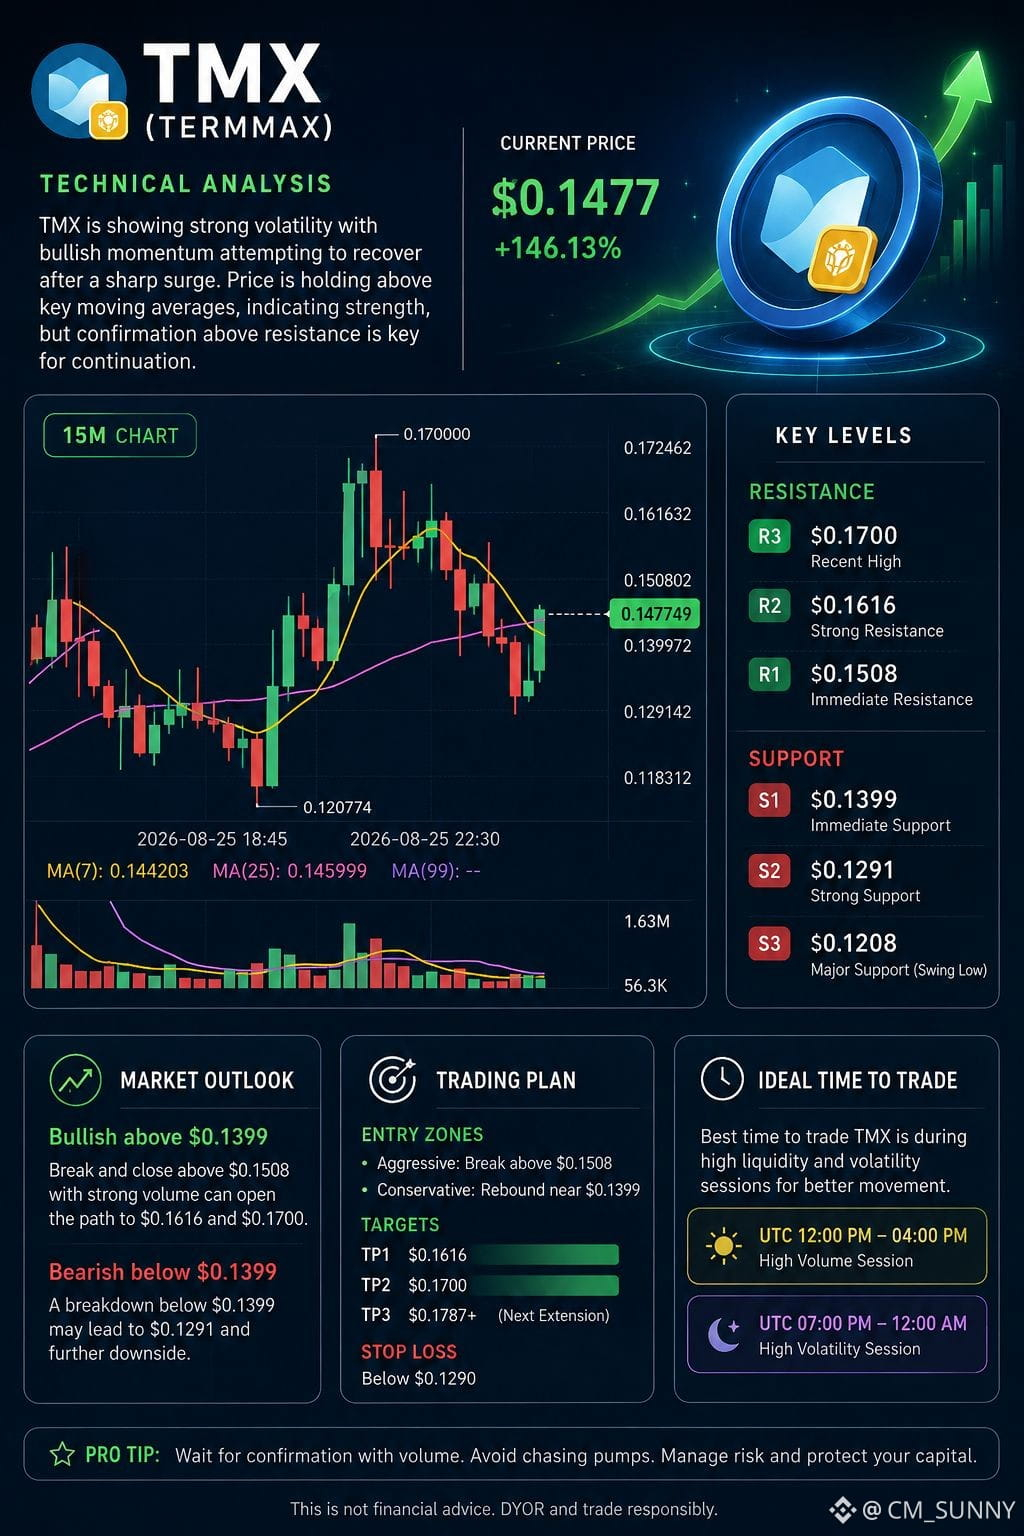
$TMX (TermMax) is showing a highly volatile bullish structure on the 15-minute chart, but the recent +146% surge means traders should be alert to sharp pullbacks. Price is around $0.1477 and is holding above both the 7-period MA ($0.1442) and 25-period MA ($0.1460), suggesting short-term momentum is attempting to stabilize after the rejection from $0.1700.
The first major support sits near $0.1399, followed by $0.1291 and the stronger swing-low area around $0.1208. Holding $0.1399 would keep the near-term recovery structure intact. On the upside, $0.1508 is the immediate resistance. A convincing 15-minute close above this zone, supported by rising volume, could open the way toward $0.1616 and then the recent high near $0.1700.
Momentum remains constructive, but volume has cooled considerably from the earlier breakout, so chasing candles at elevated levels carries higher risk. The ideal trading window is after a confirmed breakout above $0.1508 with strong volume, or a controlled pullback that holds $0.1399 and produces a bullish reversal candle. If $0.1399 fails decisively, the setup weakens and $0.1291 becomes the next downside area.
Overall, TMX remains bullish above $0.1399, but confirmation is essential given its extreme recent volatility. Because TMX is newly listed, price discovery may remain unstable.
#Write2Earn #TMX
$TMX (TermMax) is showing a highly volatile bullish structure on the 15-minute chart, but the recent +146% surge means traders should be alert to sharp pullbacks. Price is around $0.1477 and is holding above both the 7-period MA ($0.1442) and 25-period MA ($0.1460), suggesting short-term momentum is attempting to stabilize after the rejection from $0.1700.
The first major support sits near $0.1399, followed by $0.1291 and the stronger swing-low area around $0.1208. Holding $0.1399 would keep the near-term recovery structure intact. On the upside, $0.1508 is the immediate resistance. A convincing 15-minute close above this zone, supported by rising volume, could open the way toward $0.1616 and then the recent high near $0.1700.
Momentum remains constructive, but volume has cooled considerably from the earlier breakout, so chasing candles at elevated levels carries higher risk. The ideal trading window is after a confirmed breakout above $0.1508 with strong volume, or a controlled pullback that holds $0.1399 and produces a bullish reversal candle. If $0.1399 fails decisively, the setup weakens and $0.1291 becomes the next downside area.
Overall, TMX remains bullish above $0.1399, but confirmation is essential given its extreme recent volatility. Because TMX is newly listed, price discovery may remain unstable.
#Write2Earn #TMX
The first major support sits near $0.1399, followed by $0.1291 and the stronger swing-low area around $0.1208. Holding $0.1399 would keep the near-term recovery structure intact. On the upside, $0.1508 is the immediate resistance. A convincing 15-minute close above this zone, supported by rising volume, could open the way toward $0.1616 and then the recent high near $0.1700.
Momentum remains constructive, but volume has cooled considerably from the earlier breakout, so chasing candles at elevated levels carries higher risk. The ideal trading window is after a confirmed breakout above $0.1508 with strong volume, or a controlled pullback that holds $0.1399 and produces a bullish reversal candle. If $0.1399 fails decisively, the setup weakens and $0.1291 becomes the next downside area.
Overall, TMX remains bullish above $0.1399, but confirmation is essential given its extreme recent volatility. Because TMX is newly listed, price discovery may remain unstable.
#Write2Earn #TMX
2
275
·
--
Рост
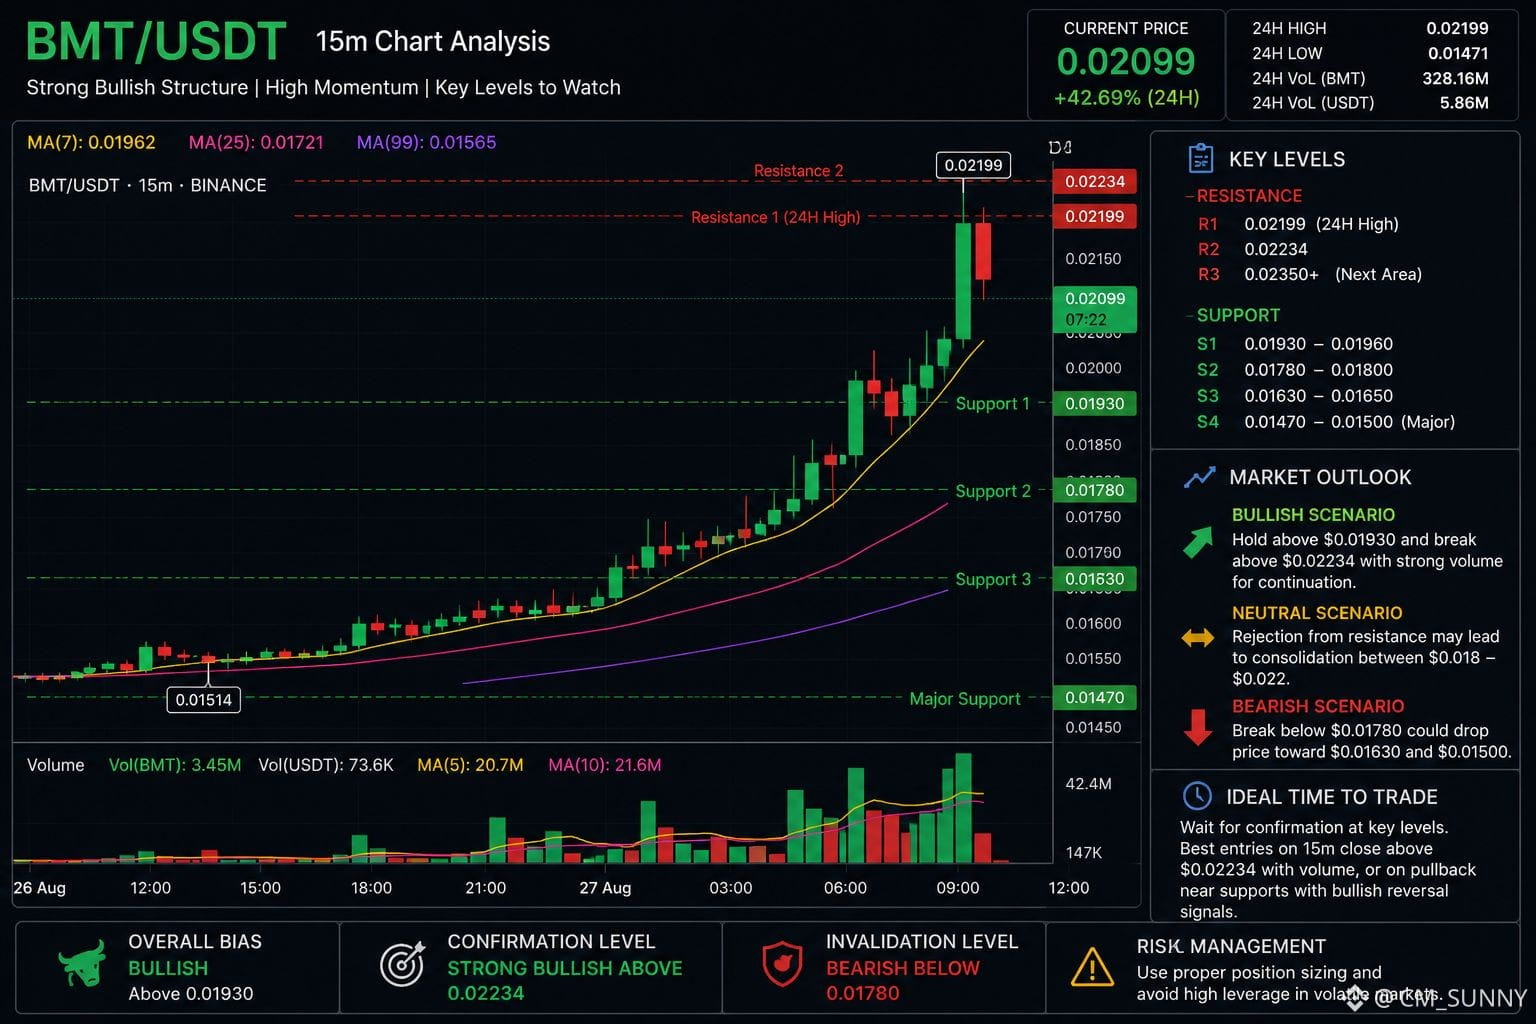
$BMT /USDT is showing a strong short-term bullish structure on the 15-minute chart. Price is around $0.02099, up approximately 42.69%, following a sharp breakout from the $0.015–$0.018 area. Strong volume accompanied the move, confirming significant buying interest, although such rapid rallies can also bring elevated profit-taking.
The moving averages remain bullish: MA(7) = $0.01962, MA(25) = $0.01721, and MA(99) = $0.01565. Price is above all three, keeping momentum firmly positive.
Key support levels are $0.01930–$0.01960 as the immediate pullback zone, followed by $0.01780–$0.01800 as important breakout support. Below that, $0.01630–$0.01650 is the next structural zone, while $0.01470–$0.01500 represents major support.
On the upside, $0.02199 is the current 24-hour high and first major resistance, followed by $0.02234. A strong 15-minute close above $0.02234 with expanding volume could signal further bullish continuation.
The ideal trading approach is to wait for confirmation rather than chase the rally. A successful breakout above resistance or a controlled pullback toward support offers cleaner setups.
Overall bias: Bullish above $0.01930; stronger confirmation above $0.02234; bearish below $0.01780.
#Write2Earn #BMT #ZECBreaksKeyResistanceUp75.5%
$BMT /USDT is showing a strong short-term bullish structure on the 15-minute chart. Price is around $0.02099, up approximately 42.69%, following a sharp breakout from the $0.015–$0.018 area. Strong volume accompanied the move, confirming significant buying interest, although such rapid rallies can also bring elevated profit-taking.
The moving averages remain bullish: MA(7) = $0.01962, MA(25) = $0.01721, and MA(99) = $0.01565. Price is above all three, keeping momentum firmly positive.
Key support levels are $0.01930–$0.01960 as the immediate pullback zone, followed by $0.01780–$0.01800 as important breakout support. Below that, $0.01630–$0.01650 is the next structural zone, while $0.01470–$0.01500 represents major support.
On the upside, $0.02199 is the current 24-hour high and first major resistance, followed by $0.02234. A strong 15-minute close above $0.02234 with expanding volume could signal further bullish continuation.
The ideal trading approach is to wait for confirmation rather than chase the rally. A successful breakout above resistance or a controlled pullback toward support offers cleaner setups.
Overall bias: Bullish above $0.01930; stronger confirmation above $0.02234; bearish below $0.01780.
#Write2Earn #BMT #ZECBreaksKeyResistanceUp75.5%
The moving averages remain bullish: MA(7) = $0.01962, MA(25) = $0.01721, and MA(99) = $0.01565. Price is above all three, keeping momentum firmly positive.
Key support levels are $0.01930–$0.01960 as the immediate pullback zone, followed by $0.01780–$0.01800 as important breakout support. Below that, $0.01630–$0.01650 is the next structural zone, while $0.01470–$0.01500 represents major support.
On the upside, $0.02199 is the current 24-hour high and first major resistance, followed by $0.02234. A strong 15-minute close above $0.02234 with expanding volume could signal further bullish continuation.
The ideal trading approach is to wait for confirmation rather than chase the rally. A successful breakout above resistance or a controlled pullback toward support offers cleaner setups.
Overall bias: Bullish above $0.01930; stronger confirmation above $0.02234; bearish below $0.01780.
#Write2Earn #BMT #ZECBreaksKeyResistanceUp75.5%
216
·
--
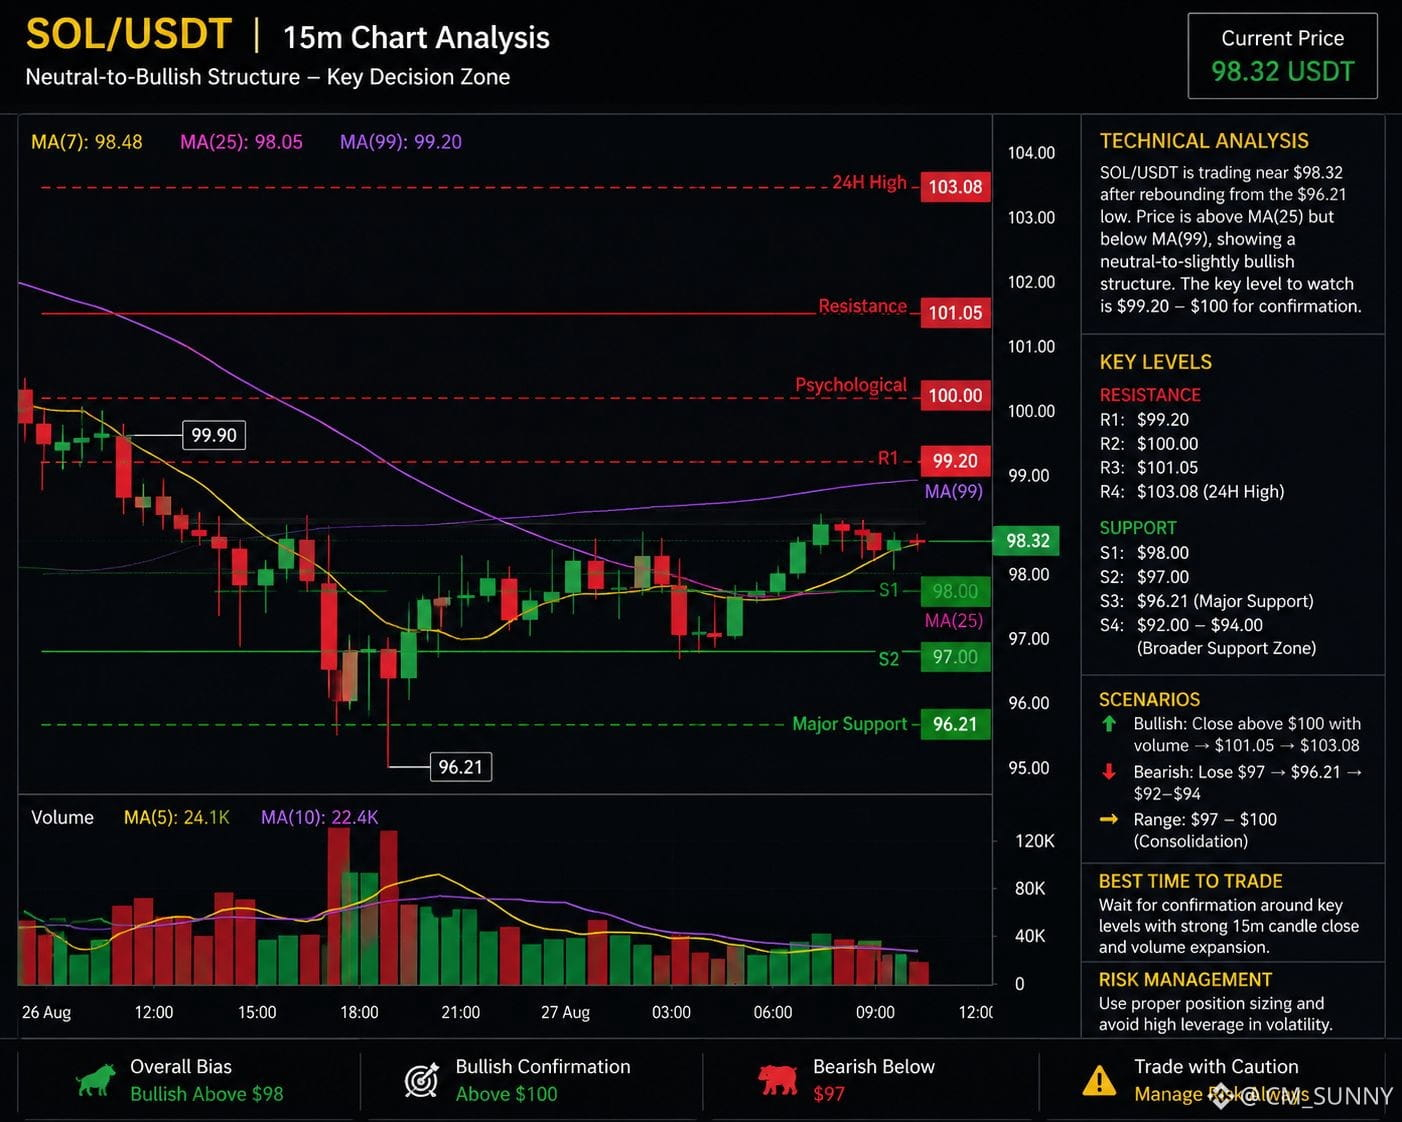
$SOL /USDT is trading near $98.32 on the 15-minute chart, showing a neutral-to-slightly bullish structure after recovering from the recent $96.21 low. Price is holding above the MA(25) near $98.05, but remains below the MA(99) around $99.20, making this a key decision zone.
Immediate support sits at $98.00–$98.05, followed by stronger support around $97.00. The major short-term invalidation level is $96.21; losing it would weaken the recovery and expose the broader $92–$94 region.
On the upside, $99.00–$99.20 is the first resistance zone, followed by the psychological $100 level. A confirmed 15-minute close above $100 with rising volume could open a move toward $101.05 and the 24-hour high near $103.08.
Volume currently appears softer during the rebound, so chasing price is risky. The cleaner setup is to wait for confirmation rather than entering in the middle of the range.
Ideal trading timing depends more on confirmation than a specific clock hour: watch for a strong 15-minute close above $100 with volume, or a clear rejection from resistance. Similarly, reactions around $98, $97, and $96.21 can provide useful signals.
Overall bias: bullish above $98, stronger bullish confirmation above $100, and bearish below $97. Manage risk carefully and avoid excessive leverage during volatile moves.
#Write2Earn #ZECBreaksKeyResistanceUp75.5%
$SOL
$SOL /USDT is trading near $98.32 on the 15-minute chart, showing a neutral-to-slightly bullish structure after recovering from the recent $96.21 low. Price is holding above the MA(25) near $98.05, but remains below the MA(99) around $99.20, making this a key decision zone.
Immediate support sits at $98.00–$98.05, followed by stronger support around $97.00. The major short-term invalidation level is $96.21; losing it would weaken the recovery and expose the broader $92–$94 region.
On the upside, $99.00–$99.20 is the first resistance zone, followed by the psychological $100 level. A confirmed 15-minute close above $100 with rising volume could open a move toward $101.05 and the 24-hour high near $103.08.
Volume currently appears softer during the rebound, so chasing price is risky. The cleaner setup is to wait for confirmation rather than entering in the middle of the range.
Ideal trading timing depends more on confirmation than a specific clock hour: watch for a strong 15-minute close above $100 with volume, or a clear rejection from resistance. Similarly, reactions around $98, $97, and $96.21 can provide useful signals.
Overall bias: bullish above $98, stronger bullish confirmation above $100, and bearish below $97. Manage risk carefully and avoid excessive leverage during volatile moves.
#Write2Earn #ZECBreaksKeyResistanceUp75.5%
$SOL
Immediate support sits at $98.00–$98.05, followed by stronger support around $97.00. The major short-term invalidation level is $96.21; losing it would weaken the recovery and expose the broader $92–$94 region.
On the upside, $99.00–$99.20 is the first resistance zone, followed by the psychological $100 level. A confirmed 15-minute close above $100 with rising volume could open a move toward $101.05 and the 24-hour high near $103.08.
Volume currently appears softer during the rebound, so chasing price is risky. The cleaner setup is to wait for confirmation rather than entering in the middle of the range.
Ideal trading timing depends more on confirmation than a specific clock hour: watch for a strong 15-minute close above $100 with volume, or a clear rejection from resistance. Similarly, reactions around $98, $97, and $96.21 can provide useful signals.
Overall bias: bullish above $98, stronger bullish confirmation above $100, and bearish below $97. Manage risk carefully and avoid excessive leverage during volatile moves.
#Write2Earn #ZECBreaksKeyResistanceUp75.5%
$SOL
181
·
--
The Irony of Consensus: Why Protocol Crises Reveal the Real Power Players
@Dusk_Foundation I spent the aftermath of that August 16 bridge incident digging into the raw mechanics of our block reward distribution, and what I uncovered completely reshaped how I view our network's security model. While watching the quick execution of the Web Wallet blocklists, I realized that behind the polished promise of shared consensus rewards lies a deeply asymmetrical economic pipeline favoring the block generator over the validating provisioners. I watched as seventy percent of the block reward was handed immediately to the proposer, while an extra ten percent variable slice was tethered to certificate credits, leaving the hard-working provisioners to scramble over whatever dynamic remnant remained. What disturbed me most was seeing unallocated credit fractions get instantly burned rather than routed down to the voting pool, forcing consensus validators to absorb the financial hit of network friction while the block generator's massive baseline pay stayed entirely untouched.
#dusk $DUSK @Dusk_Foundation
The Irony of Consensus: Why Protocol Crises Reveal the Real Power Players
@Dusk I spent the aftermath of that August 16 bridge incident digging into the raw mechanics of our block reward distribution, and what I uncovered completely reshaped how I view our network's security model. While watching the quick execution of the Web Wallet blocklists, I realized that behind the polished promise of shared consensus rewards lies a deeply asymmetrical economic pipeline favoring the block generator over the validating provisioners. I watched as seventy percent of the block reward was handed immediately to the proposer, while an extra ten percent variable slice was tethered to certificate credits, leaving the hard-working provisioners to scramble over whatever dynamic remnant remained. What disturbed me most was seeing unallocated credit fractions get instantly burned rather than routed down to the voting pool, forcing consensus validators to absorb the financial hit of network friction while the block generator's massive baseline pay stayed entirely untouched.
#dusk $DUSK @Dusk
@Dusk I spent the aftermath of that August 16 bridge incident digging into the raw mechanics of our block reward distribution, and what I uncovered completely reshaped how I view our network's security model. While watching the quick execution of the Web Wallet blocklists, I realized that behind the polished promise of shared consensus rewards lies a deeply asymmetrical economic pipeline favoring the block generator over the validating provisioners. I watched as seventy percent of the block reward was handed immediately to the proposer, while an extra ten percent variable slice was tethered to certificate credits, leaving the hard-working provisioners to scramble over whatever dynamic remnant remained. What disturbed me most was seeing unallocated credit fractions get instantly burned rather than routed down to the voting pool, forcing consensus validators to absorb the financial hit of network friction while the block generator's massive baseline pay stayed entirely untouched.
#dusk $DUSK @Dusk


96
·
--
🇺🇸 Trump administration proposes regulation to impose more than $100,000 fee on new H-1B worker visas.
🇺🇸 Trump administration proposes regulation to impose more than $100,000 fee on new H-1B worker visas.
78
·
--
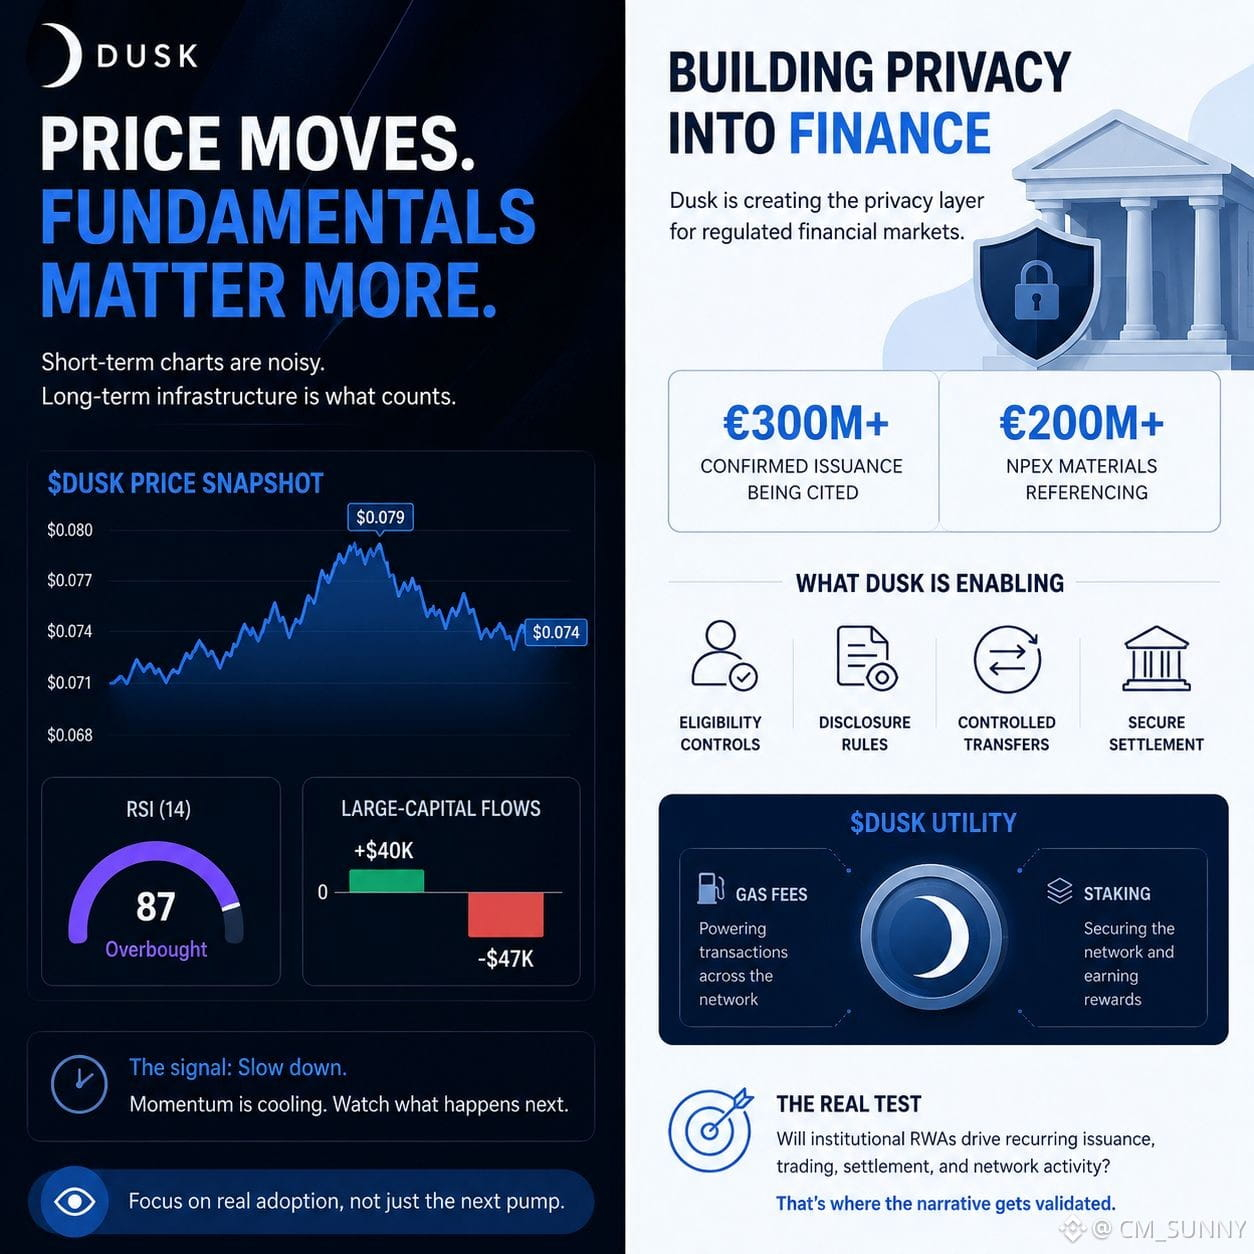
Dusk is one of those charts where the price is only half the story.
It pushed up toward $0.079, cooled back around $0.074, and honestly, I’m not too interested in chasing that move. RSI was already around 87, while large-capital flows flipped from roughly +$40K to around -$47K.
That tells me to slow down and watch what happens next.
What really catches my attention is what Dusk is building underneath the price action.
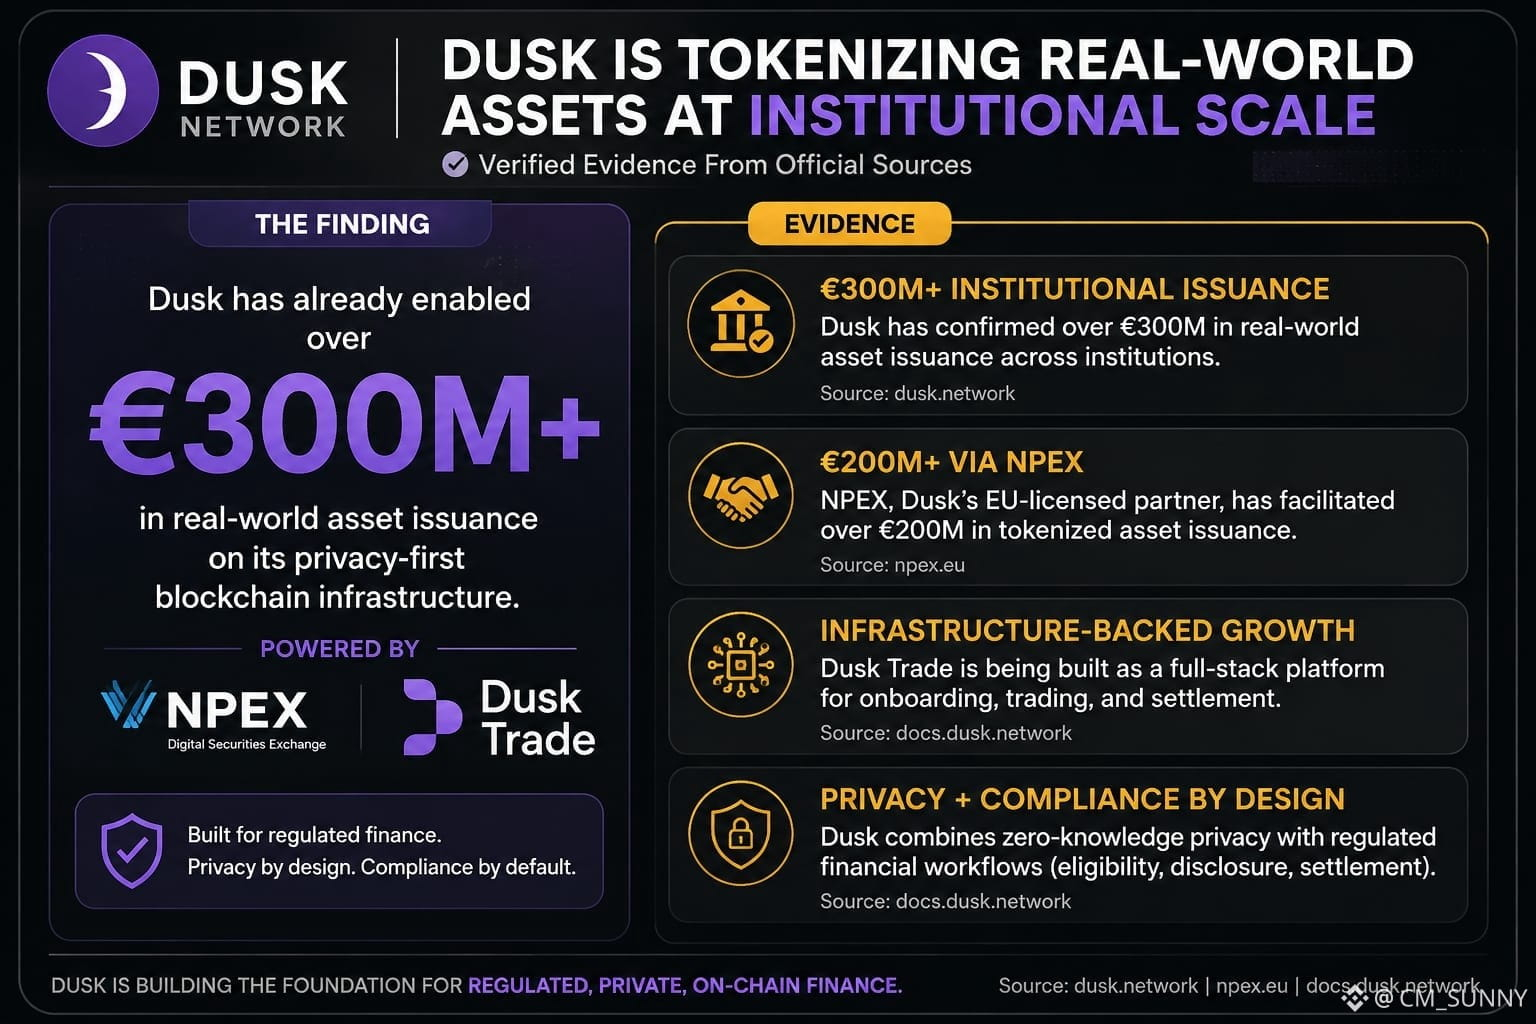
The project is focused on bringing privacy into regulated financial markets, with €300M+ in confirmed issuance being cited and NPEX materials referencing €200M+.
But the numbers alone aren’t enough.
The real test is whether those assets actually lead to recurring issuance, trading, settlement and network activity.
That’s why I find Dusk’s approach interesting. Privacy isn’t being pushed as the end product. It’s being built into the financial infrastructure itself — where eligibility, disclosure, controlled transfers and settlement actually matter.
And with Dusk used for gas and staking, growing network activity could eventually translate into stronger token utility.
So I’m not watching Dusk just for another pump.
I’m watching to see whether the institutional RWA story turns into real, repeatable usage.
That’s where the narrative either gets validated or falls apart.
DYOR.
#dusk $DUSK @Dusk_Foundation
Dusk is one of those charts where the price is only half the story.
It pushed up toward $0.079, cooled back around $0.074, and honestly, I’m not too interested in chasing that move. RSI was already around 87, while large-capital flows flipped from roughly +$40K to around -$47K.
That tells me to slow down and watch what happens next.
What really catches my attention is what Dusk is building underneath the price action.
The project is focused on bringing privacy into regulated financial markets, with €300M+ in confirmed issuance being cited and NPEX materials referencing €200M+.
But the numbers alone aren’t enough.
The real test is whether those assets actually lead to recurring issuance, trading, settlement and network activity.
That’s why I find Dusk’s approach interesting. Privacy isn’t being pushed as the end product. It’s being built into the financial infrastructure itself — where eligibility, disclosure, controlled transfers and settlement actually matter.
And with Dusk used for gas and staking, growing network activity could eventually translate into stronger token utility.
So I’m not watching Dusk just for another pump.
I’m watching to see whether the institutional RWA story turns into real, repeatable usage.
That’s where the narrative either gets validated or falls apart.
DYOR.
#dusk $DUSK @Dusk
It pushed up toward $0.079, cooled back around $0.074, and honestly, I’m not too interested in chasing that move. RSI was already around 87, while large-capital flows flipped from roughly +$40K to around -$47K.
That tells me to slow down and watch what happens next.
What really catches my attention is what Dusk is building underneath the price action.
The project is focused on bringing privacy into regulated financial markets, with €300M+ in confirmed issuance being cited and NPEX materials referencing €200M+.
But the numbers alone aren’t enough.
The real test is whether those assets actually lead to recurring issuance, trading, settlement and network activity.
That’s why I find Dusk’s approach interesting. Privacy isn’t being pushed as the end product. It’s being built into the financial infrastructure itself — where eligibility, disclosure, controlled transfers and settlement actually matter.
And with Dusk used for gas and staking, growing network activity could eventually translate into stronger token utility.
So I’m not watching Dusk just for another pump.
I’m watching to see whether the institutional RWA story turns into real, repeatable usage.
That’s where the narrative either gets validated or falls apart.
DYOR.
#dusk $DUSK @Dusk
2
2
101
·
--
DUSK: The Moment Utility Meets Reality
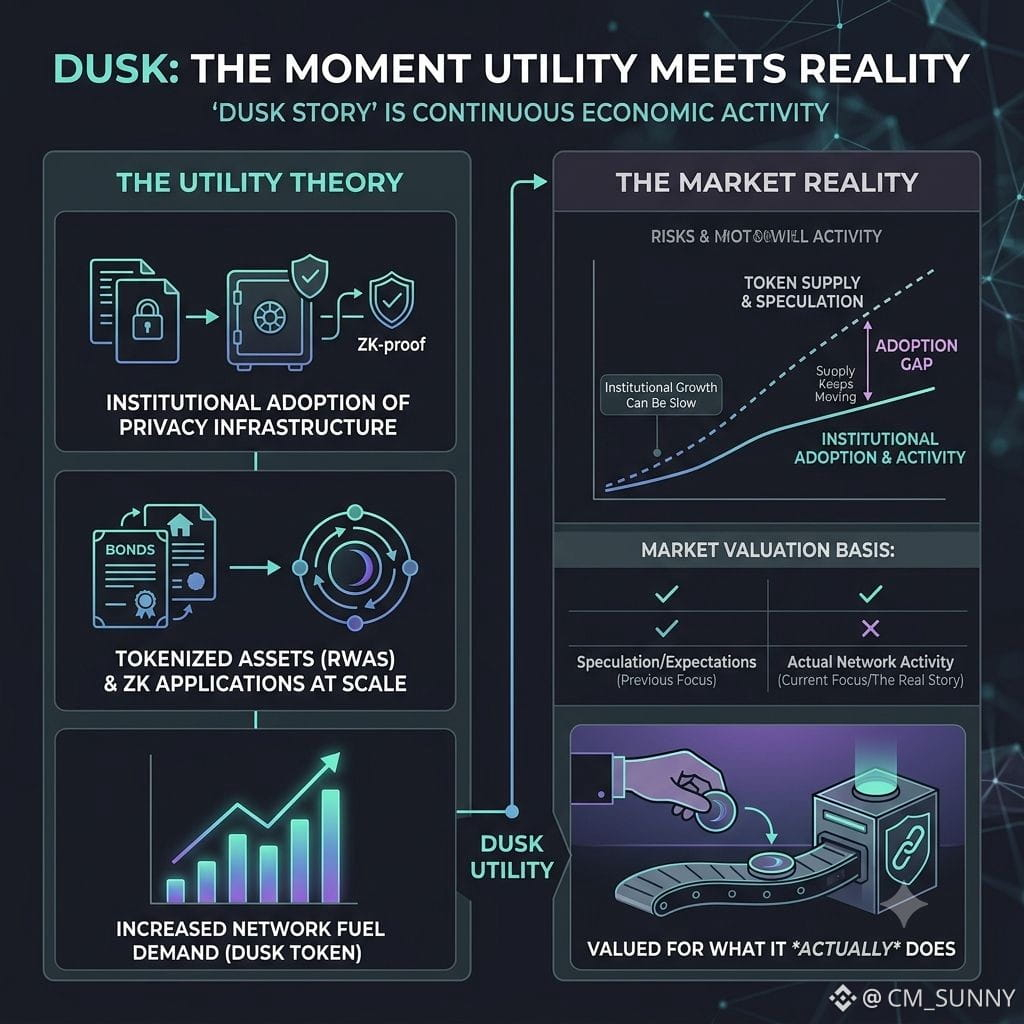
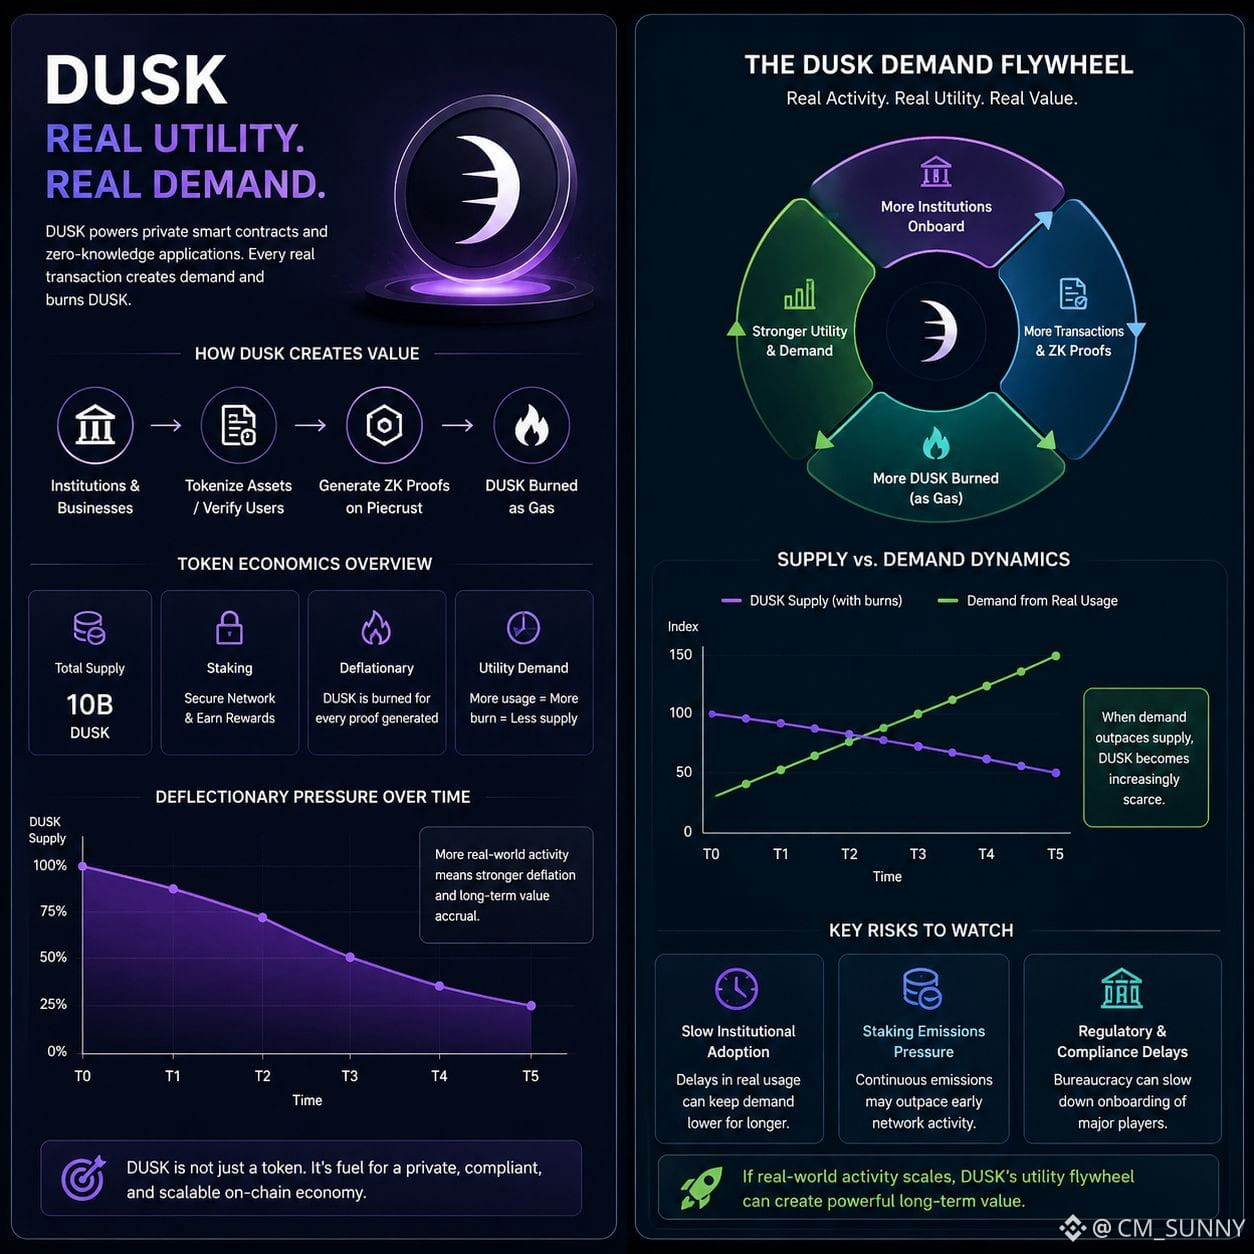
@Dusk_Foundation i’ve been thinking about DUSK differently lately. when i look beyond the chart and the usual market noise, i see a token economy that could become much more interesting if real adoption starts arriving. DUSK isn’t built only around speculation; its role as network fuel gives it a direct connection to actual activity. The exciting part is what happens when institutions begin using privacy infrastructure, tokenized assets, and zero-knowledge applications at scale. More activity should mean more demand, and that is where the theory becomes real. But i also see the biggest risk: adoption has to move fast enough to matter. Institutional growth can be slow while token supply keeps moving, and that gap could create pressure before utility catches up. So for me, the real DUSK story starts now. i’m not watching only the price anymore. i’m watching whether the network can turn technology into continuous economic activity. If it does, the market may eventually have no choice but to value DUSK for what it actually does, not just what people expect it to do.
#dusk $DUSK @Dusk_Foundation $TUT
DUSK: The Moment Utility Meets Reality
@Dusk i’ve been thinking about DUSK differently lately. when i look beyond the chart and the usual market noise, i see a token economy that could become much more interesting if real adoption starts arriving. DUSK isn’t built only around speculation; its role as network fuel gives it a direct connection to actual activity. The exciting part is what happens when institutions begin using privacy infrastructure, tokenized assets, and zero-knowledge applications at scale. More activity should mean more demand, and that is where the theory becomes real. But i also see the biggest risk: adoption has to move fast enough to matter. Institutional growth can be slow while token supply keeps moving, and that gap could create pressure before utility catches up. So for me, the real DUSK story starts now. i’m not watching only the price anymore. i’m watching whether the network can turn technology into continuous economic activity. If it does, the market may eventually have no choice but to value DUSK for what it actually does, not just what people expect it to do.
#dusk $DUSK @Dusk $TUT
@Dusk i’ve been thinking about DUSK differently lately. when i look beyond the chart and the usual market noise, i see a token economy that could become much more interesting if real adoption starts arriving. DUSK isn’t built only around speculation; its role as network fuel gives it a direct connection to actual activity. The exciting part is what happens when institutions begin using privacy infrastructure, tokenized assets, and zero-knowledge applications at scale. More activity should mean more demand, and that is where the theory becomes real. But i also see the biggest risk: adoption has to move fast enough to matter. Institutional growth can be slow while token supply keeps moving, and that gap could create pressure before utility catches up. So for me, the real DUSK story starts now. i’m not watching only the price anymore. i’m watching whether the network can turn technology into continuous economic activity. If it does, the market may eventually have no choice but to value DUSK for what it actually does, not just what people expect it to do.
#dusk $DUSK @Dusk $TUT
82
·
--
Rethinking RWA: Why Tokenization Was Always Just the Appetizer
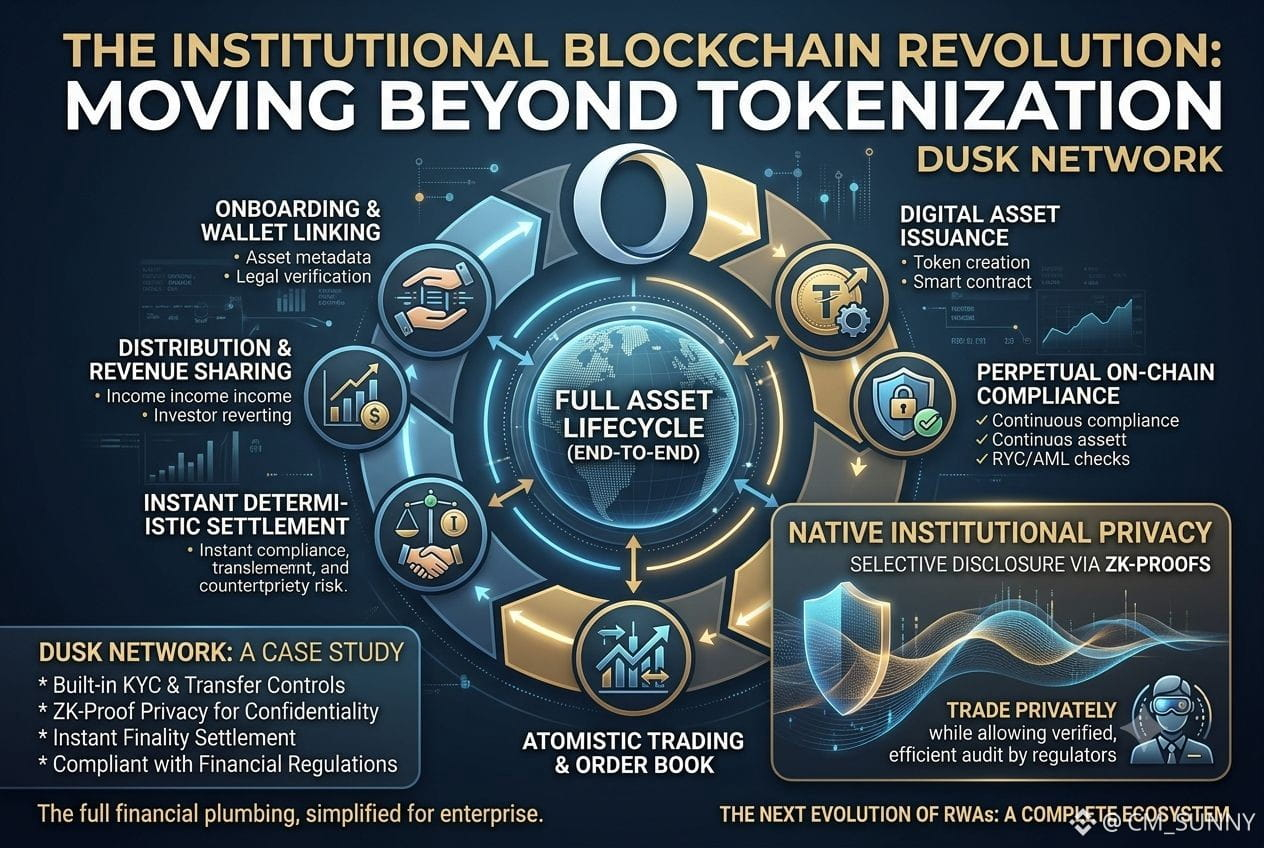
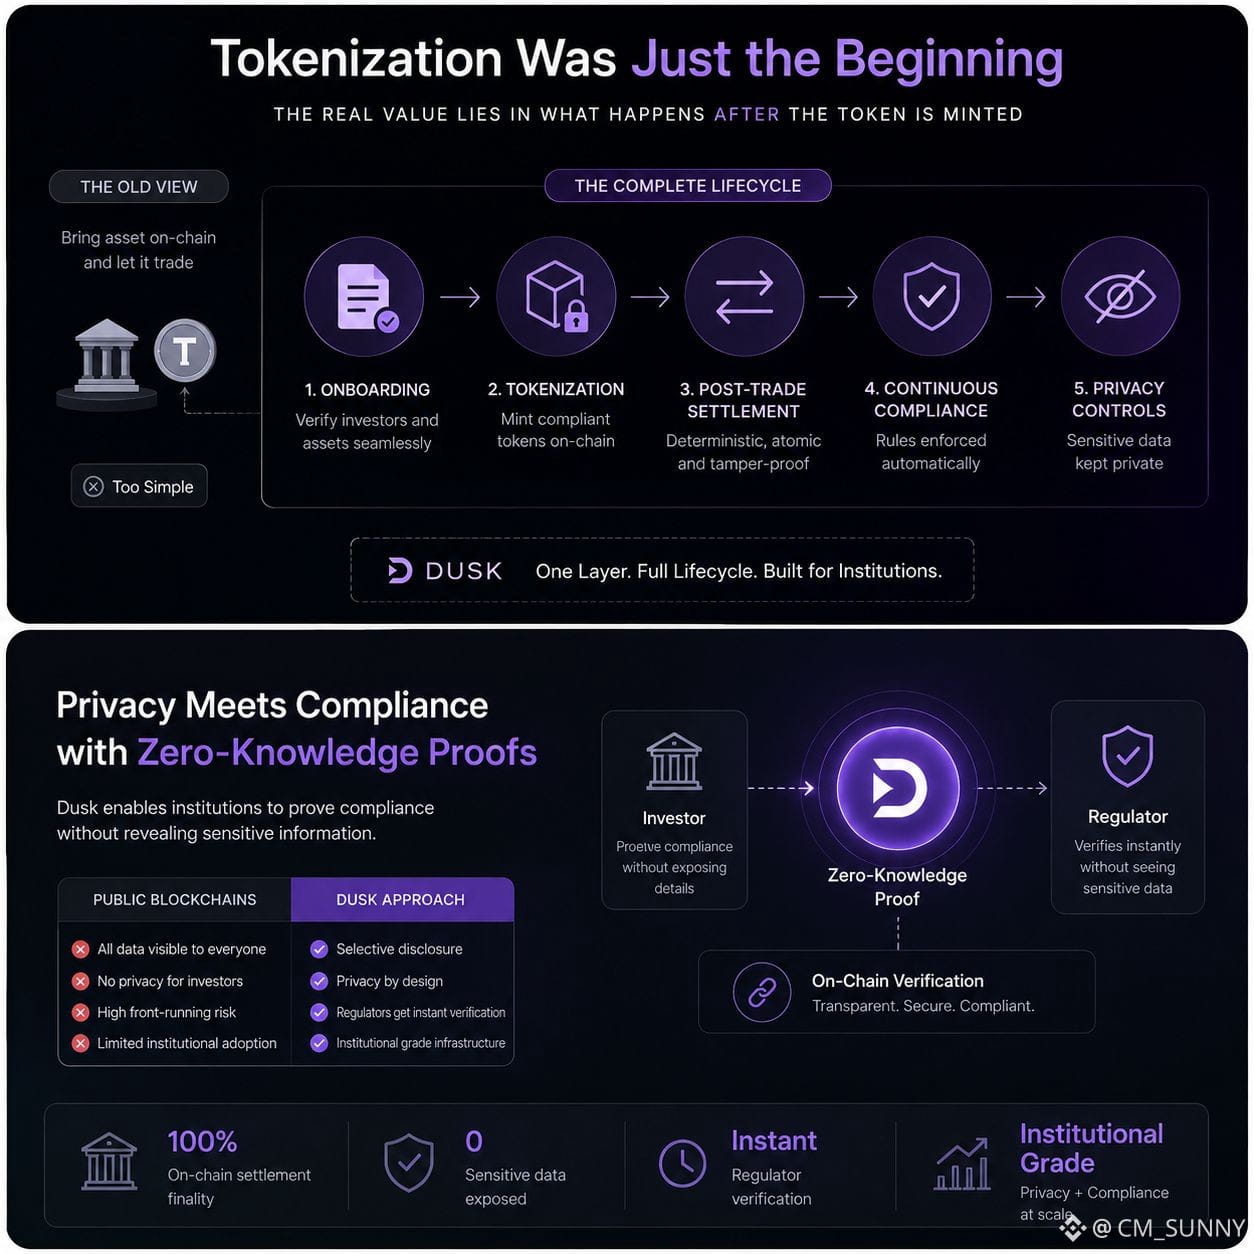
@Dusk_Foundation I used to think tokenizing real-world assets was simple: just bring the asset on-chain and let it trade. The massive adoption numbers easily convinced me, but looking closer at Dusk completely shifted my perspective. I realized minting a token is actually the easy part; the real challenge begins afterward with post-trade settlement, continuous investor compliance, and privacy controls. I always assumed absolute transparency was ideal for blockchain, yet institutional investors simply cannot operate if their balances and strategies are totally public. Utilizing selective disclosure through zero-knowledge proofs allows me to see how a network can protect privacy while giving regulators instant verification. By handling onboarding, deterministic settlement, and compliance within the exact same layer, Dusk aims to manage the full asset lifecycle. I am still watching to see if traditional institutions can seamlessly integrate this complex infrastructure, but I now realize tokenization was merely the starting point.
#dusk $DUSK @Dusk_Foundation $ENS
Rethinking RWA: Why Tokenization Was Always Just the Appetizer
@Dusk I used to think tokenizing real-world assets was simple: just bring the asset on-chain and let it trade. The massive adoption numbers easily convinced me, but looking closer at Dusk completely shifted my perspective. I realized minting a token is actually the easy part; the real challenge begins afterward with post-trade settlement, continuous investor compliance, and privacy controls. I always assumed absolute transparency was ideal for blockchain, yet institutional investors simply cannot operate if their balances and strategies are totally public. Utilizing selective disclosure through zero-knowledge proofs allows me to see how a network can protect privacy while giving regulators instant verification. By handling onboarding, deterministic settlement, and compliance within the exact same layer, Dusk aims to manage the full asset lifecycle. I am still watching to see if traditional institutions can seamlessly integrate this complex infrastructure, but I now realize tokenization was merely the starting point.
#dusk $DUSK @Dusk $ENS
@Dusk I used to think tokenizing real-world assets was simple: just bring the asset on-chain and let it trade. The massive adoption numbers easily convinced me, but looking closer at Dusk completely shifted my perspective. I realized minting a token is actually the easy part; the real challenge begins afterward with post-trade settlement, continuous investor compliance, and privacy controls. I always assumed absolute transparency was ideal for blockchain, yet institutional investors simply cannot operate if their balances and strategies are totally public. Utilizing selective disclosure through zero-knowledge proofs allows me to see how a network can protect privacy while giving regulators instant verification. By handling onboarding, deterministic settlement, and compliance within the exact same layer, Dusk aims to manage the full asset lifecycle. I am still watching to see if traditional institutions can seamlessly integrate this complex infrastructure, but I now realize tokenization was merely the starting point.
#dusk $DUSK @Dusk $ENS
1
230
Войдите, чтобы посмотреть больше материала
Присоединяйтесь к пользователям криптовалют по всему миру на Binance Square
⚡️ Получайте новейшую и полезную информацию о криптоактивах.
💬 Нам доверяет крупнейшая в мире криптобиржа.
👍 Получите достоверные аналитические данные от верифицированных создателей контента.
Эл. почта/номер телефона
В тренде
USAugustPPIRisesLessThanExpected
Просмотров: 41
36 обсуждают
#usaugustppiriseslessthanexpected U.S. August PPI monthly rate: 0.4%, vs. an expected
0.40%; the previous reading was revised from 0.00% to 0.1%.
U.S.
August PPI annual rate: 5.4%, vs. an expected 5.3%; the previous reading was revised from 4.70% to 4.8%. The data weighed on gold prices, which fell below 4,350 once again! #PPI $IOST $TRIA $HEI
Isabella-I
·Лайков: 0
·Просмотров: 64
SECApprovesNasdaqTexasCommodityTrustRule
Просмотров: 1,457
112 обсуждают
ECBRaisesRatesSecondTimeTo2.5%
Просмотров: 661
73 обсуждают