
CryptoXCoin CoinXpert
14 Публикации

CryptoXCoin CoinXpert
Отправить жалобу
Заблокировать пользователя
1 подписок(и/а)
3 подписчиков(а)
2 понравилось
Посты
Все
Видео
Статья
PAXG/USDT Bullish Momentum 🚀 | Gold Price Breakout Incoming? 📈📊 PAXG/USDT Market Analysis – Gold Shows Bullish Momentum! Is a Breakout Coming?
Date: November 14, 2026
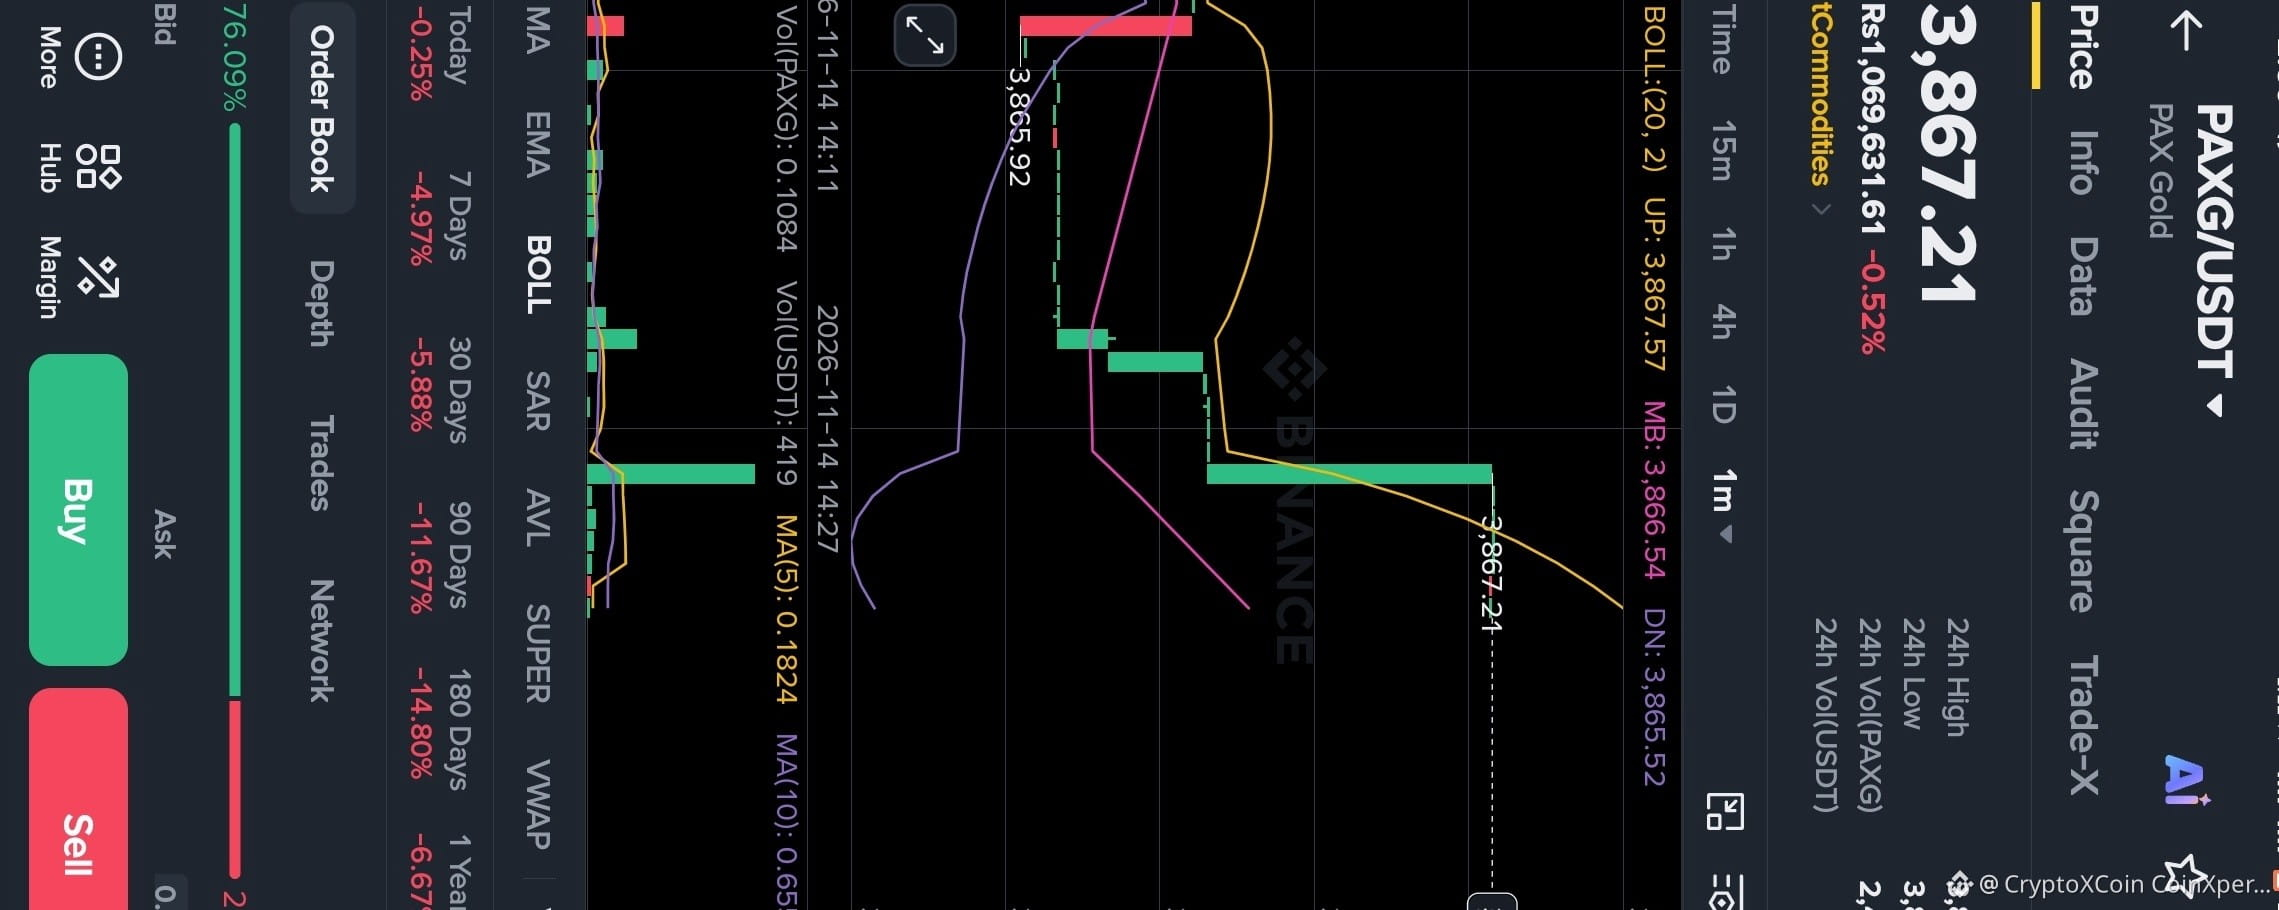
The PAXG/USDT market is showing noticeable bullish momentum on the 1-minute timeframe. According to the provided chart, PAX Gold is currently trading at 3,867.21 USDT, with a 24-hour high of 3,896.15 and a low of 3,859.80.
📈 Technical Analysis
The chart shows a strong recovery from approximately 3,865.92, followed by consecutive green candles pushing the price toward 3,867.21.
Bollinger Bands Analysis:
Upper Band: 3,867.57
Middle Band: 3,866.54
Lower Band: 3,865.52
The price is currently trading close to the upper Bollinger Band, indicating short-term buying pressure and potential bullish momentum.
🎯 Key Support & Resistance Levels
Resistance Levels:
3,867.57
3,868.00
3,869.00
Support Levels:
3,866.54
3,865.92
3,865.52
🔍 What Could Happen Next?
If PAXG successfully breaks above 3,867.57 and maintains its position, further upward movement could become possible.
However, if the price faces rejection near this resistance, a short-term pullback toward 3,866.54 or 3,865.92 may occur.
⚠️ Trading Strategy & Risk Management
Bullish momentum is visible, but traders should avoid making decisions based on a single large green candle.$PAXG
Before entering any trade, consider:
Trading volume confirmation.
The next candle's closing position.
Trend direction on higher timeframes.
Proper stop-loss and risk management.
Final Thoughts:
PAXG/USDT is showing promising short-term bullish activity. However, confirmation above resistance will be important before expecting further upside.
Remember: Successful trading is not about chasing the market. It's about patience, discipline, proper analysis, and smart risk management.
#PAXG #PAXGUSDT #GoldTrading #CryptoAnalysis #TechnicalAnalysis #Binance #TradingSignals
Disclaimer: This analysis is based on the provided chart screenshot and is for educational purposes only. It is not financial advice. Always manage your risk before trading.$PAXG
{future}(PAXGUSDT)
PAXG/USDT Bullish Momentum 🚀 | Gold Price Breakout Incoming? 📈
📊 PAXG/USDT Market Analysis – Gold Shows Bullish Momentum! Is a Breakout Coming?
Date: November 14, 2026
The PAXG/USDT market is showing noticeable bullish momentum on the 1-minute timeframe. According to the provided chart, PAX Gold is currently trading at 3,867.21 USDT, with a 24-hour high of 3,896.15 and a low of 3,859.80.
📈 Technical Analysis
The chart shows a strong recovery from approximately 3,865.92, followed by consecutive green candles pushing the price toward 3,867.21.
Bollinger Bands Analysis:
Upper Band: 3,867.57
Middle Band: 3,866.54
Lower Band: 3,865.52
The price is currently trading close to the upper Bollinger Band, indicating short-term buying pressure and potential bullish momentum.
🎯 Key Support & Resistance Levels
Resistance Levels:
3,867.57
3,868.00
3,869.00
Support Levels:
3,866.54
3,865.92
3,865.52
🔍 What Could Happen Next?
If PAXG successfully breaks above 3,867.57 and maintains its position, further upward movement could become possible.
However, if the price faces rejection near this resistance, a short-term pullback toward 3,866.54 or 3,865.92 may occur.
⚠️ Trading Strategy & Risk Management
Bullish momentum is visible, but traders should avoid making decisions based on a single large green candle.$PAXG
Before entering any trade, consider:
Trading volume confirmation.
The next candle's closing position.
Trend direction on higher timeframes.
Proper stop-loss and risk management.
Final Thoughts:
PAXG/USDT is showing promising short-term bullish activity. However, confirmation above resistance will be important before expecting further upside.
Remember: Successful trading is not about chasing the market. It's about patience, discipline, proper analysis, and smart risk management.
#PAXG #PAXGUSDT #GoldTrading #CryptoAnalysis #TechnicalAnalysis #Binance #TradingSignals
Disclaimer: This analysis is based on the provided chart screenshot and is for educational purposes only. It is not financial advice. Always manage your risk before trading.$PAXG
Date: November 14, 2026
The PAXG/USDT market is showing noticeable bullish momentum on the 1-minute timeframe. According to the provided chart, PAX Gold is currently trading at 3,867.21 USDT, with a 24-hour high of 3,896.15 and a low of 3,859.80.
📈 Technical Analysis
The chart shows a strong recovery from approximately 3,865.92, followed by consecutive green candles pushing the price toward 3,867.21.
Bollinger Bands Analysis:
Upper Band: 3,867.57
Middle Band: 3,866.54
Lower Band: 3,865.52
The price is currently trading close to the upper Bollinger Band, indicating short-term buying pressure and potential bullish momentum.
🎯 Key Support & Resistance Levels
Resistance Levels:
3,867.57
3,868.00
3,869.00
Support Levels:
3,866.54
3,865.92
3,865.52
🔍 What Could Happen Next?
If PAXG successfully breaks above 3,867.57 and maintains its position, further upward movement could become possible.
However, if the price faces rejection near this resistance, a short-term pullback toward 3,866.54 or 3,865.92 may occur.
⚠️ Trading Strategy & Risk Management
Bullish momentum is visible, but traders should avoid making decisions based on a single large green candle.$PAXG
Before entering any trade, consider:
Trading volume confirmation.
The next candle's closing position.
Trend direction on higher timeframes.
Proper stop-loss and risk management.
Final Thoughts:
PAXG/USDT is showing promising short-term bullish activity. However, confirmation above resistance will be important before expecting further upside.
Remember: Successful trading is not about chasing the market. It's about patience, discipline, proper analysis, and smart risk management.
#PAXG #PAXGUSDT #GoldTrading #CryptoAnalysis #TechnicalAnalysis #Binance #TradingSignals
Disclaimer: This analysis is based on the provided chart screenshot and is for educational purposes only. It is not financial advice. Always manage your risk before trading.$PAXG
158
Статья
PEPE/USDT Price Analysis – Bearish Trend Continues, Can Buyers Make a Comeback?PEPE/USDT Market Analysis 🐸
$PEPE
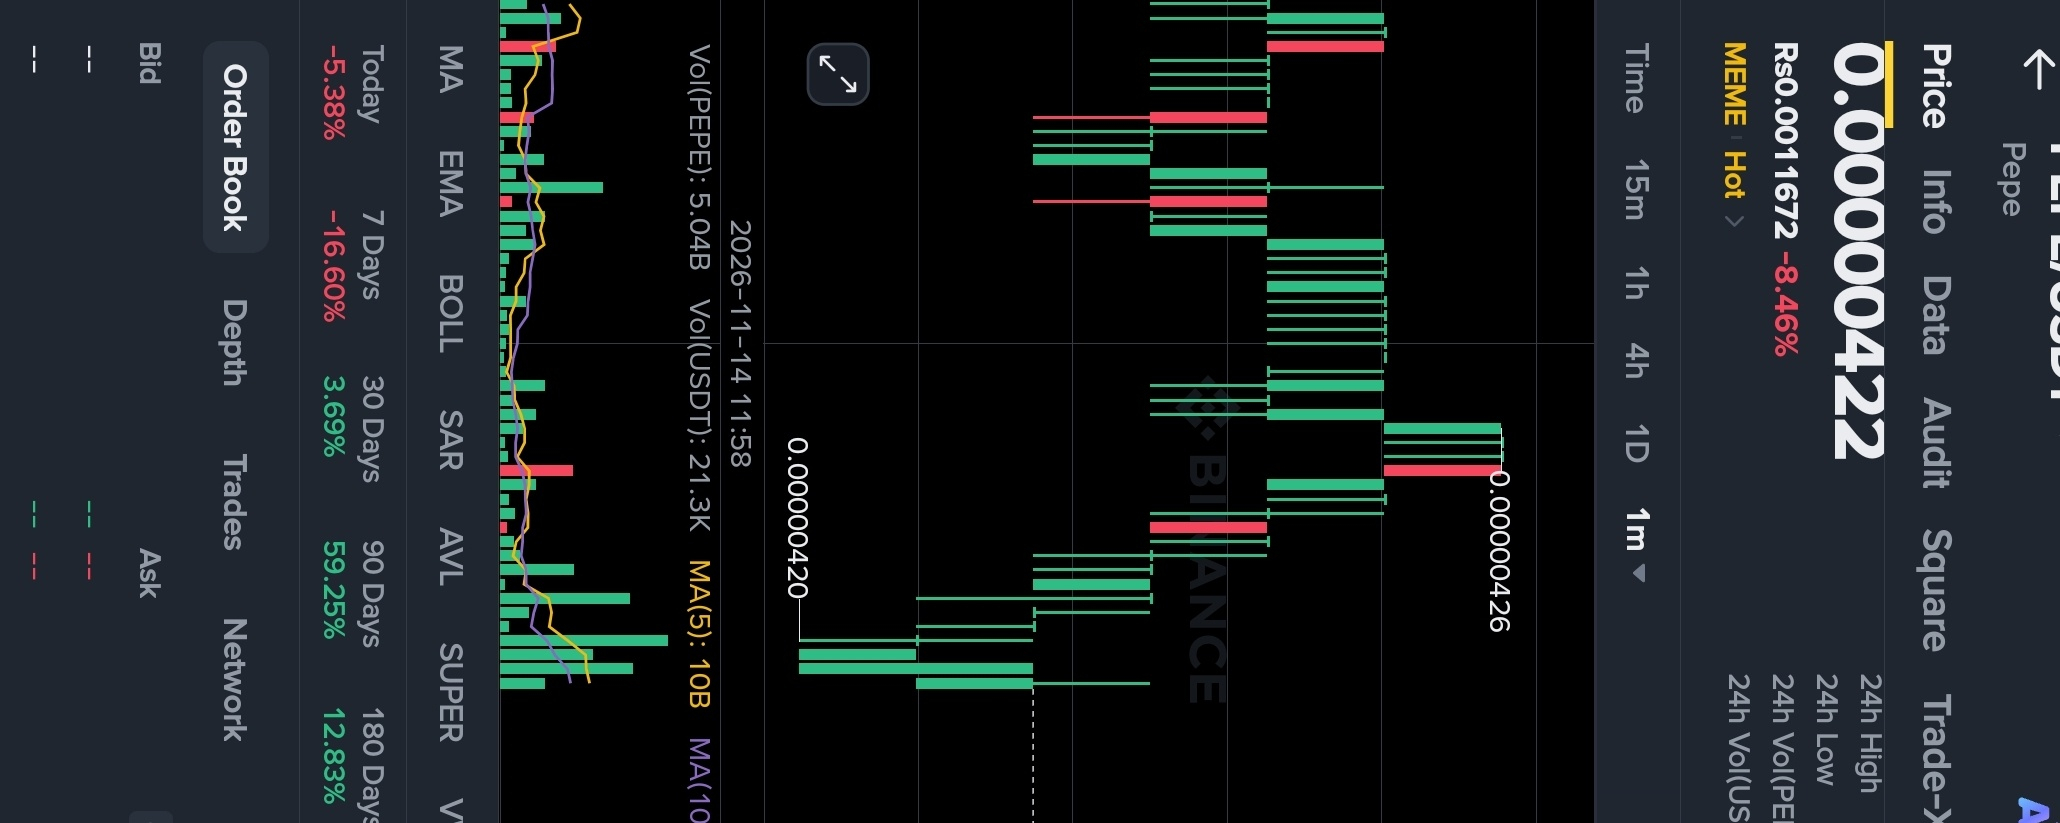
Current Price: 0.00000422 USDT
24H Change: -8.46%
Market Overview
PEPE/USDT is currently showing bearish momentum on the 1-minute chart. Sellers have pushed the price down from the recent high of 0.00000426 toward the support zone around 0.00000420.
A small recovery is visible, with buyers attempting to push the price back toward 0.00000422. However, buying pressure still needs confirmation.
Trend Direction 📉
Short-Term Trend: BEARISH
The market structure currently favors sellers. Unless PEPE breaks above nearby resistance with strong volume, downside pressure may continue.
Important Price Levels
- Support: 0.00000420 – 0.00000419
- Resistance: 0.00000424 – 0.00000426
- Current Price: 0.00000422
What to Expect Next?
If the price breaks below 0.00000420, further downside movement could develop. On the other hand, a strong move above 0.00000424 may indicate a short-term recovery toward 0.00000426.
Final Analysis
PEPE is currently in a short-term bearish phase, while buyers are trying to defend the support zone. Traders should watch volume and key price levels before making any decision.
Market Bias: BEARISH 📉donw trand
This analysis is based on the provided chart and is for educational purposes only, not financial advice.$PEPE
{alpha}(nullnull)
PEPE/USDT Price Analysis – Bearish Trend Continues, Can Buyers Make a Comeback?
PEPE/USDT Market Analysis 🐸
$PEPE
Current Price: 0.00000422 USDT
24H Change: -8.46%
Market Overview
PEPE/USDT is currently showing bearish momentum on the 1-minute chart. Sellers have pushed the price down from the recent high of 0.00000426 toward the support zone around 0.00000420.
A small recovery is visible, with buyers attempting to push the price back toward 0.00000422. However, buying pressure still needs confirmation.
Trend Direction 📉
Short-Term Trend: BEARISH
The market structure currently favors sellers. Unless PEPE breaks above nearby resistance with strong volume, downside pressure may continue.
Important Price Levels
- Support: 0.00000420 – 0.00000419
- Resistance: 0.00000424 – 0.00000426
- Current Price: 0.00000422
What to Expect Next?
If the price breaks below 0.00000420, further downside movement could develop. On the other hand, a strong move above 0.00000424 may indicate a short-term recovery toward 0.00000426.
Final Analysis
PEPE is currently in a short-term bearish phase, while buyers are trying to defend the support zone. Traders should watch volume and key price levels before making any decision.
Market Bias: BEARISH 📉donw trand
This analysis is based on the provided chart and is for educational purposes only, not financial advice.$PEPE
$PEPE
Current Price: 0.00000422 USDT
24H Change: -8.46%
Market Overview
PEPE/USDT is currently showing bearish momentum on the 1-minute chart. Sellers have pushed the price down from the recent high of 0.00000426 toward the support zone around 0.00000420.
A small recovery is visible, with buyers attempting to push the price back toward 0.00000422. However, buying pressure still needs confirmation.
Trend Direction 📉
Short-Term Trend: BEARISH
The market structure currently favors sellers. Unless PEPE breaks above nearby resistance with strong volume, downside pressure may continue.
Important Price Levels
- Support: 0.00000420 – 0.00000419
- Resistance: 0.00000424 – 0.00000426
- Current Price: 0.00000422
What to Expect Next?
If the price breaks below 0.00000420, further downside movement could develop. On the other hand, a strong move above 0.00000424 may indicate a short-term recovery toward 0.00000426.
Final Analysis
PEPE is currently in a short-term bearish phase, while buyers are trying to defend the support zone. Traders should watch volume and key price levels before making any decision.
Market Bias: BEARISH 📉donw trand
This analysis is based on the provided chart and is for educational purposes only, not financial advice.$PEPE
86
Частичная правда
Статья
Gold at a Critical Turning Point 🔥 | Bulls vs Bears – Who Will Win?🥇 XAUUSDT Gold Analysis: Bulls vs Bears – What’s Next?
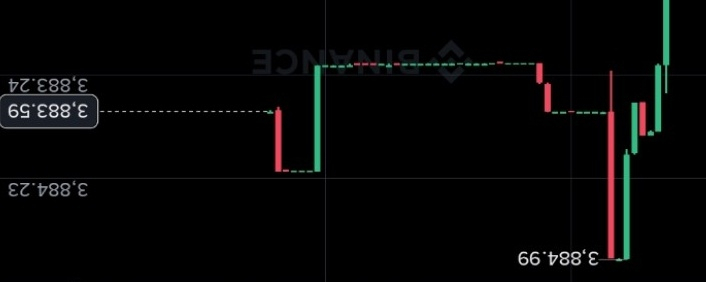
Gold (XAUUSDT) is showing short-term volatility, with price currently trading around 3,883.58 USDT on the 1-minute chart.
📊 Market Overview
$XAUT Gold recently made a quick upward move toward 3,884.99, but sellers stepped in and pushed the price back toward 3,883.59. This suggests that buyers are facing resistance at higher levels.
🔍 Key Levels to Watch
- Resistance: 3,884.23 – 3,884.99
- Support: 3,883.24 – 3,882.26
- Major Support: 3,881.27
📈 Market Outlook
If buyers regain momentum and price breaks above 3,884.99, bullish momentum could increase.
However, if sellers maintain control and price moves below 3,883.24, further downside pressure may develop toward the next support zone.
⚡ Final Thoughts
Gold is currently showing a battle between buyers and sellers. Traders should wait for a clear breakout or breakdown confirmation instead of making decisions based on a single candle.$XAG
Stay patient, manage risk, and always follow market confirmation.
#XAUUSDT #GoldAnalysis #BinanceSquare #TradingView #CryptoMarketxauus $XAU
{future}(XAUUSDT)
Gold at a Critical Turning Point 🔥 | Bulls vs Bears – Who Will Win?
🥇 XAUUSDT Gold Analysis: Bulls vs Bears – What’s Next?
Gold (XAUUSDT) is showing short-term volatility, with price currently trading around 3,883.58 USDT on the 1-minute chart.
📊 Market Overview
$XAUT Gold recently made a quick upward move toward 3,884.99, but sellers stepped in and pushed the price back toward 3,883.59. This suggests that buyers are facing resistance at higher levels.
🔍 Key Levels to Watch
- Resistance: 3,884.23 – 3,884.99
- Support: 3,883.24 – 3,882.26
- Major Support: 3,881.27
📈 Market Outlook
If buyers regain momentum and price breaks above 3,884.99, bullish momentum could increase.
However, if sellers maintain control and price moves below 3,883.24, further downside pressure may develop toward the next support zone.
⚡ Final Thoughts
Gold is currently showing a battle between buyers and sellers. Traders should wait for a clear breakout or breakdown confirmation instead of making decisions based on a single candle.$XAG
Stay patient, manage risk, and always follow market confirmation.
#XAUUSDT #GoldAnalysis #BinanceSquare #TradingView #CryptoMarketxauus $XAU
Gold (XAUUSDT) is showing short-term volatility, with price currently trading around 3,883.58 USDT on the 1-minute chart.
📊 Market Overview
$XAUT Gold recently made a quick upward move toward 3,884.99, but sellers stepped in and pushed the price back toward 3,883.59. This suggests that buyers are facing resistance at higher levels.
🔍 Key Levels to Watch
- Resistance: 3,884.23 – 3,884.99
- Support: 3,883.24 – 3,882.26
- Major Support: 3,881.27
📈 Market Outlook
If buyers regain momentum and price breaks above 3,884.99, bullish momentum could increase.
However, if sellers maintain control and price moves below 3,883.24, further downside pressure may develop toward the next support zone.
⚡ Final Thoughts
Gold is currently showing a battle between buyers and sellers. Traders should wait for a clear breakout or breakdown confirmation instead of making decisions based on a single candle.$XAG
Stay patient, manage risk, and always follow market confirmation.
#XAUUSDT #GoldAnalysis #BinanceSquare #TradingView #CryptoMarketxauus $XAU
1
1
657
Статья
AKEUSDT Market Analysis: Massive Rally Followed by a Sharp Correction!
AKEUSDT has attracted signifAKEUSDT Market Analysis: Massive Rally Followed by a Sharp Correction!
$AKE
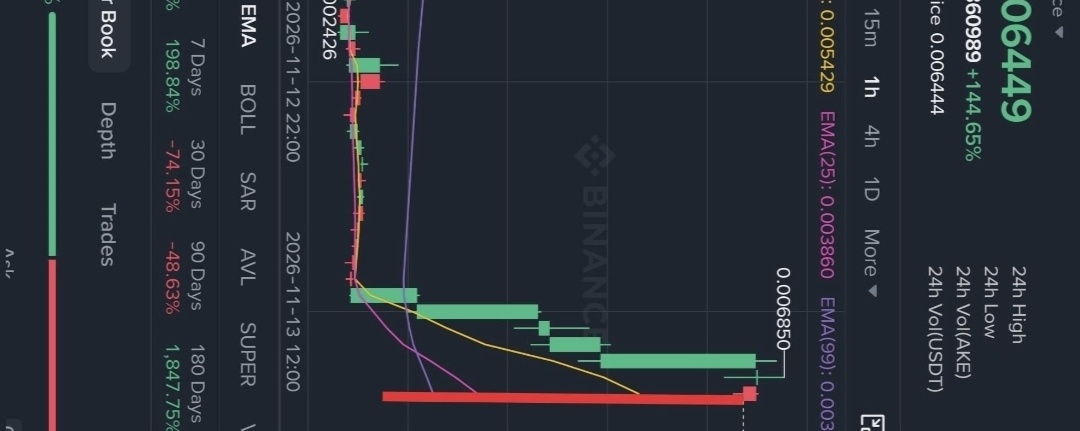
AKEUSDT has attracted significant market attention after an impressive bullish move. According to the chart, the token surged from approximately $0.002426 to $0.006850, recording a massive price increase.
📊 Key Market Highlights
- Current Price: $0.006449
- 24H High: $0.006850
- 24H Low: $0.002492
- 24H Performance: +142.17%
- 7-Day Performance: +198.84%
- 24H Trading Volume: 80.31B AKE
📈 Technical Analysis
The 1-hour chart shows a powerful bullish breakout, with price moving above the EMA(7), EMA(25), and EMA(99).
However, a sharp red candle appeared after the rally, indicating strong selling pressure and possible profit-taking.
🔑 Important Price Levels
- Resistance: $0.006850
- Immediate Support: $0.005429
- Next Support: $0.003860
- Major Support: $0.003426
🔮 What Could Happen Next?
If AKEUSDT holds above its important support levels and buying volume returns, another bullish attempt could develop.
However, continued selling pressure may lead to further correction. Traders should wait for price stabilization and confirmation before making decisions.
🎯 Final Outlook
AKEUSDT is showing high volatility after a massive rally. The next move will depend on whether buyers can defend key support zones or sellers take control.$AKE
Watch the $0.006850 resistance and $0.005429 support closely.
Educational marke$akt analysis only. Not financial advice.$AKE
{future}(AKEUSDT)
Chak this chart 📉 📈 📊✅
AKEUSDT Market Analysis: Massive Rally Followed by a Sharp Correction! AKEUSDT has attracted signif
AKEUSDT Market Analysis: Massive Rally Followed by a Sharp Correction!
$AKE
AKEUSDT has attracted significant market attention after an impressive bullish move. According to the chart, the token surged from approximately $0.002426 to $0.006850, recording a massive price increase.
📊 Key Market Highlights
- Current Price: $0.006449
- 24H High: $0.006850
- 24H Low: $0.002492
- 24H Performance: +142.17%
- 7-Day Performance: +198.84%
- 24H Trading Volume: 80.31B AKE
📈 Technical Analysis
The 1-hour chart shows a powerful bullish breakout, with price moving above the EMA(7), EMA(25), and EMA(99).
However, a sharp red candle appeared after the rally, indicating strong selling pressure and possible profit-taking.
🔑 Important Price Levels
- Resistance: $0.006850
- Immediate Support: $0.005429
- Next Support: $0.003860
- Major Support: $0.003426
🔮 What Could Happen Next?
If AKEUSDT holds above its important support levels and buying volume returns, another bullish attempt could develop.
However, continued selling pressure may lead to further correction. Traders should wait for price stabilization and confirmation before making decisions.
🎯 Final Outlook
AKEUSDT is showing high volatility after a massive rally. The next move will depend on whether buyers can defend key support zones or sellers take control.$AKE
Watch the $0.006850 resistance and $0.005429 support closely.
Educational marke$akt analysis only. Not financial advice.$AKE
Chak this chart 📉 📈 📊✅
$AKE
AKEUSDT has attracted significant market attention after an impressive bullish move. According to the chart, the token surged from approximately $0.002426 to $0.006850, recording a massive price increase.
📊 Key Market Highlights
- Current Price: $0.006449
- 24H High: $0.006850
- 24H Low: $0.002492
- 24H Performance: +142.17%
- 7-Day Performance: +198.84%
- 24H Trading Volume: 80.31B AKE
📈 Technical Analysis
The 1-hour chart shows a powerful bullish breakout, with price moving above the EMA(7), EMA(25), and EMA(99).
However, a sharp red candle appeared after the rally, indicating strong selling pressure and possible profit-taking.
🔑 Important Price Levels
- Resistance: $0.006850
- Immediate Support: $0.005429
- Next Support: $0.003860
- Major Support: $0.003426
🔮 What Could Happen Next?
If AKEUSDT holds above its important support levels and buying volume returns, another bullish attempt could develop.
However, continued selling pressure may lead to further correction. Traders should wait for price stabilization and confirmation before making decisions.
🎯 Final Outlook
AKEUSDT is showing high volatility after a massive rally. The next move will depend on whether buyers can defend key support zones or sellers take control.$AKE
Watch the $0.006850 resistance and $0.005429 support closely.
Educational marke$akt analysis only. Not financial advice.$AKE
Chak this chart 📉 📈 📊✅
526
Статья
Bitcoin (BTC) Weekly Chart Analysis: Elliott Wave Structure Signals a Potential Bullish ContinuationBitcoin (BTC) Weekly Chart Analysis: Bulls Eye the Next Major Resistance!
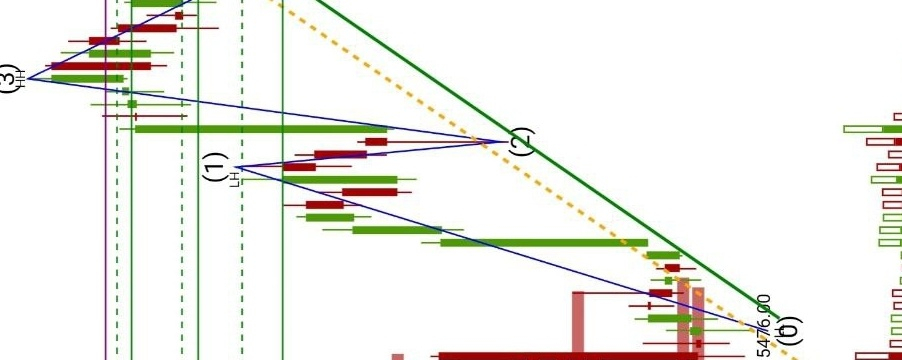
Bitcoin's weekly chart is showing an interesting bullish Elliott Wave structure. The price action has completed several important wave movements, with Wave (3) reaching a high near $31,804 before entering a correction.
📊 Technical Analysis
The chart highlights a possible five-wave bullish structure:$BTC
- Wave (0): The initial base formed near $15,476.
- Wave (1): Bitcoin started a strong upward move.
- Wave (2): A corrective pullback followed.
- Wave (3): A powerful bullish rally pushed the price toward $31,804.
- Wave (4): The market experienced another correction before attempting to recover.
🔑 Important Support Levels
- $28,584 – Immediate price area
- $26,336 – Important support
- $25,235 – Secondary support
- $24,285 – Major trend support
🎯 Resistance Levels
The $30,000 zone is an important resistance area, while $31,804 is the previous major high. A sustained breakout above these levels could strengthen the bullish outlook.
📈 Market Outlook$BTC
Bitcoin's broader weekly structure appears bullish as long as the rising trendline and important support zones remain intact. However, a breakdown below major support could weaken the current bullish setup.
Conclusion: Bitcoin is approaching an important decision zone. Traders should watch the support trendline, volume, and resistance breakout for confirmation before considering the next market direction.
This is technical chart analysis for educational purposes, not financial advice.$ETH
Bitcoin (BTC) Weekly Chart Analysis: Elliott Wave Structure Signals a Potential Bullish Continuation
Bitcoin (BTC) Weekly Chart Analysis: Bulls Eye the Next Major Resistance!
Bitcoin's weekly chart is showing an interesting bullish Elliott Wave structure. The price action has completed several important wave movements, with Wave (3) reaching a high near $31,804 before entering a correction.
📊 Technical Analysis
The chart highlights a possible five-wave bullish structure:$BTC
- Wave (0): The initial base formed near $15,476.
- Wave (1): Bitcoin started a strong upward move.
- Wave (2): A corrective pullback followed.
- Wave (3): A powerful bullish rally pushed the price toward $31,804.
- Wave (4): The market experienced another correction before attempting to recover.
🔑 Important Support Levels
- $28,584 – Immediate price area
- $26,336 – Important support
- $25,235 – Secondary support
- $24,285 – Major trend support
🎯 Resistance Levels
The $30,000 zone is an important resistance area, while $31,804 is the previous major high. A sustained breakout above these levels could strengthen the bullish outlook.
📈 Market Outlook$BTC
Bitcoin's broader weekly structure appears bullish as long as the rising trendline and important support zones remain intact. However, a breakdown below major support could weaken the current bullish setup.
Conclusion: Bitcoin is approaching an important decision zone. Traders should watch the support trendline, volume, and resistance breakout for confirmation before considering the next market direction.
This is technical chart analysis for educational purposes, not financial advice.$ETH
Bitcoin's weekly chart is showing an interesting bullish Elliott Wave structure. The price action has completed several important wave movements, with Wave (3) reaching a high near $31,804 before entering a correction.
📊 Technical Analysis
The chart highlights a possible five-wave bullish structure:$BTC
- Wave (0): The initial base formed near $15,476.
- Wave (1): Bitcoin started a strong upward move.
- Wave (2): A corrective pullback followed.
- Wave (3): A powerful bullish rally pushed the price toward $31,804.
- Wave (4): The market experienced another correction before attempting to recover.
🔑 Important Support Levels
- $28,584 – Immediate price area
- $26,336 – Important support
- $25,235 – Secondary support
- $24,285 – Major trend support
🎯 Resistance Levels
The $30,000 zone is an important resistance area, while $31,804 is the previous major high. A sustained breakout above these levels could strengthen the bullish outlook.
📈 Market Outlook$BTC
Bitcoin's broader weekly structure appears bullish as long as the rising trendline and important support zones remain intact. However, a breakdown below major support could weaken the current bullish setup.
Conclusion: Bitcoin is approaching an important decision zone. Traders should watch the support trendline, volume, and resistance breakout for confirmation before considering the next market direction.
This is technical chart analysis for educational purposes, not financial advice.$ETH
90
Статья
ETH Breakdown – Sellers Are Still in Control! 📉🔴 ETH/USDT – Bearish Momentum Continues 📉
Ethereum is showing strong bearish momentum on the 1-minute chart.
Technical Analysis:$ETH
- Current Price: $1,925.20
- Previous High: $1,953.62
- Recent Low: $1,915.43
- Resistance Zone: $1,930–$1,938
- Support Zone: $1,915–$1,920
Market Struct$:
$ETH has formed lower highs and lower lows, indicating continued selling pressure. After reaching $1,915.43, price attempted a small recovery, but bearish pressure remains important.
Key Levels to Watch:
- Above $1,930: Possible short-term recovery.
- Below $1,915: Possible further downside.
- Rejection near resistance: Bearish continuation may follow.
Final Outlook: 🔴 BEARISH
Sellers currently have the advantage, but wait for candle confirmation before making any trading decision.
This is technical analysis, not a guaranteed price prediction.$ETH
{spot}(ETHUSDT)
ETH Breakdown – Sellers Are Still in Control! 📉
🔴 ETH/USDT – Bearish Momentum Continues 📉
Ethereum is showing strong bearish momentum on the 1-minute chart.
Technical Analysis:$ETH
- Current Price: $1,925.20
- Previous High: $1,953.62
- Recent Low: $1,915.43
- Resistance Zone: $1,930–$1,938
- Support Zone: $1,915–$1,920
Market Struct$:
$ETH has formed lower highs and lower lows, indicating continued selling pressure. After reaching $1,915.43, price attempted a small recovery, but bearish pressure remains important.
Key Levels to Watch:
- Above $1,930: Possible short-term recovery.
- Below $1,915: Possible further downside.
- Rejection near resistance: Bearish continuation may follow.
Final Outlook: 🔴 BEARISH
Sellers currently have the advantage, but wait for candle confirmation before making any trading decision.
This is technical analysis, not a guaranteed price prediction.$ETH
Ethereum is showing strong bearish momentum on the 1-minute chart.
Technical Analysis:$ETH
- Current Price: $1,925.20
- Previous High: $1,953.62
- Recent Low: $1,915.43
- Resistance Zone: $1,930–$1,938
- Support Zone: $1,915–$1,920
Market Struct$:
$ETH has formed lower highs and lower lows, indicating continued selling pressure. After reaching $1,915.43, price attempted a small recovery, but bearish pressure remains important.
Key Levels to Watch:
- Above $1,930: Possible short-term recovery.
- Below $1,915: Possible further downside.
- Rejection near resistance: Bearish continuation may follow.
Final Outlook: 🔴 BEARISH
Sellers currently have the advantage, but wait for candle confirmation before making any trading decision.
This is technical analysis, not a guaranteed price prediction.$ETH
14
# 🚨 BITCOIN: THE BEAR TRAP MAY BE HERE!
Bitcoin is showing an interesting move, and the next few levels could be very important.
I previously highlighted the possibility of a drop below $75K, with $71K as the next key support level. Now, all eyes are on what Bitcoin does next.
**My current market outlook:**
📉 $71K → $67K — Potential Bear Trap
📈 $67K → $100K → $114K — Possible bullish recovery targets
The market can change quickly, so don't rush into trades. Watch the key levels, manage your risk, and wait for confirmation before making any decisions.
Stay alert for the next Bitcoin update!
**$BTC** 🚀$BTC
# 🚨 BITCOIN: THE BEAR TRAP MAY BE HERE!
Bitcoin is showing an interesting move, and the next few levels could be very important.
I previously highlighted the possibility of a drop below $75K, with $71K as the next key support level. Now, all eyes are on what Bitcoin does next.
**My current market outlook:**
📉 $71K → $67K — Potential Bear Trap
📈 $67K → $100K → $114K — Possible bullish recovery targets
The market can change quickly, so don't rush into trades. Watch the key levels, manage your risk, and wait for confirmation before making any decisions.
Stay alert for the next Bitcoin update!
**$BTC ** 🚀$BTC
Bitcoin is showing an interesting move, and the next few levels could be very important.
I previously highlighted the possibility of a drop below $75K, with $71K as the next key support level. Now, all eyes are on what Bitcoin does next.
**My current market outlook:**
📉 $71K → $67K — Potential Bear Trap
📈 $67K → $100K → $114K — Possible bullish recovery targets
The market can change quickly, so don't rush into trades. Watch the key levels, manage your risk, and wait for confirmation before making any decisions.
Stay alert for the next Bitcoin update!
**$BTC ** 🚀$BTC

22
🔥 Three Touches Trendline – The Last Kiss Before the Downtrend 📉
Three Touches. One Trendline. One Final Kiss.in $BTC
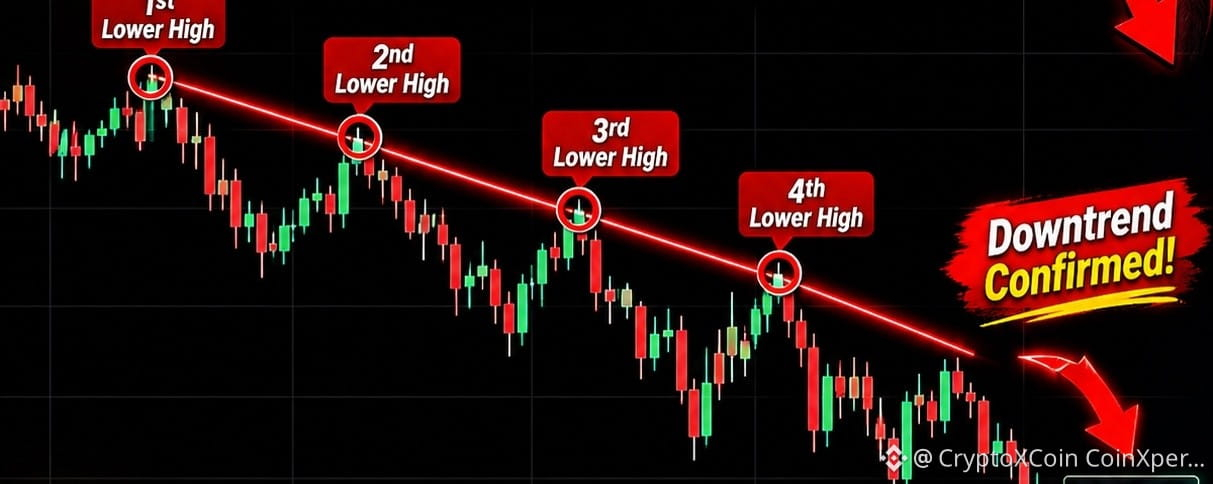
Price tested the upper resistance trendline three times, showing strong selling pressure at the same level.
Each touch created a rejection, while the candlesticks showed that buyers were losing momentum.
The final kiss (retest) at the trendline became an important moment. After rejection, $BTC
Key Technical Points:
- 3 Touches at Trendline Resistance
- Candlestick Rejection
- Final Trendline Kiss (Retest)
- Sellers Taking Control
- Bearish Trend Continuation 📉
🔥 Three Touches Trendline – The Last Kiss Before the Downtrend 📉
Three Touches. One Trendline. One Final Kiss.in $BTC
Price tested the upper resistance trendline three times, showing strong selling pressure at the same level.
Each touch created a rejection, while the candlesticks showed that buyers were losing momentum.
The final kiss (retest) at the trendline became an important moment. After rejection, $BTC
Key Technical Points:
- 3 Touches at Trendline Resistance
- Candlestick Rejection
- Final Trendline Kiss (Retest)
- Sellers Taking Control
- Bearish Trend Continuation 📉
Three Touches. One Trendline. One Final Kiss.in $BTC
Price tested the upper resistance trendline three times, showing strong selling pressure at the same level.
Each touch created a rejection, while the candlesticks showed that buyers were losing momentum.
The final kiss (retest) at the trendline became an important moment. After rejection, $BTC
Key Technical Points:
- 3 Touches at Trendline Resistance
- Candlestick Rejection
- Final Trendline Kiss (Retest)
- Sellers Taking Control
- Bearish Trend Continuation 📉
38
·
--
Рост
XAUT/USDT 🚀 | GOLD IS SHOWING STRENGTH!
Gold is making an interesting move right now. XAUT is trading around $3,875.67 after recovering from the $3,866 support area.
Buyers have pushed the price higher toward $3,877, but a small pullback is now visible.
Important Levels to Watch:
- Current Price: $3,875.67
- Resistance: $3,877.16
- Support: $3,872.81
- Major Support: $3,866.00
My Market View:
If buyers manage to break above $3,877 and hold that level, we could see another upward move.
However, if momentum slows down, price may revisit nearby support zones.
For now, I'm watching the next candle closely. No rushing into trades without confirmation.
Stay focused. Follow the trend, not the noise! 📊#BitcoinCoreDisclosesTorTrafficVulnerability
XAUT/USDT 🚀 | GOLD IS SHOWING STRENGTH!
Gold is making an interesting move right now. XAUT is trading around $3,875.67 after recovering from the $3,866 support area.
Buyers have pushed the price higher toward $3,877, but a small pullback is now visible.
Important Levels to Watch:
- Current Price: $3,875.67
- Resistance: $3,877.16
- Support: $3,872.81
- Major Support: $3,866.00
My Market View:
If buyers manage to break above $3,877 and hold that level, we could see another upward move.
However, if momentum slows down, price may revisit nearby support zones.
For now, I'm watching the next candle closely. No rushing into trades without confirmation.
Stay focused. Follow the trend, not the noise! 📊#BitcoinCoreDisclosesTorTrafficVulnerability
Gold is making an interesting move right now. XAUT is trading around $3,875.67 after recovering from the $3,866 support area.
Buyers have pushed the price higher toward $3,877, but a small pullback is now visible.
Important Levels to Watch:
- Current Price: $3,875.67
- Resistance: $3,877.16
- Support: $3,872.81
- Major Support: $3,866.00
My Market View:
If buyers manage to break above $3,877 and hold that level, we could see another upward move.
However, if momentum slows down, price may revisit nearby support zones.
For now, I'm watching the next candle closely. No rushing into trades without confirmation.
Stay focused. Follow the trend, not the noise! 📊#BitcoinCoreDisclosesTorTrafficVulnerability
5
Статья
XAUT/USDT 🚀 GOLD BULLISH BREAKOUT | NEXT MOVE 3,880+?
Caption: Gold is shXAUT/USDT 🚀 | GOLD IS SHOWING STRENGTH!$GOLD.US
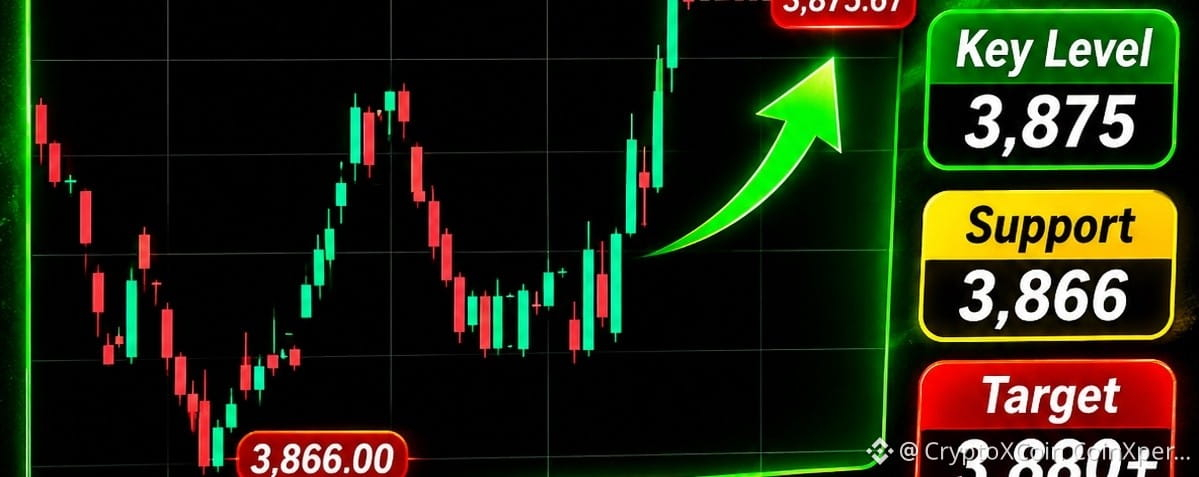
Gold is making an interesting move right now. XAUT is trading around $3,875.67 after recovering from the $3,866 support area.
Buyers have pushed the price higher toward $3,877, but a small pullback is now visible.
Important Levels to Watch:
- Current Price: $3,875.67
- Resistance: $3,877.16
- Support: $3,872.81
- Major Support: $3,866.00
My Market View:
If buyers manage to break above $3,877 and hold that level, we could see another upward move.
However, if momentum slows down, price may revisit nearby support zones.$GOLD.US
For now, I'm watching the next candle closely. #SpaceXTeslaMergerTalksWouldCombine30220BTC No rushing into trades without confirmation.
Stay focused. Follow the trend, not the noise! 📊
XAUT/USDT 🚀 GOLD BULLISH BREAKOUT | NEXT MOVE 3,880+? Caption: Gold is sh
XAUT/USDT 🚀 | GOLD IS SHOWING STRENGTH!$GOLD.US
Gold is making an interesting move right now. XAUT is trading around $3,875.67 after recovering from the $3,866 support area.
Buyers have pushed the price higher toward $3,877, but a small pullback is now visible.
Important Levels to Watch:
- Current Price: $3,875.67
- Resistance: $3,877.16
- Support: $3,872.81
- Major Support: $3,866.00
My Market View:
If buyers manage to break above $3,877 and hold that level, we could see another upward move.
However, if momentum slows down, price may revisit nearby support zones.$GOLD.US
For now, I'm watching the next candle closely. #SpaceXTeslaMergerTalksWouldCombine30220BTC No rushing into trades without confirmation.
Stay focused. Follow the trend, not the noise! 📊
Gold is making an interesting move right now. XAUT is trading around $3,875.67 after recovering from the $3,866 support area.
Buyers have pushed the price higher toward $3,877, but a small pullback is now visible.
Important Levels to Watch:
- Current Price: $3,875.67
- Resistance: $3,877.16
- Support: $3,872.81
- Major Support: $3,866.00
My Market View:
If buyers manage to break above $3,877 and hold that level, we could see another upward move.
However, if momentum slows down, price may revisit nearby support zones.$GOLD.US
For now, I'm watching the next candle closely. #SpaceXTeslaMergerTalksWouldCombine30220BTC No rushing into trades without confirmation.
Stay focused. Follow the trend, not the noise! 📊
1
251
Статья
BTC/USDT WARNING ⚠️ | Bitcoin Faces Strong Selling Pressure$BTC /USDT UPDATE 📉 | Market Under Pressure
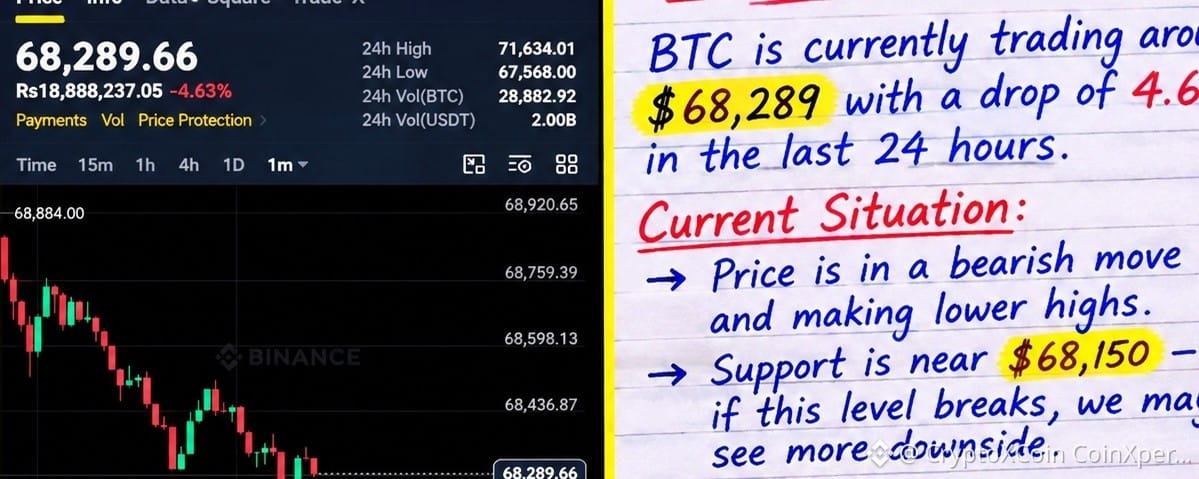
Bitcoin is showing weakness right now. BTC is trading around $68,289, with sellers still putting pressure on the market.
On the 1-minute chart, we can see a clear downward move. Price recently touched the $68,151 area and bounced slightly, but buyers haven't shown strong confirmation yet.
Key Levels to Watch:
- Support: $68,151
- Resistance: $68,436
- Next Resistance: $68,598
For now, I'm watching how BTC reacts around these levels. A strong move above resistance could bring some recovery, while losing support may create further downside pressure.$ETH
No need to rush. Let the market show its direction first.
Stay patient. Protect your capital. Trade with a plan. 📊$BTC
{future}(BTCUSDT)
BTC/USDT WARNING ⚠️ | Bitcoin Faces Strong Selling Pressure
$BTC /USDT UPDATE 📉 | Market Under Pressure
Bitcoin is showing weakness right now. BTC is trading around $68,289, with sellers still putting pressure on the market.
On the 1-minute chart, we can see a clear downward move. Price recently touched the $68,151 area and bounced slightly, but buyers haven't shown strong confirmation yet.
Key Levels to Watch:
- Support: $68,151
- Resistance: $68,436
- Next Resistance: $68,598
For now, I'm watching how BTC reacts around these levels. A strong move above resistance could bring some recovery, while losing support may create further downside pressure.$ETH
No need to rush. Let the market show its direction first.
Stay patient. Protect your capital. Trade with a plan. 📊$BTC
Bitcoin is showing weakness right now. BTC is trading around $68,289, with sellers still putting pressure on the market.
On the 1-minute chart, we can see a clear downward move. Price recently touched the $68,151 area and bounced slightly, but buyers haven't shown strong confirmation yet.
Key Levels to Watch:
- Support: $68,151
- Resistance: $68,436
- Next Resistance: $68,598
For now, I'm watching how BTC reacts around these levels. A strong move above resistance could bring some recovery, while losing support may create further downside pressure.$ETH
No need to rush. Let the market show its direction first.
Stay patient. Protect your capital. Trade with a plan. 📊$BTC
43
Статья
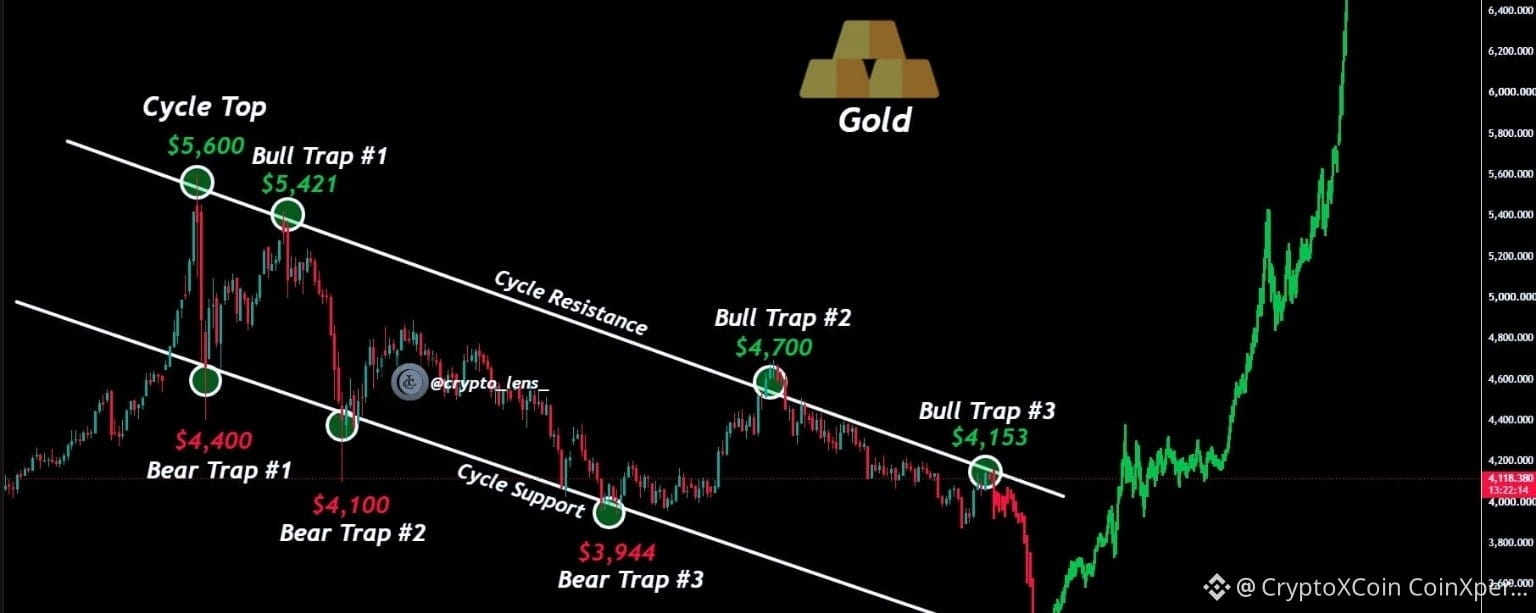
GOLD PRICE WARNING ⚠️ | A Major Move Could Be Coming
Caption: Don't Follow the Crowd — Watch**GOLD UPDATE ⚠️ | A Critical Level to Watch**
Gold is currently sitting at a very important price zone. The market may look bullish, but a reversal could still be on the table.
We've seen similar market setups before, so don't rush into buying without confirmation. Smart traders stay patient and protect their capital.
**My market outlook is still the same:**
🎯 $4,116 → $3,800 → $3,600 → $3,400 → New Bullish Cycle
Keep an eye on these levels and watch how the market reacts in the coming weeks.
Don't follow the crowd blindly. Trade with patience, discipline, and a clear strategy.
I'll keep sharing important GOLD updates here. Stay tuned! 📊$GOLD.US
Title: GOLD PRICE WARNING ⚠️ | A Major Move Could Be Comin
$GOLD.US
{stock_us}(GOLD.US)
GOLD PRICE WARNING ⚠️ | A Major Move Could Be Coming Caption: Don't Follow the Crowd — Watch
**GOLD UPDATE ⚠️ | A Critical Level to Watch**
Gold is currently sitting at a very important price zone. The market may look bullish, but a reversal could still be on the table.
We've seen similar market setups before, so don't rush into buying without confirmation. Smart traders stay patient and protect their capital.
**My market outlook is still the same:**
🎯 $4,116 → $3,800 → $3,600 → $3,400 → New Bullish Cycle
Keep an eye on these levels and watch how the market reacts in the coming weeks.
Don't follow the crowd blindly. Trade with patience, discipline, and a clear strategy.
I'll keep sharing important GOLD updates here. Stay tuned! 📊$GOLD.US
Title: GOLD PRICE WARNING ⚠️ | A Major Move Could Be Comin
$GOLD.US
Gold is currently sitting at a very important price zone. The market may look bullish, but a reversal could still be on the table.
We've seen similar market setups before, so don't rush into buying without confirmation. Smart traders stay patient and protect their capital.
**My market outlook is still the same:**
🎯 $4,116 → $3,800 → $3,600 → $3,400 → New Bullish Cycle
Keep an eye on these levels and watch how the market reacts in the coming weeks.
Don't follow the crowd blindly. Trade with patience, discipline, and a clear strategy.
I'll keep sharing important GOLD updates here. Stay tuned! 📊$GOLD.US
Title: GOLD PRICE WARNING ⚠️ | A Major Move Could Be Comin
$GOLD.US
XAU+0,64%
GLDETF+0,06%
1.1k
Статья
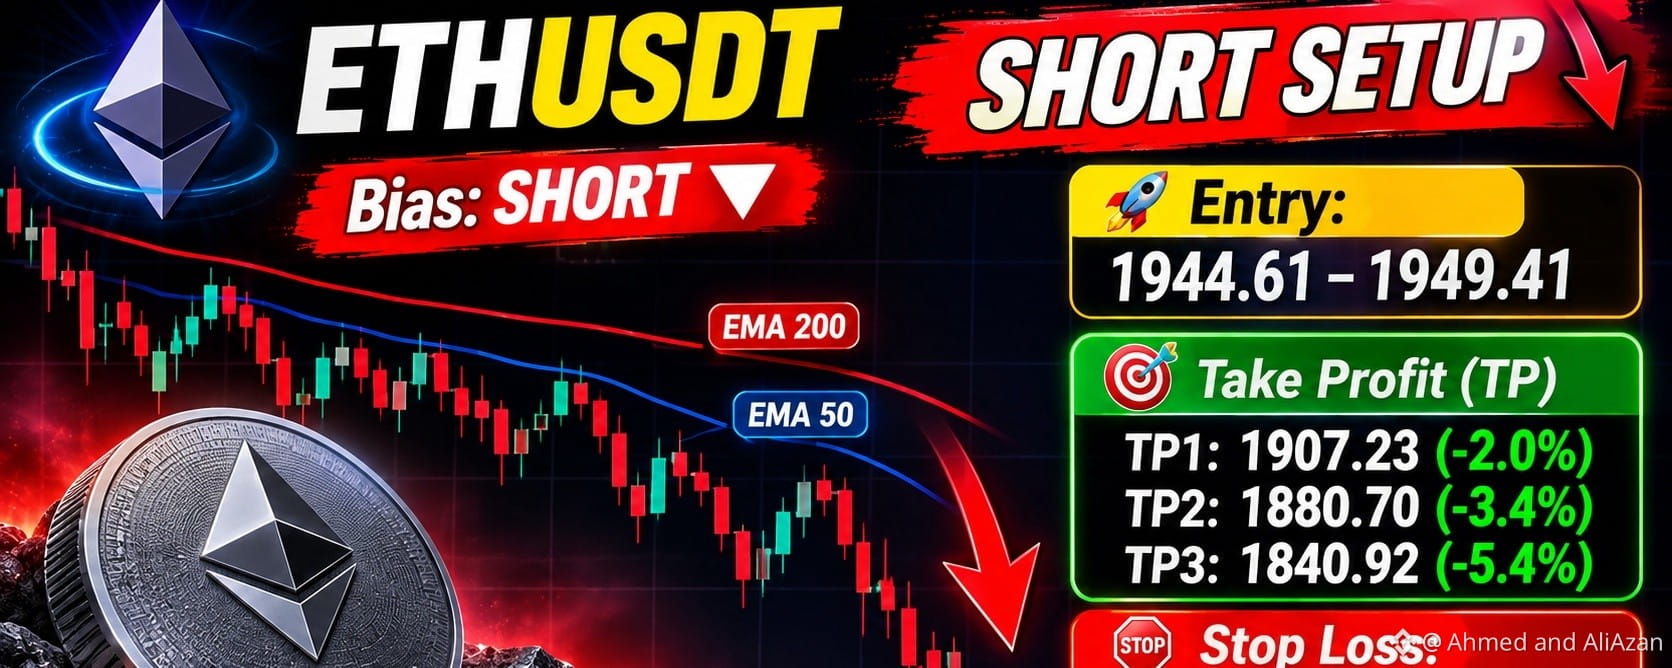
🔴 ETHUSDT SHORT SETUP 📉 | Entry, Take Profit Targets & Stop Loss | Bearish Market Analysis$ETH is looking bearish right now. On 4H and 1H chart price is below EMA50 and EMA200. Sellers are still looking strong.
# 🔴 ETHUSDT – SHORT SETUP
**Bias: SHORT 📉**
ETH is looking bearish right now. On 4H and 1H chart price is below EMA50 and EMA200. Sellers are still looking strong.
**Entry:** 1944.61 – 1949.41
**Targets 🎯**
- TP1: 1907.23 (-2.0%)
- TP2: 1880.70 (-3.4%)
- TP3: 1840.92 (-5.4%)
**Stop Loss:** 2000.05 (+2.7%)
My plan is to close 50% at TP1, 25% at TP2 and the rest 25% at TP3.
After TP1, stop loss can be moved to entry.
This setup looks bearish but confidence is only moderate, so don't take big risk.
What do you think about this ETH short setup? Let me know your opinion.
⚠️ Personal market analysis only. NFA. Always manage your risk and DYOR.$ETH
Educational content
only. Not financial advices
$BTC
🔴 ETHUSDT SHORT SETUP 📉 | Entry, Take Profit Targets & Stop Loss | Bearish Market Analysis
$ETH is looking bearish right now. On 4H and 1H chart price is below EMA50 and EMA200. Sellers are still looking strong.
# 🔴 ETHUSDT – SHORT SETUP
**Bias: SHORT 📉**
ETH is looking bearish right now. On 4H and 1H chart price is below EMA50 and EMA200. Sellers are still looking strong.
**Entry:** 1944.61 – 1949.41
**Targets 🎯**
- TP1: 1907.23 (-2.0%)
- TP2: 1880.70 (-3.4%)
- TP3: 1840.92 (-5.4%)
**Stop Loss:** 2000.05 (+2.7%)
My plan is to close 50% at TP1, 25% at TP2 and the rest 25% at TP3.
After TP1, stop loss can be moved to entry.
This setup looks bearish but confidence is only moderate, so don't take big risk.
What do you think about this ETH short setup? Let me know your opinion.
⚠️ Personal market analysis only. NFA. Always manage your risk and DYOR.$ETH
Educational content
only. Not financial advices
$BTC
# 🔴 ETHUSDT – SHORT SETUP
**Bias: SHORT 📉**
ETH is looking bearish right now. On 4H and 1H chart price is below EMA50 and EMA200. Sellers are still looking strong.
**Entry:** 1944.61 – 1949.41
**Targets 🎯**
- TP1: 1907.23 (-2.0%)
- TP2: 1880.70 (-3.4%)
- TP3: 1840.92 (-5.4%)
**Stop Loss:** 2000.05 (+2.7%)
My plan is to close 50% at TP1, 25% at TP2 and the rest 25% at TP3.
After TP1, stop loss can be moved to entry.
This setup looks bearish but confidence is only moderate, so don't take big risk.
What do you think about this ETH short setup? Let me know your opinion.
⚠️ Personal market analysis only. NFA. Always manage your risk and DYOR.$ETH
Educational content
only. Not financial advices
$BTC
117

Статья
BITCOIN:$$BTC
# 🚨 BITCOIN: THE BEAR TRAP MAY BE HERE!
Bitcoin is showing an interesting move, and the next few levels could be very important.
I previously highlighted the possibility of a drop below $71K, with $68K as the next key support level. Now, all eyes are on what Bitcoin does next.
**My current market outlook:**$ETH
📉 $71K → $67K — Potential Bear Trap
📈 $67K → $100K → $114K — Possible bullish recovery targets
The market can change quickly, so don't rush into trades. Watch the key levels, manage your risk, and wait for confirmation before making any decisions.
Stay alert for the next Bitcoin upda
te!
**$BTC ** 🚀$
BITCOIN:$
$BTC
# 🚨 BITCOIN: THE BEAR TRAP MAY BE HERE!
Bitcoin is showing an interesting move, and the next few levels could be very important.
I previously highlighted the possibility of a drop below $71K, with $68K as the next key support level. Now, all eyes are on what Bitcoin does next.
**My current market outlook:**$ETH
📉 $71K → $67K — Potential Bear Trap
📈 $67K → $100K → $114K — Possible bullish recovery targets
The market can change quickly, so don't rush into trades. Watch the key levels, manage your risk, and wait for confirmation before making any decisions.
Stay alert for the next Bitcoin upda
te!
**$BTC ** 🚀$
# 🚨 BITCOIN: THE BEAR TRAP MAY BE HERE!
Bitcoin is showing an interesting move, and the next few levels could be very important.
I previously highlighted the possibility of a drop below $71K, with $68K as the next key support level. Now, all eyes are on what Bitcoin does next.
**My current market outlook:**$ETH
📉 $71K → $67K — Potential Bear Trap
📈 $67K → $100K → $114K — Possible bullish recovery targets
The market can change quickly, so don't rush into trades. Watch the key levels, manage your risk, and wait for confirmation before making any decisions.
Stay alert for the next Bitcoin upda
te!
**$BTC ** 🚀$
219
Войдите, чтобы посмотреть больше материала
Присоединяйтесь к пользователям криптовалют по всему миру на Binance Square
⚡️ Получайте новейшую и полезную информацию о криптоактивах.
💬 Нам доверяет крупнейшая в мире криптобиржа.
👍 Получите достоверные аналитические данные от верифицированных создателей контента.
Эл. почта/номер телефона
В тренде
A Packed Week of Earnings and Data Tests Markets
Просмотров: 8,457
123 обсуждают
🚨🇺🇸 BIG WEEK AHEAD FOR THE MARKETS!
Markets are pricing in a Fed rate hike in December and $BTC could see some big moves next week.
Here's what's coming:
• Monday: Fed Chair Warsh speaks
• Tuesday: US Retail Sales + $NVDA earnings
• Wednesday: FOMC Minutes
• Thursday: Jobless Claims + Philly Fed Index
• Friday: Consumer Sentiment + Fed speeches
All eyes on $BTC as another important week begins.
#bitcoin
Mookie
·Лайков: 6
·Просмотров: 3.2k
AnthropicIPOTestsInvestorAppetiteForAI
Просмотров: 5,191
219 обсуждают
HuangReportedlyConsidersReturnToNvidia
Просмотров: 25,012
426 обсуждают