

Zubair Khan lashari
124 Публикации

Zubair Khan lashari
Отправить жалобу
Заблокировать пользователя
Открытая сделка
Трейдер с регулярными сделками
1.6 г
278 подписок(и/а)
157 подписчиков(а)
42 понравилось
Посты
Портфель
Все
Цитирования
Активно
🎙️ Seems like she's not happy 😂 but i need to watch my $BTC position

Завершено
06 ч 00 мин 00 сек
8.6k
3
0
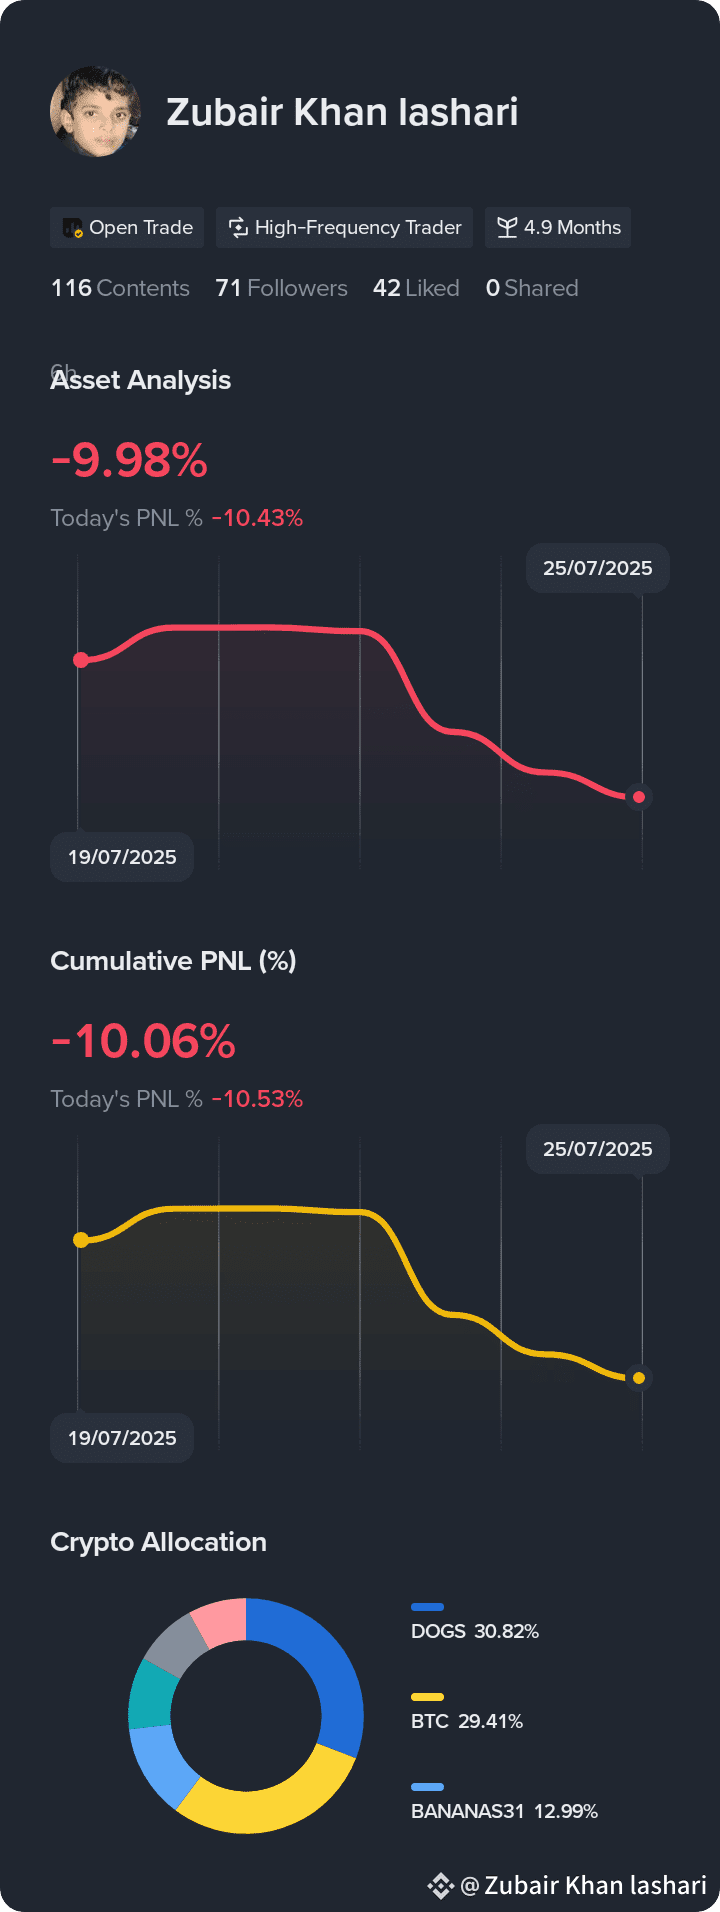
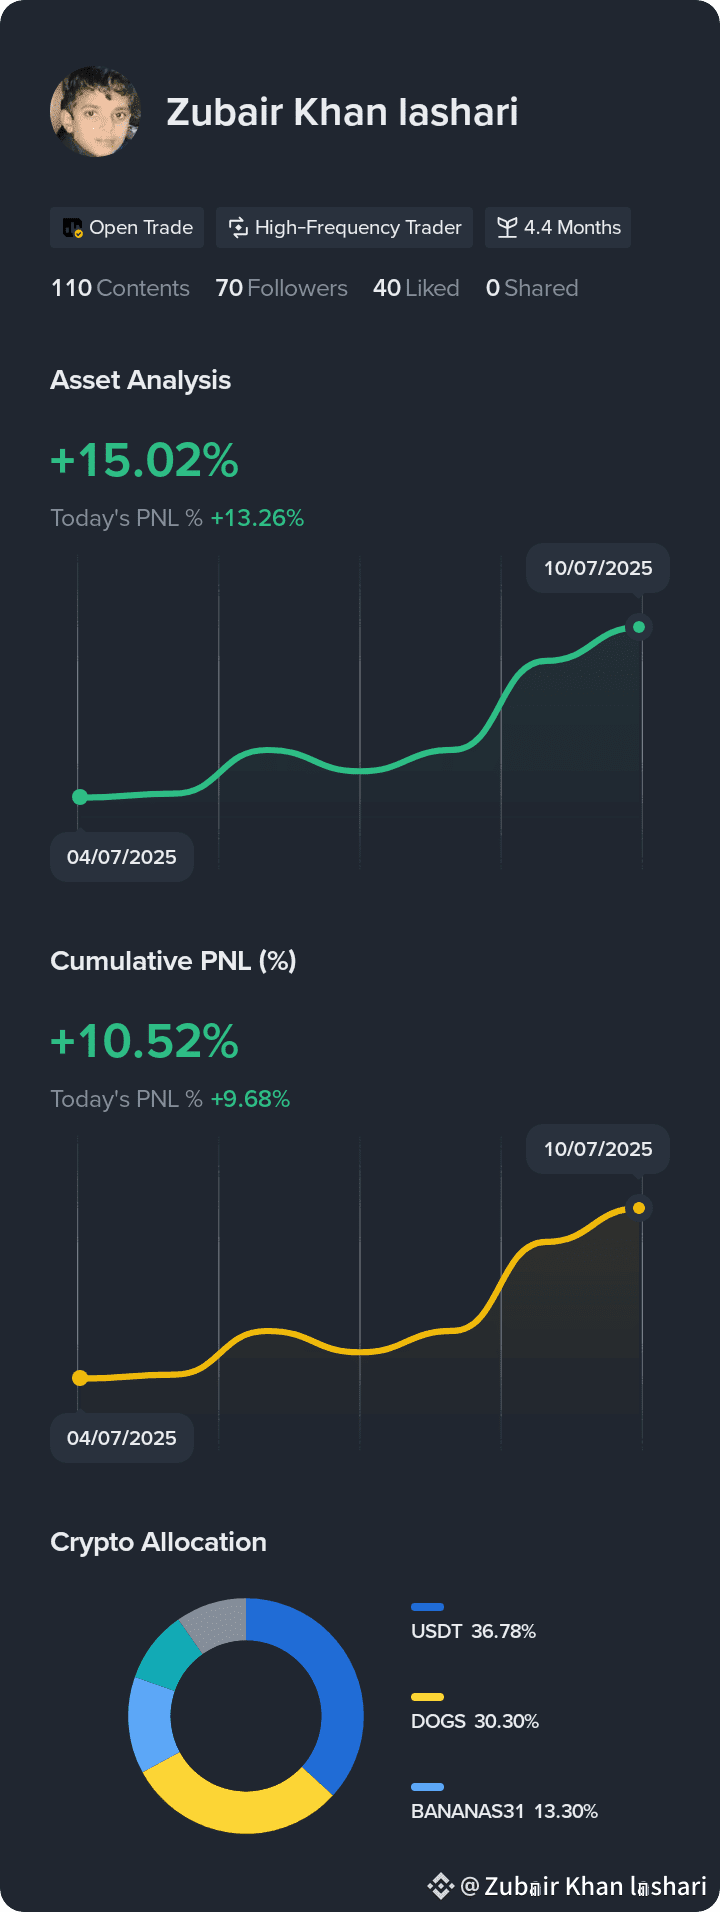
See my returns and portfolio breakdown. Follow for investment tips
See my returns and portfolio breakdown. Follow for investment tips
3
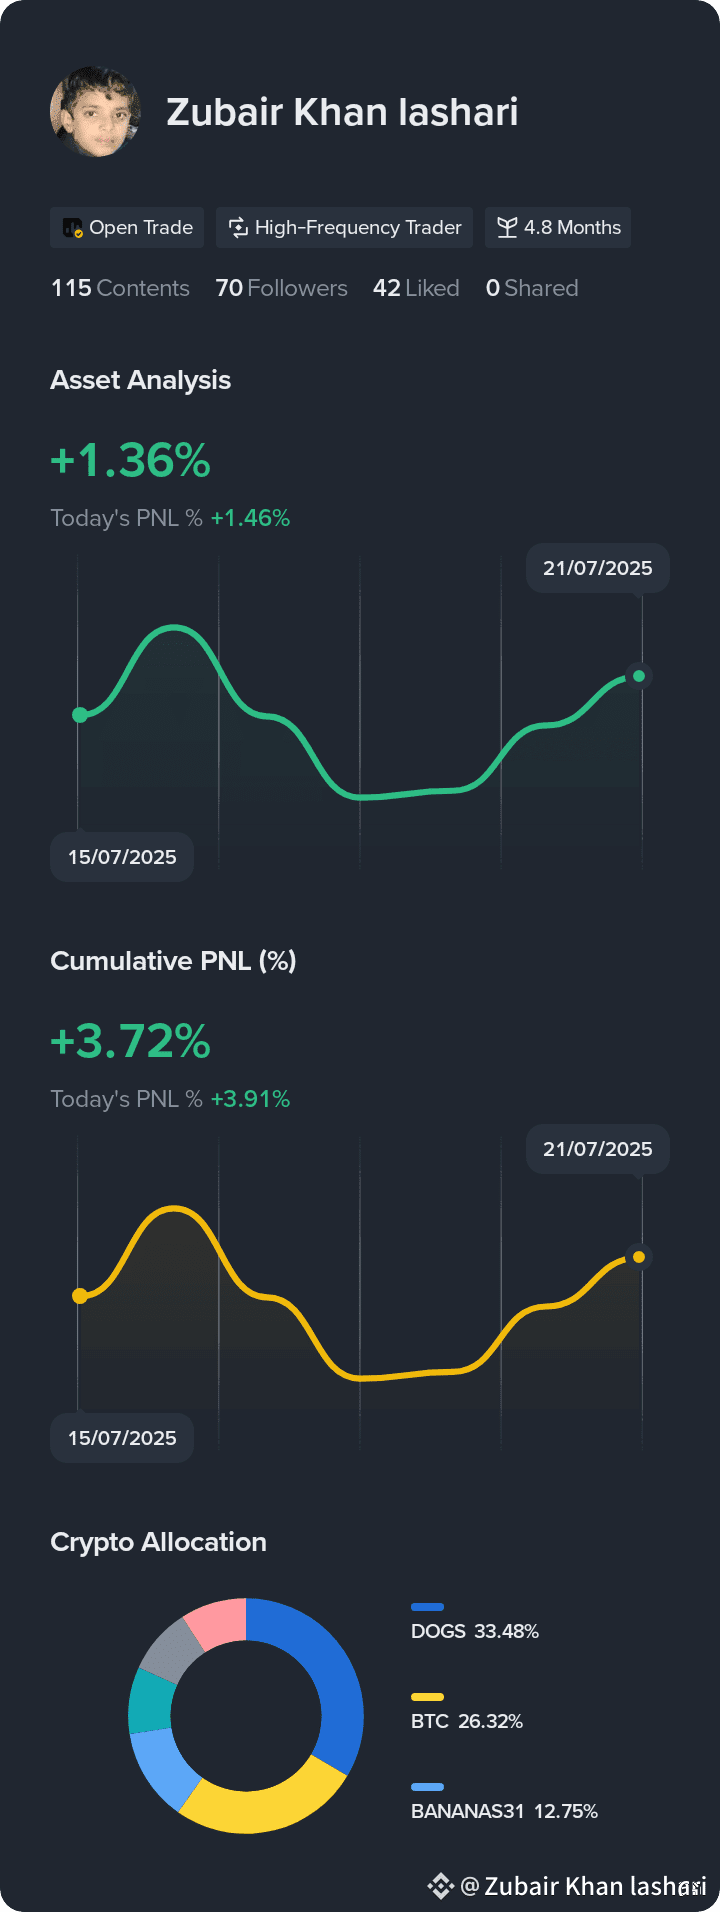
See my returns and portfolio breakdown. Follow for investment tips
See my returns and portfolio breakdown. Follow for investment tips
5
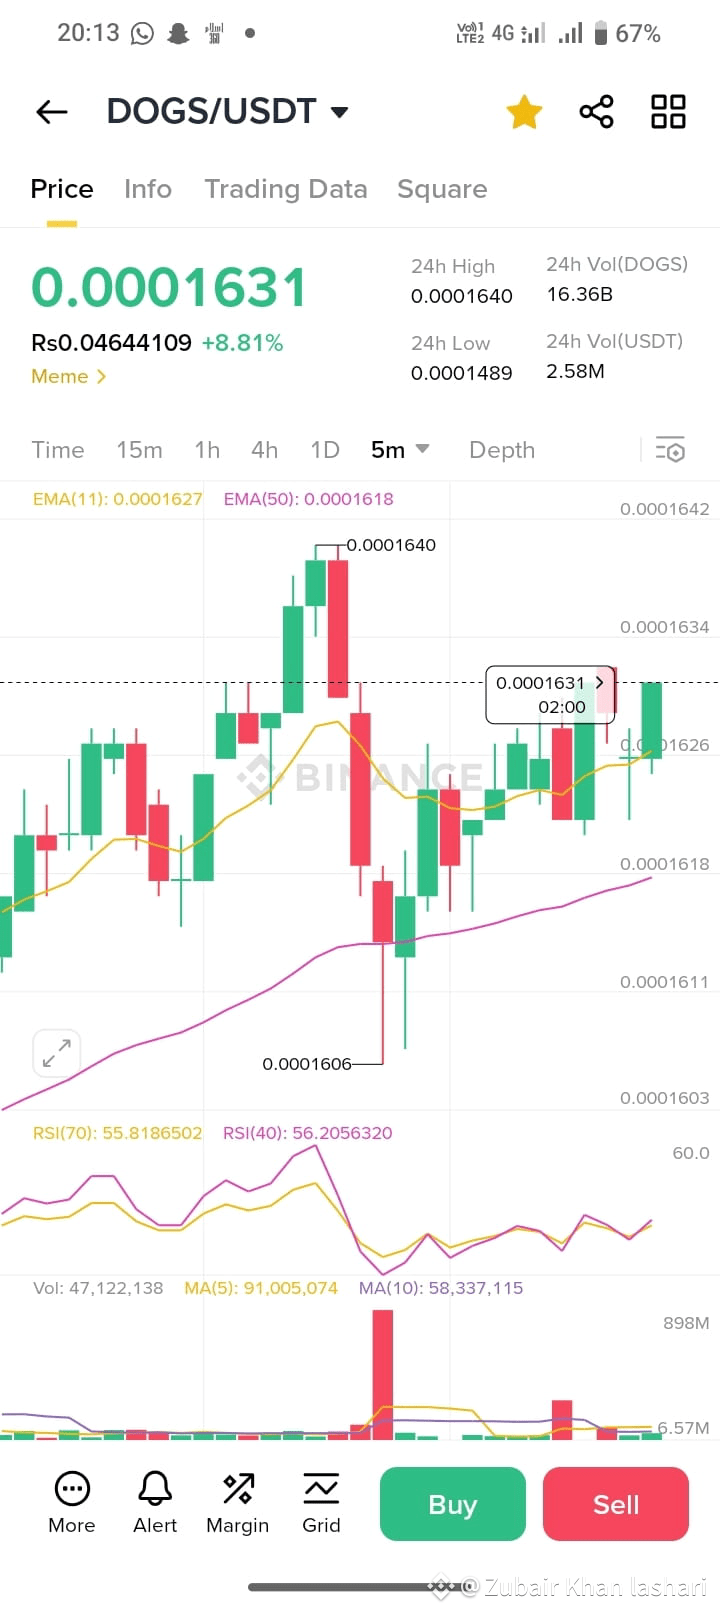
See my returns and portfolio breakdown. Follow for investment tips
See my returns and portfolio breakdown. Follow for investment tips
12
1
1
212
·
--
Рост
$SUI
{spot}(SUIUSDT)
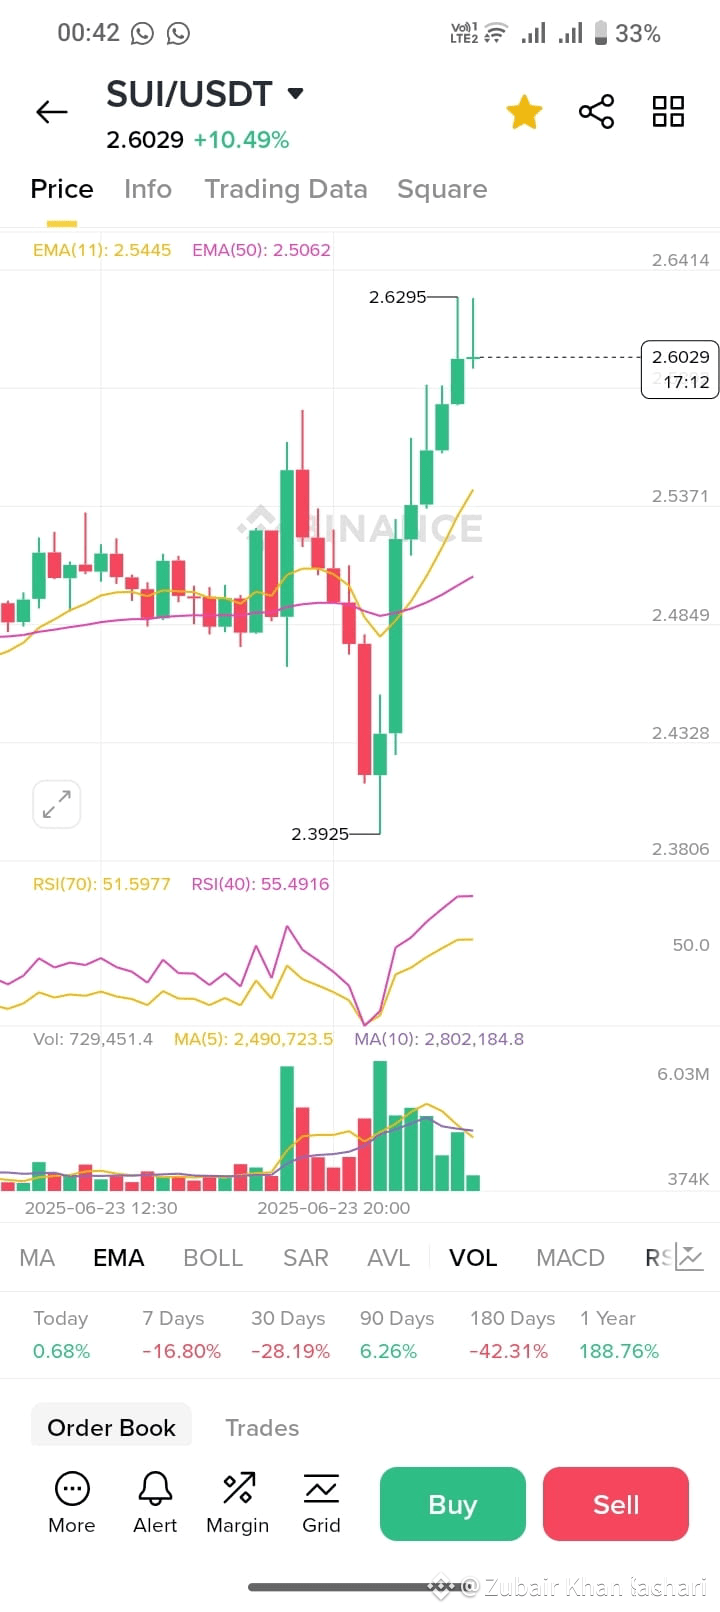
SUI coin under the microscope: Detailed technical analysis and potential trading opportunities amidst varying indicators?!!
In light of the ongoing volatility in the cryptocurrency market, SUI coin stands out as one of the projects attracting the attention of both investors and speculators. With its reliance on advanced blockchain technologies and a highly scalable network, many questions arise about its technical future and the trading opportunities currently available. In this report, we highlight the latest technical developments of SUI coin, with a detailed analysis of indicators and price movement, to help you make informed decisions in the current market environment.
📊 Current price and market performance
Current price: approximately $2.73
Change in the last 24 hours: approximately 3% increase
Daily high and low price: $2.79 / $2.63
🔎 Recent technical analytical outlook
Technical indicators (from multiple sources):
✅ Comprehensive short-term technical classification leaning towards 'Sell' with some short-term bullish signals.
✅ The key moving averages (MA20, MA50, MA100, MA200) indicate significant selling pressure.
✅ The Relative Strength Index (RSI) ranges from 37 to 58, reflecting a neutral state with a slight inclination to buy or sell depending on the time frame.
✅ The MACD indicator shows slight negative divergence and slight positive, reflecting a clear hesitation in market direction.
✅ Key support points are at levels $2.60 - $2.70, with resistances around $2.80 - $2.90.
🎯 Potential trading opportunities
Short-term speculators: The price rebound from strong support at $2.60 - $2.70 can be exploited, while monitoring the breakout of resistance at $2.80 - $2.90 for quick profits.
Medium and long-term investors: It is advised to closely monitor price performance, especially when breaking or crossing pivotal levels, as stability above resistance gives a strong positive signal, while breaking support may bring the price back to lower levels like $2.50.
Caution strategy: With the divergence in technical indicators a
$SUI
SUI coin under the microscope: Detailed technical analysis and potential trading opportunities amidst varying indicators?!!
In light of the ongoing volatility in the cryptocurrency market, SUI coin stands out as one of the projects attracting the attention of both investors and speculators. With its reliance on advanced blockchain technologies and a highly scalable network, many questions arise about its technical future and the trading opportunities currently available. In this report, we highlight the latest technical developments of SUI coin, with a detailed analysis of indicators and price movement, to help you make informed decisions in the current market environment.
📊 Current price and market performance
Current price: approximately $2.73
Change in the last 24 hours: approximately 3% increase
Daily high and low price: $2.79 / $2.63
🔎 Recent technical analytical outlook
Technical indicators (from multiple sources):
✅ Comprehensive short-term technical classification leaning towards 'Sell' with some short-term bullish signals.
✅ The key moving averages (MA20, MA50, MA100, MA200) indicate significant selling pressure.
✅ The Relative Strength Index (RSI) ranges from 37 to 58, reflecting a neutral state with a slight inclination to buy or sell depending on the time frame.
✅ The MACD indicator shows slight negative divergence and slight positive, reflecting a clear hesitation in market direction.
✅ Key support points are at levels $2.60 - $2.70, with resistances around $2.80 - $2.90.
🎯 Potential trading opportunities
Short-term speculators: The price rebound from strong support at $2.60 - $2.70 can be exploited, while monitoring the breakout of resistance at $2.80 - $2.90 for quick profits.
Medium and long-term investors: It is advised to closely monitor price performance, especially when breaking or crossing pivotal levels, as stability above resistance gives a strong positive signal, while breaking support may bring the price back to lower levels like $2.50.
Caution strategy: With the divergence in technical indicators a
SUI coin under the microscope: Detailed technical analysis and potential trading opportunities amidst varying indicators?!!
In light of the ongoing volatility in the cryptocurrency market, SUI coin stands out as one of the projects attracting the attention of both investors and speculators. With its reliance on advanced blockchain technologies and a highly scalable network, many questions arise about its technical future and the trading opportunities currently available. In this report, we highlight the latest technical developments of SUI coin, with a detailed analysis of indicators and price movement, to help you make informed decisions in the current market environment.
📊 Current price and market performance
Current price: approximately $2.73
Change in the last 24 hours: approximately 3% increase
Daily high and low price: $2.79 / $2.63
🔎 Recent technical analytical outlook
Technical indicators (from multiple sources):
✅ Comprehensive short-term technical classification leaning towards 'Sell' with some short-term bullish signals.
✅ The key moving averages (MA20, MA50, MA100, MA200) indicate significant selling pressure.
✅ The Relative Strength Index (RSI) ranges from 37 to 58, reflecting a neutral state with a slight inclination to buy or sell depending on the time frame.
✅ The MACD indicator shows slight negative divergence and slight positive, reflecting a clear hesitation in market direction.
✅ Key support points are at levels $2.60 - $2.70, with resistances around $2.80 - $2.90.
🎯 Potential trading opportunities
Short-term speculators: The price rebound from strong support at $2.60 - $2.70 can be exploited, while monitoring the breakout of resistance at $2.80 - $2.90 for quick profits.
Medium and long-term investors: It is advised to closely monitor price performance, especially when breaking or crossing pivotal levels, as stability above resistance gives a strong positive signal, while breaking support may bring the price back to lower levels like $2.50.
Caution strategy: With the divergence in technical indicators a
3
125
Войдите, чтобы посмотреть больше материала
Присоединяйтесь к пользователям криптовалют по всему миру на Binance Square
⚡️ Получайте новейшую и полезную информацию о криптоактивах.
💬 Нам доверяет крупнейшая в мире криптобиржа.
👍 Получите достоверные аналитические данные от верифицированных создателей контента.
Эл. почта/номер телефона