
Sonofenio
7 Публикации

Sonofenio
Отправить жалобу
Заблокировать пользователя
trader 5 years

Топ трейдеров по прибыли за 7 дн.
Открытая сделка

Владелец NEAR
Трейдер с регулярными сделками
5.8 г
0 подписок(и/а)
26 подписчиков(а)
20 понравилось
1 Значки
Посты
Портфель
·
--
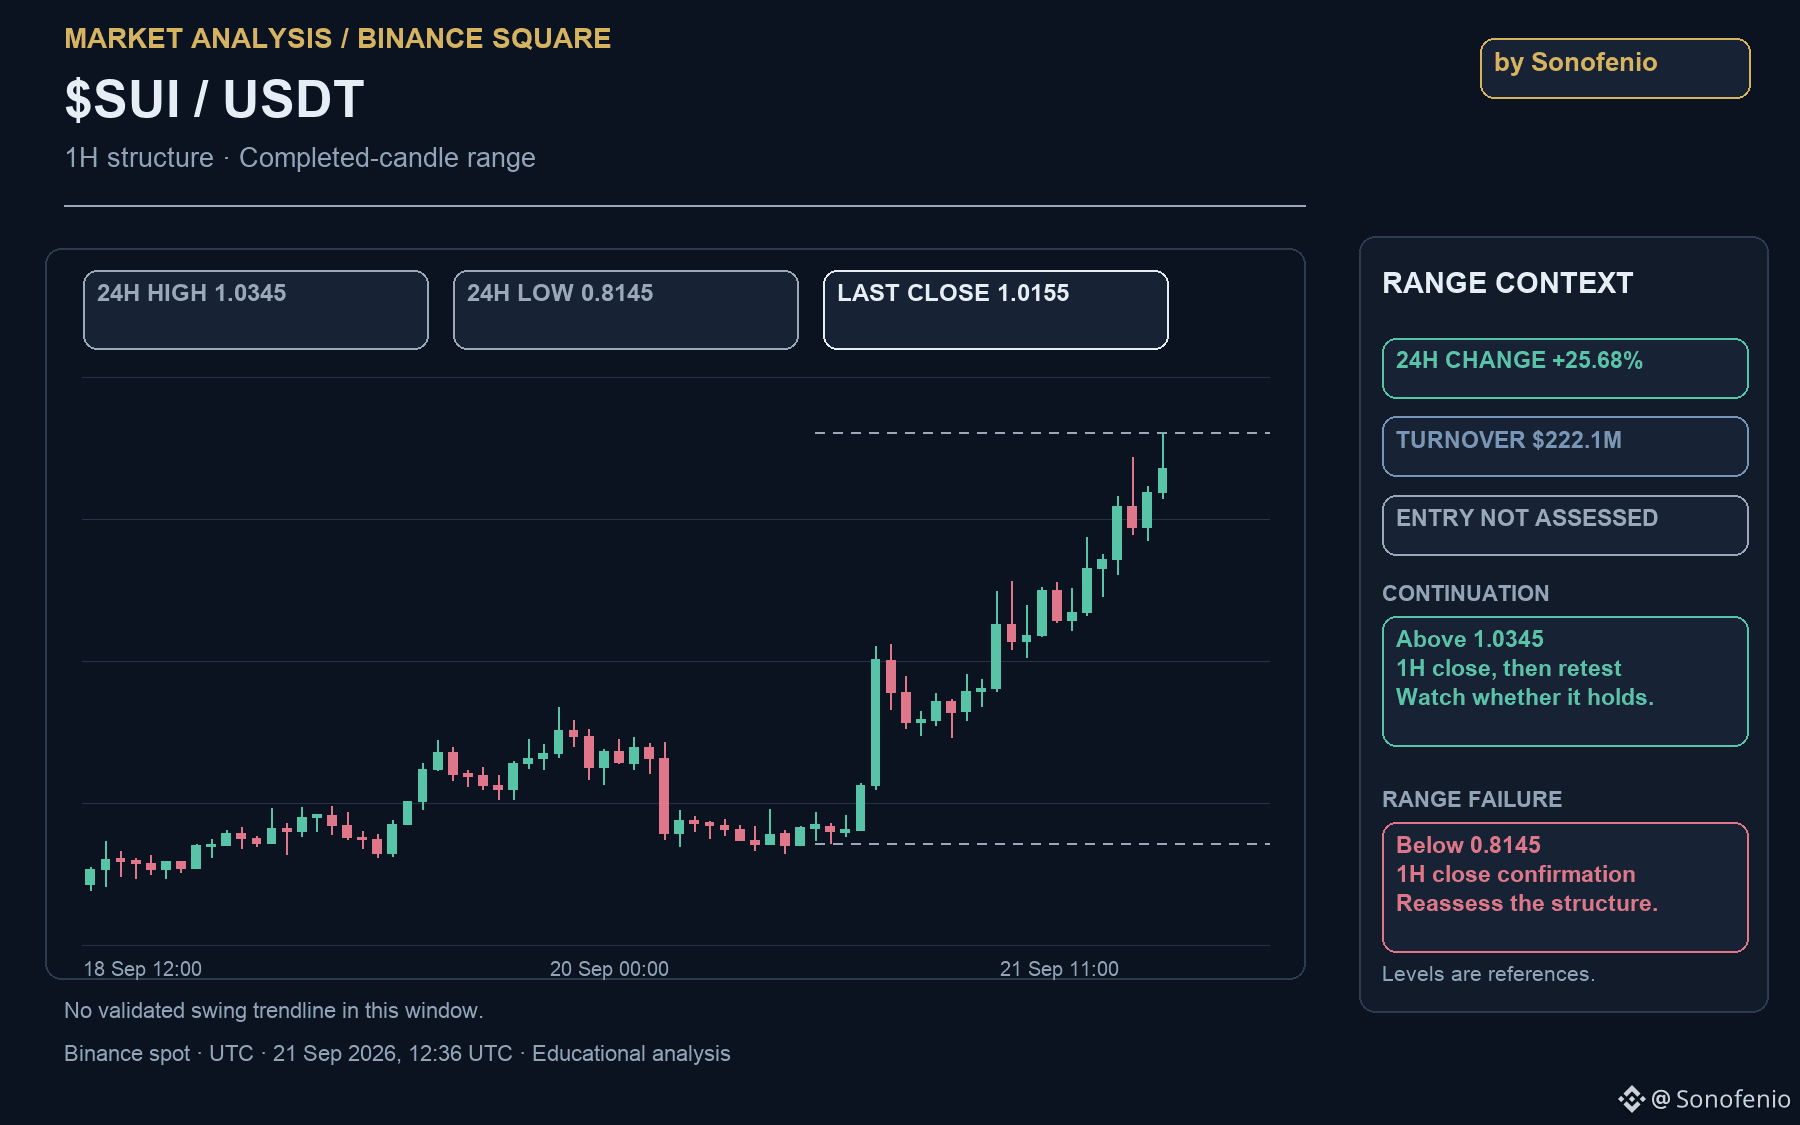
$SUI is up 25.7% in 24 hours. A big move still needs a clear plan.
Price: $1.0294. The chart shows completed hourly candles; the latest closed at $1.0155.
📈 Watch $1.0345 — the high of the last 24 completed hours. A close above it, then a retest that holds, would support continuation.
A return below that level after a breakout would weaken the case. The opposite range edge is $0.8145 — a broad reference, not a suggested stop.
Takeaway: this wide range is not a precise entry setup. A strong rally alone does not define an entry.
Binance spot · 21 Sep, 12:36 UTC
Educational analysis.
#SUI #PriceAction #TechnicalAnalysis
$SUI is up 25.7% in 24 hours. A big move still needs a clear plan.
Price: $1.0294. The chart shows completed hourly candles; the latest closed at $1.0155.
📈 Watch $1.0345 — the high of the last 24 completed hours. A close above it, then a retest that holds, would support continuation.
A return below that level after a breakout would weaken the case. The opposite range edge is $0.8145 — a broad reference, not a suggested stop.
Takeaway: this wide range is not a precise entry setup. A strong rally alone does not define an entry.
Binance spot · 21 Sep, 12:36 UTC
Educational analysis.
#SUI #PriceAction #TechnicalAnalysis
Price: $1.0294. The chart shows completed hourly candles; the latest closed at $1.0155.
📈 Watch $1.0345 — the high of the last 24 completed hours. A close above it, then a retest that holds, would support continuation.
A return below that level after a breakout would weaken the case. The opposite range edge is $0.8145 — a broad reference, not a suggested stop.
Takeaway: this wide range is not a precise entry setup. A strong rally alone does not define an entry.
Binance spot · 21 Sep, 12:36 UTC
Educational analysis.
#SUI #PriceAction #TechnicalAnalysis
1
134
·
--
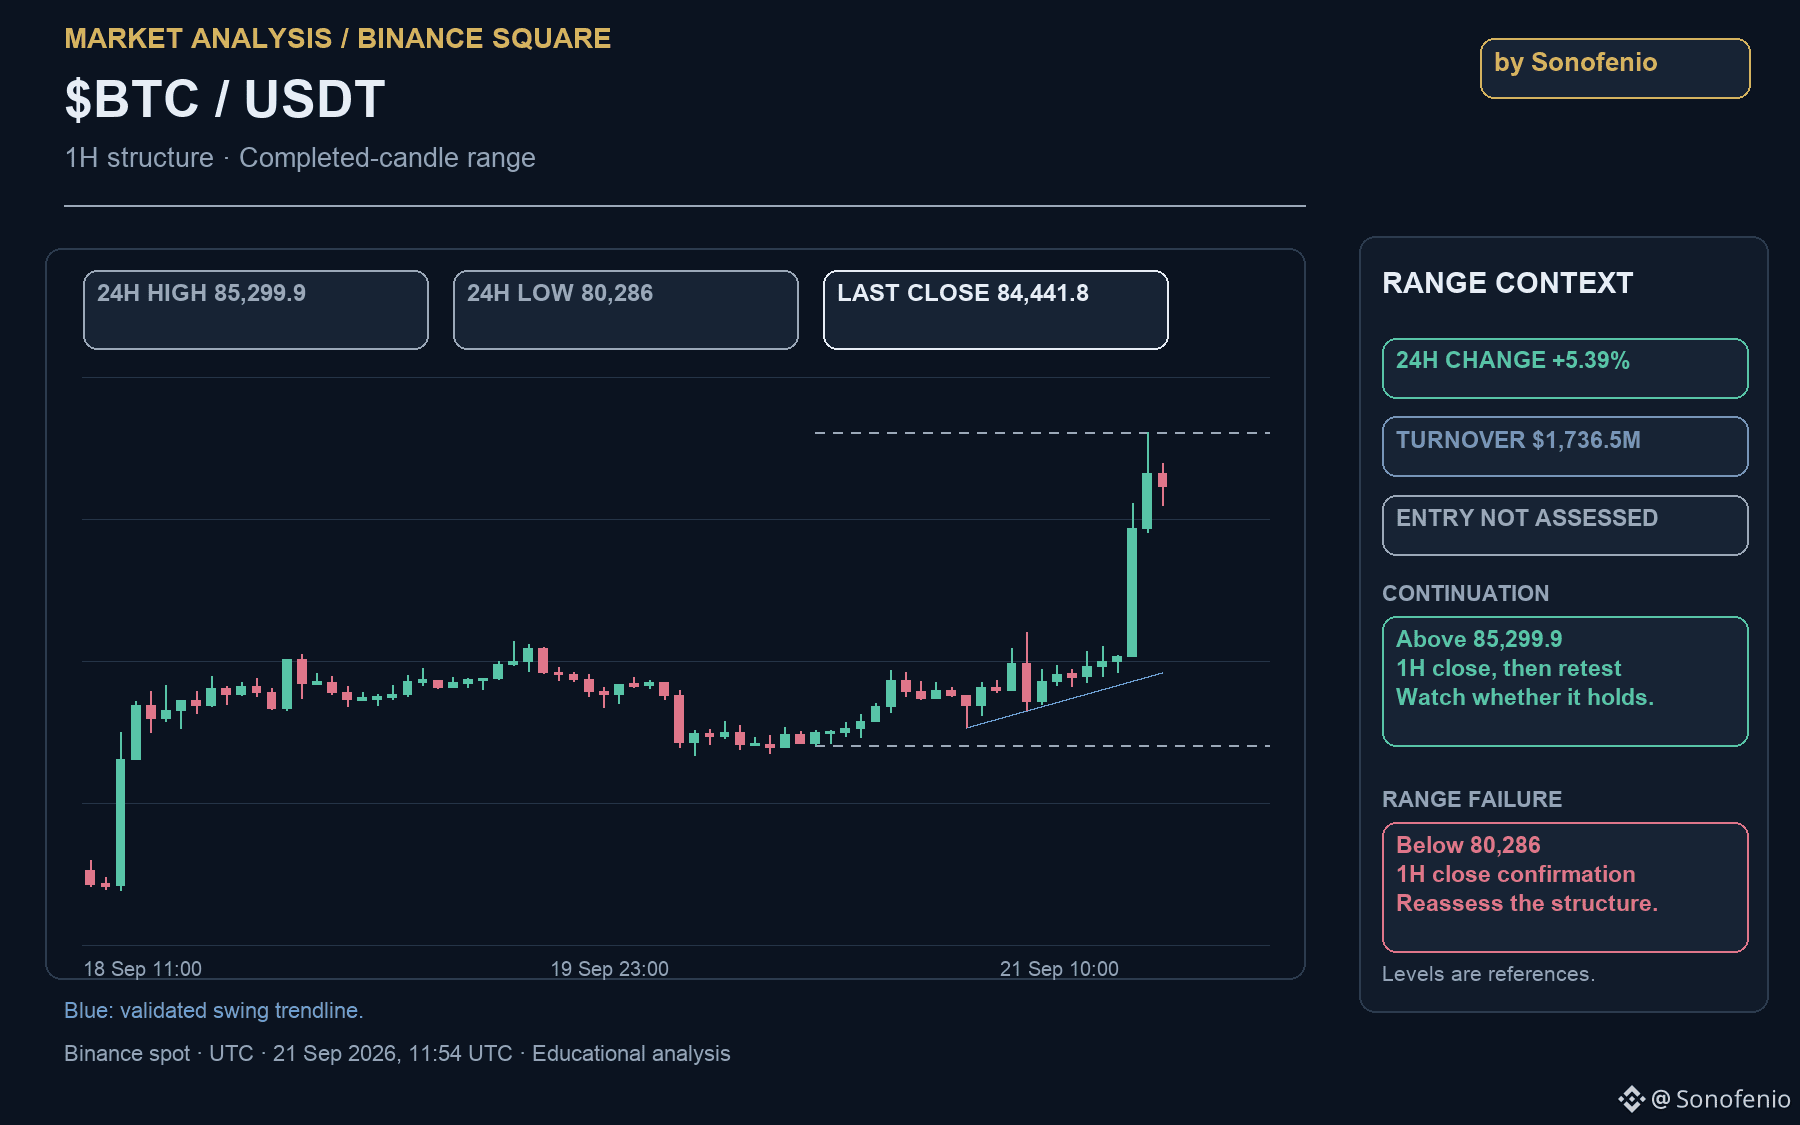
$BTC is up 5.4% in 24 hours. The useful question now is whether it can hold beyond $85,299.9.
At 11:54 UTC, Binance spot quoted $84,861.3, with $1.74B in 24-hour turnover. The latest completed hourly candle closed at $84,441.8; that is why the chart’s closing price differs from the live quote.
The chart shows a sharp push out of the earlier consolidation. But the high of the last 24 completed hourly candles, $85,299.9, has not yet become a confirmed floor.
📈 Continuation: an hourly close above that level, followed by a retest that holds, would make the breakout more convincing. A quick return below it would weaken that reading.
The opposite edge of this 24-candle range is $80,286. An hourly close below it would break the range on the downside. That level is a broad structural reference, not a suggested stop: the range is too wide to treat as a precise entry setup.
The lesson here: touching a high and accepting prices above it are different events. Watch the close and the reaction that follows.
Source: Binance spot, 21 Sep 2026, 11:54 UTC. Educational analysis.
https://www.binance.com/en/trade/BTC_USDT?type=spot
#BTC #Bitcoin #PriceAction #TechnicalAnalysis
$BTC is up 5.4% in 24 hours. The useful question now is whether it can hold beyond $85,299.9.
At 11:54 UTC, Binance spot quoted $84,861.3, with $1.74B in 24-hour turnover. The latest completed hourly candle closed at $84,441.8; that is why the chart’s closing price differs from the live quote.
The chart shows a sharp push out of the earlier consolidation. But the high of the last 24 completed hourly candles, $85,299.9, has not yet become a confirmed floor.
📈 Continuation: an hourly close above that level, followed by a retest that holds, would make the breakout more convincing. A quick return below it would weaken that reading.
The opposite edge of this 24-candle range is $80,286. An hourly close below it would break the range on the downside. That level is a broad structural reference, not a suggested stop: the range is too wide to treat as a precise entry setup.
The lesson here: touching a high and accepting prices above it are different events. Watch the close and the reaction that follows.
Source: Binance spot, 21 Sep 2026, 11:54 UTC. Educational analysis.
https://www.binance.com/en/trade/BTC_USDT?type=spot
#BTC #Bitcoin #PriceAction #TechnicalAnalysis
At 11:54 UTC, Binance spot quoted $84,861.3, with $1.74B in 24-hour turnover. The latest completed hourly candle closed at $84,441.8; that is why the chart’s closing price differs from the live quote.
The chart shows a sharp push out of the earlier consolidation. But the high of the last 24 completed hourly candles, $85,299.9, has not yet become a confirmed floor.
📈 Continuation: an hourly close above that level, followed by a retest that holds, would make the breakout more convincing. A quick return below it would weaken that reading.
The opposite edge of this 24-candle range is $80,286. An hourly close below it would break the range on the downside. That level is a broad structural reference, not a suggested stop: the range is too wide to treat as a precise entry setup.
The lesson here: touching a high and accepting prices above it are different events. Watch the close and the reaction that follows.
Source: Binance spot, 21 Sep 2026, 11:54 UTC. Educational analysis.
https://www.binance.com/en/trade/BTC_USDT?type=spot
#BTC #Bitcoin #PriceAction #TechnicalAnalysis
1
91

·
--
When is better to Buy $ALT 💰💰💰
I have analyzed the $ALT chart, especially for you
1D - moved in a descending wedge (channel), broke upward.
We worked out the C wave according to Elliott.
4H - the price is clearly in the buyer's zone. The price came out of the downward channel upward. Retested the upper boundary of the channel.
RSI is neutral, MACD has approached a bearish crossover.
20 EMA below 200.
1H - 20 EMA broke through 200 upwards, the price left the descending channel, retested the upper border of the channel once, and bounced off the 200 EMA - I entered into a trade. There was an extended bearish divergence on the MACD at the time I entered the trade - I didn’t notice it. Now there is a bearish divergence on the RSI.
💻 Summarise
locally we can go even lower to the lower border of the channel and there we need to observe how the price will behave.
If you look at the daily TF, it looks long, and according to the chart where you can take into account the formation of a new cycle according to Elliot and indicators that have cooled down.
It is possible to enter a trade with targets at 🔥 0.70 🔥 when a new 3rd wave is formed.
#ALT #Sonofenio #BTC #Halving #binancelaunchpool
When is better to Buy $ALT 💰💰💰
I have analyzed the $ALT chart, especially for you
1D - moved in a descending wedge (channel), broke upward.
We worked out the C wave according to Elliott.
4H - the price is clearly in the buyer's zone. The price came out of the downward channel upward. Retested the upper boundary of the channel.
RSI is neutral, MACD has approached a bearish crossover.
20 EMA below 200.
1H - 20 EMA broke through 200 upwards, the price left the descending channel, retested the upper border of the channel once, and bounced off the 200 EMA - I entered into a trade. There was an extended bearish divergence on the MACD at the time I entered the trade - I didn’t notice it. Now there is a bearish divergence on the RSI.
💻 Summarise
locally we can go even lower to the lower border of the channel and there we need to observe how the price will behave.
If you look at the daily TF, it looks long, and according to the chart where you can take into account the formation of a new cycle according to Elliot and indicators that have cooled down.
It is possible to enter a trade with targets at 🔥 0.70 🔥 when a new 3rd wave is formed.
#ALT #Sonofenio #BTC #Halving #binancelaunchpool
I have analyzed the $ALT chart, especially for you
1D - moved in a descending wedge (channel), broke upward.
We worked out the C wave according to Elliott.
4H - the price is clearly in the buyer's zone. The price came out of the downward channel upward. Retested the upper boundary of the channel.
RSI is neutral, MACD has approached a bearish crossover.
20 EMA below 200.
1H - 20 EMA broke through 200 upwards, the price left the descending channel, retested the upper border of the channel once, and bounced off the 200 EMA - I entered into a trade. There was an extended bearish divergence on the MACD at the time I entered the trade - I didn’t notice it. Now there is a bearish divergence on the RSI.
💻 Summarise
locally we can go even lower to the lower border of the channel and there we need to observe how the price will behave.
If you look at the daily TF, it looks long, and according to the chart where you can take into account the formation of a new cycle according to Elliot and indicators that have cooled down.
It is possible to enter a trade with targets at 🔥 0.70 🔥 when a new 3rd wave is formed.
#ALT #Sonofenio #BTC #Halving #binancelaunchpool

5
1
17
3k
Войдите, чтобы посмотреть больше материала
Присоединяйтесь к пользователям криптовалют по всему миру на Binance Square
⚡️ Получайте новейшую и полезную информацию о криптоактивах.
💬 Нам доверяет крупнейшая в мире криптобиржа.
👍 Получите достоверные аналитические данные от верифицированных создателей контента.
Эл. почта/номер телефона