
Richman9999
19 Публикации

Richman9999
Crypto market analysis — on-chain, sentiment, price structure. No hype, no shilling, just what the data shows.
29 подписок(и/а)
9 подписчиков(а)
14 понравилось
Посты
PINNED
First post: what I'm actually watching after BTC's 11% day
Quick intro so you know who's talking.
I've traded and invested my own money for years without ever calling myself an analyst. This account is where I write down what I think and why — trading views with levels, macro takes, and plain-English explanations of the terms nobody bothers to define. One post a day. When I'm wrong, I'll say so in the Sunday recap instead of quietly deleting it.
Starting with today.
$BTC went from $64.3k to roughly $73.8k in about 48 hours. Timelines are already calling the bull market back. Check the fuel first: $1.92B liquidated in 24 hours, $1.7B of that inside the final four. That's shorts getting run over, not spot buyers stepping in. There's real news underneath it — the Treasury doubling long-dated buyback operations to at least $4B each starting September 9, and the SEC proposing an exemption framework for crypto offerings. Both are genuine reasons for risk appetite. But the *speed* of this move was mechanical.
What I'm actually watching: the daily 200 EMA sits near $71.7k. Price closed above it for the first time since June. Daily RSI is 78. Overbought doesn't mean sell — it means the easy part is over.
My read: constructive while daily closes hold above $71.7k. Lose that and this becomes another failed reclaim inside a trend still more than 40% below the October 2025 high. I'm not going to pretend I know which one it is yet.
$ETH back at $2,000 is the second thing on my screen this week.
What are you watching? I reply to everyone.
Quick intro so you know who's talking.
I've traded and invested my own money for years without ever calling myself an analyst. This account is where I write down what I think and why — trading views with levels, macro takes, and plain-English explanations of the terms nobody bothers to define. One post a day. When I'm wrong, I'll say so in the Sunday recap instead of quietly deleting it.
Starting with today.
$BTC went from $64.3k to roughly $73.8k in about 48 hours. Timelines are already calling the bull market back. Check the fuel first: $1.92B liquidated in 24 hours, $1.7B of that inside the final four. That's shorts getting run over, not spot buyers stepping in. There's real news underneath it — the Treasury doubling long-dated buyback operations to at least $4B each starting September 9, and the SEC proposing an exemption framework for crypto offerings. Both are genuine reasons for risk appetite. But the *speed* of this move was mechanical.
What I'm actually watching: the daily 200 EMA sits near $71.7k. Price closed above it for the first time since June. Daily RSI is 78. Overbought doesn't mean sell — it means the easy part is over.
My read: constructive while daily closes hold above $71.7k. Lose that and this becomes another failed reclaim inside a trend still more than 40% below the October 2025 high. I'm not going to pretend I know which one it is yet.
$ETH back at $2,000 is the second thing on my screen this week.
What are you watching? I reply to everyone.
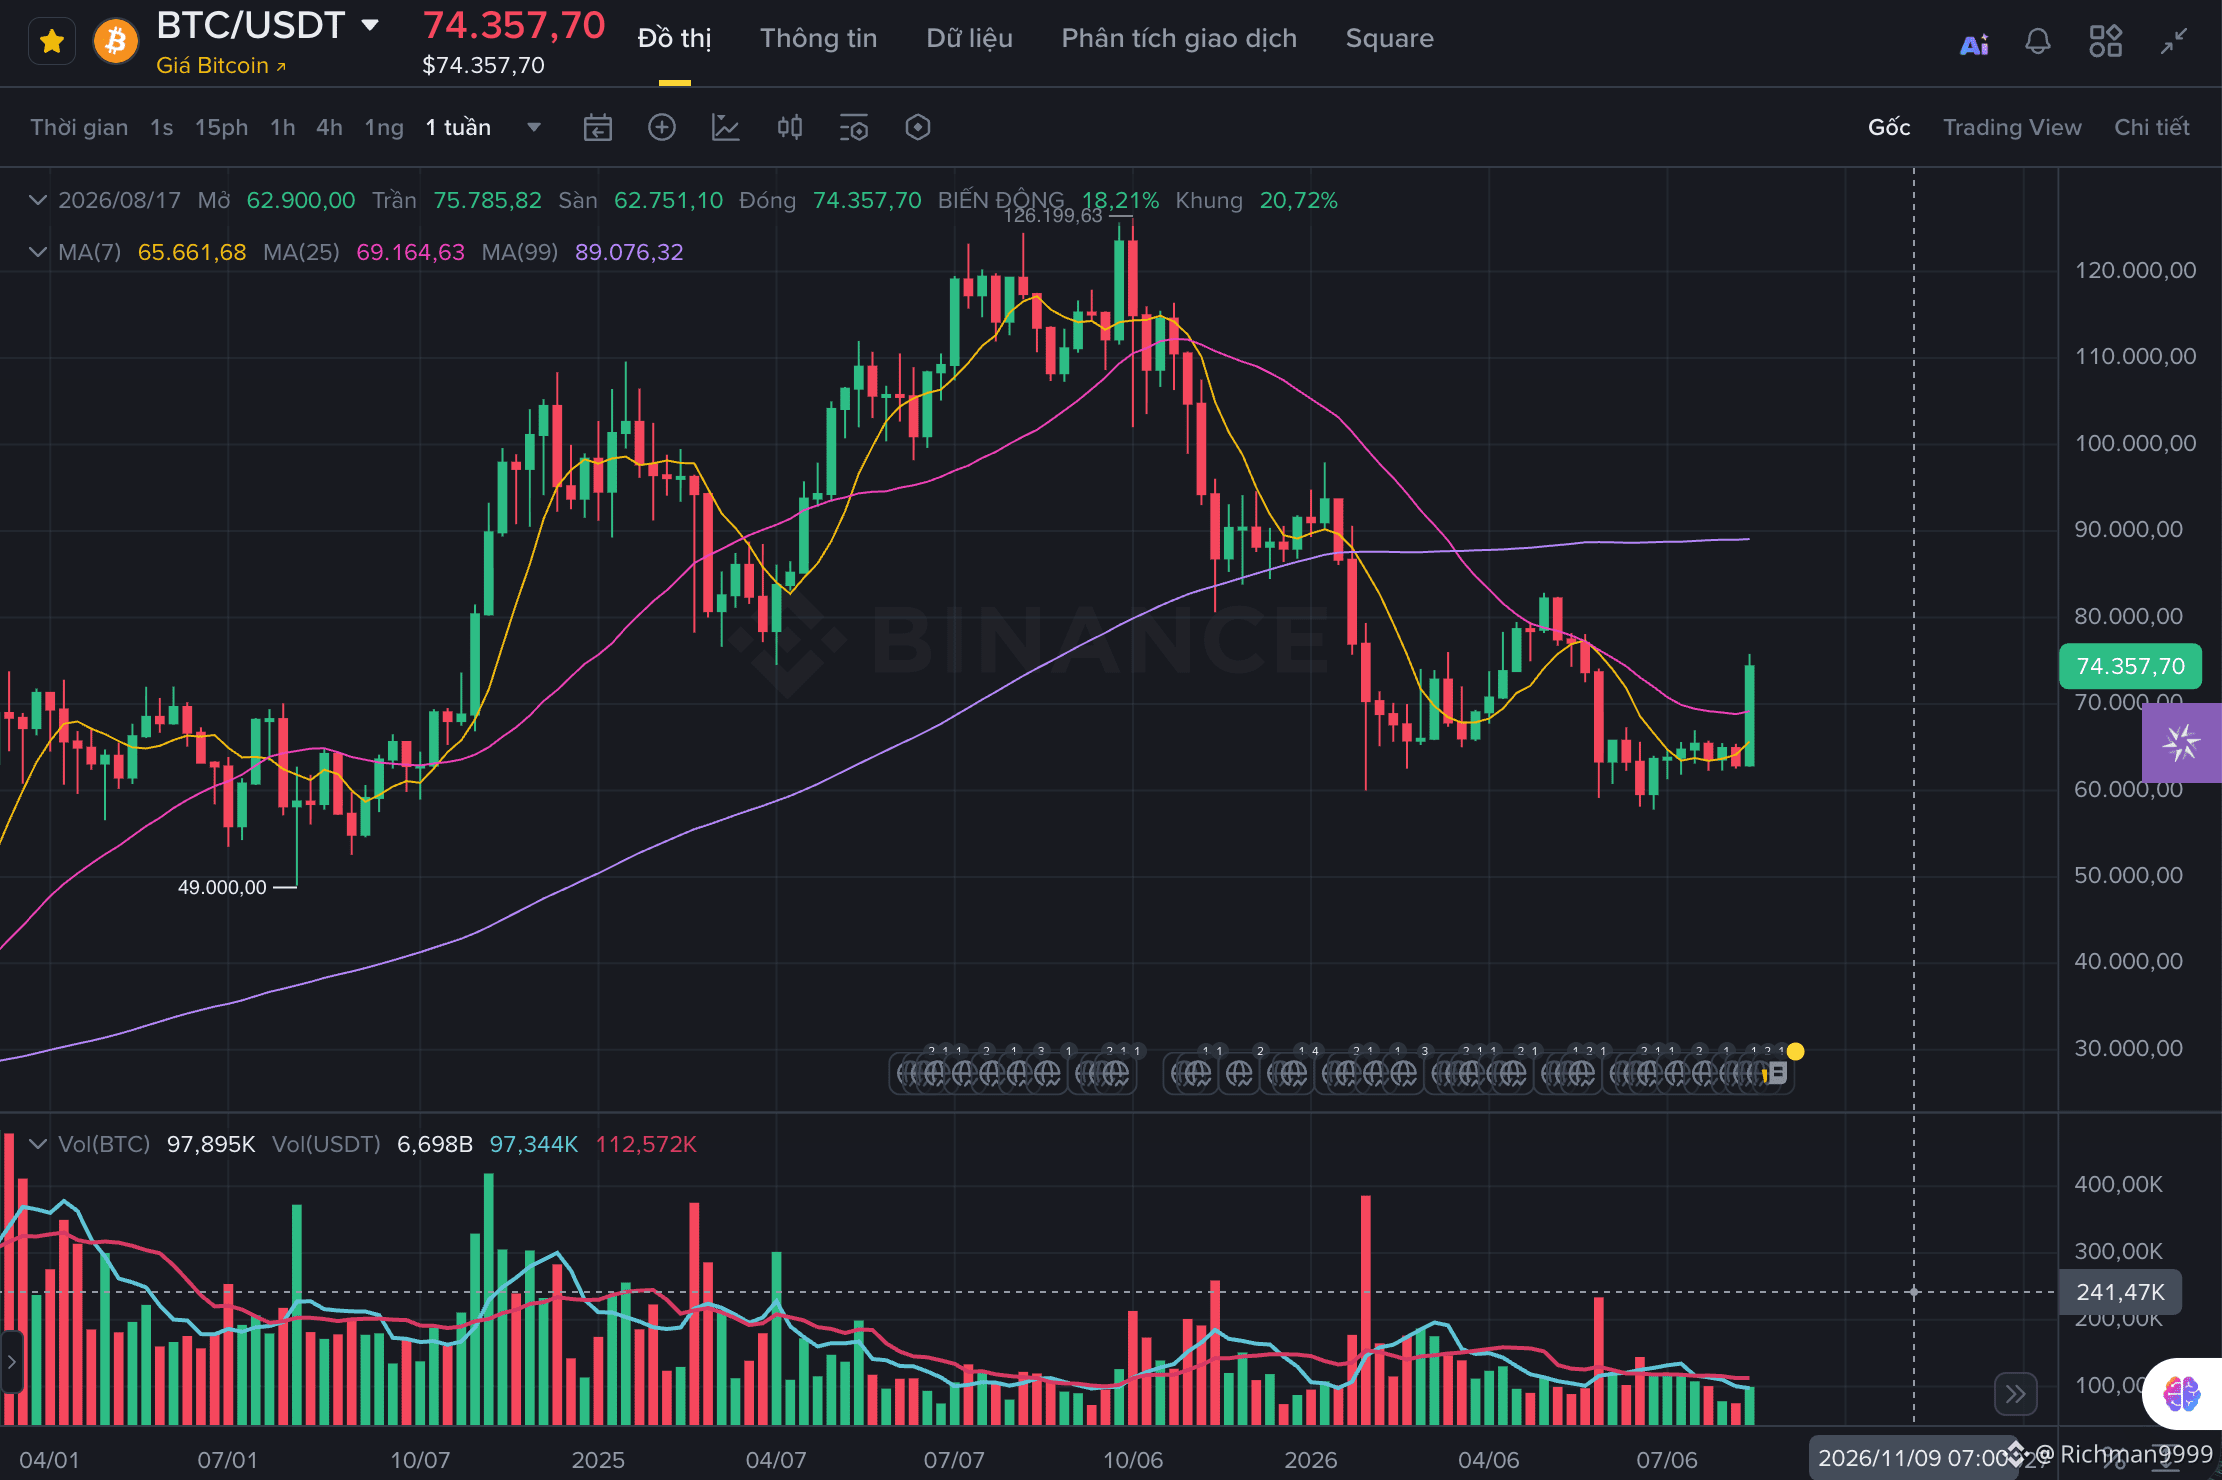
$EDEN /USDT (4H) - Strong Bounce After Deep Correction
EDEN made a massive parabolic move from 0.037 up to 0.088 before facing heavy selling pressure. Price has been correcting for over a week and is now showing signs of recovery with a strong bullish candle today.
Key Observations:
Sharp rejection at 0.088 with high volume (distribution)Price corrected deeply and found support near the 0.048 – 0.050 zoneToday’s strong green candle + volume spike suggests short-term buying interest returningPrice has reclaimed MA7 and MA25, showing early bullish momentum
Trade Setup:
Long Bias:
Entry Zone: 0.057 – 0.060
Stop Loss: 0.0525 (below recent swing low)
Take Profit 1: 0.066 – 0.068
Take Profit 2: 0.074 – 0.076
Take Profit 3: 0.085 – 0.088
Alternative (Aggressive Long):
Entry on pullback to 0.054 – 0.0555
SL: 0.0515
TP same as above
Note: This setup favors bulls in the short term due to today’s momentum. However, the higher timeframe structure remains corrective until price can sustain above 0.070.
NFA, DYOR.
$EDEN $BTC #EDENUSDT #OpenEden #CryptoTrading #TechnicalAnalysis #PriceAction #TradingSetup #Binance
EDEN made a massive parabolic move from 0.037 up to 0.088 before facing heavy selling pressure. Price has been correcting for over a week and is now showing signs of recovery with a strong bullish candle today.
Key Observations:
Sharp rejection at 0.088 with high volume (distribution)Price corrected deeply and found support near the 0.048 – 0.050 zoneToday’s strong green candle + volume spike suggests short-term buying interest returningPrice has reclaimed MA7 and MA25, showing early bullish momentum
Trade Setup:
Long Bias:
Entry Zone: 0.057 – 0.060
Stop Loss: 0.0525 (below recent swing low)
Take Profit 1: 0.066 – 0.068
Take Profit 2: 0.074 – 0.076
Take Profit 3: 0.085 – 0.088
Alternative (Aggressive Long):
Entry on pullback to 0.054 – 0.0555
SL: 0.0515
TP same as above
Note: This setup favors bulls in the short term due to today’s momentum. However, the higher timeframe structure remains corrective until price can sustain above 0.070.
NFA, DYOR.
$EDEN $BTC #EDENUSDT #OpenEden #CryptoTrading #TechnicalAnalysis #PriceAction #TradingSetup #Binance
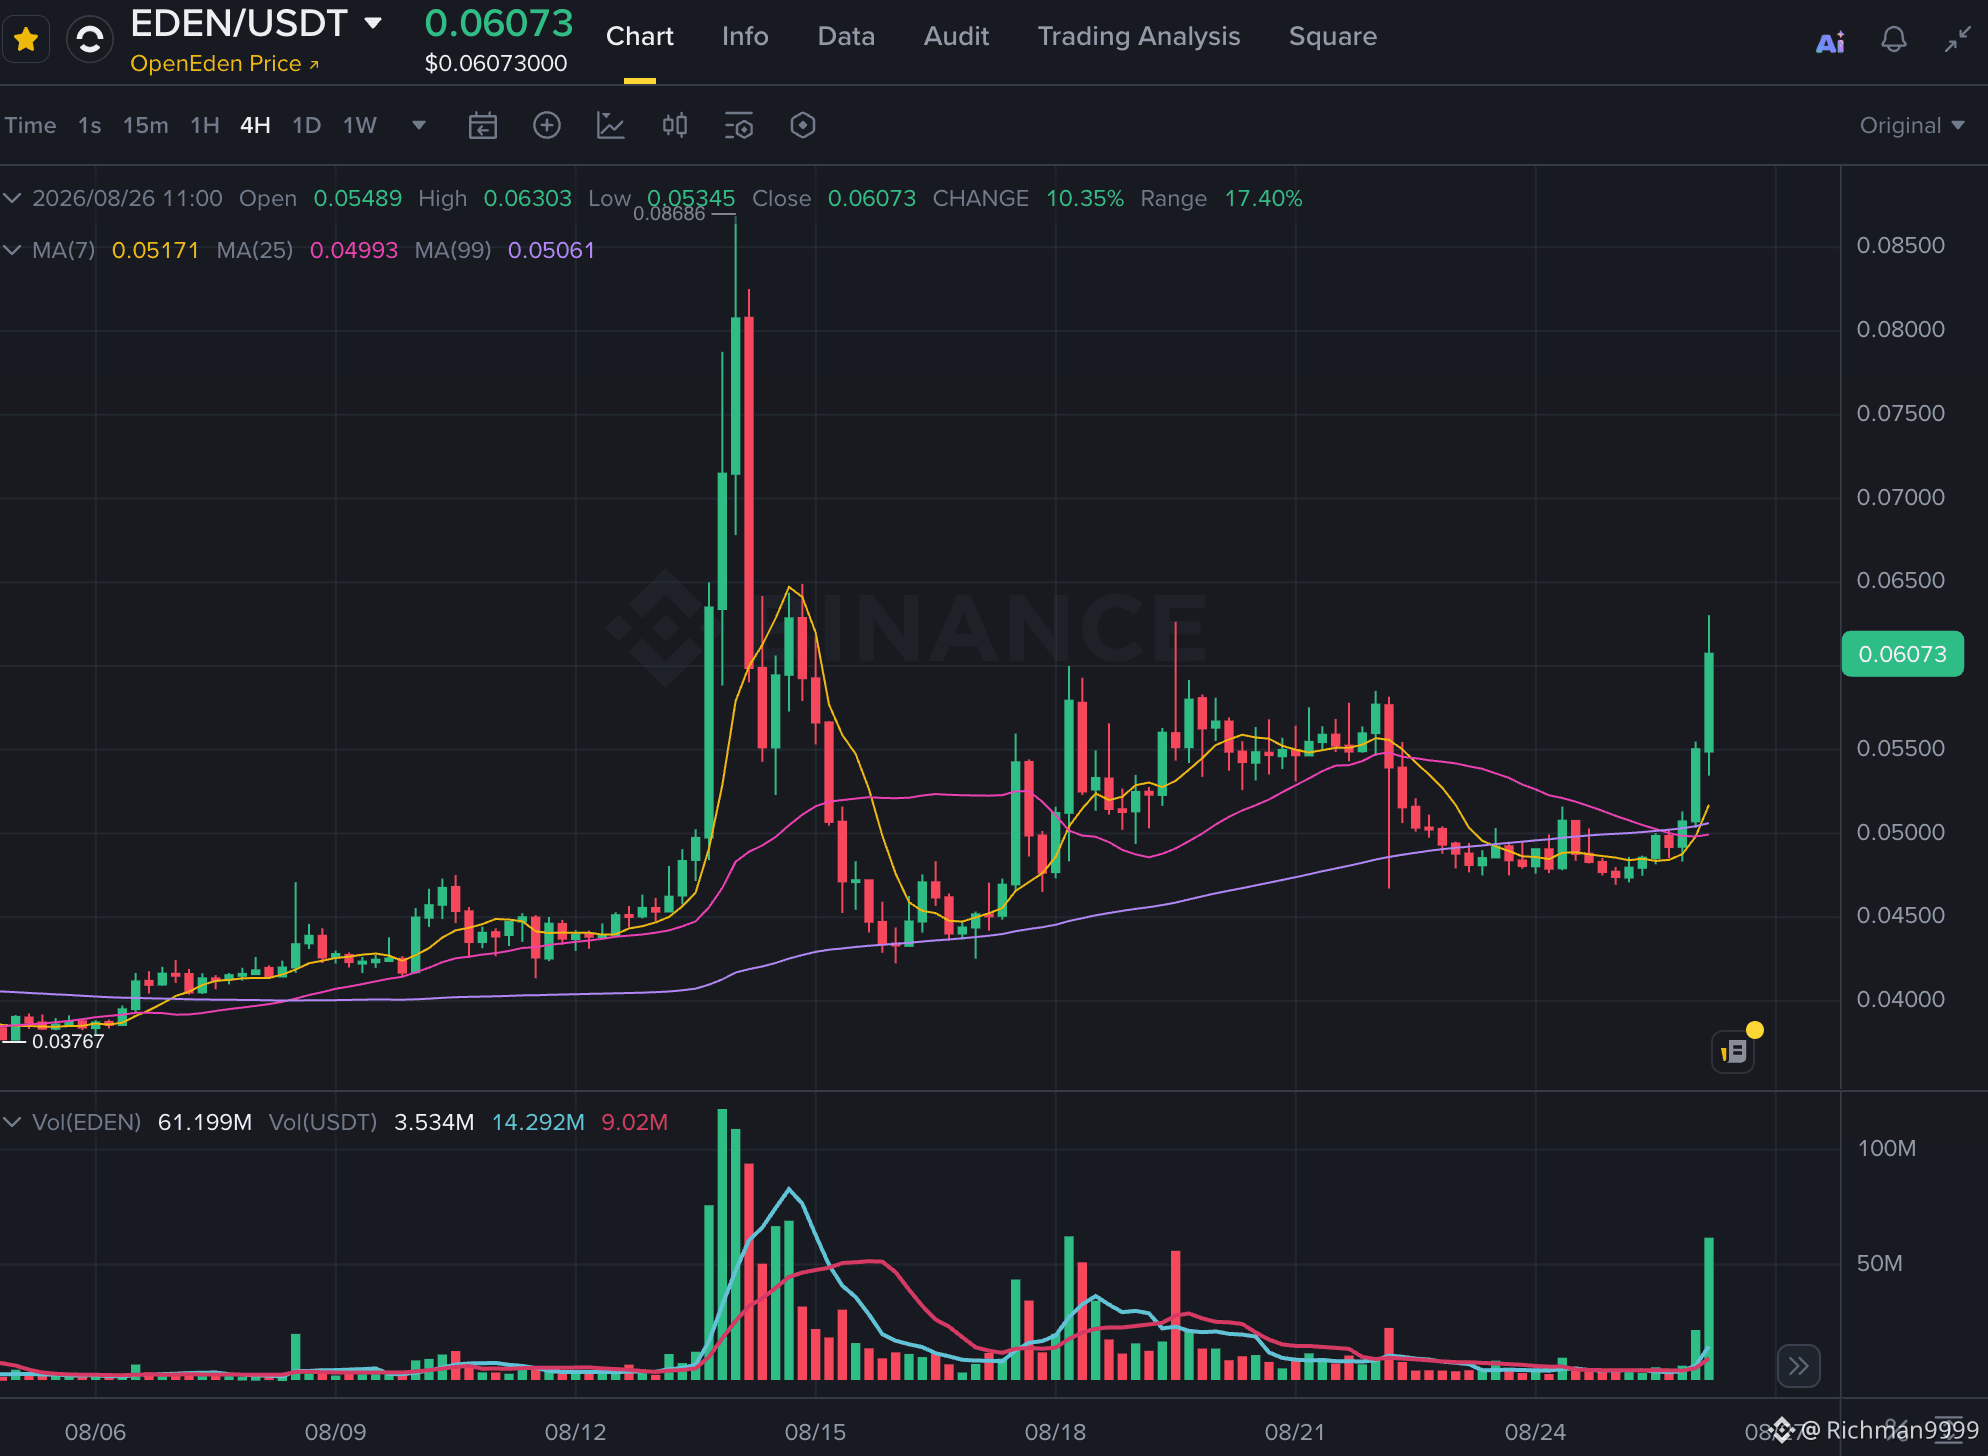
$ZRO /USDT (4H) - Short Setup After Strong Rejection
ZRO had a strong impulsive rally from 0.75 up to 1.344, but got rejected hard at the highs. Price is now pulling back and showing signs of weakness.
* Key Observations:
Strong rejection at 1.344 with heavy selling pressureLarge volume spike near the top → possible distributionCurrently trading below the recent structure and struggling to reclaim higher levelsMA25 acting as dynamic resistance on any bounce
* Short Bias Setup:
- Entry Zone: 1.22 – 1.26 (relief bounce area)
- Stop Loss: 1.33 – 1.35 (above the high)
- Take Profit 1: 1.10
- Take Profit 2: 0.95 – 1.00
- Take Profit 3: 0.82 – 0.85
* Risk/Reward: Very favorable if entered in the 1.23–1.25 range.
* Note: This is a short-term setup. Wait for price to reach the entry zone instead of chasing. A break below 1.145 would further confirm bearish momentum.
NFA, DYOR.
$ZRO #ZROUSDT #CryptoTrading #TechnicalAnalysis
ZRO had a strong impulsive rally from 0.75 up to 1.344, but got rejected hard at the highs. Price is now pulling back and showing signs of weakness.
* Key Observations:
Strong rejection at 1.344 with heavy selling pressureLarge volume spike near the top → possible distributionCurrently trading below the recent structure and struggling to reclaim higher levelsMA25 acting as dynamic resistance on any bounce
* Short Bias Setup:
- Entry Zone: 1.22 – 1.26 (relief bounce area)
- Stop Loss: 1.33 – 1.35 (above the high)
- Take Profit 1: 1.10
- Take Profit 2: 0.95 – 1.00
- Take Profit 3: 0.82 – 0.85
* Risk/Reward: Very favorable if entered in the 1.23–1.25 range.
* Note: This is a short-term setup. Wait for price to reach the entry zone instead of chasing. A break below 1.145 would further confirm bearish momentum.
NFA, DYOR.
$ZRO #ZROUSDT #CryptoTrading #TechnicalAnalysis
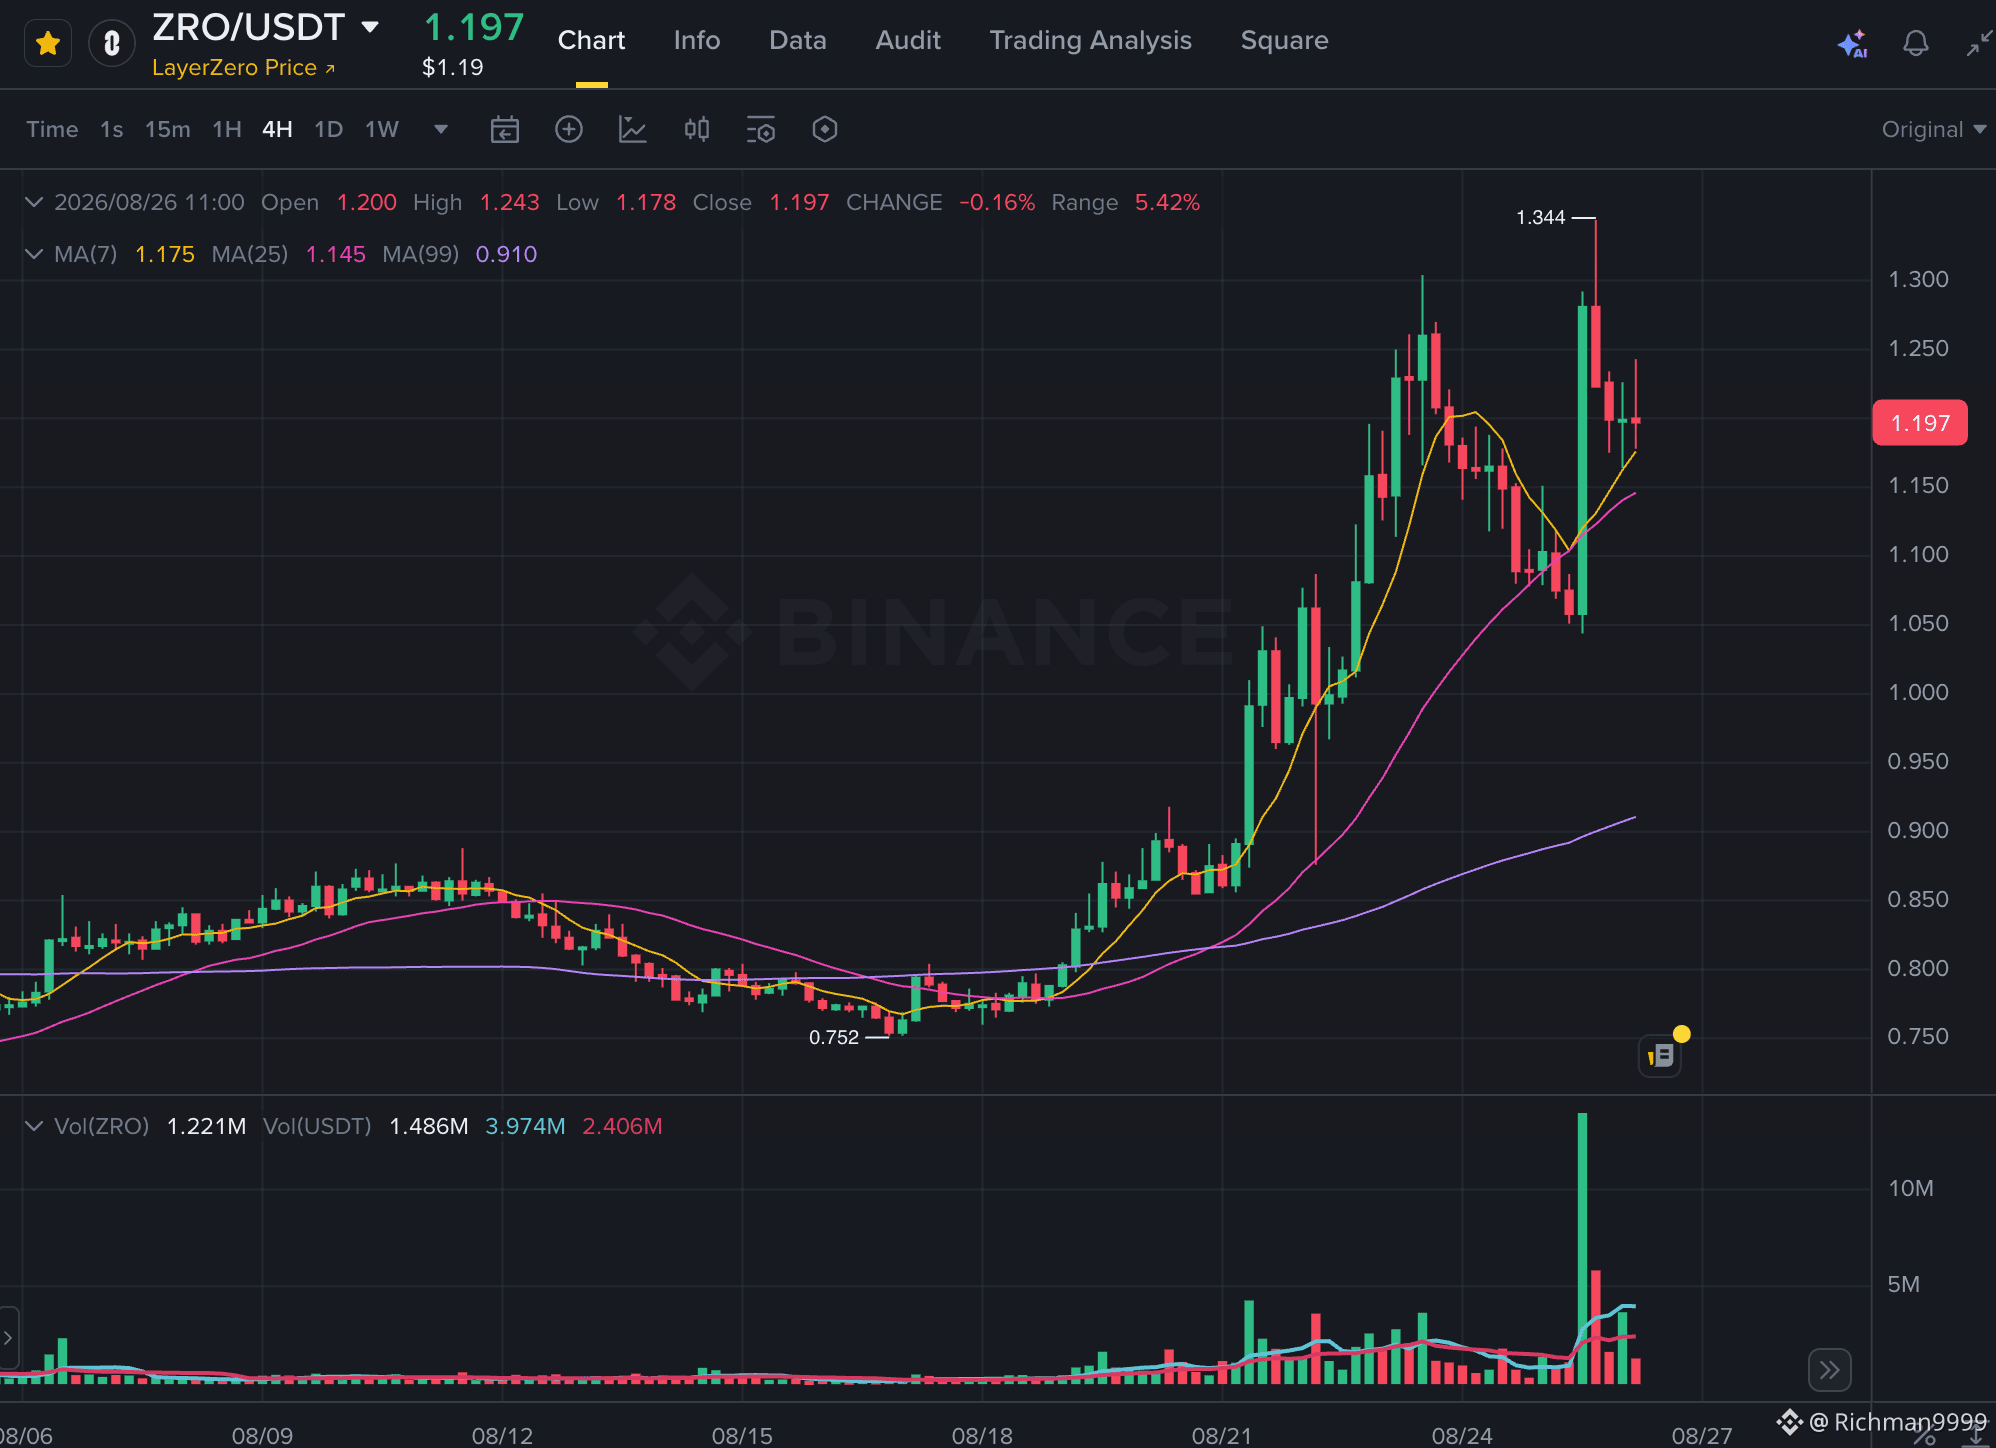
📊 Quick Technical Analysis: $BROCCOLI714 /USDT (4H Timeframe)
- Current Price: 0.01743 USDT
- Moving Averages (MA):
MA(7): 0.01724 – Price is currently stabilizing above MA(7).
MA(25): 0.01802 – Acts as the immediate overhead dynamic resistance.
MA(99): 0.01701 – Key medium-term structural support.
- Price Action & Structure:
Following a pullback from the secondary peak at 0.02050 – 0.02080 USDT, price is testing the confluence of MA(99) and the local support base (0.01680 – 0.01710 USDT).
4H candles are showing lower wick rejections, indicating active buying interest at support.
Volume has dried up substantially during the decline, signaling seller exhaustion.
🎯 Trading Setup (Entry, SL, TP)
- Scenario 1: Long Setup at MA(99) Support (Primary Plan)
Entry Zone: 0.01710 – 0.01740 USDT (Current market price / pullback to 0.01710).
Stop Loss (SL): 0.01640 USDT (4H candle close below 0.01680 and breaking MA99).
Take Profit (TP):
TP1: 0.01800 – 0.01820 USDT (MA25 resistance — secure 40%, move SL to Breakeven).
TP2: 0.01950 – 0.02000 USDT (Previous swing high — secure 40%).
TP3: 0.02150 – 0.02180 USDT (Retest of cycle high — ride remaining 20%).
Risk / Reward (R:R): 1 : 2.5 to 1 : 4.0.
- Scenario 2: Short Scalp at MA(25) Rejection (Counter-trend / High Risk)
Condition: Only trigger if price rebounds to 0.01800 – 0.01820 USDT with strong bearish reversal candles (Pinbar / Bearish Engulfing).
Entry: 0.01800 – 0.01820 USDT
Stop Loss (SL): 0.01860 USDT
Take Profit (TP): 0.01710 – 0.01680 USDT
$BROCCOLI714 #BROCCOLI714 #BinanceSquare #CryptoTrading #PriceAction #TechnicalAnalysis #TradingSetup #CryptoAnalysis #CZ #MemeCoin $BTC
- Current Price: 0.01743 USDT
- Moving Averages (MA):
MA(7): 0.01724 – Price is currently stabilizing above MA(7).
MA(25): 0.01802 – Acts as the immediate overhead dynamic resistance.
MA(99): 0.01701 – Key medium-term structural support.
- Price Action & Structure:
Following a pullback from the secondary peak at 0.02050 – 0.02080 USDT, price is testing the confluence of MA(99) and the local support base (0.01680 – 0.01710 USDT).
4H candles are showing lower wick rejections, indicating active buying interest at support.
Volume has dried up substantially during the decline, signaling seller exhaustion.
🎯 Trading Setup (Entry, SL, TP)
- Scenario 1: Long Setup at MA(99) Support (Primary Plan)
Entry Zone: 0.01710 – 0.01740 USDT (Current market price / pullback to 0.01710).
Stop Loss (SL): 0.01640 USDT (4H candle close below 0.01680 and breaking MA99).
Take Profit (TP):
TP1: 0.01800 – 0.01820 USDT (MA25 resistance — secure 40%, move SL to Breakeven).
TP2: 0.01950 – 0.02000 USDT (Previous swing high — secure 40%).
TP3: 0.02150 – 0.02180 USDT (Retest of cycle high — ride remaining 20%).
Risk / Reward (R:R): 1 : 2.5 to 1 : 4.0.
- Scenario 2: Short Scalp at MA(25) Rejection (Counter-trend / High Risk)
Condition: Only trigger if price rebounds to 0.01800 – 0.01820 USDT with strong bearish reversal candles (Pinbar / Bearish Engulfing).
Entry: 0.01800 – 0.01820 USDT
Stop Loss (SL): 0.01860 USDT
Take Profit (TP): 0.01710 – 0.01680 USDT
$BROCCOLI714 #BROCCOLI714 #BinanceSquare #CryptoTrading #PriceAction #TechnicalAnalysis #TradingSetup #CryptoAnalysis #CZ #MemeCoin $BTC
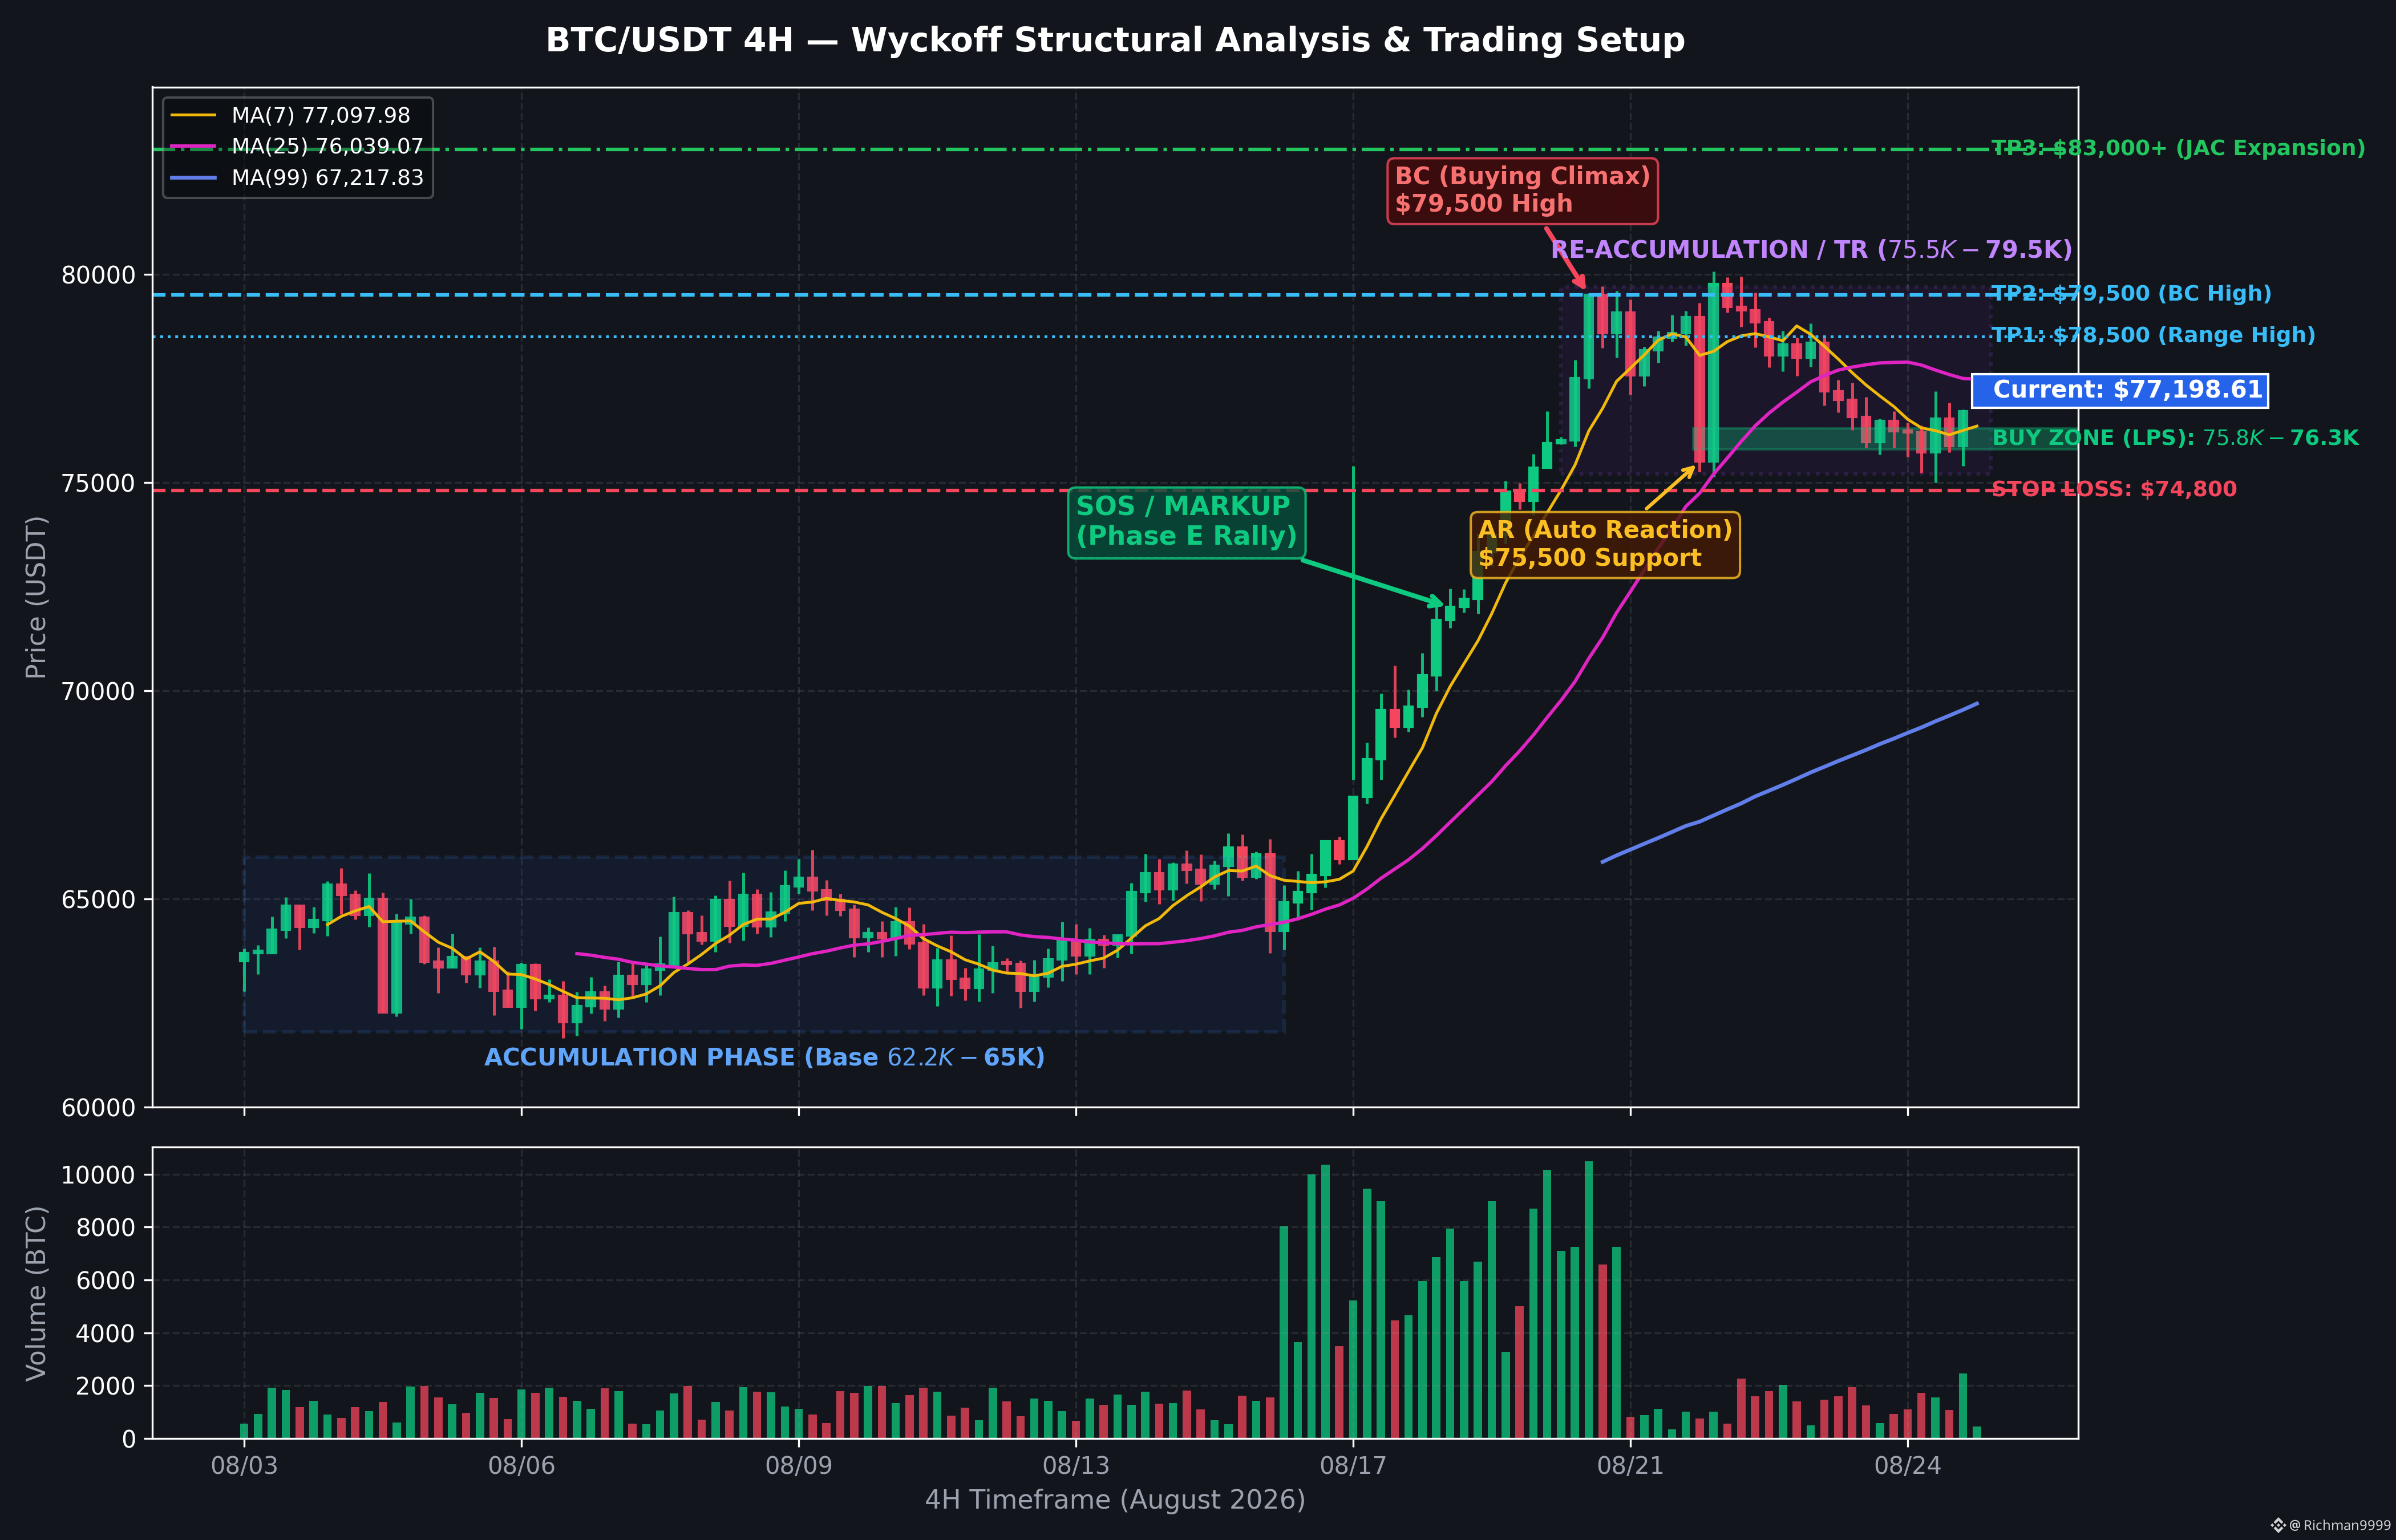
🚀 $BTC (4H) Wyckoff Update: Re-Accumulation or Distribution?
Bitcoin is currently consolidating around $77.2K following an explosive Sign of Strength (SOS) rally from the $62.2K base to $79.5K.
Here is what the Wyckoff structure is telling us on the 4H timeframe:
📊 Key Structure Breakdown:
Buying Climax (BC): Peak established at $79,500 with initial profit-taking.
Automatic Reaction (AR): Quick corrective dip well-defended at $75,500 (MA25 confluence).
Trading Range (TR): Sideways band between $75.5K – $79.5K.
Volume Dynamics: 4H volume is drying up significantly (~465 BTC), indicating seller exhaustion and institutional absorption rather than heavy distribution.
🎯 Actionable Trade Setup (Long on Dips / LPS):
🟢 Entry Zone: $75,800 – $76,300 (Wait for bullish rejection near MA25)
🛑 Stop Loss: $74,800 (Strict invalidation below AR low)
🎯 Take Profit:
TP1: $78,500
TP2: $79,500 (Range High / BC)
TP3: $83,000 – $85,000 (Breakout expansion)
⚡ Breakout Alternative: If BTC closes a solid 4H candle above $79,500 with high volume, look for a momentum entry targeting $83K–$85K.
⚠️ Disclaimer: Not financial advice. Always practice strict risk management (1-2% risk per trade).
#Bitcoin #BTC #Wyckoff #TradingSetup #BinanceSquare #CryptoAnalysis #PriceAction
Bitcoin is currently consolidating around $77.2K following an explosive Sign of Strength (SOS) rally from the $62.2K base to $79.5K.
Here is what the Wyckoff structure is telling us on the 4H timeframe:
📊 Key Structure Breakdown:
Buying Climax (BC): Peak established at $79,500 with initial profit-taking.
Automatic Reaction (AR): Quick corrective dip well-defended at $75,500 (MA25 confluence).
Trading Range (TR): Sideways band between $75.5K – $79.5K.
Volume Dynamics: 4H volume is drying up significantly (~465 BTC), indicating seller exhaustion and institutional absorption rather than heavy distribution.
🎯 Actionable Trade Setup (Long on Dips / LPS):
🟢 Entry Zone: $75,800 – $76,300 (Wait for bullish rejection near MA25)
🛑 Stop Loss: $74,800 (Strict invalidation below AR low)
🎯 Take Profit:
TP1: $78,500
TP2: $79,500 (Range High / BC)
TP3: $83,000 – $85,000 (Breakout expansion)
⚡ Breakout Alternative: If BTC closes a solid 4H candle above $79,500 with high volume, look for a momentum entry targeting $83K–$85K.
⚠️ Disclaimer: Not financial advice. Always practice strict risk management (1-2% risk per trade).
#Bitcoin #BTC #Wyckoff #TradingSetup #BinanceSquare #CryptoAnalysis #PriceAction
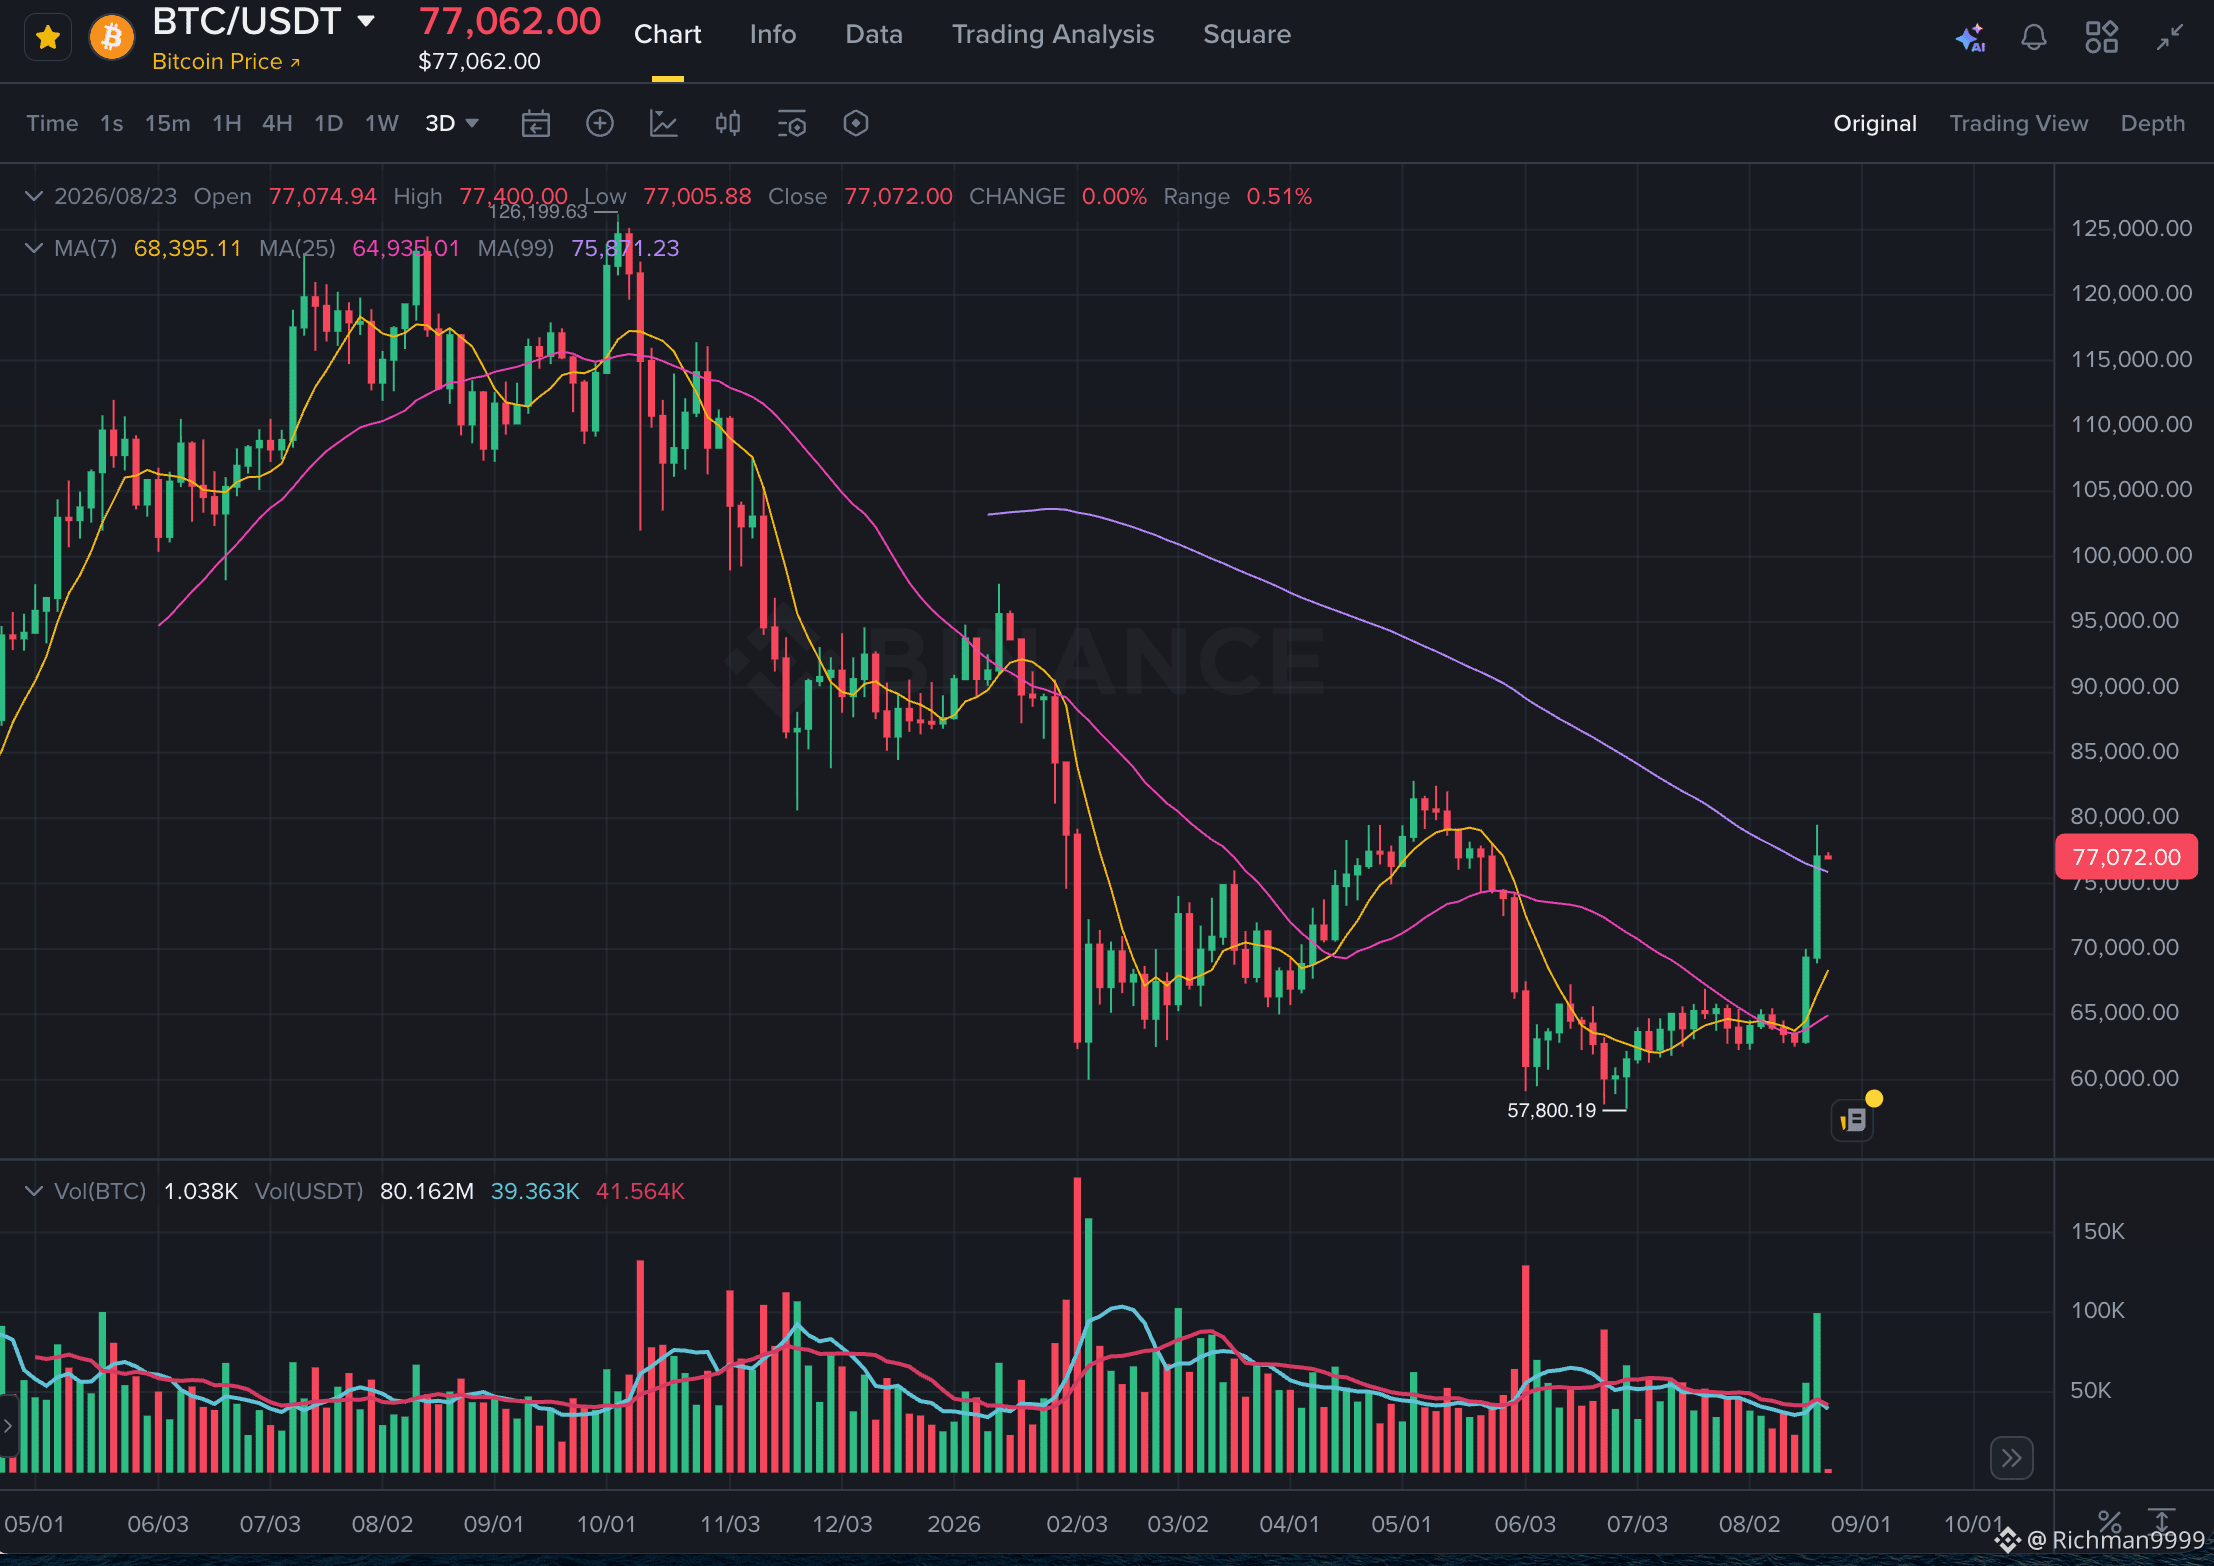
$BTC update 23/08/2026 - 3D Timeframe
BTC/USDT — Wyckoff read on the current structure
Bitcoin just printed a sharp break above 77k on a volume spike after four months of chop between 58k and 66k. Zooming out, this fits a full Wyckoff cycle:
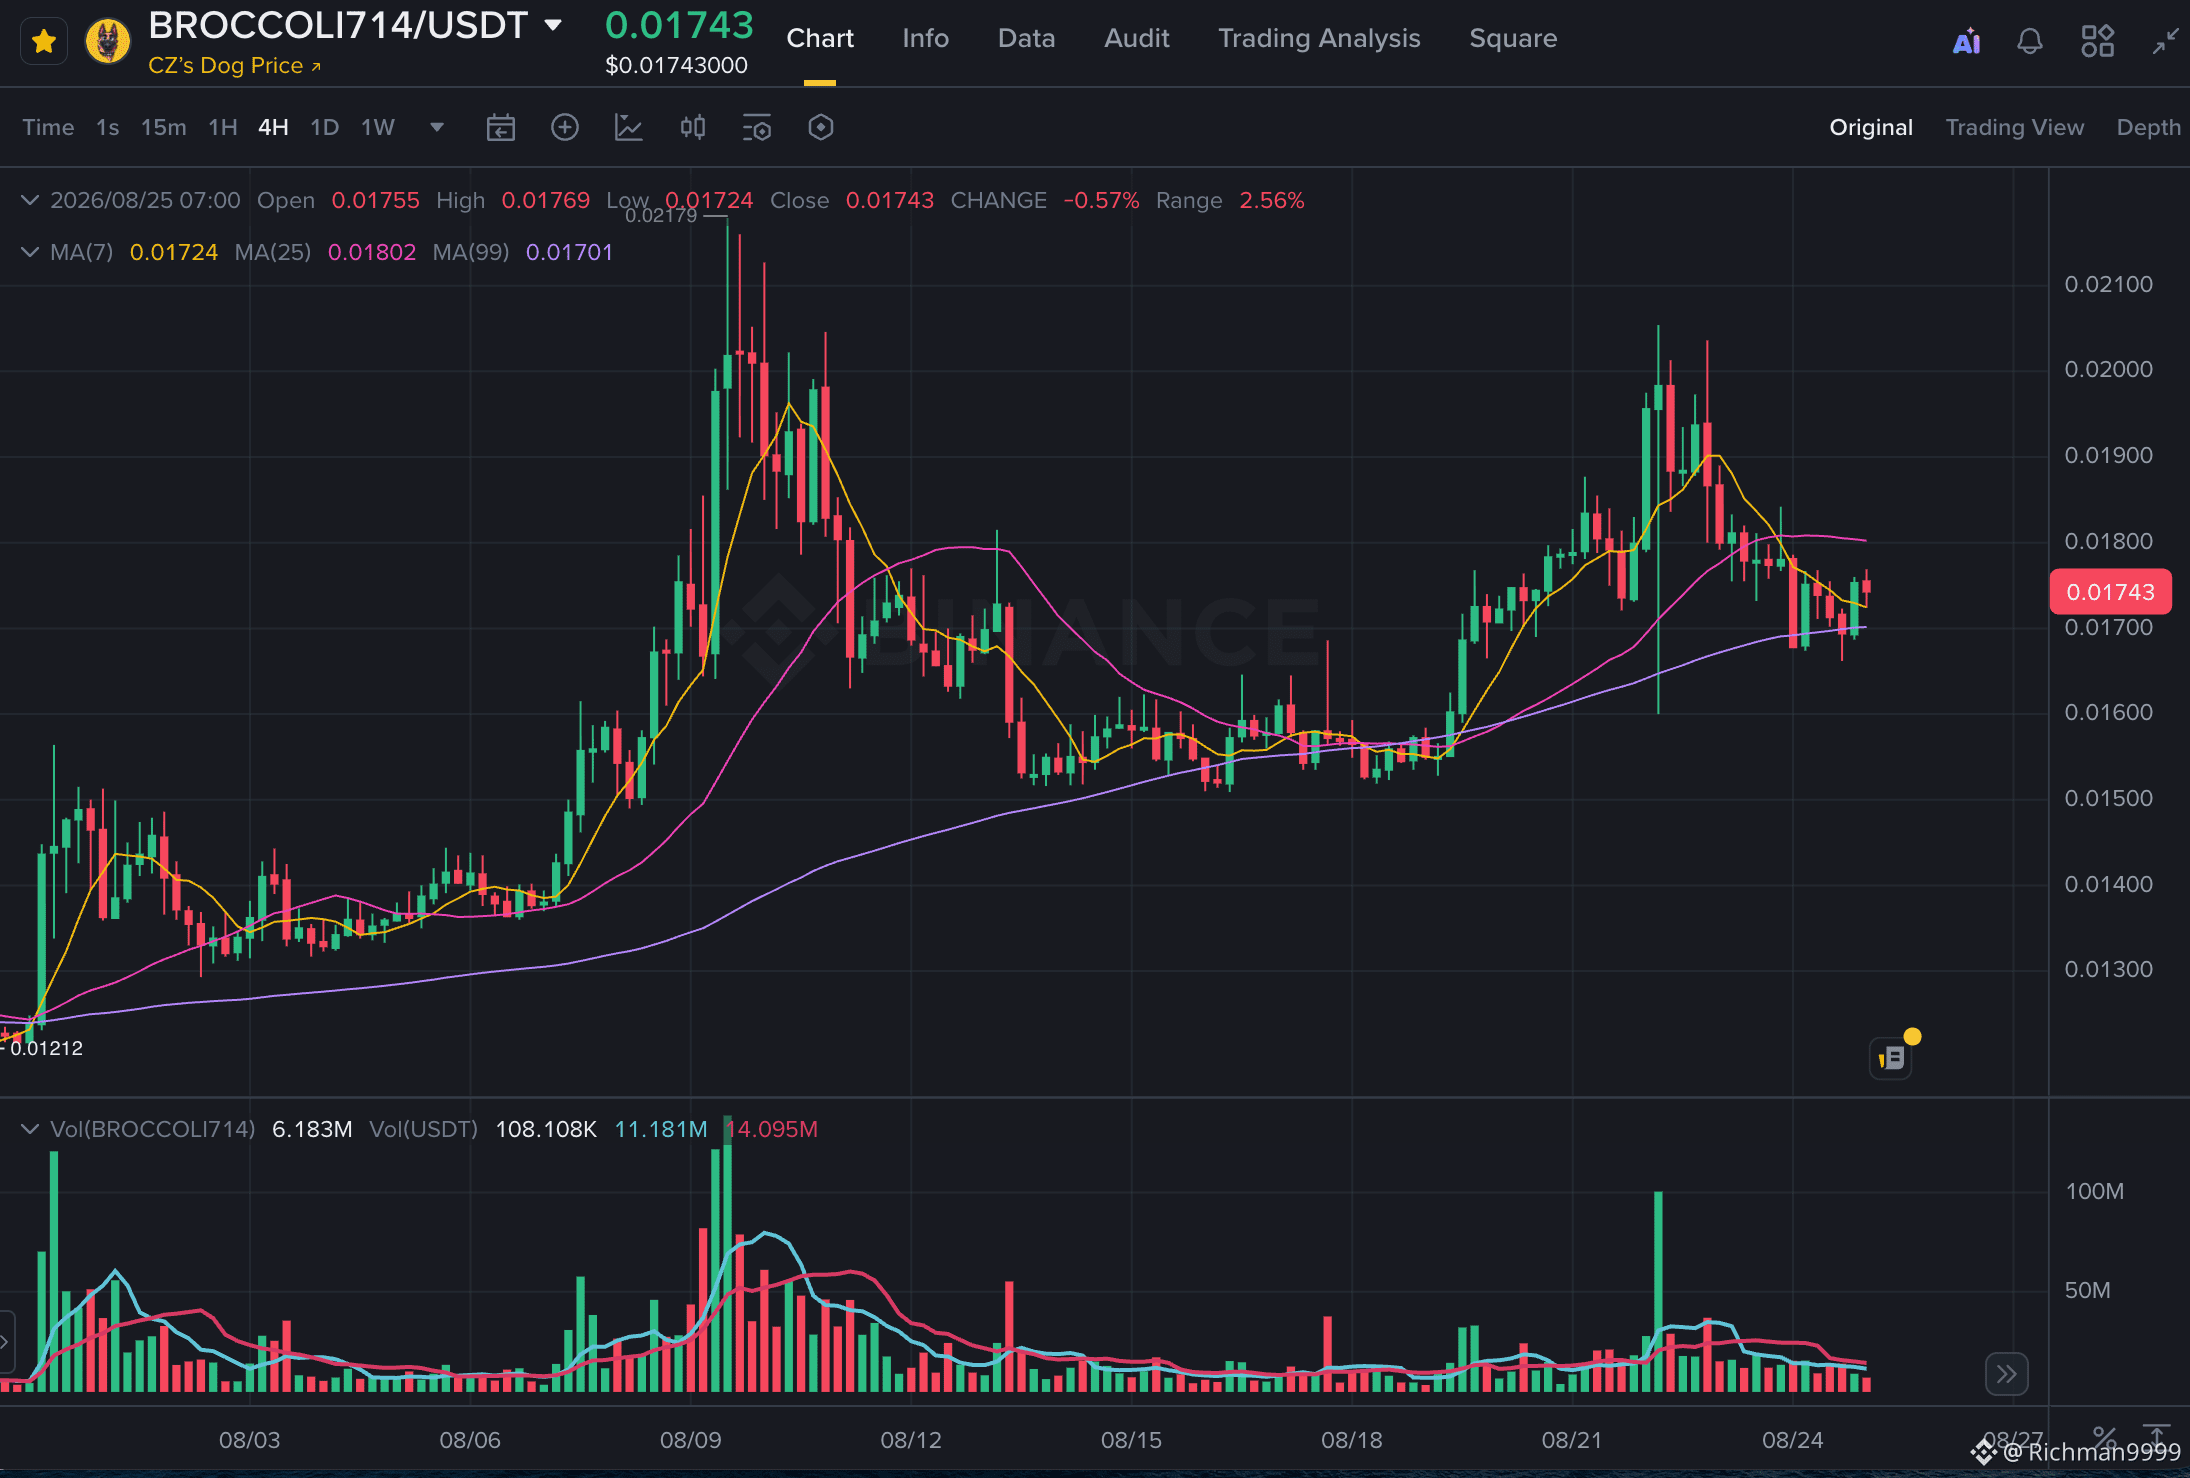
126,199 was the top — classic UTAD, price pushed past the old high, couldn't hold, sellers took over.
The drop that followed wasn't a straight line down. It bounced at 97k, failed, then gave way hard into a selling climax at 57,800.
From there: an automatic rally to 84.5k, then a secondary test back down near 61k that held above the SC low. That's the range — 58k to 85k — quietly building cause since March.
The move today is the Sign of Strength. Volume confirms it, and price closed above the 99MA (75.8k) for the first time since early this year.
What I'm watching next:
→ A pullback toward 70-72k on lighter volume (Last Point of Support) — confirms the SOS was real
→ A close above 84.5k — that's the range high, clears the structure
→ A drop back under 65k invalidates this and puts distribution back on the table
Wyckoff reads price and volume, not certainty. Treat this as a framework, not a signal.
#BTC #Wyckoff #TechnicalAnalysis. Not finance advice. DYOR
BTC/USDT — Wyckoff read on the current structure
Bitcoin just printed a sharp break above 77k on a volume spike after four months of chop between 58k and 66k. Zooming out, this fits a full Wyckoff cycle:
126,199 was the top — classic UTAD, price pushed past the old high, couldn't hold, sellers took over.
The drop that followed wasn't a straight line down. It bounced at 97k, failed, then gave way hard into a selling climax at 57,800.
From there: an automatic rally to 84.5k, then a secondary test back down near 61k that held above the SC low. That's the range — 58k to 85k — quietly building cause since March.
The move today is the Sign of Strength. Volume confirms it, and price closed above the 99MA (75.8k) for the first time since early this year.
What I'm watching next:
→ A pullback toward 70-72k on lighter volume (Last Point of Support) — confirms the SOS was real
→ A close above 84.5k — that's the range high, clears the structure
→ A drop back under 65k invalidates this and puts distribution back on the table
Wyckoff reads price and volume, not certainty. Treat this as a framework, not a signal.
#BTC #Wyckoff #TechnicalAnalysis. Not finance advice. DYOR
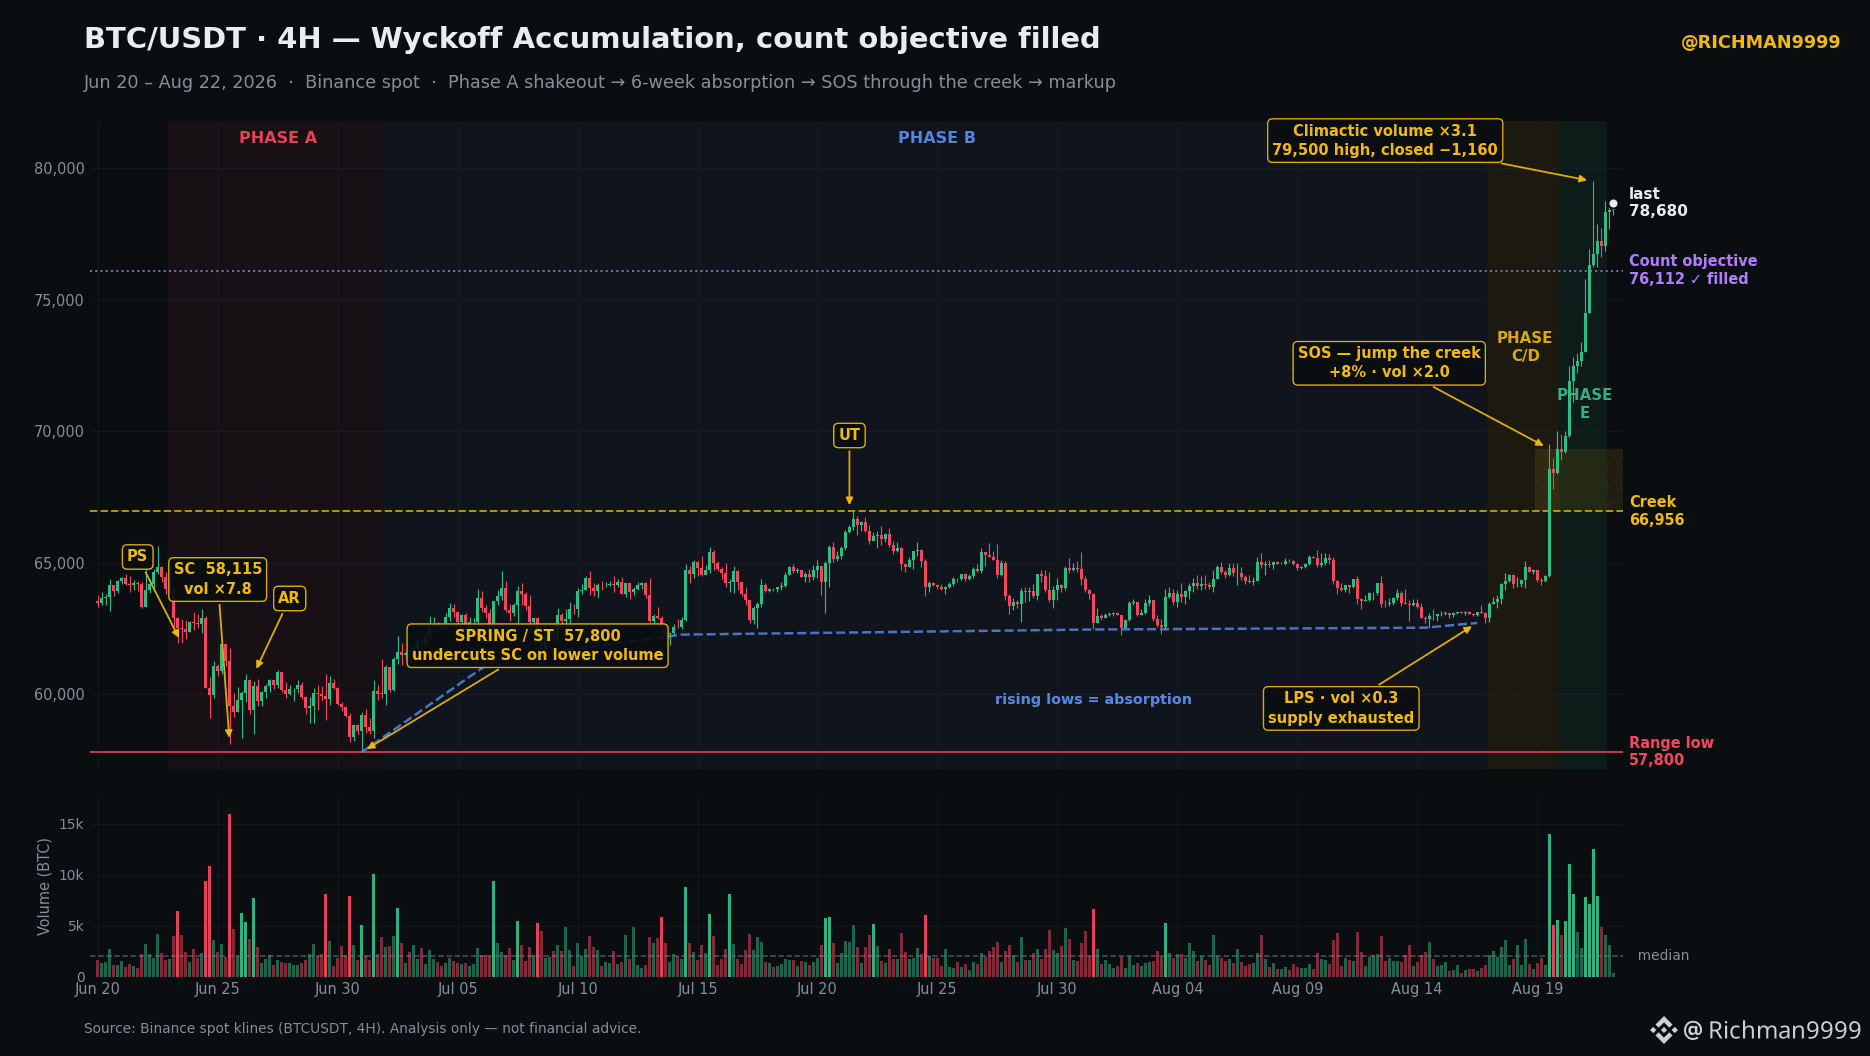
$BTC just filled its Wyckoff count and almost nobody is saying it out loud.
Jun 25: selling climax at 58,115 on 7.8x median volume.
Jul 1: price undercut it to 57,800 on LESS volume than the climax itself. That is a spring, not a breakdown.
Jul 2 - Aug 16: six weeks of rising lows (61,306 / 62,272 / 62,466 / 62,716) while volume died. Aug 16 printed 0.3x median, the quietest day in two months. Absorption finishing.
Aug 19: +8% through the creek on 2x volume.
Aug 21: 79,500 high on 3.1x volume, closed 1,160 off the high.
The range was 9,156 wide. Project it twice off the low: 76,112. We are at 78,680. The cause is spent.
What keeps me constructive anyway: perp premium never flipped positive through the entire 21% move, still sitting near -0.03%. A rip that size with futures at a discount to spot is spot demand, not leverage chasing.
Watching 69,335, the SOS close. Hold it and this is re-accumulation at a higher shelf. Lose it on a 4H close and the jump across the creek failed. The real creek is 66,956.
Backup at the 73k shelf, or all the way down to the creek?
Not financial advice.
Jun 25: selling climax at 58,115 on 7.8x median volume.
Jul 1: price undercut it to 57,800 on LESS volume than the climax itself. That is a spring, not a breakdown.
Jul 2 - Aug 16: six weeks of rising lows (61,306 / 62,272 / 62,466 / 62,716) while volume died. Aug 16 printed 0.3x median, the quietest day in two months. Absorption finishing.
Aug 19: +8% through the creek on 2x volume.
Aug 21: 79,500 high on 3.1x volume, closed 1,160 off the high.
The range was 9,156 wide. Project it twice off the low: 76,112. We are at 78,680. The cause is spent.
What keeps me constructive anyway: perp premium never flipped positive through the entire 21% move, still sitting near -0.03%. A rip that size with futures at a discount to spot is spot demand, not leverage chasing.
Watching 69,335, the SOS close. Hold it and this is re-accumulation at a higher shelf. Lose it on a 4H close and the jump across the creek failed. The real creek is 66,956.
Backup at the 73k shelf, or all the way down to the creek?
Not financial advice.
Войдите, чтобы посмотреть больше материала