

CUN BNB
9.5k Публикации

CUN BNB
Отправить жалобу
Заблокировать пользователя
AI Strategist | Daily Trade Setups | Trade Smart. Stay Disciplined. Real-Time Market Insights.
Открытая сделка
Трейдер с частыми сделками
6.9 г
1.5K+ подписок(и/а)
13.3K+ подписчиков(а)
11.2K+ понравилось
Посты
Портфель
Все
Цитирования
Видео
Активно
PINNED
·
--
Рост
🏆 TOP 11 — A New Milestone for CUN BNB! ❤️
I honestly never imagined reaching Top 11, and this might be CUN BNB's greatest achievement so far!
A huge THANK YOU to everyone who has supported, trusted, and followed CUN BNB throughout this journey. Your support means more than any ranking. ❤️
CUN is constantly learning, evolving, and improving trading strategies to deliver clearer analysis, better signals, and more valuable insights. I know I'm not perfect, but I'll always do my best to minimize mistakes and keep improving for everyone who trusts me.
🤝 A Special BIG THANK YOU to @000XX !
For those who don't know him, @000XX is an incredibly experienced trader who has supported me tremendously by sharing some truly impressive trade setups.
But what I admire most isn't just his trading accuracy - it's his calm mindset, patience, and decisiveness.
He knows when to wait, when to hunt for the right opportunity, and when to execute without hesitation. These are qualities I deeply respect and continue to learn from.
Trading isn't just about finding the perfect entry. It's about discipline, patience, and emotional control. And @000XX is a great example of that.
Follow him to learn more !!!
Once again, thank you to everyone who believes in CUN BNB. This milestone belongs to all of us! 🫶
Top 11 today, but our journey is far from over. Let's keep learning, growing, and becoming better traders together! 🚀
$BTC $ETH
2.3k
3
97
2.3k
PINNED
·
--
Рост
A little curious about how the rest of today plays out 🤍
I'm long on $ETH /USDT and price is sitting right where I wanted it. Buyers seem to be holding their ground here. Levels are below. If it pays quickly, I'll protect some profit and move on.
📍 Entry: 1653 - 1657
🛑 SL: 1639
✦ TP1: 1667
✦ TP2: 1675
✦ TP3: 1687
Maybe this one surprises us 🍀
Tap Add Trade if you want to track this with me 💛
{future}(ETHUSDT)
Disclaimer: NFA. Scalp setups move fast; manage your own risk.
A little curious about how the rest of today plays out 🤍
I'm long on $ETH /USDT and price is sitting right where I wanted it. Buyers seem to be holding their ground here. Levels are below. If it pays quickly, I'll protect some profit and move on.
📍 Entry: 1653 - 1657
🛑 SL: 1639
✦ TP1: 1667
✦ TP2: 1675
✦ TP3: 1687
Maybe this one surprises us 🍀
Tap Add Trade if you want to track this with me 💛
Disclaimer: NFA. Scalp setups move fast; manage your own risk.
75
2
116
31.2k
·
--
Падение
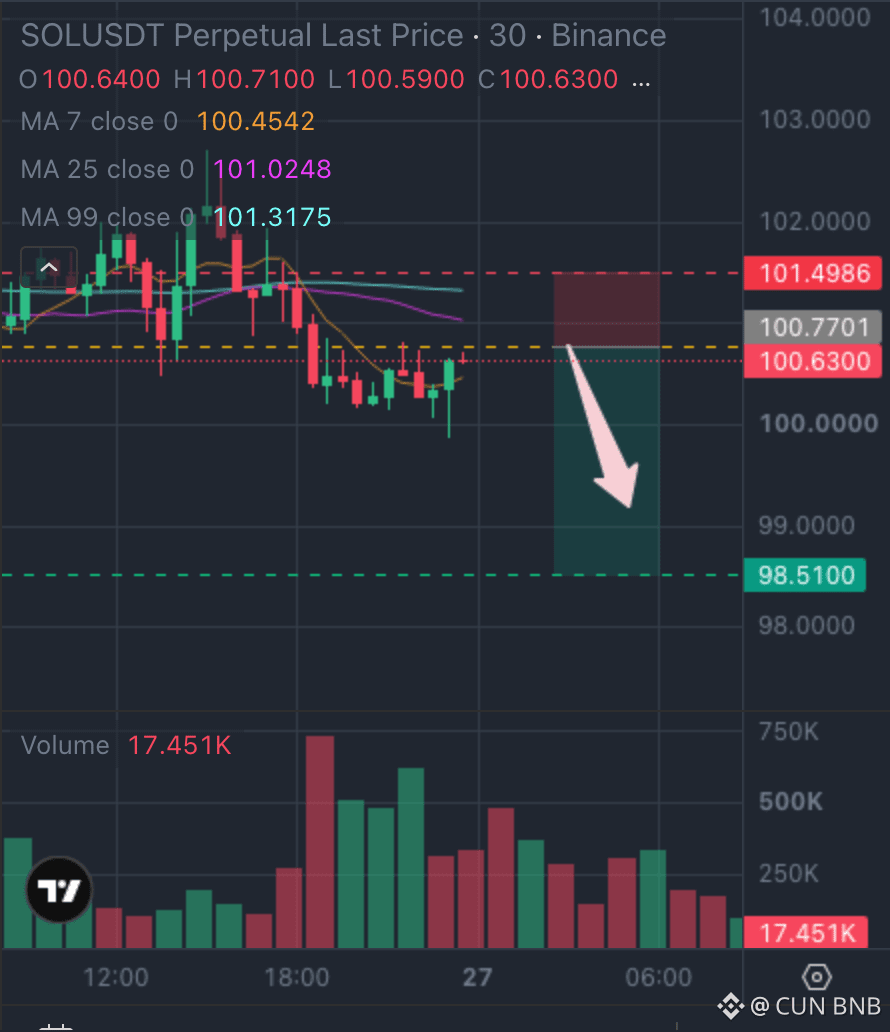
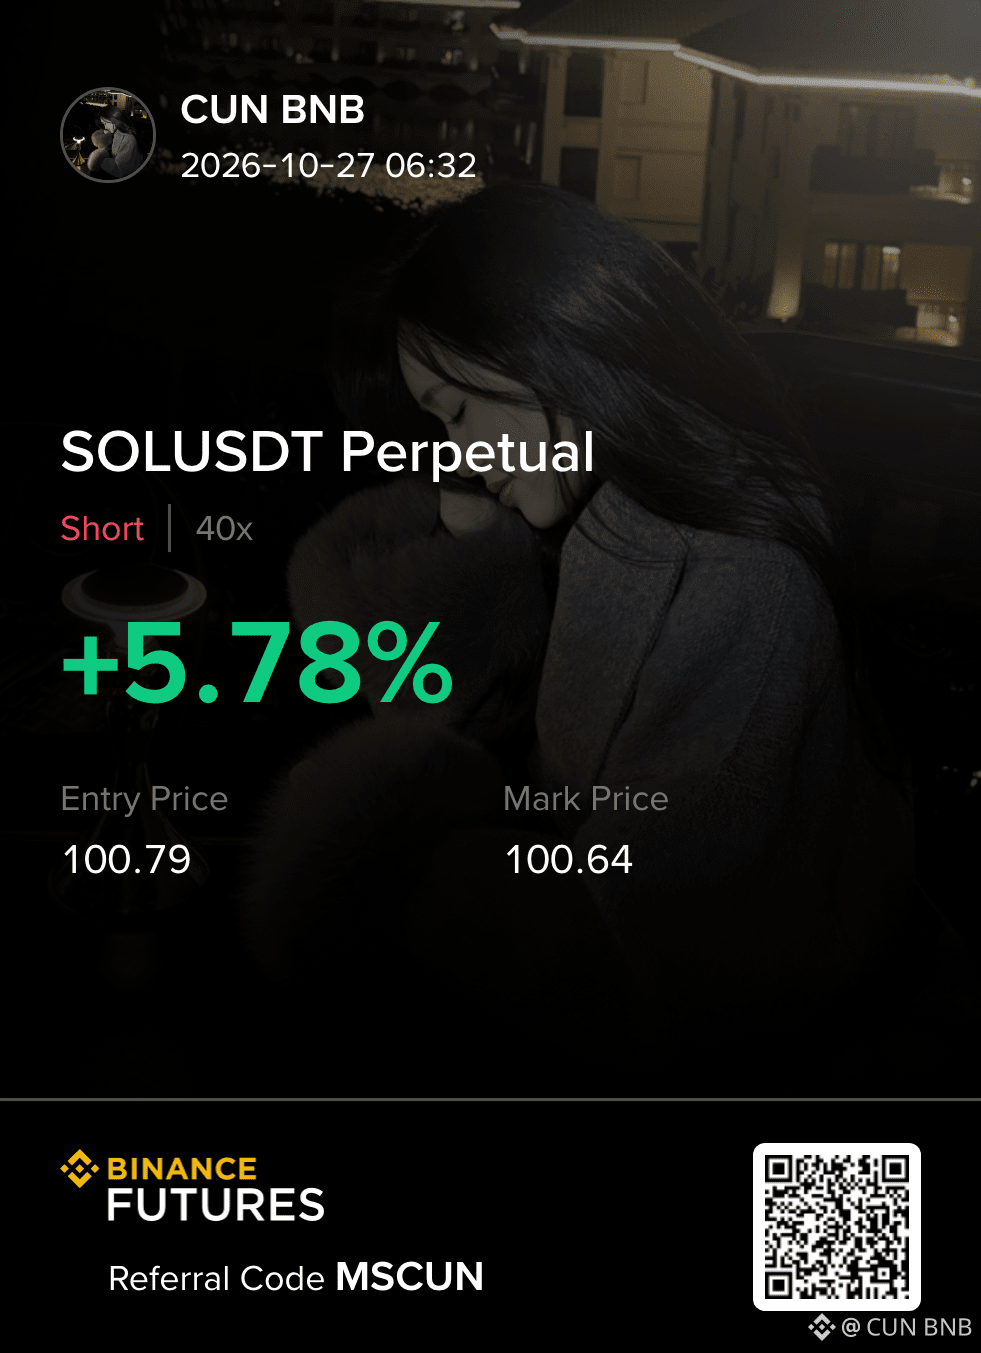
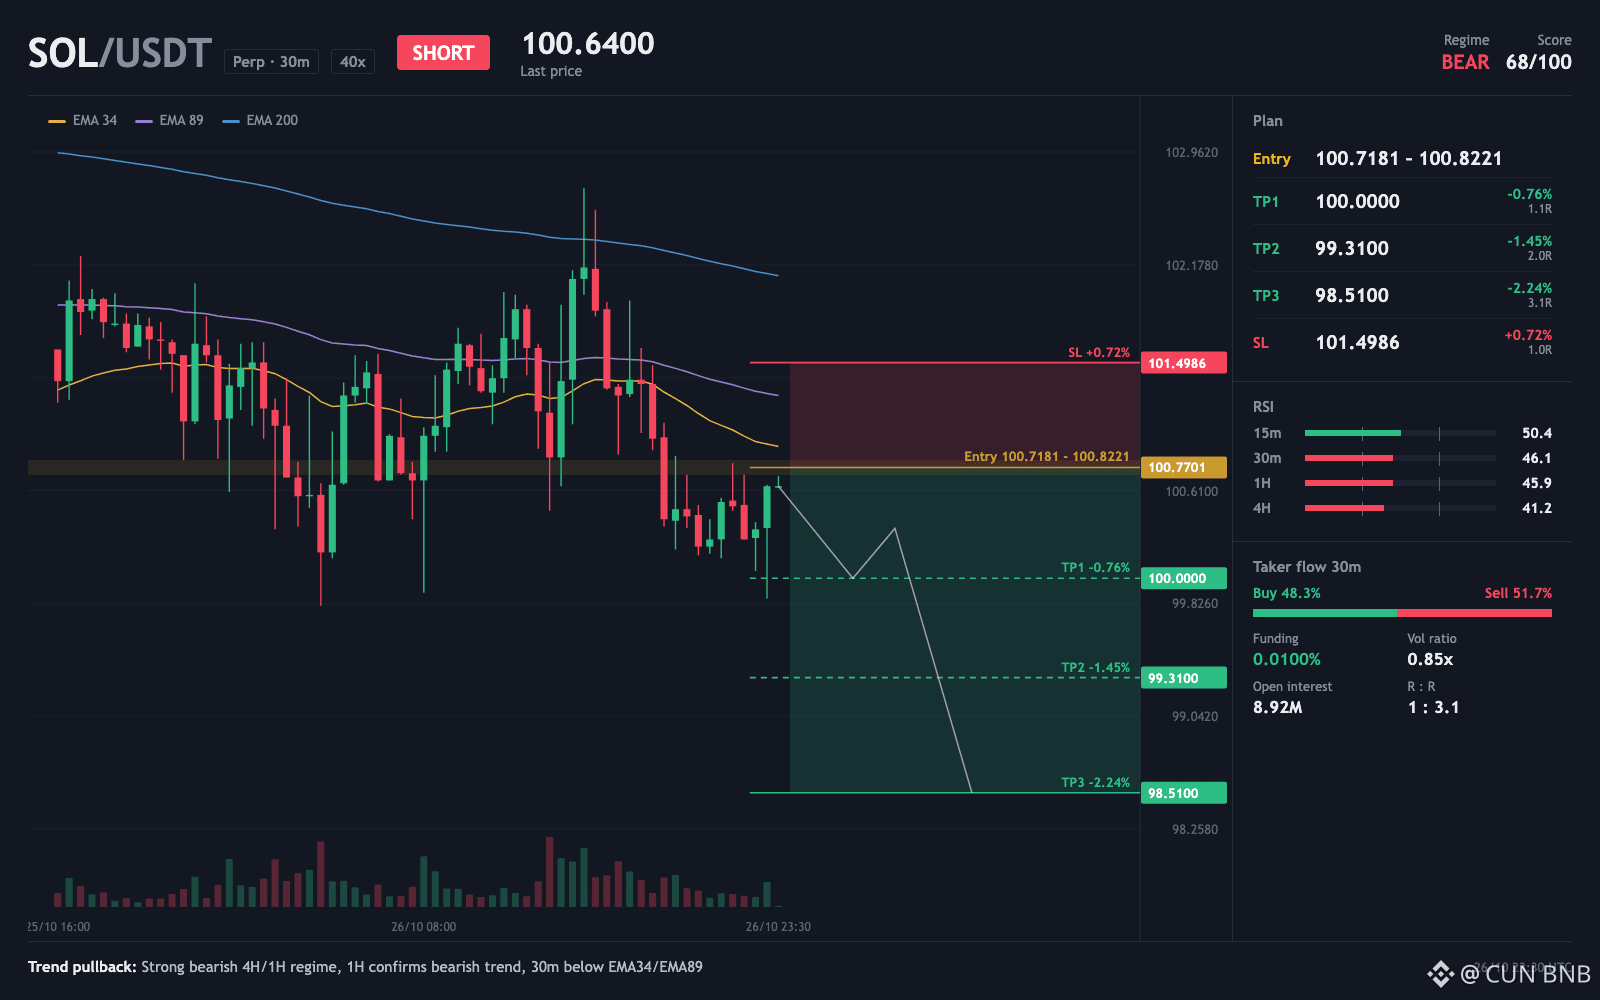
$SOL - SHORT execution plan
At a glance $SOL looks calm. Look closer, the 1-hour and 4-hour RSI show sellers in control.
Part of this idea is already done today. The price here is not the earlier price, and I am sizing for that.
The 1-hour RSI sits at 46 and the 4-hour at 41, both under 50 but well above 30, so sellers hold the edge without the market being washed out. That leaves room for more downside before any bounce gets a foothold.
The entry zone sits about 0.1% above current price, and the stop is 0.7% from entry, which is the gap to respect if price pushes up first. BTC is trending down too, so the wider market blows the same way.
Anyone watching 100.72 instead of the entry zone?
TRADE PLAN
Entry zone: 100.72 - 100.82 (ref 100.786)
TP1: 100 (+0.78%)
TP2: 99.31 (+1.46%)
TP3: 98.51 (+2.26%)
Stop loss: 101.5 (-0.71%)
⚠️ Personal market insight, not investment advice. DYOR.
{future}(SOLUSDT)
$SOL - SHORT execution plan
At a glance $SOL looks calm. Look closer, the 1-hour and 4-hour RSI show sellers in control.
Part of this idea is already done today. The price here is not the earlier price, and I am sizing for that.
The 1-hour RSI sits at 46 and the 4-hour at 41, both under 50 but well above 30, so sellers hold the edge without the market being washed out. That leaves room for more downside before any bounce gets a foothold.
The entry zone sits about 0.1% above current price, and the stop is 0.7% from entry, which is the gap to respect if price pushes up first. BTC is trending down too, so the wider market blows the same way.
Anyone watching 100.72 instead of the entry zone?
TRADE PLAN
Entry zone: 100.72 - 100.82 (ref 100.786)
TP1: 100 (+0.78%)
TP2: 99.31 (+1.46%)
TP3: 98.51 (+2.26%)
Stop loss: 101.5 (-0.71%)
⚠️ Personal market insight, not investment advice. DYOR.
94
·
--
Рост
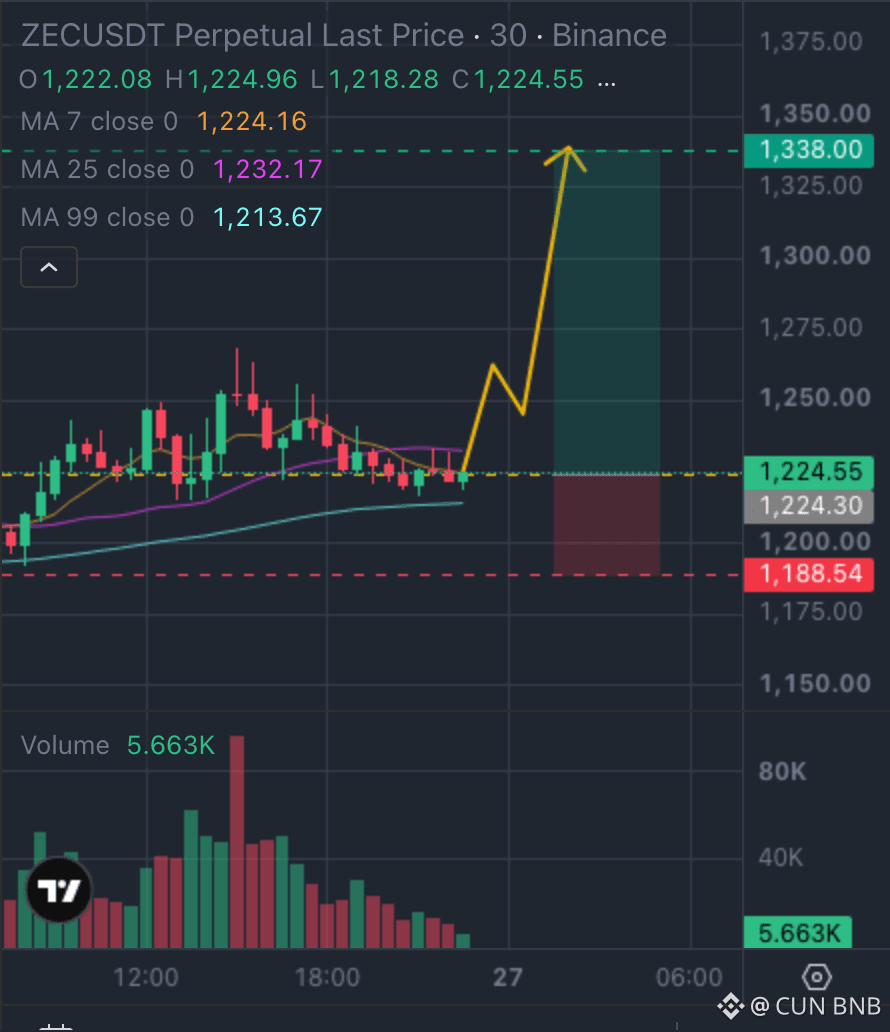
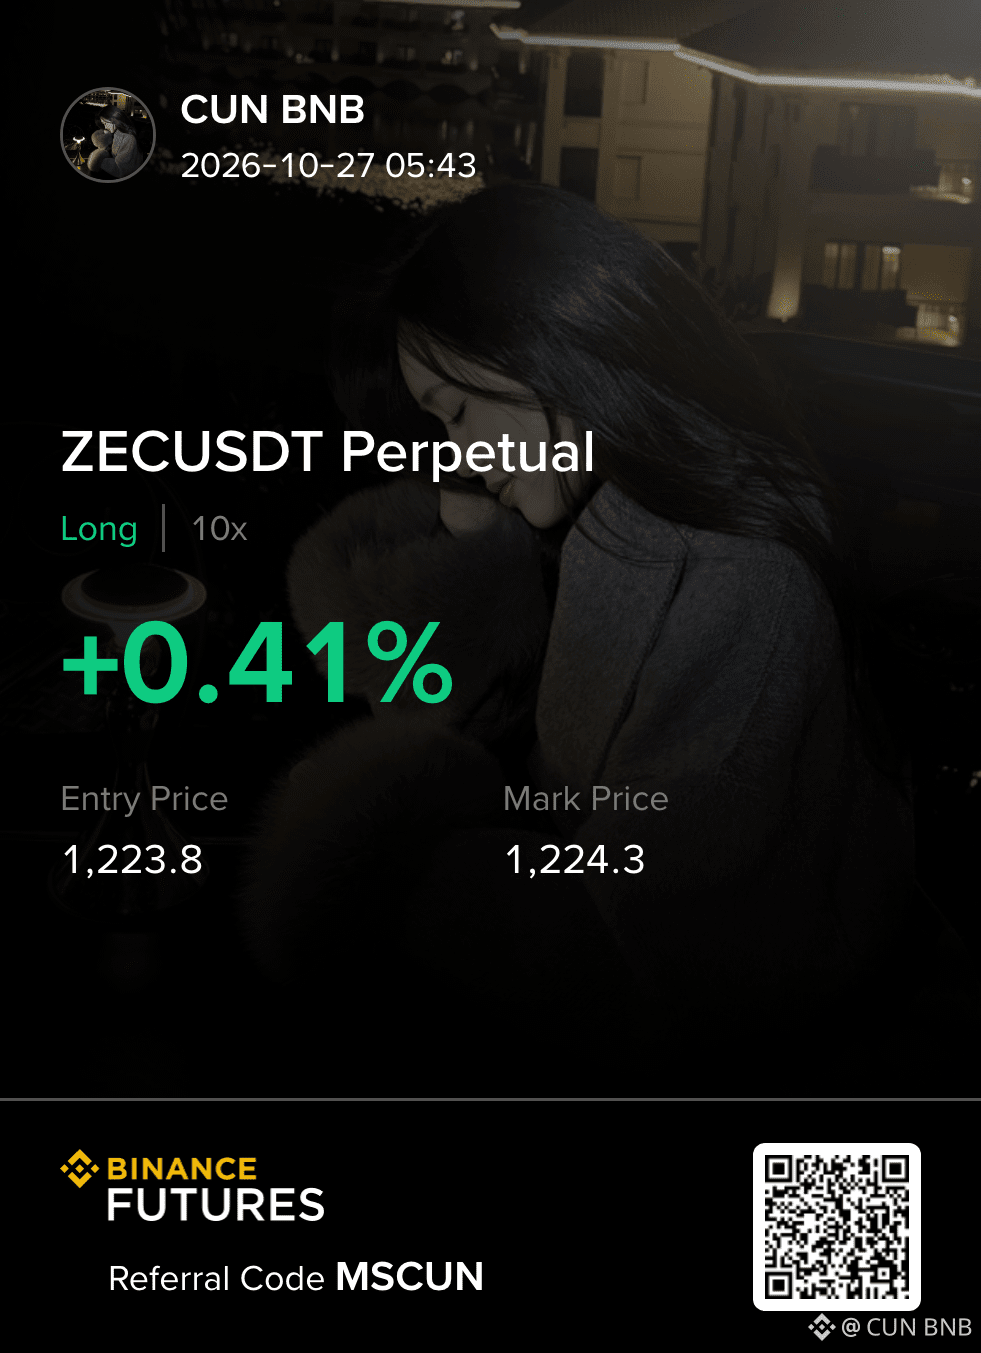
$ZEC - seeing a LONG advantage
POV: you almost skipped $ZEC because holding it felt too expensive.
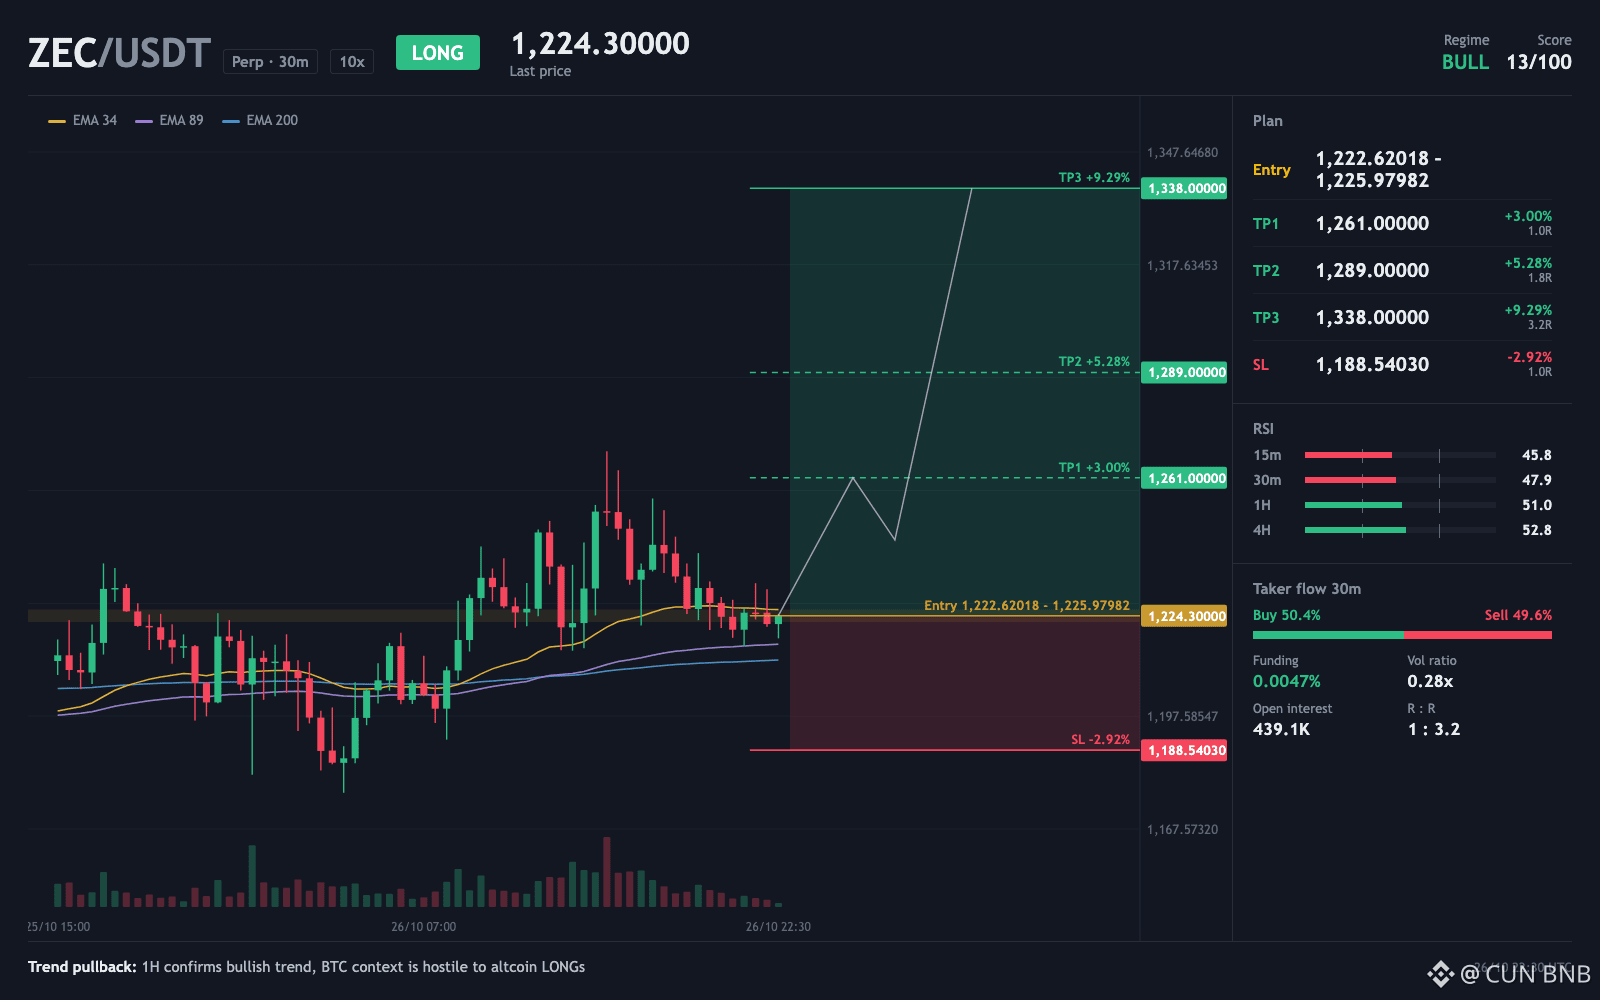
TRADE PLAN
Entry zone: 1222.62 - 1225.98 (ref 1223.796)
TP1: 1261 (+3.04%)
TP2: 1289 (+5.33%)
TP3: 1338 (+9.33%)
Stop loss: 1188.54 (-2.88%)
- I nearly waved off the funding at 0.0047%, the cost longs pay shorts just to stay open.
- That tells me the long side isn't cheap right now, but buys at 50.4% mean nobody is chasing either way.
- What gets me is price already sitting in the zone, and the stop 2.9% out gives this room to breathe.
Does that 0.0047% funding worry you, or is even buy flow the calmer sign?
⚠️ Personal market insight, not investment advice. DYOR.
{future}(ZECUSDT)
$ZEC - seeing a LONG advantage
POV: you almost skipped $ZEC because holding it felt too expensive.
TRADE PLAN
Entry zone: 1222.62 - 1225.98 (ref 1223.796)
TP1: 1261 (+3.04%)
TP2: 1289 (+5.33%)
TP3: 1338 (+9.33%)
Stop loss: 1188.54 (-2.88%)
- I nearly waved off the funding at 0.0047%, the cost longs pay shorts just to stay open.
- That tells me the long side isn't cheap right now, but buys at 50.4% mean nobody is chasing either way.
- What gets me is price already sitting in the zone, and the stop 2.9% out gives this room to breathe.
Does that 0.0047% funding worry you, or is even buy flow the calmer sign?
⚠️ Personal market insight, not investment advice. DYOR.
254
·
--
Рост
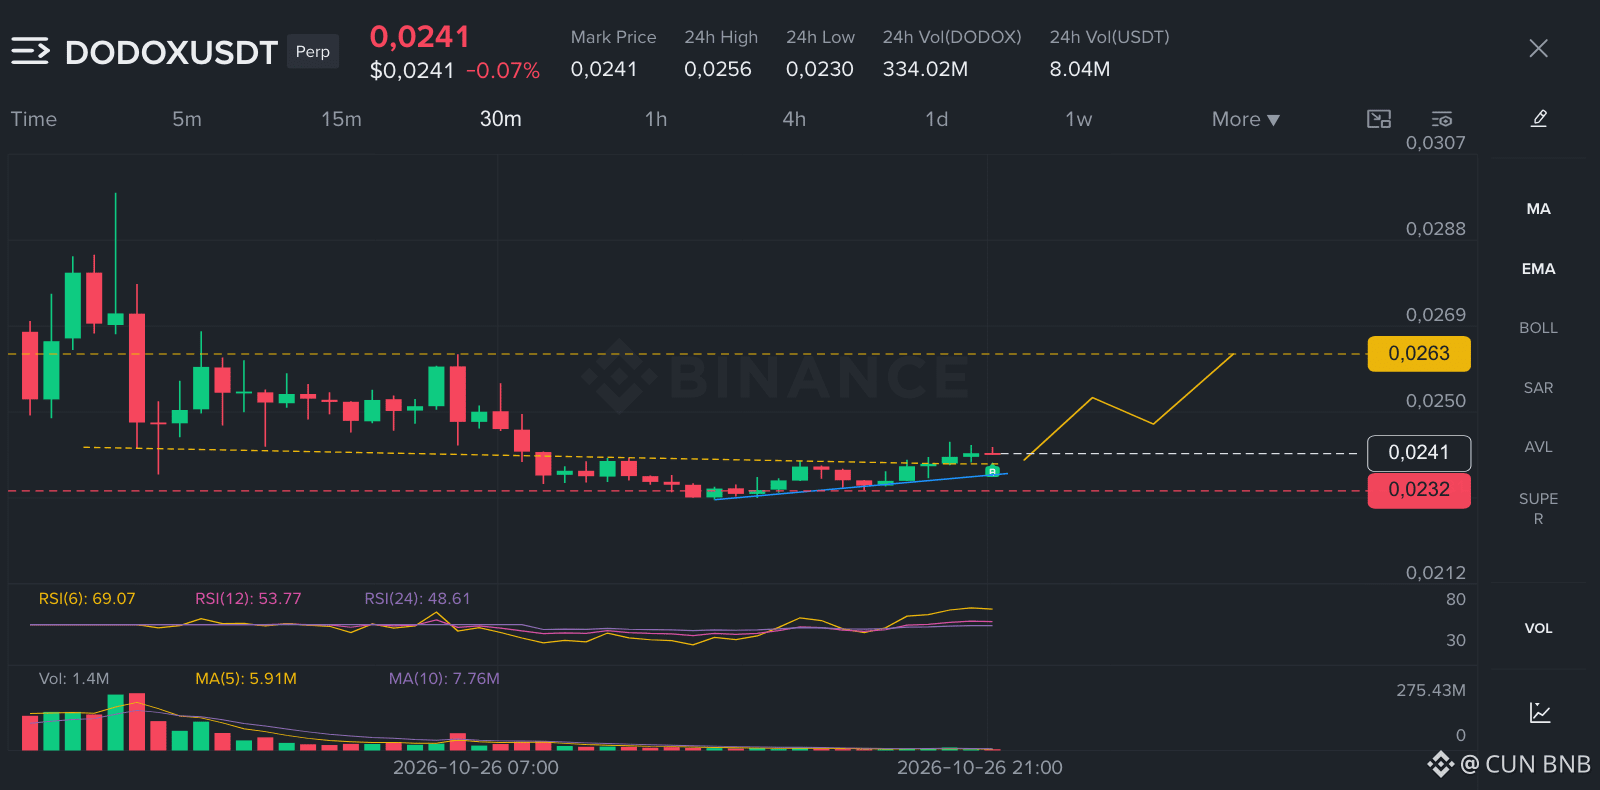
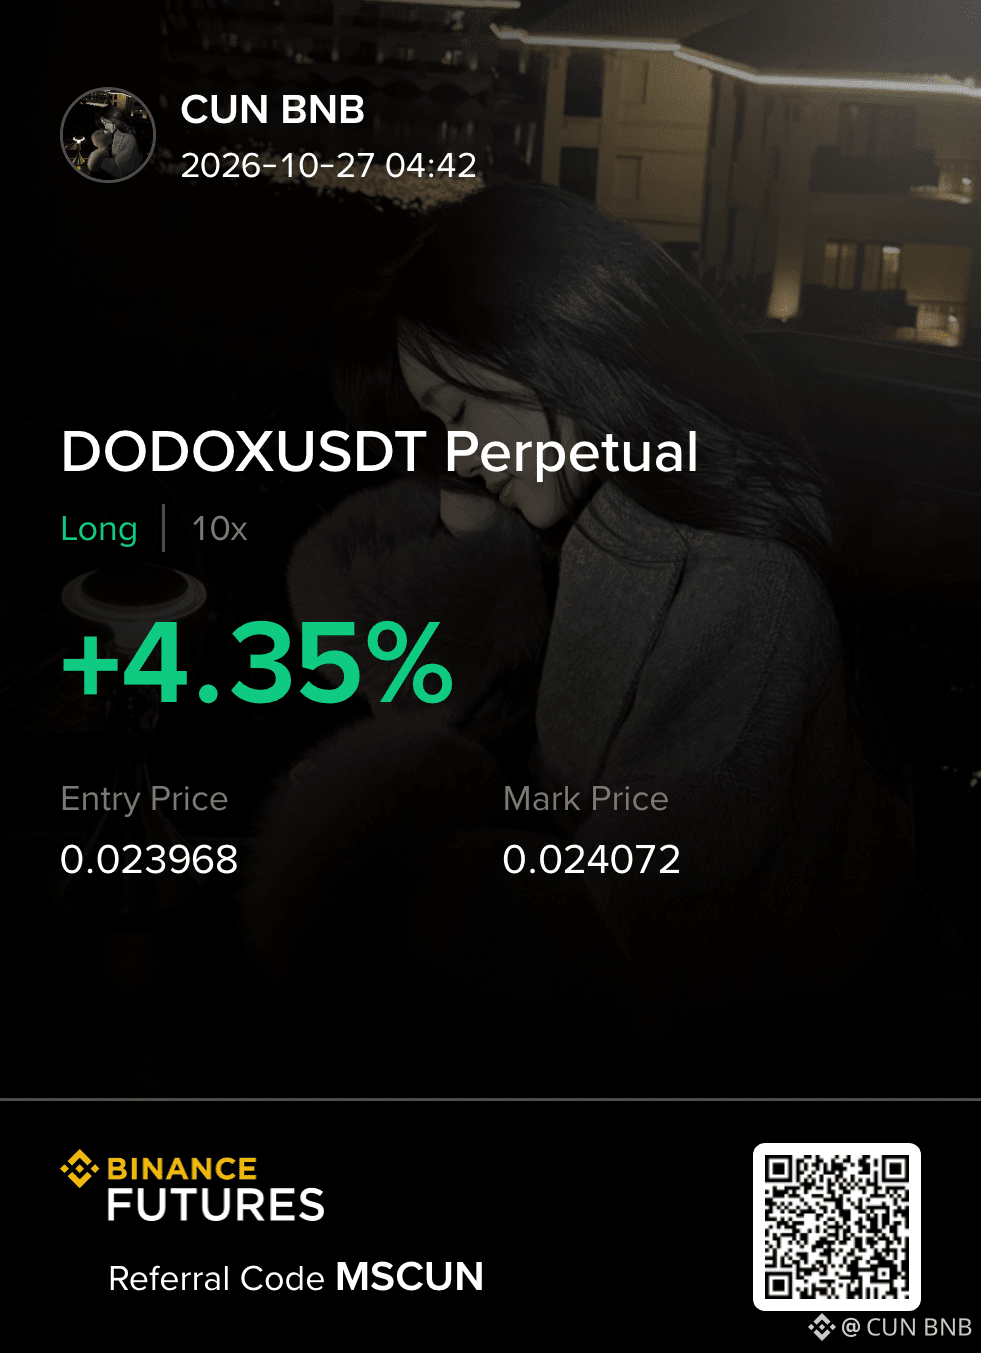
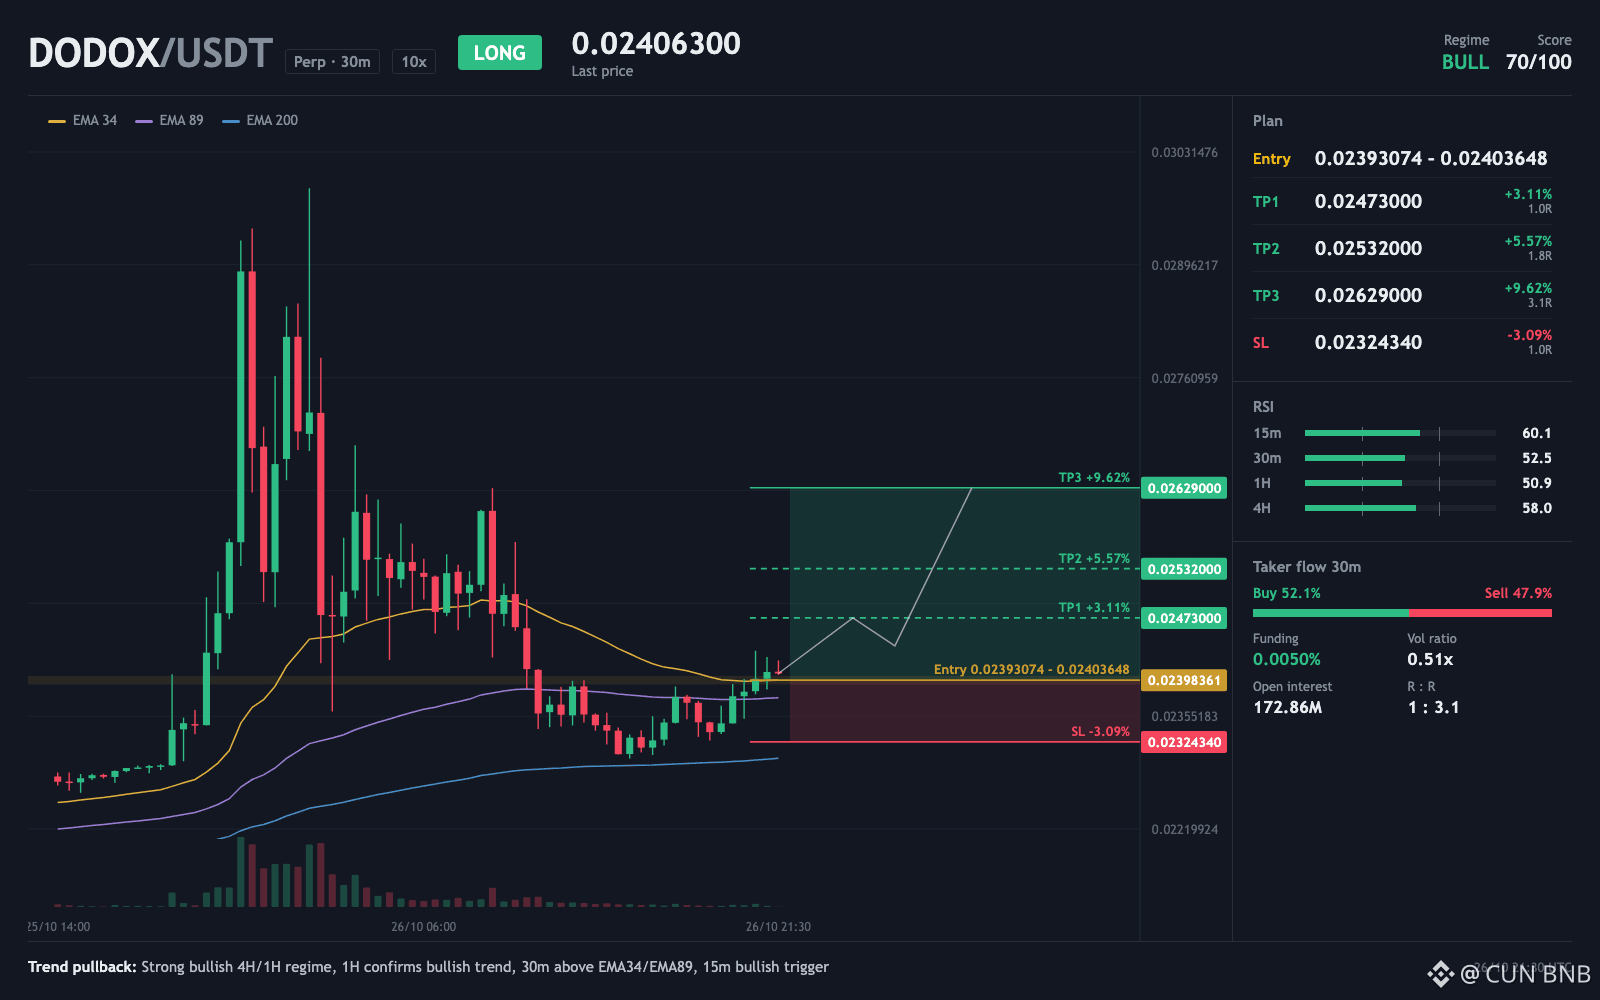
$DODOX - LONG scenario
51. Buyers are in control.
TRADE PLAN
Entry zone: 0.0239 - 0.024 (ref 0.02397)
TP1: 0.0247 (+3.18%)
TP2: 0.0253 (+5.64%)
TP3: 0.0263 (+9.69%)
Stop loss: 0.0232 (-3.02%)
That is the 1-hour RSI, a speed gauge for price that sits above 50 when buyers are winning and below 70 when things are not yet stretched. The 4-hour reading of 58 tells the same story on a slower view. The 15-minute chart just flashed a buy trigger, so short-term timing now lines up with the bigger picture.
The catch is timing, not direction. The entry zone sits about 0.4% below current price, so the setup is still waiting on a small pullback.
Is anyone watching 0.024 instead of the entry zone?
⚠️ Personal market insight, not investment advice. DYOR.
{future}(DODOXUSDT)
$DODOX - LONG scenario
51. Buyers are in control.
TRADE PLAN
Entry zone: 0.0239 - 0.024 (ref 0.02397)
TP1: 0.0247 (+3.18%)
TP2: 0.0253 (+5.64%)
TP3: 0.0263 (+9.69%)
Stop loss: 0.0232 (-3.02%)
That is the 1-hour RSI, a speed gauge for price that sits above 50 when buyers are winning and below 70 when things are not yet stretched. The 4-hour reading of 58 tells the same story on a slower view. The 15-minute chart just flashed a buy trigger, so short-term timing now lines up with the bigger picture.
The catch is timing, not direction. The entry zone sits about 0.4% below current price, so the setup is still waiting on a small pullback.
Is anyone watching 0.024 instead of the entry zone?
⚠️ Personal market insight, not investment advice. DYOR.
332
·
--
Падение
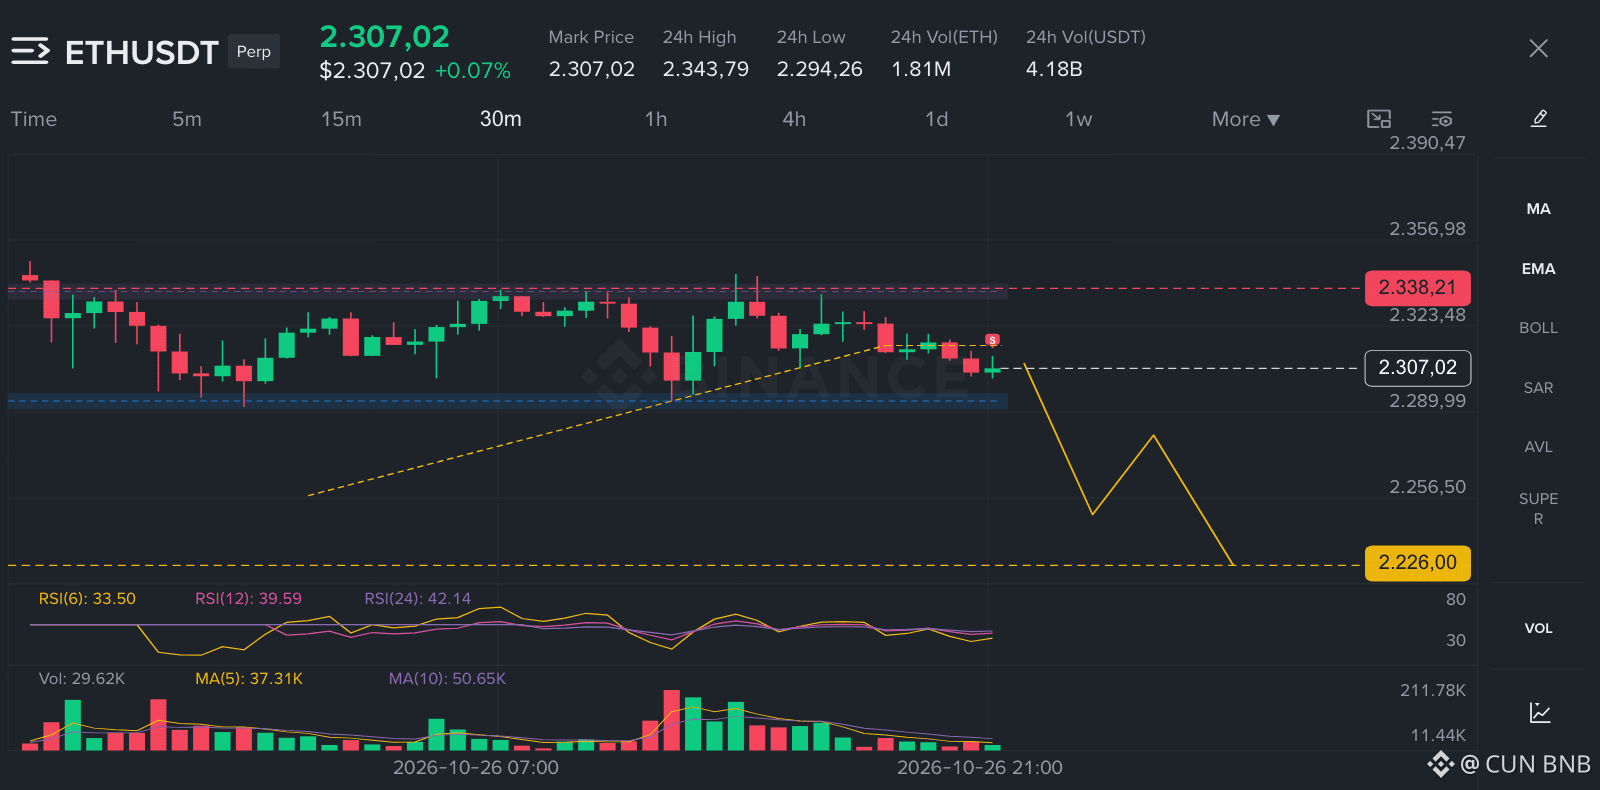
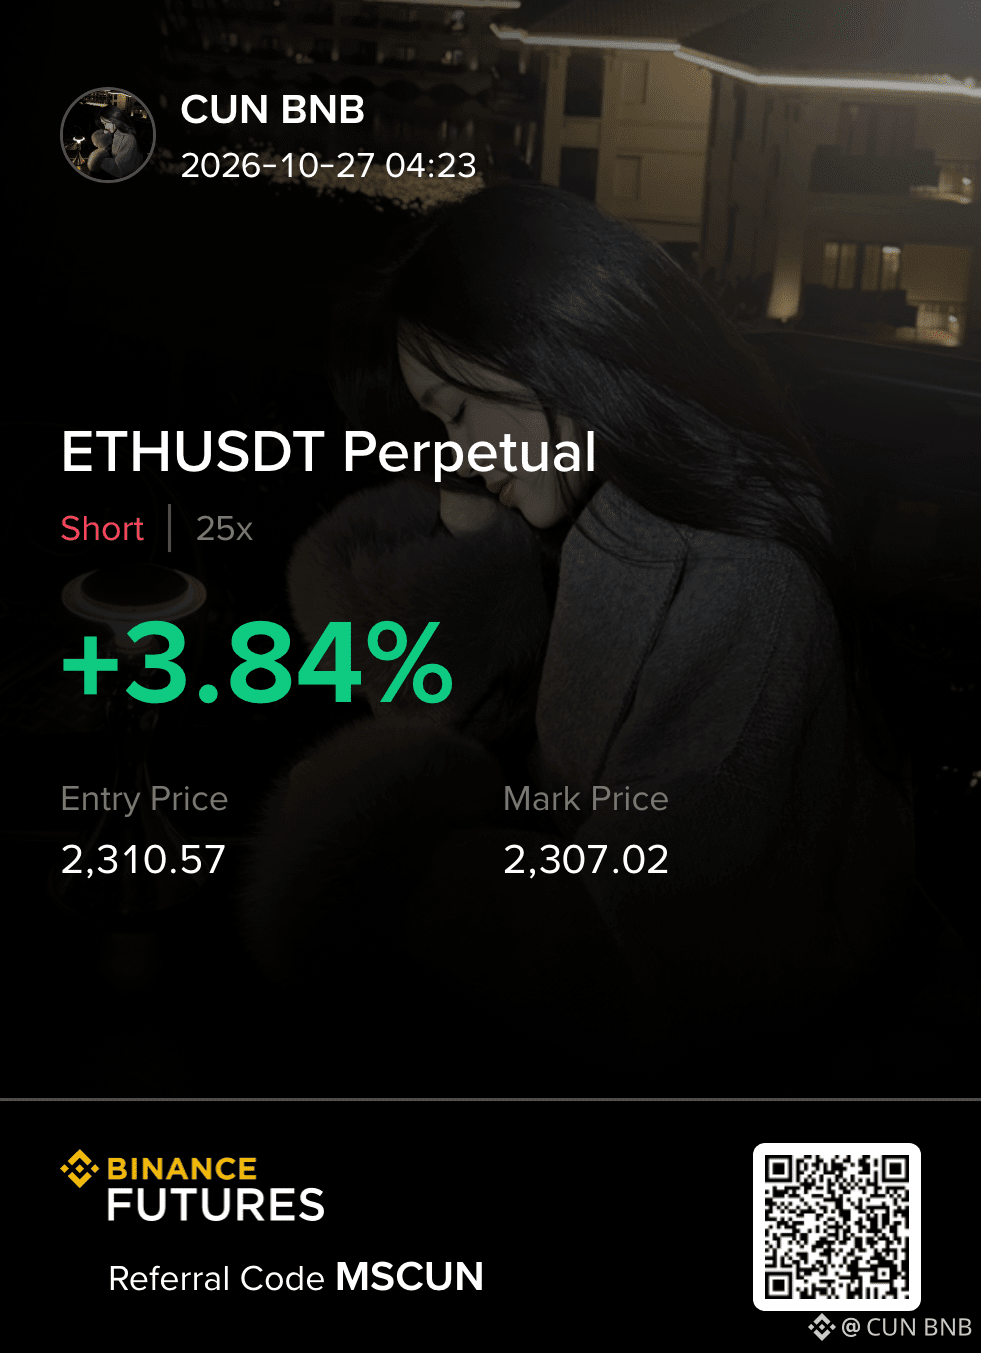
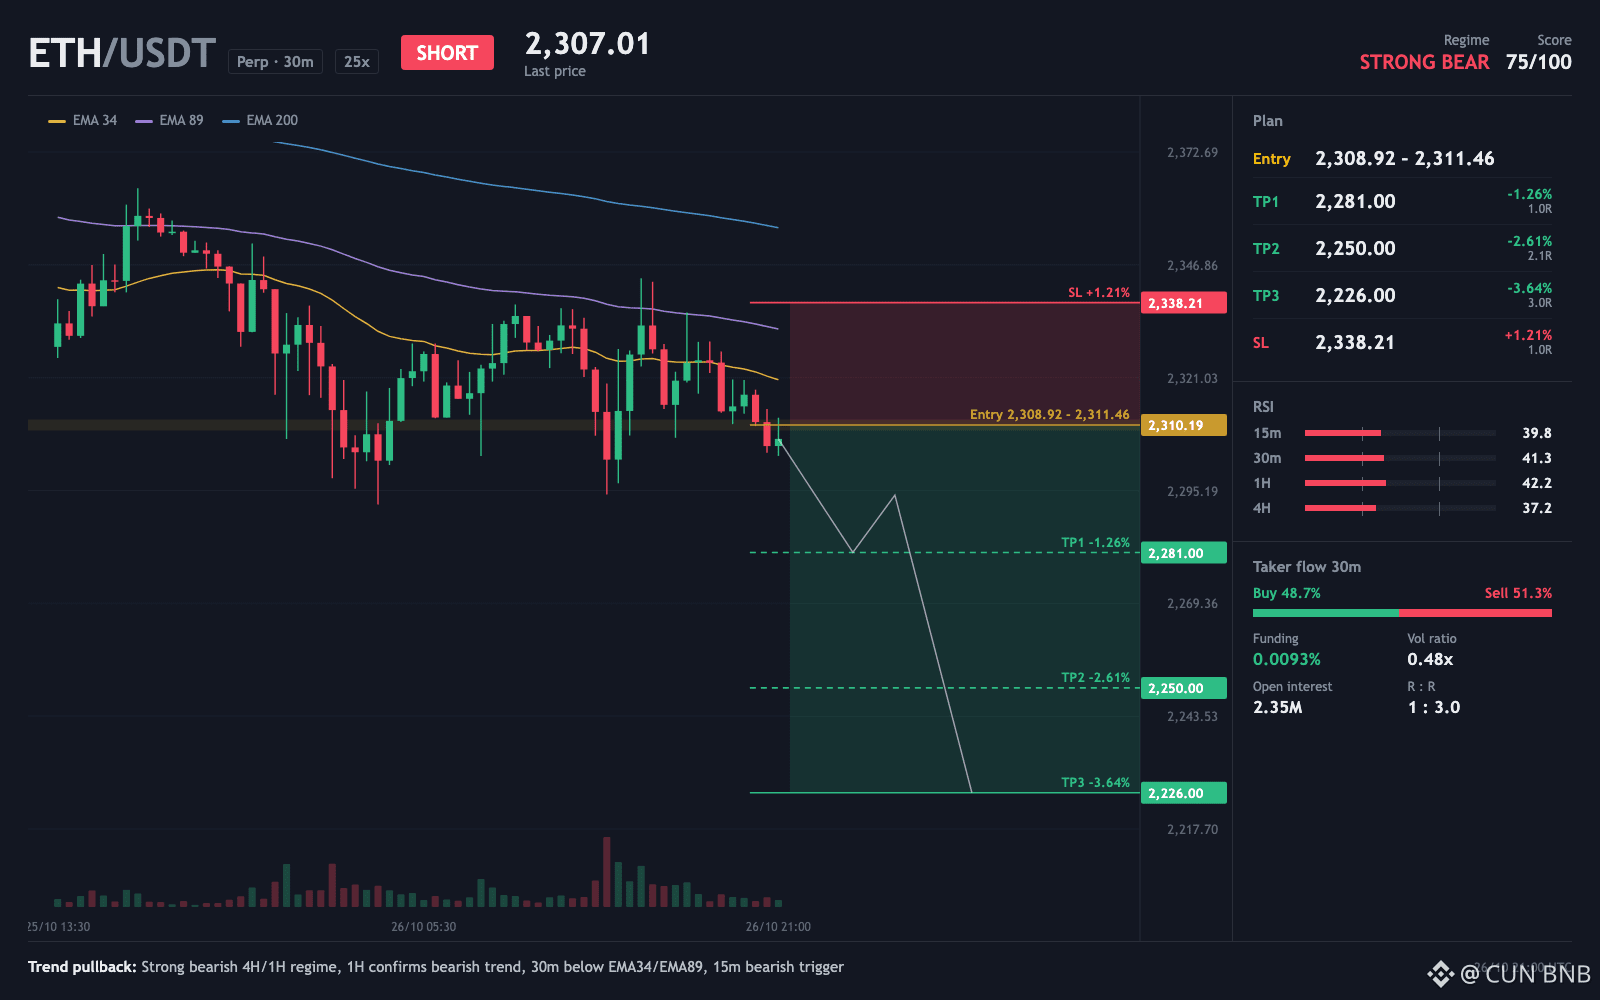
$ETH - SHORT momentum play
Is $ETH just following BTC down here?
Bitcoin's drop points the same way, so $ETH moves with the broader push lower. The last 30-minute candle ran at only 48% of normal volume, so nobody is rushing this move yet.
TRADE PLAN
Entry zone: 2308.92 - 2311.46 (ref 2310.571)
TP1: 2281 (+1.28%)
TP2: 2250 (+2.62%)
TP3: 2226 (+3.66%)
Stop loss: 2338.21 (-1.20%)
⚠️ Personal market insight, not investment advice. DYOR.
{future}(ETHUSDT)
$ETH - SHORT momentum play
Is $ETH just following BTC down here?
Bitcoin's drop points the same way, so $ETH moves with the broader push lower. The last 30-minute candle ran at only 48% of normal volume, so nobody is rushing this move yet.
TRADE PLAN
Entry zone: 2308.92 - 2311.46 (ref 2310.571)
TP1: 2281 (+1.28%)
TP2: 2250 (+2.62%)
TP3: 2226 (+3.66%)
Stop loss: 2338.21 (-1.20%)
⚠️ Personal market insight, not investment advice. DYOR.
259
·
--
Падение
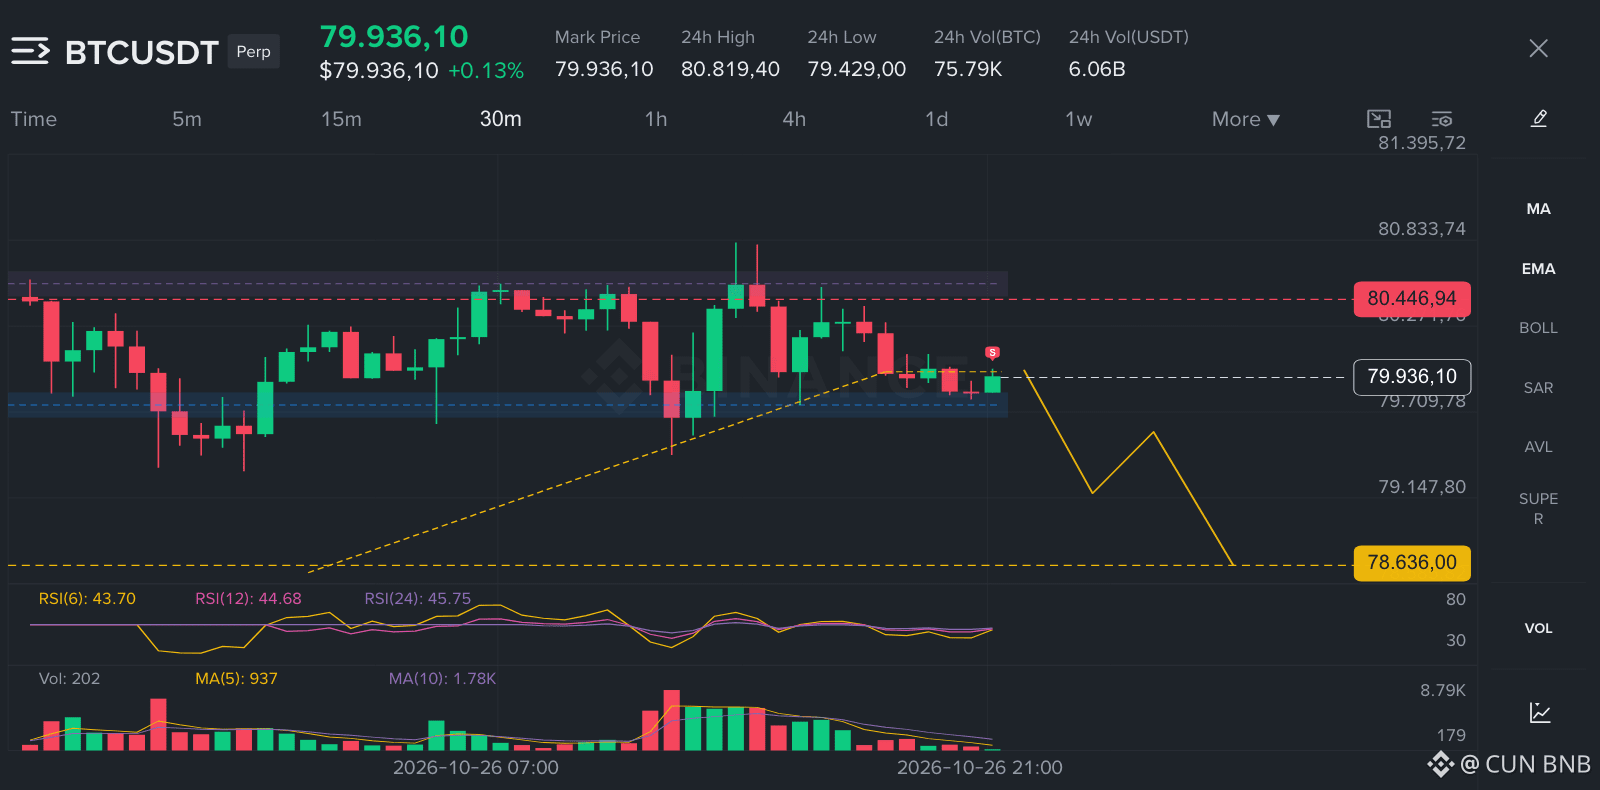
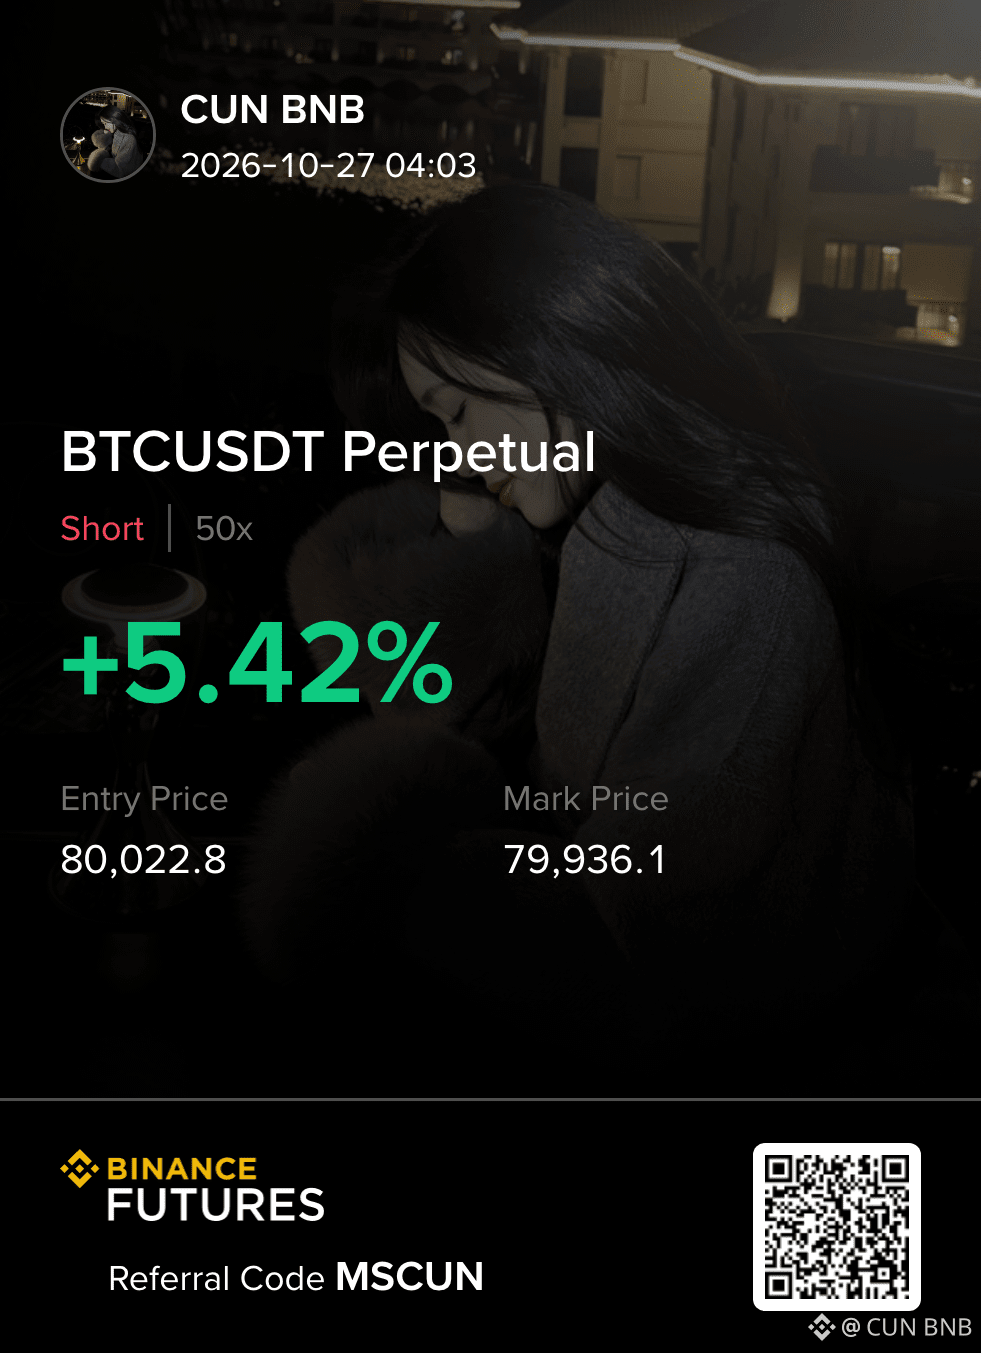
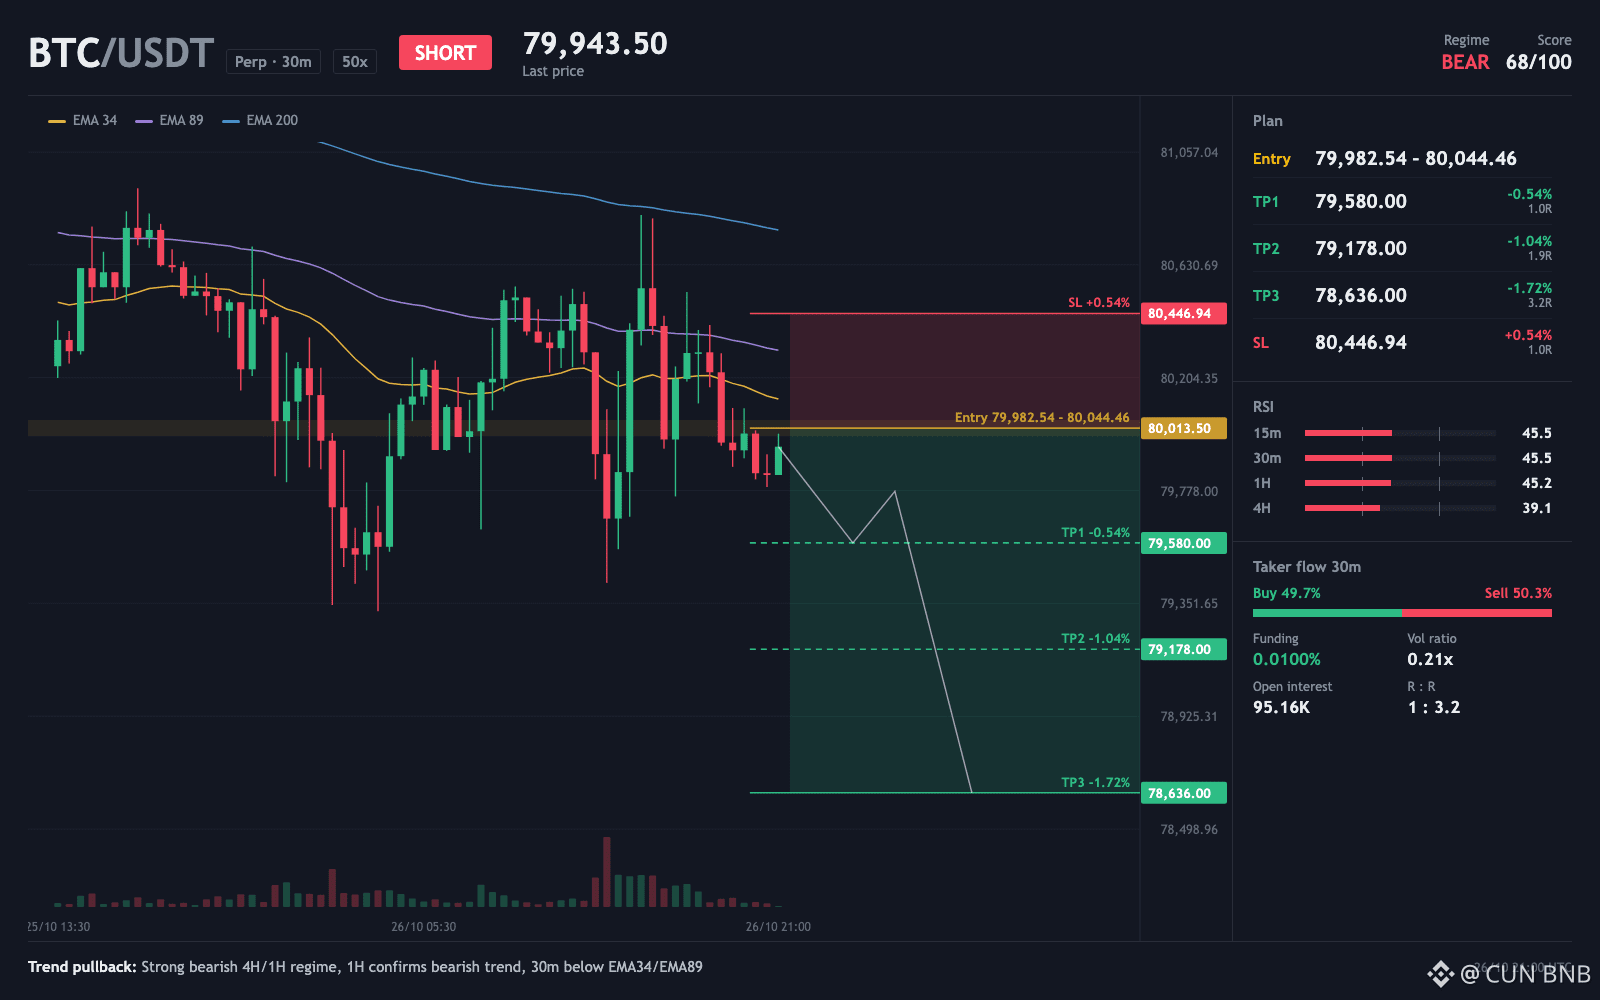
$BTC - SHORT opportunity
Quick lesson from $BTC on reading who is actually pushing price.
Buy and sell market orders are nearly even at 49.7%, so this looks like a two-way fight with no driver. My worry is price sits below the 79982.54 trigger, so the setup is still waiting.
Ever watched a calm, even market like this break one way fast?
TRADE PLAN
Entry zone: 79982.54 - 80044.46 (ref 80022.788)
TP1: 79580 (+0.55%)
TP2: 79178 (+1.06%)
TP3: 78636 (+1.73%)
Stop loss: 80446.94 (-0.53%)
⚠️ Personal market insight, not investment advice. DYOR.
{future}(BTCUSDT)
$BTC - SHORT opportunity
Quick lesson from $BTC on reading who is actually pushing price.
Buy and sell market orders are nearly even at 49.7%, so this looks like a two-way fight with no driver. My worry is price sits below the 79982.54 trigger, so the setup is still waiting.
Ever watched a calm, even market like this break one way fast?
TRADE PLAN
Entry zone: 79982.54 - 80044.46 (ref 80022.788)
TP1: 79580 (+0.55%)
TP2: 79178 (+1.06%)
TP3: 78636 (+1.73%)
Stop loss: 80446.94 (-0.53%)
⚠️ Personal market insight, not investment advice. DYOR.
1
423
·
--
Рост
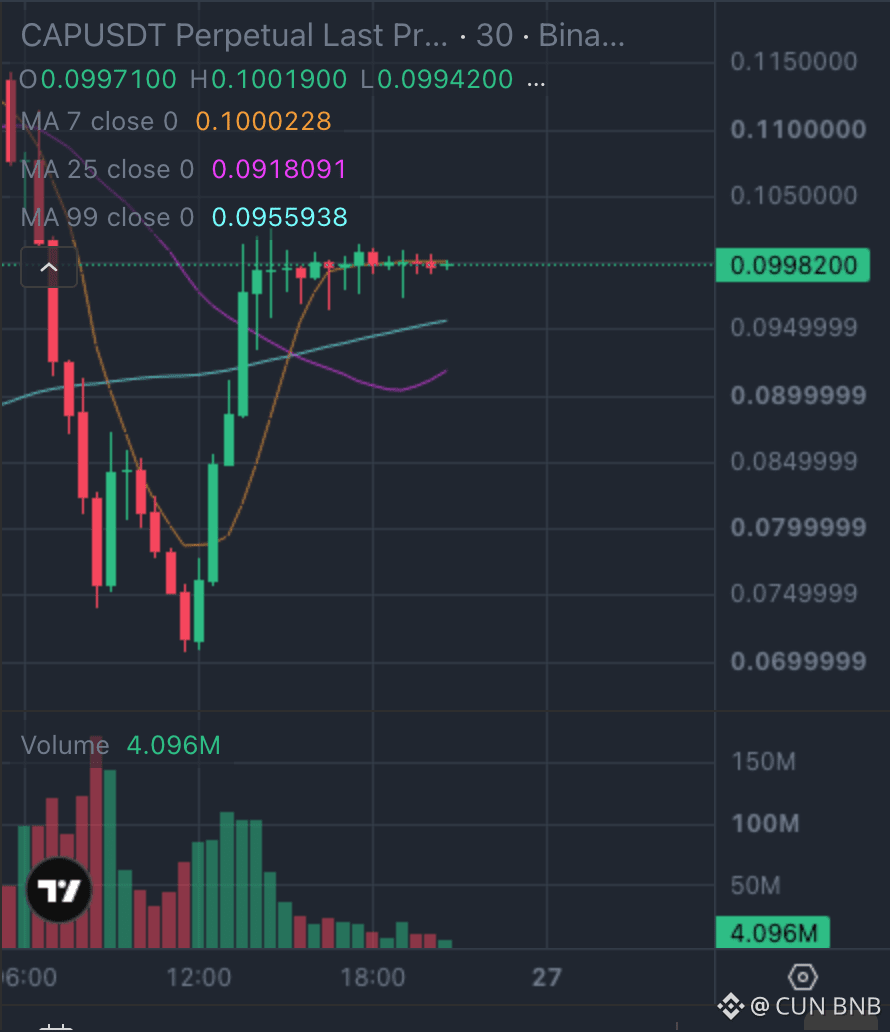
$CAP - waiting for LONG confirmation
Real talk: $CAP is climbing while BTC slides, and that is the part to slow down on.
TRADE PLAN
Entry zone: 0.098 - 0.099 (ref 0.0987)
TP1: 0.105 (+6.09%)
TP2: 0.112 (+12.98%)
TP3: 0.117 (+18.96%)
Stop loss: 0.093 (-5.82%)
Wide stop here, 5.8% away. Sized so that loss stays boring, or not at all.
LONG vs SHORT: 73 vs 5, LONG favored
🟢 Long (5/7): 4H trend up, 1H confirms, 30m above EMAs
🔴 Short (1/7): crowded longs
Why wait: BTC leaning against it
Flip: a close below 0.093 kills the long idea
I nearly shrugged off the split from BTC, and it stays the real risk here. Both the 4-hour and 1-hour trend point up with price above its main EMAs, so the setup holds even against a falling market. Price still sits near 1.2% above the 0.099 zone, so nothing triggers until it gets there.
Anyone watching 0.099 instead of chasing the current price?
⚠️ Personal market insight, not investment advice. DYOR.
{future}(CAPUSDT)
$CAP - waiting for LONG confirmation
Real talk: $CAP is climbing while BTC slides, and that is the part to slow down on.
TRADE PLAN
Entry zone: 0.098 - 0.099 (ref 0.0987)
TP1: 0.105 (+6.09%)
TP2: 0.112 (+12.98%)
TP3: 0.117 (+18.96%)
Stop loss: 0.093 (-5.82%)
Wide stop here, 5.8% away. Sized so that loss stays boring, or not at all.
LONG vs SHORT: 73 vs 5, LONG favored
🟢 Long (5/7): 4H trend up, 1H confirms, 30m above EMAs
🔴 Short (1/7): crowded longs
Why wait: BTC leaning against it
Flip: a close below 0.093 kills the long idea
I nearly shrugged off the split from BTC, and it stays the real risk here. Both the 4-hour and 1-hour trend point up with price above its main EMAs, so the setup holds even against a falling market. Price still sits near 1.2% above the 0.099 zone, so nothing triggers until it gets there.
Anyone watching 0.099 instead of chasing the current price?
⚠️ Personal market insight, not investment advice. DYOR.
3
441
·
--
Падение
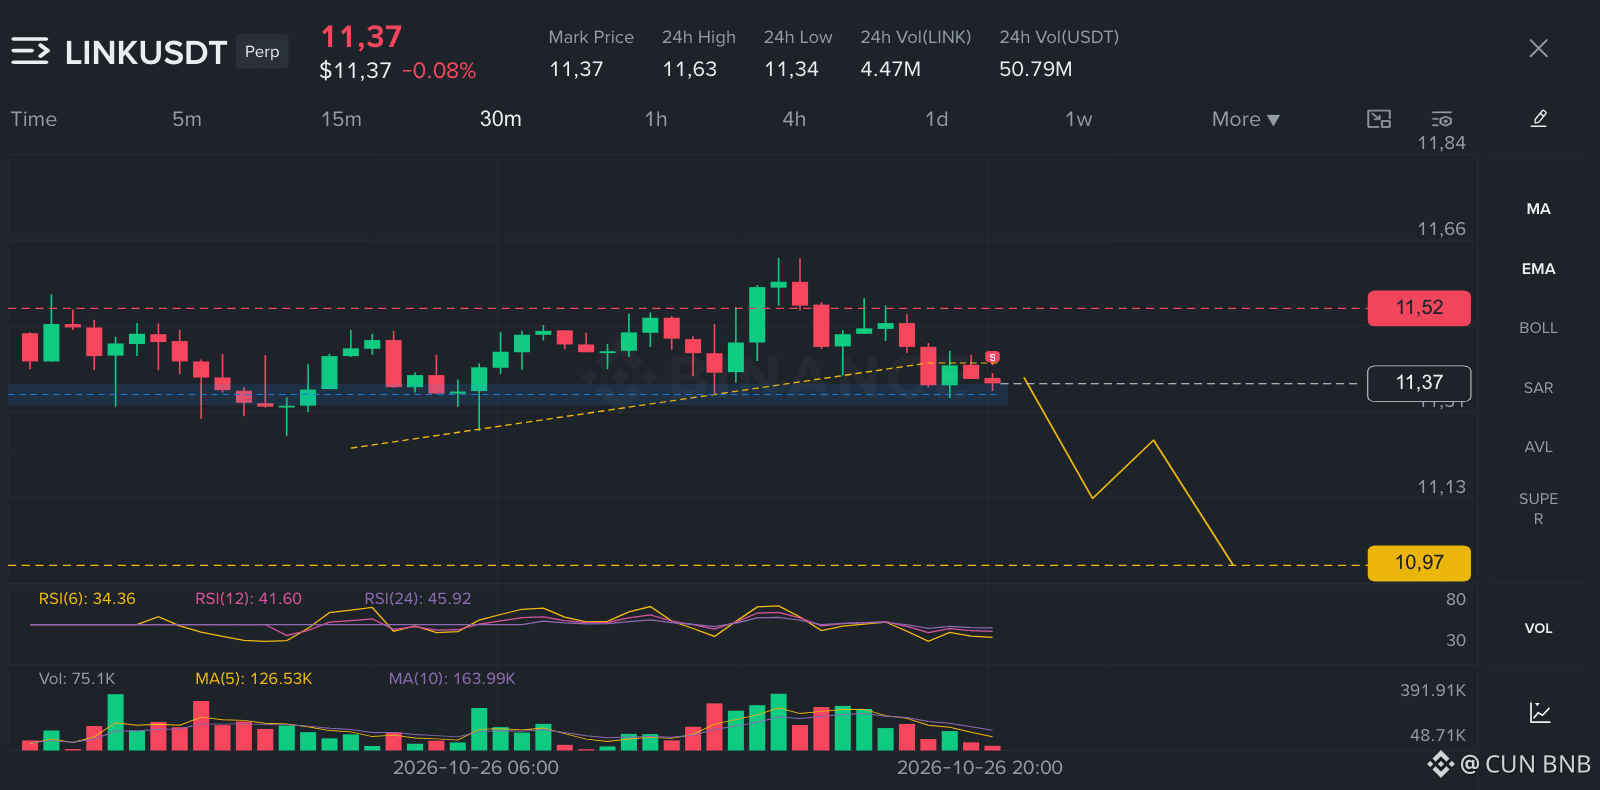
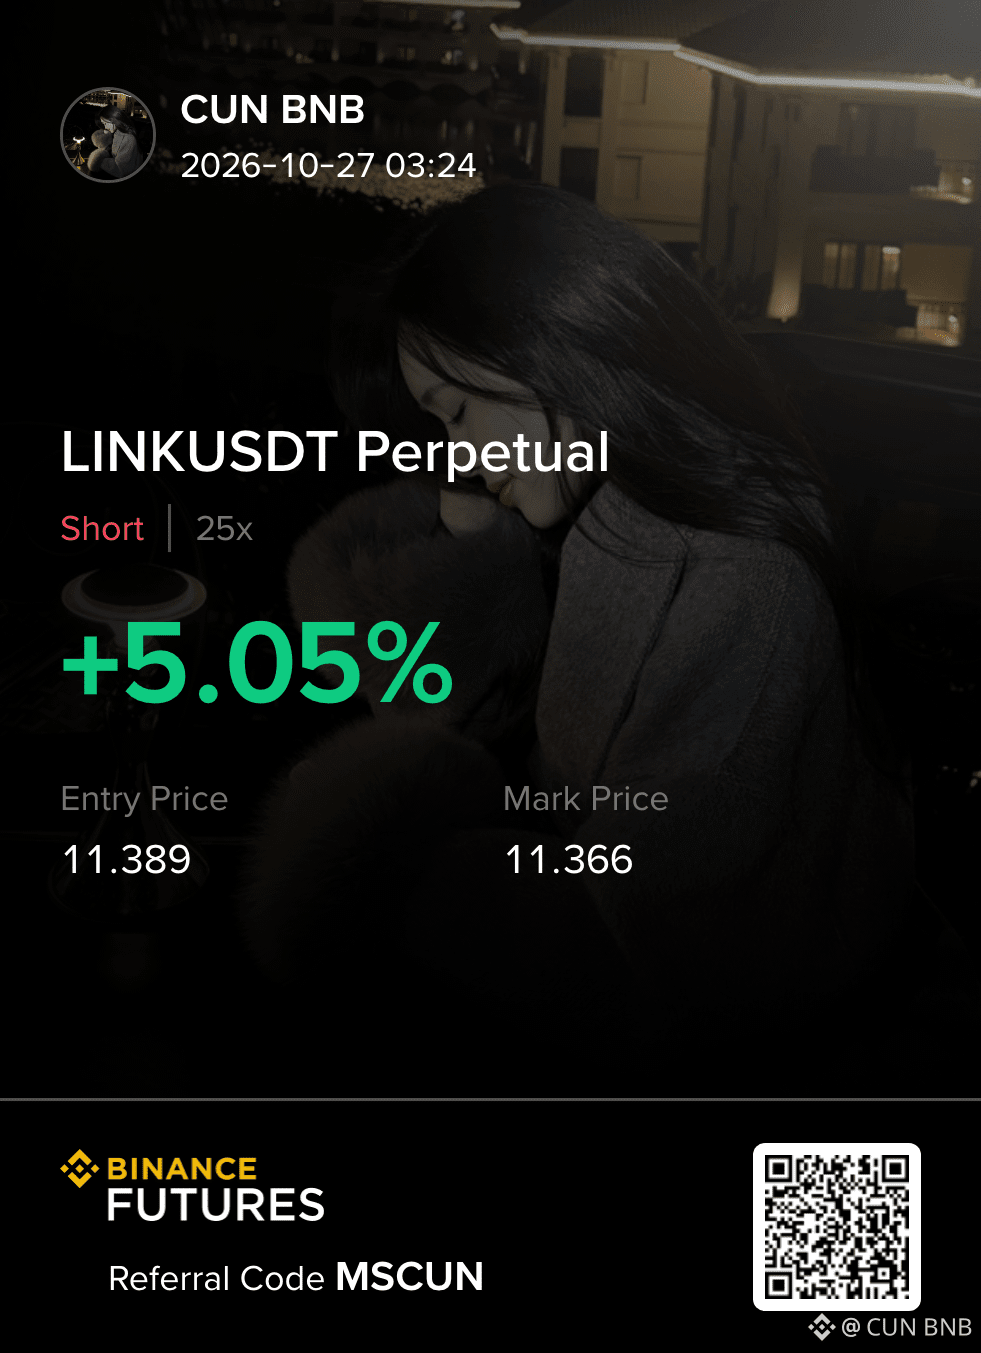
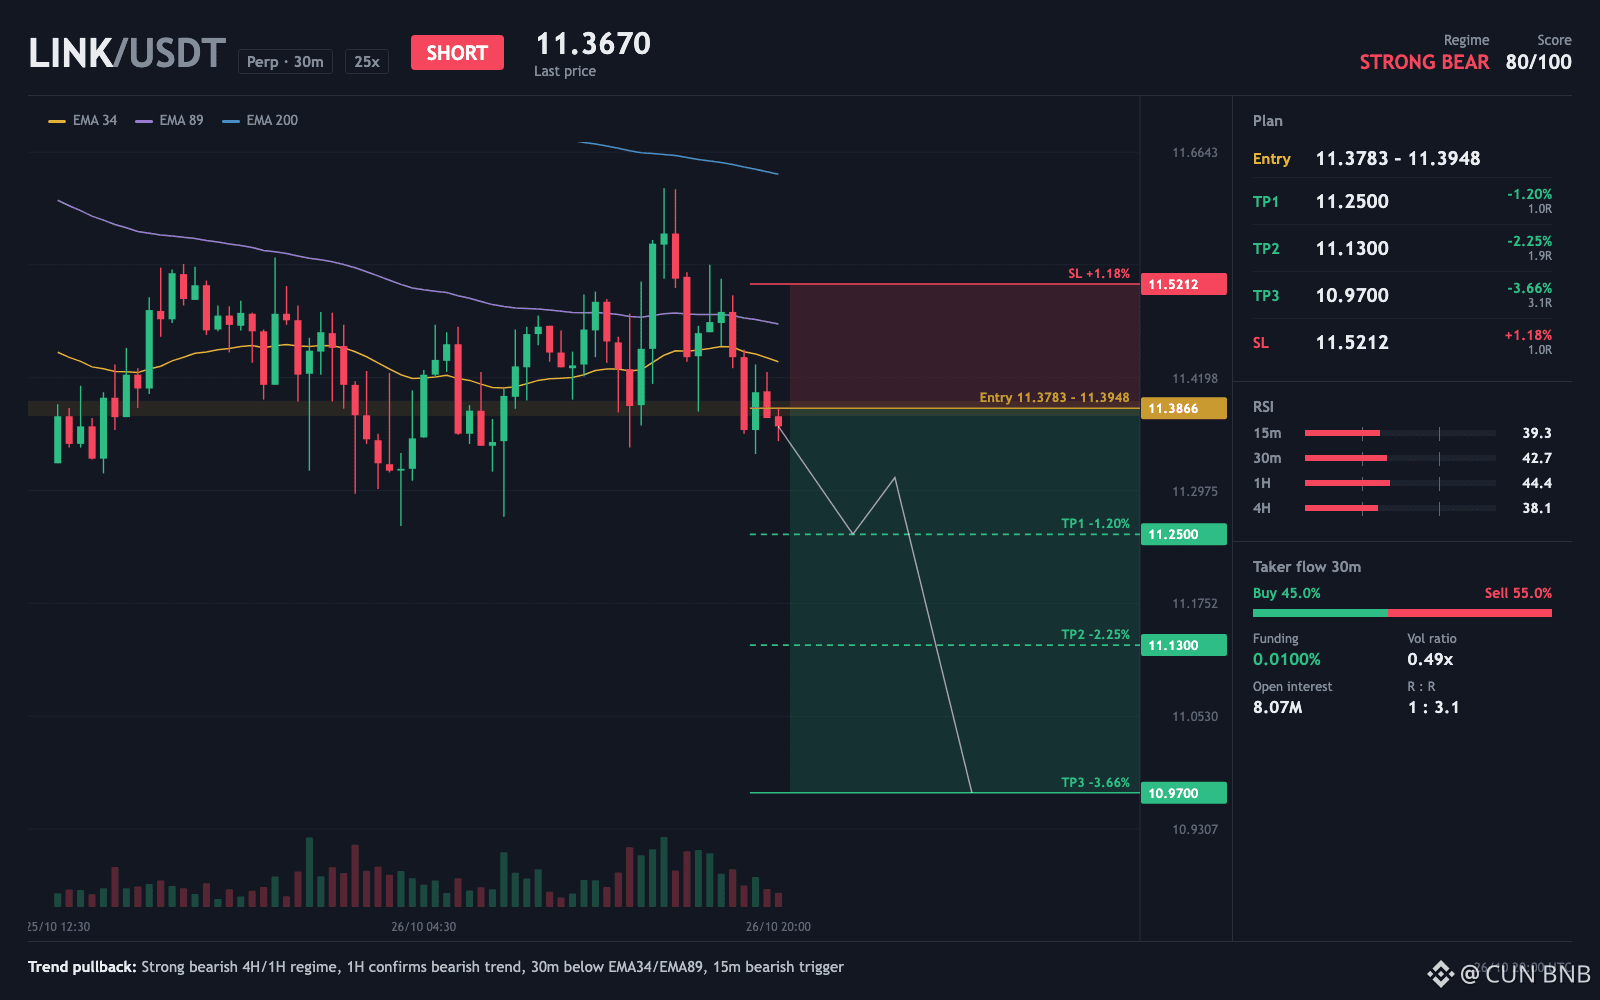
$LINK - SHORT trade plan
At a glance calm candles on $LINK. Look closer, sellers are still hitting the bid.
TRADE PLAN
Entry zone: 11.38 - 11.39 (ref 11.389)
TP1: 11.25 (+1.22%)
TP2: 11.13 (+2.27%)
TP3: 10.97 (+3.68%)
Stop loss: 11.52 (-1.16%)
A 30-minute candle here only travels about 0.7% from high to low, so a real break would be easy to spot. Sellers are pressing with 55% of market orders, and what gets me is that quiet tape can hide who is actually in control. Price still needs to reach 11.38 before this short idea even applies.
What would make you ignore the sellers here?
⚠️ Personal market insight, not investment advice. DYOR.
{future}(LINKUSDT)
$LINK - SHORT trade plan
At a glance calm candles on $LINK . Look closer, sellers are still hitting the bid.
TRADE PLAN
Entry zone: 11.38 - 11.39 (ref 11.389)
TP1: 11.25 (+1.22%)
TP2: 11.13 (+2.27%)
TP3: 10.97 (+3.68%)
Stop loss: 11.52 (-1.16%)
A 30-minute candle here only travels about 0.7% from high to low, so a real break would be easy to spot. Sellers are pressing with 55% of market orders, and what gets me is that quiet tape can hide who is actually in control. Price still needs to reach 11.38 before this short idea even applies.
What would make you ignore the sellers here?
⚠️ Personal market insight, not investment advice. DYOR.
2
233
·
--
Падение
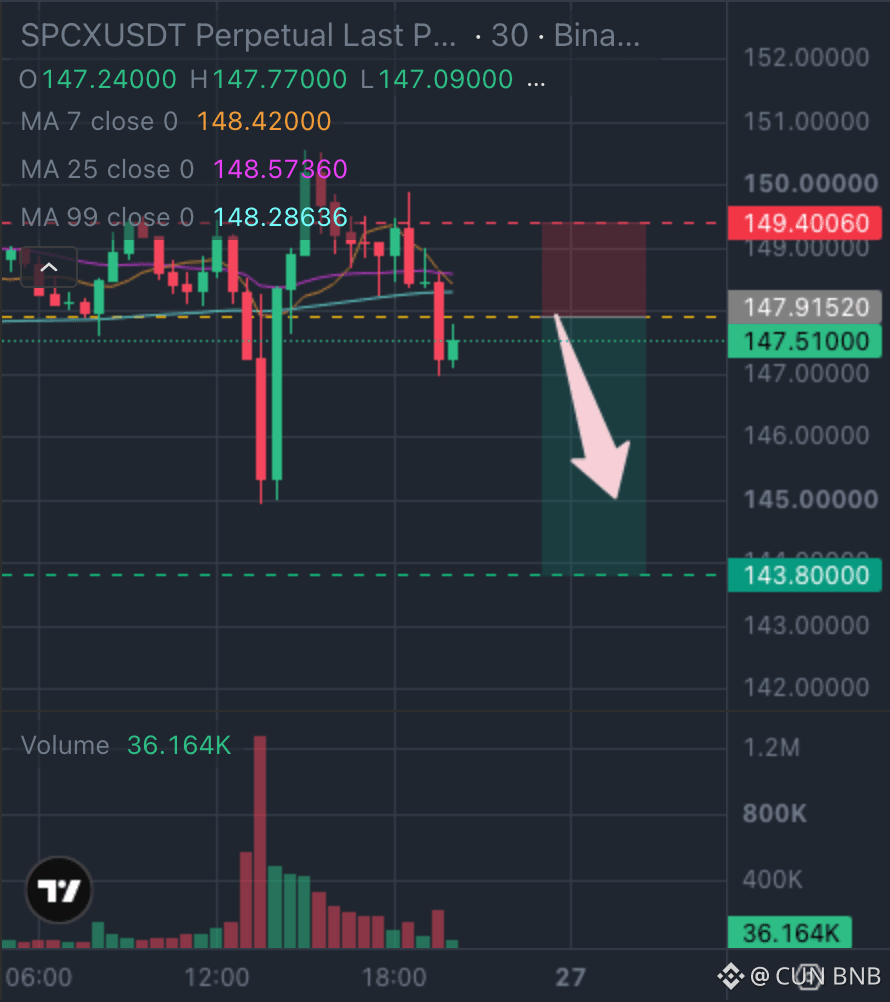
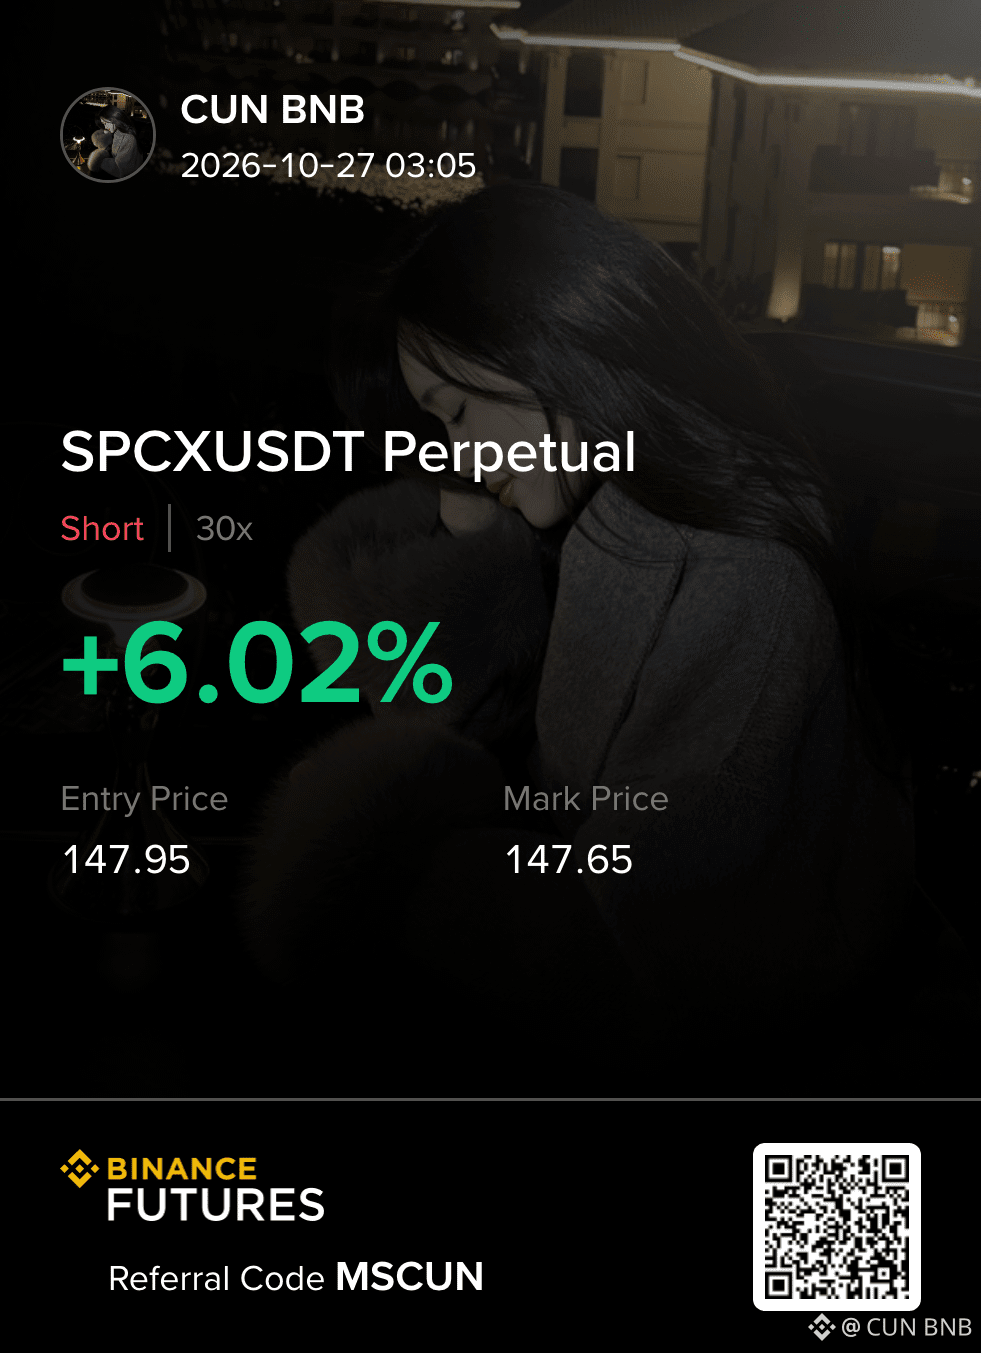
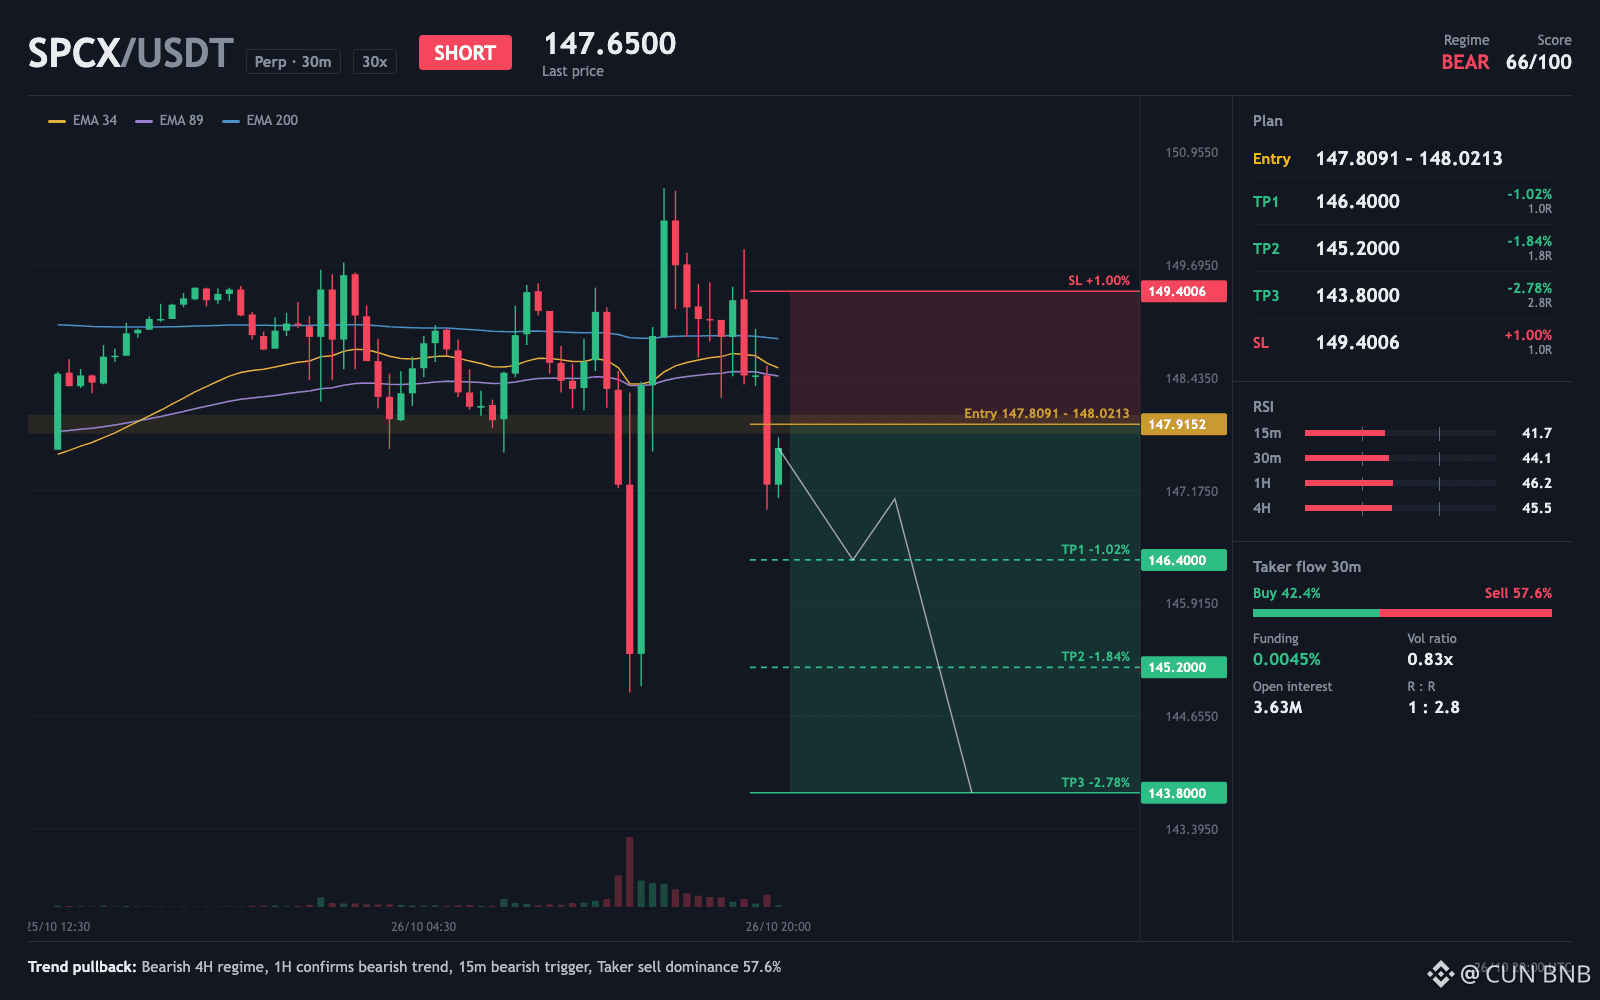
$SPCX - SHORT continuation setup
$SPCX, late night. Sellers still pressing, BTC sliding the same way.
This is an active setup, and the reason is simple: BTC is falling too, so the whole market pushes the same direction. The 4-hour and 1-hour both point down, which means the path of least resistance stays lower. What gets me here is how both clocks agree while BTC drags everything with it.
The entry zone sits about 0.2% above current price, so price has not filled it yet. The stop is 1.0% from entry, and the first target is 1.0% away.
Anyone watching 147.81 instead of the entry zone?
TRADE PLAN
Entry zone: 147.81 - 148.02 (ref 147.947)
TP1: 146.4 (+1.05%)
TP2: 145.2 (+1.86%)
TP3: 143.8 (+2.80%)
Stop loss: 149.4 (-0.98%)
⚠️ Personal market insight, not investment advice. DYOR.
{future}(SPCXUSDT)
$SPCX - SHORT continuation setup
$SPCX , late night. Sellers still pressing, BTC sliding the same way.
This is an active setup, and the reason is simple: BTC is falling too, so the whole market pushes the same direction. The 4-hour and 1-hour both point down, which means the path of least resistance stays lower. What gets me here is how both clocks agree while BTC drags everything with it.
The entry zone sits about 0.2% above current price, so price has not filled it yet. The stop is 1.0% from entry, and the first target is 1.0% away.
Anyone watching 147.81 instead of the entry zone?
TRADE PLAN
Entry zone: 147.81 - 148.02 (ref 147.947)
TP1: 146.4 (+1.05%)
TP2: 145.2 (+1.86%)
TP3: 143.8 (+2.80%)
Stop loss: 149.4 (-0.98%)
⚠️ Personal market insight, not investment advice. DYOR.
1
287
·
--
Рост
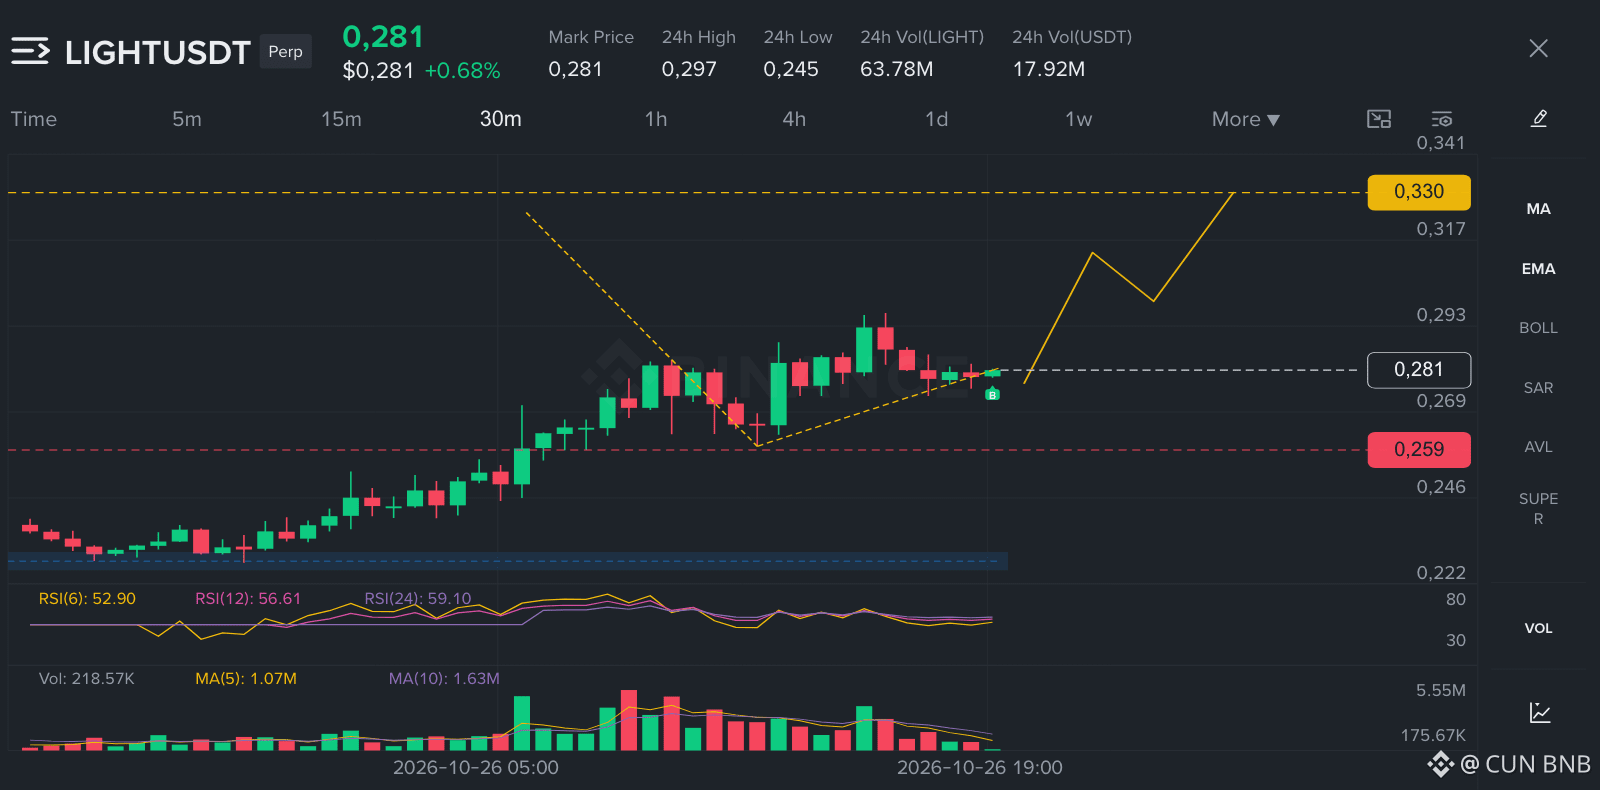
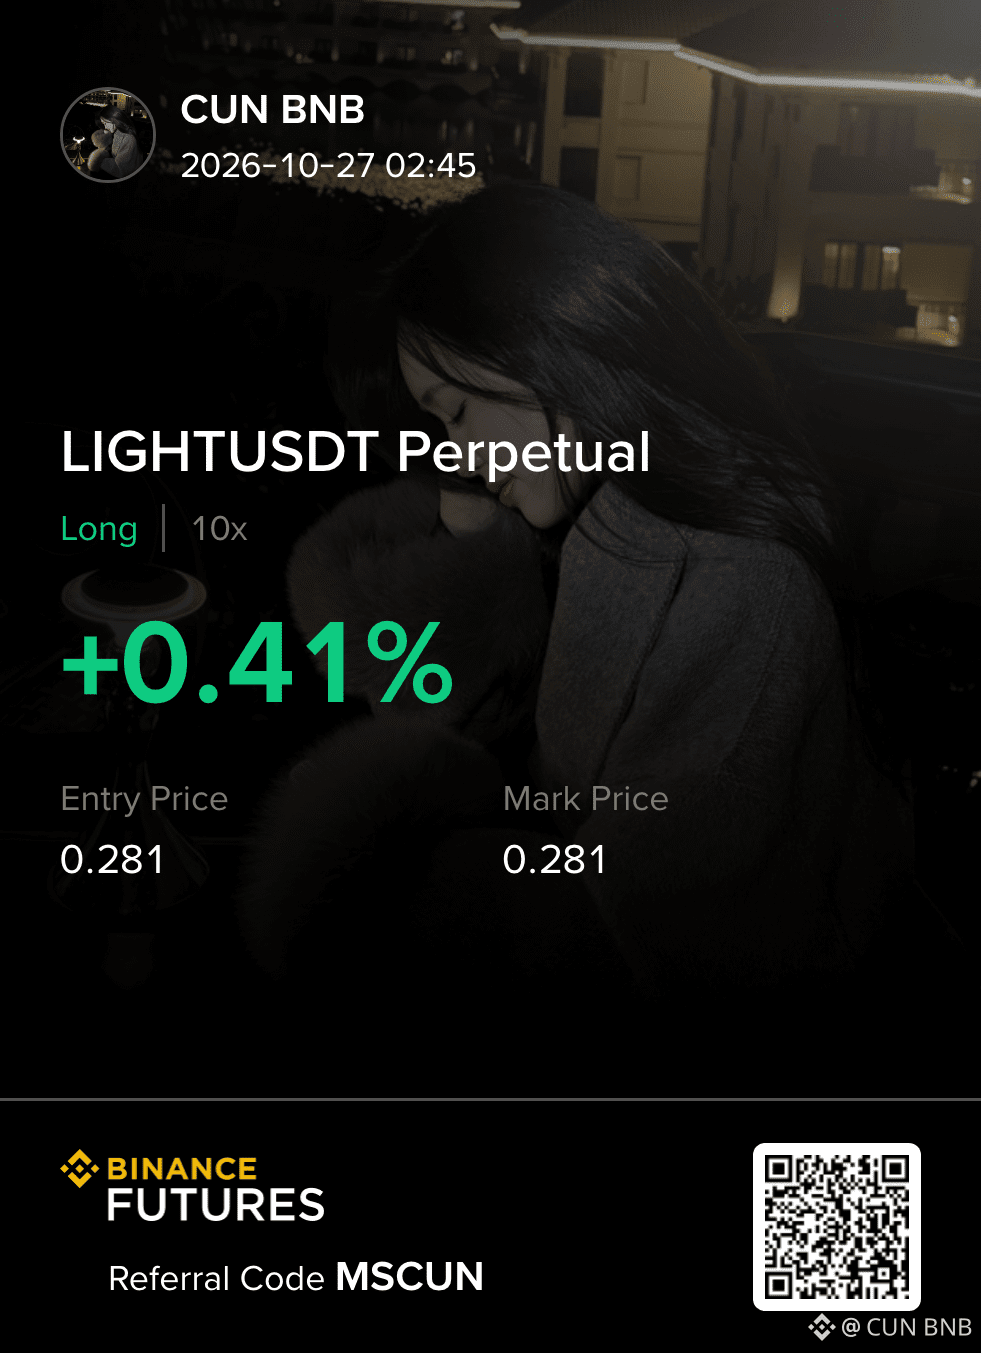
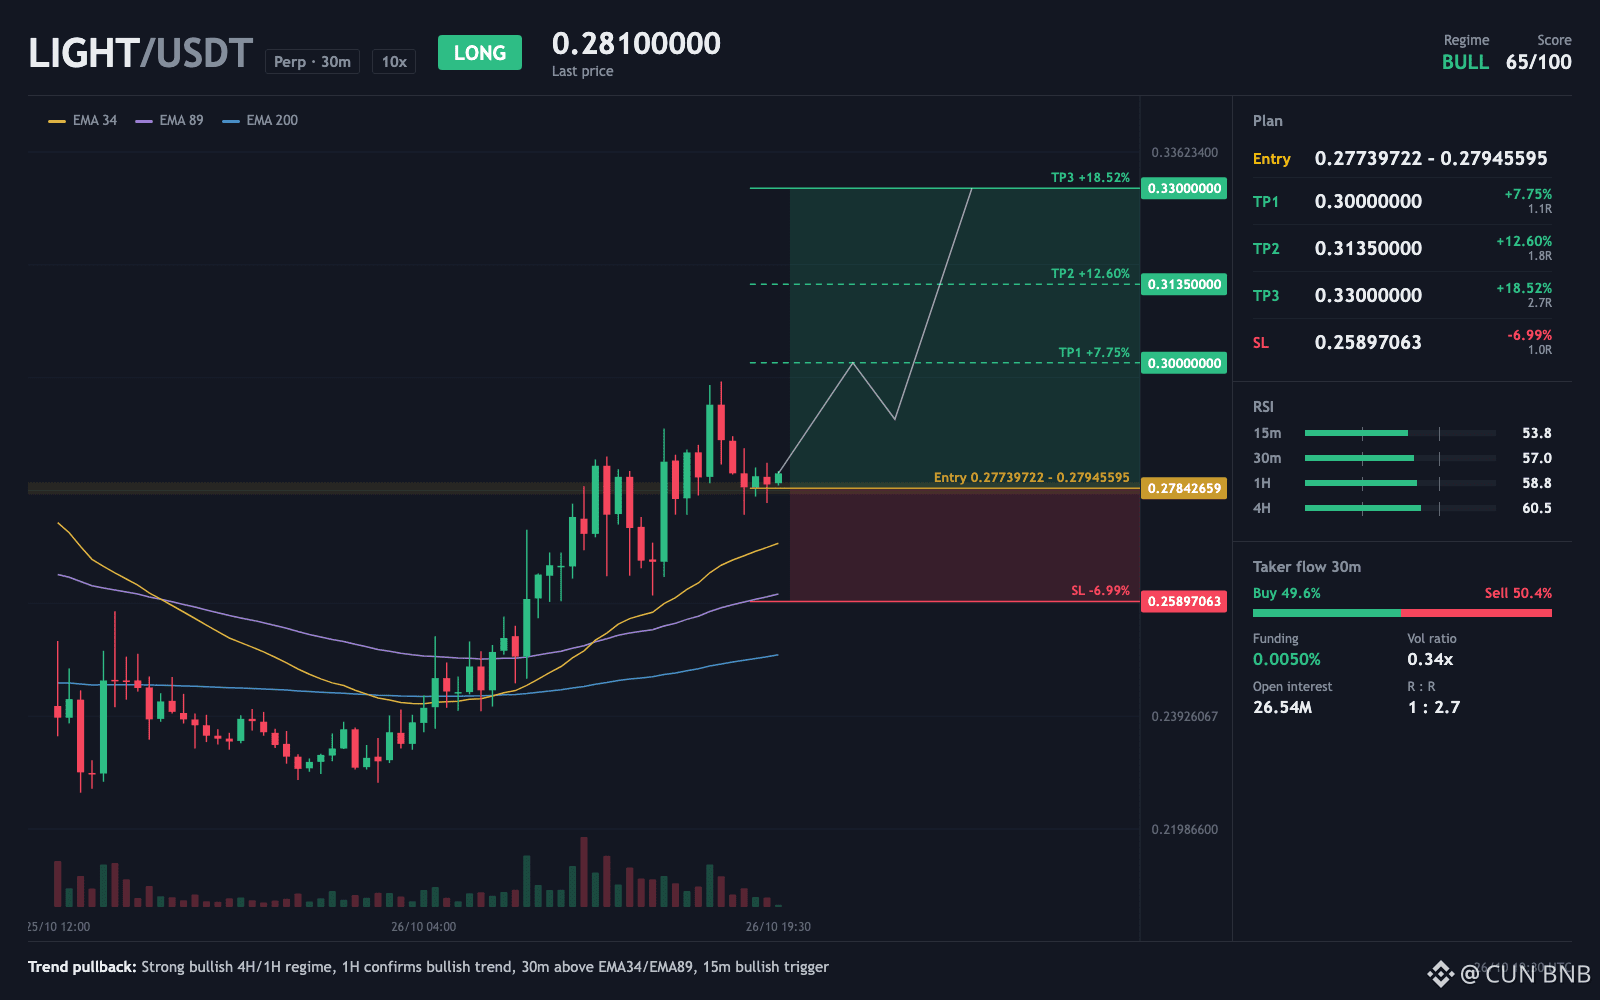
$LIGHT - LONG play
$LIGHT order flow is a coin flip at 49.6% buys: buyers step up or fade out?
TRADE PLAN
Entry zone: 0.277 - 0.279 (ref 0.2781)
TP1: 0.3 (+7.87%)
TP2: 0.314 (+12.72%)
TP3: 0.33 (+18.65%)
Stop loss: 0.259 (-6.88%)
Heads up, the stop is 6.9% out. Lower leverage or smaller size, whichever you prefer.
Buys and sells are almost even, so neither side is rushing. The last 30-minute candle ran at 34% of usual volume, meaning this move has thin participation behind it.
⚠️ Personal market insight, not investment advice. DYOR.
{future}(LIGHTUSDT)
$LIGHT - LONG play
$LIGHT order flow is a coin flip at 49.6% buys: buyers step up or fade out?
TRADE PLAN
Entry zone: 0.277 - 0.279 (ref 0.2781)
TP1: 0.3 (+7.87%)
TP2: 0.314 (+12.72%)
TP3: 0.33 (+18.65%)
Stop loss: 0.259 (-6.88%)
Heads up, the stop is 6.9% out. Lower leverage or smaller size, whichever you prefer.
Buys and sells are almost even, so neither side is rushing. The last 30-minute candle ran at 34% of usual volume, meaning this move has thin participation behind it.
⚠️ Personal market insight, not investment advice. DYOR.
1
260
·
--
Рост
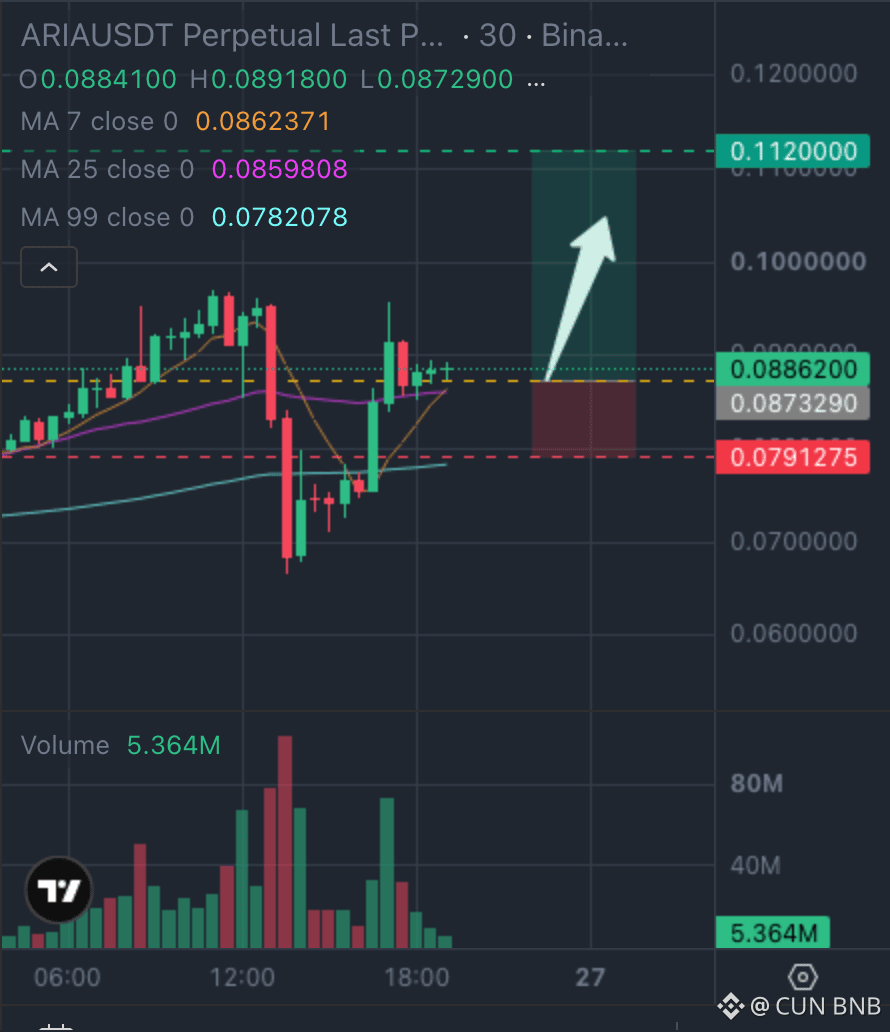
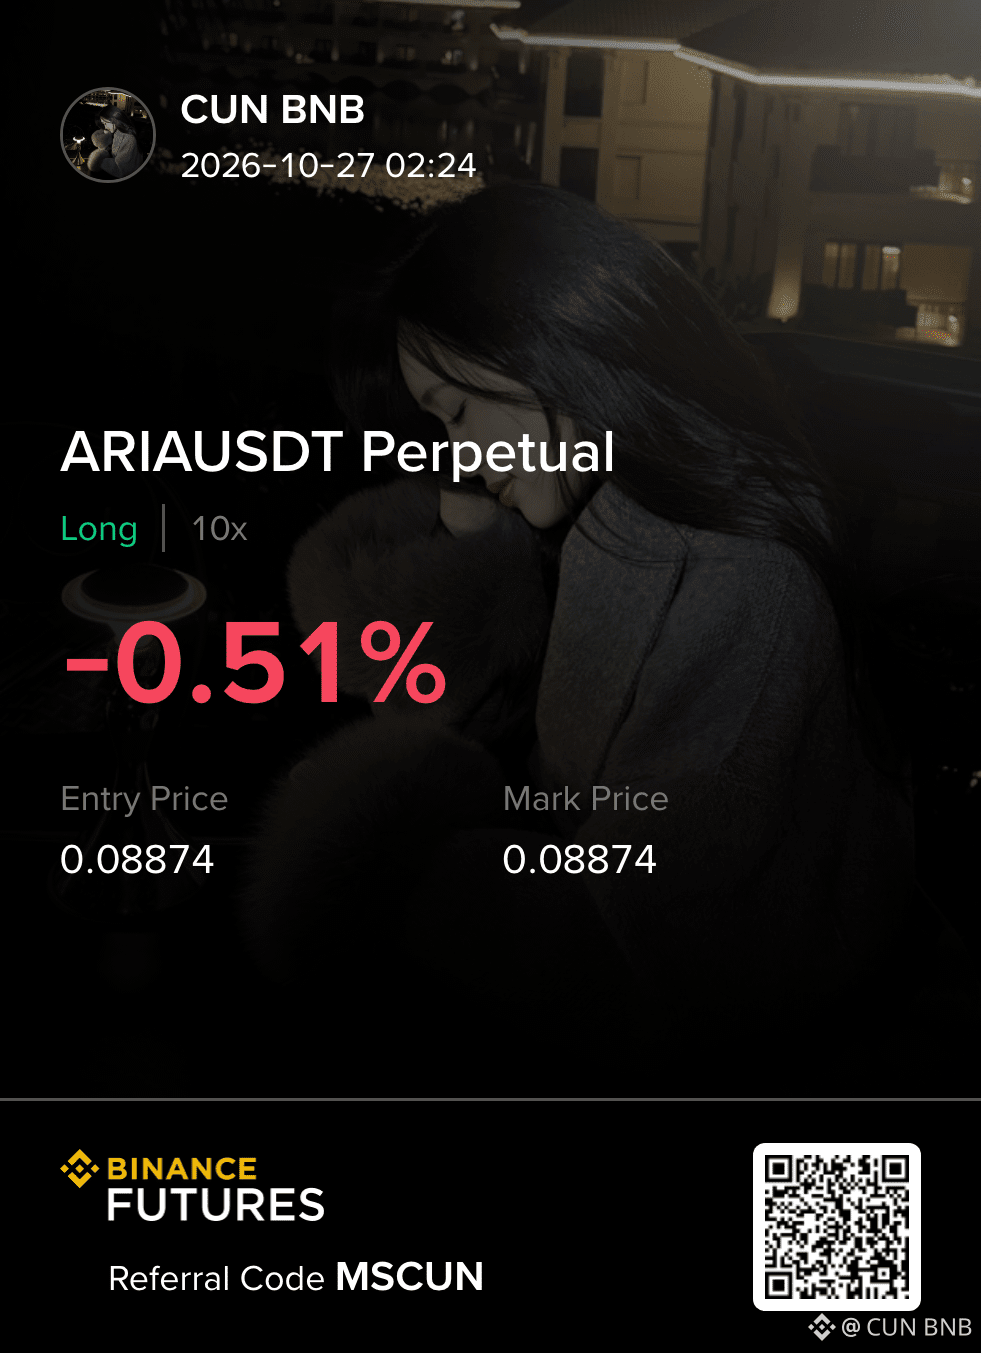
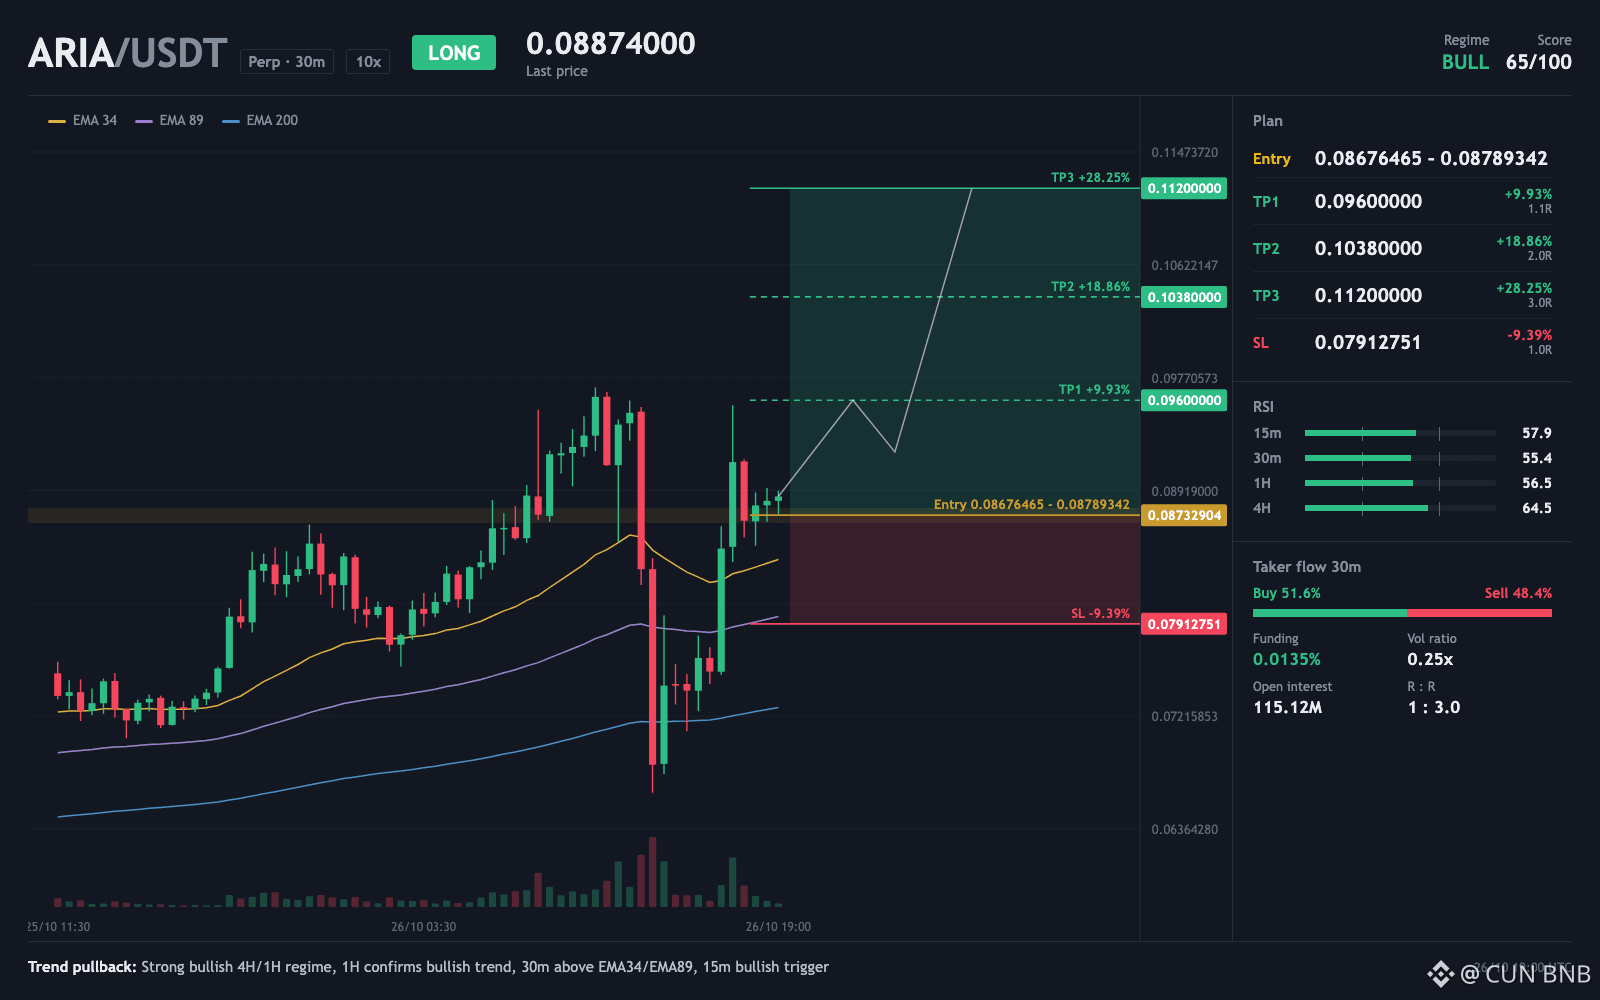
$ARIA - LONG play
POV: you wrote $ARIA off as just another altcoin drifting sideways.
Both the 4-hour and the 1-hour trend point up, and price sits above its main EMAs on both. That alignment matters because the idea is a LONG one and the trend is doing the lifting. The catch is that BTC is trending down while this coin leans the other way, so it is moving against the market.
The entry zone sits about 1.8% below current price, well under 0.088, while the stop is 9.2% from entry and the first target is 10.1% away.
What would make you ignore the hot RSI here?
TRADE PLAN
Entry zone: 0.087 - 0.088 (ref 0.0872)
TP1: 0.096 (+10.14%)
TP2: 0.104 (+19.09%)
TP3: 0.112 (+28.50%)
Stop loss: 0.079 (-9.22%)
Heads up, the stop is 9.2% out. Lower leverage or smaller size, whichever you prefer.
⚠️ Personal market insight, not investment advice. DYOR.
{future}(ARIAUSDT)
$ARIA - LONG play
POV: you wrote $ARIA off as just another altcoin drifting sideways.
Both the 4-hour and the 1-hour trend point up, and price sits above its main EMAs on both. That alignment matters because the idea is a LONG one and the trend is doing the lifting. The catch is that BTC is trending down while this coin leans the other way, so it is moving against the market.
The entry zone sits about 1.8% below current price, well under 0.088, while the stop is 9.2% from entry and the first target is 10.1% away.
What would make you ignore the hot RSI here?
TRADE PLAN
Entry zone: 0.087 - 0.088 (ref 0.0872)
TP1: 0.096 (+10.14%)
TP2: 0.104 (+19.09%)
TP3: 0.112 (+28.50%)
Stop loss: 0.079 (-9.22%)
Heads up, the stop is 9.2% out. Lower leverage or smaller size, whichever you prefer.
⚠️ Personal market insight, not investment advice. DYOR.
1
343
·
--
Падение
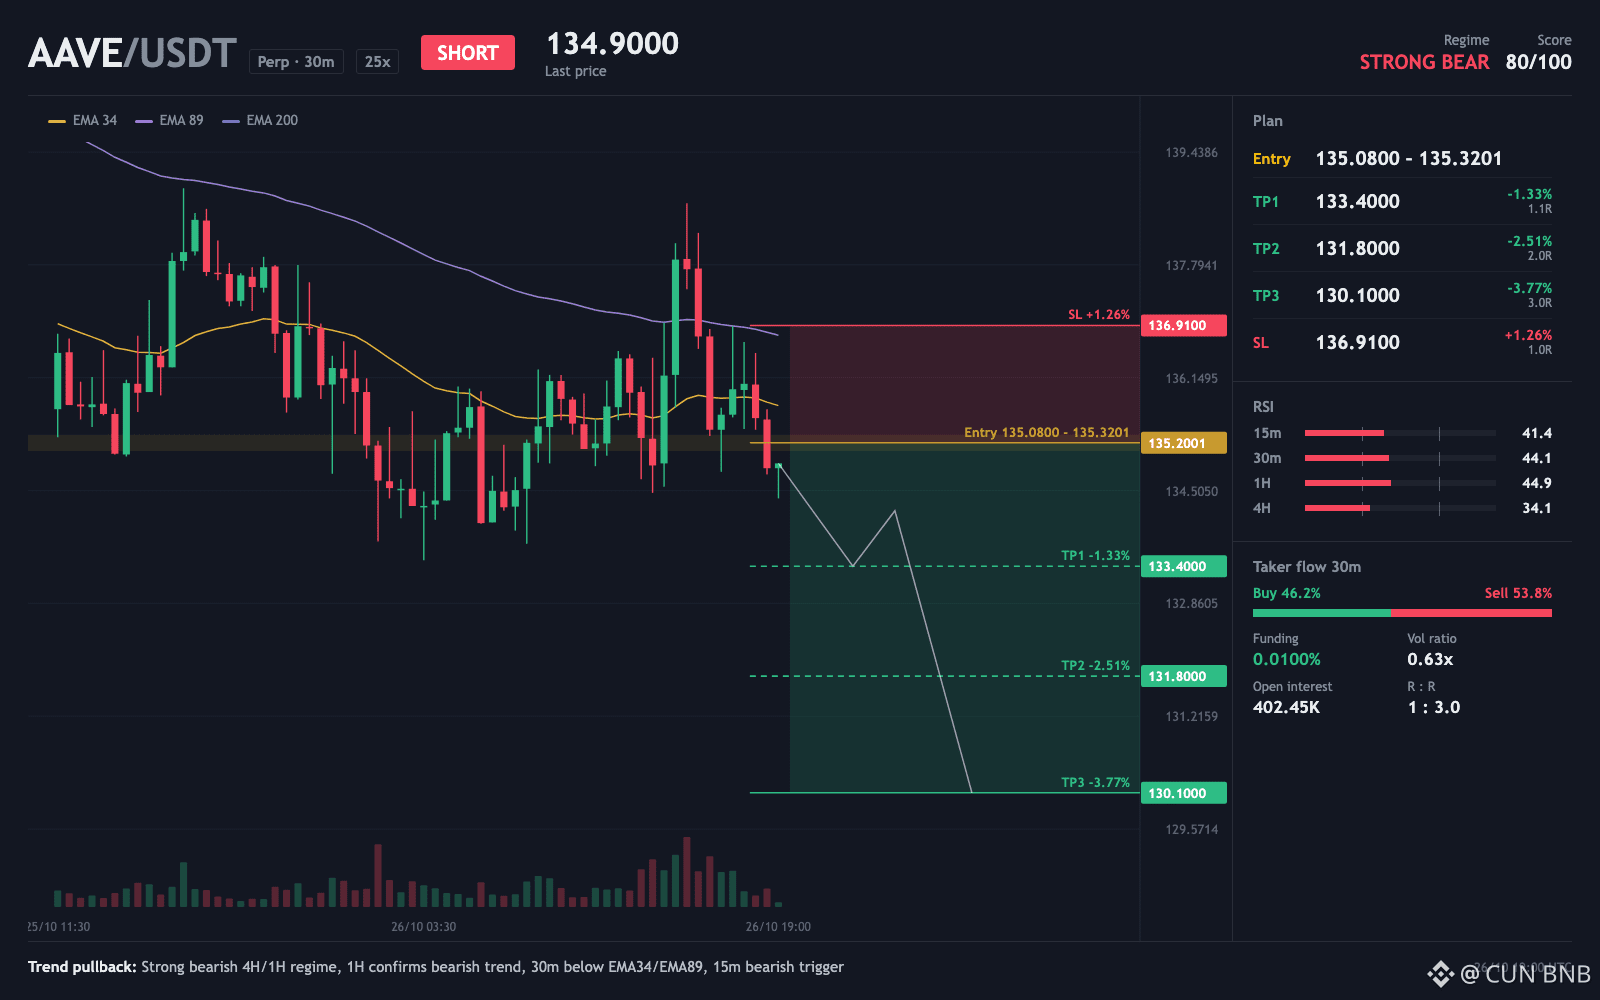
$AAVE - SHORT scenario
Quick lesson from $AAVE on what a sell trigger looks like when timing lines up
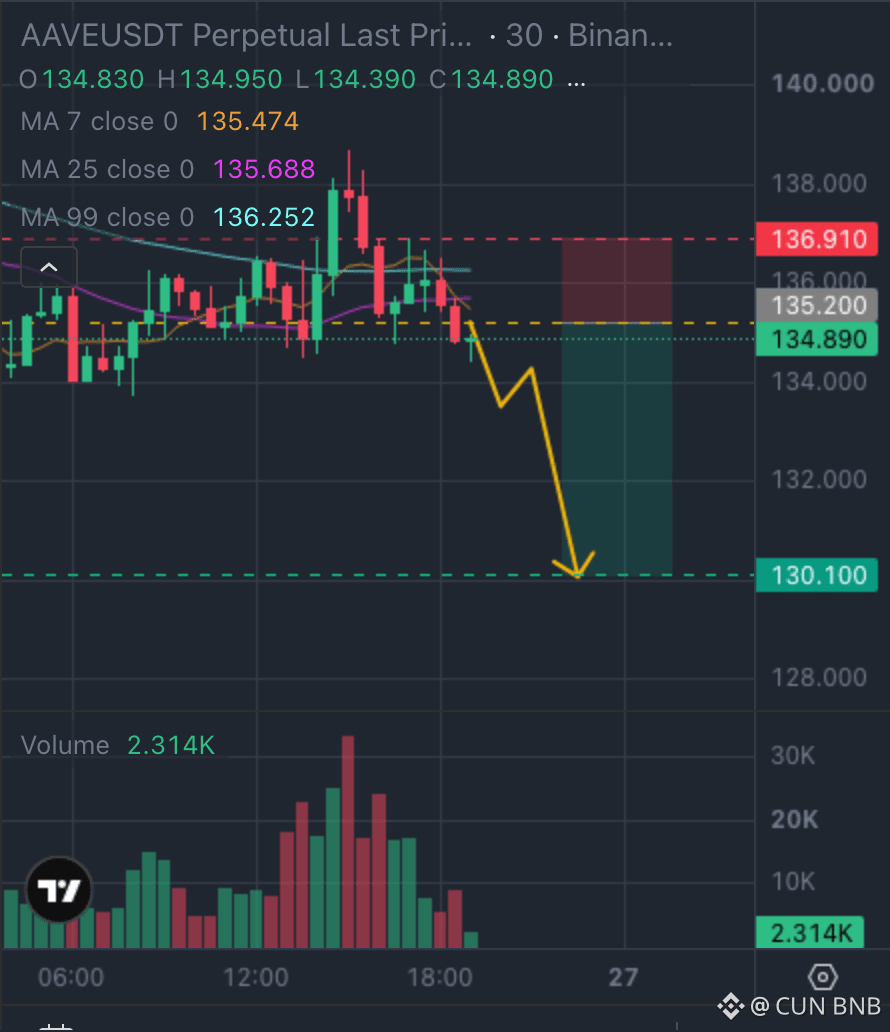
The 15-minute chart has flipped to a sell signal, so the short-term clock now points the same way as the larger idea. That means the setup reads as ready rather than waiting. Price is still about 0.2% under the entry zone at 135.08, so nothing has filled yet and the idea stays a watch until price gets there.
Next thing to track is whether price reaches that zone at all.
Reaches 135.08 and fills, or drifts away without touching it?
TRADE PLAN
Entry zone: 135.08 - 135.32 (ref 135.236)
TP1: 133.4 (+1.36%)
TP2: 131.8 (+2.54%)
TP3: 130.1 (+3.80%)
Stop loss: 136.91 (-1.24%)
⚠️ Personal market insight, not investment advice. DYOR.
{future}(AAVEUSDT)
$AAVE - SHORT scenario
Quick lesson from $AAVE on what a sell trigger looks like when timing lines up
The 15-minute chart has flipped to a sell signal, so the short-term clock now points the same way as the larger idea. That means the setup reads as ready rather than waiting. Price is still about 0.2% under the entry zone at 135.08, so nothing has filled yet and the idea stays a watch until price gets there.
Next thing to track is whether price reaches that zone at all.
Reaches 135.08 and fills, or drifts away without touching it?
TRADE PLAN
Entry zone: 135.08 - 135.32 (ref 135.236)
TP1: 133.4 (+1.36%)
TP2: 131.8 (+2.54%)
TP3: 130.1 (+3.80%)
Stop loss: 136.91 (-1.24%)
⚠️ Personal market insight, not investment advice. DYOR.
1
293
·
--
Падение
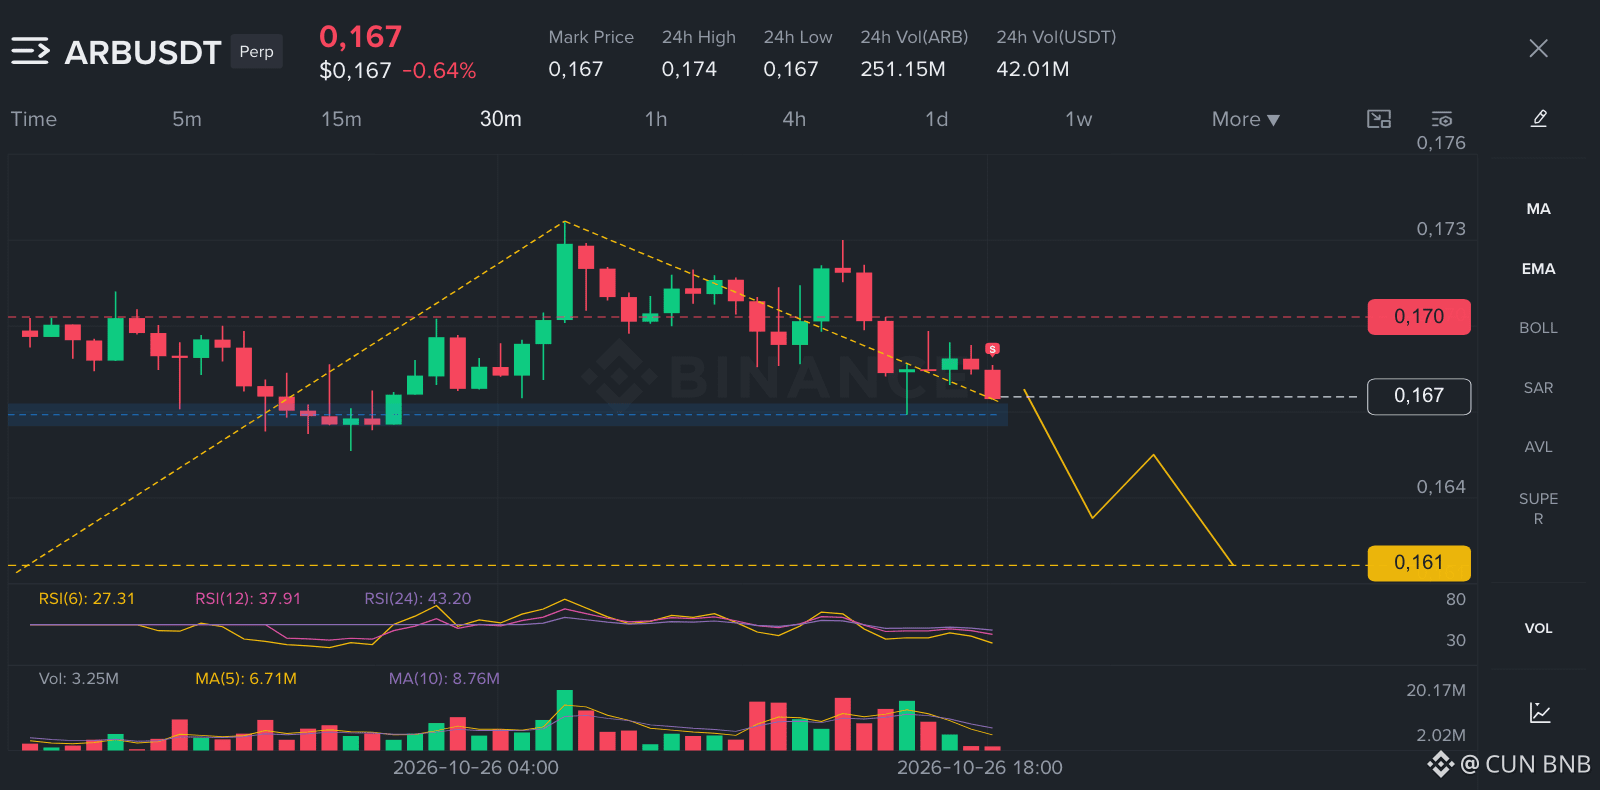
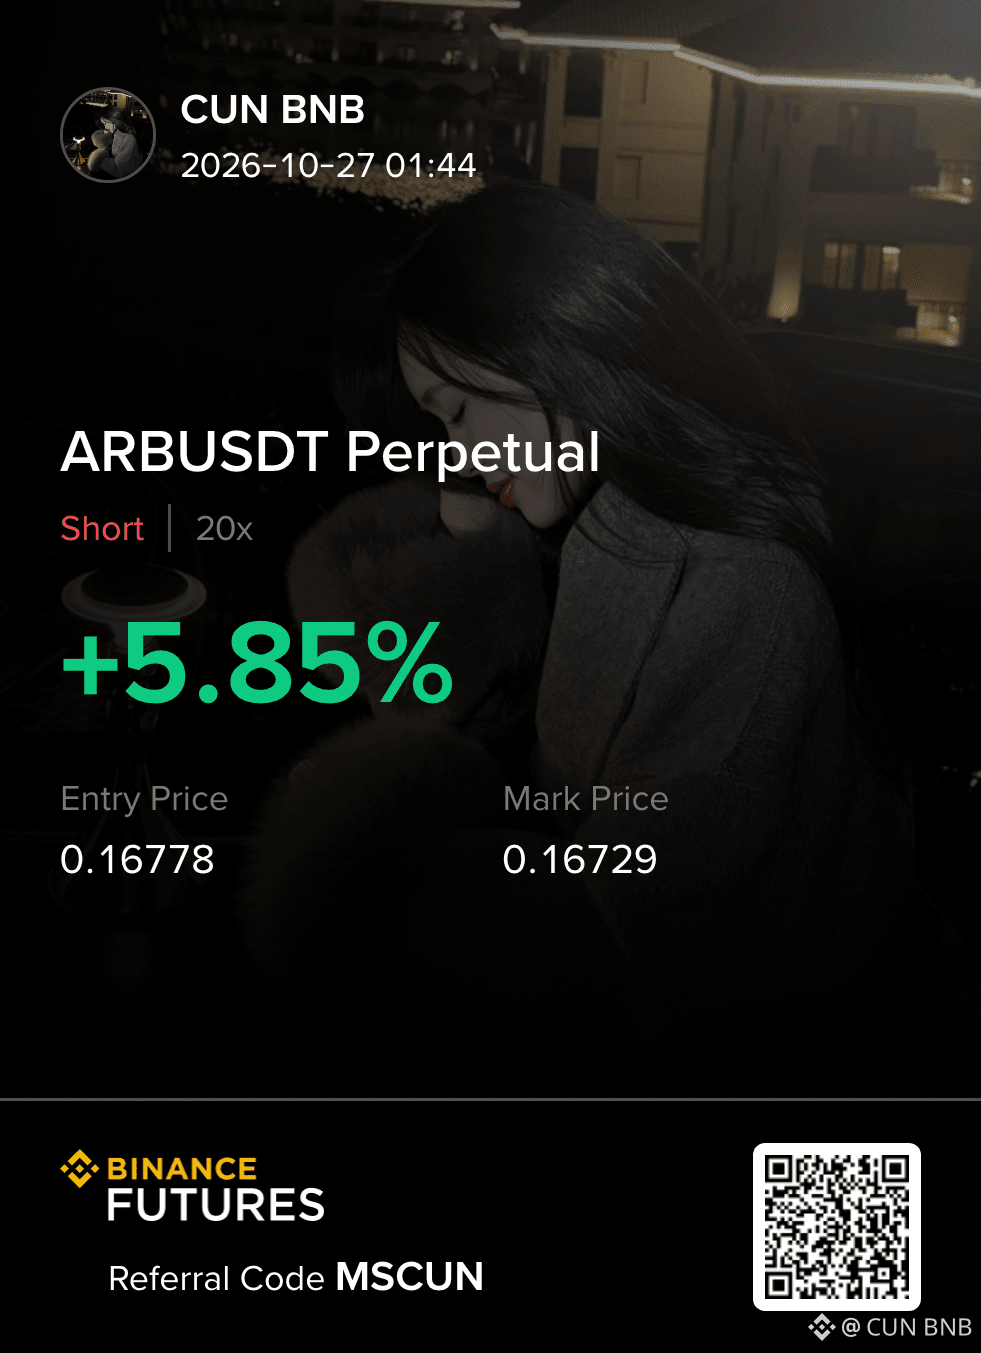
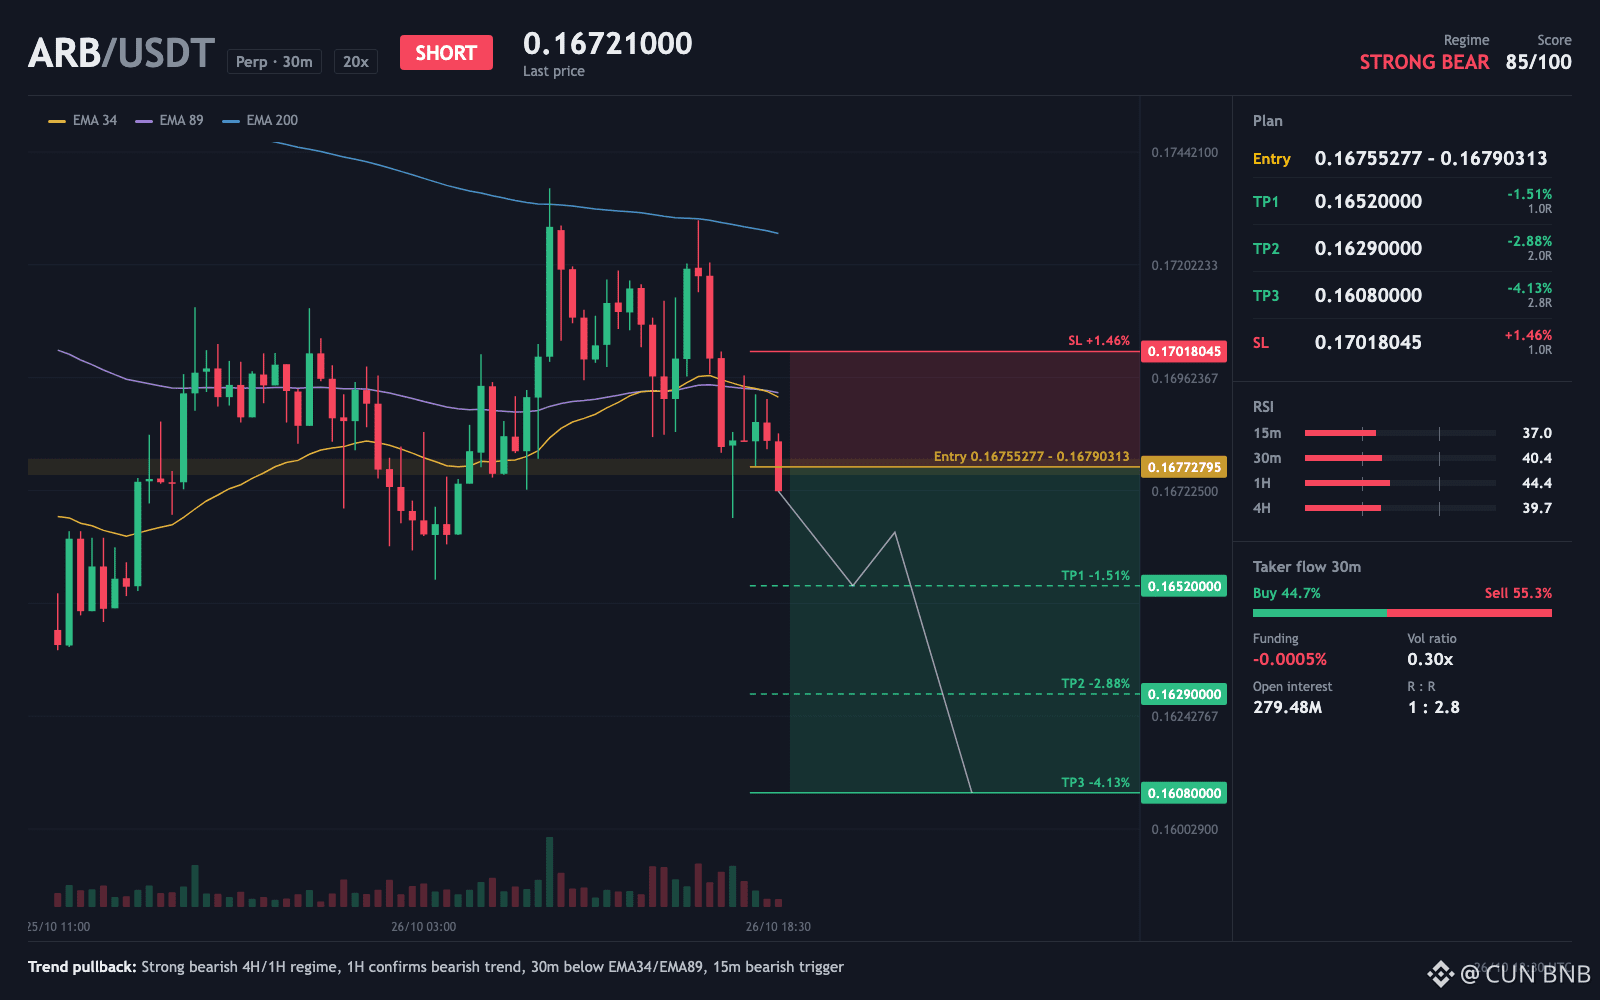
$ARB - SHORT breakout setup
1%. That is calm.
TRADE PLAN
Entry zone: 0.1676 - 0.1679 (ref 0.16778)
TP1: 0.1652 (+1.54%)
TP2: 0.1629 (+2.91%)
TP3: 0.1608 (+4.16%)
Stop loss: 0.1702 (-1.43%)
This is an active setup built on a quiet chart, where the average 30-minute candle only swings about 1% between its high and low. Calm price action like that means a clean break would stand out, and the entry zone sits about 0.3% above current price at 0.17. What gets me here is how tight that range is, because the stop is 1.4% from entry and a short still fights negative funding at 0.0005%, so shorts pay longs to hold.
Does this 1% candle range look calm to you, or too quiet to trust?
⚠️ Personal market insight, not investment advice. DYOR.
{future}(ARBUSDT)
$ARB - SHORT breakout setup
1%. That is calm.
TRADE PLAN
Entry zone: 0.1676 - 0.1679 (ref 0.16778)
TP1: 0.1652 (+1.54%)
TP2: 0.1629 (+2.91%)
TP3: 0.1608 (+4.16%)
Stop loss: 0.1702 (-1.43%)
This is an active setup built on a quiet chart, where the average 30-minute candle only swings about 1% between its high and low. Calm price action like that means a clean break would stand out, and the entry zone sits about 0.3% above current price at 0.17. What gets me here is how tight that range is, because the stop is 1.4% from entry and a short still fights negative funding at 0.0005%, so shorts pay longs to hold.
Does this 1% candle range look calm to you, or too quiet to trust?
⚠️ Personal market insight, not investment advice. DYOR.
1
369
·
--
Падение
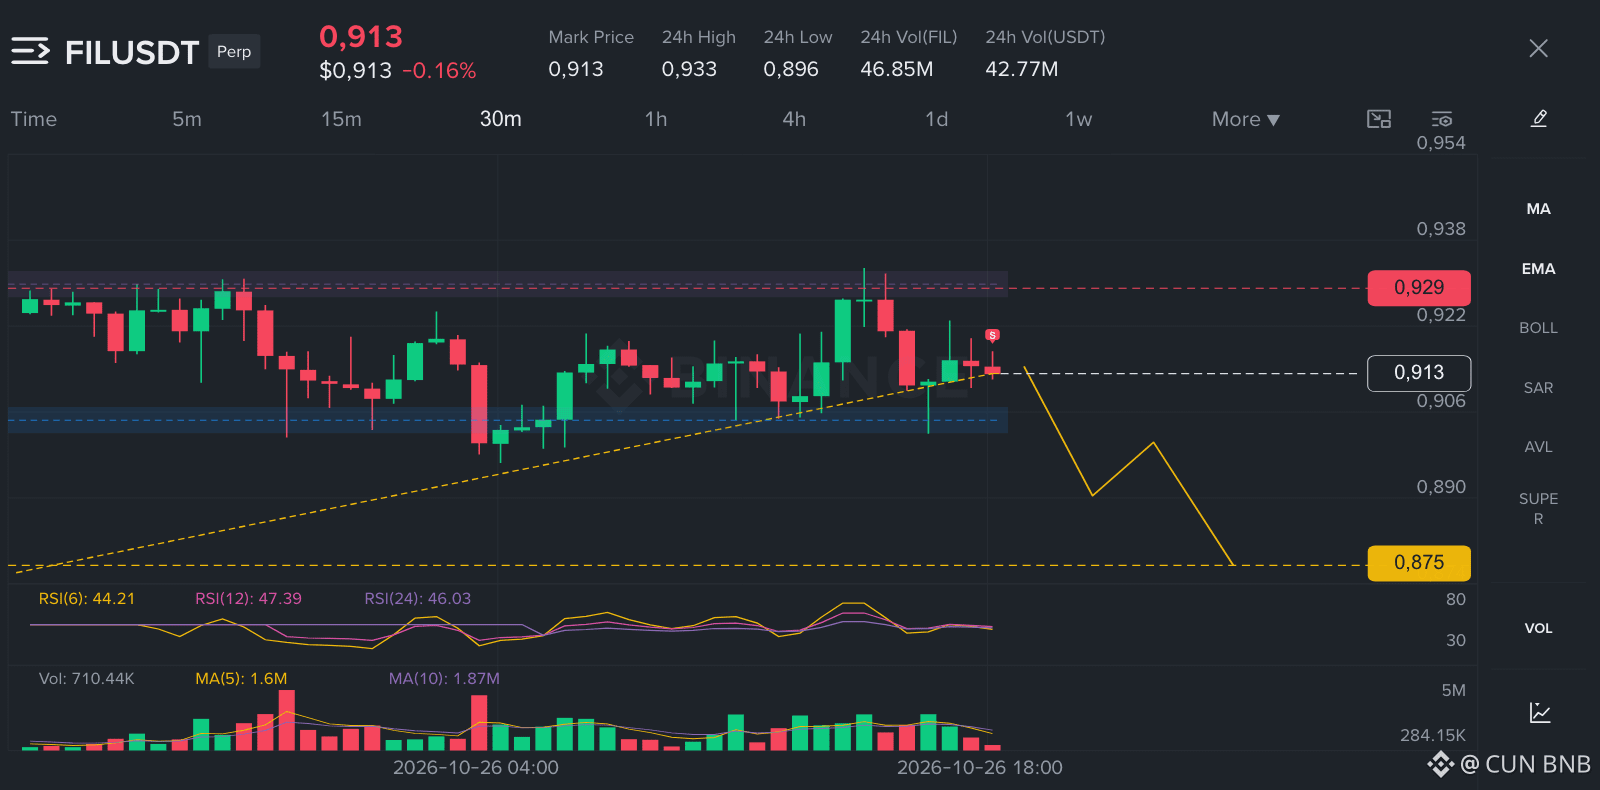
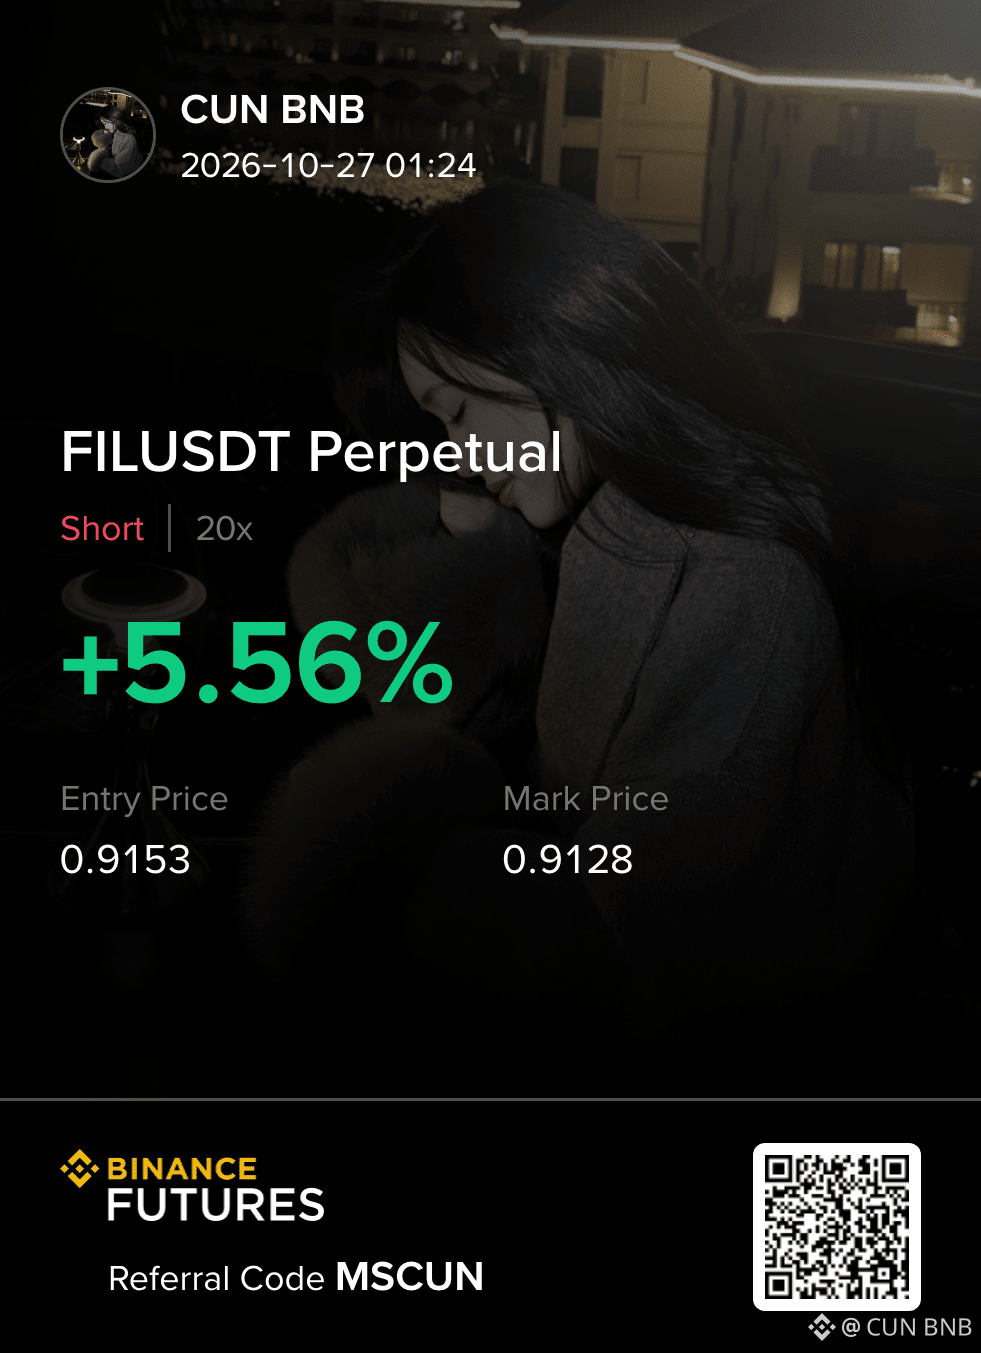
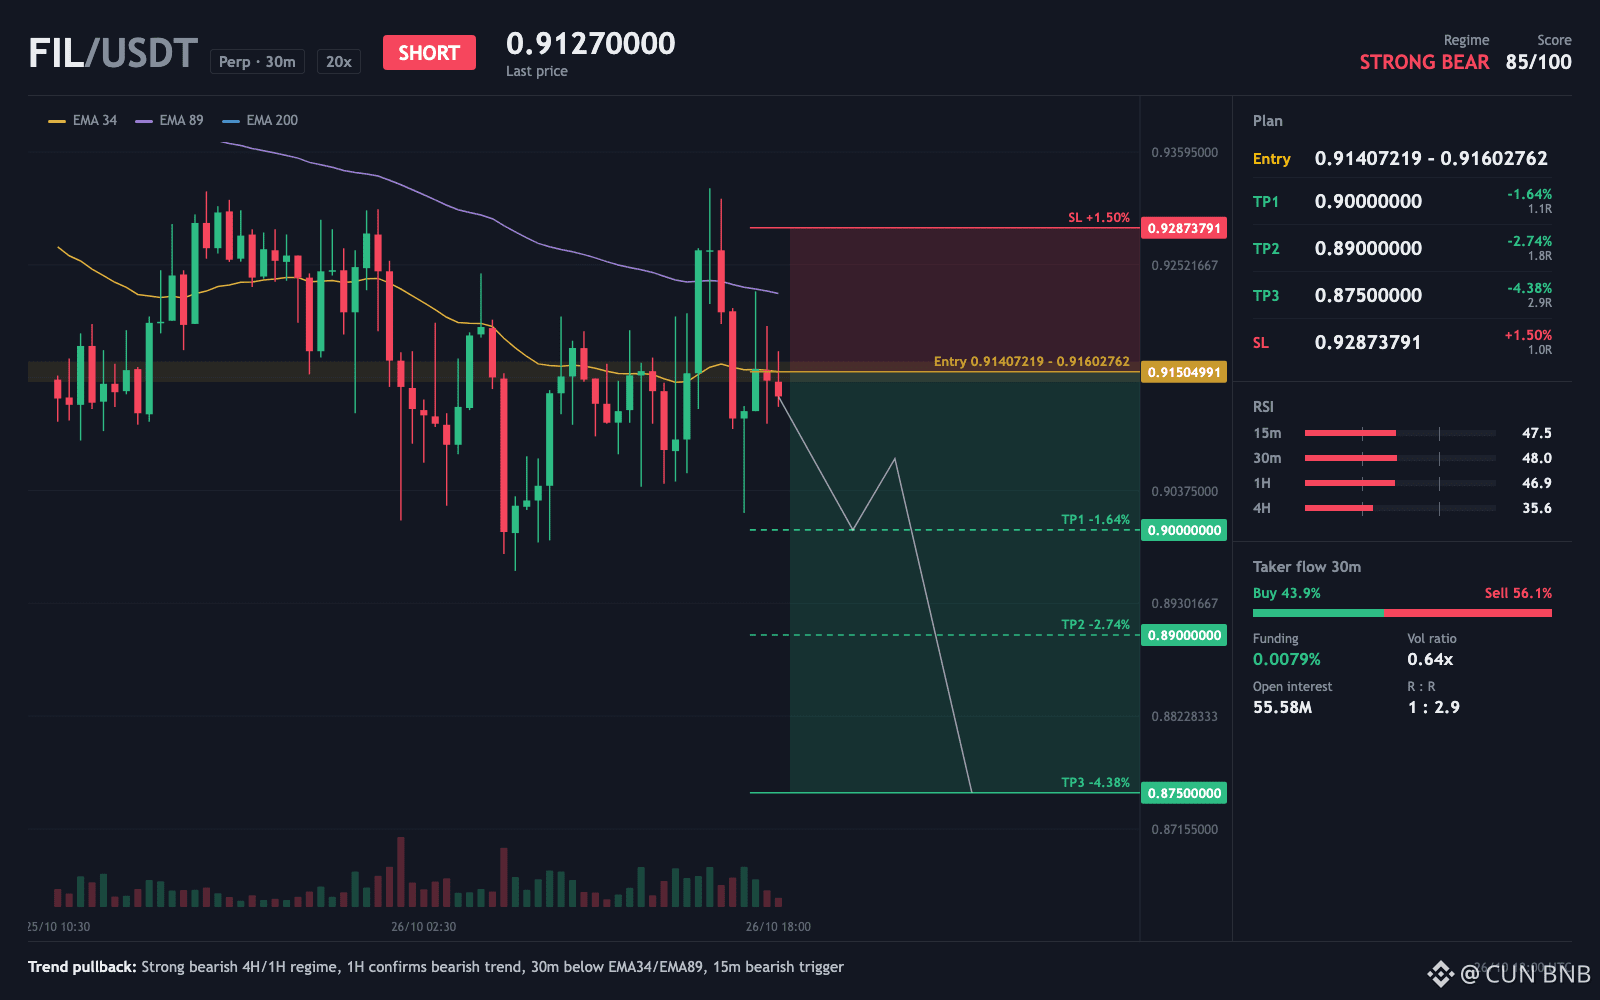
$FIL - SHORT execution plan
Real talk: $FIL looks calm until you see who is actually doing the selling.
Most of the market orders on the 30-minute chart are sells at 56.1%, and price still sits below 0.91 where the entry zone waits. The doubt is whether that zone gets reached at all before the flow flips.
Ever watched a pullback stall right before your level and never come back?
TRADE PLAN
Entry zone: 0.91 - 0.92 (ref 0.915)
TP1: 0.9 (+1.68%)
TP2: 0.89 (+2.77%)
TP3: 0.88 (+4.41%)
Stop loss: 0.93 (-1.46%)
⚠️ Personal market insight, not investment advice. DYOR.
{future}(FILUSDT)
$FIL - SHORT execution plan
Real talk: $FIL looks calm until you see who is actually doing the selling.
Most of the market orders on the 30-minute chart are sells at 56.1%, and price still sits below 0.91 where the entry zone waits. The doubt is whether that zone gets reached at all before the flow flips.
Ever watched a pullback stall right before your level and never come back?
TRADE PLAN
Entry zone: 0.91 - 0.92 (ref 0.915)
TP1: 0.9 (+1.68%)
TP2: 0.89 (+2.77%)
TP3: 0.88 (+4.41%)
Stop loss: 0.93 (-1.46%)
⚠️ Personal market insight, not investment advice. DYOR.
1
386
·
--
Рост
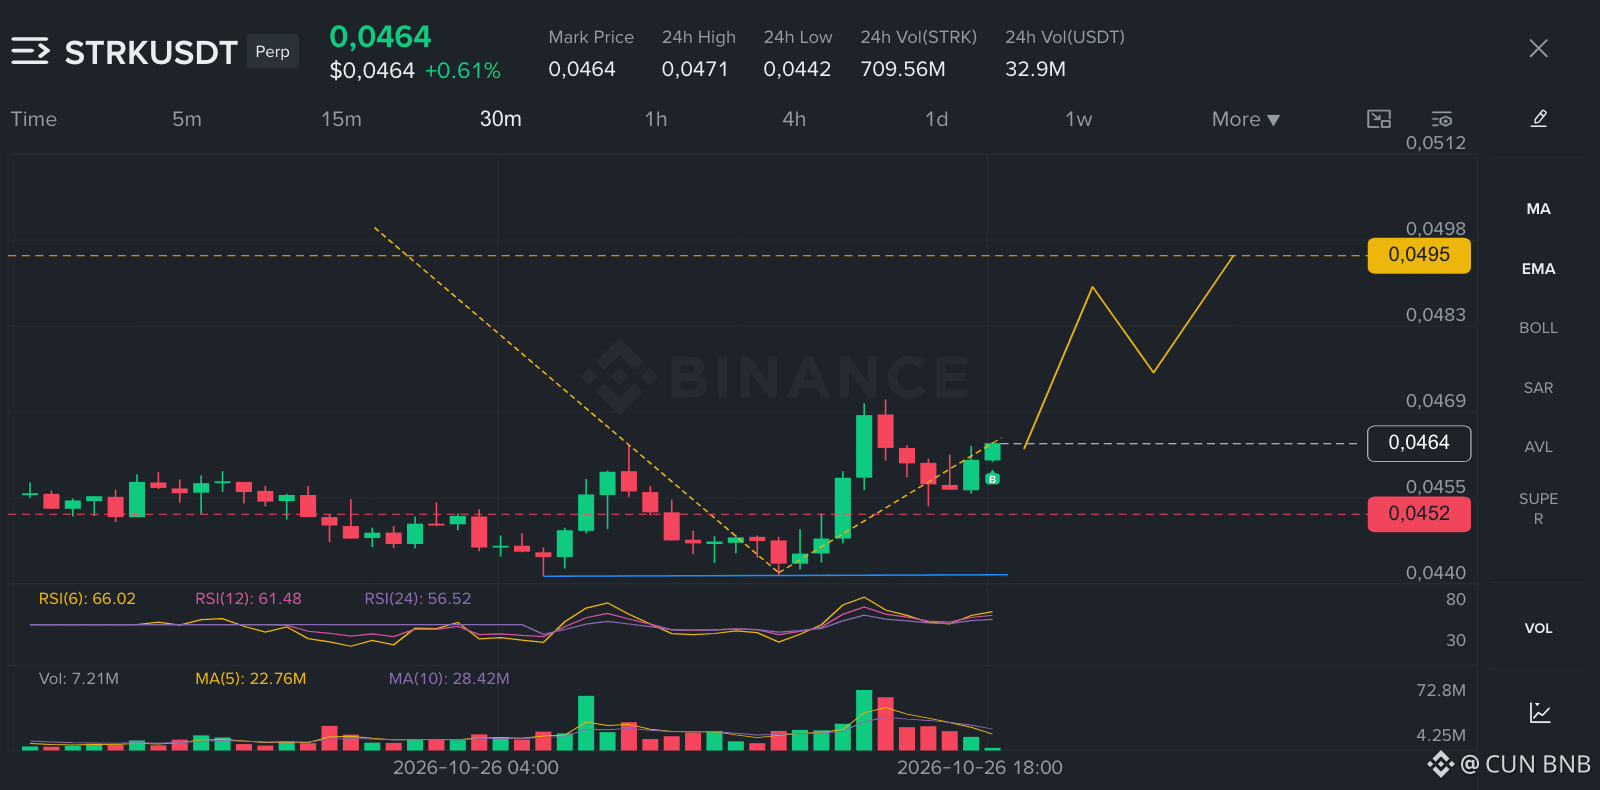
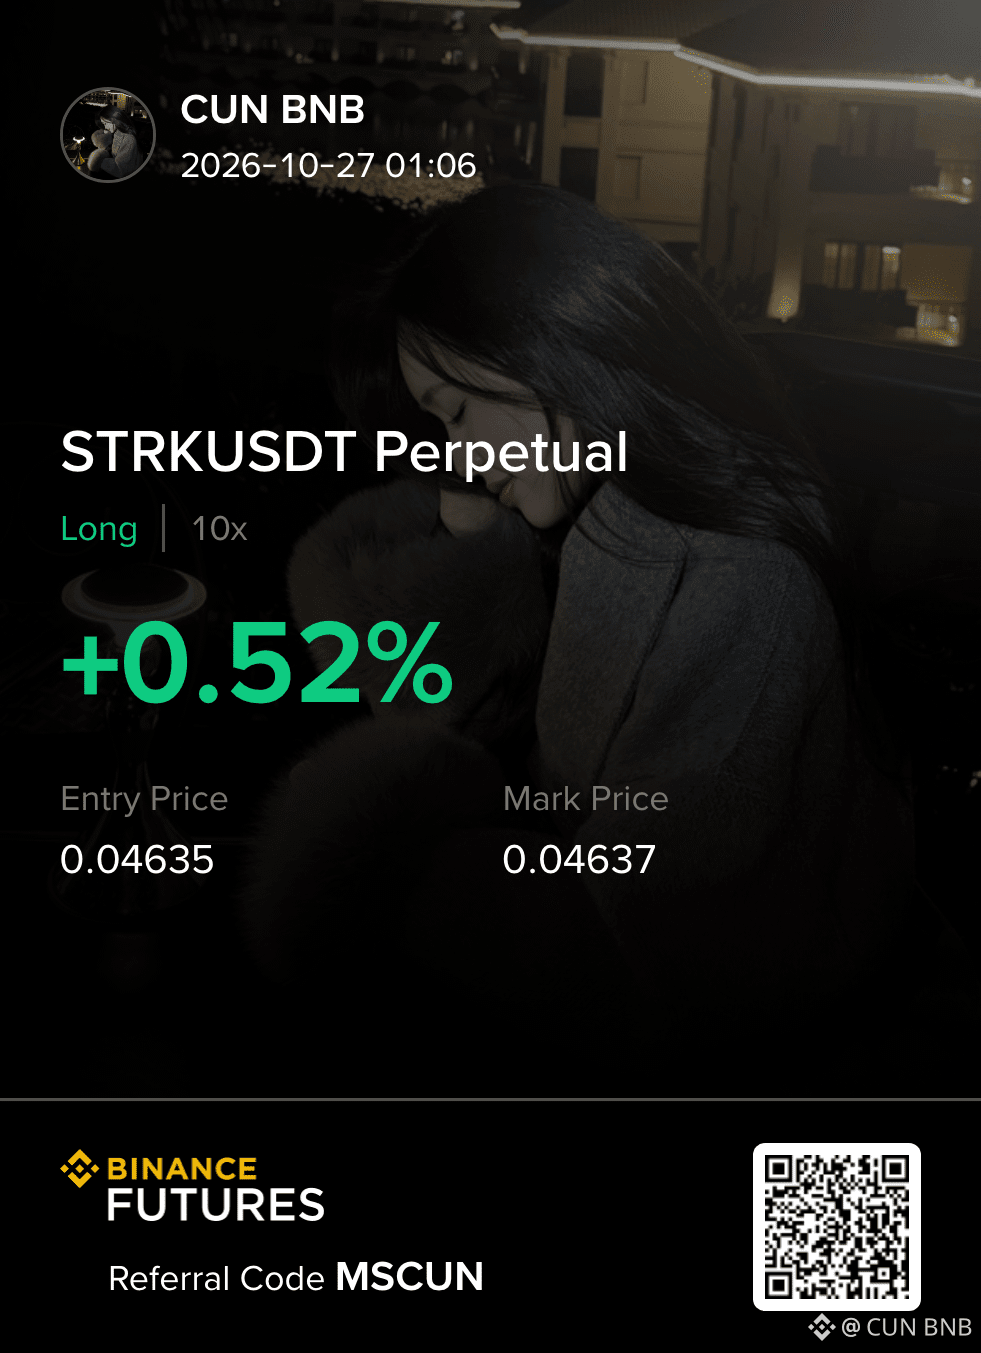
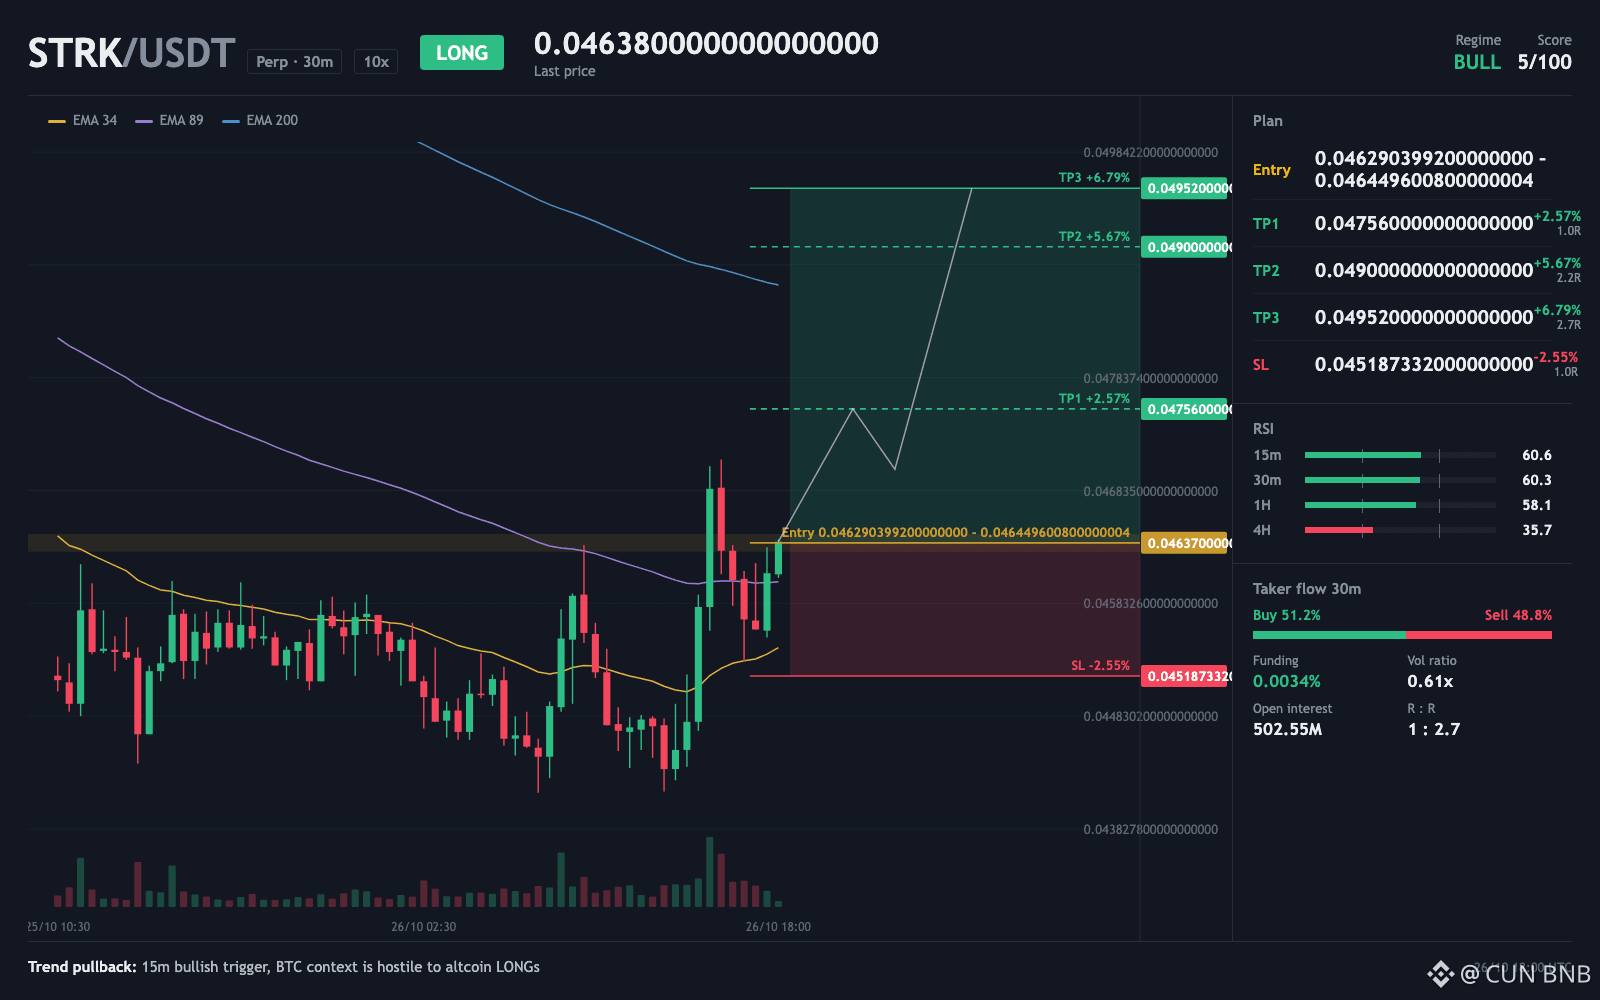
$STRK - I'm leaning LONG here
The whole $STRK idea rests on a candle that barely traded.
TRADE PLAN
Entry zone: 0.0463 - 0.0464 (ref 0.04635)
TP1: 0.0476 (+2.62%)
TP2: 0.049 (+5.73%)
TP3: 0.0495 (+6.85%)
Stop loss: 0.0452 (-2.50%)
The last finished 30-minute candle ran at just 61% of normal volume, so the move happened without many people joining in. That backward calm is what gets me: nobody has piled in, so the move is still early rather than late. My worry is BTC sliding while this one pushes the other way.
⚠️ Personal market insight, not investment advice. DYOR.
{future}(STRKUSDT)
$STRK - I'm leaning LONG here
The whole $STRK idea rests on a candle that barely traded.
TRADE PLAN
Entry zone: 0.0463 - 0.0464 (ref 0.04635)
TP1: 0.0476 (+2.62%)
TP2: 0.049 (+5.73%)
TP3: 0.0495 (+6.85%)
Stop loss: 0.0452 (-2.50%)
The last finished 30-minute candle ran at just 61% of normal volume, so the move happened without many people joining in. That backward calm is what gets me: nobody has piled in, so the move is still early rather than late. My worry is BTC sliding while this one pushes the other way.
⚠️ Personal market insight, not investment advice. DYOR.
1
242
·
--
Падение
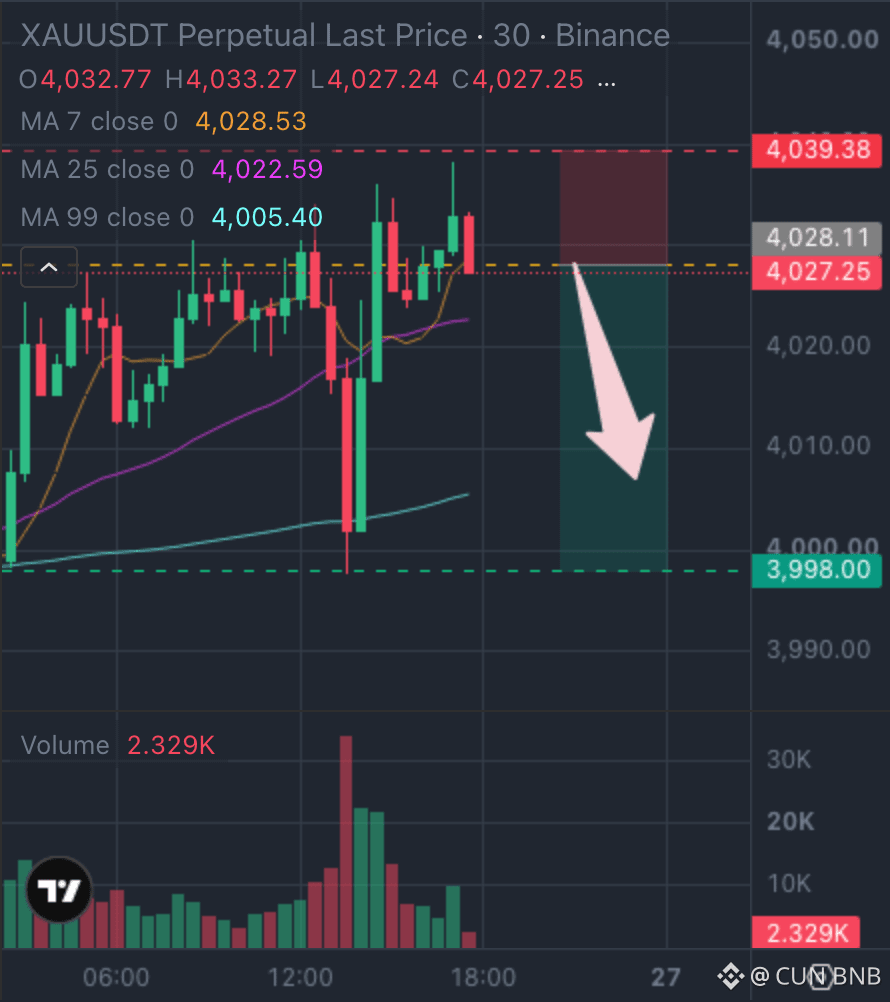
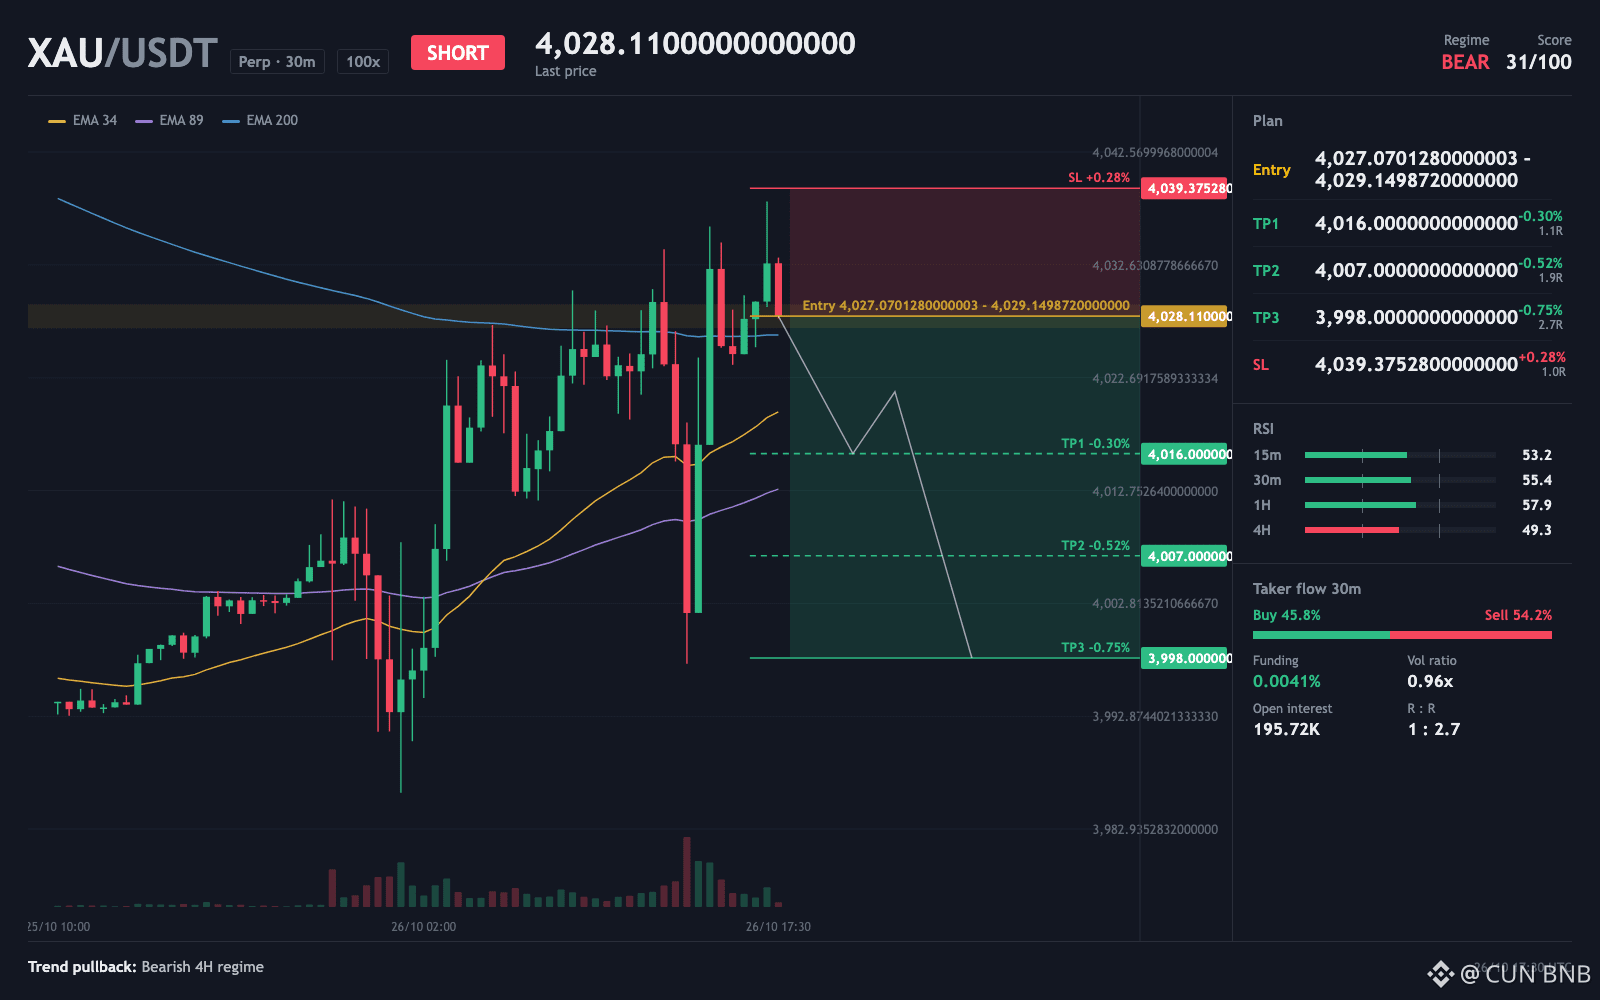
$XAU - currently tilted SHORT
$XAU sits right at its 200 EMA on the 30-minute chart.
Price being 0% below that average means the trend has no cushion either way. RSI reads 58 on the 1-hour and 49 on the 4-hour, so momentum is split.
Holds 4027.07 or loses it first?
TRADE PLAN
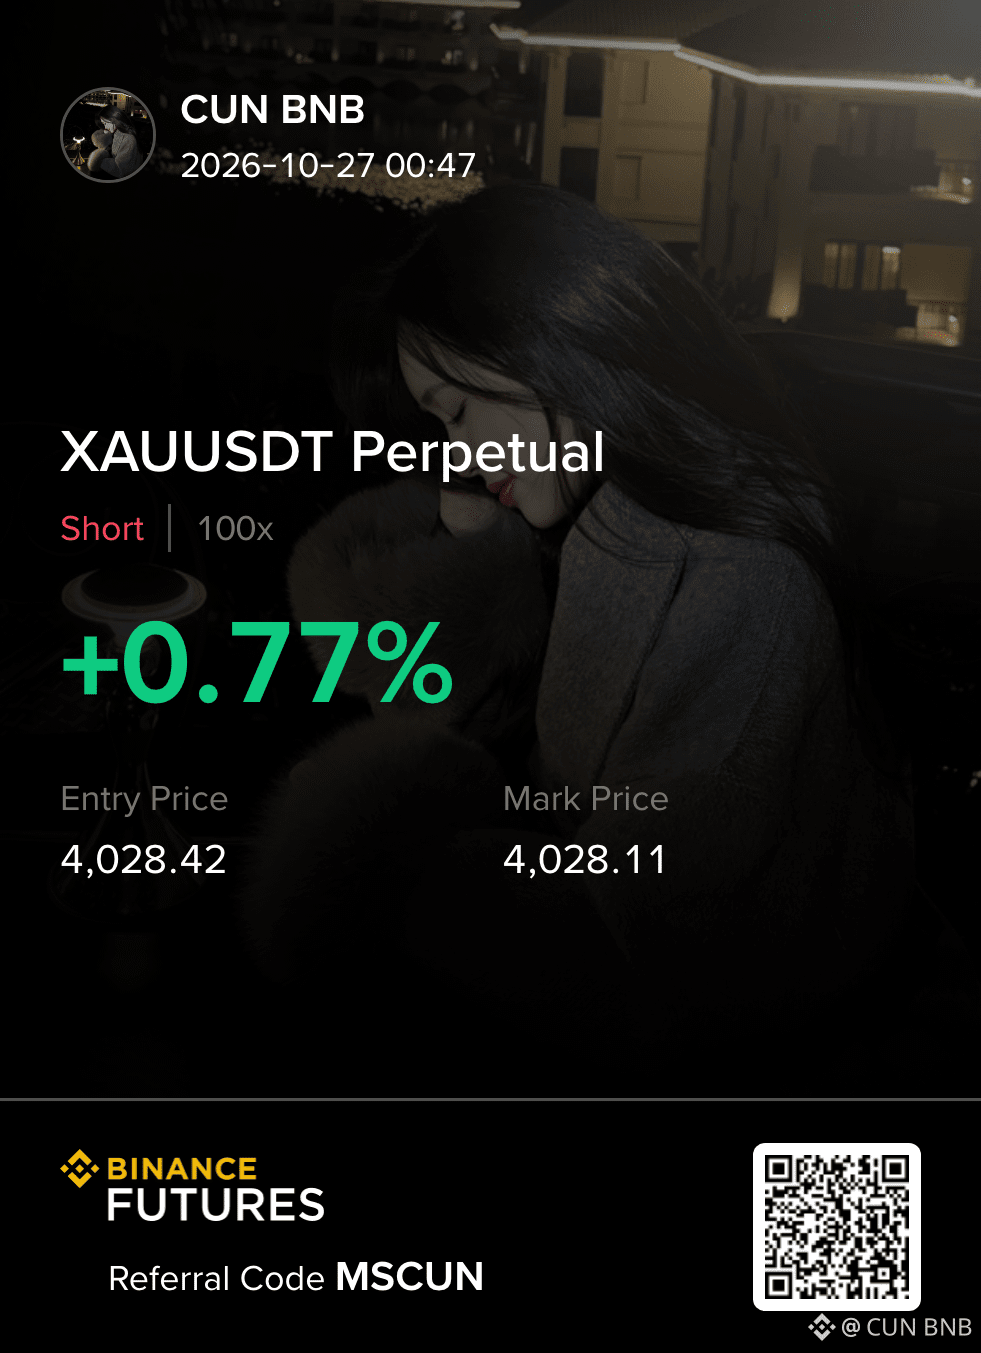
Entry zone: 4027.07 - 4029.15 (ref 4028.422)
TP1: 4016 (+0.31%)
TP2: 4007 (+0.53%)
TP3: 3998 (+0.76%)
Stop loss: 4039.38 (-0.27%)
⚠️ Personal market insight, not investment advice. DYOR.
{future}(XAUUSDT)
$XAU - currently tilted SHORT
$XAU sits right at its 200 EMA on the 30-minute chart.
Price being 0% below that average means the trend has no cushion either way. RSI reads 58 on the 1-hour and 49 on the 4-hour, so momentum is split.
Holds 4027.07 or loses it first?
TRADE PLAN
Entry zone: 4027.07 - 4029.15 (ref 4028.422)
TP1: 4016 (+0.31%)
TP2: 4007 (+0.53%)
TP3: 3998 (+0.76%)
Stop loss: 4039.38 (-0.27%)
⚠️ Personal market insight, not investment advice. DYOR.
2
231
·
--
Рост
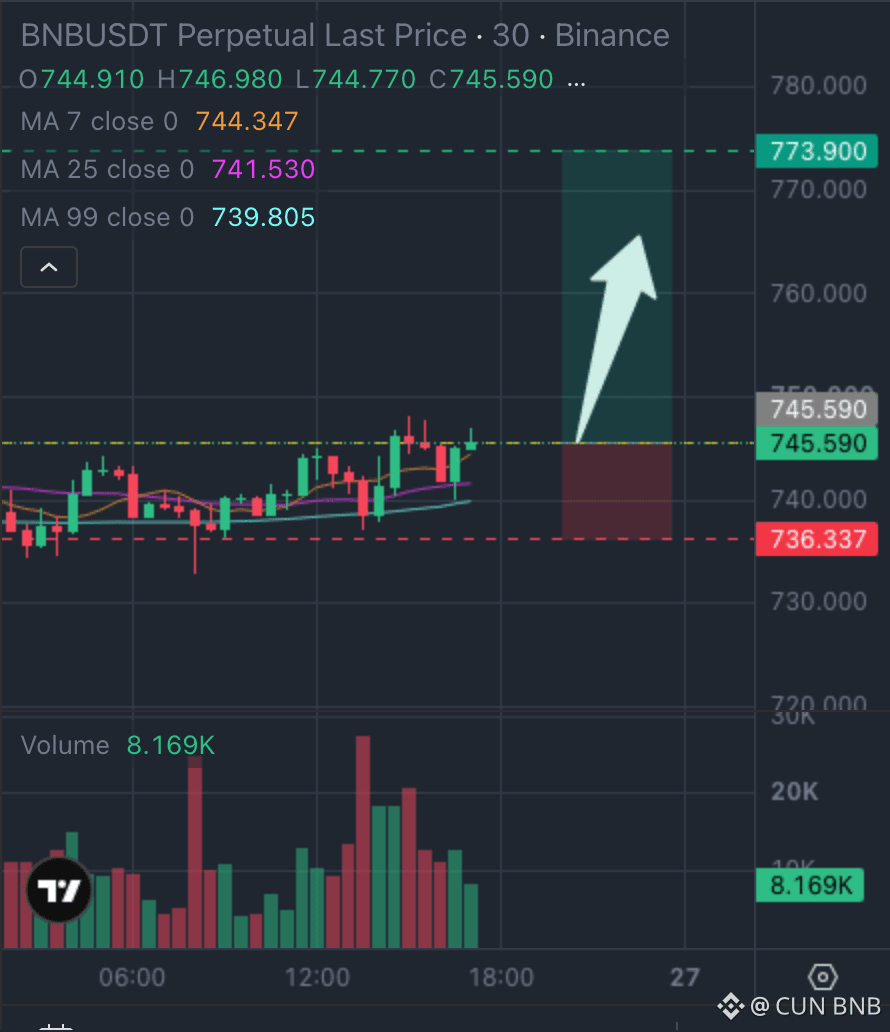
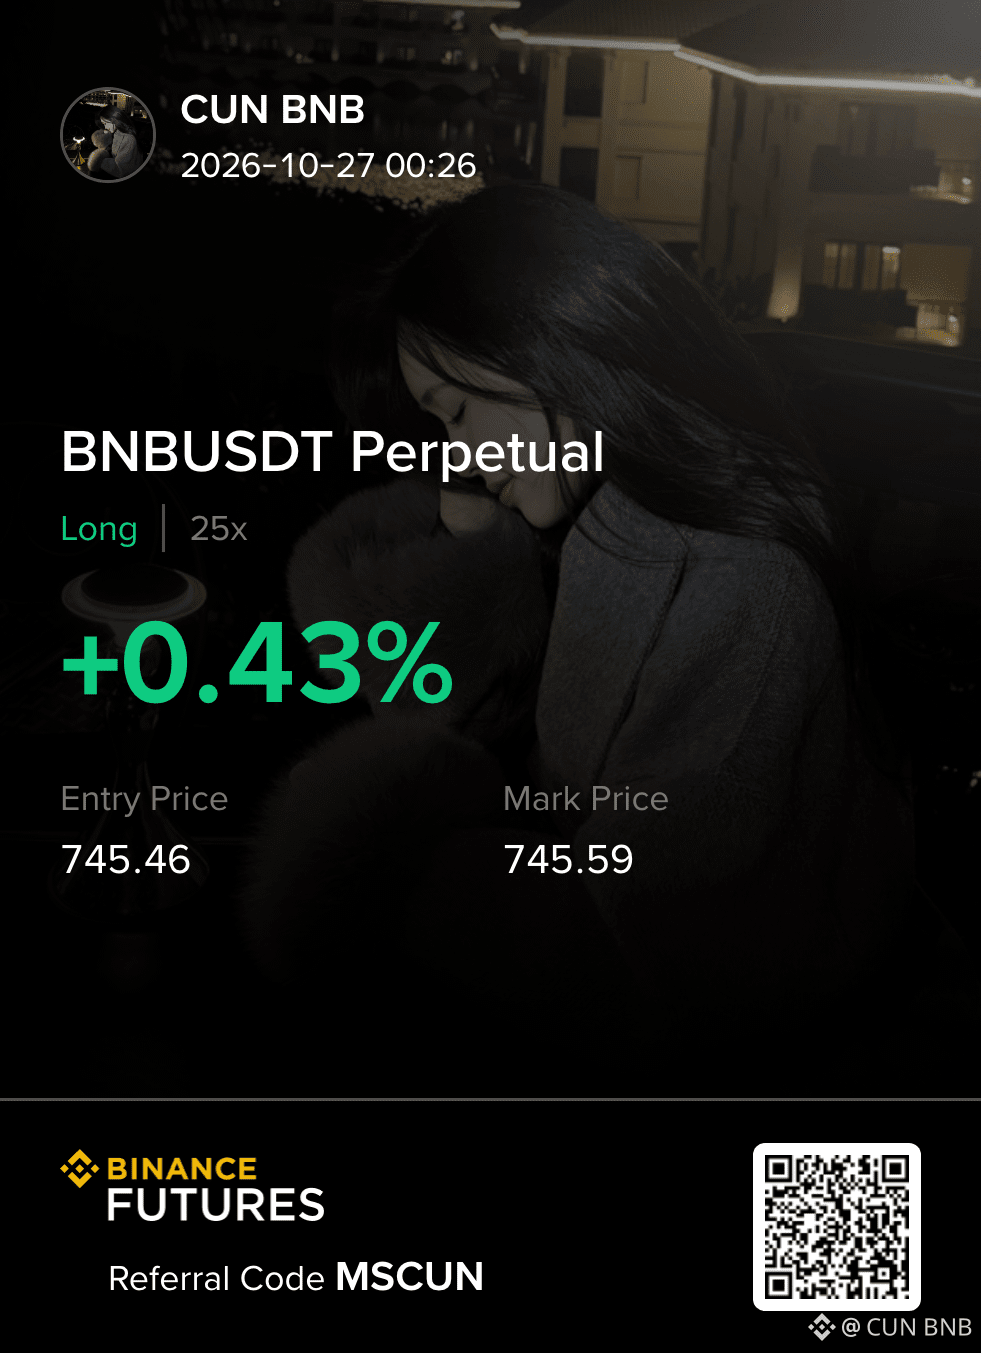
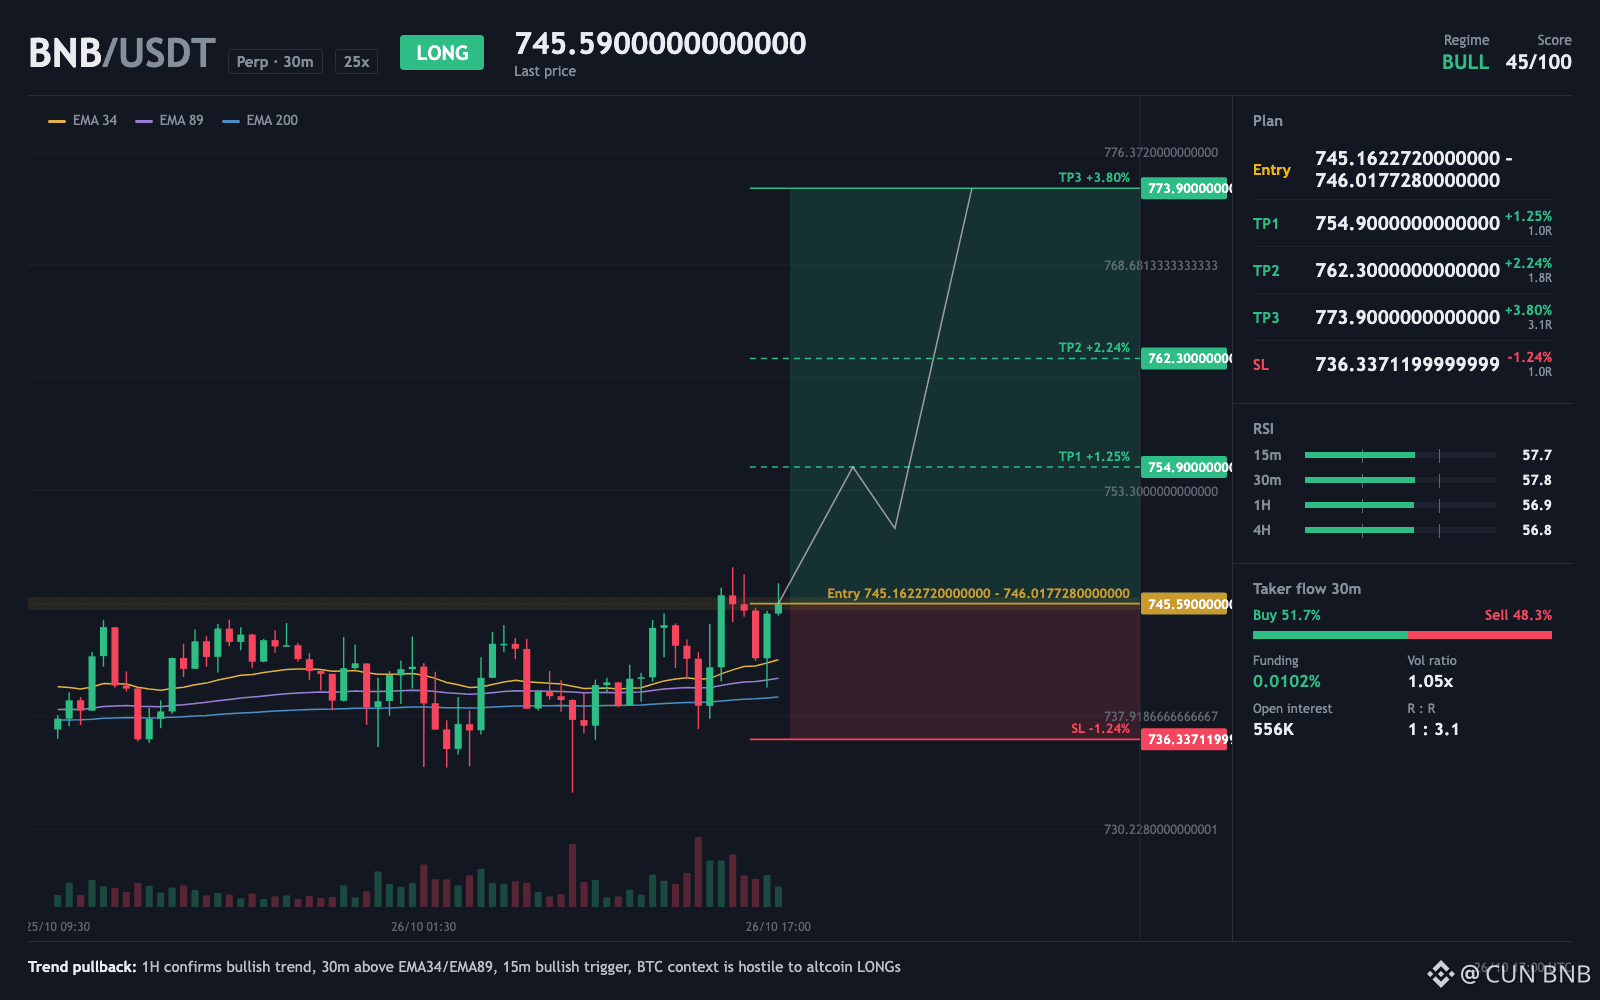
$BNB - leaning LONG
How do you read $BNB's last 30-minute candle, where volume ran about normal?
TRADE PLAN
Entry zone: 745.16 - 746.02 (ref 745.462)
TP1: 754.9 (+1.27%)
TP2: 762.3 (+2.26%)
TP3: 773.9 (+3.81%)
Stop loss: 736.34 (-1.22%)
That candle shows steady trading, not panic and not frenzy. Price already sits in the entry zone, so the move can be judged from here. The 1-hour trend points up while the 4-hour has not joined yet, which keeps this a shorter-term move.
A stop 1.2% away guards the read, and the first target sits 1.3% out.
⚠️ Personal market insight, not investment advice. DYOR.
{future}(BNBUSDT)
$BNB - leaning LONG
How do you read $BNB 's last 30-minute candle, where volume ran about normal?
TRADE PLAN
Entry zone: 745.16 - 746.02 (ref 745.462)
TP1: 754.9 (+1.27%)
TP2: 762.3 (+2.26%)
TP3: 773.9 (+3.81%)
Stop loss: 736.34 (-1.22%)
That candle shows steady trading, not panic and not frenzy. Price already sits in the entry zone, so the move can be judged from here. The 1-hour trend points up while the 4-hour has not joined yet, which keeps this a shorter-term move.
A stop 1.2% away guards the read, and the first target sits 1.3% out.
⚠️ Personal market insight, not investment advice. DYOR.
1
345
·
--
Падение
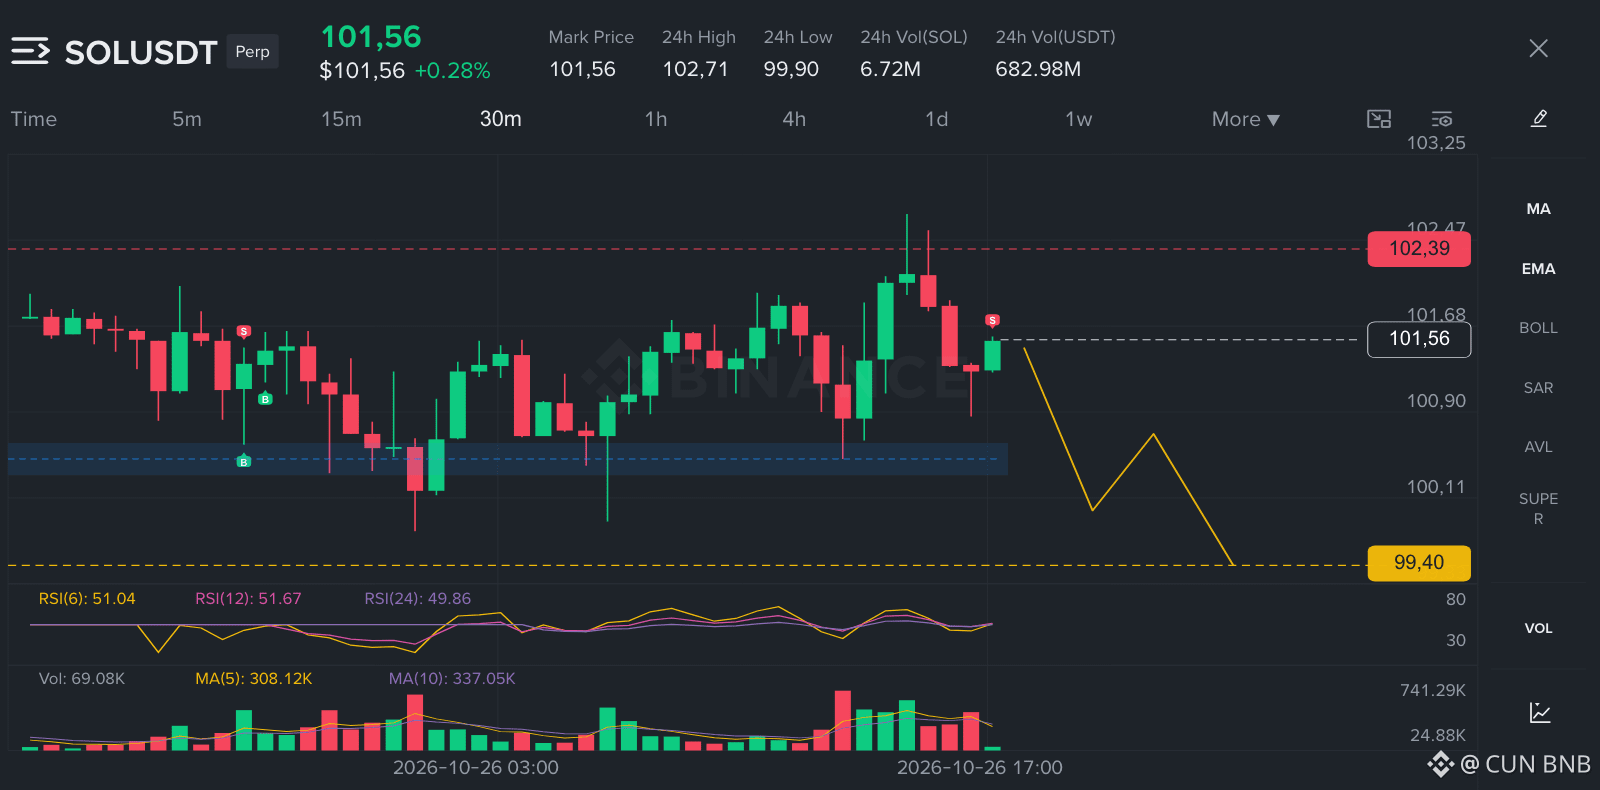
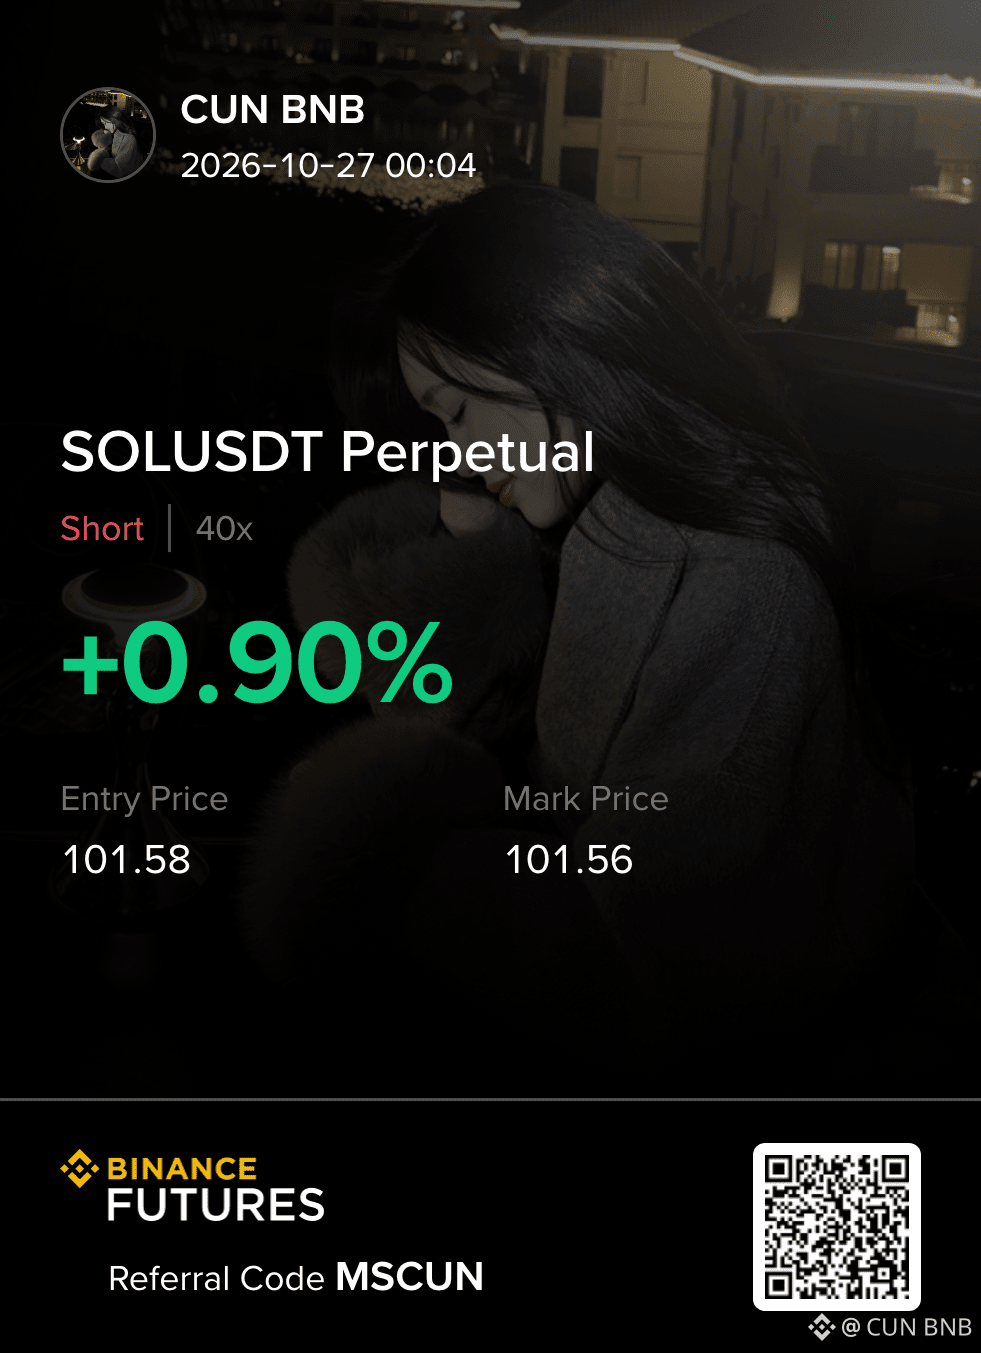
$SOL - SHORT bias
Part of this idea is already done today. The price here is not the earlier price, and I am sizing for that.
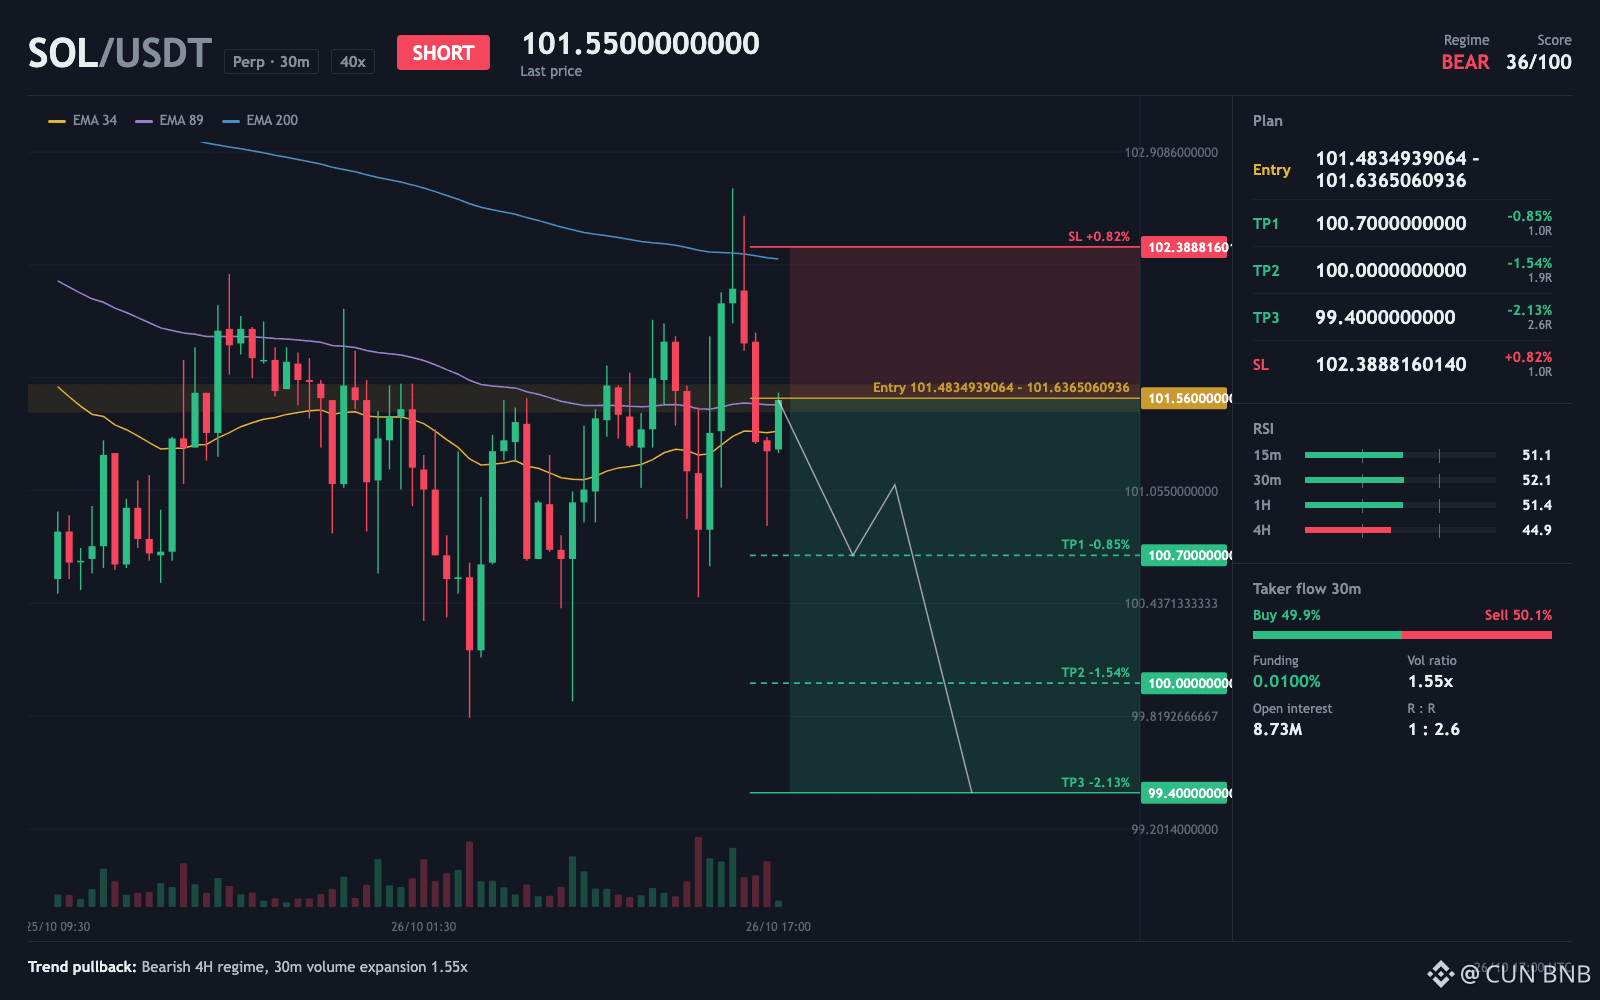
At a glance the chart looks like a coin resting on its long-term average. The 30-minute view shows price 1.1% under the 200 EMA, with the 34 EMA above the 89, both sitting overhead. That stacking keeps the short-side picture intact, since price is still below all three averages.
Price is already inside the entry zone, with the stop 0.8% from entry and the first target 0.9% away. Watch whether price stays capped under that overhead stack, because a climb back through it would break the setup.
TRADE PLAN
Entry zone: 101.48 - 101.64 (ref 101.583)
TP1: 100.7 (+0.87%)
TP2: 100 (+1.56%)
TP3: 99.4 (+2.15%)
Stop loss: 102.39 (-0.79%)
⚠️ Personal market insight, not investment advice. DYOR.
{future}(SOLUSDT)
$SOL - SHORT bias
Part of this idea is already done today. The price here is not the earlier price, and I am sizing for that.
At a glance the chart looks like a coin resting on its long-term average. The 30-minute view shows price 1.1% under the 200 EMA, with the 34 EMA above the 89, both sitting overhead. That stacking keeps the short-side picture intact, since price is still below all three averages.
Price is already inside the entry zone, with the stop 0.8% from entry and the first target 0.9% away. Watch whether price stays capped under that overhead stack, because a climb back through it would break the setup.
TRADE PLAN
Entry zone: 101.48 - 101.64 (ref 101.583)
TP1: 100.7 (+0.87%)
TP2: 100 (+1.56%)
TP3: 99.4 (+2.15%)
Stop loss: 102.39 (-0.79%)
⚠️ Personal market insight, not investment advice. DYOR.
208
·
--
Падение
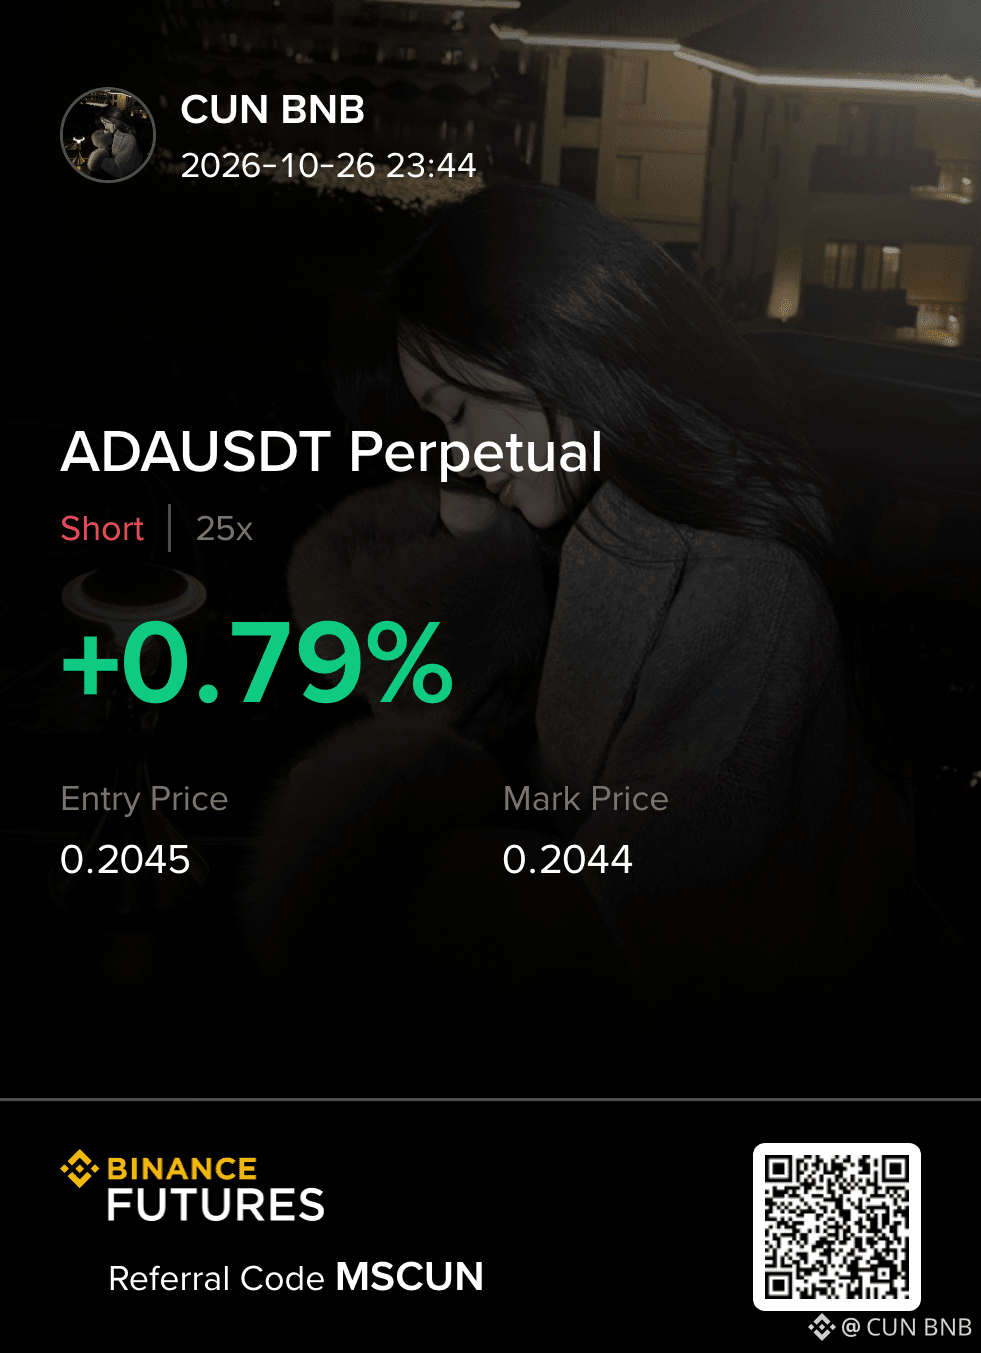
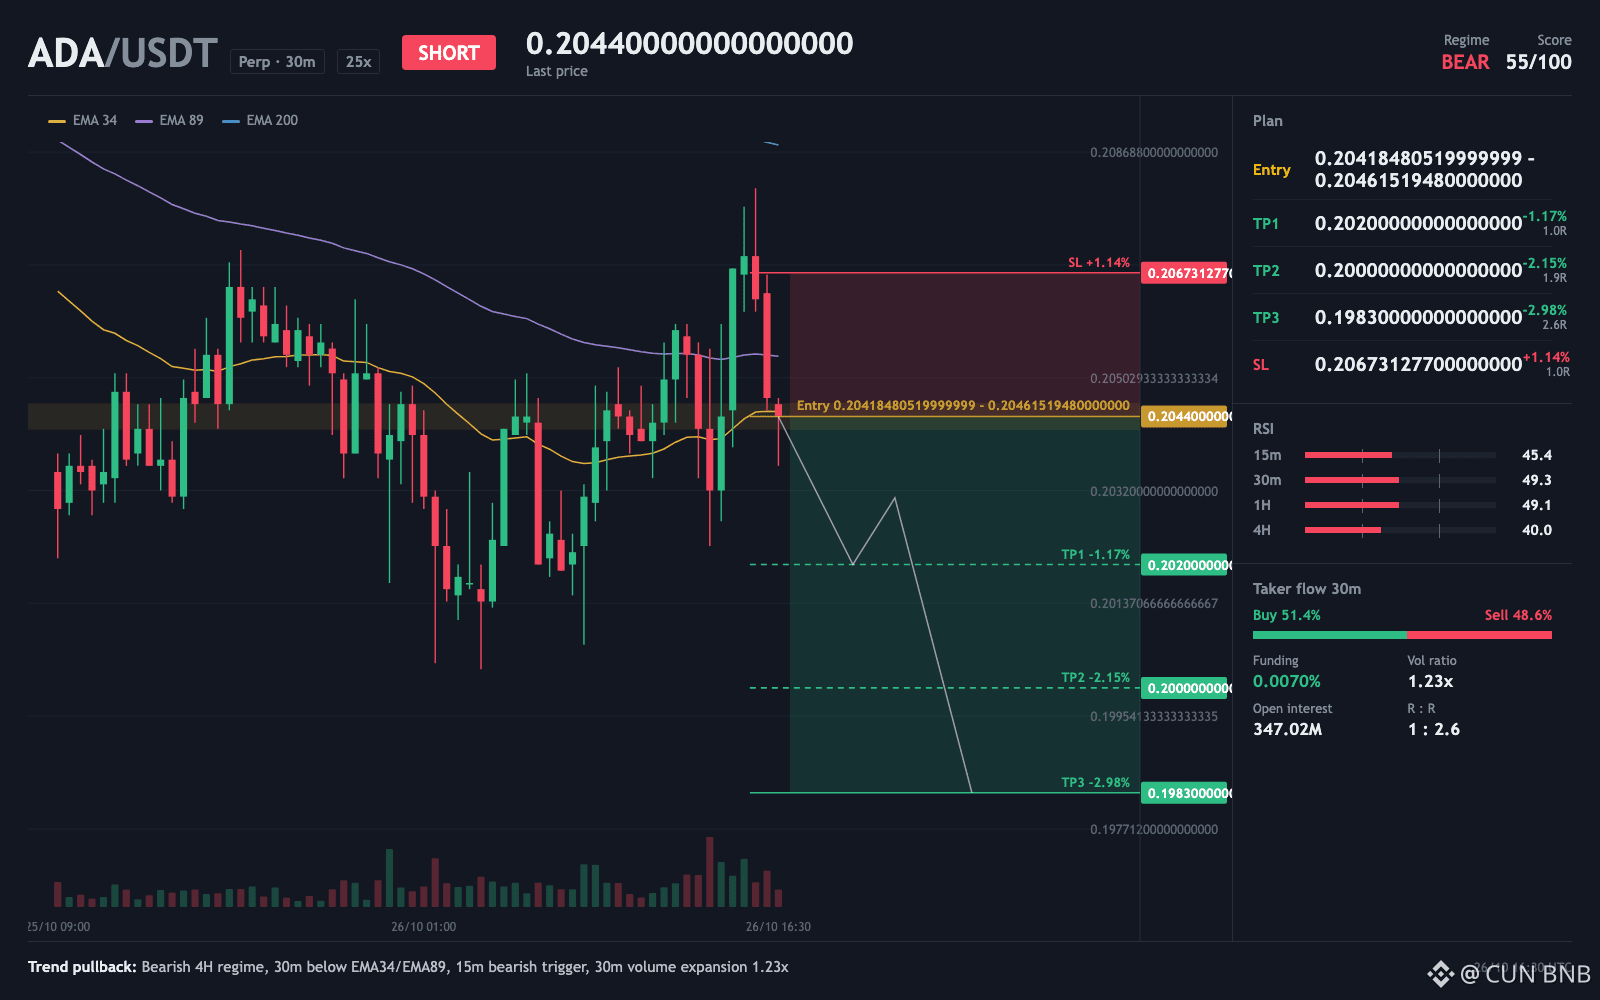
$ADA - SHORT outlook
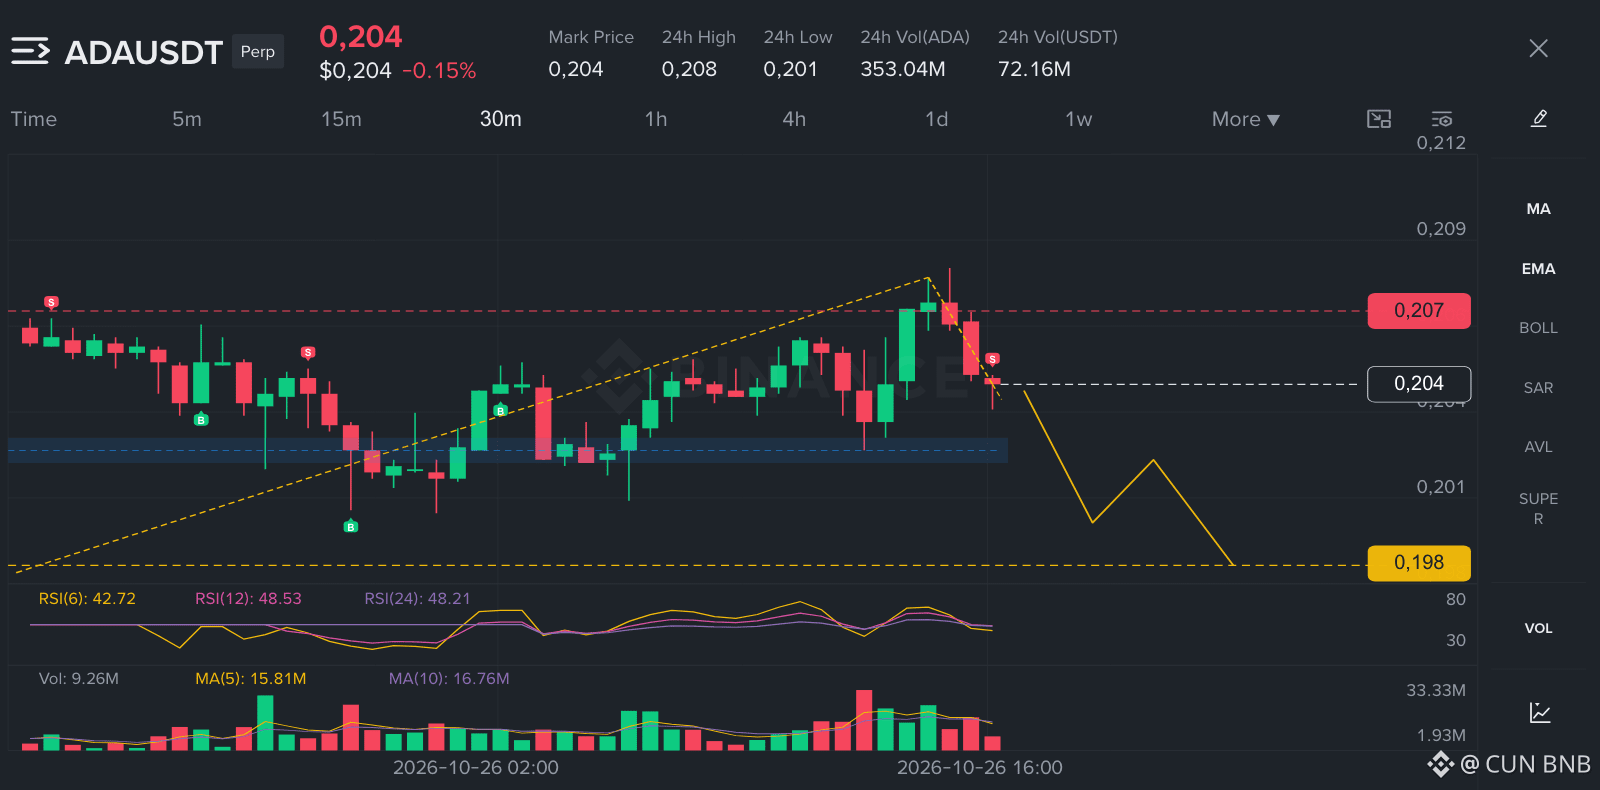
POV: you skimmed the 30-minute candles and almost closed the tab.
Part of this idea is already done today. The price here is not the earlier price, and I am sizing for that.
TRADE PLAN
Entry zone: 0.204 - 0.205 (ref 0.2045)
TP1: 0.202 (+1.21%)
TP2: 0.2 (+2.18%)
TP3: 0.198 (+3.01%)
Stop loss: 0.207 (-1.11%)
What I nearly dismissed is how ordinary the last finished 30-minute candle looked, since it traded around 1.2x normal volume with no panic and no frenzy. That calm cuts both ways for a short, because funding at 0.007% means longs are paying to hold and that cost builds while price struggles.
⚠️ Personal market insight, not investment advice. DYOR.
{future}(ADAUSDT)
$ADA - SHORT outlook
POV: you skimmed the 30-minute candles and almost closed the tab.
Part of this idea is already done today. The price here is not the earlier price, and I am sizing for that.
TRADE PLAN
Entry zone: 0.204 - 0.205 (ref 0.2045)
TP1: 0.202 (+1.21%)
TP2: 0.2 (+2.18%)
TP3: 0.198 (+3.01%)
Stop loss: 0.207 (-1.11%)
What I nearly dismissed is how ordinary the last finished 30-minute candle looked, since it traded around 1.2x normal volume with no panic and no frenzy. That calm cuts both ways for a short, because funding at 0.007% means longs are paying to hold and that cost builds while price struggles.
⚠️ Personal market insight, not investment advice. DYOR.
1
811
Войдите, чтобы посмотреть больше материала
Присоединяйтесь к пользователям криптовалют по всему миру на Binance Square
⚡️ Получайте новейшую и полезную информацию о криптоактивах.
💬 Нам доверяет крупнейшая в мире криптобиржа.
👍 Получите достоверные аналитические данные от верифицированных создателей контента.
Эл. почта/номер телефона
В тренде
BinancePick
Просмотров: 3.1M
155,054 обсуждают
Join #EarningsSeason: Predict Earnings on Binance Pick, Share Your Take on Binance Square!
Binance Square Official
·Лайков: 413
·Просмотров: 343.7k
EarningsSeason
Просмотров: 5.3M
26,130 обсуждают
AnthropicTTMRevenueGrewAbout1200%
Просмотров: 38,663
471 обсуждают