
Obaida1981
114 Публикации

Obaida1981
scalp trades the best in high volatility market.
Случайный трейдер
1.7 г
17 подписок(и/а)
13 подписчиков(а)
24 понравилось
Посты
Все
Цитирования
Активно
i sold it minutes before it pumbs to 2.83 😭

ALEXANDRExJOKER
·
--
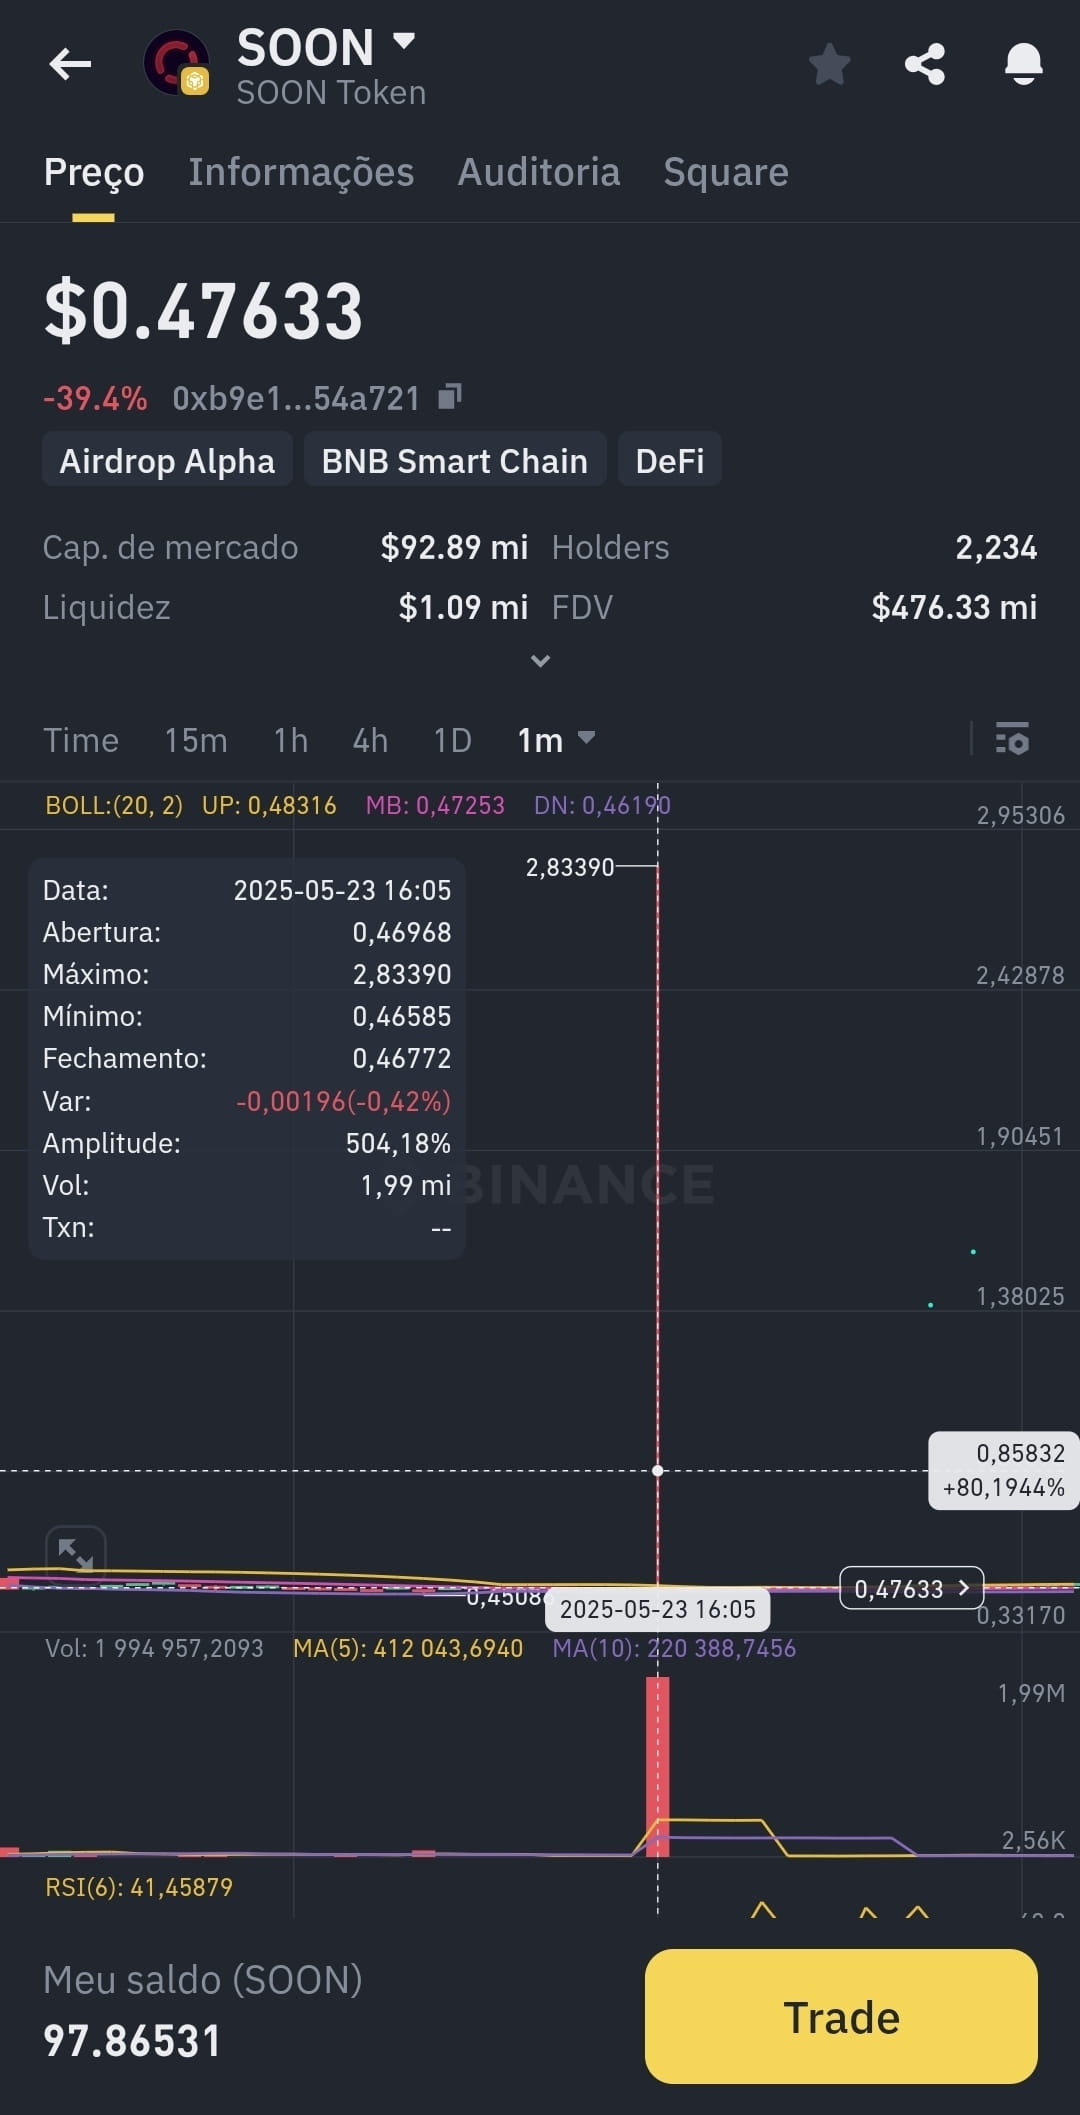
$SOON você acha que já perdeu muito?
imagina esse que comprou quase 2m, foi a $2.83 e depois caiu para 0.47 olha esse prejuízo.
Talvez ele tem o dedo gordo e fez uma grande besteira 😱.
Ou ele sabe de alguma coisa importante ou acredita muito no projeto
imagina esse que comprou quase 2m, foi a $2.83 e depois caiu para 0.47 olha esse prejuízo.
Talvez ele tem o dedo gordo e fez uma grande besteira 😱.
Ou ele sabe de alguma coisa importante ou acredita muito no projeto
$NXPC this coin going to raise in the few next hours
remember my words its going to pumb crazy and go above highest price
remember my words its going to pumb crazy and go above highest price
looool
Цитируемый контент удален
loool

Crypto_GAZA
·
--
Рост#SolanaUSTD هذه ارباحى خلال 30 يوم
go now and search jellyjelly coin and open sell short trade and u will recover your loss

Siva_Vfc
·
--
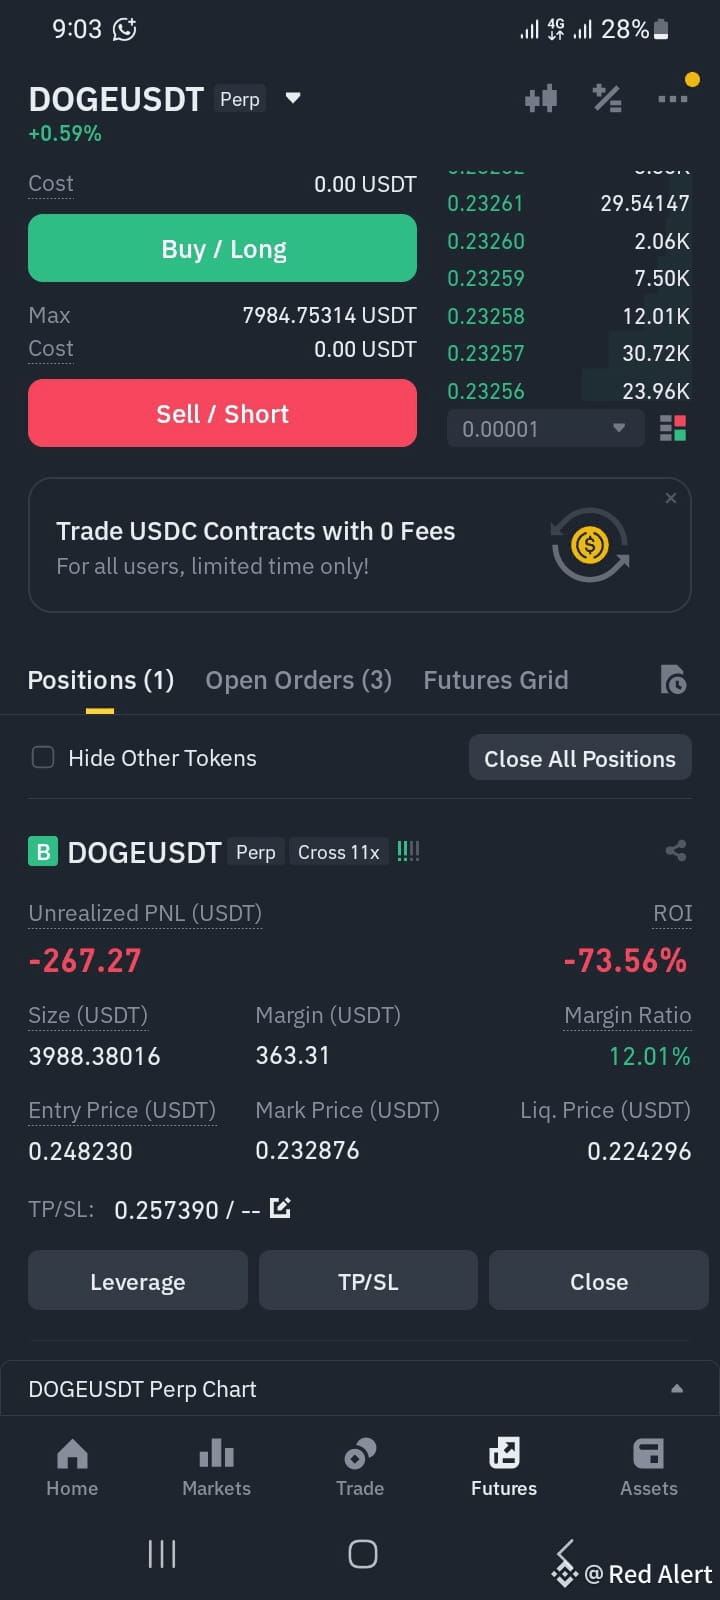
$DOGE
Yeah Allah guide me 😭😭😭😭😭😭😭😭😭😭😭😭😭😭😭😭😭😭😭😭😭😭😭😭😭😭😭😭😭😭
Yeah Allah guide me 😭😭😭😭😭😭😭😭😭😭😭😭😭😭😭😭😭😭😭😭😭😭😭😭😭😭😭😭😭😭
every time on earth has its own people
past is past and present is present
if we know the future i think we will not live good like we are living now
past is past and present is present
if we know the future i think we will not live good like we are living now

Simply_Sandy
·
--
Its so painful being this man right now.
12 years ago , he sold 10,000 bitcoin for pizza.
what a great pain😭😭
12 years ago , he sold 10,000 bitcoin for pizza.
what a great pain😭😭

it was usless on alpaca coin when they announced its going to be delisted it kept raise more and more and rsi was above 90!!
and price raised from 0.06 to 1.4!!
all shorter died
and price raised from 0.06 to 1.4!!
all shorter died

Rough Trader PK
·
--
What is RSI in Crypto? – Let's Understand
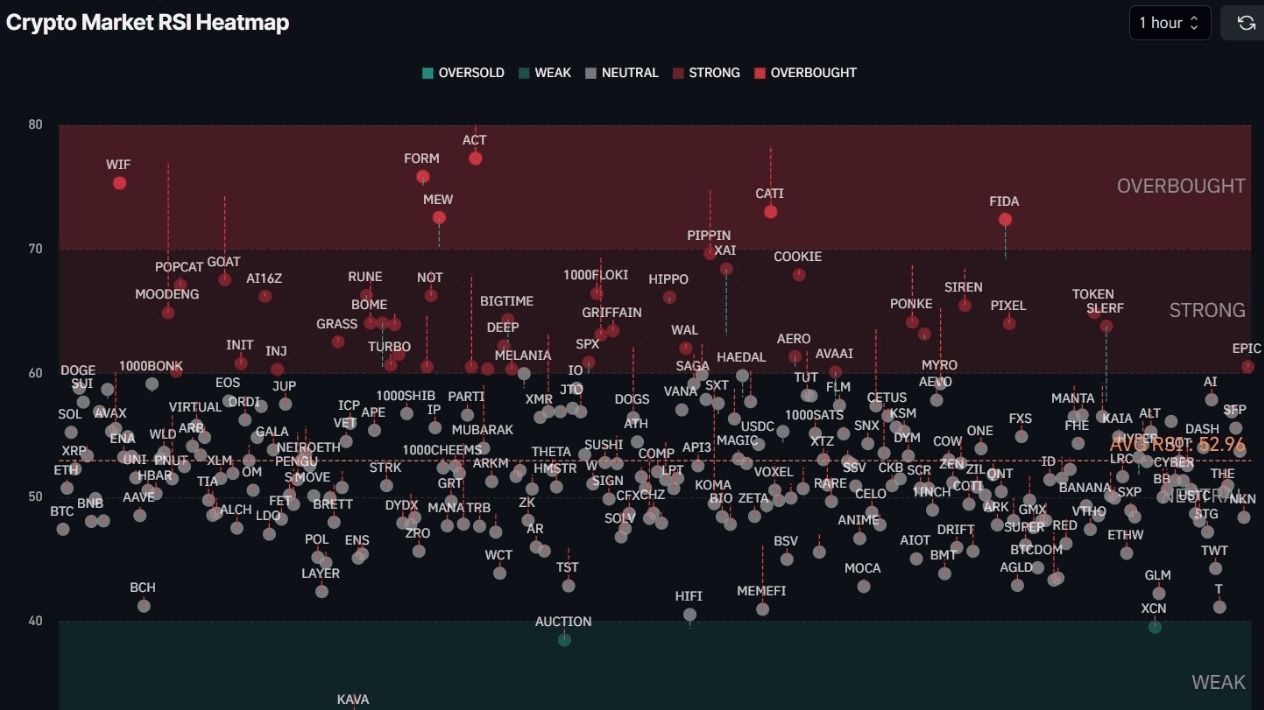
If you're new to trading crypto, you might have heard people talk about RSI. It’s a basic tool that helps you understand when a coin might be too high (overbought) or too low (oversold). Let’s break it down in the simplest way.
Note: I didn't have any paid community or group. I am not selling any course. I am not influencer and don't need likes & followers. If you want to pay me something, read this article till end.
What is RSI?
RSI stands for Relative Strength Index. It shows the strength or weakness of a coin’s recent price movements. RSI is a number between 0 and 100.
When RSI is above 70, it usually means the coin is overbought — price may fall soon.
When RSI is below 30, it usually means the coin is oversold — price may rise soon.
Think of it like a "heat meter" — it helps you see if a coin is hot (too high) or cold (too low).
How to Use RSI in Trading
Many traders use RSI to decide when to buy or sell. For example:
If a coin has RSI near 30, it might be a good buying opportunity.
If RSI is near 70, it might be time to be cautious or take profit.
But here's the most important thing:
👉 Don’t use RSI alone.
Sometimes RSI drops not because the price is naturally correcting, but because of bad news — like a coin getting delisted, tagged as risky, or facing some issue. In such cases, RSI can fall very low, but it's not the right time to buy.
You Remember OM, Portal and many other coins..
RSI is just a tool — it works best when used with other things like support levels, trends, and news.
Understanding RSI Levels
Here’s a quick look at common RSI levels:
70 and above – Overbought (coin may go down)30 and below – Oversold (coin may bounce up)Around 50 – Neutral zone (no strong trend)
Use RSI mostly on 4-hour or daily charts — shorter timeframes (like 15 min) can be confusing for new traders.
What About RSI Divergence?
This is a simple signal that can hint a trend change:
If price goes up, but RSI doesn’t, it means the move may be weak.If price drops, but RSI starts rising, it may signal a bounce is coming.
This can help you spot early reversals. RSI is a helpful tool to understand the momentum of a coin, but never rely on it alone. Use it with other tools and always be aware of the news. A sudden announcement can move the market, no matter what RSI says.
In Short:
RSI helps you guess if a coin is too high or too low.
Use RSI with other tools — not alone.
Don’t buy just because RSI is low. Check the news and overall market.
Be patient — smart trading is about timing, not rushing.
I have simplify RSI but if you still have any confusion.. Ask me in comment section.
Disclaimer: This post is for learning purposes only. Always do your own research before making any trade.
#TradeOfTheWeek #StrategyTrade #NewsTrade #RoughTraderPk
Note: I didn't have any paid community or group. I am not selling any course. I am not influencer and don't need likes & followers. If you want to pay me something, read this article till end.
What is RSI?
RSI stands for Relative Strength Index. It shows the strength or weakness of a coin’s recent price movements. RSI is a number between 0 and 100.
When RSI is above 70, it usually means the coin is overbought — price may fall soon.
When RSI is below 30, it usually means the coin is oversold — price may rise soon.
Think of it like a "heat meter" — it helps you see if a coin is hot (too high) or cold (too low).
How to Use RSI in Trading
Many traders use RSI to decide when to buy or sell. For example:
If a coin has RSI near 30, it might be a good buying opportunity.
If RSI is near 70, it might be time to be cautious or take profit.
But here's the most important thing:
👉 Don’t use RSI alone.
Sometimes RSI drops not because the price is naturally correcting, but because of bad news — like a coin getting delisted, tagged as risky, or facing some issue. In such cases, RSI can fall very low, but it's not the right time to buy.
You Remember OM, Portal and many other coins..
RSI is just a tool — it works best when used with other things like support levels, trends, and news.
Understanding RSI Levels
Here’s a quick look at common RSI levels:
70 and above – Overbought (coin may go down)30 and below – Oversold (coin may bounce up)Around 50 – Neutral zone (no strong trend)
Use RSI mostly on 4-hour or daily charts — shorter timeframes (like 15 min) can be confusing for new traders.
What About RSI Divergence?
This is a simple signal that can hint a trend change:
If price goes up, but RSI doesn’t, it means the move may be weak.If price drops, but RSI starts rising, it may signal a bounce is coming.
This can help you spot early reversals. RSI is a helpful tool to understand the momentum of a coin, but never rely on it alone. Use it with other tools and always be aware of the news. A sudden announcement can move the market, no matter what RSI says.
In Short:
RSI helps you guess if a coin is too high or too low.
Use RSI with other tools — not alone.
Don’t buy just because RSI is low. Check the news and overall market.
Be patient — smart trading is about timing, not rushing.
I have simplify RSI but if you still have any confusion.. Ask me in comment section.
Disclaimer: This post is for learning purposes only. Always do your own research before making any trade.
#TradeOfTheWeek #StrategyTrade #NewsTrade #RoughTraderPk
bro u made me lose 40 usd in few hours
working without stop loss
i forgive u
working without stop loss
i forgive u
Цитируемый контент удален
brother i am already copying with u but tell me do i have to set my own stop loss or leave it to u too plz answer
Цитируемый контент удален
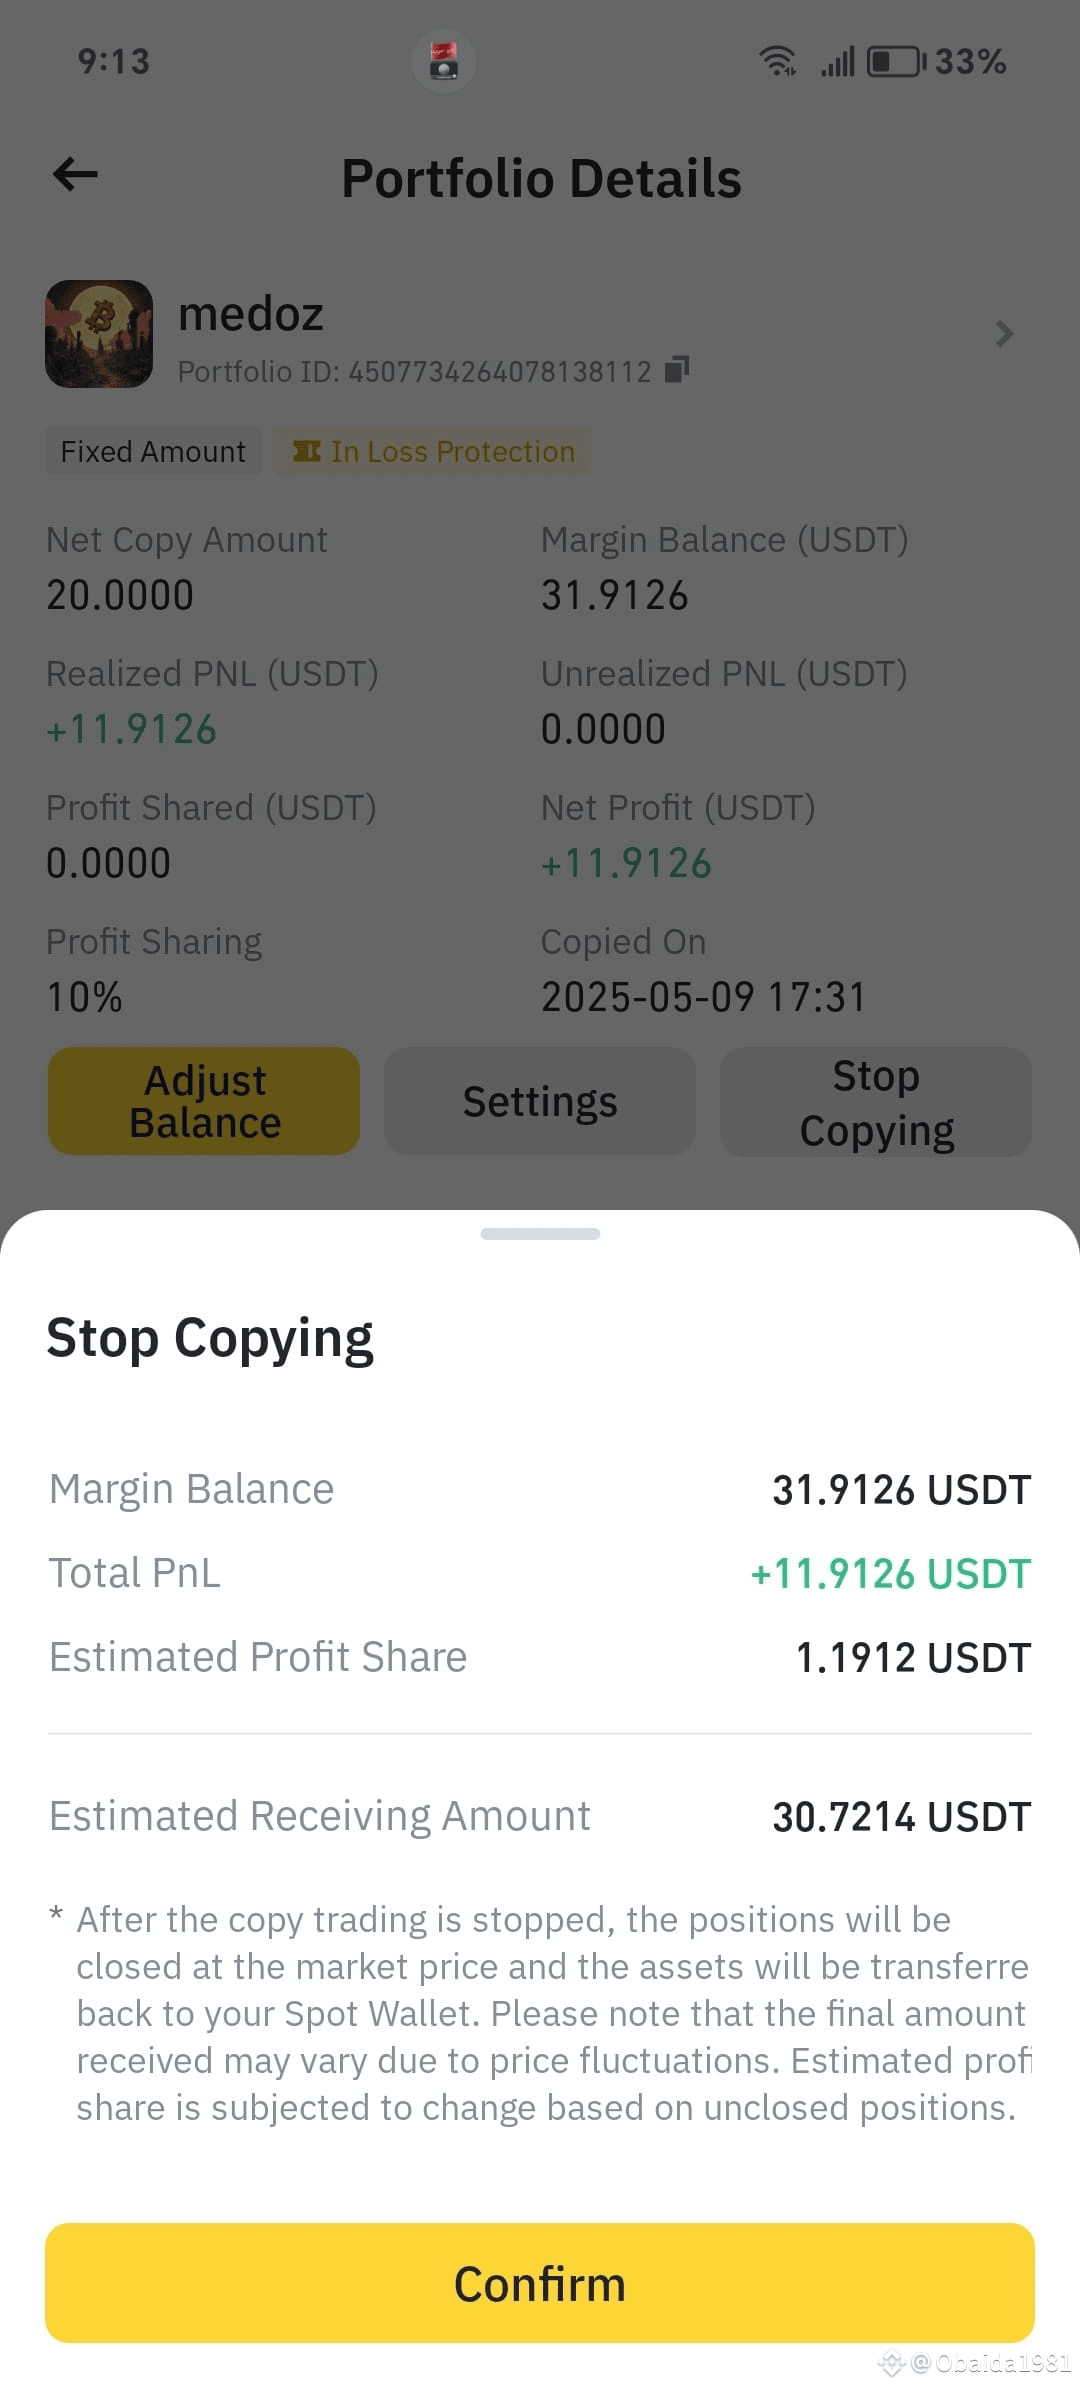
bro medoz thank you my brother i copied you with 20 usd and in two hours become 31 such amazing trader you
Цитируемый контент удален
hold any way ur liquidation prices is so far hold and pray

ALAMIN_SHEKH
·
--
close or hold??
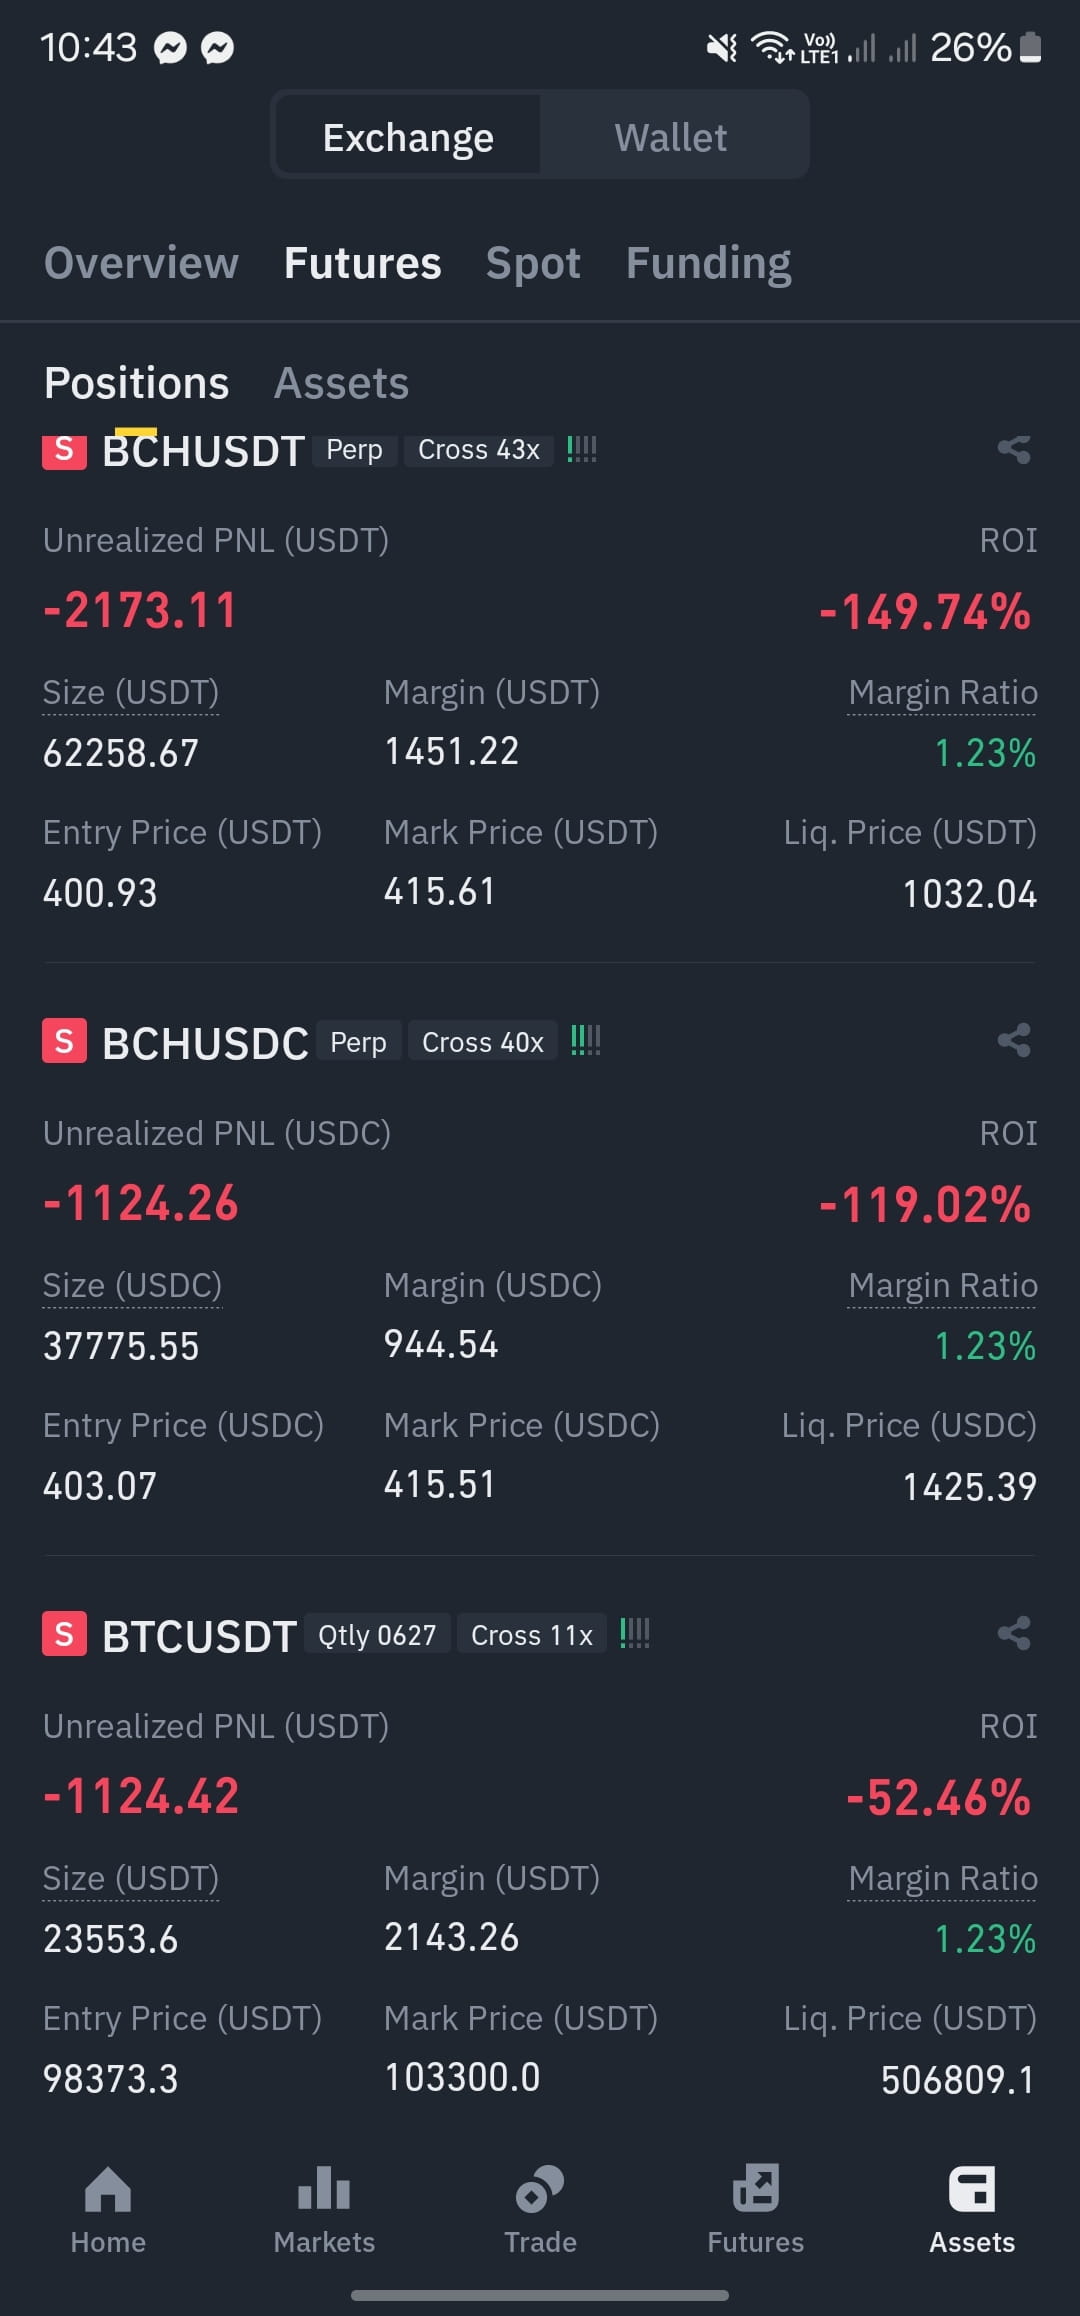
close better

Jinilse kifyan
·
--
РостAny suggestions what should I do
i am holding it for 3 days
$BNB $ETH $BTC
i am holding it for 3 days
$BNB $ETH $BTC
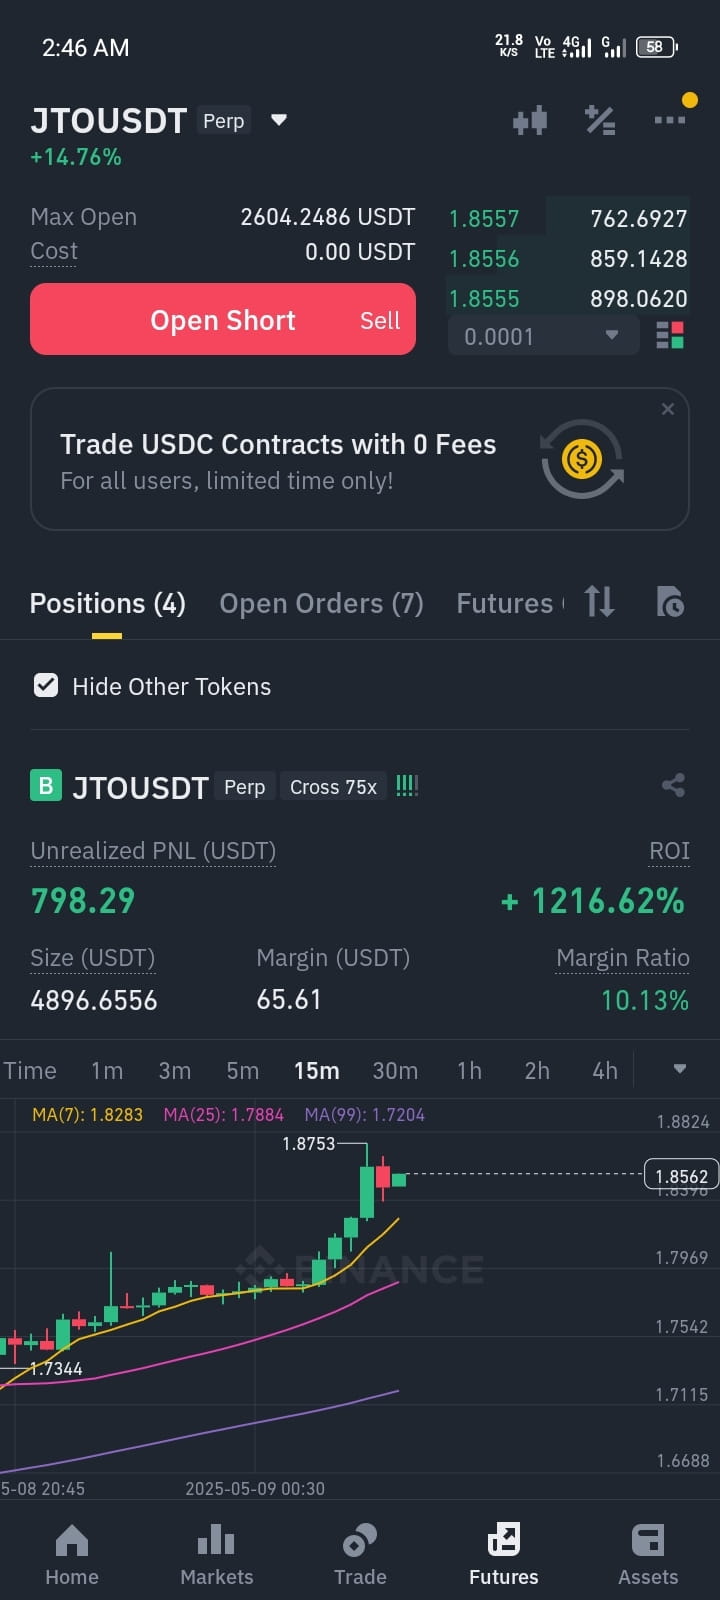
its going to raise wait bro

Shanto_74
·
--
Is there any chance of recovery on $SUI ? experts give suggestions
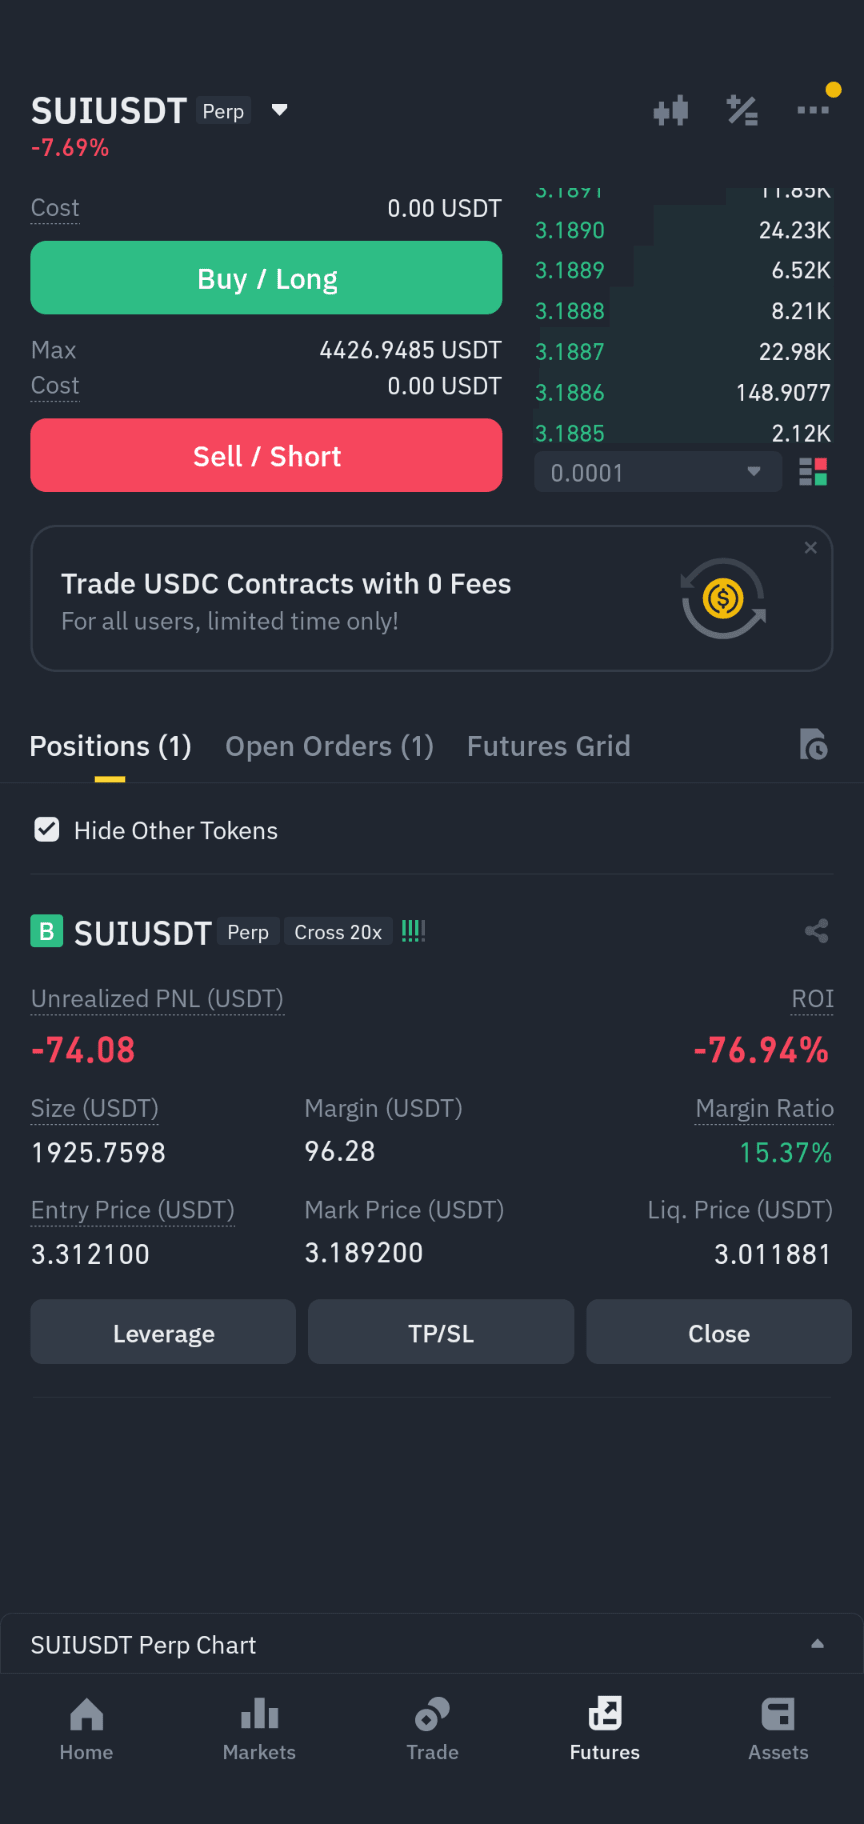
all short btc its going to fall like 🍁

MarkusFantner
·
--
ПадениеIst es vorbei oder kommt noch was ? #BTC
go short on it
its going to go liw to 84000 maybe lower
its going to go liw to 84000 maybe lower


MU_Traders
·
--
$BTC
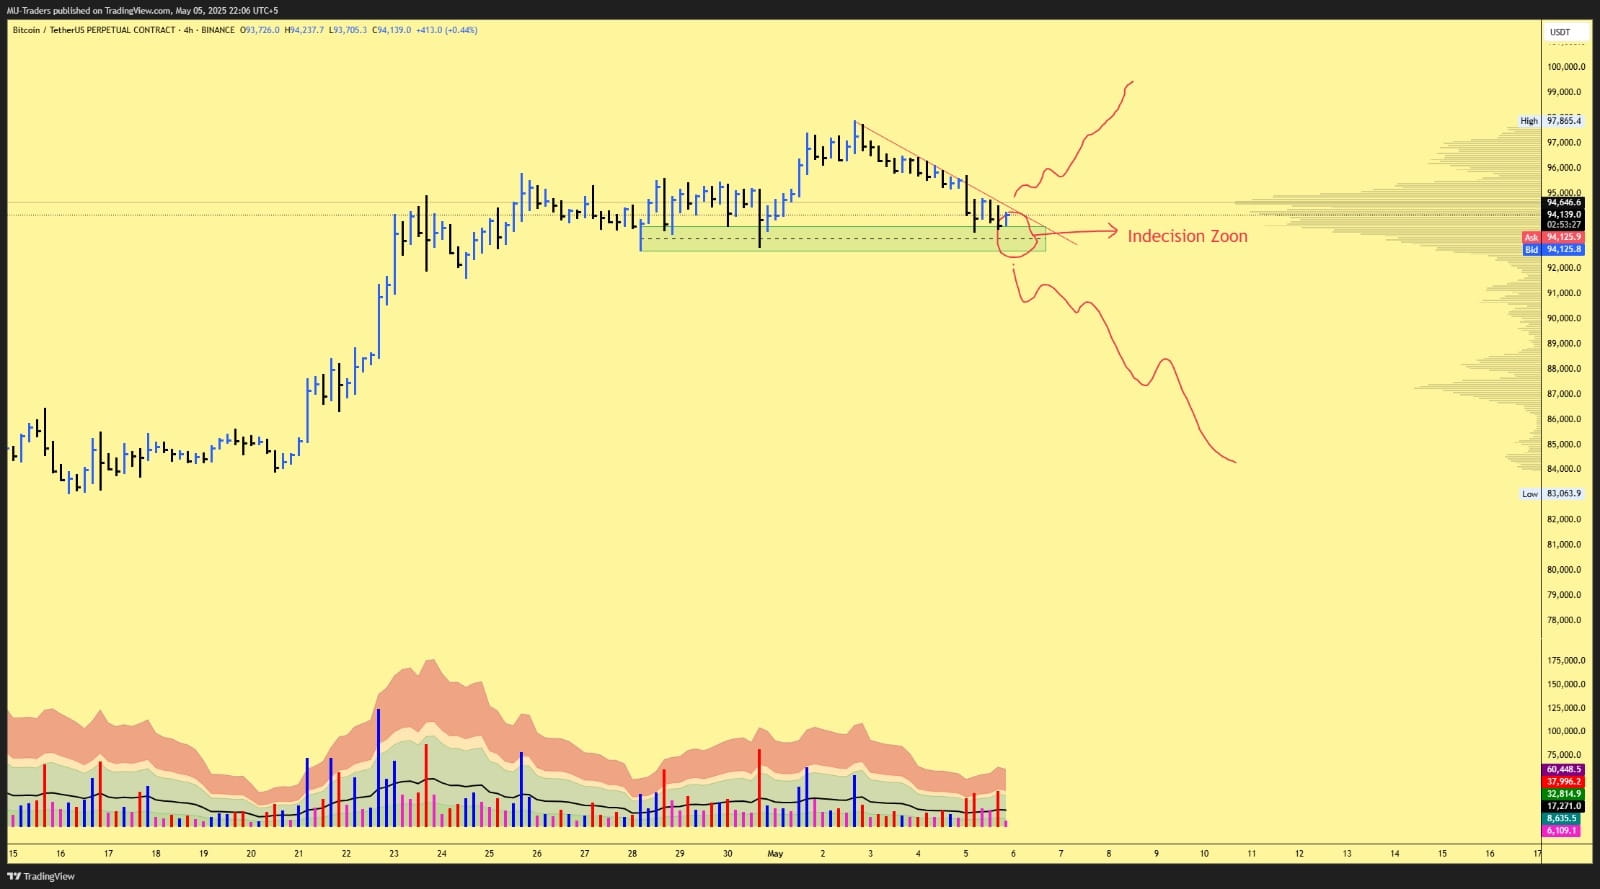
Two scenarios here right now.
If #BTC breaks this trend line and holds above it we will buy and set s.l below $92,600 while using 1% risk of capital.
T.p will remain $97,400 , $99,500, $102K
On the same side if it breaks support we will wait for $87K zone.
It is double side game that can work while predicting to grab attention but not when you are trading let's make it one sided.
Once it holds above that trend line and buy I will drop a post here and let you know I am in do your own research and perform action that you need.
Until I drop a message it's means I am not in and waiting for further market drop.
#bitcoin #BTC
Two scenarios here right now.
If #BTC breaks this trend line and holds above it we will buy and set s.l below $92,600 while using 1% risk of capital.
T.p will remain $97,400 , $99,500, $102K
On the same side if it breaks support we will wait for $87K zone.
It is double side game that can work while predicting to grab attention but not when you are trading let's make it one sided.
Once it holds above that trend line and buy I will drop a post here and let you know I am in do your own research and perform action that you need.
Until I drop a message it's means I am not in and waiting for further market drop.
#bitcoin #BTC
sell

AWSY insha-A
·
--
is it the time to buy trump......or to sell
the result is liquidation because of funding rate

Asad Ali Bharwana
·
--
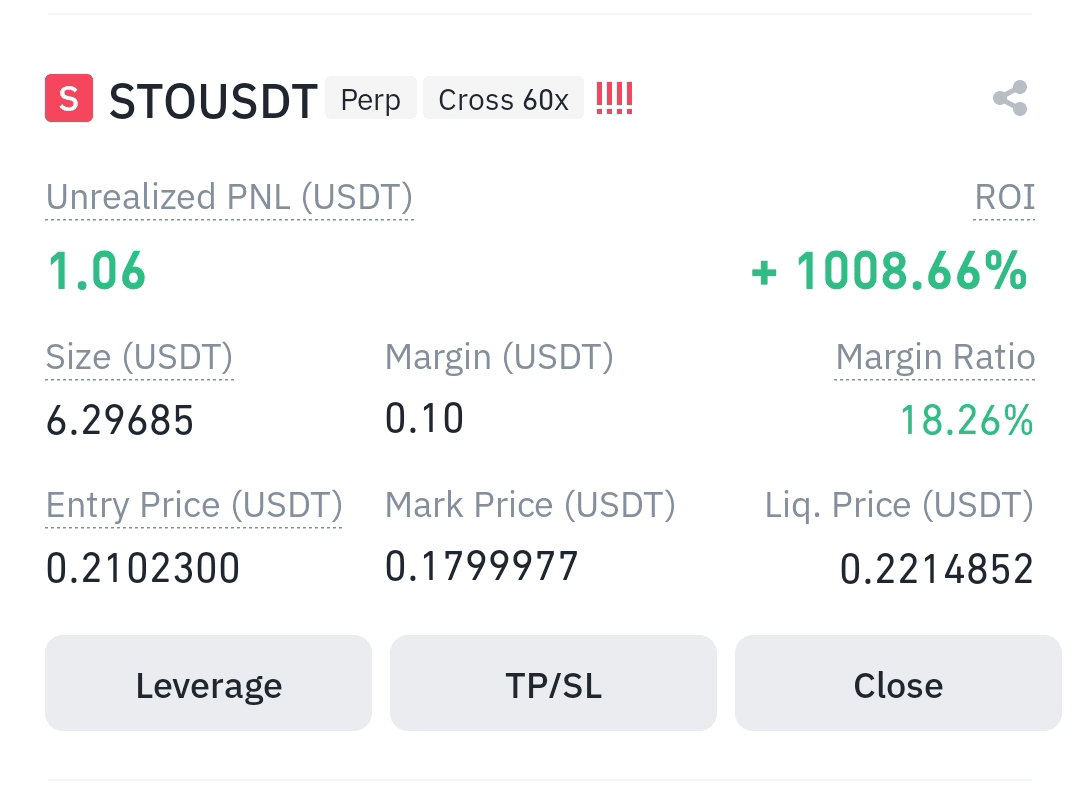
Dear All LEGEND's
I will close this position on May 9th. Let's see what the result will be.
Please make sure to share your opinions in the comment section.
#STO #AppleCryptoUpdate #BinanceHODLerSTO #DigitalAssetBill #SaylorBTCPurchase
I will close this position on May 9th. Let's see what the result will be.
Please make sure to share your opinions in the comment section.
#STO #AppleCryptoUpdate #BinanceHODLerSTO #DigitalAssetBill #SaylorBTCPurchase
its going to bullish bro

Professor Of Crypto
·
--
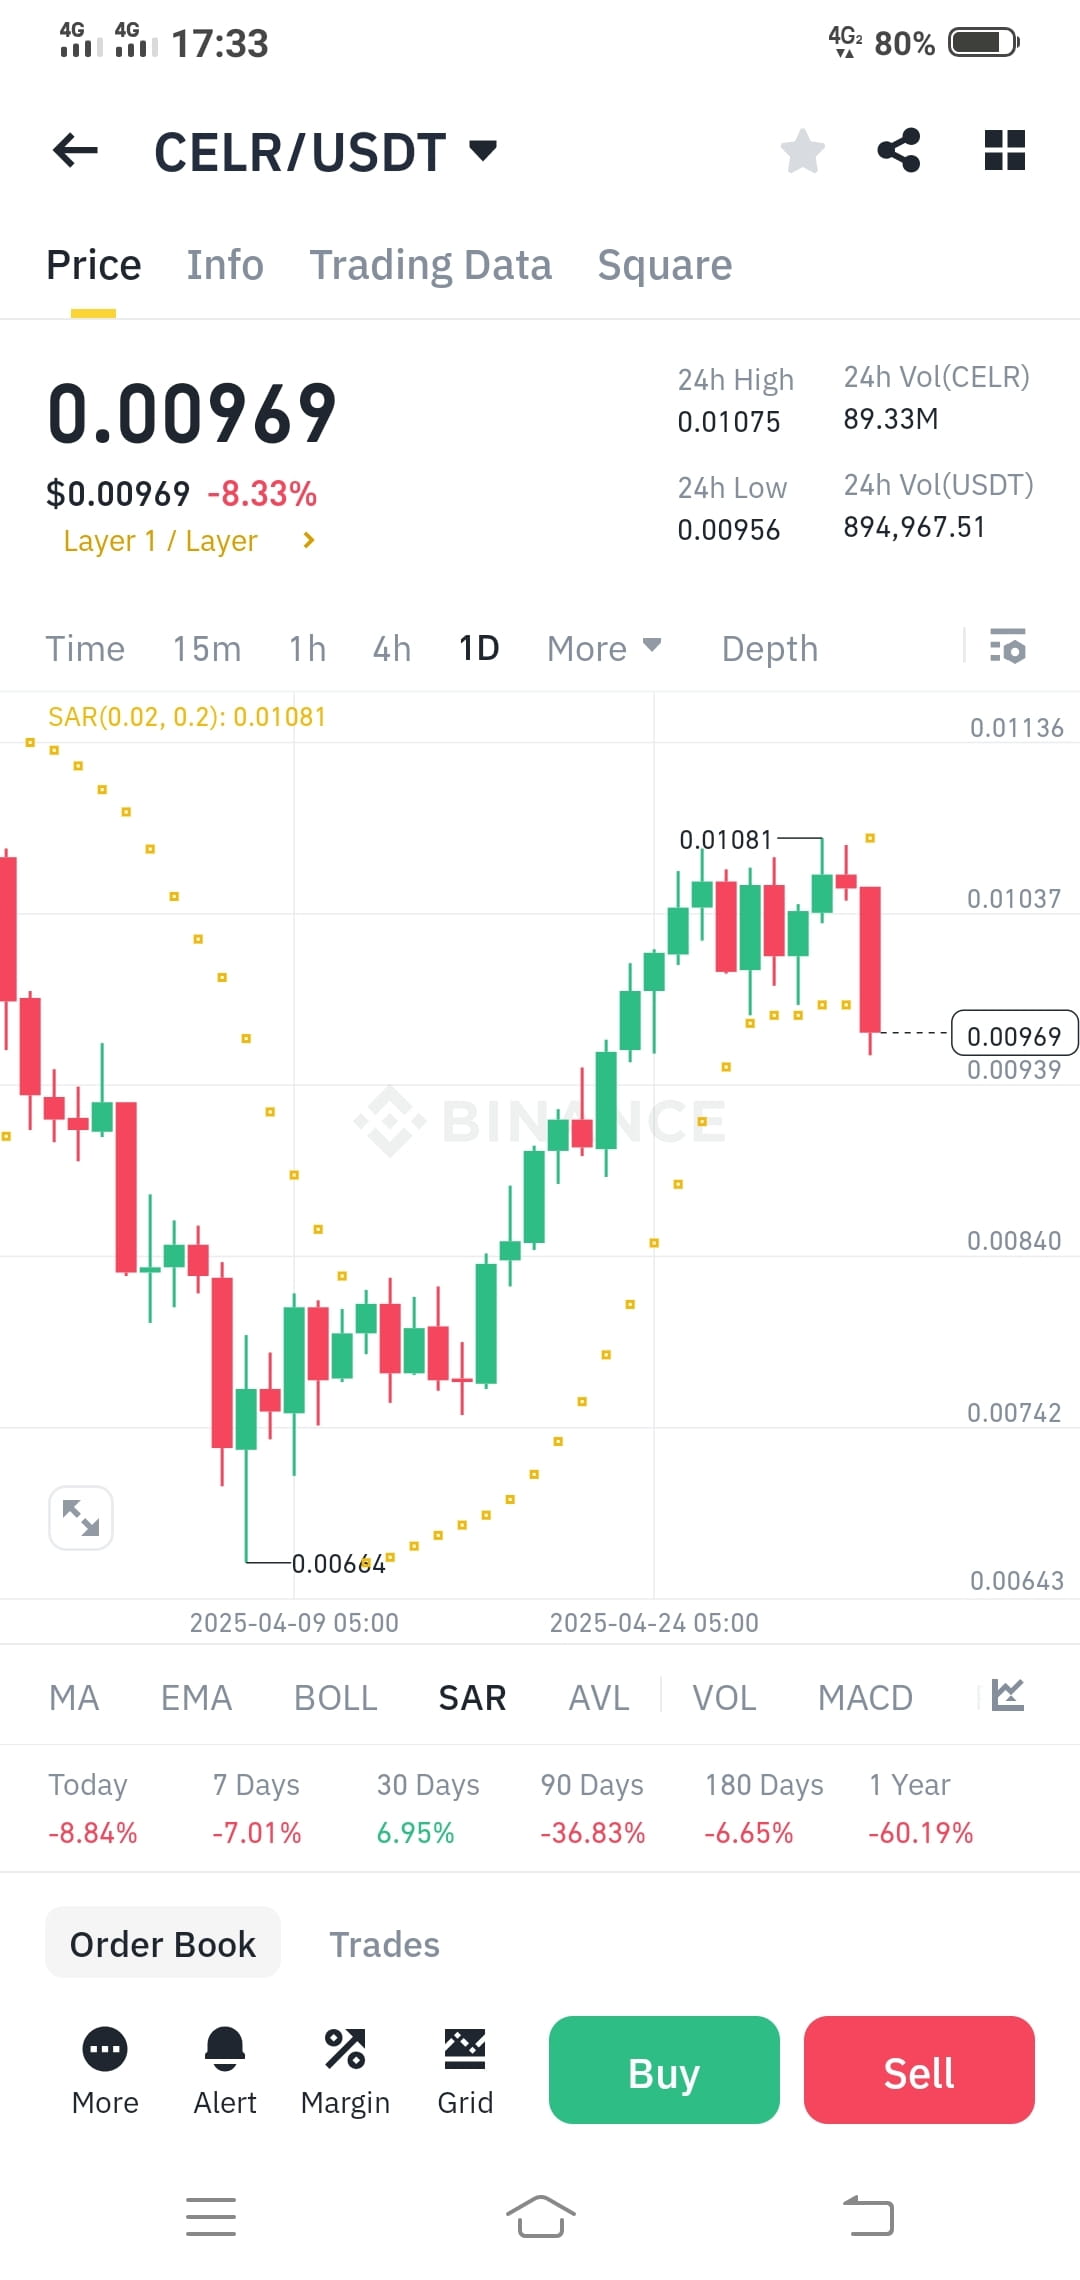
$CELR
Short Entry at market price or above
Hurry up guys don't be late
$CELR
Target 1: 0.00975
Target 2: 0.00955
Target 3: 0.00935
Target 4: 0.00876
Stop-Loss: 0.01051
After reaching the first target you can put the rest of the position to breakeven
$CELR
Short Entry at market price or above
Hurry up guys don't be late
$CELR
Target 1: 0.00975
Target 2: 0.00955
Target 3: 0.00935
Target 4: 0.00876
Stop-Loss: 0.01051
After reaching the first target you can put the rest of the position to breakeven
$CELR
Войдите, чтобы посмотреть больше материала