
Mr_Green个
7.3k Публикации

Mr_Green个
 Square Verified+
Отправить жалобу
Заблокировать пользователя
Trader 🇧🇩 || Verified KOL ✅ || Web3 Hunter 🔥 || Markets Daily 🚀
Открытая сделка

Владелец ASTER
Трейдер с частыми сделками
3.8 г
139 подписок(и/а)
41.4K+ подписчиков(а)
23.5K+ понравилось
Посты
Портфель
Все
Цитирования
Видео
Активно
·
--
Торговля за 30 дней $NEAR 1.2K USDT
📊 3 ALTCOINS, 3 CRITICAL ZONES — WHICH ONE WILL RECOVER FIRST?
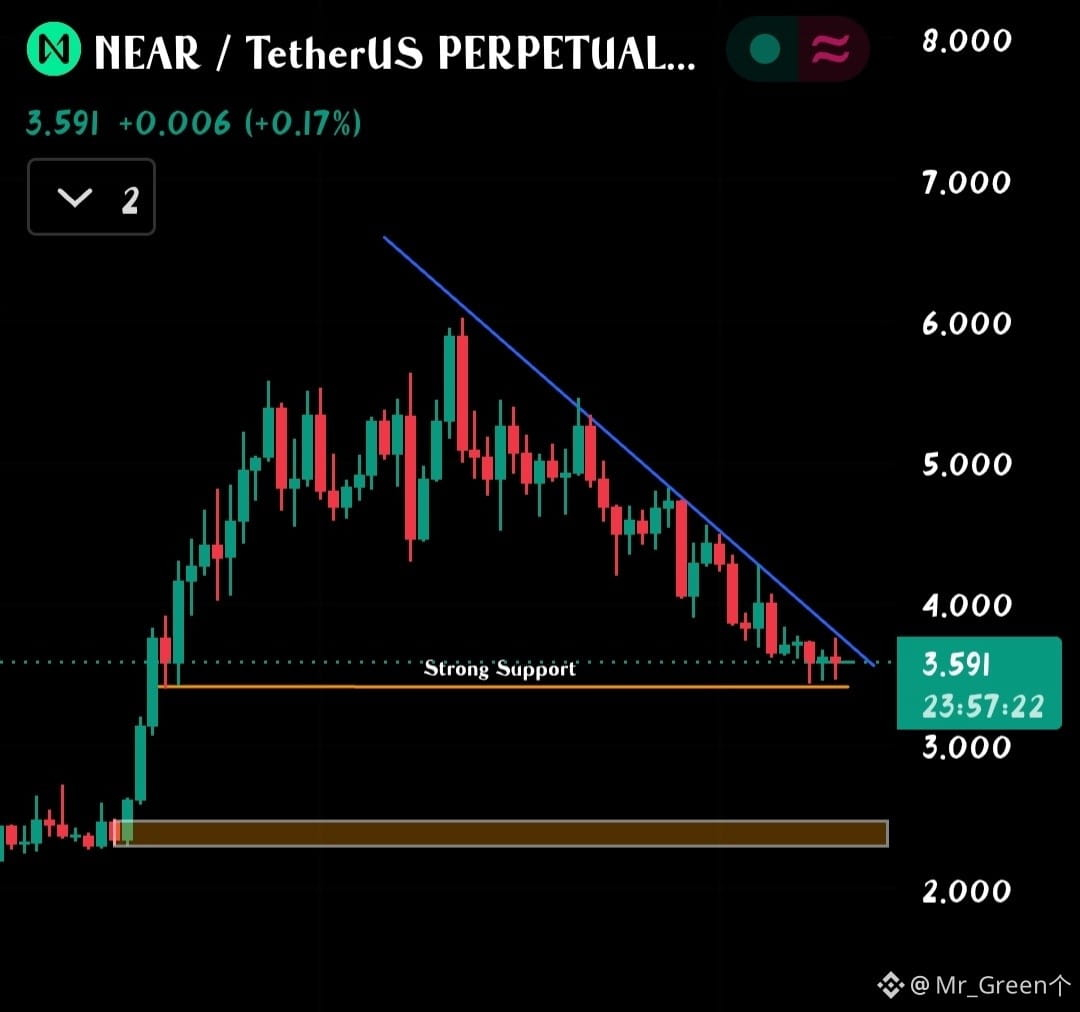
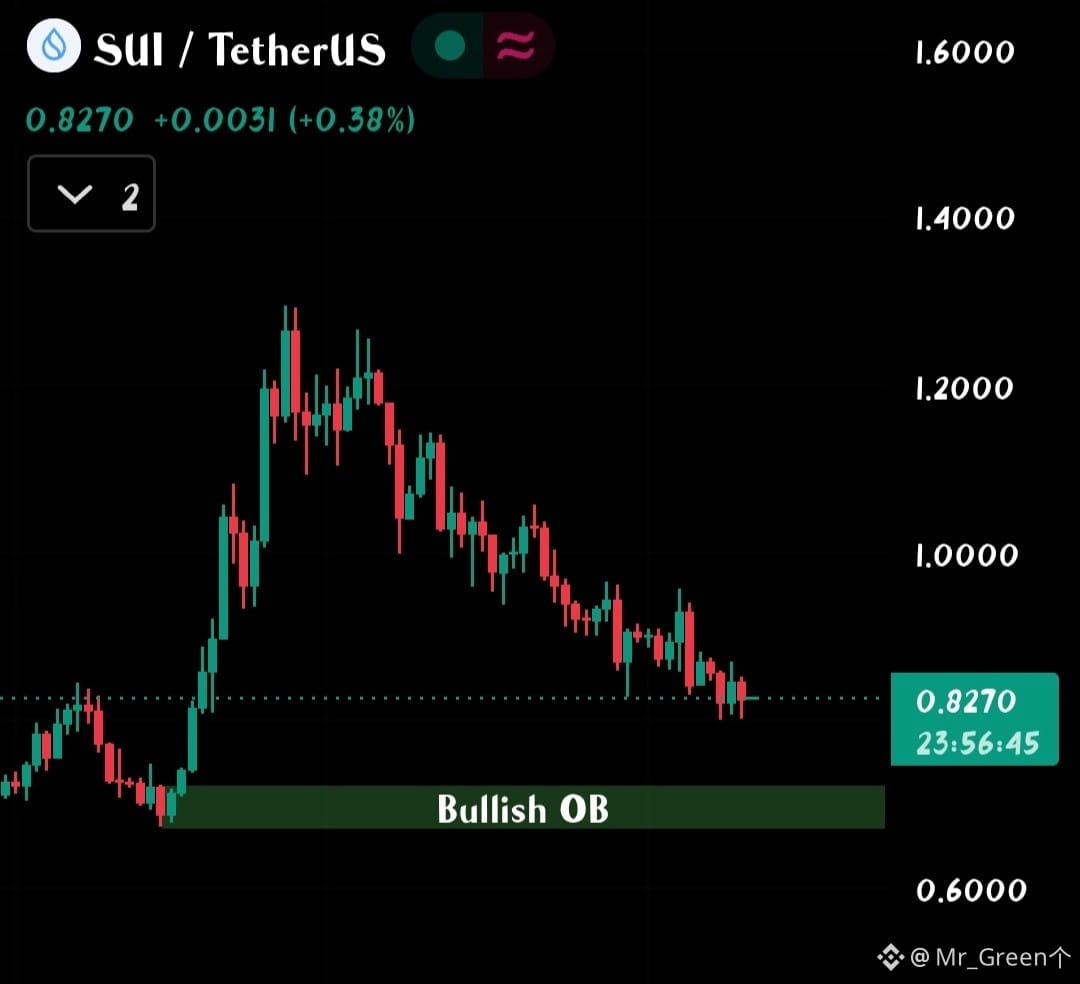
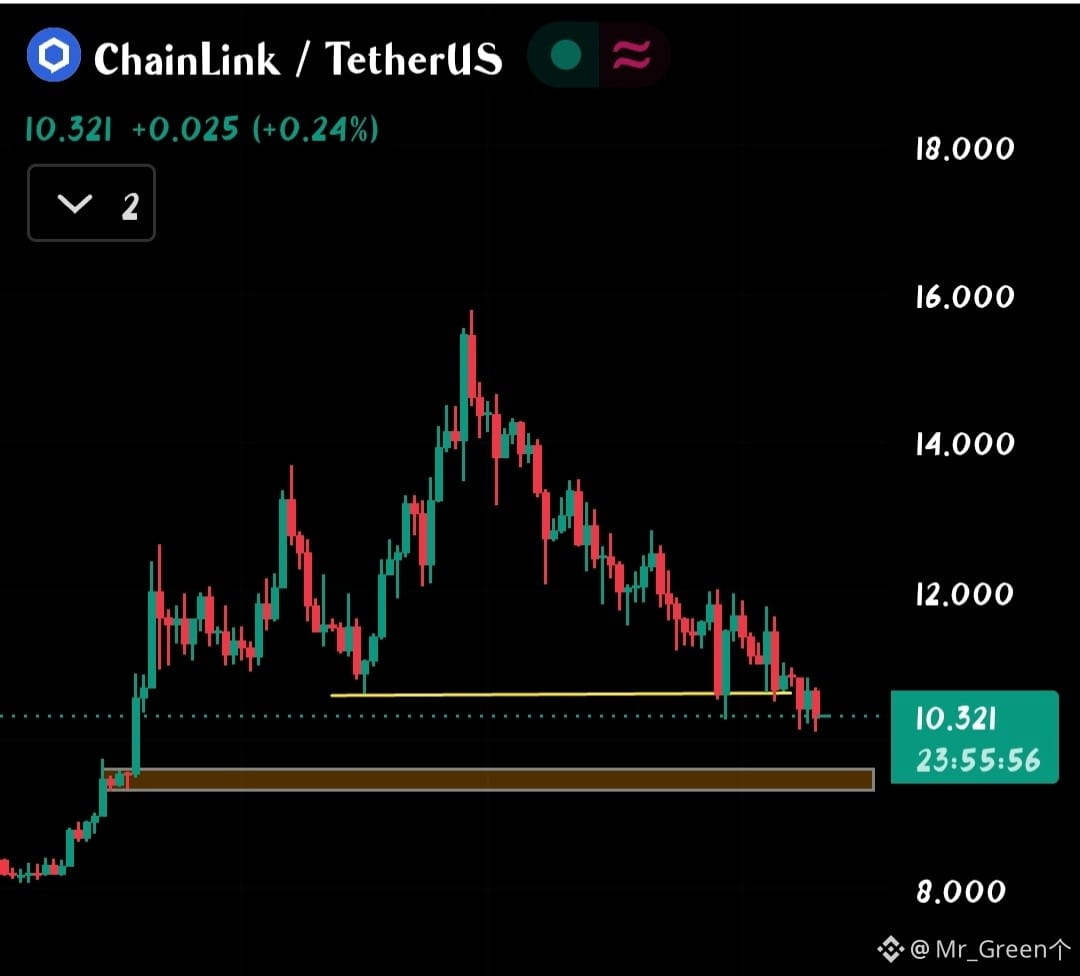
The charts of LINK, SUI and NEAR are all showing weakness, but each is approaching an important technical area. Here is what I’m watching.
🔵 1. $LINK — SUPPORT LOST, DEMAND AHEAD
LINK is trading around $10.32, with a clear sequence of lower highs since its move toward $15.80. The previous support around $10.80–$11.00 has been broken and could now act as resistance. The major demand zone sits around $8.95–$9.20. A bullish recovery needs to reclaim $10.80–$11.00 and hold it. Otherwise, another move toward the lower demand zone remains possible. I would not call this a confirmed bottom yet.
💧 2. $SUI — APPROACHING A BULLISH ORDER BLOCK
SUI is around $0.827, still following a bearish lower-high/lower-low structure after its rejection near $1.30. However, an important bullish order block is marked around $0.68–$0.74. This is the zone where I would watch for a potential demand reaction. A strong bounce followed by a reclaim of $0.90–$0.95 could improve the outlook. If the order block fails, the bullish thesis weakens considerably. Catching a falling knife before confirmation is risky.
🟢 3. $NEAR — A MAJOR DECISION POINT
NEAR is trading around $3.59, pressing against horizontal support near $3.45–$3.55 while also testing a descending trendline. This creates an important compression zone. If support holds and price breaks above the trendline, a recovery toward $3.80 and potentially $4.00–$4.30 becomes possible. But a decisive breakdown below $3.45 could expose the larger demand zone around $2.35–$2.55. Watch for a breakout and retest before committing.
⚠️ MY TAKE: All three are approaching interesting areas, but none has confirmed a bullish reversal yet. Patience and confirmation matter more than buying simply because prices have fallen.
Which one has the strongest recovery potential: LINK, SUI or NEAR?
Follow for more market structure and technical analysis.
{future}(SUIUSDT)
{future}(LINKUSDT)
{future}(NEARUSDT)
📊 3 ALTCOINS, 3 CRITICAL ZONES — WHICH ONE WILL RECOVER FIRST?
The charts of LINK, SUI and NEAR are all showing weakness, but each is approaching an important technical area. Here is what I’m watching.
🔵 1. $LINK — SUPPORT LOST, DEMAND AHEAD
LINK is trading around $10.32, with a clear sequence of lower highs since its move toward $15.80. The previous support around $10.80–$11.00 has been broken and could now act as resistance. The major demand zone sits around $8.95–$9.20. A bullish recovery needs to reclaim $10.80–$11.00 and hold it. Otherwise, another move toward the lower demand zone remains possible. I would not call this a confirmed bottom yet.
💧 2. $SUI — APPROACHING A BULLISH ORDER BLOCK
SUI is around $0.827, still following a bearish lower-high/lower-low structure after its rejection near $1.30. However, an important bullish order block is marked around $0.68–$0.74. This is the zone where I would watch for a potential demand reaction. A strong bounce followed by a reclaim of $0.90–$0.95 could improve the outlook. If the order block fails, the bullish thesis weakens considerably. Catching a falling knife before confirmation is risky.
🟢 3. $NEAR — A MAJOR DECISION POINT
NEAR is trading around $3.59, pressing against horizontal support near $3.45–$3.55 while also testing a descending trendline. This creates an important compression zone. If support holds and price breaks above the trendline, a recovery toward $3.80 and potentially $4.00–$4.30 becomes possible. But a decisive breakdown below $3.45 could expose the larger demand zone around $2.35–$2.55. Watch for a breakout and retest before committing.
⚠️ MY TAKE: All three are approaching interesting areas, but none has confirmed a bullish reversal yet. Patience and confirmation matter more than buying simply because prices have fallen.
Which one has the strongest recovery potential: LINK, SUI or NEAR?
Follow for more market structure and technical analysis.
The charts of LINK, SUI and NEAR are all showing weakness, but each is approaching an important technical area. Here is what I’m watching.
🔵 1. $LINK — SUPPORT LOST, DEMAND AHEAD
LINK is trading around $10.32, with a clear sequence of lower highs since its move toward $15.80. The previous support around $10.80–$11.00 has been broken and could now act as resistance. The major demand zone sits around $8.95–$9.20. A bullish recovery needs to reclaim $10.80–$11.00 and hold it. Otherwise, another move toward the lower demand zone remains possible. I would not call this a confirmed bottom yet.
💧 2. $SUI — APPROACHING A BULLISH ORDER BLOCK
SUI is around $0.827, still following a bearish lower-high/lower-low structure after its rejection near $1.30. However, an important bullish order block is marked around $0.68–$0.74. This is the zone where I would watch for a potential demand reaction. A strong bounce followed by a reclaim of $0.90–$0.95 could improve the outlook. If the order block fails, the bullish thesis weakens considerably. Catching a falling knife before confirmation is risky.
🟢 3. $NEAR — A MAJOR DECISION POINT
NEAR is trading around $3.59, pressing against horizontal support near $3.45–$3.55 while also testing a descending trendline. This creates an important compression zone. If support holds and price breaks above the trendline, a recovery toward $3.80 and potentially $4.00–$4.30 becomes possible. But a decisive breakdown below $3.45 could expose the larger demand zone around $2.35–$2.55. Watch for a breakout and retest before committing.
⚠️ MY TAKE: All three are approaching interesting areas, but none has confirmed a bullish reversal yet. Patience and confirmation matter more than buying simply because prices have fallen.
Which one has the strongest recovery potential: LINK, SUI or NEAR?
Follow for more market structure and technical analysis.
182
·
--
Торговля за 30 дней $ZEC 7.7K USDT
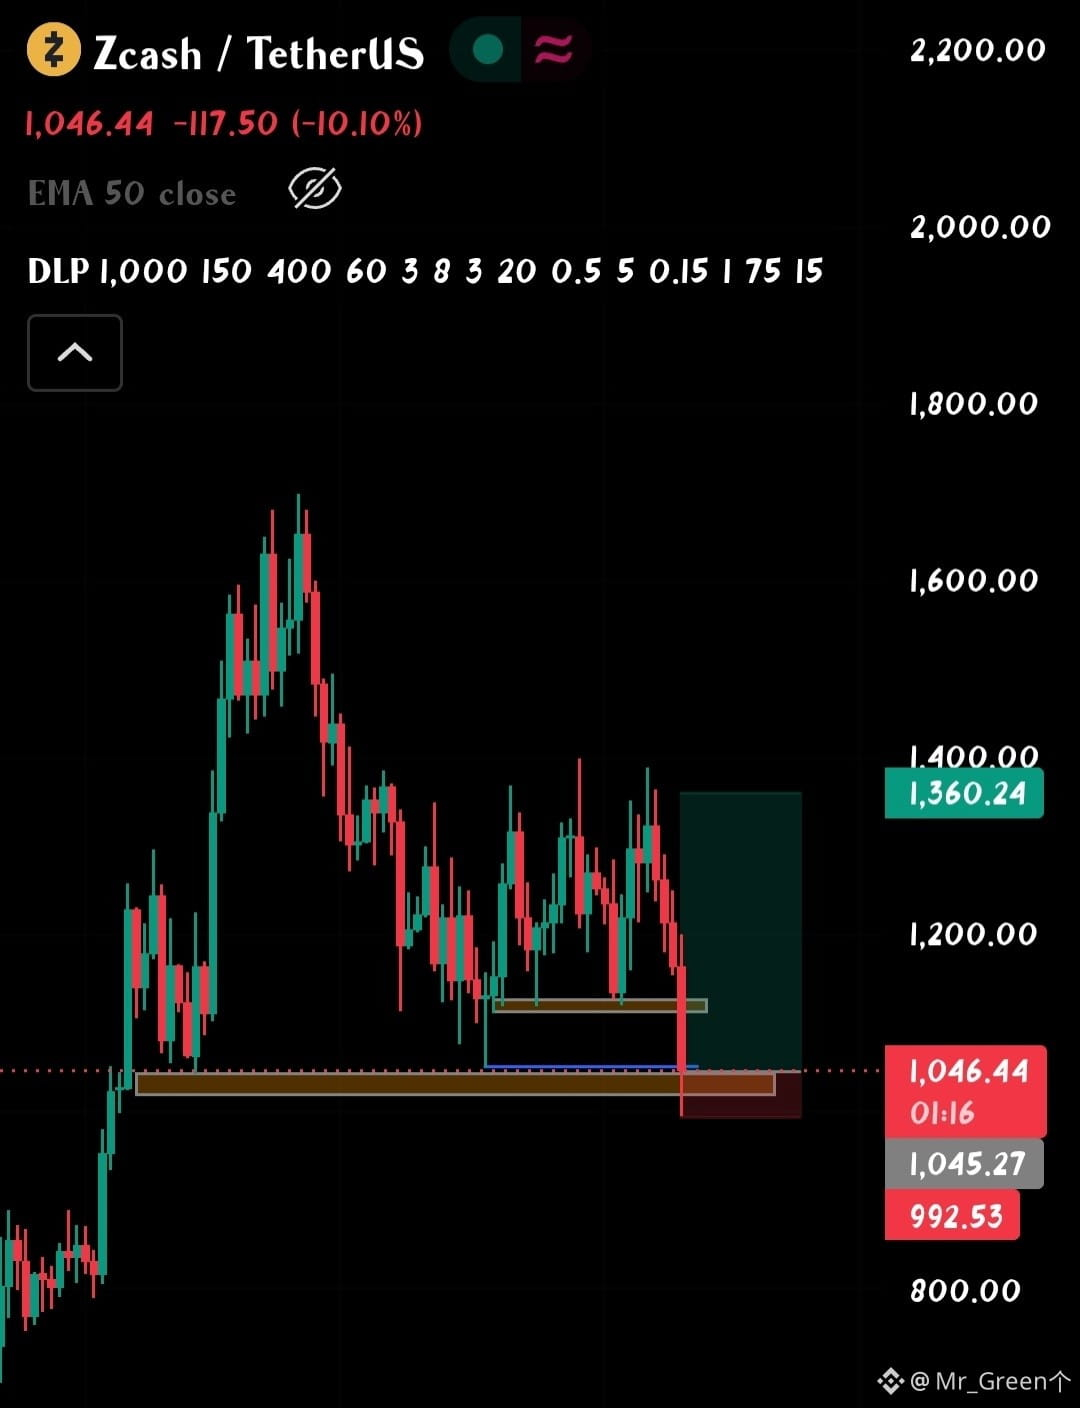
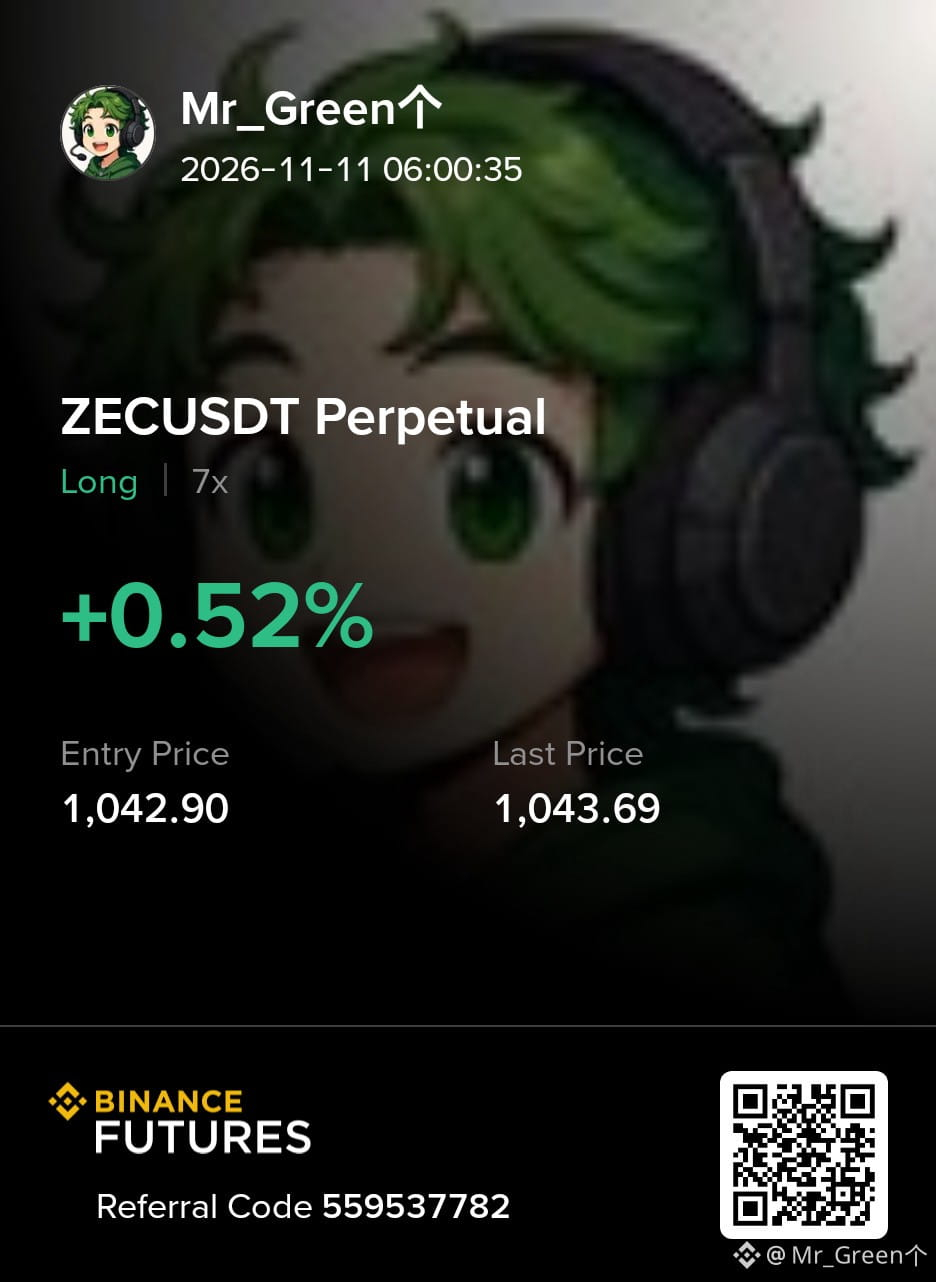
🟡 $ZEC — LIQUIDITY SWEEP! I'VE ENTERED A LONG!
Zcash has just delivered a significant liquidity sweep, and this is why I decided to take a LONG position.
Price broke below the previous range support around $1,045–$1,050, reaching close to $993 before recovering. This is the area where many traders' stop-losses and leveraged positions were likely sitting.
Why am I bullish here?
Sell-side liquidity swept: Price moved below the previous range low and reclaimed the area.
Leverage flush: A large number of long positions were liquidated during the sharp decline.
Major support: The $1,000–$1,050 region is an important area to watch for buyer interest.
Potential recovery: If buyers regain control, the next resistance zones could become upside targets.
📈 MY ZEC LONG PLAN
Entry: $1,045.27
Stop-Loss: $992.53
TP1: $1,115
TP2: $1,200
TP3: $1,360.24
Risk/Reward: Approximately 1:6 to the final target.
⚠️ What invalidates my idea?
A decisive breakdown below $992.53 invalidates this setup. I also want to see buyers reclaim the $1,115 area before becoming confident in a stronger recovery.
I'm not buying simply because ZEC has fallen 10%. I'm buying because price has swept liquidity at an important support area and shown an initial recovery.
Do you think this is a liquidity grab before a recovery, or will ZEC continue falling?
Follow for more technical analysis and trade setups.
{future}(ZECUSDT)
🟡 $ZEC — LIQUIDITY SWEEP! I'VE ENTERED A LONG!
Zcash has just delivered a significant liquidity sweep, and this is why I decided to take a LONG position.
Price broke below the previous range support around $1,045–$1,050, reaching close to $993 before recovering. This is the area where many traders' stop-losses and leveraged positions were likely sitting.
Why am I bullish here?
Sell-side liquidity swept: Price moved below the previous range low and reclaimed the area.
Leverage flush: A large number of long positions were liquidated during the sharp decline.
Major support: The $1,000–$1,050 region is an important area to watch for buyer interest.
Potential recovery: If buyers regain control, the next resistance zones could become upside targets.
📈 MY ZEC LONG PLAN
Entry: $1,045.27
Stop-Loss: $992.53
TP1: $1,115
TP2: $1,200
TP3: $1,360.24
Risk/Reward: Approximately 1:6 to the final target.
⚠️ What invalidates my idea?
A decisive breakdown below $992.53 invalidates this setup. I also want to see buyers reclaim the $1,115 area before becoming confident in a stronger recovery.
I'm not buying simply because ZEC has fallen 10%. I'm buying because price has swept liquidity at an important support area and shown an initial recovery.
Do you think this is a liquidity grab before a recovery, or will ZEC continue falling?
Follow for more technical analysis and trade setups.
Zcash has just delivered a significant liquidity sweep, and this is why I decided to take a LONG position.
Price broke below the previous range support around $1,045–$1,050, reaching close to $993 before recovering. This is the area where many traders' stop-losses and leveraged positions were likely sitting.
Why am I bullish here?
Sell-side liquidity swept: Price moved below the previous range low and reclaimed the area.
Leverage flush: A large number of long positions were liquidated during the sharp decline.
Major support: The $1,000–$1,050 region is an important area to watch for buyer interest.
Potential recovery: If buyers regain control, the next resistance zones could become upside targets.
📈 MY ZEC LONG PLAN
Entry: $1,045.27
Stop-Loss: $992.53
TP1: $1,115
TP2: $1,200
TP3: $1,360.24
Risk/Reward: Approximately 1:6 to the final target.
⚠️ What invalidates my idea?
A decisive breakdown below $992.53 invalidates this setup. I also want to see buyers reclaim the $1,115 area before becoming confident in a stronger recovery.
I'm not buying simply because ZEC has fallen 10%. I'm buying because price has swept liquidity at an important support area and shown an initial recovery.
Do you think this is a liquidity grab before a recovery, or will ZEC continue falling?
Follow for more technical analysis and trade setups.
216
·
--
Торговля за 30 дней $ZEC 7.7K USDT
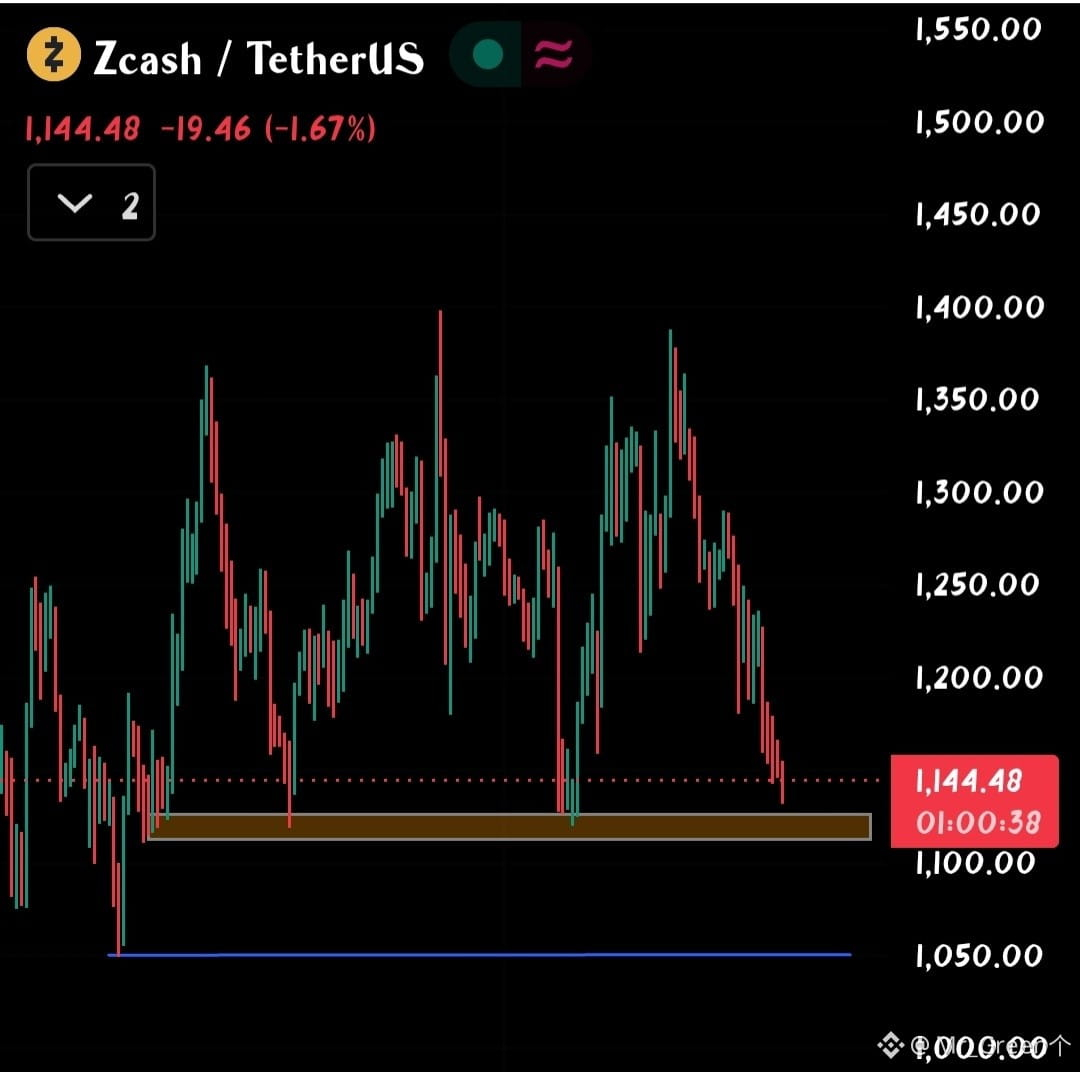
🟢 $ZEC — THE NEXT BULLISH SWING COULD BE APPROACHING! WILL BUYERS DEFEND $1,110?
Zcash has experienced strong selling pressure, but price is now approaching a major historical support zone around $1,110–$1,125.
This is the area I'm watching closely for a potential bullish reaction. However, I don't want to buy blindly while sellers are still in control.
📊 KEY LEVELS TO WATCH
Major Support: $1,110–$1,125
Immediate Resistance: $1,160
Strong Resistance: $1,180–$1,200
Next Target: $1,240
Deeper Support: $1,050
📈 MY ZEC LONG PLAN
Entry: $1,115–$1,140 (after bullish confirmation)
Stop-Loss: $1,090
TP1: $1,160
TP2: $1,200
TP3: $1,240
🔍 WHEN COULD THE NEXT SWING HAPPEN?
I'm watching the next 2–6 four-hour candles for a possible reversal signal.
A liquidity sweep below $1,120, followed by a strong bullish candle and a reclaim of $1,160, could signal that buyers are returning.
But if support breaks decisively, $1,050 becomes the next important downside target.
My strategy: Be patient. Let the market show its hand before entering.
⚠️ This is a conditional setup, not a guaranteed reversal. Always manage your risk.
Will ZEC bounce from $1,110, or are we heading toward $1,050 first?
Follow for more market structure and high-quality trading setups!
{future}(ZECUSDT)
🟢 $ZEC — THE NEXT BULLISH SWING COULD BE APPROACHING! WILL BUYERS DEFEND $1,110?
Zcash has experienced strong selling pressure, but price is now approaching a major historical support zone around $1,110–$1,125.
This is the area I'm watching closely for a potential bullish reaction. However, I don't want to buy blindly while sellers are still in control.
📊 KEY LEVELS TO WATCH
Major Support: $1,110–$1,125
Immediate Resistance: $1,160
Strong Resistance: $1,180–$1,200
Next Target: $1,240
Deeper Support: $1,050
📈 MY ZEC LONG PLAN
Entry: $1,115–$1,140 (after bullish confirmation)
Stop-Loss: $1,090
TP1: $1,160
TP2: $1,200
TP3: $1,240
🔍 WHEN COULD THE NEXT SWING HAPPEN?
I'm watching the next 2–6 four-hour candles for a possible reversal signal.
A liquidity sweep below $1,120, followed by a strong bullish candle and a reclaim of $1,160, could signal that buyers are returning.
But if support breaks decisively, $1,050 becomes the next important downside target.
My strategy: Be patient. Let the market show its hand before entering.
⚠️ This is a conditional setup, not a guaranteed reversal. Always manage your risk.
Will ZEC bounce from $1,110, or are we heading toward $1,050 first?
Follow for more market structure and high-quality trading setups!
Zcash has experienced strong selling pressure, but price is now approaching a major historical support zone around $1,110–$1,125.
This is the area I'm watching closely for a potential bullish reaction. However, I don't want to buy blindly while sellers are still in control.
📊 KEY LEVELS TO WATCH
Major Support: $1,110–$1,125
Immediate Resistance: $1,160
Strong Resistance: $1,180–$1,200
Next Target: $1,240
Deeper Support: $1,050
📈 MY ZEC LONG PLAN
Entry: $1,115–$1,140 (after bullish confirmation)
Stop-Loss: $1,090
TP1: $1,160
TP2: $1,200
TP3: $1,240
🔍 WHEN COULD THE NEXT SWING HAPPEN?
I'm watching the next 2–6 four-hour candles for a possible reversal signal.
A liquidity sweep below $1,120, followed by a strong bullish candle and a reclaim of $1,160, could signal that buyers are returning.
But if support breaks decisively, $1,050 becomes the next important downside target.
My strategy: Be patient. Let the market show its hand before entering.
⚠️ This is a conditional setup, not a guaranteed reversal. Always manage your risk.
Will ZEC bounce from $1,110, or are we heading toward $1,050 first?
Follow for more market structure and high-quality trading setups!
1
305
·
--
Торговля за 30 дней $NEAR 1.2K USDT
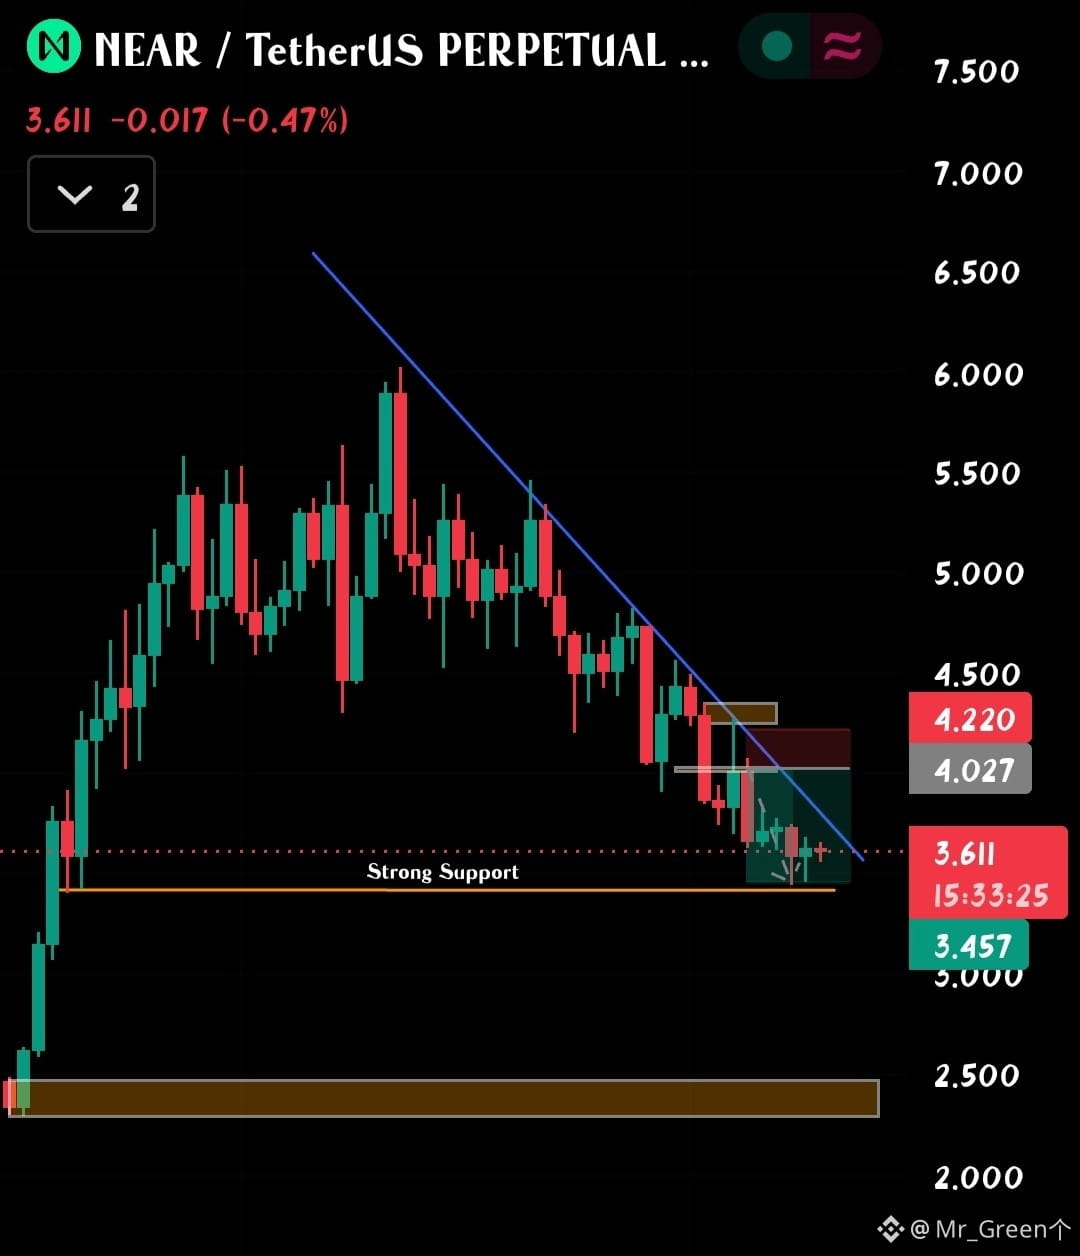
🟢 $NEAR — A BREAKDOWN TOWARD $2.50 COULD CREATE A BIG OPPORTUNITY!
NEAR is testing an important support zone around $3.45–$3.50. The descending trendline is still controlling the price action, so we need to be prepared for both scenarios.
📊 WHAT I'M WATCHING
$3.45–$3.50: Current major support.
$4.15–$4.35: Key supply and resistance zone.
$2.35–$2.50: Major bullish Order Block and potential accumulation area.
🔍 WHAT IF SUPPORT BREAKS?
A decisive breakdown below $3.45 could push NEAR toward the $2.50 area, where a major bullish order block is waiting.
But remember: A dip doesn't always mean a loss. Sometimes, it creates an opportunity to accumulate quality assets at better prices.
📈 MY STRATEGY
First, I'll watch how price reacts around $3.45. If support holds, a recovery could follow.
If support breaks, I will be watching the $2.35–$2.50 demand zone for potential accumulation, preferably after bullish confirmation.
A recovery above the descending trendline and $4.20 supply would strengthen the bullish outlook.
⚠️ Don't blindly buy every dip. Preserve capital, scale in carefully and respect invalidation levels.
Are you ready to accumulate NEAR around $2.50, or do you think $3.45 will hold?
Follow for more market structure and trading opportunities!
{future}(NEARUSDT)
🟢 $NEAR — A BREAKDOWN TOWARD $2.50 COULD CREATE A BIG OPPORTUNITY!
NEAR is testing an important support zone around $3.45–$3.50. The descending trendline is still controlling the price action, so we need to be prepared for both scenarios.
📊 WHAT I'M WATCHING
$3.45–$3.50: Current major support.
$4.15–$4.35: Key supply and resistance zone.
$2.35–$2.50: Major bullish Order Block and potential accumulation area.
🔍 WHAT IF SUPPORT BREAKS?
A decisive breakdown below $3.45 could push NEAR toward the $2.50 area, where a major bullish order block is waiting.
But remember: A dip doesn't always mean a loss. Sometimes, it creates an opportunity to accumulate quality assets at better prices.
📈 MY STRATEGY
First, I'll watch how price reacts around $3.45. If support holds, a recovery could follow.
If support breaks, I will be watching the $2.35–$2.50 demand zone for potential accumulation, preferably after bullish confirmation.
A recovery above the descending trendline and $4.20 supply would strengthen the bullish outlook.
⚠️ Don't blindly buy every dip. Preserve capital, scale in carefully and respect invalidation levels.
Are you ready to accumulate NEAR around $2.50, or do you think $3.45 will hold?
Follow for more market structure and trading opportunities!
NEAR is testing an important support zone around $3.45–$3.50. The descending trendline is still controlling the price action, so we need to be prepared for both scenarios.
📊 WHAT I'M WATCHING
$3.45–$3.50: Current major support.
$4.15–$4.35: Key supply and resistance zone.
$2.35–$2.50: Major bullish Order Block and potential accumulation area.
🔍 WHAT IF SUPPORT BREAKS?
A decisive breakdown below $3.45 could push NEAR toward the $2.50 area, where a major bullish order block is waiting.
But remember: A dip doesn't always mean a loss. Sometimes, it creates an opportunity to accumulate quality assets at better prices.
📈 MY STRATEGY
First, I'll watch how price reacts around $3.45. If support holds, a recovery could follow.
If support breaks, I will be watching the $2.35–$2.50 demand zone for potential accumulation, preferably after bullish confirmation.
A recovery above the descending trendline and $4.20 supply would strengthen the bullish outlook.
⚠️ Don't blindly buy every dip. Preserve capital, scale in carefully and respect invalidation levels.
Are you ready to accumulate NEAR around $2.50, or do you think $3.45 will hold?
Follow for more market structure and trading opportunities!
1
144
·
--
$JCT is having a breakout movement... watch it...
$JCT is having a breakout movement... watch it...
132
·
--
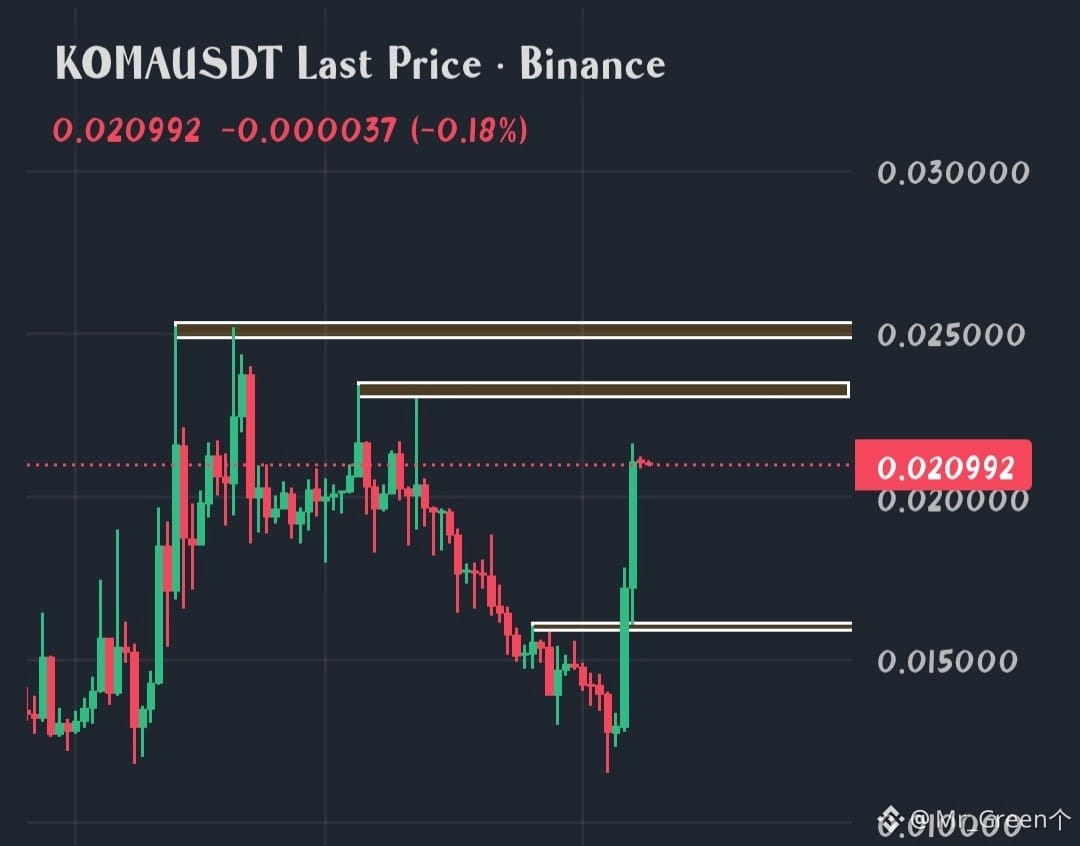
🟢 $KOMA — EXPLOSIVE BREAKOUT! IS $0.025 THE NEXT DESTINATION?
KOMA has delivered a powerful bullish move, breaking above its previous consolidation zone around $0.0155–$0.0160.
The momentum is impressive, but I don't want to chase an already extended candle.
📊 WHAT THE DATA SHOWS
Price surged over 50% in 24 hours.
Open interest increased more than 50%, indicating aggressive new positioning.
1H and 4H RSI readings are above 80, suggesting overbought conditions.
Positive funding shows longs are paying shorts.
Momentum is bullish, but overheating is a real risk.
🎯 KEY TARGETS
TP1: $0.0230
TP2: $0.0250
TP3: $0.0270 (if $0.0255 breaks)
📈 MY KOMA LONG PLAN
I would NOT enter blindly at $0.021.
Preferred Entry: $0.0185–$0.0195 (after a successful retest) Stop-Loss: $0.0175
WHAT COULD GO WRONG?
A failure to hold the breakout structure could trigger profit-taking. A daily close above $0.0230 would provide stronger confirmation of a broader bullish trend reversal.
My strategy: Let the price cool down, wait for a retest, and then look for confirmation.
⚠️ KOMA is a highly volatile meme coin. This is a conditional setup, not a guaranteed move. Manage your risk carefully.
Will KOMA reach $0.025, or will early buyers start taking profits?
Follow for more market structure and trading setups!
{future}(KOMAUSDT)
🟢 $KOMA — EXPLOSIVE BREAKOUT! IS $0.025 THE NEXT DESTINATION?
KOMA has delivered a powerful bullish move, breaking above its previous consolidation zone around $0.0155–$0.0160.
The momentum is impressive, but I don't want to chase an already extended candle.
📊 WHAT THE DATA SHOWS
Price surged over 50% in 24 hours.
Open interest increased more than 50%, indicating aggressive new positioning.
1H and 4H RSI readings are above 80, suggesting overbought conditions.
Positive funding shows longs are paying shorts.
Momentum is bullish, but overheating is a real risk.
🎯 KEY TARGETS
TP1: $0.0230
TP2: $0.0250
TP3: $0.0270 (if $0.0255 breaks)
📈 MY KOMA LONG PLAN
I would NOT enter blindly at $0.021.
Preferred Entry: $0.0185–$0.0195 (after a successful retest) Stop-Loss: $0.0175
WHAT COULD GO WRONG?
A failure to hold the breakout structure could trigger profit-taking. A daily close above $0.0230 would provide stronger confirmation of a broader bullish trend reversal.
My strategy: Let the price cool down, wait for a retest, and then look for confirmation.
⚠️ KOMA is a highly volatile meme coin. This is a conditional setup, not a guaranteed move. Manage your risk carefully.
Will KOMA reach $0.025, or will early buyers start taking profits?
Follow for more market structure and trading setups!
KOMA has delivered a powerful bullish move, breaking above its previous consolidation zone around $0.0155–$0.0160.
The momentum is impressive, but I don't want to chase an already extended candle.
📊 WHAT THE DATA SHOWS
Price surged over 50% in 24 hours.
Open interest increased more than 50%, indicating aggressive new positioning.
1H and 4H RSI readings are above 80, suggesting overbought conditions.
Positive funding shows longs are paying shorts.
Momentum is bullish, but overheating is a real risk.
🎯 KEY TARGETS
TP1: $0.0230
TP2: $0.0250
TP3: $0.0270 (if $0.0255 breaks)
📈 MY KOMA LONG PLAN
I would NOT enter blindly at $0.021.
Preferred Entry: $0.0185–$0.0195 (after a successful retest) Stop-Loss: $0.0175
WHAT COULD GO WRONG?
A failure to hold the breakout structure could trigger profit-taking. A daily close above $0.0230 would provide stronger confirmation of a broader bullish trend reversal.
My strategy: Let the price cool down, wait for a retest, and then look for confirmation.
⚠️ KOMA is a highly volatile meme coin. This is a conditional setup, not a guaranteed move. Manage your risk carefully.
Will KOMA reach $0.025, or will early buyers start taking profits?
Follow for more market structure and trading setups!
1
1
215
·
--
Хранение $SUI 22.1 USDT
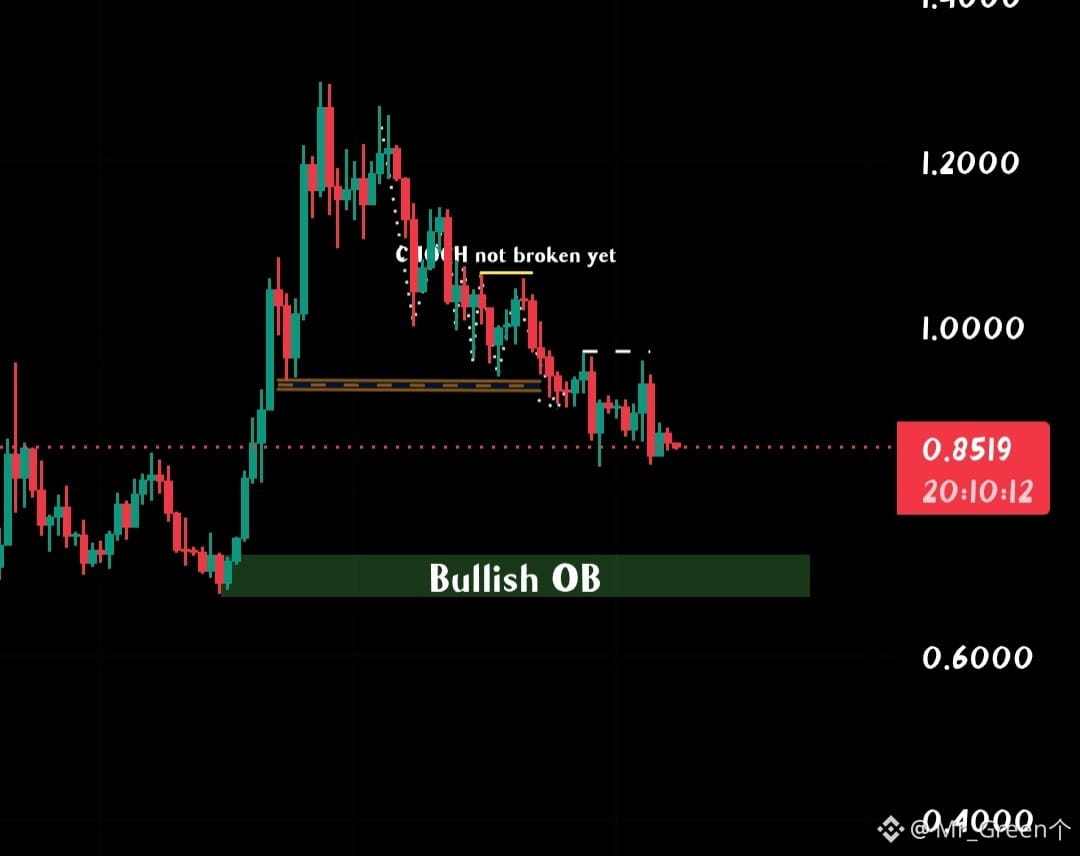
🔴 $SUI — BEARS ARE STILL IN CONTROL! WILL THE BULLISH ORDER BLOCK SAVE THE TREND?
SUI is trading around $0.85, and the chart continues to show lower highs and bearish market structure. The previous support around $0.93–$0.95 has failed to hold, turning into potential resistance.
📊 KEY LEVELS TO WATCH
Immediate Support: $0.83–$0.84
Next Support: $0.80
Major Bullish OB: $0.67–$0.72
Resistance: $0.88–$0.90
Major Resistance: $0.95
📉 MY SUI SHORT PLAN
Entry: $0.88–$0.90 (after bearish rejection) Stop-Loss: $0.925 TP1: $0.83 TP2: $0.80 TP3: $0.72
🔍 WHAT'S NEXT?
A breakdown below $0.80 could accelerate selling toward the major bullish order block around $0.67–$0.72.
However, reclaiming $0.90–$0.95 would weaken the bearish structure and could signal a potential recovery.
My bias remains bearish until buyers reclaim key resistance levels. I'm watching for a relief bounce before considering a short entry.
⚠️ Conditional setup, not a guaranteed move. Always manage your risk.
Will SUI reach the $0.70 bullish order block, or will buyers step in before that?
Follow for more market structure and trading setups!
{future}(SUIUSDT)
🔴 $SUI — BEARS ARE STILL IN CONTROL! WILL THE BULLISH ORDER BLOCK SAVE THE TREND?
SUI is trading around $0.85, and the chart continues to show lower highs and bearish market structure. The previous support around $0.93–$0.95 has failed to hold, turning into potential resistance.
📊 KEY LEVELS TO WATCH
Immediate Support: $0.83–$0.84
Next Support: $0.80
Major Bullish OB: $0.67–$0.72
Resistance: $0.88–$0.90
Major Resistance: $0.95
📉 MY SUI SHORT PLAN
Entry: $0.88–$0.90 (after bearish rejection) Stop-Loss: $0.925 TP1: $0.83 TP2: $0.80 TP3: $0.72
🔍 WHAT'S NEXT?
A breakdown below $0.80 could accelerate selling toward the major bullish order block around $0.67–$0.72.
However, reclaiming $0.90–$0.95 would weaken the bearish structure and could signal a potential recovery.
My bias remains bearish until buyers reclaim key resistance levels. I'm watching for a relief bounce before considering a short entry.
⚠️ Conditional setup, not a guaranteed move. Always manage your risk.
Will SUI reach the $0.70 bullish order block, or will buyers step in before that?
Follow for more market structure and trading setups!
SUI is trading around $0.85, and the chart continues to show lower highs and bearish market structure. The previous support around $0.93–$0.95 has failed to hold, turning into potential resistance.
📊 KEY LEVELS TO WATCH
Immediate Support: $0.83–$0.84
Next Support: $0.80
Major Bullish OB: $0.67–$0.72
Resistance: $0.88–$0.90
Major Resistance: $0.95
📉 MY SUI SHORT PLAN
Entry: $0.88–$0.90 (after bearish rejection) Stop-Loss: $0.925 TP1: $0.83 TP2: $0.80 TP3: $0.72
🔍 WHAT'S NEXT?
A breakdown below $0.80 could accelerate selling toward the major bullish order block around $0.67–$0.72.
However, reclaiming $0.90–$0.95 would weaken the bearish structure and could signal a potential recovery.
My bias remains bearish until buyers reclaim key resistance levels. I'm watching for a relief bounce before considering a short entry.
⚠️ Conditional setup, not a guaranteed move. Always manage your risk.
Will SUI reach the $0.70 bullish order block, or will buyers step in before that?
Follow for more market structure and trading setups!
230
·
--
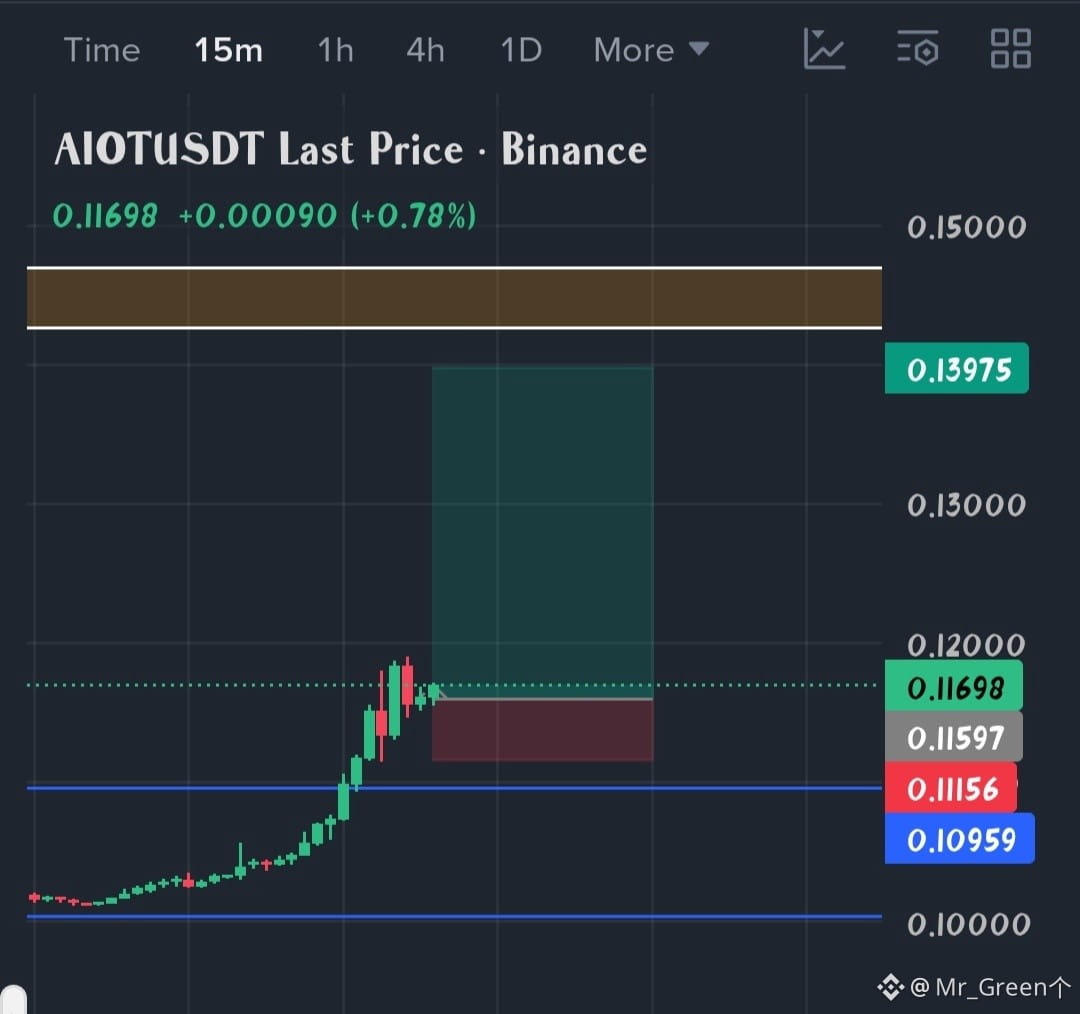
We got the daily candle breakout at 0.109 in $AIOT
Expecting a good bullish rally from here...You can wait for several rejection at 0.109 as it's the support now...
My Trade:
📌Entry: 0.11
🟢SL: 0.105
🎯TP1: 0.12
🎯TP2: 0.13
🎯TP3: 0.145
Don't enter blindly, check the chart and get your best entry...
We got the daily candle breakout at 0.109 in $AIOT
Expecting a good bullish rally from here...You can wait for several rejection at 0.109 as it's the support now...
My Trade:
📌Entry: 0.11
🟢SL: 0.105
🎯TP1: 0.12
🎯TP2: 0.13
🎯TP3: 0.145
Don't enter blindly, check the chart and get your best entry...
Expecting a good bullish rally from here...You can wait for several rejection at 0.109 as it's the support now...
My Trade:
📌Entry: 0.11
🟢SL: 0.105
🎯TP1: 0.12
🎯TP2: 0.13
🎯TP3: 0.145
Don't enter blindly, check the chart and get your best entry...
1
2
221
·
--
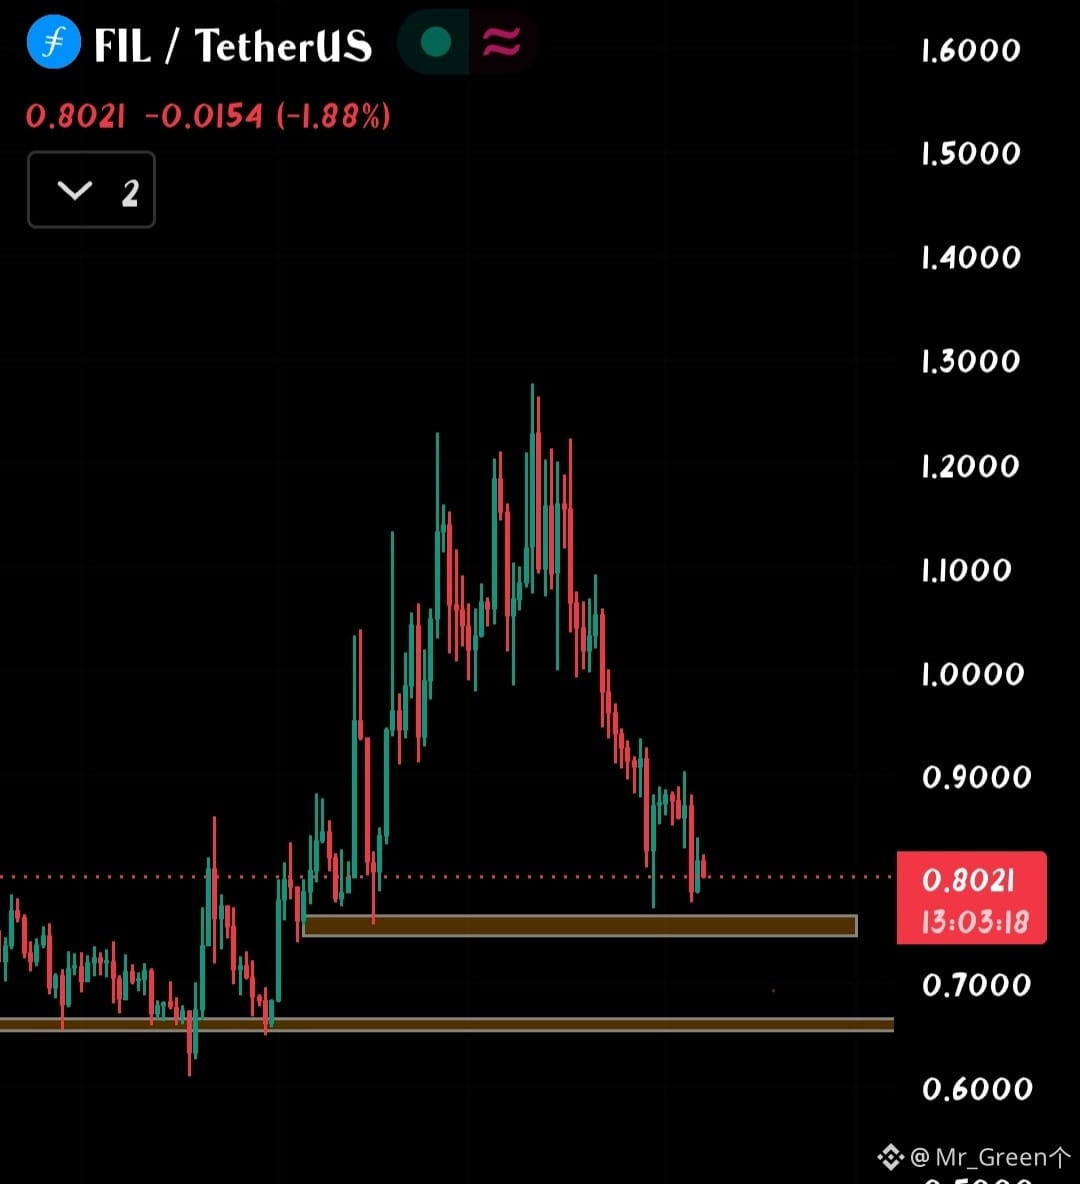
🔵 $FIL — WILL BUYERS DEFEND THE $0.75 SUPPORT?
Filecoin is approaching a critical demand zone after falling from nearly $1.27. The chart continues to show lower highs and lower lows, suggesting sellers are still in control.
However, the $0.74–$0.76 zone could become an important area for a potential reversal.
📊 KEY LEVELS
Major Support: $0.74–$0.76
Lower Support: $0.65–$0.67
Resistance: $0.82–$0.85
Strong Resistance: $0.88–$0.90
📉 MY FIL SHORT PLAN
Entry: $0.84–$0.88 (after bearish rejection) Stop-Loss: $0.92 TP1: $0.78 TP2: $0.75 TP3: $0.67
🔍 WHAT'S NEXT?
A breakdown below $0.74 could open the door toward $0.67. However, a strong recovery above $0.90 would weaken the bearish structure.
My strategy is to avoid chasing shorts near major support and wait for a confirmed pullback and rejection.
⚠️ Conditional setup, not a guaranteed move. Always manage your risk.
Are you accumulating FIL near $0.75, or expecting another breakdown?
Follow for more market analysis and trading setups!
🔵 $FIL — WILL BUYERS DEFEND THE $0.75 SUPPORT?
Filecoin is approaching a critical demand zone after falling from nearly $1.27. The chart continues to show lower highs and lower lows, suggesting sellers are still in control.
However, the $0.74–$0.76 zone could become an important area for a potential reversal.
📊 KEY LEVELS
Major Support: $0.74–$0.76
Lower Support: $0.65–$0.67
Resistance: $0.82–$0.85
Strong Resistance: $0.88–$0.90
📉 MY FIL SHORT PLAN
Entry: $0.84–$0.88 (after bearish rejection) Stop-Loss: $0.92 TP1: $0.78 TP2: $0.75 TP3: $0.67
🔍 WHAT'S NEXT?
A breakdown below $0.74 could open the door toward $0.67. However, a strong recovery above $0.90 would weaken the bearish structure.
My strategy is to avoid chasing shorts near major support and wait for a confirmed pullback and rejection.
⚠️ Conditional setup, not a guaranteed move. Always manage your risk.
Are you accumulating FIL near $0.75, or expecting another breakdown?
Follow for more market analysis and trading setups!
Filecoin is approaching a critical demand zone after falling from nearly $1.27. The chart continues to show lower highs and lower lows, suggesting sellers are still in control.
However, the $0.74–$0.76 zone could become an important area for a potential reversal.
📊 KEY LEVELS
Major Support: $0.74–$0.76
Lower Support: $0.65–$0.67
Resistance: $0.82–$0.85
Strong Resistance: $0.88–$0.90
📉 MY FIL SHORT PLAN
Entry: $0.84–$0.88 (after bearish rejection) Stop-Loss: $0.92 TP1: $0.78 TP2: $0.75 TP3: $0.67
🔍 WHAT'S NEXT?
A breakdown below $0.74 could open the door toward $0.67. However, a strong recovery above $0.90 would weaken the bearish structure.
My strategy is to avoid chasing shorts near major support and wait for a confirmed pullback and rejection.
⚠️ Conditional setup, not a guaranteed move. Always manage your risk.
Are you accumulating FIL near $0.75, or expecting another breakdown?
Follow for more market analysis and trading setups!
7
3
2.1k
·
--
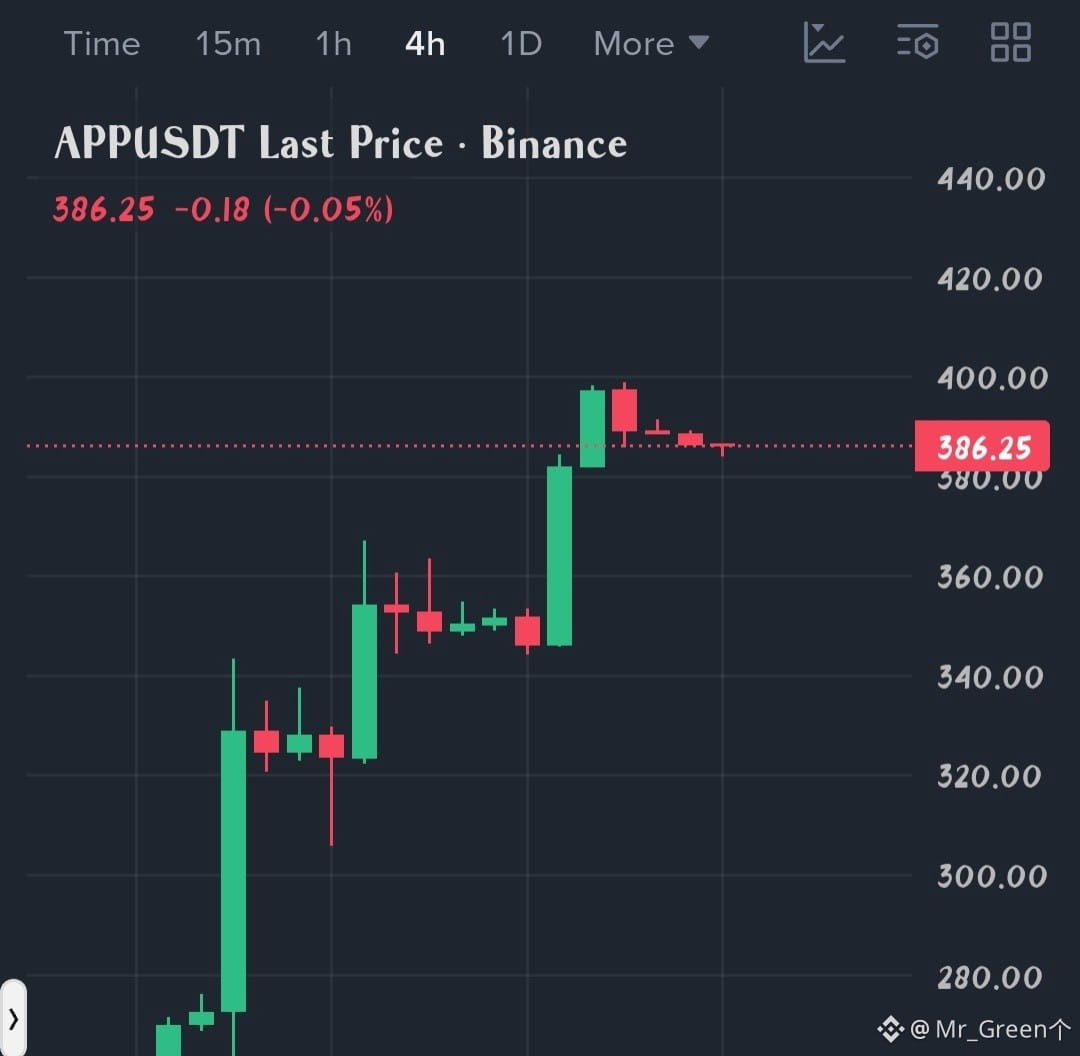
Do you find this chart interesting?
Similar pattern?
Bullishvrally next?
$APP
Do you find this chart interesting?
Similar pattern?
Bullishvrally next?
$APP
Similar pattern?
Bullishvrally next?
$APP
1
492
·
--
Падение
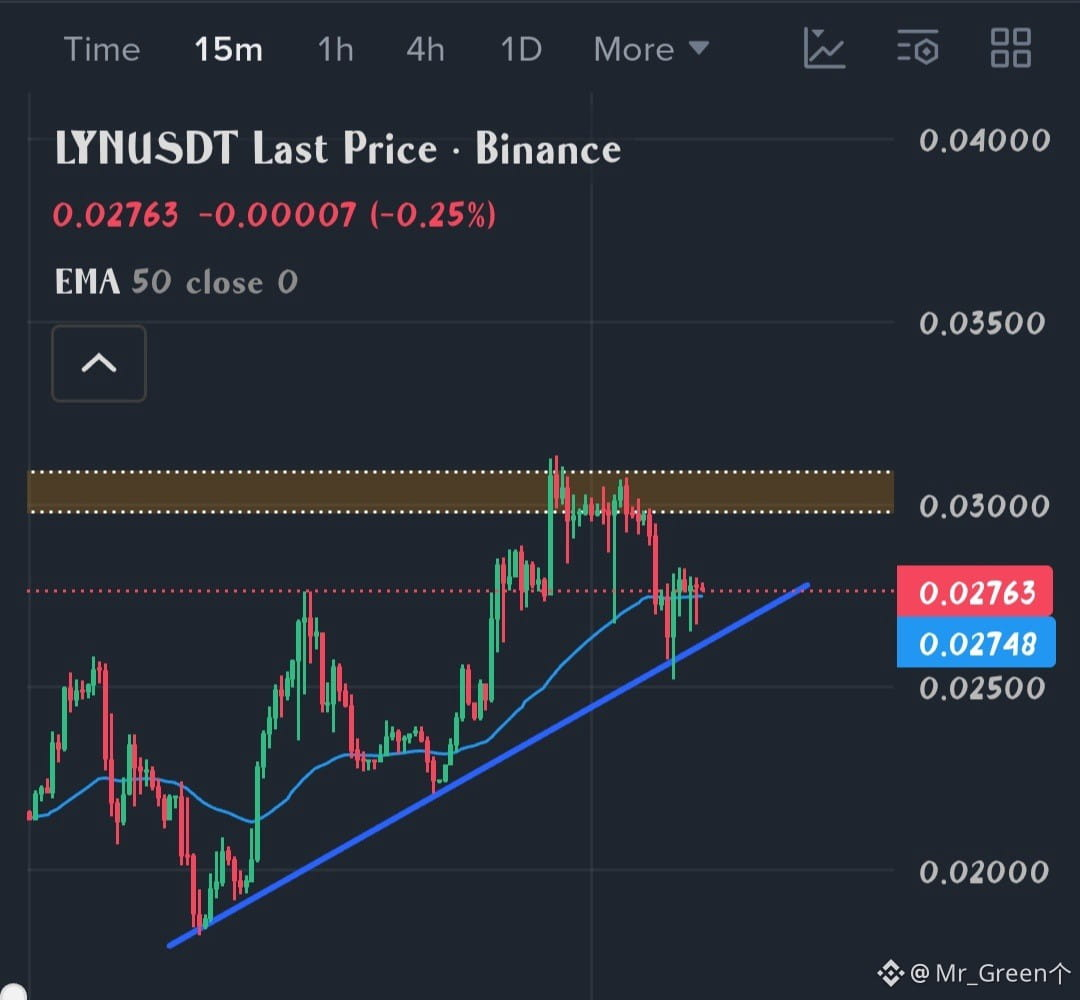
$LYN is in a very decisive phase...Price is showing bearish candles...but now the price is near the trendline and also near the EMA 50 line...
These two are playing the vital role as a support...
If the price breaks below that trandline or the EMA 50 then bearish run will start...
But if not..then we can see another rejection at the supply zone...
What is more likely to happen?
A retest or a support break?
$LYN is in a very decisive phase...Price is showing bearish candles...but now the price is near the trendline and also near the EMA 50 line...
These two are playing the vital role as a support...
If the price breaks below that trandline or the EMA 50 then bearish run will start...
But if not..then we can see another rejection at the supply zone...
What is more likely to happen?
A retest or a support break?
These two are playing the vital role as a support...
If the price breaks below that trandline or the EMA 50 then bearish run will start...
But if not..then we can see another rejection at the supply zone...
What is more likely to happen?
A retest or a support break?
254
·
--
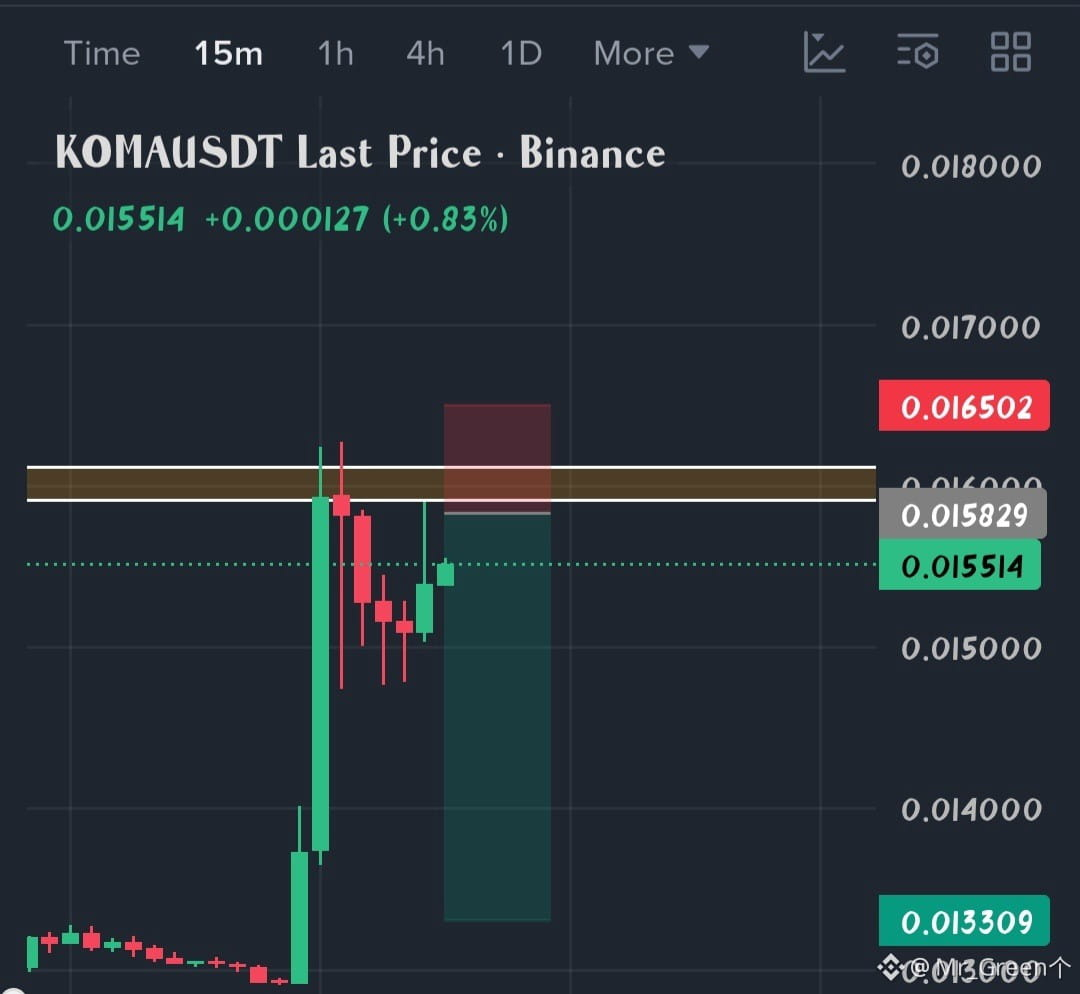
Big Short Coming in $KOMA
Entry: 0.0155-0.0156
SL: 0.0161
TP1: 0.015
TP2: 0.0145
TP3: 0.0135
Strong rejection in the resistance zone...also got the liquidity in daily time frame...RSI is high, seems buyers are exhausted... Buyers will start booking their profit which might create selling pressure...Don't enter blindly...watch and get the opportunity....
Big Short Coming in $KOMA
Entry: 0.0155-0.0156
SL: 0.0161
TP1: 0.015
TP2: 0.0145
TP3: 0.0135
Strong rejection in the resistance zone...also got the liquidity in daily time frame...RSI is high, seems buyers are exhausted... Buyers will start booking their profit which might create selling pressure...Don't enter blindly...watch and get the opportunity....
Entry: 0.0155-0.0156
SL: 0.0161
TP1: 0.015
TP2: 0.0145
TP3: 0.0135
Strong rejection in the resistance zone...also got the liquidity in daily time frame...RSI is high, seems buyers are exhausted... Buyers will start booking their profit which might create selling pressure...Don't enter blindly...watch and get the opportunity....
342
·
--
$AKE Short will work well now guys...
Let's see what do I make...
$AKE Short will work well now guys...
Let's see what do I make...
Let's see what do I make...
257
·
--
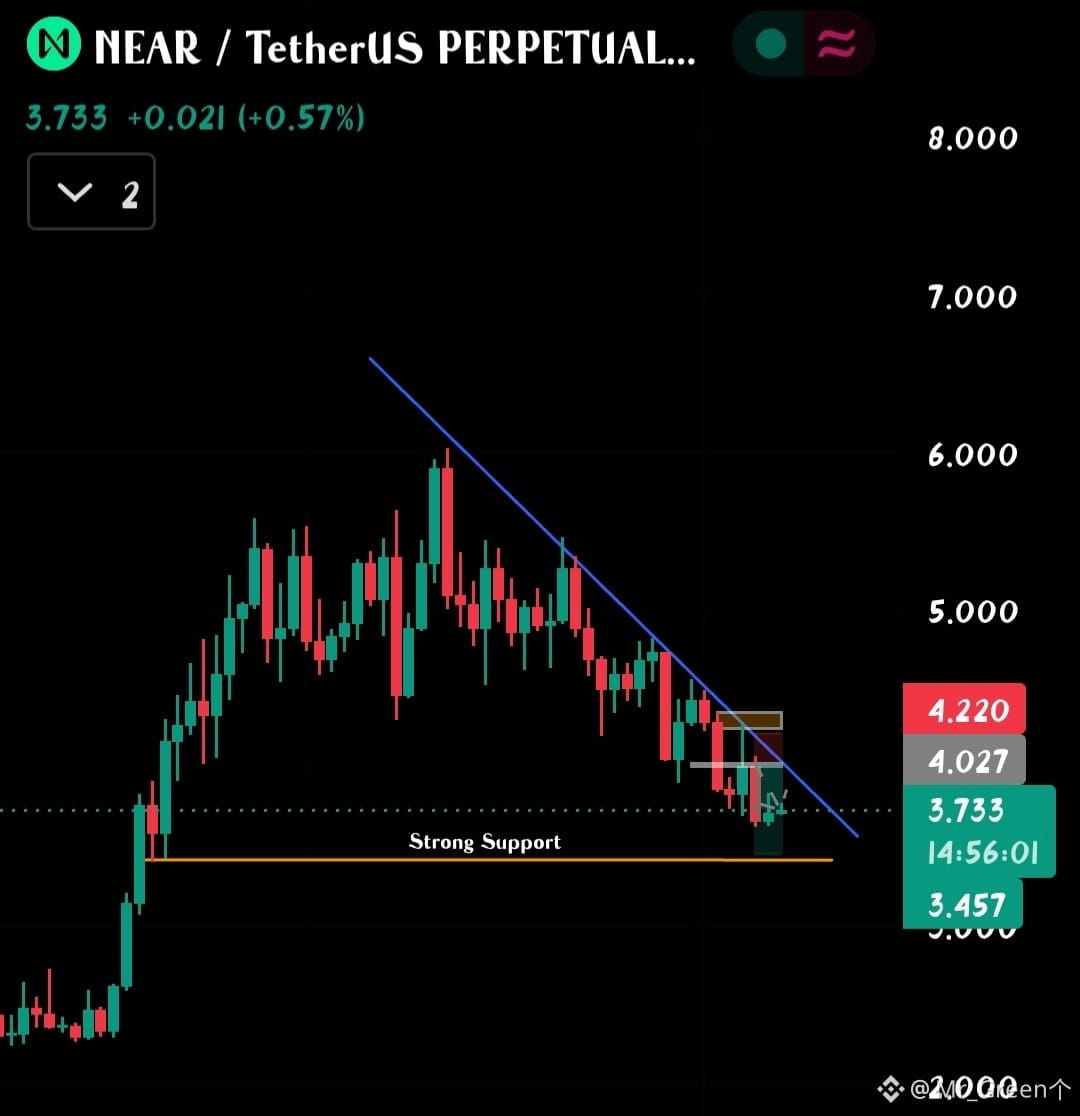
🔴 $NEAR — WILL $3.45 SUPPORT HOLD OR ARE WE HEADING LOWER?
NEAR is still struggling under a descending trendline after dropping from nearly $6.00. The chart continues to show lower highs, suggesting sellers remain in control.
📊 KEY LEVELS TO WATCH
Major support: $3.45
Immediate resistance: $3.95–$4.00
Supply zone: $4.15–$4.22
Descending trendline remains the key resistance.
📉 MY NEAR SHORT PLAN
I don't want to chase shorts directly into major support. My preferred strategy is to wait for a relief bounce and bearish rejection.
Entry: $3.95–$4.20
Stop-Loss: $4.32
TP1: $3.70
TP2: $3.45
TP3: $3.20
🔍 WHAT'S NEXT?
A confirmed breakdown below $3.45 could trigger another bearish leg toward $3.20 and potentially $3.00.
However, a breakout above the descending trendline followed by a reclaim of $4.22 would weaken the bearish structure.
For now, I'm watching the trendline and $3.45 support closely. Patience is key!
⚠️ Conditional setup, not a guaranteed move. Always manage your risk.
Will NEAR defend $3.45 or break down toward $3.20?
Follow for more technical analysis and trade setups!
{future}(NEARUSDT)
🔴 $NEAR — WILL $3.45 SUPPORT HOLD OR ARE WE HEADING LOWER?
NEAR is still struggling under a descending trendline after dropping from nearly $6.00. The chart continues to show lower highs, suggesting sellers remain in control.
📊 KEY LEVELS TO WATCH
Major support: $3.45
Immediate resistance: $3.95–$4.00
Supply zone: $4.15–$4.22
Descending trendline remains the key resistance.
📉 MY NEAR SHORT PLAN
I don't want to chase shorts directly into major support. My preferred strategy is to wait for a relief bounce and bearish rejection.
Entry: $3.95–$4.20
Stop-Loss: $4.32
TP1: $3.70
TP2: $3.45
TP3: $3.20
🔍 WHAT'S NEXT?
A confirmed breakdown below $3.45 could trigger another bearish leg toward $3.20 and potentially $3.00.
However, a breakout above the descending trendline followed by a reclaim of $4.22 would weaken the bearish structure.
For now, I'm watching the trendline and $3.45 support closely. Patience is key!
⚠️ Conditional setup, not a guaranteed move. Always manage your risk.
Will NEAR defend $3.45 or break down toward $3.20?
Follow for more technical analysis and trade setups!
NEAR is still struggling under a descending trendline after dropping from nearly $6.00. The chart continues to show lower highs, suggesting sellers remain in control.
📊 KEY LEVELS TO WATCH
Major support: $3.45
Immediate resistance: $3.95–$4.00
Supply zone: $4.15–$4.22
Descending trendline remains the key resistance.
📉 MY NEAR SHORT PLAN
I don't want to chase shorts directly into major support. My preferred strategy is to wait for a relief bounce and bearish rejection.
Entry: $3.95–$4.20
Stop-Loss: $4.32
TP1: $3.70
TP2: $3.45
TP3: $3.20
🔍 WHAT'S NEXT?
A confirmed breakdown below $3.45 could trigger another bearish leg toward $3.20 and potentially $3.00.
However, a breakout above the descending trendline followed by a reclaim of $4.22 would weaken the bearish structure.
For now, I'm watching the trendline and $3.45 support closely. Patience is key!
⚠️ Conditional setup, not a guaranteed move. Always manage your risk.
Will NEAR defend $3.45 or break down toward $3.20?
Follow for more technical analysis and trade setups!
165
·
--
Торговля за 30 дней $ZEC 7.7K USDT
🟢 $ZEC — SUPPLY REJECTION, BUT THE BULLISH TRENDLINE IS STILL INTACT!
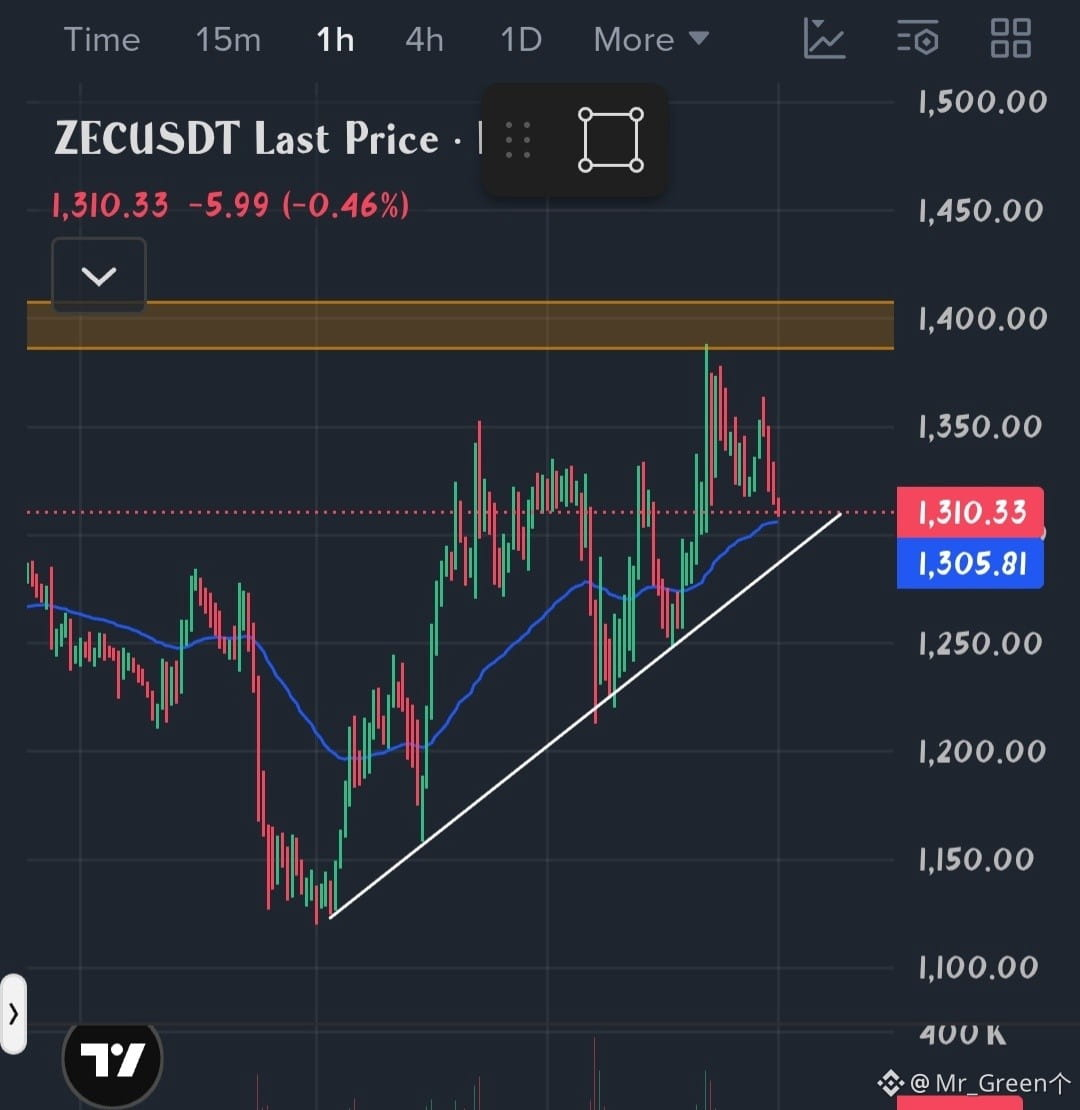
Zcash ($ZEC) has faced selling pressure after reaching its major supply zone around $1,385–$1,405. However, I'm not turning bearish just yet.
On the 1H chart, price has pulled back toward $1,310, but the ascending trendline is still holding. This is an important distinction: rejection from supply doesn't automatically mean a complete trend reversal.
📊 WHY AM I STILL WATCHING FOR A LONG?
Price continues to respect the ascending trendline, maintaining a structure of higher lows.
The 1H moving average around $1,305 provides additional nearby support.
Sellers rejected price from the $1,385–$1,405 supply zone.
A successful bounce from the current support could trigger another attempt toward the previous highs.
📈 MY ZEC LONG PLAN
Entry: $1,305–$1,320
Stop-Loss: $1,278
TP1: $1,350
TP2: $1,385
TP3: $1,430
🔍 WHAT COULD INVALIDATE THIS SETUP?
A decisive 1H candle close below the ascending trendline, followed by a failed retest, would weaken the bullish structure.
If that happens, I would watch $1,250 and potentially $1,200 as the next downside areas.
For now, I'm watching whether buyers can defend the trendline and moving average. If support holds, ZEC could regain bullish momentum and challenge the $1,400 supply zone again.
⚠️ This is a conditional trading setup, not a guaranteed reversal. Wait for confirmation and always manage your risk.
What's your view? Will ZEC break above $1,400, or will sellers push it back toward $1,250?
Follow for more market structure, technical analysis and high-quality trade setups.
{future}(ZECUSDT)
🟢 $ZEC — SUPPLY REJECTION, BUT THE BULLISH TRENDLINE IS STILL INTACT!
Zcash ($ZEC ) has faced selling pressure after reaching its major supply zone around $1,385–$1,405. However, I'm not turning bearish just yet.
On the 1H chart, price has pulled back toward $1,310, but the ascending trendline is still holding. This is an important distinction: rejection from supply doesn't automatically mean a complete trend reversal.
📊 WHY AM I STILL WATCHING FOR A LONG?
Price continues to respect the ascending trendline, maintaining a structure of higher lows.
The 1H moving average around $1,305 provides additional nearby support.
Sellers rejected price from the $1,385–$1,405 supply zone.
A successful bounce from the current support could trigger another attempt toward the previous highs.
📈 MY ZEC LONG PLAN
Entry: $1,305–$1,320
Stop-Loss: $1,278
TP1: $1,350
TP2: $1,385
TP3: $1,430
🔍 WHAT COULD INVALIDATE THIS SETUP?
A decisive 1H candle close below the ascending trendline, followed by a failed retest, would weaken the bullish structure.
If that happens, I would watch $1,250 and potentially $1,200 as the next downside areas.
For now, I'm watching whether buyers can defend the trendline and moving average. If support holds, ZEC could regain bullish momentum and challenge the $1,400 supply zone again.
⚠️ This is a conditional trading setup, not a guaranteed reversal. Wait for confirmation and always manage your risk.
What's your view? Will ZEC break above $1,400, or will sellers push it back toward $1,250?
Follow for more market structure, technical analysis and high-quality trade setups.
Zcash ($ZEC ) has faced selling pressure after reaching its major supply zone around $1,385–$1,405. However, I'm not turning bearish just yet.
On the 1H chart, price has pulled back toward $1,310, but the ascending trendline is still holding. This is an important distinction: rejection from supply doesn't automatically mean a complete trend reversal.
📊 WHY AM I STILL WATCHING FOR A LONG?
Price continues to respect the ascending trendline, maintaining a structure of higher lows.
The 1H moving average around $1,305 provides additional nearby support.
Sellers rejected price from the $1,385–$1,405 supply zone.
A successful bounce from the current support could trigger another attempt toward the previous highs.
📈 MY ZEC LONG PLAN
Entry: $1,305–$1,320
Stop-Loss: $1,278
TP1: $1,350
TP2: $1,385
TP3: $1,430
🔍 WHAT COULD INVALIDATE THIS SETUP?
A decisive 1H candle close below the ascending trendline, followed by a failed retest, would weaken the bullish structure.
If that happens, I would watch $1,250 and potentially $1,200 as the next downside areas.
For now, I'm watching whether buyers can defend the trendline and moving average. If support holds, ZEC could regain bullish momentum and challenge the $1,400 supply zone again.
⚠️ This is a conditional trading setup, not a guaranteed reversal. Wait for confirmation and always manage your risk.
What's your view? Will ZEC break above $1,400, or will sellers push it back toward $1,250?
Follow for more market structure, technical analysis and high-quality trade setups.
3
1
373
·
--
🟠 $BTC — THE $75K SUPPORT COULD DECIDE THE NEXT BIG MOVE!
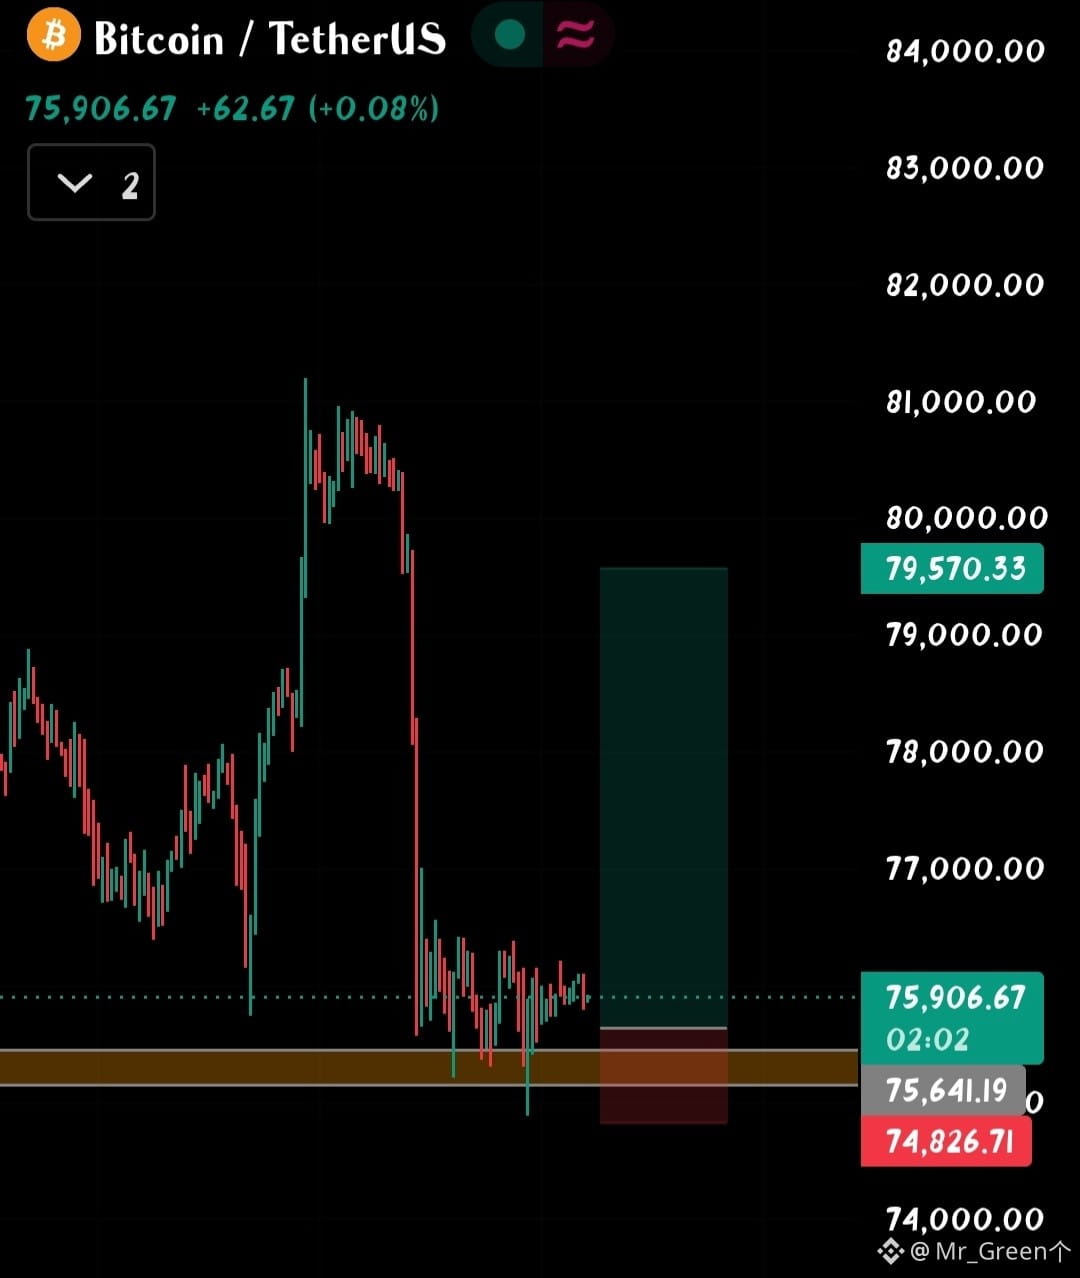
Bitcoin has finally reached a major area of interest around $75,400–$75,650. This is not just another horizontal support level — it is a zone I’m watching closely after the recent sharp sell-off.
Why am I considering a LONG here?
Price swept liquidity beneath the support zone, printed rejection wicks, and reclaimed the area. That suggests buyers may be defending this level. I want to see the zone continue holding before treating this as a valid bounce.
🌍 What about the broader market?
The global picture is still mixed. US equities recovered some ground on Friday, but the Nasdaq and S&P 500 remained down for the week. Inflation concerns, elevated borrowing costs and geopolitical uncertainty are still risks for assets like Bitcoin.
📈 MY BTC LONG PLAN
Entry: $75,450–$75,650
Stop-Loss: $74,826
TP1: $76,350
TP2: $78,150
TP3: $79,570
The bigger picture: If this support fails decisively, I won't keep looking for longs. First, lower support levels around $73K and $70K could come into play. A deeper bearish continuation could eventually expose the $60K–$62K region.
For now, I’m watching whether buyers can defend this liquidity-swept zone. A successful bounce could give BTC room to recover toward $79.5K.
⚠️ This is a conditional setup, not a guaranteed reversal. Risk management is essential, especially while the short-term trend remains weak.
What's your view — will $75K hold, or are we heading toward $60K?
Follow for more market structure and trade setups.
{future}(BTCUSDT)
🟠 $BTC — THE $75K SUPPORT COULD DECIDE THE NEXT BIG MOVE!
Bitcoin has finally reached a major area of interest around $75,400–$75,650. This is not just another horizontal support level — it is a zone I’m watching closely after the recent sharp sell-off.
Why am I considering a LONG here?
Price swept liquidity beneath the support zone, printed rejection wicks, and reclaimed the area. That suggests buyers may be defending this level. I want to see the zone continue holding before treating this as a valid bounce.
🌍 What about the broader market?
The global picture is still mixed. US equities recovered some ground on Friday, but the Nasdaq and S&P 500 remained down for the week. Inflation concerns, elevated borrowing costs and geopolitical uncertainty are still risks for assets like Bitcoin.
📈 MY BTC LONG PLAN
Entry: $75,450–$75,650
Stop-Loss: $74,826
TP1: $76,350
TP2: $78,150
TP3: $79,570
The bigger picture: If this support fails decisively, I won't keep looking for longs. First, lower support levels around $73K and $70K could come into play. A deeper bearish continuation could eventually expose the $60K–$62K region.
For now, I’m watching whether buyers can defend this liquidity-swept zone. A successful bounce could give BTC room to recover toward $79.5K.
⚠️ This is a conditional setup, not a guaranteed reversal. Risk management is essential, especially while the short-term trend remains weak.
What's your view — will $75K hold, or are we heading toward $60K?
Follow for more market structure and trade setups.
Bitcoin has finally reached a major area of interest around $75,400–$75,650. This is not just another horizontal support level — it is a zone I’m watching closely after the recent sharp sell-off.
Why am I considering a LONG here?
Price swept liquidity beneath the support zone, printed rejection wicks, and reclaimed the area. That suggests buyers may be defending this level. I want to see the zone continue holding before treating this as a valid bounce.
🌍 What about the broader market?
The global picture is still mixed. US equities recovered some ground on Friday, but the Nasdaq and S&P 500 remained down for the week. Inflation concerns, elevated borrowing costs and geopolitical uncertainty are still risks for assets like Bitcoin.
📈 MY BTC LONG PLAN
Entry: $75,450–$75,650
Stop-Loss: $74,826
TP1: $76,350
TP2: $78,150
TP3: $79,570
The bigger picture: If this support fails decisively, I won't keep looking for longs. First, lower support levels around $73K and $70K could come into play. A deeper bearish continuation could eventually expose the $60K–$62K region.
For now, I’m watching whether buyers can defend this liquidity-swept zone. A successful bounce could give BTC room to recover toward $79.5K.
⚠️ This is a conditional setup, not a guaranteed reversal. Risk management is essential, especially while the short-term trend remains weak.
What's your view — will $75K hold, or are we heading toward $60K?
Follow for more market structure and trade setups.
146
·
--
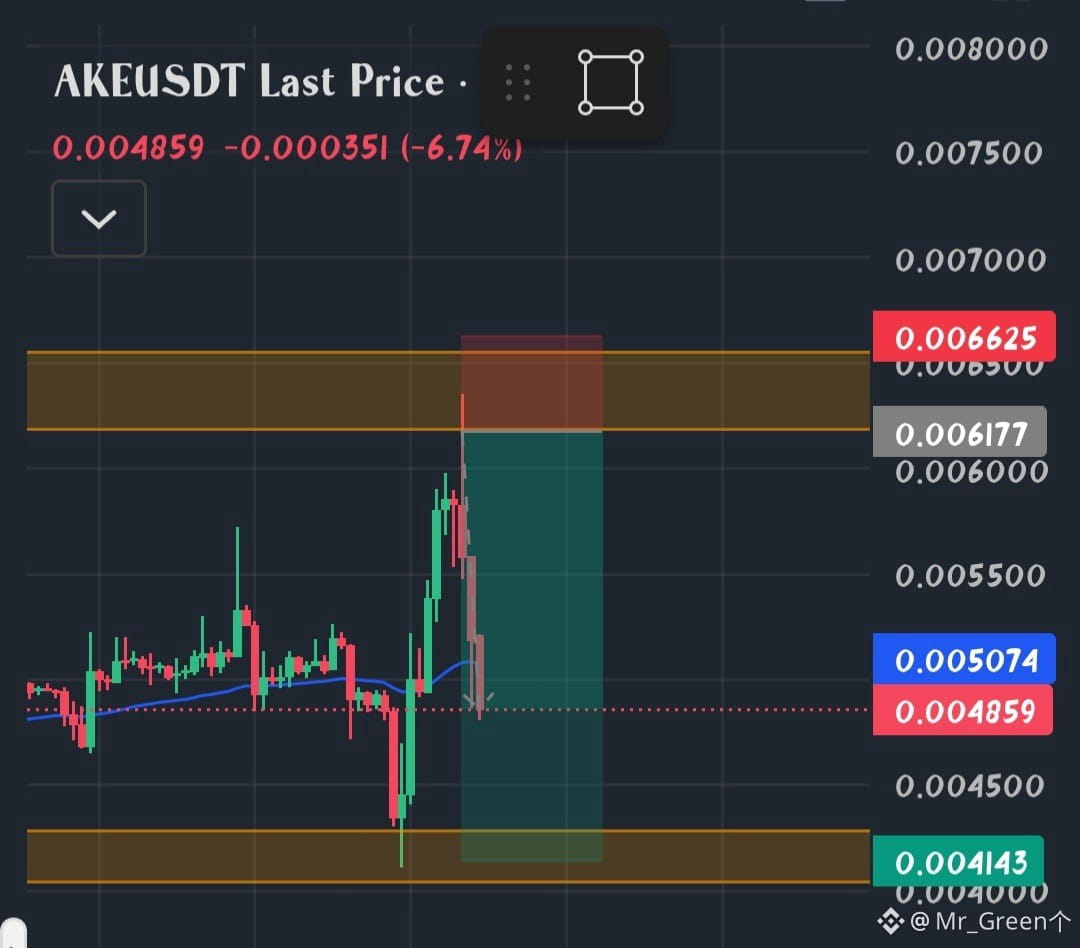
If you know how to draw levels, you can make profit...
Be patient and learn
$AKE $AIN $BTC
If you know how to draw levels, you can make profit...
Be patient and learn
$AKE $AIN $BTC
Be patient and learn
$AKE $AIN $BTC
1
145
·
--
Торговля за 30 дней $ZEC 7.7K USDT
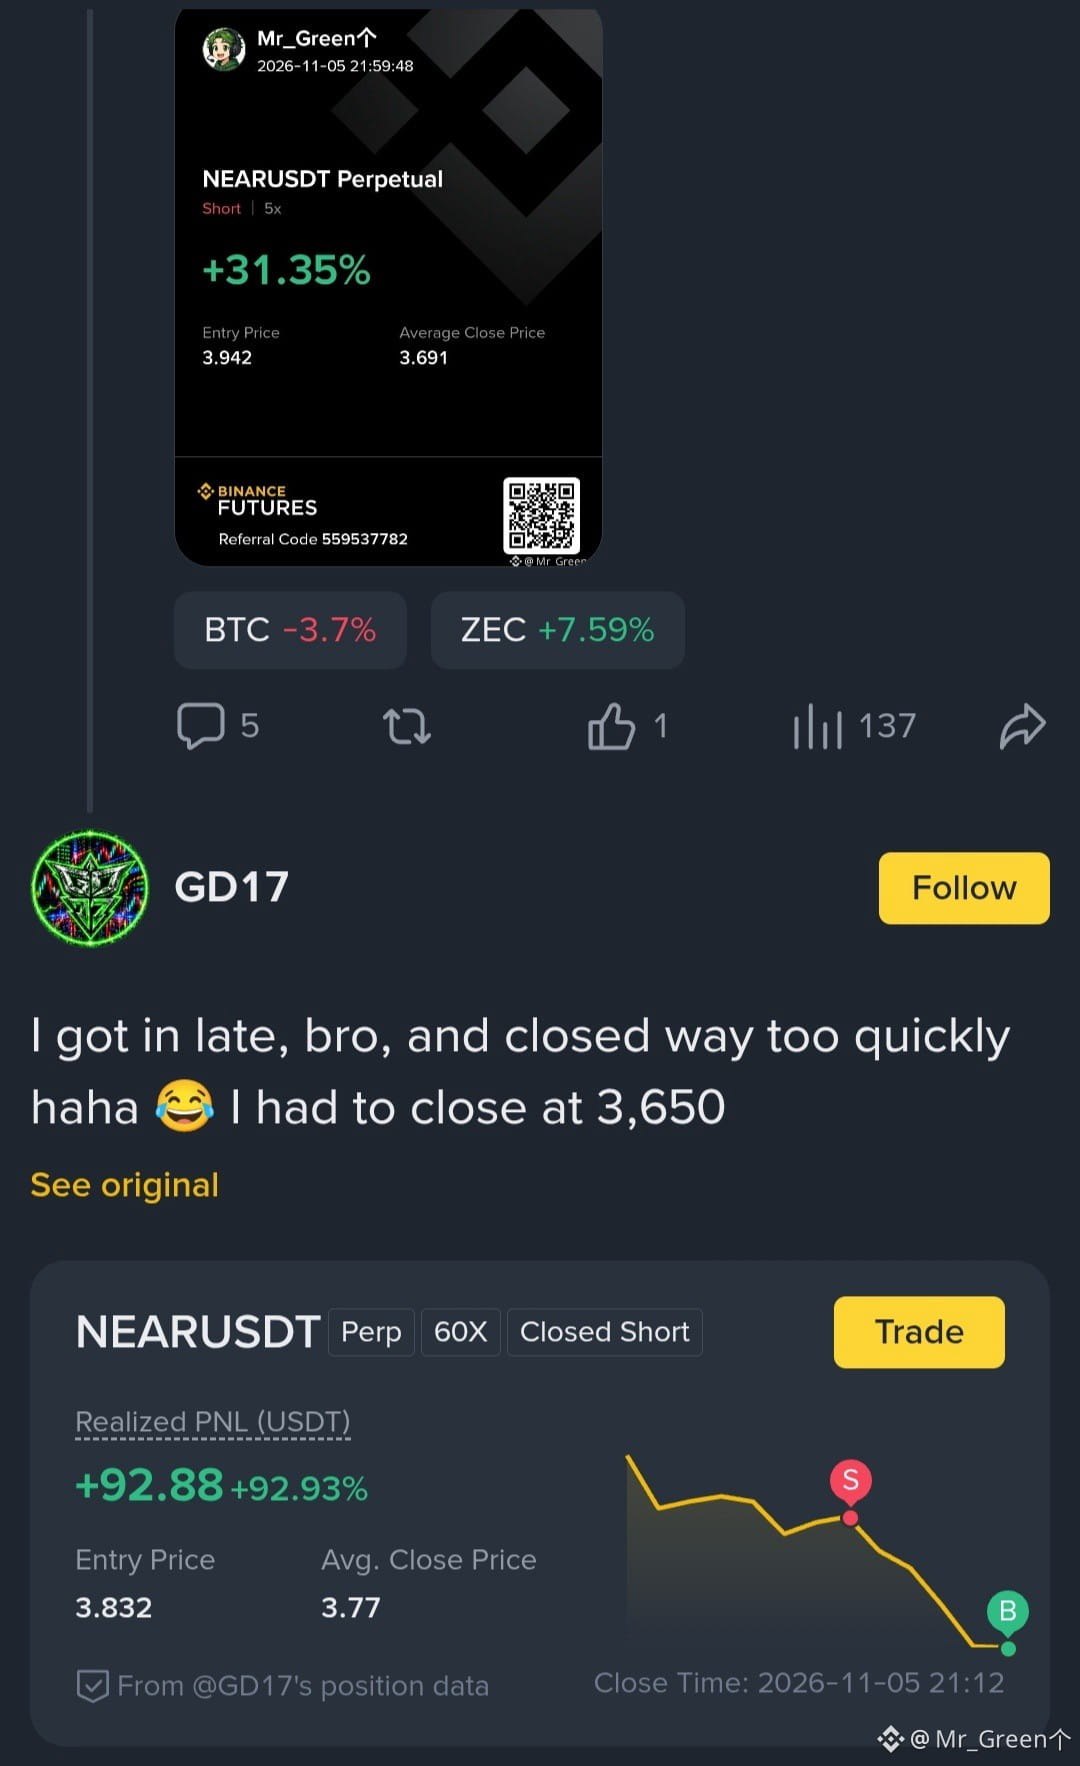
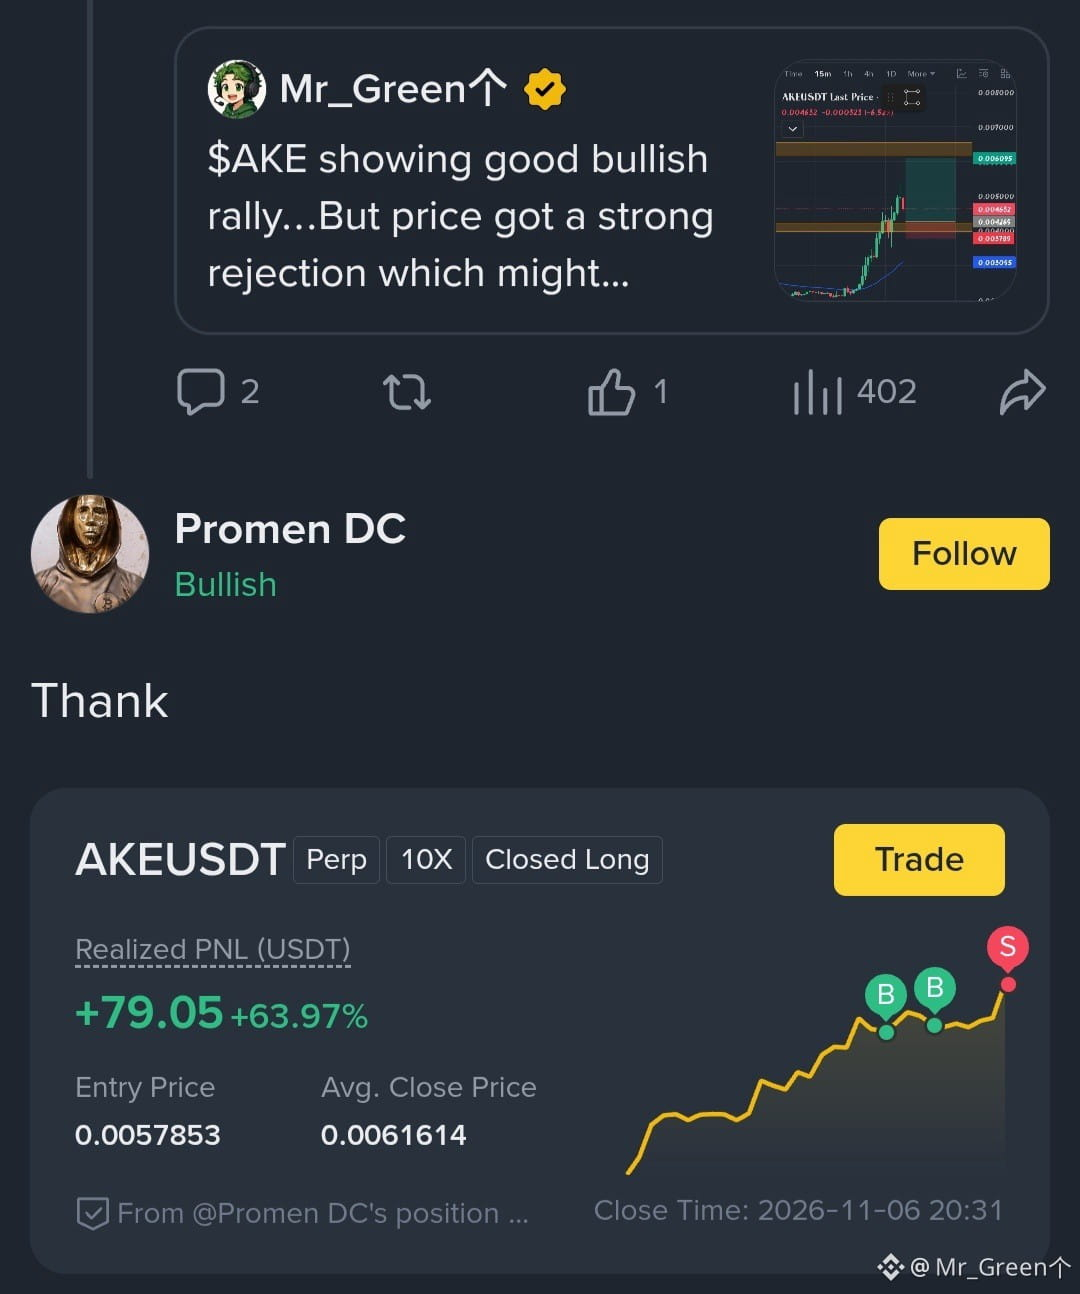
I really love you guys...when you make profit from my signals...
This is very inspiring for me...
Sometimes, our trades become invalid or you make loss...but you will not make loss if you enter in the correct time...
Never let your SL be bigger, so you need to enter on the right time....
Let's hope for the best...
$AKE $NEAR $ZEC
I really love you guys...when you make profit from my signals...
This is very inspiring for me...
Sometimes, our trades become invalid or you make loss...but you will not make loss if you enter in the correct time...
Never let your SL be bigger, so you need to enter on the right time....
Let's hope for the best...
$AKE $NEAR $ZEC
This is very inspiring for me...
Sometimes, our trades become invalid or you make loss...but you will not make loss if you enter in the correct time...
Never let your SL be bigger, so you need to enter on the right time....
Let's hope for the best...
$AKE $NEAR $ZEC
2
186
·
--
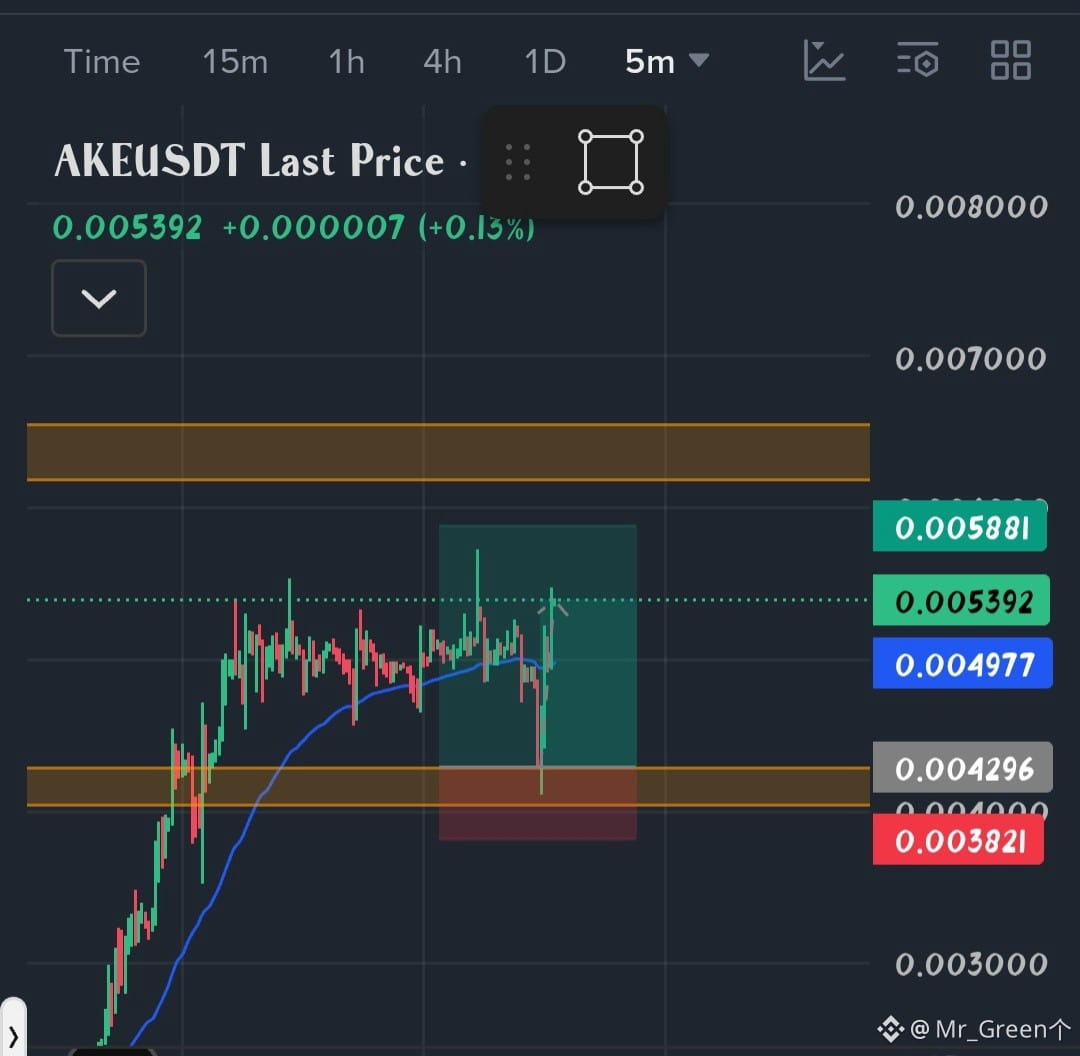
This was our $AKE signal in the morning...
Look at that...
This was our $AKE signal in the morning...
Look at that...
Look at that...
Mr_Green个
·
--
$AKE showing good bullish rally...But price got a strong rejection which might trigger a good number of selling....
I am hoping that price respect the support at 0.0042 zone...
If price hokds above that zone then, it will clea the road for 0.0056-0.0060
Now, it's upto you what you will do...
My suggestion is to go for a long from that support zone...
I am hoping that price respect the support at 0.0042 zone...
If price hokds above that zone then, it will clea the road for 0.0056-0.0060
Now, it's upto you what you will do...
My suggestion is to go for a long from that support zone...
2
1
520
Войдите, чтобы посмотреть больше материала
Присоединяйтесь к пользователям криптовалют по всему миру на Binance Square
⚡️ Получайте новейшую и полезную информацию о криптоактивах.
💬 Нам доверяет крупнейшая в мире криптобиржа.
👍 Получите достоверные аналитические данные от верифицированных создателей контента.
Эл. почта/номер телефона
В тренде
HotCPIDecemberHikePriced
Просмотров: 177,802
1,896 обсуждают
CPI Market Watch | US CPI Rises 0.4% in October, Hotter Than 0.3% Forecast
Binance News
·Лайков: 29
·Просмотров: 42.4k
StrategyFaces$2.8BSelloffRiskFromMSCIRemoval
Просмотров: 2,830
36 обсуждают
AnthropicRejectsIPODelayValuationinQuestion
Просмотров: 279,370
2,358 обсуждают