

Mek
1.1k Публикации

Mek
Отправить жалобу
Заблокировать пользователя
Trader Institutional, Entrepreneuer & Analyst since 2018 · Binance KOL & BNBChain Martian. Building at Web3 and Sovereign Infrastructure.
Трейдер с частыми сделками
5.4 г
47 подписок(и/а)
2.9K+ подписчиков(а)
1.9K+ понравилось
Посты
Все
Цитирования
Видео
Активно
·
--
O MAIOR movimento on-chain de 2026 aconteceu nessa quinta. 🚨
Quase US$ 18 bilhões em bitcoin mudaram de lugar em menos de meia hora.
Conferi as transações na blockchain.
Foram três, e em todas as moedas saíram de um endereço e voltaram para ele mesmo. Ninguém vendeu nada e nada foi para corretora.
O maior dos três endereços é o que a própria Tether divulgou como sua reserva de bitcoin.
Então a explicação mais provável é um teste de chaves.
A cada trimestre, quem guarda a reserva movimenta as moedas para provar que as chaves ainda funcionam. Os mesmos endereços fizeram isso em abril e em julho.
O detalhe é que mover cerca de US$ 8 bilhões custou menos de US$ 3 de taxa.
Um efeito colateral disso é que nos próximos dias, métricas como lucro realizado vão mostrar um pico que não aconteceu de verdade.
E principalmente métricas de STHs (investidores de curto prazo) também serão impactadas.
Só tenha cuidado com FUDs e informações incorretas.
328
·
--
Падение
APÓS MATAR URSOS, BITCOIN CAPTURA LIQUIDEZ DOS TOUROS 📉
Mais de US$200 milhões em posições compradas liquidadas em uma hora com o preço perdendo os US$80 mil.
As duas faixas inferiores que causaram o imã de queda que tivemos nas últimas horas foram construídas após o início da correção.
Trades colocaram posições numa região intermediária do range e foram pegos no contrapé.
Esse é o tipo de cenário de limpeza de mercado.
Agora entenderam porque abordei na semana passada que a receita da volatilidade estava montada com aumento no OI e crescimento da dominância de futuros.
Volatilidade bi-direcional. Esse é o cemitério dos traders.
Mas quem se posiciona pacientemente de forma estratégica olhando ciclo vai começar a pensar nesse tipo de movimento com uma boa janela de realocação.
A janela reabriu.
Você está prestando atenção?
Mek
·
--
📊 O Bitcoin consolida hoje em torno de US$ 81.550 após a rejeição clara dos máximos de US$ 84.875 no gráfico de 4 horas. O preço permanece comprimido entre o suporte imediato de US$ 81.000 e a resistência de US$ 82.300, com volume e open interest mostrando redução gradual após o movimento de queda.
No mapa de liquidez de 4 horas, as faixas mais densas de liquidação de posições compradas ficam abaixo do preço atual, concentradas em US$ 80.000, US$ 79.000 e US$ 78.000. Esses níveis formam zonas sucessivas de captura de stops de longs alavancados, com o fundo em US$ 78.000 alinhado a regiões onde fundos on-chain costumam absorver liquidez após varreduras mais profundas.
Acima, a liquidez de posições vendidas se concentra entre US$ 82.000 e US$ 82.800, alinhada às áreas de resistência intermediária antes do topo de US$ 84.875. O funding rate positivo em 0,009% indica que as posições compradas ainda pagam, enquanto as liquidações agregadas mostram pressão recente maior sobre shorts no curto prazo.
Esse range no 4 horas e no 2 horas forma um padrão de equal lows com possibilidade de varredura para baixo. A captura da liquidez em US$ 80.000, seguida de testes em US$ 79.000 e potencialmente US$ 78.000, limparia os stops de varejo e criaria o vácuo necessário para absorção institucional. Os fluxos on-chain tendem a se posicionar exatamente nesse fundo de US$ 78.000, antes de qualquer expansão.
Se o suporte for retestado com absorção e o preço recuperar acima de US$ 81.800 com volume, o cenário favorece a varredura da liquidez superior em direção a US$ 82.500–US$ 82.800 e posterior reteste da estrutura de US$ 84.000. A compressão atual e a ausência de distribuição ampla nos holders maiores sustentam o acúmulo seletivo pós-varredura. $BTC
1
140
·
--
94
·
--
📊 O Bitcoin consolida hoje em torno de US$ 81.550 após a rejeição clara dos máximos de US$ 84.875 no gráfico de 4 horas. O preço permanece comprimido entre o suporte imediato de US$ 81.000 e a resistência de US$ 82.300, com volume e open interest mostrando redução gradual após o movimento de queda.
No mapa de liquidez de 4 horas, as faixas mais densas de liquidação de posições compradas ficam abaixo do preço atual, concentradas em US$ 80.000, US$ 79.000 e US$ 78.000. Esses níveis formam zonas sucessivas de captura de stops de longs alavancados, com o fundo em US$ 78.000 alinhado a regiões onde fundos on-chain costumam absorver liquidez após varreduras mais profundas.
Acima, a liquidez de posições vendidas se concentra entre US$ 82.000 e US$ 82.800, alinhada às áreas de resistência intermediária antes do topo de US$ 84.875. O funding rate positivo em 0,009% indica que as posições compradas ainda pagam, enquanto as liquidações agregadas mostram pressão recente maior sobre shorts no curto prazo.
Esse range no 4 horas e no 2 horas forma um padrão de equal lows com possibilidade de varredura para baixo. A captura da liquidez em US$ 80.000, seguida de testes em US$ 79.000 e potencialmente US$ 78.000, limparia os stops de varejo e criaria o vácuo necessário para absorção institucional. Os fluxos on-chain tendem a se posicionar exatamente nesse fundo de US$ 78.000, antes de qualquer expansão.
Se o suporte for retestado com absorção e o preço recuperar acima de US$ 81.800 com volume, o cenário favorece a varredura da liquidez superior em direção a US$ 82.500–US$ 82.800 e posterior reteste da estrutura de US$ 84.000. A compressão atual e a ausência de distribuição ampla nos holders maiores sustentam o acúmulo seletivo pós-varredura. $BTC
1
1
75
·
--
Статья
Binance Pick Season 1 está ativo com prize pool de 1.000.000 USDCA temporada de previsão roda de 21 de outubro de 2026 00:00 UTC até 15 de novembro de 2026 23:59:59 UTC. Scores são pontos virtuais da campanha, sem valor monetário, não transferíveis e usados apenas para ranking e alocação de recompensas. Acertos em previsões aumentam o saldo de Scores.
O mecanismo é direto. Complete tarefas para gerar Scores (check-in diário, post no Square com #BinancePick e conteúdo relacionado à campanha, participação em mercados, e outras que aparecem conforme a região). Use esses Scores para entrar em mercados virtuais de Esports, Sports e Finance. Posições podem ser fechadas antes do settlement ou mantidas até o resultado. Previsão correta eleva os Scores. O ranking decide a fatia dos pools.
Os pools são três. Season Leaderboard: 500.000 USDC para os top 20.000 com Season Scores > 0. Weekly Leaderboard: 400.000 USDC no total (100.000 USDC por semana) para os top 8.000 com Weekly PnL positivo nas previsões feitas com Scores. Participation: 100.000 USDC para quem não entra nos leaderboards e completa pelo menos cinco check-ins (teto de 5 USDC por elegível). O tamanho final do pool principal foi desbloqueado com as reservas Early Bird.
Os mercados cobrem LoL Worlds (Gen.G, Invictus, G2, Dplus KIA e outros), NBA, Premier League, La Liga (incluindo Barcelona x Real Madrid) e Finance com perguntas de earnings (Microsoft, Visa e similares). Volume e odds são visíveis em tempo real. Tarefas diárias incluem check-in com bônus de streak e post no Square (mínimo 20 caracteres, hashtag #BinancePick, relacionado à campanha, reseta todo dia). Participar de mais mercados destrava Scores adicionais (marcos em 5, 10 e 20).
A campanha é powered by Predict.fun. Scores resetam no fim da temporada. Disponibilidade de tarefas e mercados varia por jurisdição e verificação de identidade. Acompanhe o leaderboard e o saldo diretamente na página da campanha.
Link de acesso: [https://app.binance.com/uni-qr/prophet?from=share&seasonId=prophet_1019_s1&ref=MEKCRYPTO](https://app.binance.com/uni-qr/prophet?from=share&seasonId=prophet_1019_s1&ref=MEKCRYPTO)
#BinancePick #EarningsSeason
Binance Pick Season 1 está ativo com prize pool de 1.000.000 USDC
A temporada de previsão roda de 21 de outubro de 2026 00:00 UTC até 15 de novembro de 2026 23:59:59 UTC. Scores são pontos virtuais da campanha, sem valor monetário, não transferíveis e usados apenas para ranking e alocação de recompensas. Acertos em previsões aumentam o saldo de Scores.
O mecanismo é direto. Complete tarefas para gerar Scores (check-in diário, post no Square com #BinancePick e conteúdo relacionado à campanha, participação em mercados, e outras que aparecem conforme a região). Use esses Scores para entrar em mercados virtuais de Esports, Sports e Finance. Posições podem ser fechadas antes do settlement ou mantidas até o resultado. Previsão correta eleva os Scores. O ranking decide a fatia dos pools.
Os pools são três. Season Leaderboard: 500.000 USDC para os top 20.000 com Season Scores > 0. Weekly Leaderboard: 400.000 USDC no total (100.000 USDC por semana) para os top 8.000 com Weekly PnL positivo nas previsões feitas com Scores. Participation: 100.000 USDC para quem não entra nos leaderboards e completa pelo menos cinco check-ins (teto de 5 USDC por elegível). O tamanho final do pool principal foi desbloqueado com as reservas Early Bird.
Os mercados cobrem LoL Worlds (Gen.G, Invictus, G2, Dplus KIA e outros), NBA, Premier League, La Liga (incluindo Barcelona x Real Madrid) e Finance com perguntas de earnings (Microsoft, Visa e similares). Volume e odds são visíveis em tempo real. Tarefas diárias incluem check-in com bônus de streak e post no Square (mínimo 20 caracteres, hashtag #BinancePick, relacionado à campanha, reseta todo dia). Participar de mais mercados destrava Scores adicionais (marcos em 5, 10 e 20).
A campanha é powered by Predict.fun. Scores resetam no fim da temporada. Disponibilidade de tarefas e mercados varia por jurisdição e verificação de identidade. Acompanhe o leaderboard e o saldo diretamente na página da campanha.
Link de acesso: https://app.binance.com/uni-qr/prophet?from=share&seasonId=prophet_1019_s1&ref=MEKCRYPTO
#BinancePick #EarningsSeason
1
401
·
--
Проверено
Tesla e Meta reportaram o 3T. A pergunta é a mesma: o gasto em IA está virando margem ou só queimando caixa?
$TSLA entregou 486.532 veículos, acima do consenso de 461.974. Receita ficou em US$ 28,05 bi, praticamente estável no ano. Margem bruta subiu para 19,6% (+160 bps a/a e bem acima dos 16,8% do 2T). Resultado operacional caiu 56% a/a, para US$ 718 mi, com opex de IA e Optimus crescendo mais rápido que o lucro bruto.
Armazenamento veio em 13,7 GWh, abaixo dos ~15,9 GWh esperados. Fluxo de caixa livre ficou positivo em US$ 1,53 bi (contra expectativa de queima forte). Capex 2026 foi guiado para cerca de US$ 20 bi.
$META receita de US$ 64,6 bi (+26% a/a). Encargo jurídico pontual de US$ 9,89 bi reduziu o resultado operacional em 37%. Capex de US$ 34,9 bi superou o fluxo de caixa operacional de US$ 32,8 bi e levou o FCF para negativo de cerca de US$ 2,1 bi. Guidance de capex 2026 ficou em US$ 135–145 bi.
O negócio central de ambos segura. O investimento em IA ainda não prova retorno claro na margem operacional da Tesla nem no caixa livre da Meta. O mercado não precifica o gasto. Precifica a evidência de retorno.
Não é recomendação de investimento.
#EarningsSeason #TSLA #META
{future}(TSLAUSDT)
{future}(METAUSDT)
Tesla e Meta reportaram o 3T. A pergunta é a mesma: o gasto em IA está virando margem ou só queimando caixa?
$TSLA entregou 486.532 veículos, acima do consenso de 461.974. Receita ficou em US$ 28,05 bi, praticamente estável no ano. Margem bruta subiu para 19,6% (+160 bps a/a e bem acima dos 16,8% do 2T). Resultado operacional caiu 56% a/a, para US$ 718 mi, com opex de IA e Optimus crescendo mais rápido que o lucro bruto.
Armazenamento veio em 13,7 GWh, abaixo dos ~15,9 GWh esperados. Fluxo de caixa livre ficou positivo em US$ 1,53 bi (contra expectativa de queima forte). Capex 2026 foi guiado para cerca de US$ 20 bi.
$META receita de US$ 64,6 bi (+26% a/a). Encargo jurídico pontual de US$ 9,89 bi reduziu o resultado operacional em 37%. Capex de US$ 34,9 bi superou o fluxo de caixa operacional de US$ 32,8 bi e levou o FCF para negativo de cerca de US$ 2,1 bi. Guidance de capex 2026 ficou em US$ 135–145 bi.
O negócio central de ambos segura. O investimento em IA ainda não prova retorno claro na margem operacional da Tesla nem no caixa livre da Meta. O mercado não precifica o gasto. Precifica a evidência de retorno.
Não é recomendação de investimento.
#EarningsSeason #TSLA #META
1
1.4k
·
--
Проверено
O Brasil já cobra imposto de país rico.
Só esqueceram de mandar a renda de país rico junto.
E o jeito de cobrar piora a conta.
Só em imposto sobre consumo, o Brasil arrecada mais, em % do PIB, do que França, Reino Unido e Alemanha.
É o imposto que vem embutido na gasolina, na conta de luz e no celular. A alíquota é a mesma pra quem ganha R$ 2 mil e pra quem ganha R$ 200 mil.
Na média da OCDE, o maior pedaço vem da renda.
Aqui, sai do preço do que você compra.
4
6
5.3k
·
--
O preço médio de aquisição via ETFs começa a se tornar uma métrica importante dentro do níveis on-chain.
Esse PM posicionado hoje em US$ 81.500 tem estabelecido o piso desse movimento corretivo.
Curiosamente, foi o topo do movimento local anterior.
Cada vez mais o fluxo via ETFs vai se tornar importante dentro do rastreamento on-chain.
Se marcarmos essa região como suporte de defesa compradora spot, a demanda deve sobrepor a oferta.
1
100
·
--
Tem gente grande comprando BTC 👀
Dominância compradora spot subiu para o maior nível desde 21 de setembro na microestrutura do order book.
Barra típica de rompimento, embora eu ainda ache que precisa sustentar acima dos $84k.
Ontem cogitei que a probabilidade dos ursos serem liquidados era a dominante.
Hoje, quase $200 MILHÕES em posições vendidas em cripto foram liquidadas.
Tá em dúvida do contexto? Dá uma lida na análise anterior. O movimento pode não ter terminado.
Mek
·
--
A RECEITA DA VOLATILIDADE NO BITCOIN 📊
Preço caindo com posições em aberto no mercado de futuros perpétuos é padrão típico de choques de volatilidade e capturas de liquidez.
É bem provável que nos próximos dias as zonas de liquidez se tornem mais efetivas, sinalizando regiões imãs de preço.
Na minha live de hoje mais tarde vou mostrar onde estão essas regiões de liquidações.
Trader que está posicionado aqui deveria ter mais atenção na mão e não deixar colateral baixo.
Caso o Funding siga caindo, a chance do preço começar a liquidar ursos deverá subir bastante.
E espero que você não tenha ficado esperando demais caso isso ocorra.
1
153
·
--
VENDAS DE CASAS NOS EUA NO MENOR NÍVEL DA HISTÓRIA.🚨
O índice de contratos assinados da NAR caiu de novo em setembro e ficou abaixo até do fundo da crise de 2008.
Olha o gráfico. O mercado imobiliário já vinha fraco desde 2022, quando o juro começou a subir.
A hipoteca de 30 anos voltou pro maior nível em quase 3 anos.
Quem tem financiamento barato não vende, e quem quer comprar não consegue pagar a parcela.
É nesse cenário que o mercado vai começar a perceber que o FED não possui muito espaço para subir juros.
Ou aceita inflação elevada, ou quebra alguma coisa. Qual dos dois será?
1
250
·
--
Um excelente dia a todos, conto com o voto de vocês abaixo para que possamos vencer. Leva menos de 30 segundos 🤝
[Vote aqui 🏆](https://www.binance.com/pt/square/profile/mek_)
Um excelente dia a todos, conto com o voto de vocês abaixo para que possamos vencer. Leva menos de 30 segundos 🤝
Vote aqui 🏆
Vote aqui 🏆
1
22
·
--
Рост
Проверено
ETF de Bitcoin da BlackRock registrou o MAIOR volume comprador de 2026.
E não foi só ontem. Desde maio, o IBIT tem saldo positivo, e os outros ETFs de bitcoin, somados, venderam.
O curioso é que o dinheiro não está saindo do bitcoin.
Está trocando de mão e indo parar na maior gestora do mundo.
A última vez que esse fluxo apertou assim, em agosto, o preço subiu quase 20% nas semanas seguintes.
Será que o padrão vai se repetir? $BTC
BTC-1,28%
IBITETF-1,99%
1
514
·
--
Рост
Проверено
$NIL Covenants: the first real answer to a structural flaw in on-chain markets
Every conditional order published on-chain exposes intent before execution. That is an information leak, and it has a cost.
Nillion's Covenants address it directly:
• Instructions sealed until their condition is met
• Nodes decrypt only when a live data feed confirms the trigger
• No keeper, no discretionary party deciding whether to act
• Settlement on Ethereum L1, with permissionless nodes staking NIL
Dusk, the first phase of the 7-era Encrypted Markets roadmap, is the foundation: cryptography, node network and developer tooling.
My read is structural, not speculative. Privacy-native execution is infrastructure, and infrastructure is judged by adoption, not by price action. Early-stage networks carry execution and adoption risk, so I am sizing accordingly.
Position shared below. Not financial advice. @nillionnetwork #NIL
$NIL Covenants: the first real answer to a structural flaw in on-chain markets
Every conditional order published on-chain exposes intent before execution. That is an information leak, and it has a cost.
Nillion's Covenants address it directly:
• Instructions sealed until their condition is met
• Nodes decrypt only when a live data feed confirms the trigger
• No keeper, no discretionary party deciding whether to act
• Settlement on Ethereum L1, with permissionless nodes staking NIL
Dusk, the first phase of the 7-era Encrypted Markets roadmap, is the foundation: cryptography, node network and developer tooling.
My read is structural, not speculative. Privacy-native execution is infrastructure, and infrastructure is judged by adoption, not by price action. Early-stage networks carry execution and adoption risk, so I am sizing accordingly.
Position shared below. Not financial advice. @Nillion #NIL
1
214
·
--
A RECEITA DA VOLATILIDADE NO BITCOIN 📊
Preço caindo com posições em aberto no mercado de futuros perpétuos é padrão típico de choques de volatilidade e capturas de liquidez.
É bem provável que nos próximos dias as zonas de liquidez se tornem mais efetivas, sinalizando regiões imãs de preço.
Na minha live de hoje mais tarde vou mostrar onde estão essas regiões de liquidações.
Trader que está posicionado aqui deveria ter mais atenção na mão e não deixar colateral baixo.
Caso o Funding siga caindo, a chance do preço começar a liquidar ursos deverá subir bastante.
E espero que você não tenha ficado esperando demais caso isso ocorra.
Mek
·
--
LIQUIDEZ DE FUTUROS VIRA DRIVER NO BITCOIN 📈
Após um período de dominância spot na ação de preço microestrutural, o padrão de liquidações no order book deve fazer o BTC seguir capturas de liquidez no curto prazo.
Hoje o preço está espremido entre três faixas.
Acima, uma concentração menor perto dos $84,5 mil e a mais densa do mapa, na região dos $87-88 mil, intacta desde o começo do mês.
Abaixo, a faixa logo sob os $80 mil, que o preço já tocou na mínima de $79,7 mil, mas sem limpar por completo.
É possível que nos próximos 3-5 dias essas regiões fiquem mais claras e o preço persiga o fechamento dessas ordens.
As faixas superiores poderão ser a de maior densidade e servirem como imã nesse caso.
1
1
122
·
--
O JPMORGAN colocou o BITCOIN na frente de ações e ouro pela primeira vez.
O braço de gestão do banco incluiu o BTC no relatório anual de retornos esperados para os próximos 10 a 15 anos, que já está na 31ª edição.
A projeção é de 10% ao ano, ACIMA de ações americanas, fundos imobiliários e ouro.
O mesmo banco cujo CEO já chamou o bitcoin de fraude agora está prevendo que seja o MELHOR ATIVO da PRÓXIMA DÉCADA.
E, sinceramente, 10% é MUITO conservador.
Nos últimos 10 anos, o bitcoin rendeu quase 63% ao ano.
Wall Street já decidiu que precisa se proteger do dinheiro fiat. E você, já começou a acumular ativos escassos?
1
141
·
--
Статья
I Asked an AI to Audit My BTC Thesis. Here Is What Held UpSix prompts, one thesis written before I started, and a verification table. Tested in the Binance app on October 16, 2026.
I did not ask Binance AI for a price prediction.
I asked it to audit mine.
My BTC read was already public on Binance Square before I opened the assistant. Then I asked Binance AI to read BTC independently, challenge my thesis, check derivatives, rank the macro drivers and show its sources.
Three findings:
What held up. Its levels matched my map. Its 30 day range of $75.1K to $87.4K sits on my swing low and swing high. Its description of a two sided deleveraging is consistent with the Coinglass liquidation data.What it challenged. It pushed back on my wording that liquidity pools act as support and resistance. Fair point.What it could not do. No live order book depth, no 24 hour open interest change, no dated macro quotes, and no chart upload at the time I tested.
Verdict: a fast and transparent second opinion. Not a data terminal.
The Premise
Most AI content in crypto is a feature tour. It teaches you nothing.
I wanted a harder question. Can Binance AI see something that a trader with a fully formed view might have missed?
So I used a rule I apply to analysts. Write the view first. Then test it. If you open the tool first, it anchors you.
On October 15, a day before this test, I published my liquidity map on Binance Square. Dense liquidation bands near $87K to $88K above price, and near $74K to $75K below.
Methodology
Feature tested. The Binance AI assistant, which answers open questions with AI generated analysis inside the app.
Platform. Binance mobile app. At the time of testing, Binance AI was not available on web or desktop.
Input. I tried to upload my TradingView and Coinglass screenshots. There was no image upload option, so I typed my thesis instead.
Baseline tools. TradingView for structure. Coinglass for liquidations and the heatmap.
Six prompts, in this order:
A. Give me your read on BTC right now: trend, key levels, and what is driving price today.B. Here is my read: [my thesis]. Where do you agree, where do you disagree, and what am I missing?C. What do Open Interest, funding, and the order book say about positioning and nearby liquidity?D. Which macro events and institutional flows matter most for BTC this week, and why?E. Which data sources and timestamps did you use for that answer?F. What was the 24h change in open interest and funding, and does it fit a short squeeze?
Verification. I checked what I could against my own screenshots. What I could not check, I say so.
My Pre-Registered Read
This is the thesis exactly as I typed it into the assistant:
BTC is at $82,000 after capturing liquidity yesterday below $80,000, following a period of nearly a month without dipping below that level.Today, a more pronounced liquidity capture occurred above. In the last 24h, a bit more than $180M was liquidated in short positions, totaling $335M when combining long positions.Yesterday's capture closed the gap of many open stops, in a long squeeze movement. Now the largest open liquidity ranges are above $87,500 and at $75,000.These regions should be the main supports and resistances, as new liquidity zones are expected to emerge amid these capture movements.
On the daily chart, I measured the retracement from the $87,365 swing high to the $75,100 swing low. The 0.618 level sits at $79,785. That is where the sweep happened.
The Baseline Read
Prompt A. No thesis, no hints.
Binance AI put BTC near $82,430 and called the short term picture neutral to soft. Price was just below the 7 day average ($82.59K) and the 25 day average ($83.87K). MACD was bearish after a death cross 17 daily bars earlier. RSI(6) read 45.5. SuperTrend stayed positive near $79.66K. Volume was about 0.63x its 7 day average, and large order flow showed a net outflow.
Its conclusion: a modest rebound inside a range, not a breakout.
My read was about liquidity mechanics. Its read was about indicators and participation. Different lenses. Same range. Same support area near $80K.
Then I compared the maps:
Its 7 day low near $79.8K sits on my 0.618 retracement at $79,785.Its 30 day range of $75.1K to $87.4K sits on my swing low and high, $75,100 and $87,365.Its $82.6K zone sits near my 0.382 at $82,680.Its $84.35K zone sits near my 0.236 at $84,471.
It used moving averages and SuperTrend. I used swing structure. Both arrived at the same map.
The Thesis Audit
Prompt B. This is where I wanted the pushback.
Where it agreed. The sweep below $80K mattered. The 7 day low was about $79.8K and price reclaimed $80K afterward. It also agreed that $87.5K and $75K are meaningful outer magnets, because they align with the 30 day high and low.
Where it qualified. Three points:
Liquidation zones are not automatic support or resistance. They attract price. What actually holds or rejects price is acceptance, spot volume and positioning.The recovery was only partly resolved. Price was still below the 7 and 25 day averages, and the daily MACD was still bearish.The squeeze may be turning into fresh long exposure. 61.8% of accounts were long, top traders were 59.6% long by position value, funding was positive and open interest was rising.
What it added. A price versus open interest matrix:
Rising price with rising OI points to new leveraged longs.Rising price with falling OI is more consistent with short covering.Falling price with rising OI suggests fresh shorts.Falling price with falling OI suggests deleveraging near exhaustion.
Its synthesis: a broad range from $75K to $87.5K, with a tighter actionable structure from $79.8K to $84.35K.
My reaction. The first point was the sharpest. In my public posts I call these zones magnets. In the prompt, I wrote support and resistance. Those are different claims. A magnet pulls price. A level holds it. The assistant caught the looser wording. That is exactly what I wanted from a second opinion.
What the data says. The assistant never cited liquidation data. It described a two sided deleveraging from price structure and positioning. Coinglass supports that description. Over 24 hours, $151.69M of longs and $183.98M of shorts were liquidated, $335.67M in total across 80,879 traders. In the last hour, $37.12M of the $40.65M liquidated were shorts, about 91%.
One caveat. That panel covers the whole crypto market, not only BTC. The largest single order was ETHUSDT.
Derivatives and Liquidity
Prompts C and F.
On prompt C, Binance AI reported open interest up 1.08% in the last hour, funding at +0.0068% with the next rate at +0.0032%, and a net long tilt in account ratios. Its read: mildly crowded long, not extreme.
Then came the line that matters most for anyone who trades liquidity:
I don't have a live depth snapshot in this feed, so I can't claim exact resting bid and ask walls.
I respect that. It did not invent an order book. But it also means the liquidity map it gave me came from price structure, not from the book and not from a heatmap.
My heatmap shows the difference. Dense bands near $87.5K to $88K and $74K to $75K. And a dense band near $80K to $80.5K that built from late September until price wicked into it on October 15.
On prompt F, I asked directly for the 24 hour change in open interest. The assistant said its data feed does not provide it, so it could not state a verified figure. Its read: a rebound that may have started with short covering, now joined by fresh leveraged participation.
That fits the liquidation data. The last hour was driven by shorts. But without the 24 hour OI change, the full squeeze sequence cannot be confirmed from inside the tool.
I would rather have an honest "I don't have this" than a confident guess.
Macro and Institutional Flows
Prompt D.
Binance AI ranked four drivers: US rates and the dollar, spot Bitcoin ETF flows, futures positioning, and the cross asset risk tone across equities, credit, gold and oil. It listed the next FOMC decision for October 27 to 28 and gave three scenarios for what would change its read.
It also cited ETF flows from public trackers: a $261.4M net outflow on October 14 and a $5.06M net inflow on October 15.
TradingView's ETF overview shows IBIT at $65.63B in AUM, FBTC at $14.5B, GBTC at $10.3B, the Grayscale mini fund at $5.16B and BITB at $3.05B. All five were slightly negative on the session, and relative volume sat between 0.22 and 0.41 when I captured it.
That does not confirm the daily flow figures. This tab shows AUM and relative volume, not net flows. Treat the two flow numbers as the assistant's reported figures from public trackers, which the assistant itself said were not verified against issuer data.
My assessment. Good framework. Thin data. And one miss.
The assistant asked whether the recent easing in Treasury yields and the dollar would persist. It did not give a dated quote for either. It also did not mention CPI or PPI. Both surprised to the upside this week. CPI printed 3.7% year on year against 3.6% expected (BLS, October 14). PPI printed 6.3% year on year against 5.3% expected (BLS, October 15). I covered both on Binance Square.
For a question about this week's macro drivers, those two prints are the main event.
The Source Audit
Prompt E.
I asked what data sources and timestamps it used. The assistant listed:
The Federal Reserve calendar, accessed October 16.US Treasury yield curve data as context, with no intraday yield quoted.Public Bitcoin ETF flow trackers, for the October 14 and 15 figures.Binance BTCUSDT derivatives data, queried during the response.
Then it listed what it did not have: no timestamped quote for the dollar index, equities, credit spreads, gold or oil, and no verification of the ETF figures against issuer publications.
This is the habit I want from any research tool. It names what it used, what it did not use, and where the data is secondhand.
One note. It did not volunteer this. I had to ask.
Verification Table
BTC support, 7 day low near $79.8K
Check: TradingView daily, 0.618 retracement at $79,785.Result: Matched.
30 day range, $75.1K to $87.4K
Check: TradingView swing points $75,099.56 and $87,365.47. Binance perp heatmap high $87,385.1 and low $74,909.4.Result: Matched, within about $200 across venues.
Overhead zones, $82.6K and $84.35K
Check: 0.382 at $82,680 and 0.236 at $84,471.Result: Close, within about $120.
Two sided deleveraging
Check: Coinglass 24h, $151.69M longs and $183.98M shorts.Result: Consistent. The assistant inferred it and did not cite liquidation data.
Outer liquidity at $87.5K and $75K
Check: Heatmap bands near $87.5K to $88K and $74K to $75K.Result: Matched. The assistant reached these through range extremes, not through a heatmap.
Funding, 1 hour OI change, long share of accounts
Check: Not independently captured in this test.Result: Unverified. Reported by the assistant from Binance derivatives data.
24 hour open interest change
Result: Not provided by the assistant.
ETF net flows, October 14 and 15
Check: TradingView overview shows AUM and relative volume, not flows.Result: Unverified. The assistant flagged them as tracker figures.
Recent easing in yields and the dollar
Check: No dated quote provided. CPI and PPI both surprised higher this week.Result: Unverified. Treat with caution.
Scorecard
My assessment, on this test only.
Relevance: 4 out of 5. It stayed on BTC and on my question.Accuracy on what I could check: 4 out of 5. Levels and liquidation framing matched.Depth: 3 out of 5. No order book depth, no 24 hour OI, thin macro numbers.Time saved: 4 out of 5. A structured second opinion across structure, derivatives and macro without opening five tabs.Transparency: 4 out of 5. Sources and gaps disclosed. Not volunteered.
What Worked, What Did Not
What worked
It disagreed with me, specifically and usefully.Its levels converged with an independent method.It admitted gaps instead of filling them.Every answer carried a clear disclaimer.
What did not
No chart or image input at the time of testing.No live order book depth or liquidation heatmap.No 24 hour open interest change.The macro answer had no dated quotes and skipped the week's CPI and PPI.The baselines for daily change differed. Prompt A reported about +1.4% against a $81,304 open. Later answers reported +0.1% to +0.18% since 00:00 UTC. One label would remove the confusion.
Product Feedback
Image upload for charts and heatmaps. The comparison I wanted needs it.Order book depth and liquidation data inside the derivatives answer.The 24 hour OI change next to the hourly figure.A fixed timestamp and baseline on every number.Inline sources on the first answer, not only when asked.Dated macro quotes and the week's economic calendar, including CPI and PPI.Web and desktop availability. Serious analysis happens on a large screen.
Where Binance AI Fits in a Trader's Workflow
Think of it as a second analyst who reads fast, speaks plainly and admits what he has not seen.
It is not a terminal. It does not replace TradingView, Coinglass or your own judgment.
Before a session, it is a cheap way to find the hole in your thesis. As a source of truth, it is a risk.
Price goes where the orders are, not where the narrative is. Today Binance AI shows you structure and positioning. The order book and the heatmap are the missing pieces.
Try It Yourself
Open the Binance app on mobile and find Binance AI.Write your own read first. Save it with a timestamp.Ask for an independent read of the same asset.Paste your thesis. Ask where it agrees, where it disagrees and what you are missing.Ask about derivatives and the macro drivers.Ask for sources and timestamps.Check three numbers on your own tools.
Use the six prompts from the Methodology section.
Try it yourself. Write your read first. Then ask Binance AI to challenge it. Tell me what it caught that you missed.
Official Binance AI guide:
[https://www.binance.com/en/blog/ecosystem/5585027824672566322](https://www.binance.com/en/blog/ecosystem/5585027824672566322)
Availability depends on your region. Binance AI provides information and context. It does not replace your own research or judgment. Nothing in this article is investment advice or a trade recommendation.
@Binance
I Asked an AI to Audit My BTC Thesis. Here Is What Held Up
Six prompts, one thesis written before I started, and a verification table. Tested in the Binance app on October 16, 2026.
I did not ask Binance AI for a price prediction.
I asked it to audit mine.
My BTC read was already public on Binance Square before I opened the assistant. Then I asked Binance AI to read BTC independently, challenge my thesis, check derivatives, rank the macro drivers and show its sources.
Three findings:
What held up. Its levels matched my map. Its 30 day range of $75.1K to $87.4K sits on my swing low and swing high. Its description of a two sided deleveraging is consistent with the Coinglass liquidation data.What it challenged. It pushed back on my wording that liquidity pools act as support and resistance. Fair point.What it could not do. No live order book depth, no 24 hour open interest change, no dated macro quotes, and no chart upload at the time I tested.
Verdict: a fast and transparent second opinion. Not a data terminal.
The Premise
Most AI content in crypto is a feature tour. It teaches you nothing.
I wanted a harder question. Can Binance AI see something that a trader with a fully formed view might have missed?
So I used a rule I apply to analysts. Write the view first. Then test it. If you open the tool first, it anchors you.
On October 15, a day before this test, I published my liquidity map on Binance Square. Dense liquidation bands near $87K to $88K above price, and near $74K to $75K below.
Methodology
Feature tested. The Binance AI assistant, which answers open questions with AI generated analysis inside the app.
Platform. Binance mobile app. At the time of testing, Binance AI was not available on web or desktop.
Input. I tried to upload my TradingView and Coinglass screenshots. There was no image upload option, so I typed my thesis instead.
Baseline tools. TradingView for structure. Coinglass for liquidations and the heatmap.
Six prompts, in this order:
A. Give me your read on BTC right now: trend, key levels, and what is driving price today.B. Here is my read: [my thesis]. Where do you agree, where do you disagree, and what am I missing?C. What do Open Interest, funding, and the order book say about positioning and nearby liquidity?D. Which macro events and institutional flows matter most for BTC this week, and why?E. Which data sources and timestamps did you use for that answer?F. What was the 24h change in open interest and funding, and does it fit a short squeeze?
Verification. I checked what I could against my own screenshots. What I could not check, I say so.
My Pre-Registered Read
This is the thesis exactly as I typed it into the assistant:
BTC is at $82,000 after capturing liquidity yesterday below $80,000, following a period of nearly a month without dipping below that level.Today, a more pronounced liquidity capture occurred above. In the last 24h, a bit more than $180M was liquidated in short positions, totaling $335M when combining long positions.Yesterday's capture closed the gap of many open stops, in a long squeeze movement. Now the largest open liquidity ranges are above $87,500 and at $75,000.These regions should be the main supports and resistances, as new liquidity zones are expected to emerge amid these capture movements.
On the daily chart, I measured the retracement from the $87,365 swing high to the $75,100 swing low. The 0.618 level sits at $79,785. That is where the sweep happened.
The Baseline Read
Prompt A. No thesis, no hints.
Binance AI put BTC near $82,430 and called the short term picture neutral to soft. Price was just below the 7 day average ($82.59K) and the 25 day average ($83.87K). MACD was bearish after a death cross 17 daily bars earlier. RSI(6) read 45.5. SuperTrend stayed positive near $79.66K. Volume was about 0.63x its 7 day average, and large order flow showed a net outflow.
Its conclusion: a modest rebound inside a range, not a breakout.
My read was about liquidity mechanics. Its read was about indicators and participation. Different lenses. Same range. Same support area near $80K.
Then I compared the maps:
Its 7 day low near $79.8K sits on my 0.618 retracement at $79,785.Its 30 day range of $75.1K to $87.4K sits on my swing low and high, $75,100 and $87,365.Its $82.6K zone sits near my 0.382 at $82,680.Its $84.35K zone sits near my 0.236 at $84,471.
It used moving averages and SuperTrend. I used swing structure. Both arrived at the same map.
The Thesis Audit
Prompt B. This is where I wanted the pushback.
Where it agreed. The sweep below $80K mattered. The 7 day low was about $79.8K and price reclaimed $80K afterward. It also agreed that $87.5K and $75K are meaningful outer magnets, because they align with the 30 day high and low.
Where it qualified. Three points:
Liquidation zones are not automatic support or resistance. They attract price. What actually holds or rejects price is acceptance, spot volume and positioning.The recovery was only partly resolved. Price was still below the 7 and 25 day averages, and the daily MACD was still bearish.The squeeze may be turning into fresh long exposure. 61.8% of accounts were long, top traders were 59.6% long by position value, funding was positive and open interest was rising.
What it added. A price versus open interest matrix:
Rising price with rising OI points to new leveraged longs.Rising price with falling OI is more consistent with short covering.Falling price with rising OI suggests fresh shorts.Falling price with falling OI suggests deleveraging near exhaustion.
Its synthesis: a broad range from $75K to $87.5K, with a tighter actionable structure from $79.8K to $84.35K.
My reaction. The first point was the sharpest. In my public posts I call these zones magnets. In the prompt, I wrote support and resistance. Those are different claims. A magnet pulls price. A level holds it. The assistant caught the looser wording. That is exactly what I wanted from a second opinion.
What the data says. The assistant never cited liquidation data. It described a two sided deleveraging from price structure and positioning. Coinglass supports that description. Over 24 hours, $151.69M of longs and $183.98M of shorts were liquidated, $335.67M in total across 80,879 traders. In the last hour, $37.12M of the $40.65M liquidated were shorts, about 91%.
One caveat. That panel covers the whole crypto market, not only BTC. The largest single order was ETHUSDT.
Derivatives and Liquidity
Prompts C and F.
On prompt C, Binance AI reported open interest up 1.08% in the last hour, funding at +0.0068% with the next rate at +0.0032%, and a net long tilt in account ratios. Its read: mildly crowded long, not extreme.
Then came the line that matters most for anyone who trades liquidity:
I don't have a live depth snapshot in this feed, so I can't claim exact resting bid and ask walls.
I respect that. It did not invent an order book. But it also means the liquidity map it gave me came from price structure, not from the book and not from a heatmap.
My heatmap shows the difference. Dense bands near $87.5K to $88K and $74K to $75K. And a dense band near $80K to $80.5K that built from late September until price wicked into it on October 15.
On prompt F, I asked directly for the 24 hour change in open interest. The assistant said its data feed does not provide it, so it could not state a verified figure. Its read: a rebound that may have started with short covering, now joined by fresh leveraged participation.
That fits the liquidation data. The last hour was driven by shorts. But without the 24 hour OI change, the full squeeze sequence cannot be confirmed from inside the tool.
I would rather have an honest "I don't have this" than a confident guess.
Macro and Institutional Flows
Prompt D.
Binance AI ranked four drivers: US rates and the dollar, spot Bitcoin ETF flows, futures positioning, and the cross asset risk tone across equities, credit, gold and oil. It listed the next FOMC decision for October 27 to 28 and gave three scenarios for what would change its read.
It also cited ETF flows from public trackers: a $261.4M net outflow on October 14 and a $5.06M net inflow on October 15.
TradingView's ETF overview shows IBIT at $65.63B in AUM, FBTC at $14.5B, GBTC at $10.3B, the Grayscale mini fund at $5.16B and BITB at $3.05B. All five were slightly negative on the session, and relative volume sat between 0.22 and 0.41 when I captured it.
That does not confirm the daily flow figures. This tab shows AUM and relative volume, not net flows. Treat the two flow numbers as the assistant's reported figures from public trackers, which the assistant itself said were not verified against issuer data.
My assessment. Good framework. Thin data. And one miss.
The assistant asked whether the recent easing in Treasury yields and the dollar would persist. It did not give a dated quote for either. It also did not mention CPI or PPI. Both surprised to the upside this week. CPI printed 3.7% year on year against 3.6% expected (BLS, October 14). PPI printed 6.3% year on year against 5.3% expected (BLS, October 15). I covered both on Binance Square.
For a question about this week's macro drivers, those two prints are the main event.
The Source Audit
Prompt E.
I asked what data sources and timestamps it used. The assistant listed:
The Federal Reserve calendar, accessed October 16.US Treasury yield curve data as context, with no intraday yield quoted.Public Bitcoin ETF flow trackers, for the October 14 and 15 figures.Binance BTCUSDT derivatives data, queried during the response.
Then it listed what it did not have: no timestamped quote for the dollar index, equities, credit spreads, gold or oil, and no verification of the ETF figures against issuer publications.
This is the habit I want from any research tool. It names what it used, what it did not use, and where the data is secondhand.
One note. It did not volunteer this. I had to ask.
Verification Table
BTC support, 7 day low near $79.8K
Check: TradingView daily, 0.618 retracement at $79,785.Result: Matched.
30 day range, $75.1K to $87.4K
Check: TradingView swing points $75,099.56 and $87,365.47. Binance perp heatmap high $87,385.1 and low $74,909.4.Result: Matched, within about $200 across venues.
Overhead zones, $82.6K and $84.35K
Check: 0.382 at $82,680 and 0.236 at $84,471.Result: Close, within about $120.
Two sided deleveraging
Check: Coinglass 24h, $151.69M longs and $183.98M shorts.Result: Consistent. The assistant inferred it and did not cite liquidation data.
Outer liquidity at $87.5K and $75K
Check: Heatmap bands near $87.5K to $88K and $74K to $75K.Result: Matched. The assistant reached these through range extremes, not through a heatmap.
Funding, 1 hour OI change, long share of accounts
Check: Not independently captured in this test.Result: Unverified. Reported by the assistant from Binance derivatives data.
24 hour open interest change
Result: Not provided by the assistant.
ETF net flows, October 14 and 15
Check: TradingView overview shows AUM and relative volume, not flows.Result: Unverified. The assistant flagged them as tracker figures.
Recent easing in yields and the dollar
Check: No dated quote provided. CPI and PPI both surprised higher this week.Result: Unverified. Treat with caution.
Scorecard
My assessment, on this test only.
Relevance: 4 out of 5. It stayed on BTC and on my question.Accuracy on what I could check: 4 out of 5. Levels and liquidation framing matched.Depth: 3 out of 5. No order book depth, no 24 hour OI, thin macro numbers.Time saved: 4 out of 5. A structured second opinion across structure, derivatives and macro without opening five tabs.Transparency: 4 out of 5. Sources and gaps disclosed. Not volunteered.
What Worked, What Did Not
What worked
It disagreed with me, specifically and usefully.Its levels converged with an independent method.It admitted gaps instead of filling them.Every answer carried a clear disclaimer.
What did not
No chart or image input at the time of testing.No live order book depth or liquidation heatmap.No 24 hour open interest change.The macro answer had no dated quotes and skipped the week's CPI and PPI.The baselines for daily change differed. Prompt A reported about +1.4% against a $81,304 open. Later answers reported +0.1% to +0.18% since 00:00 UTC. One label would remove the confusion.
Product Feedback
Image upload for charts and heatmaps. The comparison I wanted needs it.Order book depth and liquidation data inside the derivatives answer.The 24 hour OI change next to the hourly figure.A fixed timestamp and baseline on every number.Inline sources on the first answer, not only when asked.Dated macro quotes and the week's economic calendar, including CPI and PPI.Web and desktop availability. Serious analysis happens on a large screen.
Where Binance AI Fits in a Trader's Workflow
Think of it as a second analyst who reads fast, speaks plainly and admits what he has not seen.
It is not a terminal. It does not replace TradingView, Coinglass or your own judgment.
Before a session, it is a cheap way to find the hole in your thesis. As a source of truth, it is a risk.
Price goes where the orders are, not where the narrative is. Today Binance AI shows you structure and positioning. The order book and the heatmap are the missing pieces.
Try It Yourself
Open the Binance app on mobile and find Binance AI.Write your own read first. Save it with a timestamp.Ask for an independent read of the same asset.Paste your thesis. Ask where it agrees, where it disagrees and what you are missing.Ask about derivatives and the macro drivers.Ask for sources and timestamps.Check three numbers on your own tools.
Use the six prompts from the Methodology section.
Try it yourself. Write your read first. Then ask Binance AI to challenge it. Tell me what it caught that you missed.
Official Binance AI guide:
https://www.binance.com/en/blog/ecosystem/5585027824672566322
Availability depends on your region. Binance AI provides information and context. It does not replace your own research or judgment. Nothing in this article is investment advice or a trade recommendation.
@Binance
1
27
·
--
A BNB Chain agora detém US$ 1,47 bilhão em ações tokenizadas, 42,59% do mercado e mais do que a soma dos US$ 730,43 milhões do Ethereum e dos US$ 489,72 milhões da Solana.
De 35,55% do mercado para 42,59% (US$ 1,47 bilhão) em apenas 30 dias.
Ações tokenizadas estão crescendo rapidamente na @BNB_Chain .
Source: MSB Intel
A BNB Chain agora detém US$ 1,47 bilhão em ações tokenizadas, 42,59% do mercado e mais do que a soma dos US$ 730,43 milhões do Ethereum e dos US$ 489,72 milhões da Solana.
De 35,55% do mercado para 42,59% (US$ 1,47 bilhão) em apenas 30 dias.
Ações tokenizadas estão crescendo rapidamente na @BNB Chain .
Source: MSB Intel
De 35,55% do mercado para 42,59% (US$ 1,47 bilhão) em apenas 30 dias.
Ações tokenizadas estão crescendo rapidamente na @BNB Chain .
Source: MSB Intel
2
1.2k
·
--
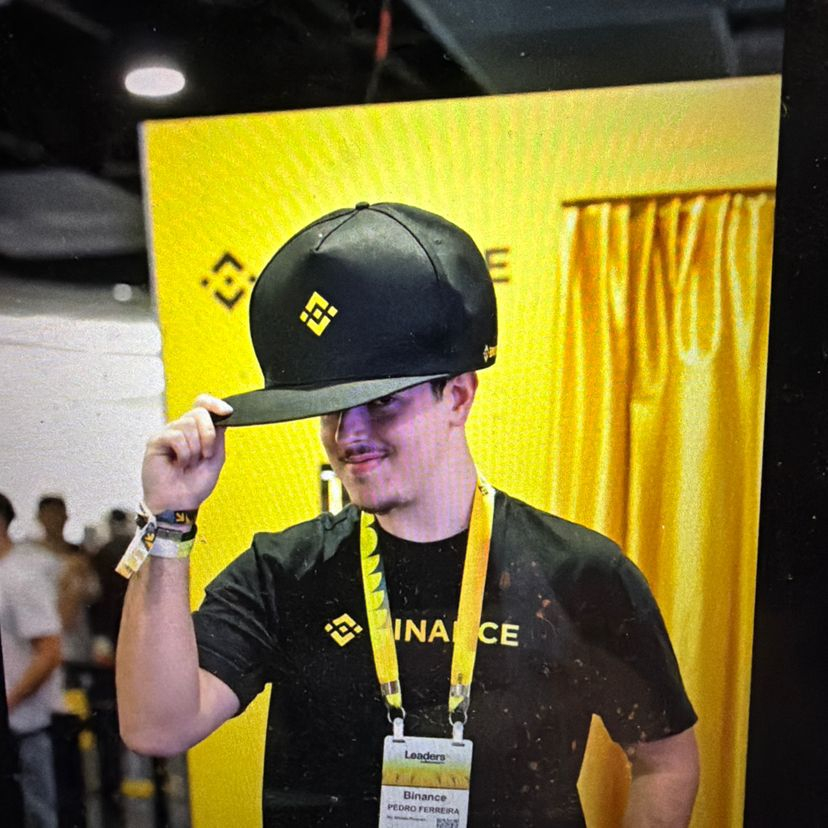
Grande honra representar o Brasil no Blockchain 100 Awards, vamos pra cima!
🏆🇧🇷 Acesse meu perfil e vote para a categoria Estrela em Ascensão!
Grande honra representar o Brasil no Blockchain 100 Awards, vamos pra cima!
🏆🇧🇷 Acesse meu perfil e vote para a categoria Estrela em Ascensão!
🏆🇧🇷 Acesse meu perfil e vote para a categoria Estrela em Ascensão!
Pedro Bonis
·
--
🏆🇧🇷 BLOCKCHAIN 100 AWARDS 2026 — CONHEÇA OS BRASILEIROS NA DISPUTA!
Você já conhece o Blockchain 100?
A premiação global promovida pela Binance reconhece 100 criadores de conteúdo que contribuem para o mercado financeiro e cripto por meio de educação, análises, informação e conteúdo de qualidade.
🌎 A iniciativa reúne criadores do mundo todo em cinco categorias, reconhecendo desde traders e grandes influenciadores até streamers, produtores de conteúdo e novos talentos.
🇧🇷 E o Brasil também está representado!
Confira os 13 criadores brasileiros que estão participando desta edição, em ordem alfabética:
• @Deividi Guedes
• @Diego Bechara
• @diogomury
• @Dicas de Cripto
• @eduardofeldberg
• Flávia Jabur
• @bitdasminas
• Igor Freitas
• @Jana Crypto Queen
• @Mek
• @Sávio Investe
• @Valéria Garcia
• @Vinicius Velasque
🗳️ As votações já estão abertas!
Até 28 de outubro, usuários da Binance com identidade verificada podem votar nos seus criadores favoritos, com até cinco votos por dia, respeitando o limite de um voto por categoria.
🏆 Os vencedores serão anunciados em 29 de outubro
🔗 Confira os indicados e participe da votação:
https://www.binance.com/pt/square/blockchain-100-2026
Vamos valorizar os brasileiros que contribuem para a educação financeira e o crescimento do ecossistema cripto! 🚀
#Blockchain100 #Binance #Crypto #Brasil #BinanceSquare
1
9
·
--
De 4 de junho para cá tivemos cerca de 137 dias no bitcoin e uma alta de quase 40%.
Mas o curioso é que essa alta foi entregue em cerca de 8 dias.
Ou seja, o trader que ficou tentando acertar o dia certo de comprar provavelmente ficou de fora.
Ficar bem posicionado bate acertar timing.
E investidor paciente tende a vencer do trader apressadinho.
Você ainda tenta acertar cada topo e fundo ou já aprendeu a negociar como "gente grande"?
2
117
·
--
Сомнительно
Um dos MAIORES investidores do mundo está apostando no COLAPSO da moeda fiat. 📈
87% da carteira revelada do family office do Ray Dalio está em ouro.
O resto? Um pouco de título do Tesouro, um pouco de ação e quase nada mais.
É literalmente o que aparece no 13F do segundo trimestre.
Ele está mostrando com seu dinheiro onde o real risco está: no papel colorido do Estado.
87% da carteira revelada do family office do Ray Dalio está em ouro.
O resto? Um pouco de título do Tesouro, um pouco de ação e quase nada mais.
É literalmente o que aparece no 13F do segundo trimestre.
Ele está mostrando com seu dinheiro onde o real risco está: no papel colorido do Estado.
1
542
Войдите, чтобы посмотреть больше материала
Присоединяйтесь к пользователям криптовалют по всему миру на Binance Square
⚡️ Получайте новейшую и полезную информацию о криптоактивах.
💬 Нам доверяет крупнейшая в мире криптобиржа.
👍 Получите достоверные аналитические данные от верифицированных создателей контента.
Эл. почта/номер телефона