
LiqMap
335 Публикации

LiqMap
Отправить жалобу
Заблокировать пользователя
0 подписок(и/а)
211 подписчиков(а)
432 понравилось
Посты
·
--
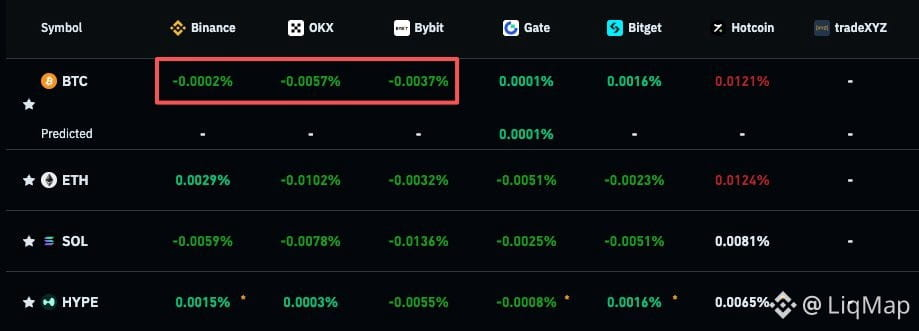
Funding just flipped negative 🧐
Shorts are now paying longs. Market's leaning bearish on leverage but price hasn't dumped yet — classic squeeze setup if we hold support. Watch for a short liquidation cascade if buyers step in here.
Derivatives saying one thing, price saying another. When funding goes negative but price holds, that's usually fuel.
Funding just flipped negative 🧐
Shorts are now paying longs. Market's leaning bearish on leverage but price hasn't dumped yet — classic squeeze setup if we hold support. Watch for a short liquidation cascade if buyers step in here.
Derivatives saying one thing, price saying another. When funding goes negative but price holds, that's usually fuel.
Shorts are now paying longs. Market's leaning bearish on leverage but price hasn't dumped yet — classic squeeze setup if we hold support. Watch for a short liquidation cascade if buyers step in here.
Derivatives saying one thing, price saying another. When funding goes negative but price holds, that's usually fuel.
2
491
·
--
We're pushing toward that 70k handle. If we're building a higher low, it's sitting around 69-70k — that's where the weekly 200 EMA lines up for confluence.
But my gut says we've already raided the range high. Now we're probably headed back down to test at least one of those lows.
Watch the 69-70k zone. If it holds, we might get structure. If it breaks, we're hunting lower liquidity. Price wants to rebalance after that sweep.
We're pushing toward that 70k handle. If we're building a higher low, it's sitting around 69-70k — that's where the weekly 200 EMA lines up for confluence.
But my gut says we've already raided the range high. Now we're probably headed back down to test at least one of those lows.
Watch the 69-70k zone. If it holds, we might get structure. If it breaks, we're hunting lower liquidity. Price wants to rebalance after that sweep.
But my gut says we've already raided the range high. Now we're probably headed back down to test at least one of those lows.
Watch the 69-70k zone. If it holds, we might get structure. If it breaks, we're hunting lower liquidity. Price wants to rebalance after that sweep.
667
·
--
Частичная правда
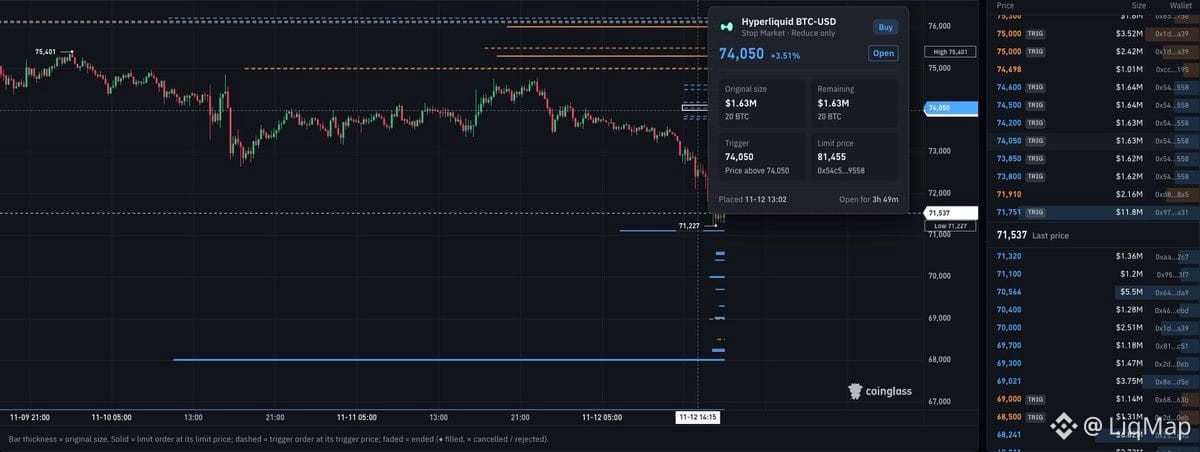
Hyperliquid whale tracker just dropped on CoinGlass. Now you can see exactly where the big orders sit — their take-profit levels, their stop-losses, all in one view.
This is the map. You want to know where size is positioned? Where the exits are? Where the squeeze zones live? It's all there.
Price doesn't move in a vacuum. It moves around liquidity. And now you can see where the whales parked theirs. Watch how price reacts when it runs into their levels — that's your edge.
If you're trading $HYPE or anything on Hyperliquid, this is the layer you've been missing. The order book tells you one thing. This tells you where the real money is leaning.
Hyperliquid whale tracker just dropped on CoinGlass. Now you can see exactly where the big orders sit — their take-profit levels, their stop-losses, all in one view.
This is the map. You want to know where size is positioned? Where the exits are? Where the squeeze zones live? It's all there.
Price doesn't move in a vacuum. It moves around liquidity. And now you can see where the whales parked theirs. Watch how price reacts when it runs into their levels — that's your edge.
If you're trading $HYPE or anything on Hyperliquid, this is the layer you've been missing. The order book tells you one thing. This tells you where the real money is leaning.
This is the map. You want to know where size is positioned? Where the exits are? Where the squeeze zones live? It's all there.
Price doesn't move in a vacuum. It moves around liquidity. And now you can see where the whales parked theirs. Watch how price reacts when it runs into their levels — that's your edge.
If you're trading $HYPE or anything on Hyperliquid, this is the layer you've been missing. The order book tells you one thing. This tells you where the real money is leaning.
486
·
--
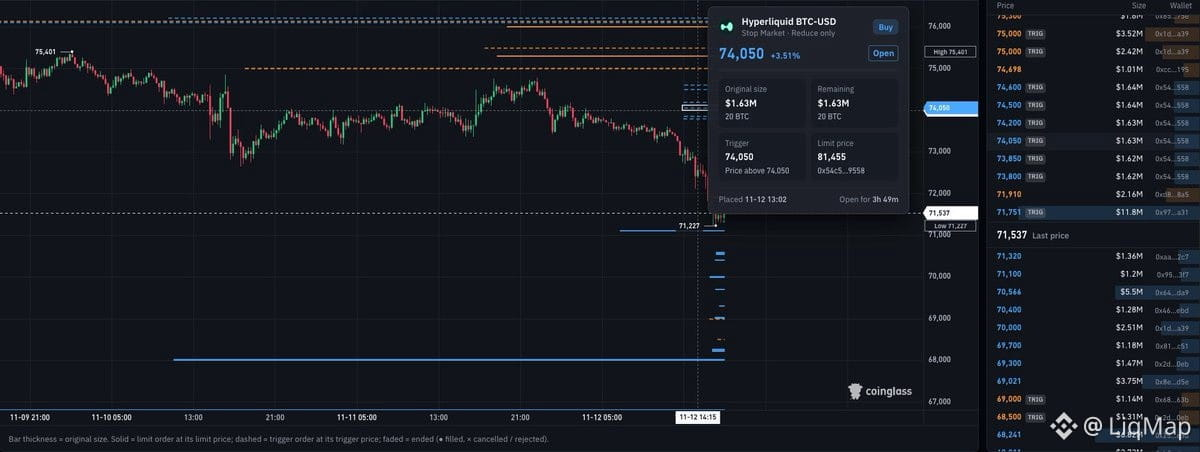
Hyperliquid whale tracking just got real. CoinGlass now shows large orders with their take-profit and stop-loss levels visible in one dashboard. You can literally see where the size is positioned and where they're planning exits.
This is huge for reading order flow. When you spot clusters of whale stops or profit targets, you're looking at liquidity zones the market will either defend or hunt. Price tends to gravitate toward these levels — either to trigger stops and fuel a move, or to hit take-profits and reverse.
If you're trading $HYPE or any Hyperliquid pair, this gives you an edge on positioning. Stack this with open interest shifts and funding rate swings, and you've got a clear map of where the squeeze potential sits. Watch for stop clusters below support — that's your liquidation fuel. Watch for TP clusters above resistance — that's your exit liquidity.
Derivatives data like this is how you trade the players, not just the price. The whales telegraph their hand; now you can front-run the move.
Hyperliquid whale tracking just got real. CoinGlass now shows large orders with their take-profit and stop-loss levels visible in one dashboard. You can literally see where the size is positioned and where they're planning exits.
This is huge for reading order flow. When you spot clusters of whale stops or profit targets, you're looking at liquidity zones the market will either defend or hunt. Price tends to gravitate toward these levels — either to trigger stops and fuel a move, or to hit take-profits and reverse.
If you're trading $HYPE or any Hyperliquid pair, this gives you an edge on positioning. Stack this with open interest shifts and funding rate swings, and you've got a clear map of where the squeeze potential sits. Watch for stop clusters below support — that's your liquidation fuel. Watch for TP clusters above resistance — that's your exit liquidity.
Derivatives data like this is how you trade the players, not just the price. The whales telegraph their hand; now you can front-run the move.
This is huge for reading order flow. When you spot clusters of whale stops or profit targets, you're looking at liquidity zones the market will either defend or hunt. Price tends to gravitate toward these levels — either to trigger stops and fuel a move, or to hit take-profits and reverse.
If you're trading $HYPE or any Hyperliquid pair, this gives you an edge on positioning. Stack this with open interest shifts and funding rate swings, and you've got a clear map of where the squeeze potential sits. Watch for stop clusters below support — that's your liquidation fuel. Watch for TP clusters above resistance — that's your exit liquidity.
Derivatives data like this is how you trade the players, not just the price. The whales telegraph their hand; now you can front-run the move.
367
·
--
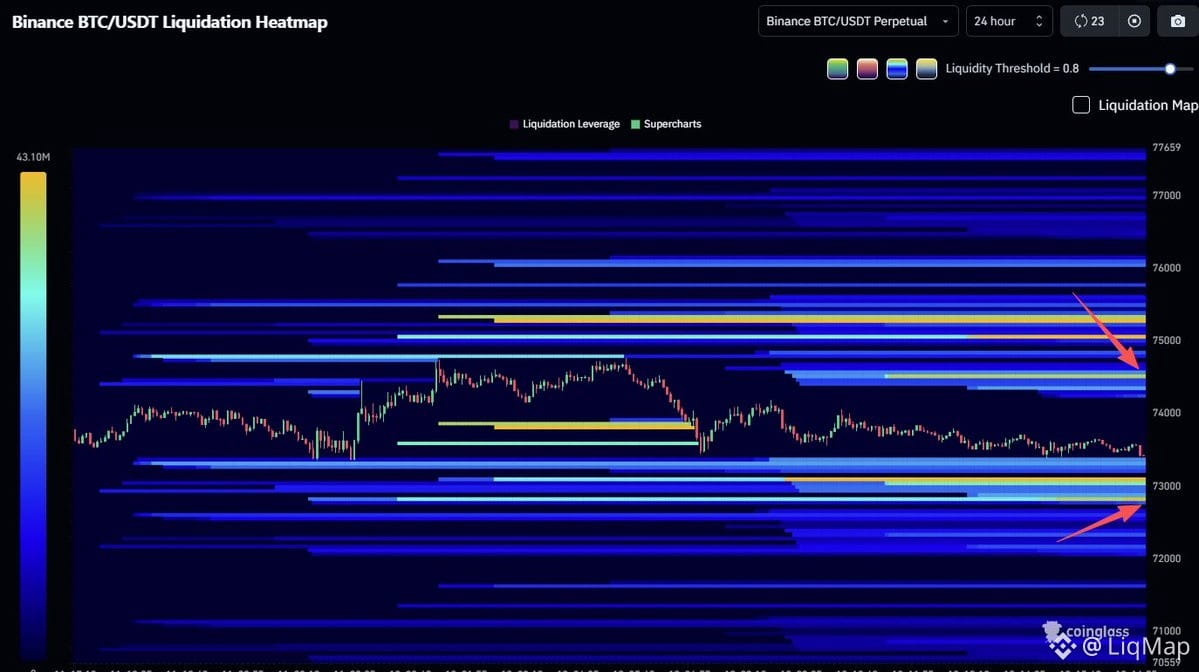
Liquidation map showing two magnets pulling price:
🧲 $74.5K — heavy long liq cluster
🧲 $72.8K — short squeeze zone
$BTC sitting between both. High-leverage liquidity stacked on either side means we're in squeeze territory. Price wants to run the stops on one side before the real move.
Watch which magnet gets hit first. If we tap $74.5K and reject hard, longs get flushed and we probably wick down to $72.8K to clear shorts. If we hold above $74K and grind, shorts start sweating and we melt up.
Derivatives setup screaming for a fake-out in one direction before the real direction prints. Don't chase the first move — wait for the liquidity grab, then enter on the retest.
Liquidation map showing two magnets pulling price:
🧲 $74.5K — heavy long liq cluster
🧲 $72.8K — short squeeze zone
$BTC sitting between both. High-leverage liquidity stacked on either side means we're in squeeze territory. Price wants to run the stops on one side before the real move.
Watch which magnet gets hit first. If we tap $74.5K and reject hard, longs get flushed and we probably wick down to $72.8K to clear shorts. If we hold above $74K and grind, shorts start sweating and we melt up.
Derivatives setup screaming for a fake-out in one direction before the real direction prints. Don't chase the first move — wait for the liquidity grab, then enter on the retest.
🧲 $74.5K — heavy long liq cluster
🧲 $72.8K — short squeeze zone
$BTC sitting between both. High-leverage liquidity stacked on either side means we're in squeeze territory. Price wants to run the stops on one side before the real move.
Watch which magnet gets hit first. If we tap $74.5K and reject hard, longs get flushed and we probably wick down to $72.8K to clear shorts. If we hold above $74K and grind, shorts start sweating and we melt up.
Derivatives setup screaming for a fake-out in one direction before the real direction prints. Don't chase the first move — wait for the liquidity grab, then enter on the retest.
1.3k
·
--
$BTC sitting at $73,441 — basically flat on the day but the derivatives stack is telling a different story.
OI dropped 2.71% to $50.83B. That's not profit-taking, that's position unwinding. When OI bleeds while price holds, it means the weak hands are getting shaken out before the next leg.
$59.8M liquidated in 24h, 41% longs. So shorts got clipped harder — classic bear trap setup. Funding at 0.0067% (7.3% annualized) is neutral to slightly positive, no overheated longs yet.
ETF outflow of $299.8M on Nov 11 confirms the retail flush. Fear & Greed at 29 (Fear) — when everyone's scared, that's when you start looking for entries.
Here's the read: OI dropping + shorts getting rekt + funding still reasonable = squeeze potential building. If $BTC reclaims $74k with OI climbing back, that's your confirmation for the next push.
Watch the funding rate. If it stays under 0.01% and OI starts rising again, that's your window. Don't chase — let the data confirm the move first.
$BTC sitting at $73,441 — basically flat on the day but the derivatives stack is telling a different story.
OI dropped 2.71% to $50.83B. That's not profit-taking, that's position unwinding. When OI bleeds while price holds, it means the weak hands are getting shaken out before the next leg.
$59.8M liquidated in 24h, 41% longs. So shorts got clipped harder — classic bear trap setup. Funding at 0.0067% (7.3% annualized) is neutral to slightly positive, no overheated longs yet.
ETF outflow of $299.8M on Nov 11 confirms the retail flush. Fear & Greed at 29 (Fear) — when everyone's scared, that's when you start looking for entries.
Here's the read: OI dropping + shorts getting rekt + funding still reasonable = squeeze potential building. If $BTC reclaims $74k with OI climbing back, that's your confirmation for the next push.
Watch the funding rate. If it stays under 0.01% and OI starts rising again, that's your window. Don't chase — let the data confirm the move first.
OI dropped 2.71% to $50.83B. That's not profit-taking, that's position unwinding. When OI bleeds while price holds, it means the weak hands are getting shaken out before the next leg.
$59.8M liquidated in 24h, 41% longs. So shorts got clipped harder — classic bear trap setup. Funding at 0.0067% (7.3% annualized) is neutral to slightly positive, no overheated longs yet.
ETF outflow of $299.8M on Nov 11 confirms the retail flush. Fear & Greed at 29 (Fear) — when everyone's scared, that's when you start looking for entries.
Here's the read: OI dropping + shorts getting rekt + funding still reasonable = squeeze potential building. If $BTC reclaims $74k with OI climbing back, that's your confirmation for the next push.
Watch the funding rate. If it stays under 0.01% and OI starts rising again, that's your window. Don't chase — let the data confirm the move first.
216
·
--
November close matters — watch this candle hard.
Bullish case: We're wicking down right now, setting up a reclaim of the trendline before December hits. If we bounce and hold above, that's your cue.
Bearish case: We close at or below this level, lose the trendline, and the structure breaks.
Mark the calendar. November's monthly close will tell you which version we're running. $BTC
November close matters — watch this candle hard.
Bullish case: We're wicking down right now, setting up a reclaim of the trendline before December hits. If we bounce and hold above, that's your cue.
Bearish case: We close at or below this level, lose the trendline, and the structure breaks.
Mark the calendar. November's monthly close will tell you which version we're running. $BTC
Bullish case: We're wicking down right now, setting up a reclaim of the trendline before December hits. If we bounce and hold above, that's your cue.
Bearish case: We close at or below this level, lose the trendline, and the structure breaks.
Mark the calendar. November's monthly close will tell you which version we're running. $BTC
289
·
--
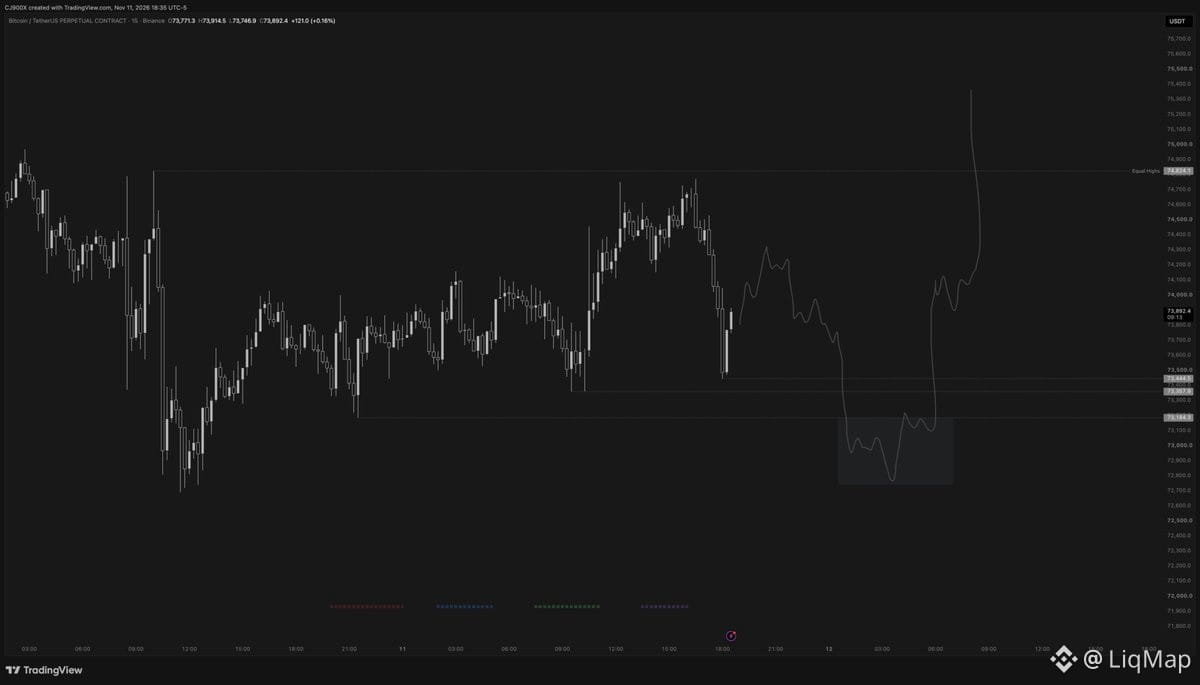
Lower timeframe long setup on $BTC. Looking for a lower high to form, then a rinse through the clustered lows — deviation below 73,189.5 and reclaim above it. That's the entry trigger. Classic liquidity sweep before the bounce.
Lower timeframe long setup on $BTC. Looking for a lower high to form, then a rinse through the clustered lows — deviation below 73,189.5 and reclaim above it. That's the entry trigger. Classic liquidity sweep before the bounce.
1
367
·
--
Quarterly play: still watching dips under 75k down to 69k for longs. Posted that Oct 1, still holds. Weekly closes can shift it — if we don't bounce there or start closing below structure, I'm out. Would accept a sweep of 62k lows but ideally want a triple tap around 60k.
Cycle read: probably rally to ~100k but not convinced we print new ATHs without visiting 40k first.
So right now I'm leaning long in this zone (quarterly bias) to ride it toward 100k. That 97.8k swing high matters — decision point. From what's printed so far, I'd then expect a lower high into a move toward 40k. If new data flips the probabilities I'll adjust.
Traders hold primary and secondary ideas. It's about what you weight and why. That's your bias, that's how you trade it.
Side note: not selling anything, not farming engagement. I post because I like sharing the view, it helps others learn, and it's my online journal. Relax.
Quarterly play: still watching dips under 75k down to 69k for longs. Posted that Oct 1, still holds. Weekly closes can shift it — if we don't bounce there or start closing below structure, I'm out. Would accept a sweep of 62k lows but ideally want a triple tap around 60k.
Cycle read: probably rally to ~100k but not convinced we print new ATHs without visiting 40k first.
So right now I'm leaning long in this zone (quarterly bias) to ride it toward 100k. That 97.8k swing high matters — decision point. From what's printed so far, I'd then expect a lower high into a move toward 40k. If new data flips the probabilities I'll adjust.
Traders hold primary and secondary ideas. It's about what you weight and why. That's your bias, that's how you trade it.
Side note: not selling anything, not farming engagement. I post because I like sharing the view, it helps others learn, and it's my online journal. Relax.
Cycle read: probably rally to ~100k but not convinced we print new ATHs without visiting 40k first.
So right now I'm leaning long in this zone (quarterly bias) to ride it toward 100k. That 97.8k swing high matters — decision point. From what's printed so far, I'd then expect a lower high into a move toward 40k. If new data flips the probabilities I'll adjust.
Traders hold primary and secondary ideas. It's about what you weight and why. That's your bias, that's how you trade it.
Side note: not selling anything, not farming engagement. I post because I like sharing the view, it helps others learn, and it's my online journal. Relax.
301
·
--
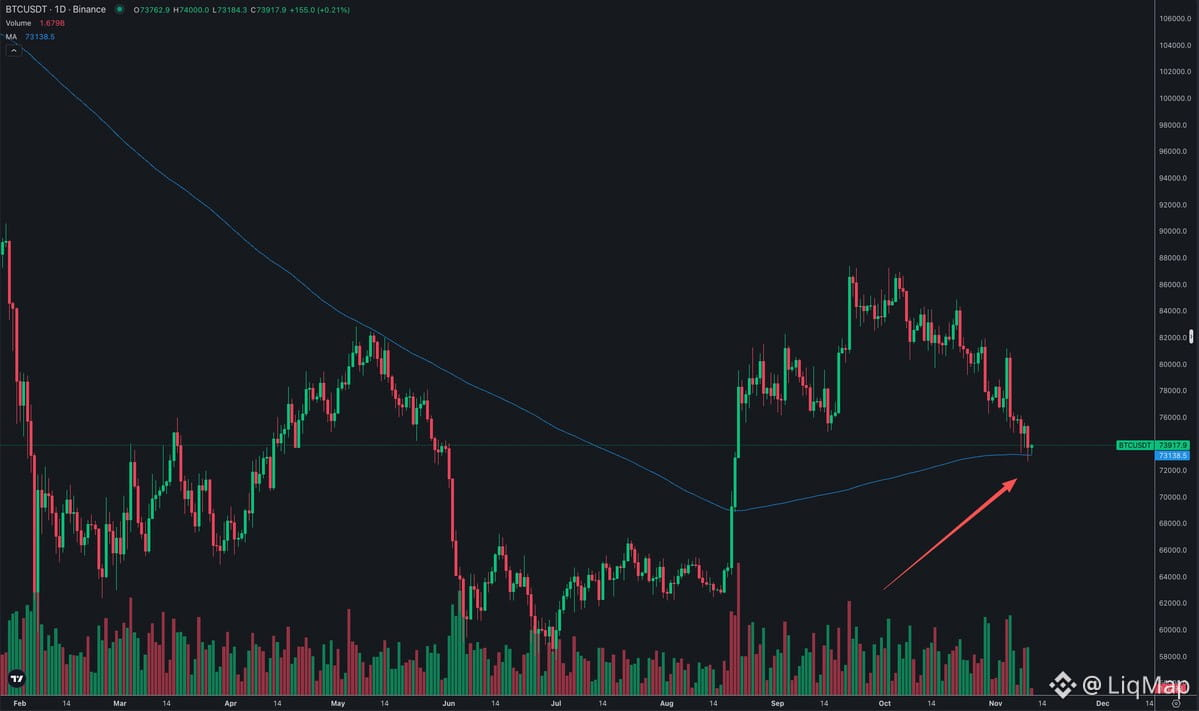
Price is holding the 200 EMA — that's your line in the sand right now. Bulls need to defend this or we're looking at a deeper flush. Watch how OI reacts if we lose it. If longs start getting squeezed and funding flips negative, that's your capitulation setup. Hold the EMA, hold the structure. Lose it, and the next support is a gap lower.
Price is holding the 200 EMA — that's your line in the sand right now. Bulls need to defend this or we're looking at a deeper flush. Watch how OI reacts if we lose it. If longs start getting squeezed and funding flips negative, that's your capitulation setup. Hold the EMA, hold the structure. Lose it, and the next support is a gap lower.
377
·
--
NQ looking prime for a 30.2k run — failed breakdown, re-accepted into range. That's textbook squeeze setup if 27.5k holds.
But here's the disconnect: $BTC isn't playing along yet. Normally when NQ flips bullish like this, you'd expect Bitcoin to catch a relief bounce. Price action says nah. No reaction, no follow-through.
If I flip this chart inverse? It'd be marked bearish. So we're in this weird spot where equities want to rip but crypto's sitting on its hands.
TLDR:
• NQ bullish above 27.5k → 30.2k target
• $BTC expected to join but MIA so far
• Not chasing new ATHs, just looking for the relief move
Watch the correlation break. If $BTC doesn't wake up while NQ runs, that's your red flag. Derivatives data would help here — check if OI is flat or if funding's dead. That'd tell you if this is just a local NQ pump or if crypto's actually lagging for a reason.
¯\_(ツ)_/¯
NQ looking prime for a 30.2k run — failed breakdown, re-accepted into range. That's textbook squeeze setup if 27.5k holds.
But here's the disconnect: $BTC isn't playing along yet. Normally when NQ flips bullish like this, you'd expect Bitcoin to catch a relief bounce. Price action says nah. No reaction, no follow-through.
If I flip this chart inverse? It'd be marked bearish. So we're in this weird spot where equities want to rip but crypto's sitting on its hands.
TLDR:
• NQ bullish above 27.5k → 30.2k target
• $BTC expected to join but MIA so far
• Not chasing new ATHs, just looking for the relief move
Watch the correlation break. If $BTC doesn't wake up while NQ runs, that's your red flag. Derivatives data would help here — check if OI is flat or if funding's dead. That'd tell you if this is just a local NQ pump or if crypto's actually lagging for a reason.
¯\_(ツ)_/¯
But here's the disconnect: $BTC isn't playing along yet. Normally when NQ flips bullish like this, you'd expect Bitcoin to catch a relief bounce. Price action says nah. No reaction, no follow-through.
If I flip this chart inverse? It'd be marked bearish. So we're in this weird spot where equities want to rip but crypto's sitting on its hands.
TLDR:
• NQ bullish above 27.5k → 30.2k target
• $BTC expected to join but MIA so far
• Not chasing new ATHs, just looking for the relief move
Watch the correlation break. If $BTC doesn't wake up while NQ runs, that's your red flag. Derivatives data would help here — check if OI is flat or if funding's dead. That'd tell you if this is just a local NQ pump or if crypto's actually lagging for a reason.
¯\_(ツ)_/¯
134
·
--
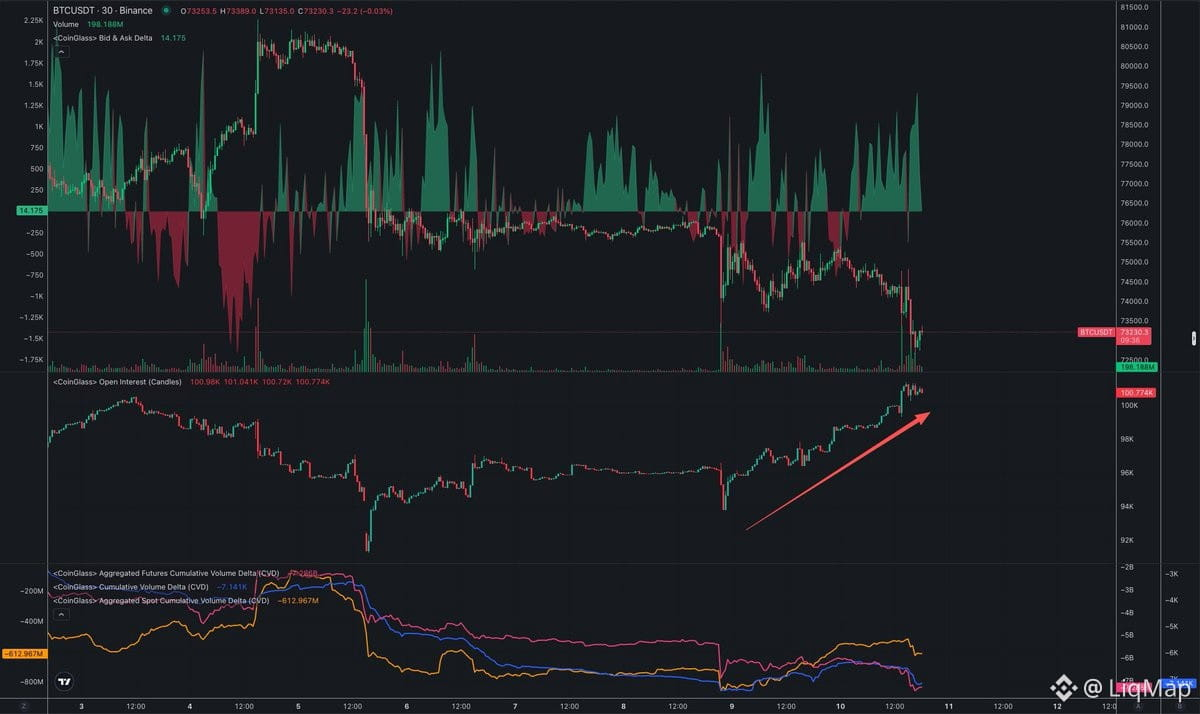
Open interest climbing while price isn't breaking out? That's usually a red flag. More contracts piling in without conviction = fuel for a squeeze in either direction. If we're range-bound and OI keeps stacking, someone's about to get wrecked. Watch for a liquidity grab — this setup loves to hunt stops before the real move. Don't chase here.
Open interest climbing while price isn't breaking out? That's usually a red flag. More contracts piling in without conviction = fuel for a squeeze in either direction. If we're range-bound and OI keeps stacking, someone's about to get wrecked. Watch for a liquidity grab — this setup loves to hunt stops before the real move. Don't chase here.
383
·
--
48-hour $BTC liquidation heatmap showing two big magnets:
🧲 $76K — heavy longs stacked here
🧲 $71K — shorts piling in below
High leverage on both sides. Price loves hunting these clusters. If we chop between them, expect wicks in both directions to sweep liquidity before the real move. Watch which magnet gets hit first — that'll tell you where the squeeze goes next.
48-hour $BTC liquidation heatmap showing two big magnets:
🧲 $76K — heavy longs stacked here
🧲 $71K — shorts piling in below
High leverage on both sides. Price loves hunting these clusters. If we chop between them, expect wicks in both directions to sweep liquidity before the real move. Watch which magnet gets hit first — that'll tell you where the squeeze goes next.
🧲 $76K — heavy longs stacked here
🧲 $71K — shorts piling in below
High leverage on both sides. Price loves hunting these clusters. If we chop between them, expect wicks in both directions to sweep liquidity before the real move. Watch which magnet gets hit first — that'll tell you where the squeeze goes next.
1
182
·
--
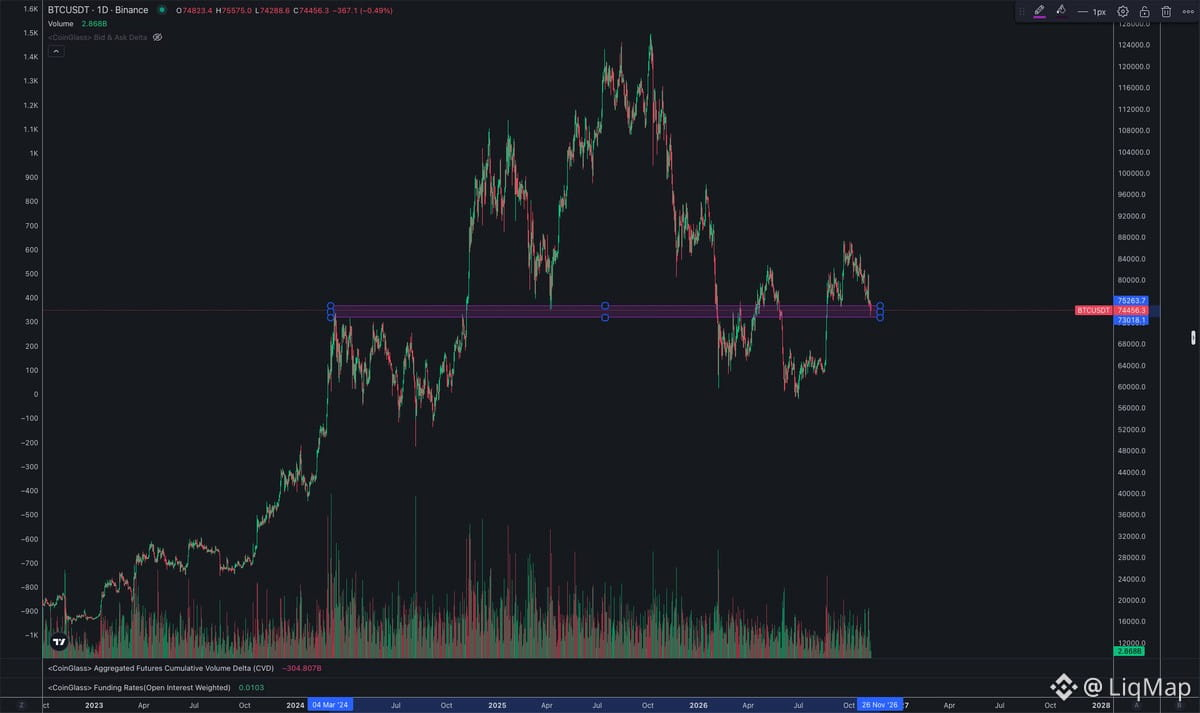
$BTC sitting at a critical support zone right now. If this level cracks, we're looking at a bearish cascade — probably triggers a wave of long liquidations and opens the door to lower lows. Watch the open interest here. If OI stays elevated while price breaks down, that's fuel for a squeeze to the downside. Funding's been neutral to slightly negative, so no overheated longs yet, but a breach here changes the game fast. Not the time to hero-long into weakness. Wait for a reclaim with volume or look for short entries on the retest if it fails.
$BTC sitting at a critical support zone right now. If this level cracks, we're looking at a bearish cascade — probably triggers a wave of long liquidations and opens the door to lower lows. Watch the open interest here. If OI stays elevated while price breaks down, that's fuel for a squeeze to the downside. Funding's been neutral to slightly negative, so no overheated longs yet, but a breach here changes the game fast. Not the time to hero-long into weakness. Wait for a reclaim with volume or look for short entries on the retest if it fails.
1
342
·
--
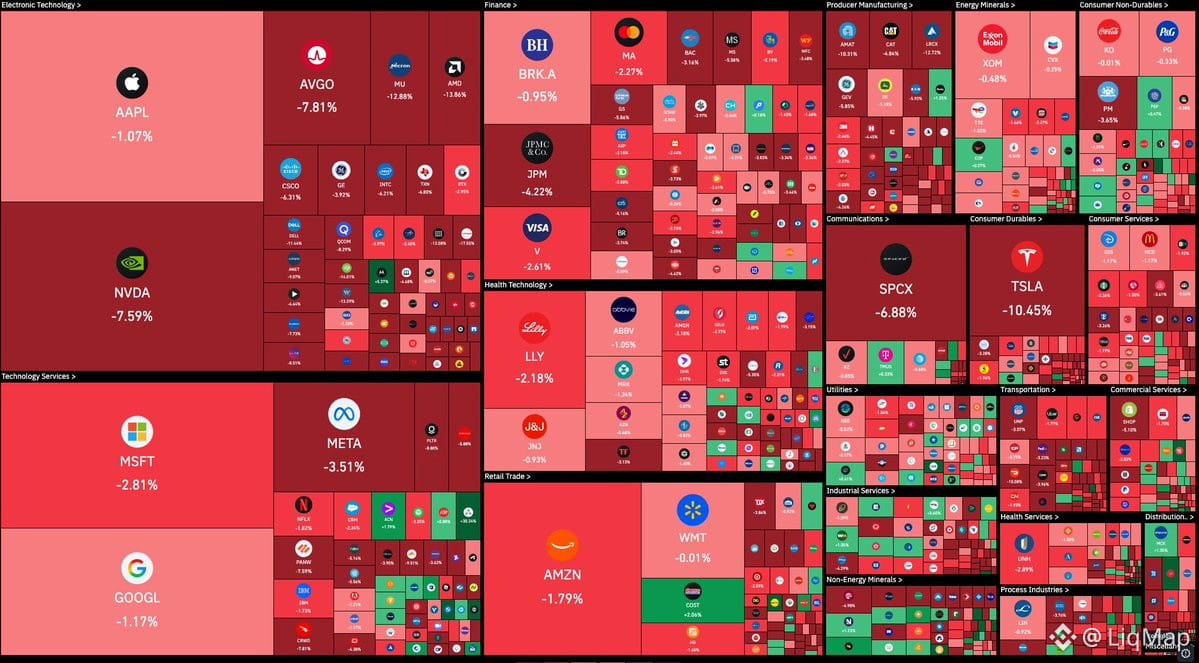
US equities just posted the biggest single-day wipeout in history. That's not noise — that's a regime shift. When traditional markets crater like this, crypto doesn't decouple, it amplifies. Watch $BTC correlation spike and alts bleed harder. If you're holding levered longs, this is your liquidation map lighting up. Risk-off flows hit derivatives first — funding will flip negative, open interest compresses, and we get the cascade. This isn't a dip to buy yet. Wait for the dust to settle and OI to reset before looking for entries. Right now, cash is the position.
US equities just posted the biggest single-day wipeout in history. That's not noise — that's a regime shift. When traditional markets crater like this, crypto doesn't decouple, it amplifies. Watch $BTC correlation spike and alts bleed harder. If you're holding levered longs, this is your liquidation map lighting up. Risk-off flows hit derivatives first — funding will flip negative, open interest compresses, and we get the cascade. This isn't a dip to buy yet. Wait for the dust to settle and OI to reset before looking for entries. Right now, cash is the position.
3
1.6k
·
--
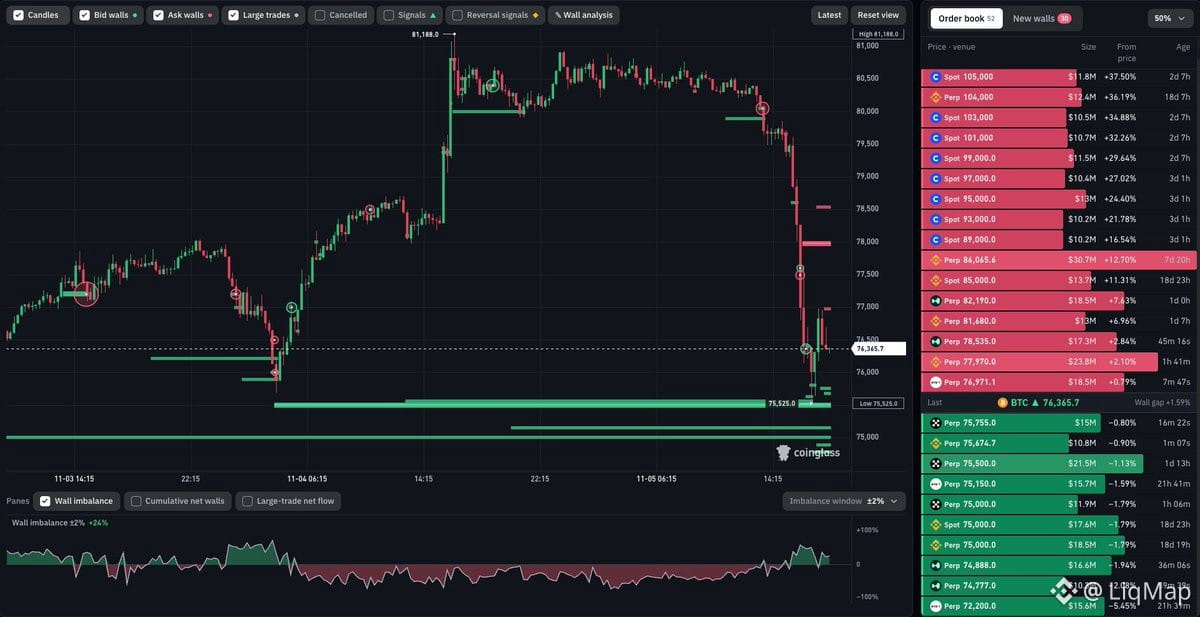
Still seeing bids stacked around $75k. Someone's holding that line — probably limit orders or stop hunting setup. Watch the OI if we test it again. If those bids get pulled or absorbed fast, we're likely going lower. If they hold and bounce with volume, could be the local floor. Derivatives data will tell you if it's real support or just bait.
Still seeing bids stacked around $75k. Someone's holding that line — probably limit orders or stop hunting setup. Watch the OI if we test it again. If those bids get pulled or absorbed fast, we're likely going lower. If they hold and bounce with volume, could be the local floor. Derivatives data will tell you if it's real support or just bait.
421
·
--
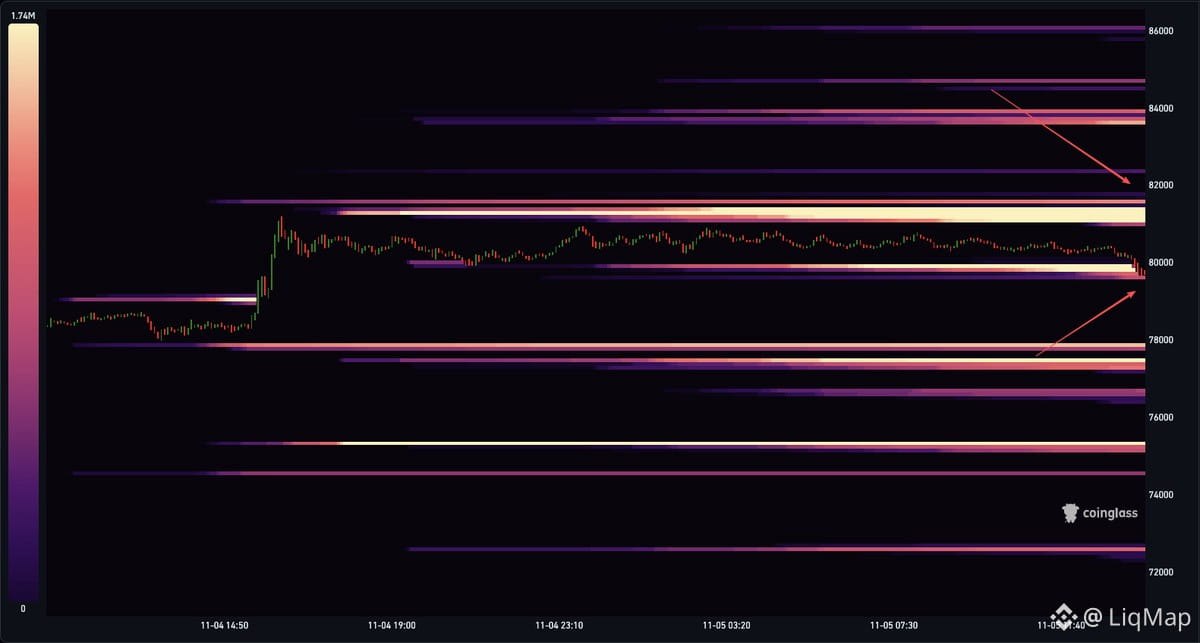
48-hour $BTC liquidation heatmap just dropped. High leverage stacking up — classic squeeze fuel.
When you see clustered liquidity zones like this, it's not about if they get hit, it's about when. Price gravitates toward leverage, especially when OI's climbing and funding's tilted.
Watch those dense pockets above and below current price. If we run stops in either direction, the cascade starts fast. That's your entry window — not before the move, during the flush.
Leverage = liquidity = volatility. This map tells you where the pain trade lives. Trade the reaction, not the prediction. 🧐
48-hour $BTC liquidation heatmap just dropped. High leverage stacking up — classic squeeze fuel.
When you see clustered liquidity zones like this, it's not about if they get hit, it's about when. Price gravitates toward leverage, especially when OI's climbing and funding's tilted.
Watch those dense pockets above and below current price. If we run stops in either direction, the cascade starts fast. That's your entry window — not before the move, during the flush.
Leverage = liquidity = volatility. This map tells you where the pain trade lives. Trade the reaction, not the prediction. 🧐
When you see clustered liquidity zones like this, it's not about if they get hit, it's about when. Price gravitates toward leverage, especially when OI's climbing and funding's tilted.
Watch those dense pockets above and below current price. If we run stops in either direction, the cascade starts fast. That's your entry window — not before the move, during the flush.
Leverage = liquidity = volatility. This map tells you where the pain trade lives. Trade the reaction, not the prediction. 🧐
2
1.5k
·
--
Binance just absorbed $4.25B in net inflows over 24 hours. That's not noise — that's capital repositioning at scale. When the biggest exchange sees this kind of volume shift, it usually precedes a directional move. Watch how $BTC and $ETH respond to this liquidity injection. If price coils while OI climbs, we're setting up for a squeeze. If funding stays neutral and spot absorbs it cleanly, we might grind higher without fireworks. Either way, $4.25B doesn't sit idle for long.
Binance just absorbed $4.25B in net inflows over 24 hours. That's not noise — that's capital repositioning at scale. When the biggest exchange sees this kind of volume shift, it usually precedes a directional move. Watch how $BTC and $ETH respond to this liquidity injection. If price coils while OI climbs, we're setting up for a squeeze. If funding stays neutral and spot absorbs it cleanly, we might grind higher without fireworks. Either way, $4.25B doesn't sit idle for long.
140
·
--
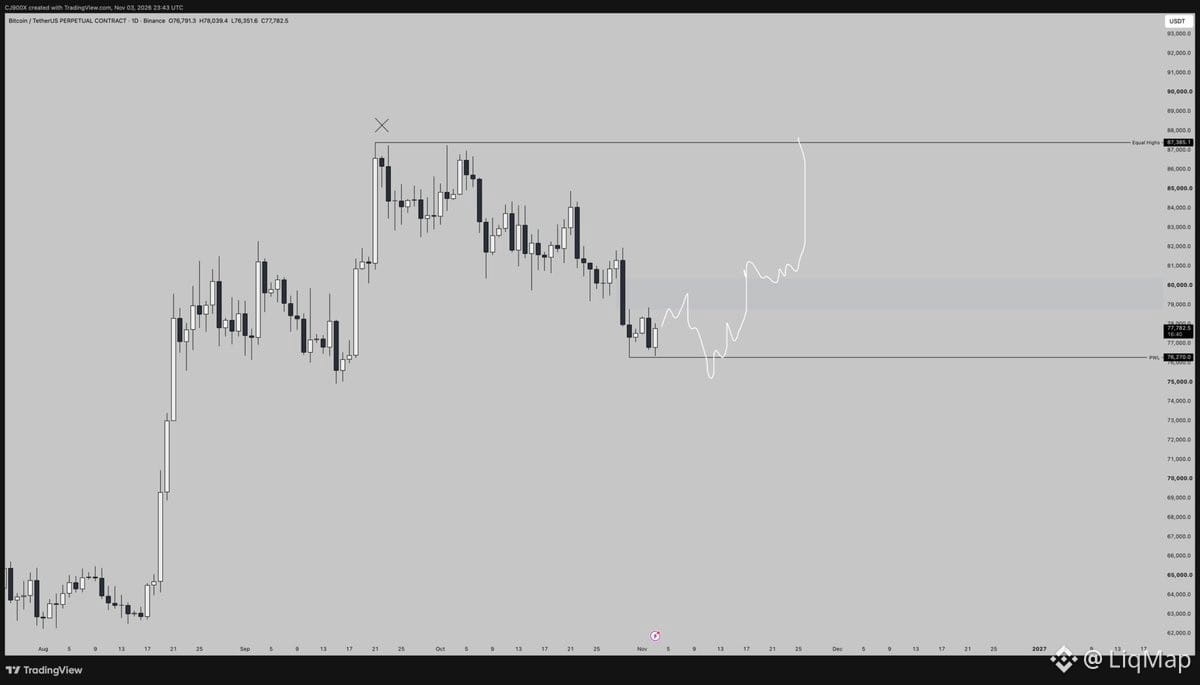
Loose $BTC setup:
Looking for longs if price fails to expand below last week's low. Either sweep + reclaim or deviation below + reclaim works.
Can tag mid-September low but not required.
Second long entry: reclaim of the marked imbalance.
Price action read: if they can't push it lower and structure holds, that's the squeeze setup. Watch for the failed breakdown — that's where the shorts get trapped and you ride the reversal.
GL
Loose $BTC setup:
Looking for longs if price fails to expand below last week's low. Either sweep + reclaim or deviation below + reclaim works.
Can tag mid-September low but not required.
Second long entry: reclaim of the marked imbalance.
Price action read: if they can't push it lower and structure holds, that's the squeeze setup. Watch for the failed breakdown — that's where the shorts get trapped and you ride the reversal.
GL
Looking for longs if price fails to expand below last week's low. Either sweep + reclaim or deviation below + reclaim works.
Can tag mid-September low but not required.
Second long entry: reclaim of the marked imbalance.
Price action read: if they can't push it lower and structure holds, that's the squeeze setup. Watch for the failed breakdown — that's where the shorts get trapped and you ride the reversal.
GL
593
·
--
48-hour $BTC liquidation heatmap just dropped.
Heavy leverage stacked up on both sides. Classic squeeze setup brewing — whoever gets caught wrong is going to fuel the next leg. Watch the clustered zones; that's where the real move starts when price hunts stops.
Leverage is the gasoline. Price just needs a spark.
48-hour $BTC liquidation heatmap just dropped.
Heavy leverage stacked up on both sides. Classic squeeze setup brewing — whoever gets caught wrong is going to fuel the next leg. Watch the clustered zones; that's where the real move starts when price hunts stops.
Leverage is the gasoline. Price just needs a spark.
Heavy leverage stacked up on both sides. Classic squeeze setup brewing — whoever gets caught wrong is going to fuel the next leg. Watch the clustered zones; that's where the real move starts when price hunts stops.
Leverage is the gasoline. Price just needs a spark.
371
Войдите, чтобы посмотреть больше материала
Присоединяйтесь к пользователям криптовалют по всему миру на Binance Square
⚡️ Получайте новейшую и полезную информацию о криптоактивах.
💬 Нам доверяет крупнейшая в мире криптобиржа.
👍 Получите достоверные аналитические данные от верифицированных создателей контента.
Эл. почта/номер телефона
В тренде
USPPIMissMayEaseBTCPressure
Просмотров: 74,380
959 обсуждают
US PPI Rises 6.5% a Year in October, Slightly Below 6.6% Forecast
Binance News
·Лайков: 17
·Просмотров: 19.7k
BitcoinCoreDisclosesTorTrafficVulnerability
Просмотров: 31,922
540 обсуждают
WhatWillDriveCryptoandStocks’NextRebound?
Просмотров: 199,030
1,753 обсуждают