

JÖN_SÊNS
33.6k Публикации

JÖN_SÊNS
 Square Verified+
Отправить жалобу
Заблокировать пользователя
Открытая сделка
Случайный трейдер
1.1 г
1.1K+ подписок(и/а)
45.4K+ подписчиков(а)
57.1K+ понравилось
Посты
Портфель
Все
Активно
·
--

Статья
Halloween, Crypto Hype, and Binance SEAPumpkinFrenzy: Just Tell Your Story and Keep It RealLet's be honest. There's already enough noise in the crypto world. Every day, someone is talking about the next big opportunity, predicting a price jump, or promising that a particular trend will change everything. After a while, it all starts to sound the same.
That's why I like the idea behind Binance's #SEAPumpkinFrenzy Halloween campaign. Instead of talking about charts, trading strategies, or where the market might go next, people get to share something a little different. A Halloween memory, a funny experience, or a moment that genuinely scared them at the time.
And yes, there's a chance to win USDC rewards, which makes it more interesting. But I think the best part is having a reason to share stories and connect with people outside the usual crypto conversations.
A Small Halloween Scare I'll Never Forget
Imagine walking home late one evening. The street is quiet, most of the houses are dark, and the wind is pushing dry leaves across the road. You're thinking about your day and just want to get home.
Then suddenly, you hear a loud noise.
You stop walking.
For a moment, you can't figure out where it came from. You look toward a nearby gate, but there's nothing obvious. A few seconds later, the noise comes again.
Now your imagination is doing all the work.
You start wondering whether someone is standing behind the gate. You look at the shadows on the wall, and every little movement suddenly seems suspicious. A minute ago, you were perfectly comfortable walking home. Now you're considering whether running would be a better idea.
Eventually, you gather enough courage to take a closer look.
It's just a loose gate banging against its frame in the wind.
That's the whole story. No ghost, no mysterious figure, and certainly no horror movie ending.
You probably feel a little embarrassed, but once you get home, you can't help laughing about it. Tell your friends the next day, and they'll have a great time making fun of you. Someone will claim they wouldn't have been scared, while someone else will admit they probably would have run in the opposite direction.
Honestly, I think most of us have experienced something similar. A strange noise in the middle of the night, a shadow that looks like a person, or an ordinary object that seems frightening when you see it in the dark.
It's funny how quickly our minds can turn something harmless into a whole horror story.
And that's exactly why I think simple, relatable stories are worth sharing. They don't need a dramatic ending or some unbelievable twist. Sometimes, the funniest part is realizing how badly you misunderstood the situation.
Why I Prefer Real Stories Over Perfect Ones
One thing I've noticed online is how much people try to make everything look impressive.
Every experience has to sound extraordinary. Every post needs a clever opening. Every story seems to require some unexpected ending that leaves everyone amazed.
But real life doesn't always work that way.
Sometimes you make a silly mistake. Sometimes you get scared over nothing. Sometimes you plan an entire evening, and everything falls apart before it even begins.
Those experiences might not seem important when they happen, but they're often the ones you remember most clearly.
Think about a Halloween party where someone spends hours preparing a costume, only to realize they can barely move in it. Or a group of friends watching a horror movie, with one person acting brave until the first jump scare sends them flying off the sofa.
Nobody planned for those moments to happen. That's what makes them funny.
I'd much rather read a story like that than something that feels exaggerated just to get attention.
For me, that's a good approach to Binance's #SEAPumpkinFrenzy. Share something that actually happened to you. It doesn't have to be the scariest Halloween experience anyone has ever heard. It just has to be a story you enjoy telling.
Maybe it's a childhood memory. Maybe it's something that happened last year. Or perhaps you don't celebrate Halloween at all but have a funny experience involving a costume, a scary movie, or an unexpected surprise.
There's room for different experiences, and that's what makes a community interesting.
A Break From the Usual Crypto Conversations
Crypto communities can be exciting, but sometimes the conversations become exhausting.
One person predicts that prices will rise. Another insists a market crash is coming. Someone shares a screenshot of a profitable trade, and suddenly everyone wants to know how they did it. A few days later, the market changes direction, and the confident predictions disappear.
Then the cycle starts all over again.
I understand why people follow these discussions. The market moves quickly, and people naturally want to understand what's happening. But there's more to an online community than price predictions and trading opinions.
Behind every account is a person with their own experiences, responsibilities, and interests. Not everyone wants to spend the whole day discussing cryptocurrency.
Sometimes, it's nice to talk about something completely unrelated to the market.
That's where a campaign like #SEAPumpkinFrenzy can be refreshing. You don't need to be an experienced trader or know every technical term in crypto. You just need a story to share and a little interest in hearing what other people have experienced.
Someone might post about a childhood Halloween prank. Another person might share a memory of getting lost while looking for a party. Someone else might describe a horror movie night that turned into a comedy because nobody could stop laughing.
Different stories, different people, and something new to read.
That feels like a welcome change from seeing the same market predictions over and over again.
Let's Talk About the USDC Rewards, Too
Of course, the rewards are part of the attraction.
If a campaign offers participants a chance to win USDC, it's perfectly understandable that people will want to take part. There's nothing wrong with being interested in a prize.
The important thing is understanding what the offer actually means.
A chance to win isn't the same as a guaranteed reward. Posting a story doesn't automatically mean you'll receive USDC, and nobody should treat a promotional campaign as a reliable way to earn money.
Before participating, I'd check the official campaign announcement, including the deadline, eligibility requirements, submission instructions, and reward conditions. Those details matter much more than whatever someone claims in a random social media post.
I'd also be careful about fake accounts and suspicious links. Unfortunately, scammers know how to take advantage of popular campaigns, especially when rewards are involved.
If someone messages you claiming you've won but asks you to send cryptocurrency first, be cautious. Never share your password, authentication codes, or wallet recovery phrase to claim a prize. Verify announcements through Binance's official channels rather than trusting an account simply because it uses a familiar logo or hashtag.
A Halloween campaign should be fun. Losing access to your account because you clicked a suspicious link would ruin the experience pretty quickly.
Enjoy the event, but keep your common sense switched on.
You Don't Need to Be a Professional Writer
If you're thinking about joining #SEAPumpkinFrenzy, don't spend hours worrying about whether your story sounds impressive enough.
Start with a simple question: What happened, and why do I still remember it?
Maybe you were younger and convinced there was something hiding in your room. Perhaps you spent an evening with friends watching horror movies, only to discover that the person who suggested the movie was the most frightened of everyone.
Or maybe Halloween didn't go according to plan at all.
Whatever the experience, focus on the details that make it yours. Where were you? What happened first? How did you react? What made the situation funny, strange, or frightening?
You don't need to answer every question in your post. Just include enough detail for someone reading it to picture the moment.
And don't worry if the story is a little embarrassing. Those are often the best ones.
There's also no reason to invent an experience just because you think a more dramatic story will attract attention. If something happened to you, tell it in your own words. If you're sharing a fictional story, be honest about that, too, and follow the campaign's rules.
The point of a storytelling event is to hear different voices, not to see hundreds of people repeating the same story with different names.
What Makes an Online Community Worth Joining?
For me, it's the people who make it interesting.
You can read a story from someone living thousands of miles away and still recognize the feeling they're describing. Maybe you've made the same mistake, laughed at a similar situation, or experienced that moment when your imagination gets ahead of you.
You don't have to know someone personally to relate to their experience.
That's one of the better things about the internet when people use it well. It gives us a chance to see how others live, what they find funny, and which memories stay with them.
Of course, online communities aren't always like that. Sometimes the pressure to get likes, views, or rewards makes everything feel like a competition. People copy popular posts because they think that's what works, and original experiences get buried beneath repetitive content.
A simple, honest story can be a nice change.
It doesn't have to teach anyone a lesson. It doesn't have to promote a complicated idea. It can simply give someone a reason to smile while scrolling through their feed.
And if that story starts a conversation with someone who has a similar memory, even better.
That's the kind of interaction I'd like to see more often, both in crypto communities and elsewhere.
Keep It Simple, Keep It Safe, and Enjoy Halloween
I don't expect Binance's #SEAPumpkinFrenzy to change the crypto industry, and I don't think it needs to.
It's a seasonal campaign built around storytelling and community participation, with USDC rewards adding another reason to join. Sometimes that's enough.
Not every event needs to become a discussion about market trends or future opportunities. A pumpkin doesn't have to symbolize the next big thing in crypto. A Halloween story doesn't need to become a lesson about blockchain technology.
Sometimes, it's just nice to do something different.
If you've got a funny memory, share it. If you've had a genuinely creepy experience, tell people what happened. If your Halloween plans ended in complete chaos, that's a story worth telling, too.
Just make sure you understand the official entry requirements, keep your personal information private, and don't trust anyone promising guaranteed rewards in exchange for money or sensitive account details.
And most importantly, don't put too much pressure on yourself to write the perfect post.
The loose gate in my example wasn't frightening because it was unusual. It was frightening because, for a few seconds, I didn't know what was making the noise. Once I understood what was happening, the fear disappeared and the funny part remained.
That's how many good memories work. The moment itself might be small, but the way we remember it makes it worth sharing.
So, if you're taking part in Binance's #SEAPumpkinFrenzy this Halloween, tell your story the way you'd tell it to a friend. Be yourself, have a little fun, and let other people bring their own experiences to the conversation.
Maybe you'll win some USDC. Maybe you'll discover a few stories that make you laugh. Either way, you can enjoy the campaign without expecting it to be more than it is.
Happy Halloween to everyone joining #SEAPumpkinFrenzy. Stay safe, keep an eye out for suspicious offers, and remember that sometimes the best stories come from the moments when absolutely nothing went according to plan.
#SEAPumpkinFrenzy
Halloween, Crypto Hype, and Binance SEAPumpkinFrenzy: Just Tell Your Story and Keep It Real
Let's be honest. There's already enough noise in the crypto world. Every day, someone is talking about the next big opportunity, predicting a price jump, or promising that a particular trend will change everything. After a while, it all starts to sound the same.
That's why I like the idea behind Binance's #SEAPumpkinFrenzy Halloween campaign. Instead of talking about charts, trading strategies, or where the market might go next, people get to share something a little different. A Halloween memory, a funny experience, or a moment that genuinely scared them at the time.
And yes, there's a chance to win USDC rewards, which makes it more interesting. But I think the best part is having a reason to share stories and connect with people outside the usual crypto conversations.
A Small Halloween Scare I'll Never Forget
Imagine walking home late one evening. The street is quiet, most of the houses are dark, and the wind is pushing dry leaves across the road. You're thinking about your day and just want to get home.
Then suddenly, you hear a loud noise.
You stop walking.
For a moment, you can't figure out where it came from. You look toward a nearby gate, but there's nothing obvious. A few seconds later, the noise comes again.
Now your imagination is doing all the work.
You start wondering whether someone is standing behind the gate. You look at the shadows on the wall, and every little movement suddenly seems suspicious. A minute ago, you were perfectly comfortable walking home. Now you're considering whether running would be a better idea.
Eventually, you gather enough courage to take a closer look.
It's just a loose gate banging against its frame in the wind.
That's the whole story. No ghost, no mysterious figure, and certainly no horror movie ending.
You probably feel a little embarrassed, but once you get home, you can't help laughing about it. Tell your friends the next day, and they'll have a great time making fun of you. Someone will claim they wouldn't have been scared, while someone else will admit they probably would have run in the opposite direction.
Honestly, I think most of us have experienced something similar. A strange noise in the middle of the night, a shadow that looks like a person, or an ordinary object that seems frightening when you see it in the dark.
It's funny how quickly our minds can turn something harmless into a whole horror story.
And that's exactly why I think simple, relatable stories are worth sharing. They don't need a dramatic ending or some unbelievable twist. Sometimes, the funniest part is realizing how badly you misunderstood the situation.
Why I Prefer Real Stories Over Perfect Ones
One thing I've noticed online is how much people try to make everything look impressive.
Every experience has to sound extraordinary. Every post needs a clever opening. Every story seems to require some unexpected ending that leaves everyone amazed.
But real life doesn't always work that way.
Sometimes you make a silly mistake. Sometimes you get scared over nothing. Sometimes you plan an entire evening, and everything falls apart before it even begins.
Those experiences might not seem important when they happen, but they're often the ones you remember most clearly.
Think about a Halloween party where someone spends hours preparing a costume, only to realize they can barely move in it. Or a group of friends watching a horror movie, with one person acting brave until the first jump scare sends them flying off the sofa.
Nobody planned for those moments to happen. That's what makes them funny.
I'd much rather read a story like that than something that feels exaggerated just to get attention.
For me, that's a good approach to Binance's #SEAPumpkinFrenzy. Share something that actually happened to you. It doesn't have to be the scariest Halloween experience anyone has ever heard. It just has to be a story you enjoy telling.
Maybe it's a childhood memory. Maybe it's something that happened last year. Or perhaps you don't celebrate Halloween at all but have a funny experience involving a costume, a scary movie, or an unexpected surprise.
There's room for different experiences, and that's what makes a community interesting.
A Break From the Usual Crypto Conversations
Crypto communities can be exciting, but sometimes the conversations become exhausting.
One person predicts that prices will rise. Another insists a market crash is coming. Someone shares a screenshot of a profitable trade, and suddenly everyone wants to know how they did it. A few days later, the market changes direction, and the confident predictions disappear.
Then the cycle starts all over again.
I understand why people follow these discussions. The market moves quickly, and people naturally want to understand what's happening. But there's more to an online community than price predictions and trading opinions.
Behind every account is a person with their own experiences, responsibilities, and interests. Not everyone wants to spend the whole day discussing cryptocurrency.
Sometimes, it's nice to talk about something completely unrelated to the market.
That's where a campaign like #SEAPumpkinFrenzy can be refreshing. You don't need to be an experienced trader or know every technical term in crypto. You just need a story to share and a little interest in hearing what other people have experienced.
Someone might post about a childhood Halloween prank. Another person might share a memory of getting lost while looking for a party. Someone else might describe a horror movie night that turned into a comedy because nobody could stop laughing.
Different stories, different people, and something new to read.
That feels like a welcome change from seeing the same market predictions over and over again.
Let's Talk About the USDC Rewards, Too
Of course, the rewards are part of the attraction.
If a campaign offers participants a chance to win USDC, it's perfectly understandable that people will want to take part. There's nothing wrong with being interested in a prize.
The important thing is understanding what the offer actually means.
A chance to win isn't the same as a guaranteed reward. Posting a story doesn't automatically mean you'll receive USDC, and nobody should treat a promotional campaign as a reliable way to earn money.
Before participating, I'd check the official campaign announcement, including the deadline, eligibility requirements, submission instructions, and reward conditions. Those details matter much more than whatever someone claims in a random social media post.
I'd also be careful about fake accounts and suspicious links. Unfortunately, scammers know how to take advantage of popular campaigns, especially when rewards are involved.
If someone messages you claiming you've won but asks you to send cryptocurrency first, be cautious. Never share your password, authentication codes, or wallet recovery phrase to claim a prize. Verify announcements through Binance's official channels rather than trusting an account simply because it uses a familiar logo or hashtag.
A Halloween campaign should be fun. Losing access to your account because you clicked a suspicious link would ruin the experience pretty quickly.
Enjoy the event, but keep your common sense switched on.
You Don't Need to Be a Professional Writer
If you're thinking about joining #SEAPumpkinFrenzy, don't spend hours worrying about whether your story sounds impressive enough.
Start with a simple question: What happened, and why do I still remember it?
Maybe you were younger and convinced there was something hiding in your room. Perhaps you spent an evening with friends watching horror movies, only to discover that the person who suggested the movie was the most frightened of everyone.
Or maybe Halloween didn't go according to plan at all.
Whatever the experience, focus on the details that make it yours. Where were you? What happened first? How did you react? What made the situation funny, strange, or frightening?
You don't need to answer every question in your post. Just include enough detail for someone reading it to picture the moment.
And don't worry if the story is a little embarrassing. Those are often the best ones.
There's also no reason to invent an experience just because you think a more dramatic story will attract attention. If something happened to you, tell it in your own words. If you're sharing a fictional story, be honest about that, too, and follow the campaign's rules.
The point of a storytelling event is to hear different voices, not to see hundreds of people repeating the same story with different names.
What Makes an Online Community Worth Joining?
For me, it's the people who make it interesting.
You can read a story from someone living thousands of miles away and still recognize the feeling they're describing. Maybe you've made the same mistake, laughed at a similar situation, or experienced that moment when your imagination gets ahead of you.
You don't have to know someone personally to relate to their experience.
That's one of the better things about the internet when people use it well. It gives us a chance to see how others live, what they find funny, and which memories stay with them.
Of course, online communities aren't always like that. Sometimes the pressure to get likes, views, or rewards makes everything feel like a competition. People copy popular posts because they think that's what works, and original experiences get buried beneath repetitive content.
A simple, honest story can be a nice change.
It doesn't have to teach anyone a lesson. It doesn't have to promote a complicated idea. It can simply give someone a reason to smile while scrolling through their feed.
And if that story starts a conversation with someone who has a similar memory, even better.
That's the kind of interaction I'd like to see more often, both in crypto communities and elsewhere.
Keep It Simple, Keep It Safe, and Enjoy Halloween
I don't expect Binance's #SEAPumpkinFrenzy to change the crypto industry, and I don't think it needs to.
It's a seasonal campaign built around storytelling and community participation, with USDC rewards adding another reason to join. Sometimes that's enough.
Not every event needs to become a discussion about market trends or future opportunities. A pumpkin doesn't have to symbolize the next big thing in crypto. A Halloween story doesn't need to become a lesson about blockchain technology.
Sometimes, it's just nice to do something different.
If you've got a funny memory, share it. If you've had a genuinely creepy experience, tell people what happened. If your Halloween plans ended in complete chaos, that's a story worth telling, too.
Just make sure you understand the official entry requirements, keep your personal information private, and don't trust anyone promising guaranteed rewards in exchange for money or sensitive account details.
And most importantly, don't put too much pressure on yourself to write the perfect post.
The loose gate in my example wasn't frightening because it was unusual. It was frightening because, for a few seconds, I didn't know what was making the noise. Once I understood what was happening, the fear disappeared and the funny part remained.
That's how many good memories work. The moment itself might be small, but the way we remember it makes it worth sharing.
So, if you're taking part in Binance's #SEAPumpkinFrenzy this Halloween, tell your story the way you'd tell it to a friend. Be yourself, have a little fun, and let other people bring their own experiences to the conversation.
Maybe you'll win some USDC. Maybe you'll discover a few stories that make you laugh. Either way, you can enjoy the campaign without expecting it to be more than it is.
Happy Halloween to everyone joining #SEAPumpkinFrenzy. Stay safe, keep an eye out for suspicious offers, and remember that sometimes the best stories come from the moments when absolutely nothing went according to plan.
#SEAPumpkinFrenzy
That's why I like the idea behind Binance's #SEAPumpkinFrenzy Halloween campaign. Instead of talking about charts, trading strategies, or where the market might go next, people get to share something a little different. A Halloween memory, a funny experience, or a moment that genuinely scared them at the time.
And yes, there's a chance to win USDC rewards, which makes it more interesting. But I think the best part is having a reason to share stories and connect with people outside the usual crypto conversations.
A Small Halloween Scare I'll Never Forget
Imagine walking home late one evening. The street is quiet, most of the houses are dark, and the wind is pushing dry leaves across the road. You're thinking about your day and just want to get home.
Then suddenly, you hear a loud noise.
You stop walking.
For a moment, you can't figure out where it came from. You look toward a nearby gate, but there's nothing obvious. A few seconds later, the noise comes again.
Now your imagination is doing all the work.
You start wondering whether someone is standing behind the gate. You look at the shadows on the wall, and every little movement suddenly seems suspicious. A minute ago, you were perfectly comfortable walking home. Now you're considering whether running would be a better idea.
Eventually, you gather enough courage to take a closer look.
It's just a loose gate banging against its frame in the wind.
That's the whole story. No ghost, no mysterious figure, and certainly no horror movie ending.
You probably feel a little embarrassed, but once you get home, you can't help laughing about it. Tell your friends the next day, and they'll have a great time making fun of you. Someone will claim they wouldn't have been scared, while someone else will admit they probably would have run in the opposite direction.
Honestly, I think most of us have experienced something similar. A strange noise in the middle of the night, a shadow that looks like a person, or an ordinary object that seems frightening when you see it in the dark.
It's funny how quickly our minds can turn something harmless into a whole horror story.
And that's exactly why I think simple, relatable stories are worth sharing. They don't need a dramatic ending or some unbelievable twist. Sometimes, the funniest part is realizing how badly you misunderstood the situation.
Why I Prefer Real Stories Over Perfect Ones
One thing I've noticed online is how much people try to make everything look impressive.
Every experience has to sound extraordinary. Every post needs a clever opening. Every story seems to require some unexpected ending that leaves everyone amazed.
But real life doesn't always work that way.
Sometimes you make a silly mistake. Sometimes you get scared over nothing. Sometimes you plan an entire evening, and everything falls apart before it even begins.
Those experiences might not seem important when they happen, but they're often the ones you remember most clearly.
Think about a Halloween party where someone spends hours preparing a costume, only to realize they can barely move in it. Or a group of friends watching a horror movie, with one person acting brave until the first jump scare sends them flying off the sofa.
Nobody planned for those moments to happen. That's what makes them funny.
I'd much rather read a story like that than something that feels exaggerated just to get attention.
For me, that's a good approach to Binance's #SEAPumpkinFrenzy. Share something that actually happened to you. It doesn't have to be the scariest Halloween experience anyone has ever heard. It just has to be a story you enjoy telling.
Maybe it's a childhood memory. Maybe it's something that happened last year. Or perhaps you don't celebrate Halloween at all but have a funny experience involving a costume, a scary movie, or an unexpected surprise.
There's room for different experiences, and that's what makes a community interesting.
A Break From the Usual Crypto Conversations
Crypto communities can be exciting, but sometimes the conversations become exhausting.
One person predicts that prices will rise. Another insists a market crash is coming. Someone shares a screenshot of a profitable trade, and suddenly everyone wants to know how they did it. A few days later, the market changes direction, and the confident predictions disappear.
Then the cycle starts all over again.
I understand why people follow these discussions. The market moves quickly, and people naturally want to understand what's happening. But there's more to an online community than price predictions and trading opinions.
Behind every account is a person with their own experiences, responsibilities, and interests. Not everyone wants to spend the whole day discussing cryptocurrency.
Sometimes, it's nice to talk about something completely unrelated to the market.
That's where a campaign like #SEAPumpkinFrenzy can be refreshing. You don't need to be an experienced trader or know every technical term in crypto. You just need a story to share and a little interest in hearing what other people have experienced.
Someone might post about a childhood Halloween prank. Another person might share a memory of getting lost while looking for a party. Someone else might describe a horror movie night that turned into a comedy because nobody could stop laughing.
Different stories, different people, and something new to read.
That feels like a welcome change from seeing the same market predictions over and over again.
Let's Talk About the USDC Rewards, Too
Of course, the rewards are part of the attraction.
If a campaign offers participants a chance to win USDC, it's perfectly understandable that people will want to take part. There's nothing wrong with being interested in a prize.
The important thing is understanding what the offer actually means.
A chance to win isn't the same as a guaranteed reward. Posting a story doesn't automatically mean you'll receive USDC, and nobody should treat a promotional campaign as a reliable way to earn money.
Before participating, I'd check the official campaign announcement, including the deadline, eligibility requirements, submission instructions, and reward conditions. Those details matter much more than whatever someone claims in a random social media post.
I'd also be careful about fake accounts and suspicious links. Unfortunately, scammers know how to take advantage of popular campaigns, especially when rewards are involved.
If someone messages you claiming you've won but asks you to send cryptocurrency first, be cautious. Never share your password, authentication codes, or wallet recovery phrase to claim a prize. Verify announcements through Binance's official channels rather than trusting an account simply because it uses a familiar logo or hashtag.
A Halloween campaign should be fun. Losing access to your account because you clicked a suspicious link would ruin the experience pretty quickly.
Enjoy the event, but keep your common sense switched on.
You Don't Need to Be a Professional Writer
If you're thinking about joining #SEAPumpkinFrenzy, don't spend hours worrying about whether your story sounds impressive enough.
Start with a simple question: What happened, and why do I still remember it?
Maybe you were younger and convinced there was something hiding in your room. Perhaps you spent an evening with friends watching horror movies, only to discover that the person who suggested the movie was the most frightened of everyone.
Or maybe Halloween didn't go according to plan at all.
Whatever the experience, focus on the details that make it yours. Where were you? What happened first? How did you react? What made the situation funny, strange, or frightening?
You don't need to answer every question in your post. Just include enough detail for someone reading it to picture the moment.
And don't worry if the story is a little embarrassing. Those are often the best ones.
There's also no reason to invent an experience just because you think a more dramatic story will attract attention. If something happened to you, tell it in your own words. If you're sharing a fictional story, be honest about that, too, and follow the campaign's rules.
The point of a storytelling event is to hear different voices, not to see hundreds of people repeating the same story with different names.
What Makes an Online Community Worth Joining?
For me, it's the people who make it interesting.
You can read a story from someone living thousands of miles away and still recognize the feeling they're describing. Maybe you've made the same mistake, laughed at a similar situation, or experienced that moment when your imagination gets ahead of you.
You don't have to know someone personally to relate to their experience.
That's one of the better things about the internet when people use it well. It gives us a chance to see how others live, what they find funny, and which memories stay with them.
Of course, online communities aren't always like that. Sometimes the pressure to get likes, views, or rewards makes everything feel like a competition. People copy popular posts because they think that's what works, and original experiences get buried beneath repetitive content.
A simple, honest story can be a nice change.
It doesn't have to teach anyone a lesson. It doesn't have to promote a complicated idea. It can simply give someone a reason to smile while scrolling through their feed.
And if that story starts a conversation with someone who has a similar memory, even better.
That's the kind of interaction I'd like to see more often, both in crypto communities and elsewhere.
Keep It Simple, Keep It Safe, and Enjoy Halloween
I don't expect Binance's #SEAPumpkinFrenzy to change the crypto industry, and I don't think it needs to.
It's a seasonal campaign built around storytelling and community participation, with USDC rewards adding another reason to join. Sometimes that's enough.
Not every event needs to become a discussion about market trends or future opportunities. A pumpkin doesn't have to symbolize the next big thing in crypto. A Halloween story doesn't need to become a lesson about blockchain technology.
Sometimes, it's just nice to do something different.
If you've got a funny memory, share it. If you've had a genuinely creepy experience, tell people what happened. If your Halloween plans ended in complete chaos, that's a story worth telling, too.
Just make sure you understand the official entry requirements, keep your personal information private, and don't trust anyone promising guaranteed rewards in exchange for money or sensitive account details.
And most importantly, don't put too much pressure on yourself to write the perfect post.
The loose gate in my example wasn't frightening because it was unusual. It was frightening because, for a few seconds, I didn't know what was making the noise. Once I understood what was happening, the fear disappeared and the funny part remained.
That's how many good memories work. The moment itself might be small, but the way we remember it makes it worth sharing.
So, if you're taking part in Binance's #SEAPumpkinFrenzy this Halloween, tell your story the way you'd tell it to a friend. Be yourself, have a little fun, and let other people bring their own experiences to the conversation.
Maybe you'll win some USDC. Maybe you'll discover a few stories that make you laugh. Either way, you can enjoy the campaign without expecting it to be more than it is.
Happy Halloween to everyone joining #SEAPumpkinFrenzy. Stay safe, keep an eye out for suspicious offers, and remember that sometimes the best stories come from the moments when absolutely nothing went according to plan.
#SEAPumpkinFrenzy
7
10
269
·
--
Рост
🚨₿ $BTC /USDT — BITCOIN AT A CRITICAL TURNING POINT! 🔥📉📈
💰 Price: $81,426.01 (-2.19%)
📈 24H High: $83,250.81
📉 24H Low: $80,939.54
📊 BTC Volume: 19,576.52 BTC
💵 USDT Volume: $1.60B
🇵🇰 PKR Price: Rs 22,522,434.36
🟢 Order Book: 82.01% Buy | 17.99% Sell
🎯 Key Support: $80,939 → $80,835
🚀 Resistance: $81,749 → $82,205 → $82,662 → $83,250
🐂 BULLISH SCENARIO: If BTC holds support and breaks above $81,749, a recovery toward $82,205–$82,662 could be possible.
🐻 BEARISH SCENARIO: A decisive break below $80,939 could bring more selling pressure.
📊 PERFORMANCE:
Today: +0.06% 🟢
7D: -1.19% 🔴
30D: -5.82% 🔴
90D: +26.69% 🟢
180D: +5.32% 🟢
1Y: -24.61% 🔴
🔥 Bitcoin is trying to stabilize after a sharp drop! Buyers dominate the displayed order-book balance, but price action still needs to confirm a genuine recovery. ⚡
👀 THE BIG QUESTION: WILL BTC RECLAIM $82K OR BREAK BELOW $80.9K?
👇 BULLS 🐂 OR BEARS 🐻 — WHAT'S YOUR CALL?
{spot}(BTCUSDT)
🚨₿ $BTC /USDT — BITCOIN AT A CRITICAL TURNING POINT! 🔥📉📈
💰 Price: $81,426.01 (-2.19%)
📈 24H High: $83,250.81
📉 24H Low: $80,939.54
📊 BTC Volume: 19,576.52 BTC
💵 USDT Volume: $1.60B
🇵🇰 PKR Price: Rs 22,522,434.36
🟢 Order Book: 82.01% Buy | 17.99% Sell
🎯 Key Support: $80,939 → $80,835
🚀 Resistance: $81,749 → $82,205 → $82,662 → $83,250
🐂 BULLISH SCENARIO: If BTC holds support and breaks above $81,749, a recovery toward $82,205–$82,662 could be possible.
🐻 BEARISH SCENARIO: A decisive break below $80,939 could bring more selling pressure.
📊 PERFORMANCE:
Today: +0.06% 🟢
7D: -1.19% 🔴
30D: -5.82% 🔴
90D: +26.69% 🟢
180D: +5.32% 🟢
1Y: -24.61% 🔴
🔥 Bitcoin is trying to stabilize after a sharp drop! Buyers dominate the displayed order-book balance, but price action still needs to confirm a genuine recovery. ⚡
👀 THE BIG QUESTION: WILL BTC RECLAIM $82K OR BREAK BELOW $80.9K?
👇 BULLS 🐂 OR BEARS 🐻 — WHAT'S YOUR CALL?
💰 Price: $81,426.01 (-2.19%)
📈 24H High: $83,250.81
📉 24H Low: $80,939.54
📊 BTC Volume: 19,576.52 BTC
💵 USDT Volume: $1.60B
🇵🇰 PKR Price: Rs 22,522,434.36
🟢 Order Book: 82.01% Buy | 17.99% Sell
🎯 Key Support: $80,939 → $80,835
🚀 Resistance: $81,749 → $82,205 → $82,662 → $83,250
🐂 BULLISH SCENARIO: If BTC holds support and breaks above $81,749, a recovery toward $82,205–$82,662 could be possible.
🐻 BEARISH SCENARIO: A decisive break below $80,939 could bring more selling pressure.
📊 PERFORMANCE:
Today: +0.06% 🟢
7D: -1.19% 🔴
30D: -5.82% 🔴
90D: +26.69% 🟢
180D: +5.32% 🟢
1Y: -24.61% 🔴
🔥 Bitcoin is trying to stabilize after a sharp drop! Buyers dominate the displayed order-book balance, but price action still needs to confirm a genuine recovery. ⚡
👀 THE BIG QUESTION: WILL BTC RECLAIM $82K OR BREAK BELOW $80.9K?
👇 BULLS 🐂 OR BEARS 🐻 — WHAT'S YOUR CALL?
1
190
·
--
Рост
#BinancePick is more than a prediction game. It’s a chance to test how well you understand the crypto market. Every pick needs thought, research, and patience. 📊 The real skill is not guessing every move, but learning from the market and making smarter decisions over time. 🚀
#BinancePick #cryptotrading
#BinancePick is more than a prediction game. It’s a chance to test how well you understand the crypto market. Every pick needs thought, research, and patience. 📊 The real skill is not guessing every move, but learning from the market and making smarter decisions over time. 🚀
#BinancePick #cryptotrading
#BinancePick #cryptotrading

1
140
·
--
Рост
$ZEC /USDT — BEARS TAKING CONTROL! 🐻📉**
💰 **Price:** $1,233.19 (-8.31%)
📈 24H High: $1,368.40
📉 24H Low: $1,217.19
📊 ZEC Volume: 248,320.54
💵 USDT Volume: 321.05M
🇵🇰 PKR Price: Rs 341,568.96
🎯 **Support:** $1,217 → $1,209
🚀 **Resistance:** $1,243 → $1,276 → $1,309
🐂 **Bullish:** Reclaiming $1,243 could trigger a recovery attempt.
🐻 **Bearish:** A confirmed break below $1,217 could signal further downside.
📊 **Performance:** Today -8.04% | 7D +6.97% | 30D -16.72% | 90D +142.07% | 180D +240.43% | 1Y +341.51%
⚖️ **Order Book:** Buy 32.30% 🟢 | Sell 67.70% 🔴
🔥 ZEC is under heavy selling pressure, with price near its 24-hour low. Will buyers defend support, or will sellers push lower? 👀
👇 **BULLISH 📈 OR BEARISH 📉?**
{spot}(ZECUSDT)
$ZEC /USDT — BEARS TAKING CONTROL! 🐻📉**
💰 **Price:** $1,233.19 (-8.31%)
📈 24H High: $1,368.40
📉 24H Low: $1,217.19
📊 ZEC Volume: 248,320.54
💵 USDT Volume: 321.05M
🇵🇰 PKR Price: Rs 341,568.96
🎯 **Support:** $1,217 → $1,209
🚀 **Resistance:** $1,243 → $1,276 → $1,309
🐂 **Bullish:** Reclaiming $1,243 could trigger a recovery attempt.
🐻 **Bearish:** A confirmed break below $1,217 could signal further downside.
📊 **Performance:** Today -8.04% | 7D +6.97% | 30D -16.72% | 90D +142.07% | 180D +240.43% | 1Y +341.51%
⚖️ **Order Book:** Buy 32.30% 🟢 | Sell 67.70% 🔴
🔥 ZEC is under heavy selling pressure, with price near its 24-hour low. Will buyers defend support, or will sellers push lower? 👀
👇 **BULLISH 📈 OR BEARISH 📉?**
💰 **Price:** $1,233.19 (-8.31%)
📈 24H High: $1,368.40
📉 24H Low: $1,217.19
📊 ZEC Volume: 248,320.54
💵 USDT Volume: 321.05M
🇵🇰 PKR Price: Rs 341,568.96
🎯 **Support:** $1,217 → $1,209
🚀 **Resistance:** $1,243 → $1,276 → $1,309
🐂 **Bullish:** Reclaiming $1,243 could trigger a recovery attempt.
🐻 **Bearish:** A confirmed break below $1,217 could signal further downside.
📊 **Performance:** Today -8.04% | 7D +6.97% | 30D -16.72% | 90D +142.07% | 180D +240.43% | 1Y +341.51%
⚖️ **Order Book:** Buy 32.30% 🟢 | Sell 67.70% 🔴
🔥 ZEC is under heavy selling pressure, with price near its 24-hour low. Will buyers defend support, or will sellers push lower? 👀
👇 **BULLISH 📈 OR BEARISH 📉?**
308
·
--
Рост
$PROM /USDT — BOUNCE BACK OR MORE DOWNSIDE?** 📈📉
💰 **Price:** $5.644 (+1.44%)
📈 24H High: $6.019
📉 24H Low: $5.550
📊 PROM Volume: 883,655.01
💵 USDT Volume: 5.14M
🇵🇰 PKR Price: Rs 1,563.27
🎯 **Support:** $5.550 → $5.443
🚀 **Resistance:** $5.794 → $5.921 → $6.019
🐂 **Bullish Scenario:** Reclaiming $5.794 could open the way toward higher resistance levels.
🐻 **Bearish Scenario:** Losing $5.550 could bring renewed selling pressure.
📊 **Performance:** Today -2.05% | 7D +10.18% | 30D +11.09% | 90D +212.58% | 180D +160.82% | 1Y -42.24%
⚖️ **Order Book:** Buyers 48.06% 🟢 | Sellers 51.94% 🔴
🔥 PROM has bounced after a sharp drop, but sellers still have a slight order-book advantage. Can bulls recover, or will bears strike again? 👀
👇 **BULLISH 📈 OR BEARISH 📉?**
{spot}(PROMUSDT)
$PROM /USDT — BOUNCE BACK OR MORE DOWNSIDE?** 📈📉
💰 **Price:** $5.644 (+1.44%)
📈 24H High: $6.019
📉 24H Low: $5.550
📊 PROM Volume: 883,655.01
💵 USDT Volume: 5.14M
🇵🇰 PKR Price: Rs 1,563.27
🎯 **Support:** $5.550 → $5.443
🚀 **Resistance:** $5.794 → $5.921 → $6.019
🐂 **Bullish Scenario:** Reclaiming $5.794 could open the way toward higher resistance levels.
🐻 **Bearish Scenario:** Losing $5.550 could bring renewed selling pressure.
📊 **Performance:** Today -2.05% | 7D +10.18% | 30D +11.09% | 90D +212.58% | 180D +160.82% | 1Y -42.24%
⚖️ **Order Book:** Buyers 48.06% 🟢 | Sellers 51.94% 🔴
🔥 PROM has bounced after a sharp drop, but sellers still have a slight order-book advantage. Can bulls recover, or will bears strike again? 👀
👇 **BULLISH 📈 OR BEARISH 📉?**
💰 **Price:** $5.644 (+1.44%)
📈 24H High: $6.019
📉 24H Low: $5.550
📊 PROM Volume: 883,655.01
💵 USDT Volume: 5.14M
🇵🇰 PKR Price: Rs 1,563.27
🎯 **Support:** $5.550 → $5.443
🚀 **Resistance:** $5.794 → $5.921 → $6.019
🐂 **Bullish Scenario:** Reclaiming $5.794 could open the way toward higher resistance levels.
🐻 **Bearish Scenario:** Losing $5.550 could bring renewed selling pressure.
📊 **Performance:** Today -2.05% | 7D +10.18% | 30D +11.09% | 90D +212.58% | 180D +160.82% | 1Y -42.24%
⚖️ **Order Book:** Buyers 48.06% 🟢 | Sellers 51.94% 🔴
🔥 PROM has bounced after a sharp drop, but sellers still have a slight order-book advantage. Can bulls recover, or will bears strike again? 👀
👇 **BULLISH 📈 OR BEARISH 📉?**
328
·
--
Рост
🚀🔥 **$MAGMA USDT PERP — MASSIVE PUMP! BULLS ARE ON FIRE! 🐂💥**
💰 **Price:** $0.49882 (+31.84%)
📈 **24H High:** $0.56898
📉 **24H Low:** $0.30567
📊 **MAGMA Volume:** 899.62M
💵 **USDT Volume:** 414.59M
💸 **PKR Price:** Rs 138.16
🎯 **Support:** $0.466–$0.450
🚀 **Resistance:** $0.524 → $0.569
🐂 **Bullish Breakout:** Above $0.524, a retest of $0.569 could be possible.
🐻 **Bearish Risk:** Below $0.466, price could revisit lower levels.
📊 **Performance:** Today +56.41% | 7D +116.88% | 30D +121.53% | 90D +49.03% | 180D +90.08%
⚠️ After this explosive rally, volatility is HIGH! Don't chase the pump blindly—watch support, resistance, and confirmation.
🔥 **NEXT LEG UP 📈 OR BIG CORRECTION 📉?**
👇 Comment: **LONG 🟢 or SHORT 🔴?**
{alpha}(CT_7840x9f854b3ad20f8161ec0886f15f4a1752bf75d22261556f14cc8d3a1c5d50e529::magma::MAGMA)
🚀🔥 **$MAGMA USDT PERP — MASSIVE PUMP! BULLS ARE ON FIRE! 🐂💥**
💰 **Price:** $0.49882 (+31.84%)
📈 **24H High:** $0.56898
📉 **24H Low:** $0.30567
📊 **MAGMA Volume:** 899.62M
💵 **USDT Volume:** 414.59M
💸 **PKR Price:** Rs 138.16
🎯 **Support:** $0.466–$0.450
🚀 **Resistance:** $0.524 → $0.569
🐂 **Bullish Breakout:** Above $0.524, a retest of $0.569 could be possible.
🐻 **Bearish Risk:** Below $0.466, price could revisit lower levels.
📊 **Performance:** Today +56.41% | 7D +116.88% | 30D +121.53% | 90D +49.03% | 180D +90.08%
⚠️ After this explosive rally, volatility is HIGH! Don't chase the pump blindly—watch support, resistance, and confirmation.
🔥 **NEXT LEG UP 📈 OR BIG CORRECTION 📉?**
👇 Comment: **LONG 🟢 or SHORT 🔴?**
💰 **Price:** $0.49882 (+31.84%)
📈 **24H High:** $0.56898
📉 **24H Low:** $0.30567
📊 **MAGMA Volume:** 899.62M
💵 **USDT Volume:** 414.59M
💸 **PKR Price:** Rs 138.16
🎯 **Support:** $0.466–$0.450
🚀 **Resistance:** $0.524 → $0.569
🐂 **Bullish Breakout:** Above $0.524, a retest of $0.569 could be possible.
🐻 **Bearish Risk:** Below $0.466, price could revisit lower levels.
📊 **Performance:** Today +56.41% | 7D +116.88% | 30D +121.53% | 90D +49.03% | 180D +90.08%
⚠️ After this explosive rally, volatility is HIGH! Don't chase the pump blindly—watch support, resistance, and confirmation.
🔥 **NEXT LEG UP 📈 OR BIG CORRECTION 📉?**
👇 Comment: **LONG 🟢 or SHORT 🔴?**
333
·
--
Рост
$ETH /USDT — BEARS ARE DOMINATING! 🐻📉**
💰 **Price:** $2,398.22 (-4.59%)
📈 **24H High:** $2,526.62
📉 **24H Low:** $2,387.01
📊 **ETH Volume:** 261,601.70 ETH
💵 **USDT Volume:** 641.47M USDT
🔴 **Buy Pressure:** 35.62%
🐻 **Sell Pressure:** 64.38%
🎯 **Key Support:** $2,387
🚀 **Bullish Targets:** $2,410 → $2,441 → $2,472
⚠️ **Bearish Scenario:** A confirmed breakdown below $2,387 could signal further downside.
📊 **Market Performance:**
🔴 Today: -3.98%
🔴 7 Days: -1.37%
🔴 30 Days: -13.05%
🟢 90 Days: +27.47%
🟢 180 Days: +3.34%
🔴 1 Year: -40.25%
🔥 ETH is under heavy selling pressure, but buyers are watching the $2,387 support zone closely! Will Ethereum bounce back or fall further? 👀
👇 **BULLISH 📈 OR BEARISH 📉? Share your prediction!**
{spot}(ETHUSDT)
$ETH /USDT — BEARS ARE DOMINATING! 🐻📉**
💰 **Price:** $2,398.22 (-4.59%)
📈 **24H High:** $2,526.62
📉 **24H Low:** $2,387.01
📊 **ETH Volume:** 261,601.70 ETH
💵 **USDT Volume:** 641.47M USDT
🔴 **Buy Pressure:** 35.62%
🐻 **Sell Pressure:** 64.38%
🎯 **Key Support:** $2,387
🚀 **Bullish Targets:** $2,410 → $2,441 → $2,472
⚠️ **Bearish Scenario:** A confirmed breakdown below $2,387 could signal further downside.
📊 **Market Performance:**
🔴 Today: -3.98%
🔴 7 Days: -1.37%
🔴 30 Days: -13.05%
🟢 90 Days: +27.47%
🟢 180 Days: +3.34%
🔴 1 Year: -40.25%
🔥 ETH is under heavy selling pressure, but buyers are watching the $2,387 support zone closely! Will Ethereum bounce back or fall further? 👀
👇 **BULLISH 📈 OR BEARISH 📉? Share your prediction!**
💰 **Price:** $2,398.22 (-4.59%)
📈 **24H High:** $2,526.62
📉 **24H Low:** $2,387.01
📊 **ETH Volume:** 261,601.70 ETH
💵 **USDT Volume:** 641.47M USDT
🔴 **Buy Pressure:** 35.62%
🐻 **Sell Pressure:** 64.38%
🎯 **Key Support:** $2,387
🚀 **Bullish Targets:** $2,410 → $2,441 → $2,472
⚠️ **Bearish Scenario:** A confirmed breakdown below $2,387 could signal further downside.
📊 **Market Performance:**
🔴 Today: -3.98%
🔴 7 Days: -1.37%
🔴 30 Days: -13.05%
🟢 90 Days: +27.47%
🟢 180 Days: +3.34%
🔴 1 Year: -40.25%
🔥 ETH is under heavy selling pressure, but buyers are watching the $2,387 support zone closely! Will Ethereum bounce back or fall further? 👀
👇 **BULLISH 📈 OR BEARISH 📉? Share your prediction!**
1
184
·
--
Рост
🚨 $NEAR /USDT — BEARS ARE IN CONTROL? 🐻🔥
💰 Price: $4.952 (-7.70%)
📈 24H High: $5.451
📉 24H Low: $4.911
📊 Volume: 27.77M NEAR | 142.65M USDT
🔴 Buy Pressure: 40.82%
🐻 Sell Pressure: 59.18%
🎯 Support: $4.911
🚀 Bullish Targets: $5.003 → $5.122 → $5.240
⚠️ Bearish Scenario: A break below $4.911 could bring further downside.
💚 Long-Term Performance: 7D +2.78% | 30D +22.51% | 90D +163.12% | 180D +250.71% | 1Y +114.37%
🔥 NEAR is facing heavy selling pressure after a sharp drop! Will buyers defend support and spark a recovery, or will bears push prices lower? 👀
👇 BULLISH 📈 OR BEARISH 📉? Drop your prediction!
{spot}(NEARUSDT)
🚨 $NEAR /USDT — BEARS ARE IN CONTROL? 🐻🔥
💰 Price: $4.952 (-7.70%)
📈 24H High: $5.451
📉 24H Low: $4.911
📊 Volume: 27.77M NEAR | 142.65M USDT
🔴 Buy Pressure: 40.82%
🐻 Sell Pressure: 59.18%
🎯 Support: $4.911
🚀 Bullish Targets: $5.003 → $5.122 → $5.240
⚠️ Bearish Scenario: A break below $4.911 could bring further downside.
💚 Long-Term Performance: 7D +2.78% | 30D +22.51% | 90D +163.12% | 180D +250.71% | 1Y +114.37%
🔥 NEAR is facing heavy selling pressure after a sharp drop! Will buyers defend support and spark a recovery, or will bears push prices lower? 👀
👇 BULLISH 📈 OR BEARISH 📉? Drop your prediction!
💰 Price: $4.952 (-7.70%)
📈 24H High: $5.451
📉 24H Low: $4.911
📊 Volume: 27.77M NEAR | 142.65M USDT
🔴 Buy Pressure: 40.82%
🐻 Sell Pressure: 59.18%
🎯 Support: $4.911
🚀 Bullish Targets: $5.003 → $5.122 → $5.240
⚠️ Bearish Scenario: A break below $4.911 could bring further downside.
💚 Long-Term Performance: 7D +2.78% | 30D +22.51% | 90D +163.12% | 180D +250.71% | 1Y +114.37%
🔥 NEAR is facing heavy selling pressure after a sharp drop! Will buyers defend support and spark a recovery, or will bears push prices lower? 👀
👇 BULLISH 📈 OR BEARISH 📉? Drop your prediction!
528
·
--
Рост
🚨 $TRX /USDT — BULLS VS BEARS! 🐂🐻
💰 Price: $0.3305 (-0.48%)
📈 24H High: $0.3334
📉 24H Low: $0.3300
📊 Volume: 79.81M TRX
🟢 Buy Pressure: 55.10%
🔴 Sell Pressure: 44.90%
🎯 Key Support: $0.3300
🚀 Bullish Targets: $0.3313 → $0.3321 → $0.3334
⚠️ Bearish Scenario: A confirmed break below $0.3300 could trigger further downside.
🔥 Will TRX bounce back or break down? BULLISH 📈 or BEARISH 📉?
{spot}(TRXUSDT)
🚨 $TRX /USDT — BULLS VS BEARS! 🐂🐻
💰 Price: $0.3305 (-0.48%)
📈 24H High: $0.3334
📉 24H Low: $0.3300
📊 Volume: 79.81M TRX
🟢 Buy Pressure: 55.10%
🔴 Sell Pressure: 44.90%
🎯 Key Support: $0.3300
🚀 Bullish Targets: $0.3313 → $0.3321 → $0.3334
⚠️ Bearish Scenario: A confirmed break below $0.3300 could trigger further downside.
🔥 Will TRX bounce back or break down? BULLISH 📈 or BEARISH 📉?
💰 Price: $0.3305 (-0.48%)
📈 24H High: $0.3334
📉 24H Low: $0.3300
📊 Volume: 79.81M TRX
🟢 Buy Pressure: 55.10%
🔴 Sell Pressure: 44.90%
🎯 Key Support: $0.3300
🚀 Bullish Targets: $0.3313 → $0.3321 → $0.3334
⚠️ Bearish Scenario: A confirmed break below $0.3300 could trigger further downside.
🔥 Will TRX bounce back or break down? BULLISH 📈 or BEARISH 📉?
268
·
--
Рост
🚀🔥 $TRUMP IS MAKING A STRONG MOVE! BULLS ARE BACK IN ACTION? 🐂📈
💎 TRUMP/USDT | Official Trump
🟢 Current Price: 1.840 USDT
📈 24H Change: +8.50%
🇵🇰 PKR Equivalent: Rs 509.42
🔺 24H High: 1.847 USDT
🔻 24H Low: 1.693 USDT
💰 24H Trading Volume:
• TRUMP: 6.65M
• USDT: 11.93M
🔥 THE MARKET IS HEATING UP!
$TRUMP has climbed strongly from the 1.686 area and is now trading near 1.840, approaching its 24-hour high of 1.847. The 1-hour chart shows a bullish recovery, with buyers pushing the price higher after a period of sideways movement. 💚📊
🐂 BULLISH SCENARIO
If buyers break above 1.847, a sustained move could open the door toward 1.856 and potentially higher levels. Strong volume and a successful breakout would help confirm the momentum.
🐻 BEARISH SCENARIO
If the price gets rejected near 1.847, watch 1.820 as a nearby support area, followed by 1.784. A deeper pullback could bring 1.749 into focus. Losing these levels could weaken the short-term bullish structure.
📊 MARKET PERFORMANCE CHECK
🟢 Today: +2.51%
🔴 7 Days: -3.97%
🔴 30 Days: -10.77%
🟢 90 Days: +13.65%
🔴 180 Days: -35.03%
🔴 1 Year: -69.06%
⚖️ BUYERS VS SELLERS
🟢 Buyers: 62.20%
🔴 Sellers: 37.80%
The order book currently favors buyers, but that doesn't guarantee the next move. Price action around resistance will be crucial!
🎯 KEY LEVELS TO WATCH
🚀 Resistance: 1.847 → 1.856
🛡️ Support: 1.820 → 1.784 → 1.749
⚡ Major nearby low: 1.693
💬 MY TAKE: $TRUMP is showing short-term bullish energy, but the price is approaching resistance. A clean breakout could bring more excitement, while a rejection may trigger a healthy pullback. Smart traders watch confirmation, manage risk, and avoid chasing green candles blindly. 🧠💰
🔥 ARE YOU TEAM BULLS 🐂 OR TEAM BEARS 🐻?
Drop your prediction below! 👇🚀
{spot}(TRUMPUSDT)
🚀🔥 $TRUMP IS MAKING A STRONG MOVE! BULLS ARE BACK IN ACTION? 🐂📈
💎 TRUMP/USDT | Official Trump
🟢 Current Price: 1.840 USDT
📈 24H Change: +8.50%
🇵🇰 PKR Equivalent: Rs 509.42
🔺 24H High: 1.847 USDT
🔻 24H Low: 1.693 USDT
💰 24H Trading Volume:
• TRUMP: 6.65M
• USDT: 11.93M
🔥 THE MARKET IS HEATING UP!
$TRUMP has climbed strongly from the 1.686 area and is now trading near 1.840, approaching its 24-hour high of 1.847. The 1-hour chart shows a bullish recovery, with buyers pushing the price higher after a period of sideways movement. 💚📊
🐂 BULLISH SCENARIO
If buyers break above 1.847, a sustained move could open the door toward 1.856 and potentially higher levels. Strong volume and a successful breakout would help confirm the momentum.
🐻 BEARISH SCENARIO
If the price gets rejected near 1.847, watch 1.820 as a nearby support area, followed by 1.784. A deeper pullback could bring 1.749 into focus. Losing these levels could weaken the short-term bullish structure.
📊 MARKET PERFORMANCE CHECK
🟢 Today: +2.51%
🔴 7 Days: -3.97%
🔴 30 Days: -10.77%
🟢 90 Days: +13.65%
🔴 180 Days: -35.03%
🔴 1 Year: -69.06%
⚖️ BUYERS VS SELLERS
🟢 Buyers: 62.20%
🔴 Sellers: 37.80%
The order book currently favors buyers, but that doesn't guarantee the next move. Price action around resistance will be crucial!
🎯 KEY LEVELS TO WATCH
🚀 Resistance: 1.847 → 1.856
🛡️ Support: 1.820 → 1.784 → 1.749
⚡ Major nearby low: 1.693
💬 MY TAKE: $TRUMP is showing short-term bullish energy, but the price is approaching resistance. A clean breakout could bring more excitement, while a rejection may trigger a healthy pullback. Smart traders watch confirmation, manage risk, and avoid chasing green candles blindly. 🧠💰
🔥 ARE YOU TEAM BULLS 🐂 OR TEAM BEARS 🐻?
Drop your prediction below! 👇🚀
💎 TRUMP/USDT | Official Trump
🟢 Current Price: 1.840 USDT
📈 24H Change: +8.50%
🇵🇰 PKR Equivalent: Rs 509.42
🔺 24H High: 1.847 USDT
🔻 24H Low: 1.693 USDT
💰 24H Trading Volume:
• TRUMP: 6.65M
• USDT: 11.93M
🔥 THE MARKET IS HEATING UP!
$TRUMP has climbed strongly from the 1.686 area and is now trading near 1.840, approaching its 24-hour high of 1.847. The 1-hour chart shows a bullish recovery, with buyers pushing the price higher after a period of sideways movement. 💚📊
🐂 BULLISH SCENARIO
If buyers break above 1.847, a sustained move could open the door toward 1.856 and potentially higher levels. Strong volume and a successful breakout would help confirm the momentum.
🐻 BEARISH SCENARIO
If the price gets rejected near 1.847, watch 1.820 as a nearby support area, followed by 1.784. A deeper pullback could bring 1.749 into focus. Losing these levels could weaken the short-term bullish structure.
📊 MARKET PERFORMANCE CHECK
🟢 Today: +2.51%
🔴 7 Days: -3.97%
🔴 30 Days: -10.77%
🟢 90 Days: +13.65%
🔴 180 Days: -35.03%
🔴 1 Year: -69.06%
⚖️ BUYERS VS SELLERS
🟢 Buyers: 62.20%
🔴 Sellers: 37.80%
The order book currently favors buyers, but that doesn't guarantee the next move. Price action around resistance will be crucial!
🎯 KEY LEVELS TO WATCH
🚀 Resistance: 1.847 → 1.856
🛡️ Support: 1.820 → 1.784 → 1.749
⚡ Major nearby low: 1.693
💬 MY TAKE: $TRUMP is showing short-term bullish energy, but the price is approaching resistance. A clean breakout could bring more excitement, while a rejection may trigger a healthy pullback. Smart traders watch confirmation, manage risk, and avoid chasing green candles blindly. 🧠💰
🔥 ARE YOU TEAM BULLS 🐂 OR TEAM BEARS 🐻?
Drop your prediction below! 👇🚀
1
2
478
·
--
Рост
🚀🔥 $ZEC IS PUMPING! BULLS TAKING CONTROL? 🐂
💎 ZEC/USDT: $1,304.40 (+13.16%)
🔺 24H High: $1,326.87
🔻 24H Low: $1,151.30
💰 24H Volume: $242.92M USDT
🟢 Bullish Target: $1,350 → $1,380
🔴 Support Zones: $1,280 → $1,252.85
📊 Buyers dominate the displayed order book at 79.34%, but resistance near $1,327 remains crucial!
🔥 Breakout or pullback? Watch the levels and trade smart!
{spot}(ZECUSDT)
🚀🔥 $ZEC IS PUMPING! BULLS TAKING CONTROL? 🐂
💎 ZEC/USDT: $1,304.40 (+13.16%)
🔺 24H High: $1,326.87
🔻 24H Low: $1,151.30
💰 24H Volume: $242.92M USDT
🟢 Bullish Target: $1,350 → $1,380
🔴 Support Zones: $1,280 → $1,252.85
📊 Buyers dominate the displayed order book at 79.34%, but resistance near $1,327 remains crucial!
🔥 Breakout or pullback? Watch the levels and trade smart!
💎 ZEC/USDT: $1,304.40 (+13.16%)
🔺 24H High: $1,326.87
🔻 24H Low: $1,151.30
💰 24H Volume: $242.92M USDT
🟢 Bullish Target: $1,350 → $1,380
🔴 Support Zones: $1,280 → $1,252.85
📊 Buyers dominate the displayed order book at 79.34%, but resistance near $1,327 remains crucial!
🔥 Breakout or pullback? Watch the levels and trade smart!
1
1
427
·
--
Рост
🚀🔥 $BNB /USDT — BULLS VS BEARS!
💰 Price: $745.23 (+2.04%)
📈 24H High: $749.99
📉 24H Low: $730.16
💵 24H Volume: $80.26M
🟢 Support: $743–$741.56
🔴 Resistance: $747–$750
🐂 Bullish: A strong breakout above $750 could trigger further upside!
🐻 Bearish: Losing $741.56 could open the door toward $736.80.
⚡ Buyers lead the displayed order book at 57.40%, but volatility remains!
🔥 Will BNB break $750 or drop lower?
💬 Comment: BULLISH 🐂 or BEARISH 🐻
Based on your screenshot; prices are not live-verified. Not financial advice.
{spot}(BNBUSDT)
🚀🔥 $BNB /USDT — BULLS VS BEARS!
💰 Price: $745.23 (+2.04%)
📈 24H High: $749.99
📉 24H Low: $730.16
💵 24H Volume: $80.26M
🟢 Support: $743–$741.56
🔴 Resistance: $747–$750
🐂 Bullish: A strong breakout above $750 could trigger further upside!
🐻 Bearish: Losing $741.56 could open the door toward $736.80.
⚡ Buyers lead the displayed order book at 57.40%, but volatility remains!
🔥 Will BNB break $750 or drop lower?
💬 Comment: BULLISH 🐂 or BEARISH 🐻
Based on your screenshot; prices are not live-verified. Not financial advice.
💰 Price: $745.23 (+2.04%)
📈 24H High: $749.99
📉 24H Low: $730.16
💵 24H Volume: $80.26M
🟢 Support: $743–$741.56
🔴 Resistance: $747–$750
🐂 Bullish: A strong breakout above $750 could trigger further upside!
🐻 Bearish: Losing $741.56 could open the door toward $736.80.
⚡ Buyers lead the displayed order book at 57.40%, but volatility remains!
🔥 Will BNB break $750 or drop lower?
💬 Comment: BULLISH 🐂 or BEARISH 🐻
Based on your screenshot; prices are not live-verified. Not financial advice.
2
213
·
--
Рост
$ETH ($ETH) IS MAKING A MOVE! BULLS ARE BACK IN ACTION!
💎 ETH/USDT MARKET UPDATE 💎
Ethereum is trading at $2,443.97, up +1.68%, and the chart is showing a powerful bullish breakout followed by a short pullback. 👀🔥
📊 THE MARKET BREAKDOWN:
🟢 Current Price: $2,443.97
🚀 24H High: $2,478.00
🔻 24H Low: $2,372.62
📈 24H Change: +1.68%
💰 24H Trading Volume: 205,919.06 ETH
💵 24H Volume (USDT): 497.46M USDT
🐂 BULLISH SIDE — CAN ETH GO HIGHER?
ETH made a strong upward move from the lower price zone, breaking above the $2,413 area and pushing toward $2,478! Buyers are showing strength, and the price is now holding around $2,444 after a sharp rejection from the high. 🔥
If bulls regain momentum and break above $2,460–$2,478, the next upside move could bring fresh opportunities. A confirmed breakout above $2,478 would be an important signal to watch. 🚀
🐻 BEARISH SIDE — DON'T IGNORE THE RISK!
After such a powerful rally, profit-taking can kick in at any moment. If ETH loses the $2,430–$2,413 zone, sellers could push the price toward $2,390. A deeper correction could retest the major intraday low at $2,372.62.
KEY LEVELS TO WATCH:
Resistance 1: $2,460
Major Resistance: $2,478
Breakout Watch: Above $2,478
Immediate Support: $2,430
Key Support: $2,413
Lower Support: $2,390
Major Support: $2,372.62
MARKET SENTIMENT:
The chart shows a strong bullish impulse, but the latest candles suggest that volatility remains high. ETH is currently trading below its 24-hour high, so the next move depends on whether buyers can reclaim resistance or sellers push the price back toward support.
MY TAKE: Don't chase the green candle blindly! Watch the breakout, respect the support levels, and wait for confirmation. The market can reward patience just as quickly as it punishes FOMO.
ETHEREUM IS AT A CRUCIAL MOMENT — WILL THE BULLS PUSH TOWARD $2,500, OR WILL THE BEARS FORCE ANOTHER DIP?
WHAT'S YOUR CALL?
$2,500 NEXT
CORRECTION FIRST
Drop your prediction in the comments! 💬
{spot}(ETHUSDT)
$ETH ($ETH ) IS MAKING A MOVE! BULLS ARE BACK IN ACTION!
💎 ETH/USDT MARKET UPDATE 💎
Ethereum is trading at $2,443.97, up +1.68%, and the chart is showing a powerful bullish breakout followed by a short pullback. 👀🔥
📊 THE MARKET BREAKDOWN:
🟢 Current Price: $2,443.97
🚀 24H High: $2,478.00
🔻 24H Low: $2,372.62
📈 24H Change: +1.68%
💰 24H Trading Volume: 205,919.06 ETH
💵 24H Volume (USDT): 497.46M USDT
🐂 BULLISH SIDE — CAN ETH GO HIGHER?
ETH made a strong upward move from the lower price zone, breaking above the $2,413 area and pushing toward $2,478! Buyers are showing strength, and the price is now holding around $2,444 after a sharp rejection from the high. 🔥
If bulls regain momentum and break above $2,460–$2,478, the next upside move could bring fresh opportunities. A confirmed breakout above $2,478 would be an important signal to watch. 🚀
🐻 BEARISH SIDE — DON'T IGNORE THE RISK!
After such a powerful rally, profit-taking can kick in at any moment. If ETH loses the $2,430–$2,413 zone, sellers could push the price toward $2,390. A deeper correction could retest the major intraday low at $2,372.62.
KEY LEVELS TO WATCH:
Resistance 1: $2,460
Major Resistance: $2,478
Breakout Watch: Above $2,478
Immediate Support: $2,430
Key Support: $2,413
Lower Support: $2,390
Major Support: $2,372.62
MARKET SENTIMENT:
The chart shows a strong bullish impulse, but the latest candles suggest that volatility remains high. ETH is currently trading below its 24-hour high, so the next move depends on whether buyers can reclaim resistance or sellers push the price back toward support.
MY TAKE: Don't chase the green candle blindly! Watch the breakout, respect the support levels, and wait for confirmation. The market can reward patience just as quickly as it punishes FOMO.
ETHEREUM IS AT A CRUCIAL MOMENT — WILL THE BULLS PUSH TOWARD $2,500, OR WILL THE BEARS FORCE ANOTHER DIP?
WHAT'S YOUR CALL?
$2,500 NEXT
CORRECTION FIRST
Drop your prediction in the comments! 💬
💎 ETH/USDT MARKET UPDATE 💎
Ethereum is trading at $2,443.97, up +1.68%, and the chart is showing a powerful bullish breakout followed by a short pullback. 👀🔥
📊 THE MARKET BREAKDOWN:
🟢 Current Price: $2,443.97
🚀 24H High: $2,478.00
🔻 24H Low: $2,372.62
📈 24H Change: +1.68%
💰 24H Trading Volume: 205,919.06 ETH
💵 24H Volume (USDT): 497.46M USDT
🐂 BULLISH SIDE — CAN ETH GO HIGHER?
ETH made a strong upward move from the lower price zone, breaking above the $2,413 area and pushing toward $2,478! Buyers are showing strength, and the price is now holding around $2,444 after a sharp rejection from the high. 🔥
If bulls regain momentum and break above $2,460–$2,478, the next upside move could bring fresh opportunities. A confirmed breakout above $2,478 would be an important signal to watch. 🚀
🐻 BEARISH SIDE — DON'T IGNORE THE RISK!
After such a powerful rally, profit-taking can kick in at any moment. If ETH loses the $2,430–$2,413 zone, sellers could push the price toward $2,390. A deeper correction could retest the major intraday low at $2,372.62.
KEY LEVELS TO WATCH:
Resistance 1: $2,460
Major Resistance: $2,478
Breakout Watch: Above $2,478
Immediate Support: $2,430
Key Support: $2,413
Lower Support: $2,390
Major Support: $2,372.62
MARKET SENTIMENT:
The chart shows a strong bullish impulse, but the latest candles suggest that volatility remains high. ETH is currently trading below its 24-hour high, so the next move depends on whether buyers can reclaim resistance or sellers push the price back toward support.
MY TAKE: Don't chase the green candle blindly! Watch the breakout, respect the support levels, and wait for confirmation. The market can reward patience just as quickly as it punishes FOMO.
ETHEREUM IS AT A CRUCIAL MOMENT — WILL THE BULLS PUSH TOWARD $2,500, OR WILL THE BEARS FORCE ANOTHER DIP?
WHAT'S YOUR CALL?
$2,500 NEXT
CORRECTION FIRST
Drop your prediction in the comments! 💬
251
·
--
Статья
Bitcoin Short Squeeze Incoming? Why the $84.5K–$87K Zone Could Decide BTC’s Next MoveBitcoin Short Squeeze Incoming? Why the $84.5K–$87K Zone Could Decide BTC’s Next Move
Bitcoin is sending mixed signals, and the next move could catch traders on either side off guard.
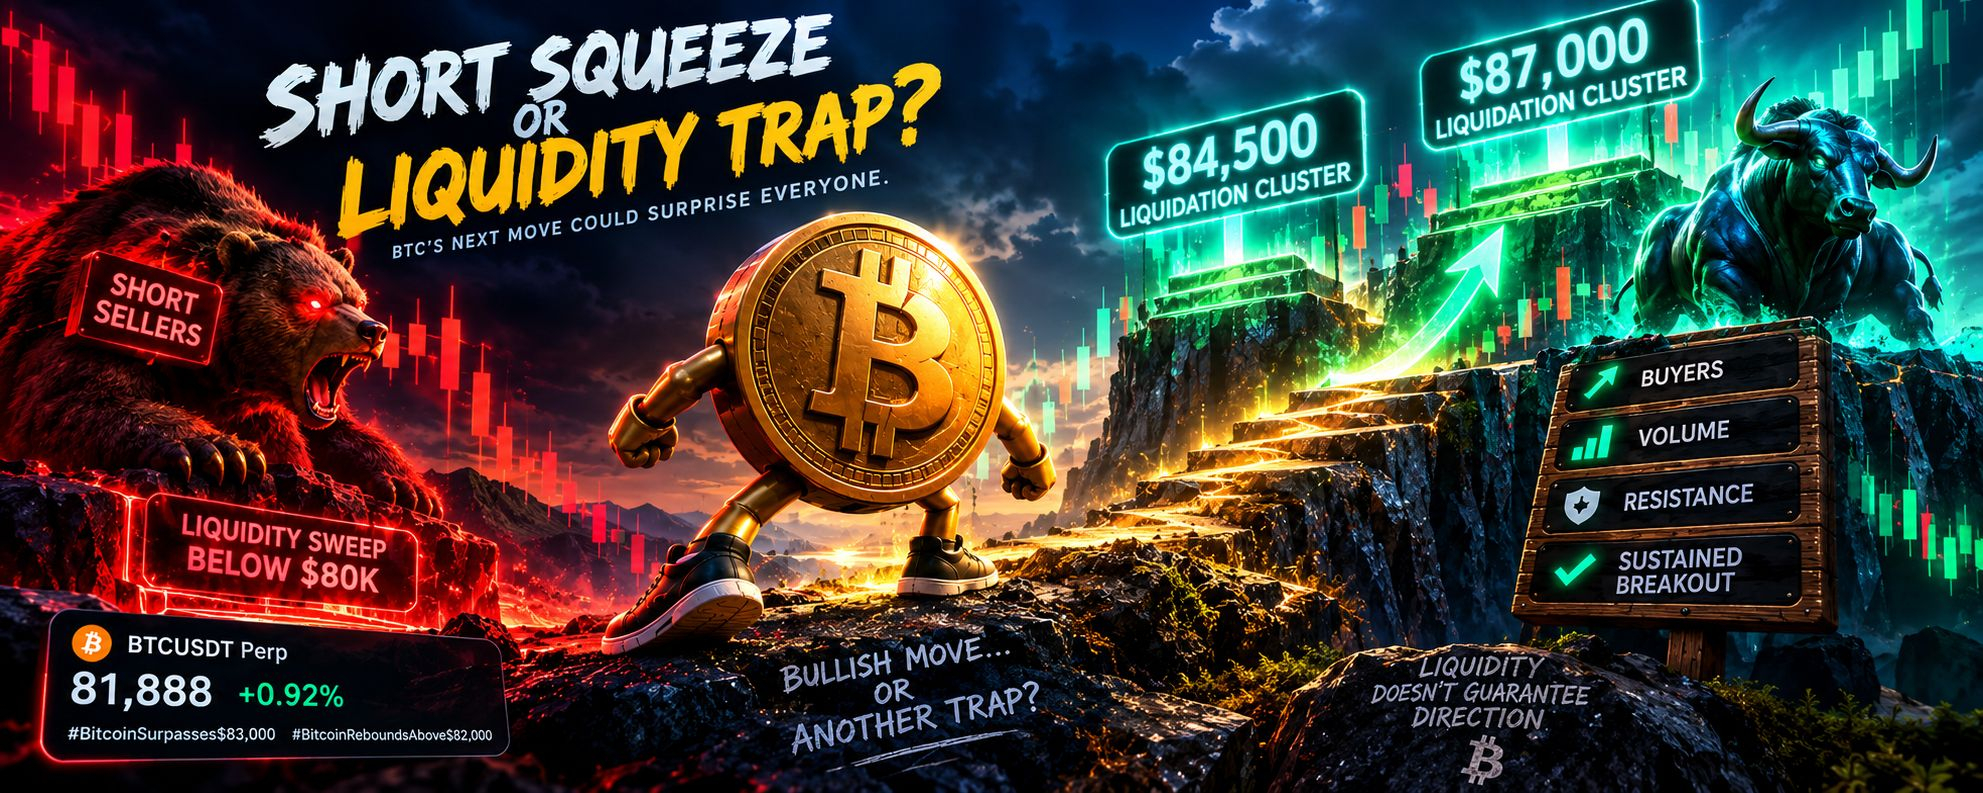
After sweeping liquidity below $80,000, BTC has started attracting renewed bullish attention. With the price rebounding, the market is now focused on whether Bitcoin can build enough momentum to challenge the $84,500 and $87,000 levels—or whether traders are getting ahead of themselves.
Could this be the beginning of a short squeeze, or is the market setting up another trap?
Why $84,500 and $87,000 Matter
Liquidation data points to potential clusters of short positions around $84,500 and $87,000. If Bitcoin moves into these areas, bearish traders using leverage could face forced liquidations. Their positions may need to be closed through buy orders, potentially adding fuel to the rally.
This is the mechanism behind a short squeeze: rising prices pressure short sellers, their exits create additional buying, and that buying can accelerate the upward move.
But there is an important distinction between identifying where liquidations may occur and predicting where Bitcoin will actually trade.
Liquidity can create the conditions for volatility, but it cannot guarantee direction.
The Bullish Setup Needs Confirmation
If BTC approaches $84,500, the market will need to show whether buyers have enough strength to push through resistance. A brief move above the level may attract momentum traders, but a breakout that quickly reverses could leave late buyers trapped.
The more convincing signal would be a sustained move above $84,500, followed by evidence that the level is holding as support. That would strengthen the case for a potential test of $87,000, where another concentration of leveraged positions could amplify price action.
Until then, the upside scenario remains a possibility—not a confirmed outcome.
Could the Short Squeeze Narrative Become a Trap?
Markets often punish crowded expectations. When traders become convinced that price must move toward a visible liquidation cluster, they can position themselves too aggressively in anticipation of that move.
If buying momentum fades near resistance, Bitcoin could reject the breakout and move lower instead. Traders entering late on bullish expectations might then be forced to exit, adding selling pressure to an already weakening market.
That is why the reaction at resistance matters more than the liquidation levels alone. Traders need to watch whether volume supports the advance, whether sellers continue to defend key prices, and whether BTC can maintain gains after breaking through resistance.
What Should Bitcoin Traders Watch Next?
For now, three areas stand out:
- Below $80,000: The previous liquidity sweep remains an important reference point if bearish pressure returns.
- Around $84,500: A decisive break and sustained acceptance could strengthen the bullish case.
- Near $87,000: If momentum carries BTC higher, this area could become the next major test for a potential short squeeze.
With BTC recently quoted around $81,888 in the scenario above, the gap to these resistance levels leaves room for either a continuation move or another rejection. The key is whether buyers can turn the rebound into a sustained trend.
Final Thoughts
Bitcoin may be preparing for a move toward $84,500–$87,000, and a wave of short liquidations could accelerate the rally if price reaches those zones. However, assuming that the market must target these levels simply because liquidity is present would be a mistake.
The real signal will come from price action: Can BTC break resistance, hold above it, and attract continued buying—or will the rally lose momentum before the squeeze develops?
Until that becomes clearer, both scenarios deserve consideration. In a market driven by leverage and expectations, the most obvious trade is not always the safest one.
What’s your take on BTC right now? Is a short squeeze toward $87K building, or are bullish traders walking straight into a liquidity trap?
$BTC | BTCUSDT Perpetual
#Bitcoin #BTCUSDT #BitcoinAnalysis #cryptotrading #ShortSqueeze
Bitcoin Short Squeeze Incoming? Why the $84.5K–$87K Zone Could Decide BTC’s Next Move
Bitcoin Short Squeeze Incoming? Why the $84.5K–$87K Zone Could Decide BTC’s Next Move
Bitcoin is sending mixed signals, and the next move could catch traders on either side off guard.
After sweeping liquidity below $80,000, BTC has started attracting renewed bullish attention. With the price rebounding, the market is now focused on whether Bitcoin can build enough momentum to challenge the $84,500 and $87,000 levels—or whether traders are getting ahead of themselves.
Could this be the beginning of a short squeeze, or is the market setting up another trap?
Why $84,500 and $87,000 Matter
Liquidation data points to potential clusters of short positions around $84,500 and $87,000. If Bitcoin moves into these areas, bearish traders using leverage could face forced liquidations. Their positions may need to be closed through buy orders, potentially adding fuel to the rally.
This is the mechanism behind a short squeeze: rising prices pressure short sellers, their exits create additional buying, and that buying can accelerate the upward move.
But there is an important distinction between identifying where liquidations may occur and predicting where Bitcoin will actually trade.
Liquidity can create the conditions for volatility, but it cannot guarantee direction.
The Bullish Setup Needs Confirmation
If BTC approaches $84,500, the market will need to show whether buyers have enough strength to push through resistance. A brief move above the level may attract momentum traders, but a breakout that quickly reverses could leave late buyers trapped.
The more convincing signal would be a sustained move above $84,500, followed by evidence that the level is holding as support. That would strengthen the case for a potential test of $87,000, where another concentration of leveraged positions could amplify price action.
Until then, the upside scenario remains a possibility—not a confirmed outcome.
Could the Short Squeeze Narrative Become a Trap?
Markets often punish crowded expectations. When traders become convinced that price must move toward a visible liquidation cluster, they can position themselves too aggressively in anticipation of that move.
If buying momentum fades near resistance, Bitcoin could reject the breakout and move lower instead. Traders entering late on bullish expectations might then be forced to exit, adding selling pressure to an already weakening market.
That is why the reaction at resistance matters more than the liquidation levels alone. Traders need to watch whether volume supports the advance, whether sellers continue to defend key prices, and whether BTC can maintain gains after breaking through resistance.
What Should Bitcoin Traders Watch Next?
For now, three areas stand out:
- Below $80,000: The previous liquidity sweep remains an important reference point if bearish pressure returns.
- Around $84,500: A decisive break and sustained acceptance could strengthen the bullish case.
- Near $87,000: If momentum carries BTC higher, this area could become the next major test for a potential short squeeze.
With BTC recently quoted around $81,888 in the scenario above, the gap to these resistance levels leaves room for either a continuation move or another rejection. The key is whether buyers can turn the rebound into a sustained trend.
Final Thoughts
Bitcoin may be preparing for a move toward $84,500–$87,000, and a wave of short liquidations could accelerate the rally if price reaches those zones. However, assuming that the market must target these levels simply because liquidity is present would be a mistake.
The real signal will come from price action: Can BTC break resistance, hold above it, and attract continued buying—or will the rally lose momentum before the squeeze develops?
Until that becomes clearer, both scenarios deserve consideration. In a market driven by leverage and expectations, the most obvious trade is not always the safest one.
What’s your take on BTC right now? Is a short squeeze toward $87K building, or are bullish traders walking straight into a liquidity trap?
$BTC | BTCUSDT Perpetual
#Bitcoin #BTCUSDT #BitcoinAnalysis #cryptotrading #ShortSqueeze
Bitcoin is sending mixed signals, and the next move could catch traders on either side off guard.
After sweeping liquidity below $80,000, BTC has started attracting renewed bullish attention. With the price rebounding, the market is now focused on whether Bitcoin can build enough momentum to challenge the $84,500 and $87,000 levels—or whether traders are getting ahead of themselves.
Could this be the beginning of a short squeeze, or is the market setting up another trap?
Why $84,500 and $87,000 Matter
Liquidation data points to potential clusters of short positions around $84,500 and $87,000. If Bitcoin moves into these areas, bearish traders using leverage could face forced liquidations. Their positions may need to be closed through buy orders, potentially adding fuel to the rally.
This is the mechanism behind a short squeeze: rising prices pressure short sellers, their exits create additional buying, and that buying can accelerate the upward move.
But there is an important distinction between identifying where liquidations may occur and predicting where Bitcoin will actually trade.
Liquidity can create the conditions for volatility, but it cannot guarantee direction.
The Bullish Setup Needs Confirmation
If BTC approaches $84,500, the market will need to show whether buyers have enough strength to push through resistance. A brief move above the level may attract momentum traders, but a breakout that quickly reverses could leave late buyers trapped.
The more convincing signal would be a sustained move above $84,500, followed by evidence that the level is holding as support. That would strengthen the case for a potential test of $87,000, where another concentration of leveraged positions could amplify price action.
Until then, the upside scenario remains a possibility—not a confirmed outcome.
Could the Short Squeeze Narrative Become a Trap?
Markets often punish crowded expectations. When traders become convinced that price must move toward a visible liquidation cluster, they can position themselves too aggressively in anticipation of that move.
If buying momentum fades near resistance, Bitcoin could reject the breakout and move lower instead. Traders entering late on bullish expectations might then be forced to exit, adding selling pressure to an already weakening market.
That is why the reaction at resistance matters more than the liquidation levels alone. Traders need to watch whether volume supports the advance, whether sellers continue to defend key prices, and whether BTC can maintain gains after breaking through resistance.
What Should Bitcoin Traders Watch Next?
For now, three areas stand out:
- Below $80,000: The previous liquidity sweep remains an important reference point if bearish pressure returns.
- Around $84,500: A decisive break and sustained acceptance could strengthen the bullish case.
- Near $87,000: If momentum carries BTC higher, this area could become the next major test for a potential short squeeze.
With BTC recently quoted around $81,888 in the scenario above, the gap to these resistance levels leaves room for either a continuation move or another rejection. The key is whether buyers can turn the rebound into a sustained trend.
Final Thoughts
Bitcoin may be preparing for a move toward $84,500–$87,000, and a wave of short liquidations could accelerate the rally if price reaches those zones. However, assuming that the market must target these levels simply because liquidity is present would be a mistake.
The real signal will come from price action: Can BTC break resistance, hold above it, and attract continued buying—or will the rally lose momentum before the squeeze develops?
Until that becomes clearer, both scenarios deserve consideration. In a market driven by leverage and expectations, the most obvious trade is not always the safest one.
What’s your take on BTC right now? Is a short squeeze toward $87K building, or are bullish traders walking straight into a liquidity trap?
$BTC | BTCUSDT Perpetual
#Bitcoin #BTCUSDT #BitcoinAnalysis #cryptotrading #ShortSqueeze
1
227
·
--
Рост
🚨 $ETH ALERT: ETH TAKES A SHARP HIT — CAN THE BULLS FIGHT BACK? 📉🔥
Ethereum is under pressure! ETH dropped from the $2,430 high toward $2,356.79, with sellers pushing price down aggressively. Now trading at $2,365.37, the next move could be crucial. 👀
📊 ETH/USDT MARKET UPDATE
💰 Current Price: $2,365.37
🔴 24H Change: -2.09%
🚀 24H High: $2,430.00
🛡️ 24H Low: $2,356.79
📈 24H Volume: 146,569.19 ETH
💵 USDT Volume: 350.93M
🇵🇰 Approx. Price: Rs 655,207.49
🎯 KEY LEVELS TO WATCH
🛡️ Support: $2,356.79
⚠️ Immediate Resistance: $2,369.24
🚀 Next Resistance: $2,385.34
🔥 Major Resistance: $2,401.45–$2,417.55
🏆 Key High: $2,430.00
🐂 BULLISH SCENARIO
If ETH holds above $2,356.79 and reclaims $2,369.24, buyers could attempt a recovery toward $2,385.34. A stronger breakout may bring $2,401–$2,417 into focus.
🐻 BEARISH SCENARIO
If ETH breaks below $2,356.79, further downside pressure could emerge, with the $2,353 area as the next visible chart reference. Watch for confirmation before entering a trade.
📉 THE BIGGER PICTURE
• Today: -0.12%
• 7 Days: -6.70%
• 30 Days: -9.50%
• 90 Days: +24.52%
• 180 Days: +2.27%
• 1 Year: -39.17%
⚡ THE SURPRISING DETAIL: The displayed order book shows 97.97% buy-side vs. 2.03% sell-side. That looks heavily tilted toward buyers, but it doesn't guarantee a rebound. Order-book liquidity can change quickly, and ETH's recent candles still show strong selling pressure.
🔥 MY TAKE: ETH is sitting near a critical support zone. Bulls need to defend the recent low and reclaim resistance to build recovery momentum. If support fails, downside risk remains.
💬 YOUR CALL:
🐂 ETH bounce toward $2,400?
🐻 Or another breakdown below $2,356?
Drop your prediction below! 👇
{spot}(ETHUSDT)
🚨 $ETH ALERT: ETH TAKES A SHARP HIT — CAN THE BULLS FIGHT BACK? 📉🔥
Ethereum is under pressure! ETH dropped from the $2,430 high toward $2,356.79, with sellers pushing price down aggressively. Now trading at $2,365.37, the next move could be crucial. 👀
📊 ETH/USDT MARKET UPDATE
💰 Current Price: $2,365.37
🔴 24H Change: -2.09%
🚀 24H High: $2,430.00
🛡️ 24H Low: $2,356.79
📈 24H Volume: 146,569.19 ETH
💵 USDT Volume: 350.93M
🇵🇰 Approx. Price: Rs 655,207.49
🎯 KEY LEVELS TO WATCH
🛡️ Support: $2,356.79
⚠️ Immediate Resistance: $2,369.24
🚀 Next Resistance: $2,385.34
🔥 Major Resistance: $2,401.45–$2,417.55
🏆 Key High: $2,430.00
🐂 BULLISH SCENARIO
If ETH holds above $2,356.79 and reclaims $2,369.24, buyers could attempt a recovery toward $2,385.34. A stronger breakout may bring $2,401–$2,417 into focus.
🐻 BEARISH SCENARIO
If ETH breaks below $2,356.79, further downside pressure could emerge, with the $2,353 area as the next visible chart reference. Watch for confirmation before entering a trade.
📉 THE BIGGER PICTURE
• Today: -0.12%
• 7 Days: -6.70%
• 30 Days: -9.50%
• 90 Days: +24.52%
• 180 Days: +2.27%
• 1 Year: -39.17%
⚡ THE SURPRISING DETAIL: The displayed order book shows 97.97% buy-side vs. 2.03% sell-side. That looks heavily tilted toward buyers, but it doesn't guarantee a rebound. Order-book liquidity can change quickly, and ETH's recent candles still show strong selling pressure.
🔥 MY TAKE: ETH is sitting near a critical support zone. Bulls need to defend the recent low and reclaim resistance to build recovery momentum. If support fails, downside risk remains.
💬 YOUR CALL:
🐂 ETH bounce toward $2,400?
🐻 Or another breakdown below $2,356?
Drop your prediction below! 👇
Ethereum is under pressure! ETH dropped from the $2,430 high toward $2,356.79, with sellers pushing price down aggressively. Now trading at $2,365.37, the next move could be crucial. 👀
📊 ETH/USDT MARKET UPDATE
💰 Current Price: $2,365.37
🔴 24H Change: -2.09%
🚀 24H High: $2,430.00
🛡️ 24H Low: $2,356.79
📈 24H Volume: 146,569.19 ETH
💵 USDT Volume: 350.93M
🇵🇰 Approx. Price: Rs 655,207.49
🎯 KEY LEVELS TO WATCH
🛡️ Support: $2,356.79
⚠️ Immediate Resistance: $2,369.24
🚀 Next Resistance: $2,385.34
🔥 Major Resistance: $2,401.45–$2,417.55
🏆 Key High: $2,430.00
🐂 BULLISH SCENARIO
If ETH holds above $2,356.79 and reclaims $2,369.24, buyers could attempt a recovery toward $2,385.34. A stronger breakout may bring $2,401–$2,417 into focus.
🐻 BEARISH SCENARIO
If ETH breaks below $2,356.79, further downside pressure could emerge, with the $2,353 area as the next visible chart reference. Watch for confirmation before entering a trade.
📉 THE BIGGER PICTURE
• Today: -0.12%
• 7 Days: -6.70%
• 30 Days: -9.50%
• 90 Days: +24.52%
• 180 Days: +2.27%
• 1 Year: -39.17%
⚡ THE SURPRISING DETAIL: The displayed order book shows 97.97% buy-side vs. 2.03% sell-side. That looks heavily tilted toward buyers, but it doesn't guarantee a rebound. Order-book liquidity can change quickly, and ETH's recent candles still show strong selling pressure.
🔥 MY TAKE: ETH is sitting near a critical support zone. Bulls need to defend the recent low and reclaim resistance to build recovery momentum. If support fails, downside risk remains.
💬 YOUR CALL:
🐂 ETH bounce toward $2,400?
🐻 Or another breakdown below $2,356?
Drop your prediction below! 👇
135
·
--
Рост
🚨 ₿ $BTC ALERT: BTC FACES SELLING PRESSURE — BOUNCE OR BREAKDOWN? 📉🔥
Bitcoin surged toward $82,295, but sellers came in aggressively and pushed BTC back to $81,150. Now the market is trying to stabilize after a sharp drop. The next move could be crucial. 👀
📊 BTC/USDT MARKET UPDATE
💰 Current Price: $81,150.05
🔴 24H Change: -0.47%
🟢 24H High: $82,295.47
🔻 24H Low: $80,819.66
📈 24H Volume: 8,857.58 BTC
💵 USDT Volume: 722.60M
🇵🇰 Approx. Price: Rs 22,478,563.85
🎯 KEY LEVELS TO WATCH
🛡️ Support: $81,070–$80,819
⚠️ Resistance: $81,395
🚀 Next Resistance: $81,720
🔥 Major Resistance: $82,045–$82,295
🐂 BULLISH SCENARIO
If BTC holds above the recent low and reclaims $81,395, buyers could attempt a recovery toward $81,720. A stronger breakout may open the way toward $82,045 and the $82,295 high.
🐻 BEARISH SCENARIO
If BTC loses the $80,819 support zone, selling pressure could intensify. Watch for confirmation before assuming a further breakdown.
📉 THE BIGGER PICTURE
• Today: -0.44%
• 7 Days: -2.27%
• 30 Days: +5.97%
• 90 Days: +25.96%
• 180 Days: +6.16%
• 1 Year: -23.93%
⚖️ THE WARNING SIGNAL: The order book shows 25.34% buy-side vs. 74.66% sell-side in this snapshot. Sellers appear dominant in the displayed order book, but these figures can change quickly and do not guarantee the next move.
🔥 MY TAKE: BTC is at a critical short-term decision zone. Bulls need to reclaim resistance to build recovery momentum, while bears will be watching the recent low closely.
💬 What's your prediction?
🐂 BTC back above $82K?
🐻 Or a retest below $80.8K?
Drop your analysis below! 👇
{spot}(BTCUSDT)
🚨 ₿ $BTC ALERT: BTC FACES SELLING PRESSURE — BOUNCE OR BREAKDOWN? 📉🔥
Bitcoin surged toward $82,295, but sellers came in aggressively and pushed BTC back to $81,150. Now the market is trying to stabilize after a sharp drop. The next move could be crucial. 👀
📊 BTC/USDT MARKET UPDATE
💰 Current Price: $81,150.05
🔴 24H Change: -0.47%
🟢 24H High: $82,295.47
🔻 24H Low: $80,819.66
📈 24H Volume: 8,857.58 BTC
💵 USDT Volume: 722.60M
🇵🇰 Approx. Price: Rs 22,478,563.85
🎯 KEY LEVELS TO WATCH
🛡️ Support: $81,070–$80,819
⚠️ Resistance: $81,395
🚀 Next Resistance: $81,720
🔥 Major Resistance: $82,045–$82,295
🐂 BULLISH SCENARIO
If BTC holds above the recent low and reclaims $81,395, buyers could attempt a recovery toward $81,720. A stronger breakout may open the way toward $82,045 and the $82,295 high.
🐻 BEARISH SCENARIO
If BTC loses the $80,819 support zone, selling pressure could intensify. Watch for confirmation before assuming a further breakdown.
📉 THE BIGGER PICTURE
• Today: -0.44%
• 7 Days: -2.27%
• 30 Days: +5.97%
• 90 Days: +25.96%
• 180 Days: +6.16%
• 1 Year: -23.93%
⚖️ THE WARNING SIGNAL: The order book shows 25.34% buy-side vs. 74.66% sell-side in this snapshot. Sellers appear dominant in the displayed order book, but these figures can change quickly and do not guarantee the next move.
🔥 MY TAKE: BTC is at a critical short-term decision zone. Bulls need to reclaim resistance to build recovery momentum, while bears will be watching the recent low closely.
💬 What's your prediction?
🐂 BTC back above $82K?
🐻 Or a retest below $80.8K?
Drop your analysis below! 👇
Bitcoin surged toward $82,295, but sellers came in aggressively and pushed BTC back to $81,150. Now the market is trying to stabilize after a sharp drop. The next move could be crucial. 👀
📊 BTC/USDT MARKET UPDATE
💰 Current Price: $81,150.05
🔴 24H Change: -0.47%
🟢 24H High: $82,295.47
🔻 24H Low: $80,819.66
📈 24H Volume: 8,857.58 BTC
💵 USDT Volume: 722.60M
🇵🇰 Approx. Price: Rs 22,478,563.85
🎯 KEY LEVELS TO WATCH
🛡️ Support: $81,070–$80,819
⚠️ Resistance: $81,395
🚀 Next Resistance: $81,720
🔥 Major Resistance: $82,045–$82,295
🐂 BULLISH SCENARIO
If BTC holds above the recent low and reclaims $81,395, buyers could attempt a recovery toward $81,720. A stronger breakout may open the way toward $82,045 and the $82,295 high.
🐻 BEARISH SCENARIO
If BTC loses the $80,819 support zone, selling pressure could intensify. Watch for confirmation before assuming a further breakdown.
📉 THE BIGGER PICTURE
• Today: -0.44%
• 7 Days: -2.27%
• 30 Days: +5.97%
• 90 Days: +25.96%
• 180 Days: +6.16%
• 1 Year: -23.93%
⚖️ THE WARNING SIGNAL: The order book shows 25.34% buy-side vs. 74.66% sell-side in this snapshot. Sellers appear dominant in the displayed order book, but these figures can change quickly and do not guarantee the next move.
🔥 MY TAKE: BTC is at a critical short-term decision zone. Bulls need to reclaim resistance to build recovery momentum, while bears will be watching the recent low closely.
💬 What's your prediction?
🐂 BTC back above $82K?
🐻 Or a retest below $80.8K?
Drop your analysis below! 👇
1
205
·
--
Рост
🚨🔥 $ERA /USDT: BIG PUMP, HARD PULLBACK — WHAT COMES NEXT?
ERA made a powerful move toward $0.0800, but sellers stepped in hard. Now trading at $0.0660 (+4.43%), the battle between bulls and bears is getting interesting. 👀📊
📈 MARKET SNAPSHOT
🟢 Price: $0.0660
🟢 24H Change: +4.43%
🚀 24H High: $0.0800
🛡️ 24H Low: $0.0614
📊 24H Volume: 161.04M ERA
💰 Trading Volume: 11.49M USDT
🇵🇰 Approx. Price: Rs 18.28
🎯 KEY LEVELS TO WATCH
🛡️ Support: $0.0614–$0.0640
⚠️ Immediate Resistance: $0.0687
🚀 Next Resistance: $0.0727
🔥 Major Resistance: $0.0768–$0.0800
🐂 BULLISH SCENARIO
If buyers defend the current area and reclaim $0.0687, ERA could attempt a recovery toward $0.0727. A stronger move above that level could bring $0.0768 back into focus.
🐻 BEARISH SCENARIO
If selling pressure continues and $0.0640 gives way, the market could retest $0.0614. A decisive break below that low would signal further downside risk.
📊 PERFORMANCE CHECK
• Today: +4.27%
• 7 Days: -17.29%
• 30 Days: +13.99%
• 90 Days: +4.27%
• 180 Days: -52.48%
• 1 Year: -82.41%
⚡ THE INTERESTING PART?
The order book shows 71.54% buy-side vs. 28.46% sell-side in this snapshot. That looks encouraging for buyers, but order-book balances can change quickly and don't guarantee a price increase.
ERA has bounced from its $0.0614 low, surged to $0.0800, and then pulled back sharply. The next big question is simple: will buyers step in again, or will sellers take control?
💬 What’s your call?
🐂 ERA recovery toward $0.0727?
🐻 Or another test of $0.0614?
Stay sharp. Manage risk. Never chase a pump blindly. DYOR. 🔍
{spot}(ERAUSDT)
🚨🔥 $ERA /USDT: BIG PUMP, HARD PULLBACK — WHAT COMES NEXT?
ERA made a powerful move toward $0.0800, but sellers stepped in hard. Now trading at $0.0660 (+4.43%), the battle between bulls and bears is getting interesting. 👀📊
📈 MARKET SNAPSHOT
🟢 Price: $0.0660
🟢 24H Change: +4.43%
🚀 24H High: $0.0800
🛡️ 24H Low: $0.0614
📊 24H Volume: 161.04M ERA
💰 Trading Volume: 11.49M USDT
🇵🇰 Approx. Price: Rs 18.28
🎯 KEY LEVELS TO WATCH
🛡️ Support: $0.0614–$0.0640
⚠️ Immediate Resistance: $0.0687
🚀 Next Resistance: $0.0727
🔥 Major Resistance: $0.0768–$0.0800
🐂 BULLISH SCENARIO
If buyers defend the current area and reclaim $0.0687, ERA could attempt a recovery toward $0.0727. A stronger move above that level could bring $0.0768 back into focus.
🐻 BEARISH SCENARIO
If selling pressure continues and $0.0640 gives way, the market could retest $0.0614. A decisive break below that low would signal further downside risk.
📊 PERFORMANCE CHECK
• Today: +4.27%
• 7 Days: -17.29%
• 30 Days: +13.99%
• 90 Days: +4.27%
• 180 Days: -52.48%
• 1 Year: -82.41%
⚡ THE INTERESTING PART?
The order book shows 71.54% buy-side vs. 28.46% sell-side in this snapshot. That looks encouraging for buyers, but order-book balances can change quickly and don't guarantee a price increase.
ERA has bounced from its $0.0614 low, surged to $0.0800, and then pulled back sharply. The next big question is simple: will buyers step in again, or will sellers take control?
💬 What’s your call?
🐂 ERA recovery toward $0.0727?
🐻 Or another test of $0.0614?
Stay sharp. Manage risk. Never chase a pump blindly. DYOR. 🔍
ERA made a powerful move toward $0.0800, but sellers stepped in hard. Now trading at $0.0660 (+4.43%), the battle between bulls and bears is getting interesting. 👀📊
📈 MARKET SNAPSHOT
🟢 Price: $0.0660
🟢 24H Change: +4.43%
🚀 24H High: $0.0800
🛡️ 24H Low: $0.0614
📊 24H Volume: 161.04M ERA
💰 Trading Volume: 11.49M USDT
🇵🇰 Approx. Price: Rs 18.28
🎯 KEY LEVELS TO WATCH
🛡️ Support: $0.0614–$0.0640
⚠️ Immediate Resistance: $0.0687
🚀 Next Resistance: $0.0727
🔥 Major Resistance: $0.0768–$0.0800
🐂 BULLISH SCENARIO
If buyers defend the current area and reclaim $0.0687, ERA could attempt a recovery toward $0.0727. A stronger move above that level could bring $0.0768 back into focus.
🐻 BEARISH SCENARIO
If selling pressure continues and $0.0640 gives way, the market could retest $0.0614. A decisive break below that low would signal further downside risk.
📊 PERFORMANCE CHECK
• Today: +4.27%
• 7 Days: -17.29%
• 30 Days: +13.99%
• 90 Days: +4.27%
• 180 Days: -52.48%
• 1 Year: -82.41%
⚡ THE INTERESTING PART?
The order book shows 71.54% buy-side vs. 28.46% sell-side in this snapshot. That looks encouraging for buyers, but order-book balances can change quickly and don't guarantee a price increase.
ERA has bounced from its $0.0614 low, surged to $0.0800, and then pulled back sharply. The next big question is simple: will buyers step in again, or will sellers take control?
💬 What’s your call?
🐂 ERA recovery toward $0.0727?
🐻 Or another test of $0.0614?
Stay sharp. Manage risk. Never chase a pump blindly. DYOR. 🔍
343
·
--
Рост
🚨 $XRP /USDT: Bulls Are Fighting Back, But the Pressure Is Still ON! 📉⚡
XRP is trading at $1.2739, down 1.89% in the latest snapshot. After a sharp sell-off, the market is trying to stabilize near the lows. 👀
📊 Market Breakdown
🔴 Current Price: $1.2739
🔻 24H Change: -1.89%
🟢 24H High: $1.3063
🔴 24H Low: $1.2687
📉 24H Volume: 59.26M XRP
💵 Volume in USDT: 76.32M
📉 Key Levels to Watch
🛡️ Support: $1.2687 — the key recent low
⚠️ Resistance: $1.2751, then $1.2834
🚀 Major Resistance: $1.2999–$1.3063
🔥 What's Happening?
Sellers pushed XRP down aggressively, but buyers are now attempting a small rebound around $1.27. The bounce is worth watching, but it’s not yet a confirmed trend reversal.
🐂 Bullish Scenario: If XRP holds above $1.2687 and reclaims $1.2751, buyers could attempt a move toward $1.2834.
🐻 Bearish Scenario: If $1.2687 breaks decisively, selling pressure could increase. Watch price action carefully before jumping in.
📈 Market Performance
• Today: -1.87%
• 7 Days: -9.29%
• 30 Days: -1.66%
• 90 Days: +16.56%
• 180 Days: -11.09%
• 1 Year: -44.74%
⚖️ The Bigger Picture: XRP has shown strength over the 90-day period, but the recent short-term weakness signals that momentum remains fragile. The next move depends on whether buyers can defend support or sellers push price lower.
💬 Your Move: Are you expecting an XRP bounce 📈 or another breakdown 📉?
Trade smart, manage your risk, and never let emotions control your decisions.
{spot}(XRPUSDT)
🚨 $XRP /USDT: Bulls Are Fighting Back, But the Pressure Is Still ON! 📉⚡
XRP is trading at $1.2739, down 1.89% in the latest snapshot. After a sharp sell-off, the market is trying to stabilize near the lows. 👀
📊 Market Breakdown
🔴 Current Price: $1.2739
🔻 24H Change: -1.89%
🟢 24H High: $1.3063
🔴 24H Low: $1.2687
📉 24H Volume: 59.26M XRP
💵 Volume in USDT: 76.32M
📉 Key Levels to Watch
🛡️ Support: $1.2687 — the key recent low
⚠️ Resistance: $1.2751, then $1.2834
🚀 Major Resistance: $1.2999–$1.3063
🔥 What's Happening?
Sellers pushed XRP down aggressively, but buyers are now attempting a small rebound around $1.27. The bounce is worth watching, but it’s not yet a confirmed trend reversal.
🐂 Bullish Scenario: If XRP holds above $1.2687 and reclaims $1.2751, buyers could attempt a move toward $1.2834.
🐻 Bearish Scenario: If $1.2687 breaks decisively, selling pressure could increase. Watch price action carefully before jumping in.
📈 Market Performance
• Today: -1.87%
• 7 Days: -9.29%
• 30 Days: -1.66%
• 90 Days: +16.56%
• 180 Days: -11.09%
• 1 Year: -44.74%
⚖️ The Bigger Picture: XRP has shown strength over the 90-day period, but the recent short-term weakness signals that momentum remains fragile. The next move depends on whether buyers can defend support or sellers push price lower.
💬 Your Move: Are you expecting an XRP bounce 📈 or another breakdown 📉?
Trade smart, manage your risk, and never let emotions control your decisions.
XRP is trading at $1.2739, down 1.89% in the latest snapshot. After a sharp sell-off, the market is trying to stabilize near the lows. 👀
📊 Market Breakdown
🔴 Current Price: $1.2739
🔻 24H Change: -1.89%
🟢 24H High: $1.3063
🔴 24H Low: $1.2687
📉 24H Volume: 59.26M XRP
💵 Volume in USDT: 76.32M
📉 Key Levels to Watch
🛡️ Support: $1.2687 — the key recent low
⚠️ Resistance: $1.2751, then $1.2834
🚀 Major Resistance: $1.2999–$1.3063
🔥 What's Happening?
Sellers pushed XRP down aggressively, but buyers are now attempting a small rebound around $1.27. The bounce is worth watching, but it’s not yet a confirmed trend reversal.
🐂 Bullish Scenario: If XRP holds above $1.2687 and reclaims $1.2751, buyers could attempt a move toward $1.2834.
🐻 Bearish Scenario: If $1.2687 breaks decisively, selling pressure could increase. Watch price action carefully before jumping in.
📈 Market Performance
• Today: -1.87%
• 7 Days: -9.29%
• 30 Days: -1.66%
• 90 Days: +16.56%
• 180 Days: -11.09%
• 1 Year: -44.74%
⚖️ The Bigger Picture: XRP has shown strength over the 90-day period, but the recent short-term weakness signals that momentum remains fragile. The next move depends on whether buyers can defend support or sellers push price lower.
💬 Your Move: Are you expecting an XRP bounce 📈 or another breakdown 📉?
Trade smart, manage your risk, and never let emotions control your decisions.
2.4k
·
--
Рост
@polymarket is becoming impossible to overlook. 📈
Nearly $22B in sports trading volume in just June and July — a massive milestone driven by World Cup hype.
What makes it stand out is the concept: people trade on outcomes across sports, politics, crypto, AI, and the economy, with market probabilities shifting as new information emerges.
It’s more than just betting on what happens next. It’s a real-time look at what the market thinks is likely to happen.
As prediction markets gain momentum, Polymarket is firmly on the radar.
The space is evolving fast. Worth watching closely.
DYOR. 🔍
@Polymarket is becoming impossible to overlook. 📈
Nearly $22B in sports trading volume in just June and July — a massive milestone driven by World Cup hype.
What makes it stand out is the concept: people trade on outcomes across sports, politics, crypto, AI, and the economy, with market probabilities shifting as new information emerges.
It’s more than just betting on what happens next. It’s a real-time look at what the market thinks is likely to happen.
As prediction markets gain momentum, Polymarket is firmly on the radar.
The space is evolving fast. Worth watching closely.
DYOR. 🔍
Nearly $22B in sports trading volume in just June and July — a massive milestone driven by World Cup hype.
What makes it stand out is the concept: people trade on outcomes across sports, politics, crypto, AI, and the economy, with market probabilities shifting as new information emerges.
It’s more than just betting on what happens next. It’s a real-time look at what the market thinks is likely to happen.
As prediction markets gain momentum, Polymarket is firmly on the radar.
The space is evolving fast. Worth watching closely.
DYOR. 🔍

1
1
344
·
--
Рост
Проверено
🚀 The future of AI and crypto is getting interesting, and Kite has my attention.
One thing I find exciting about @GoKiteAI is the idea of bringing AI and blockchain closer together. Both technologies are evolving quickly, but the real opportunity lies in making them useful beyond the hype.
Kite becoming the exclusive Premium Partner of The Blockchain adds another interesting chapter to its journey. For me, the bigger question is what comes next and how this exposure translates into real growth for the ecosystem.
I'm not here to judge a project by one announcement. I want to see consistent progress, practical innovation, and reasons for the community to stay involved.
That's what makes this journey worth following. 👀
The hype gets attention, but real progress builds trust. 🔥
@GoKiteAI
#KiteBBW $KITE
{spot}(KITEUSDT)
🚀 The future of AI and crypto is getting interesting, and Kite has my attention.
One thing I find exciting about @KITE AI 中文 is the idea of bringing AI and blockchain closer together. Both technologies are evolving quickly, but the real opportunity lies in making them useful beyond the hype.
Kite becoming the exclusive Premium Partner of The Blockchain adds another interesting chapter to its journey. For me, the bigger question is what comes next and how this exposure translates into real growth for the ecosystem.
I'm not here to judge a project by one announcement. I want to see consistent progress, practical innovation, and reasons for the community to stay involved.
That's what makes this journey worth following. 👀
The hype gets attention, but real progress builds trust. 🔥
@KITE AI 中文
#KiteBBW $KITE
One thing I find exciting about @KITE AI 中文 is the idea of bringing AI and blockchain closer together. Both technologies are evolving quickly, but the real opportunity lies in making them useful beyond the hype.
Kite becoming the exclusive Premium Partner of The Blockchain adds another interesting chapter to its journey. For me, the bigger question is what comes next and how this exposure translates into real growth for the ecosystem.
I'm not here to judge a project by one announcement. I want to see consistent progress, practical innovation, and reasons for the community to stay involved.
That's what makes this journey worth following. 👀
The hype gets attention, but real progress builds trust. 🔥
@KITE AI 中文
#KiteBBW $KITE

27
39
4.6k
Войдите, чтобы посмотреть больше материала
Присоединяйтесь к пользователям криптовалют по всему миру на Binance Square
⚡️ Получайте новейшую и полезную информацию о криптоактивах.
💬 Нам доверяет крупнейшая в мире криптобиржа.
👍 Получите достоверные аналитические данные от верифицированных создателей контента.
Эл. почта/номер телефона
В тренде
BinancekzWin
Просмотров: 32,365
93 обсуждают
МЕН ЧАТТА ЖАЙ ҒАНА ОТЫРЫП, 10 BNB ҰТЫП АЛДЫМ 😭🔥
Деп айтқым келеді, бірақ бұл шындық емес, Бірақ шындықтың өзі де керемет 💅
Жеңіл, танымдық, қызықты белсенділіктерге қатысып, қомақты сыйлықтар ұтып алу? Оңай, Binance KZ мүмкіндікке толы!
Чатта үнемі розыгрыштар болып тұрады, мен де жиі ұтып аламын. Бірақ ең басты жеңіс- өзіңе жайлы, адекватты комьюнити табу. Араласу барысында көп пайдалы нәрсе үйренесің, саудада көмектесетін білім аласың.
Тегін $50 алу приятно, ал сол білімнің арқасында оны көбейту ол менің жеңісім 💅
#BinancekzWin
Cabbage hater
·Лайков: 0
·Просмотров: 60
BinancePick
Просмотров: 2.5M
136,836 обсуждают
EarningsSeason
Просмотров: 4.9M
23,784 обсуждают