
AQA992
823 Публикации

AQA992
Отправить жалобу
Заблокировать пользователя
Crypto Analyst | Market Insights | Technical Analysis | Binance Square Creator 📈
Открытая сделка
Случайный трейдер
4.1 г
18 подписок(и/а)
30 подписчиков(а)
129 понравилось
Посты
Портфель
·
--
$ETH
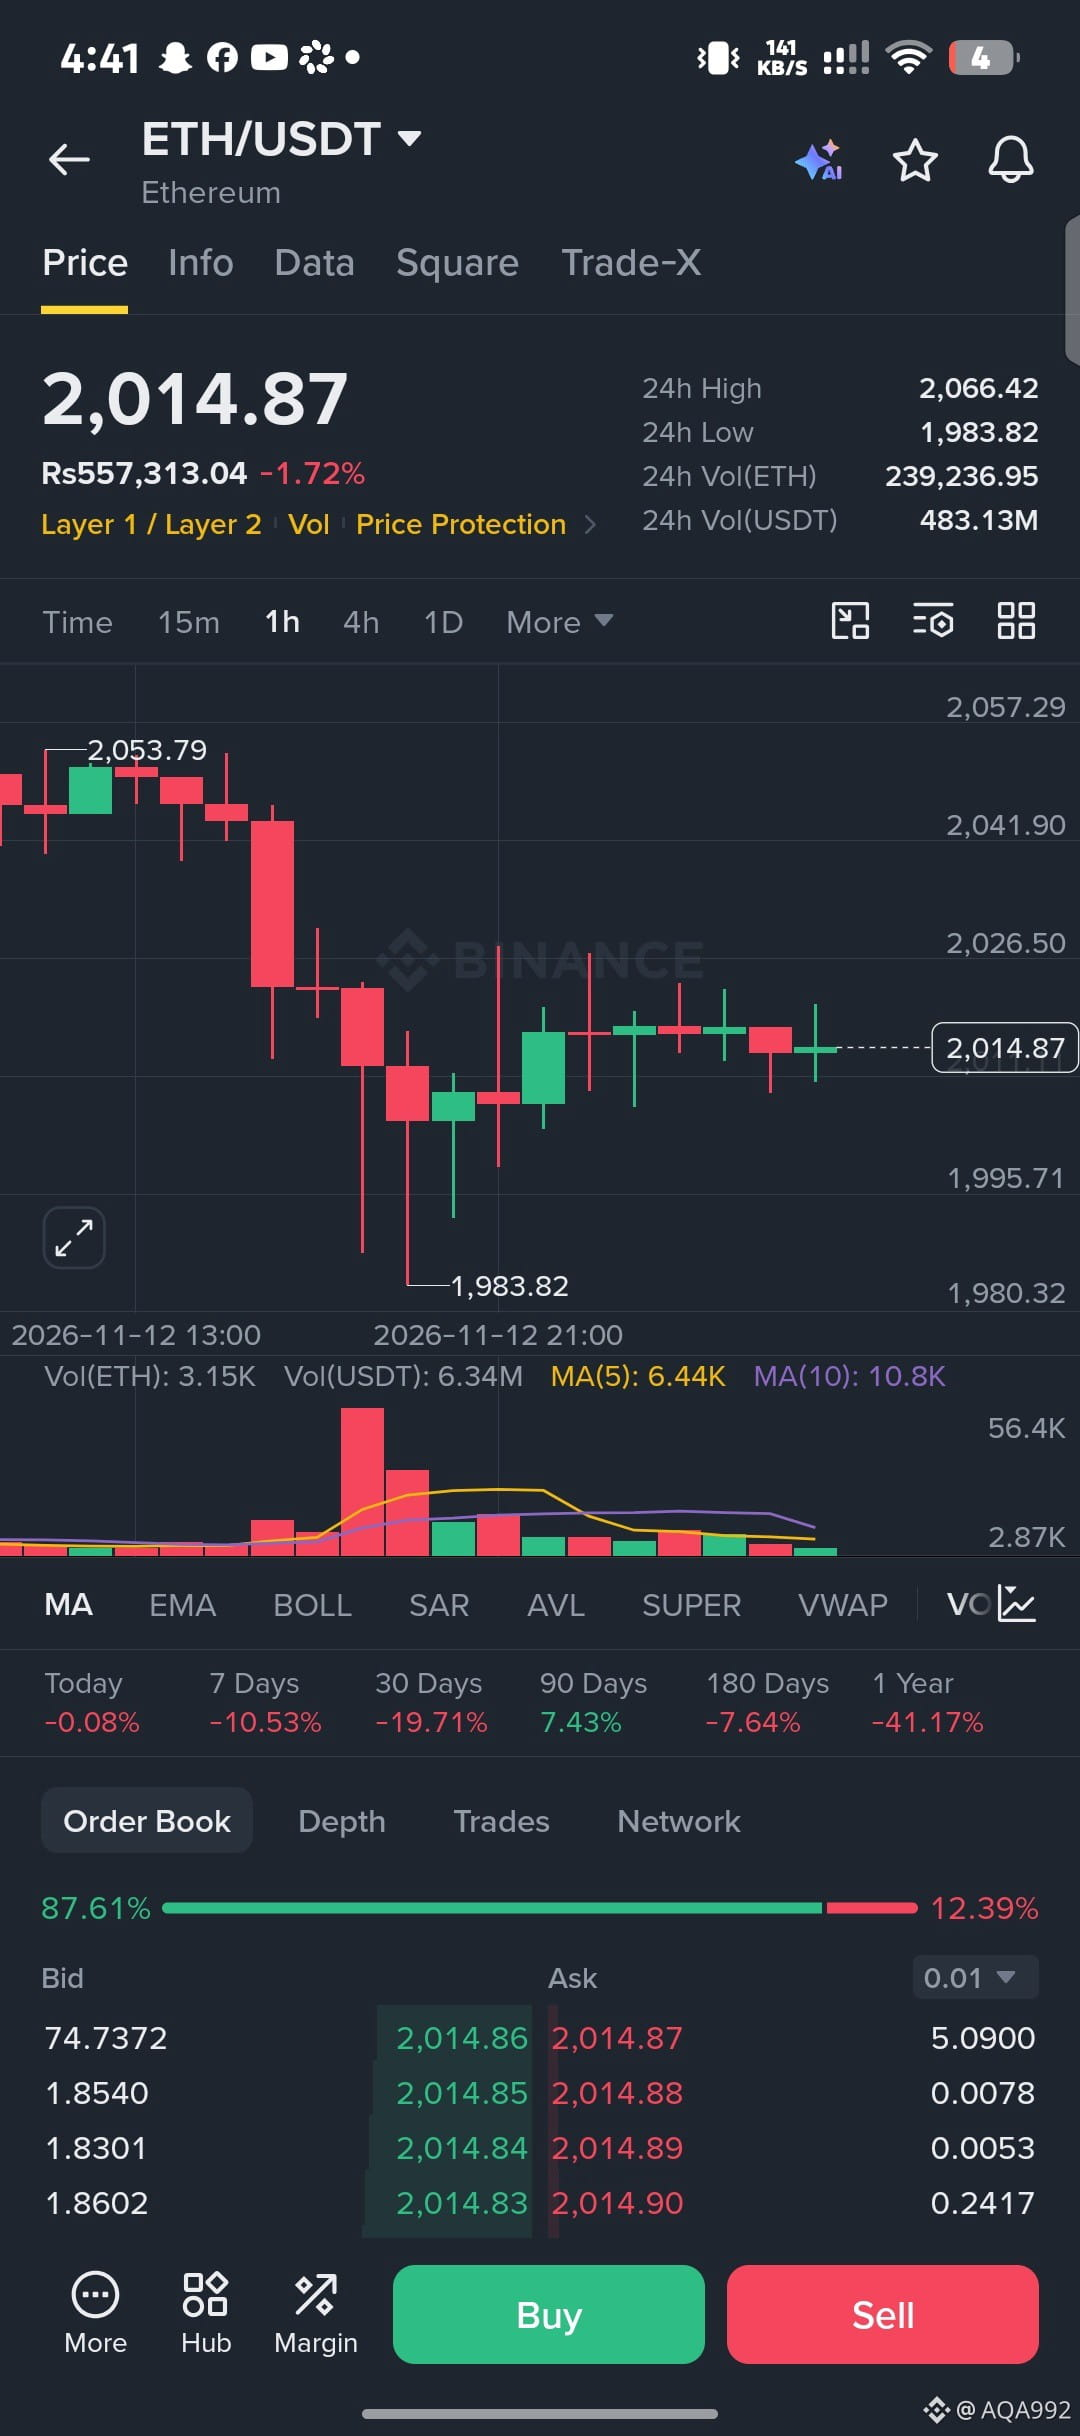
Price has aggressively swept liquidity near the 1,980 floor and is now printing a tight consolidation base. Selling volume is completely exhausted on this retest, signaling a high-probability reversal. We are front-running the bounce.
EP: 2,010 - 2,018
TP1: 2,045
TP2: 2,065
TP3: 2,085
SL: 1,975
$ETH
#AnthropicRejectsIPODelayValuationinQuestion
#ChipStocksExtendLossesAfterNvidiaCEOChange
#MSCIRemovalMayCurbStrategy’sBitcoinBuying
#TradFiForBeginners
#HuangExitNvidiaStrategyInFocus
{future}(ETHUSDT)
$ETH
Price has aggressively swept liquidity near the 1,980 floor and is now printing a tight consolidation base. Selling volume is completely exhausted on this retest, signaling a high-probability reversal. We are front-running the bounce.
EP: 2,010 - 2,018
TP1: 2,045
TP2: 2,065
TP3: 2,085
SL: 1,975
$ETH
#AnthropicRejectsIPODelayValuationinQuestion
#ChipStocksExtendLossesAfterNvidiaCEOChange
#MSCIRemovalMayCurbStrategy’sBitcoinBuying
#TradFiForBeginners
#HuangExitNvidiaStrategyInFocus
Price has aggressively swept liquidity near the 1,980 floor and is now printing a tight consolidation base. Selling volume is completely exhausted on this retest, signaling a high-probability reversal. We are front-running the bounce.
EP: 2,010 - 2,018
TP1: 2,045
TP2: 2,065
TP3: 2,085
SL: 1,975
$ETH
#AnthropicRejectsIPODelayValuationinQuestion
#ChipStocksExtendLossesAfterNvidiaCEOChange
#MSCIRemovalMayCurbStrategy’sBitcoinBuying
#TradFiForBeginners
#HuangExitNvidiaStrategyInFocus
26
·
--
Падение
$BTC
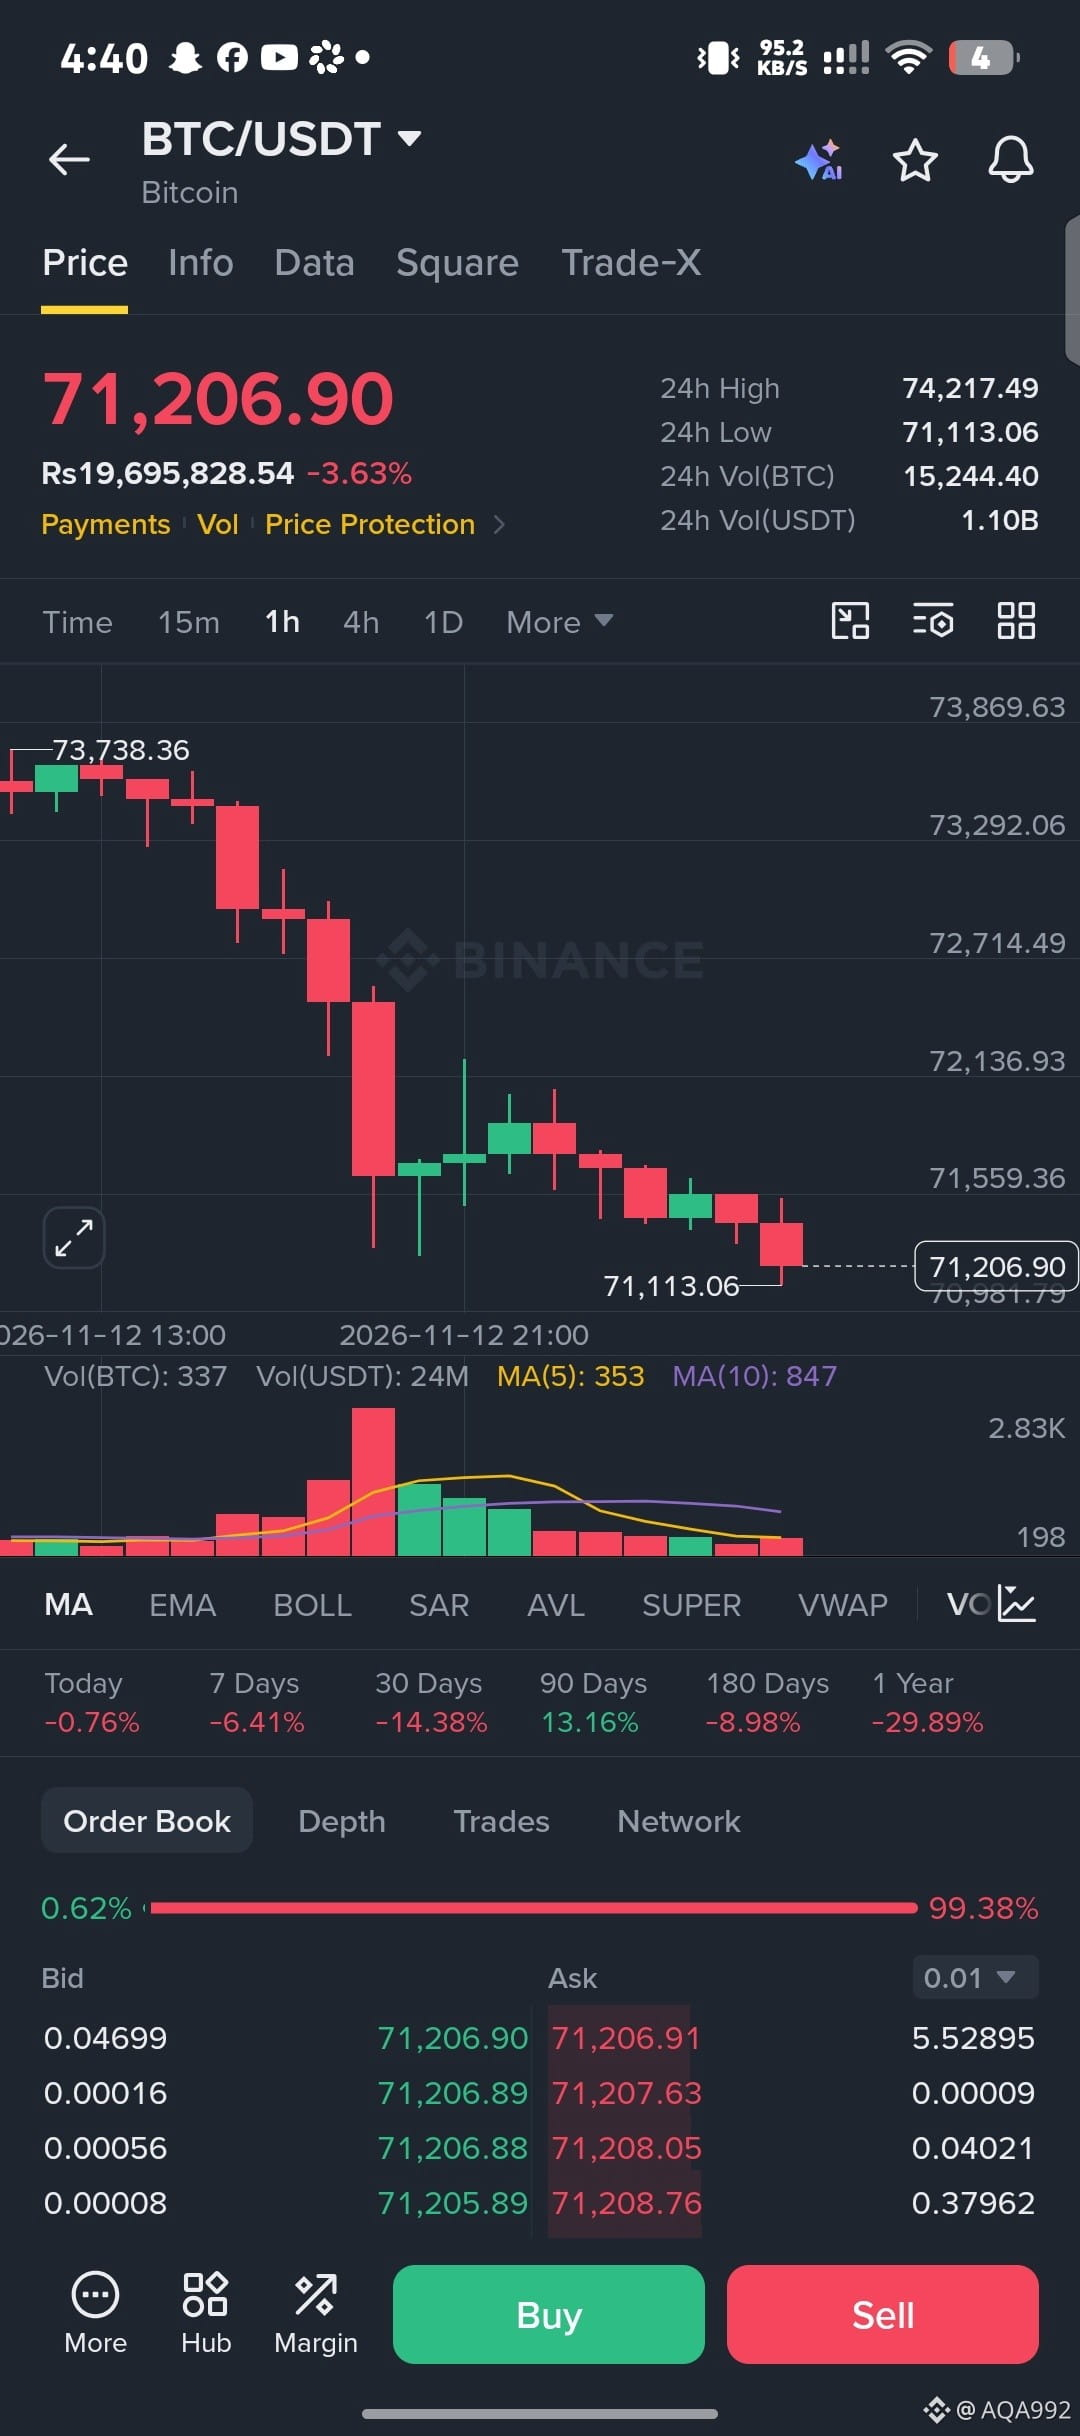
Heavy selling pressure has driven price into critical support at 71,100. Momentum is flashing oversold on lower timeframes, and volume is drying up on the retest. This is a prime setup for a violent relief bounce.
EP: 71,200 - 71,400
TP1: 72,200
TP2: 73,300
TP3: 74,200
SL: 70,800
$BTC
#HuangExitNvidiaStrategyInFocus
#AnthropicRejectsIPODelayValuationinQuestion
#CoreWeaveJumps10%On168%RevenueGrowth
#MSCIRemovalMayCurbStrategy’sBitcoinBuying
#TradFiForBeginners
{future}(BTCUSDT)
$BTC
Heavy selling pressure has driven price into critical support at 71,100. Momentum is flashing oversold on lower timeframes, and volume is drying up on the retest. This is a prime setup for a violent relief bounce.
EP: 71,200 - 71,400
TP1: 72,200
TP2: 73,300
TP3: 74,200
SL: 70,800
$BTC
#HuangExitNvidiaStrategyInFocus
#AnthropicRejectsIPODelayValuationinQuestion
#CoreWeaveJumps10%On168%RevenueGrowth
#MSCIRemovalMayCurbStrategy’sBitcoinBuying
#TradFiForBeginners
Heavy selling pressure has driven price into critical support at 71,100. Momentum is flashing oversold on lower timeframes, and volume is drying up on the retest. This is a prime setup for a violent relief bounce.
EP: 71,200 - 71,400
TP1: 72,200
TP2: 73,300
TP3: 74,200
SL: 70,800
$BTC
#HuangExitNvidiaStrategyInFocus
#AnthropicRejectsIPODelayValuationinQuestion
#CoreWeaveJumps10%On168%RevenueGrowth
#MSCIRemovalMayCurbStrategy’sBitcoinBuying
#TradFiForBeginners
17
·
--
Падение
$BNB
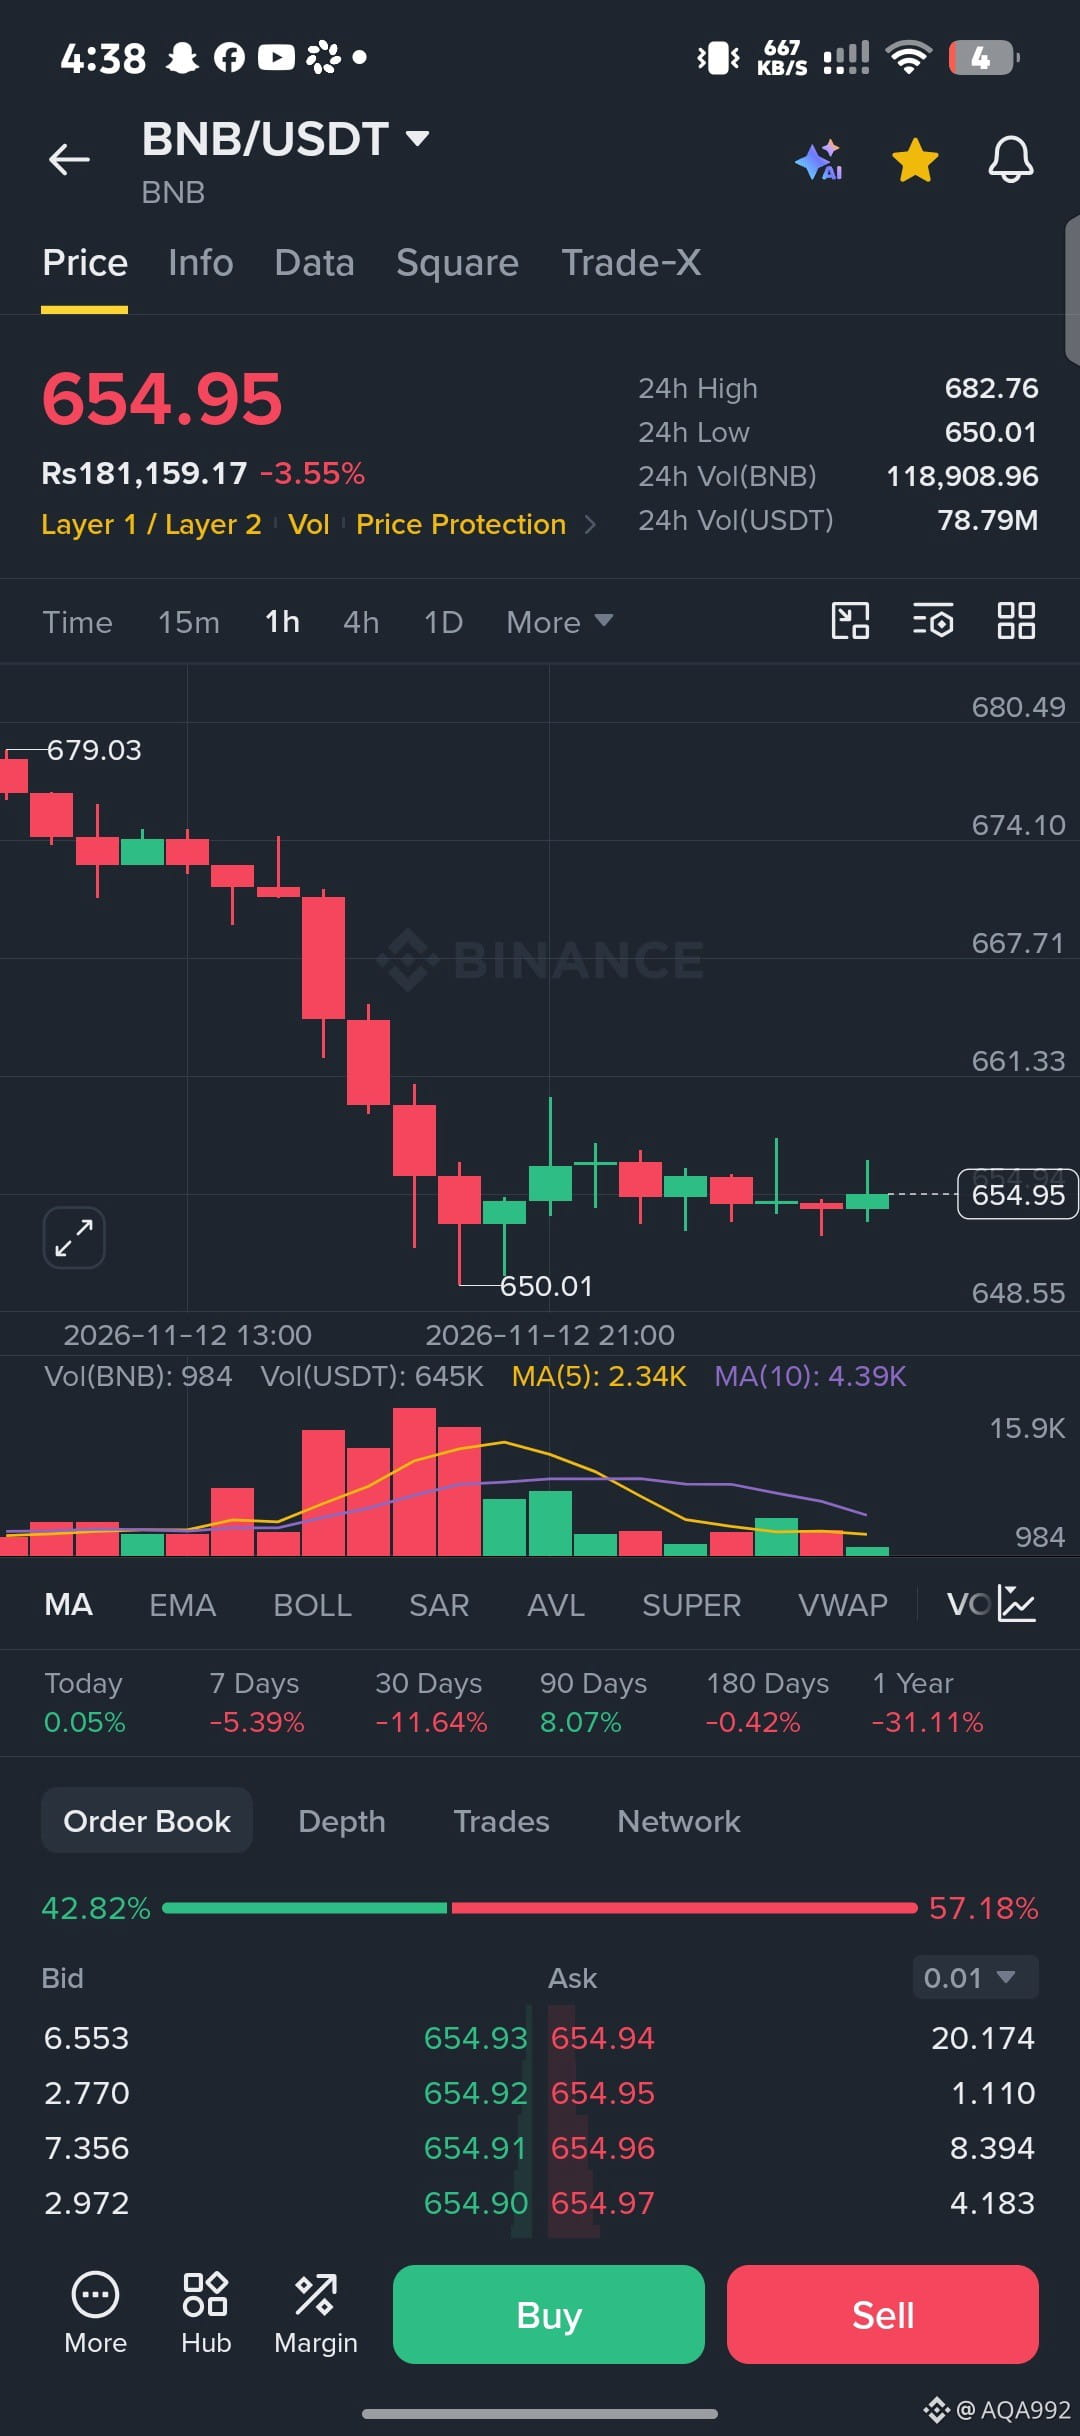
Momentum has stalled at the 650 support floor after a sharp sell-off. Price is consolidating tightly, showing seller exhaustion. This setup favors a tactical bounce.
EP: 654 - 656
TP1: 665
TP2: 674
TP3: 682
SL: 647
$BNB
#HuangExitNvidiaStrategyInFocus
#AnthropicRejectsIPODelayValuationinQuestion
#ChipStocksExtendLossesAfterNvidiaCEOChange
#MSCIRemovalMayCurbStrategy’sBitcoinBuying
#TradFiForBeginners
{future}(BNBUSDT)
$BNB
Momentum has stalled at the 650 support floor after a sharp sell-off. Price is consolidating tightly, showing seller exhaustion. This setup favors a tactical bounce.
EP: 654 - 656
TP1: 665
TP2: 674
TP3: 682
SL: 647
$BNB
#HuangExitNvidiaStrategyInFocus
#AnthropicRejectsIPODelayValuationinQuestion
#ChipStocksExtendLossesAfterNvidiaCEOChange
#MSCIRemovalMayCurbStrategy’sBitcoinBuying
#TradFiForBeginners
Momentum has stalled at the 650 support floor after a sharp sell-off. Price is consolidating tightly, showing seller exhaustion. This setup favors a tactical bounce.
EP: 654 - 656
TP1: 665
TP2: 674
TP3: 682
SL: 647
$BNB
#HuangExitNvidiaStrategyInFocus
#AnthropicRejectsIPODelayValuationinQuestion
#ChipStocksExtendLossesAfterNvidiaCEOChange
#MSCIRemovalMayCurbStrategy’sBitcoinBuying
#TradFiForBeginners
11
·
--
Падение
$XRP
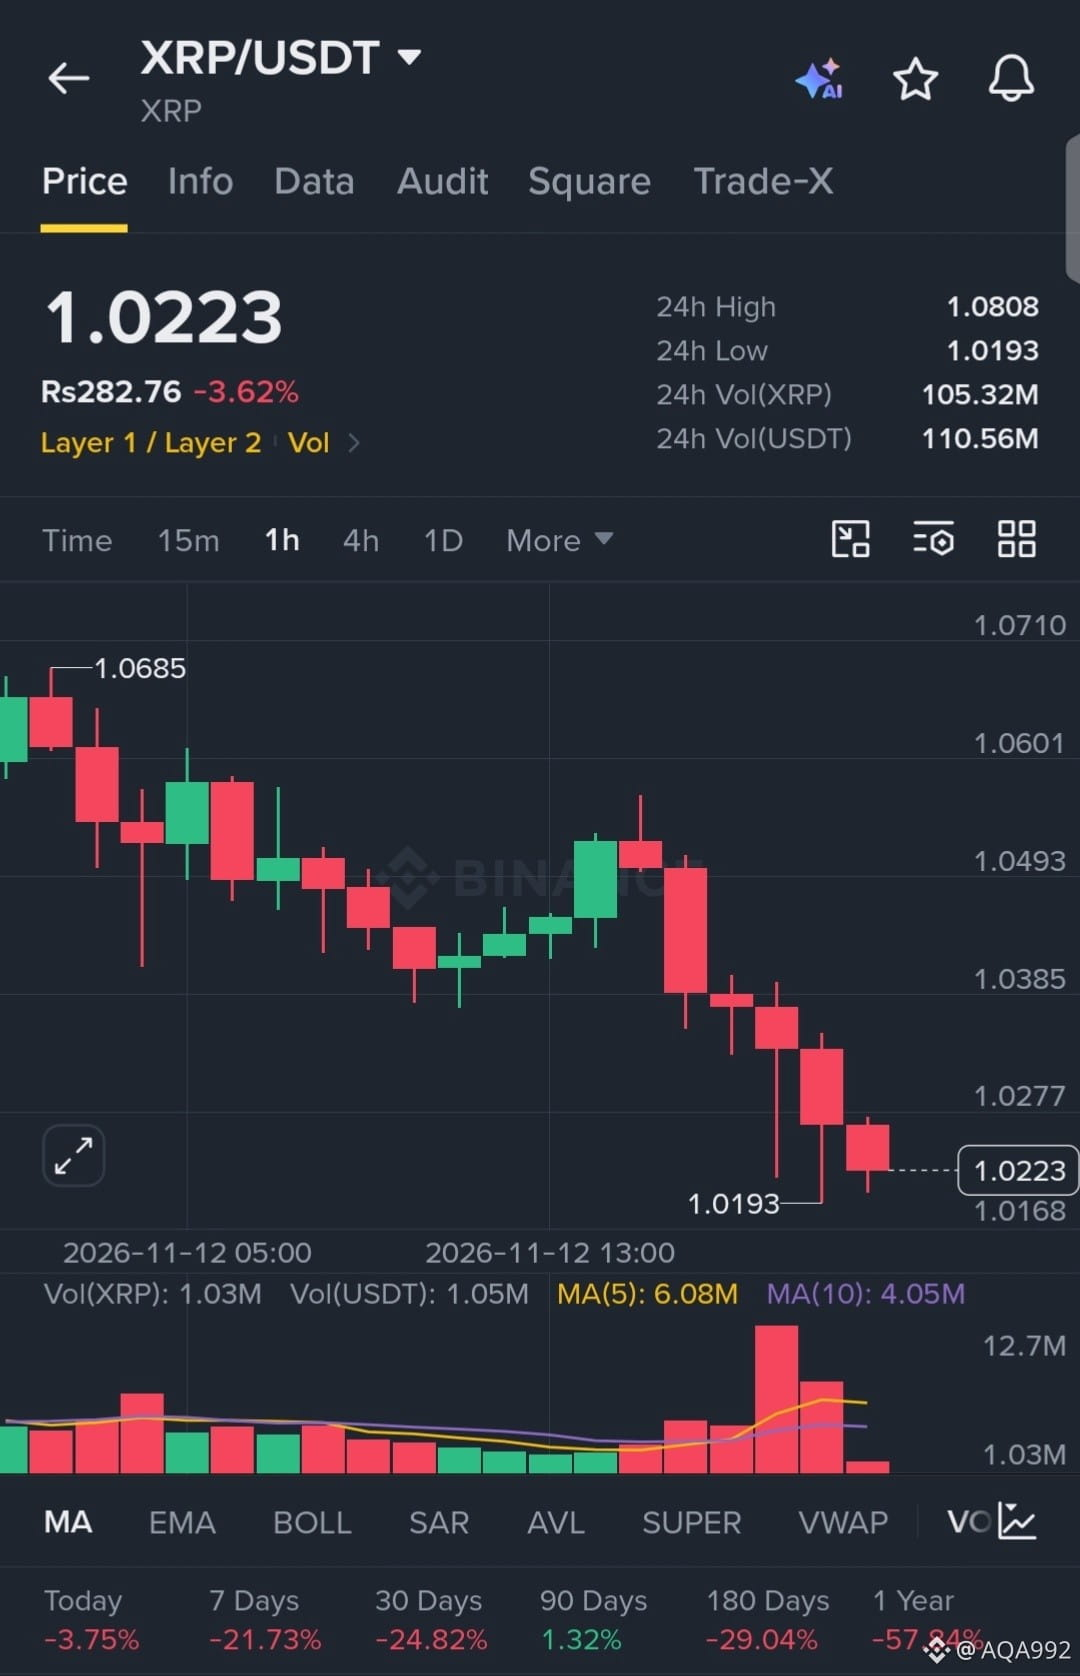
is in a severe downtrend, aggressively slicing through support levels with heavy, relentless sell volume. The 1H chart shows absolute seller dominance with zero signs of buyer absorption at the lows, indicating intense bearish momentum for a clean continuation short.
EP: 1.0223
TP: 1.0100, 0.9950, 0.9800
SL: 1.0450
$XRP
#HuangExitNvidiaStrategyInFocus
#AnthropicRejectsIPODelayValuationinQuestion
#CoreWeaveJumps10%On168%RevenueGrowth
#MSCIRemovalMayCurbStrategy’sBitcoinBuying
#USJoblessClaimsRise
{future}(XRPUSDT)
$XRP
is in a severe downtrend, aggressively slicing through support levels with heavy, relentless sell volume. The 1H chart shows absolute seller dominance with zero signs of buyer absorption at the lows, indicating intense bearish momentum for a clean continuation short.
EP: 1.0223
TP: 1.0100, 0.9950, 0.9800
SL: 1.0450
$XRP
#HuangExitNvidiaStrategyInFocus
#AnthropicRejectsIPODelayValuationinQuestion
#CoreWeaveJumps10%On168%RevenueGrowth
#MSCIRemovalMayCurbStrategy’sBitcoinBuying
#USJoblessClaimsRise
is in a severe downtrend, aggressively slicing through support levels with heavy, relentless sell volume. The 1H chart shows absolute seller dominance with zero signs of buyer absorption at the lows, indicating intense bearish momentum for a clean continuation short.
EP: 1.0223
TP: 1.0100, 0.9950, 0.9800
SL: 1.0450
$XRP
#HuangExitNvidiaStrategyInFocus
#AnthropicRejectsIPODelayValuationinQuestion
#CoreWeaveJumps10%On168%RevenueGrowth
#MSCIRemovalMayCurbStrategy’sBitcoinBuying
#USJoblessClaimsRise
8
·
--
Падение
Торговля за 30 дней $SOL 8.7 USDT
$SOL
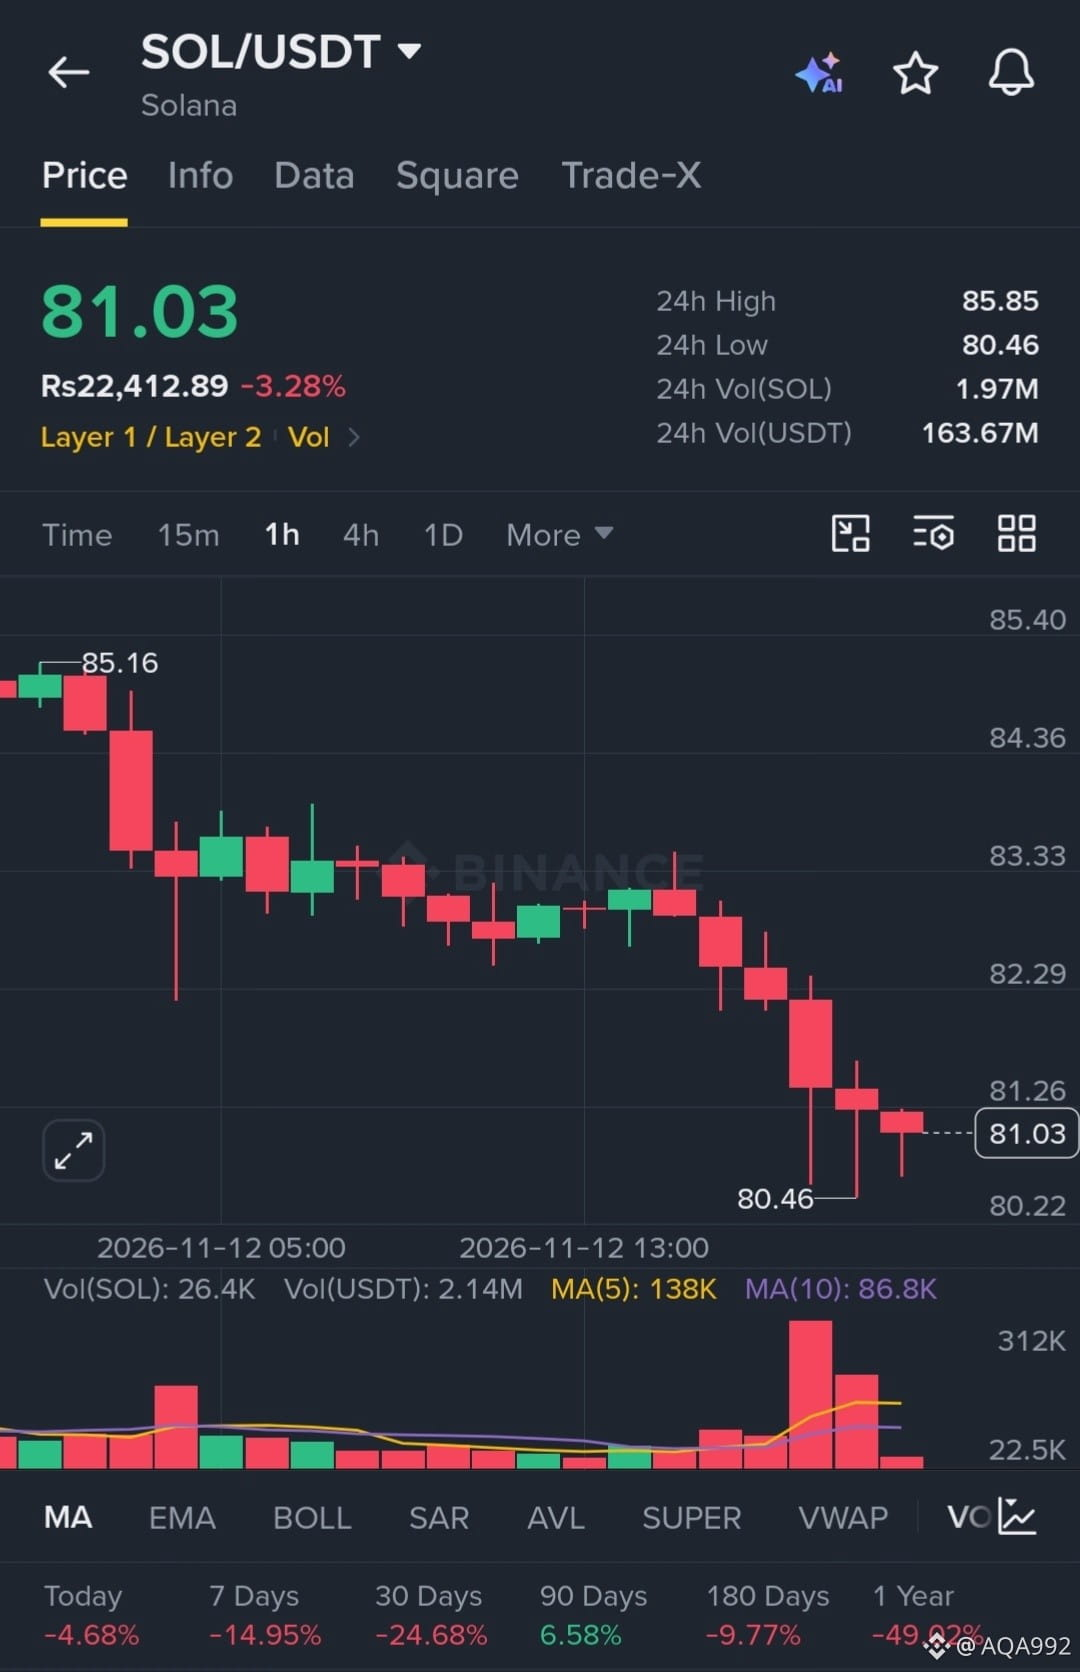
is in a heavy downtrend, aggressively printing lower highs and slicing through support levels with expanding sell volume. The 1H chart shows absolute seller control with no signs of buyer absorption at the lows, signaling intense bearish momentum for a continuation short.
EP: 81.03
TP: 79.00, 77.50, 75.00
SL: 83.50
$SOL
#HuangExitNvidiaStrategyInFocus
#AnthropicRejectsIPODelayValuationinQuestion
#CoreWeaveJumps10%On168%RevenueGrowth
#MSCIRemovalMayCurbStrategy’sBitcoinBuying
#TradFiForBeginners
{future}(SOLUSDT)
$SOL
is in a heavy downtrend, aggressively printing lower highs and slicing through support levels with expanding sell volume. The 1H chart shows absolute seller control with no signs of buyer absorption at the lows, signaling intense bearish momentum for a continuation short.
EP: 81.03
TP: 79.00, 77.50, 75.00
SL: 83.50
$SOL
#HuangExitNvidiaStrategyInFocus
#AnthropicRejectsIPODelayValuationinQuestion
#CoreWeaveJumps10%On168%RevenueGrowth
#MSCIRemovalMayCurbStrategy’sBitcoinBuying
#TradFiForBeginners
is in a heavy downtrend, aggressively printing lower highs and slicing through support levels with expanding sell volume. The 1H chart shows absolute seller control with no signs of buyer absorption at the lows, signaling intense bearish momentum for a continuation short.
EP: 81.03
TP: 79.00, 77.50, 75.00
SL: 83.50
$SOL
#HuangExitNvidiaStrategyInFocus
#AnthropicRejectsIPODelayValuationinQuestion
#CoreWeaveJumps10%On168%RevenueGrowth
#MSCIRemovalMayCurbStrategy’sBitcoinBuying
#TradFiForBeginners
8
·
--
Падение
$PEPE
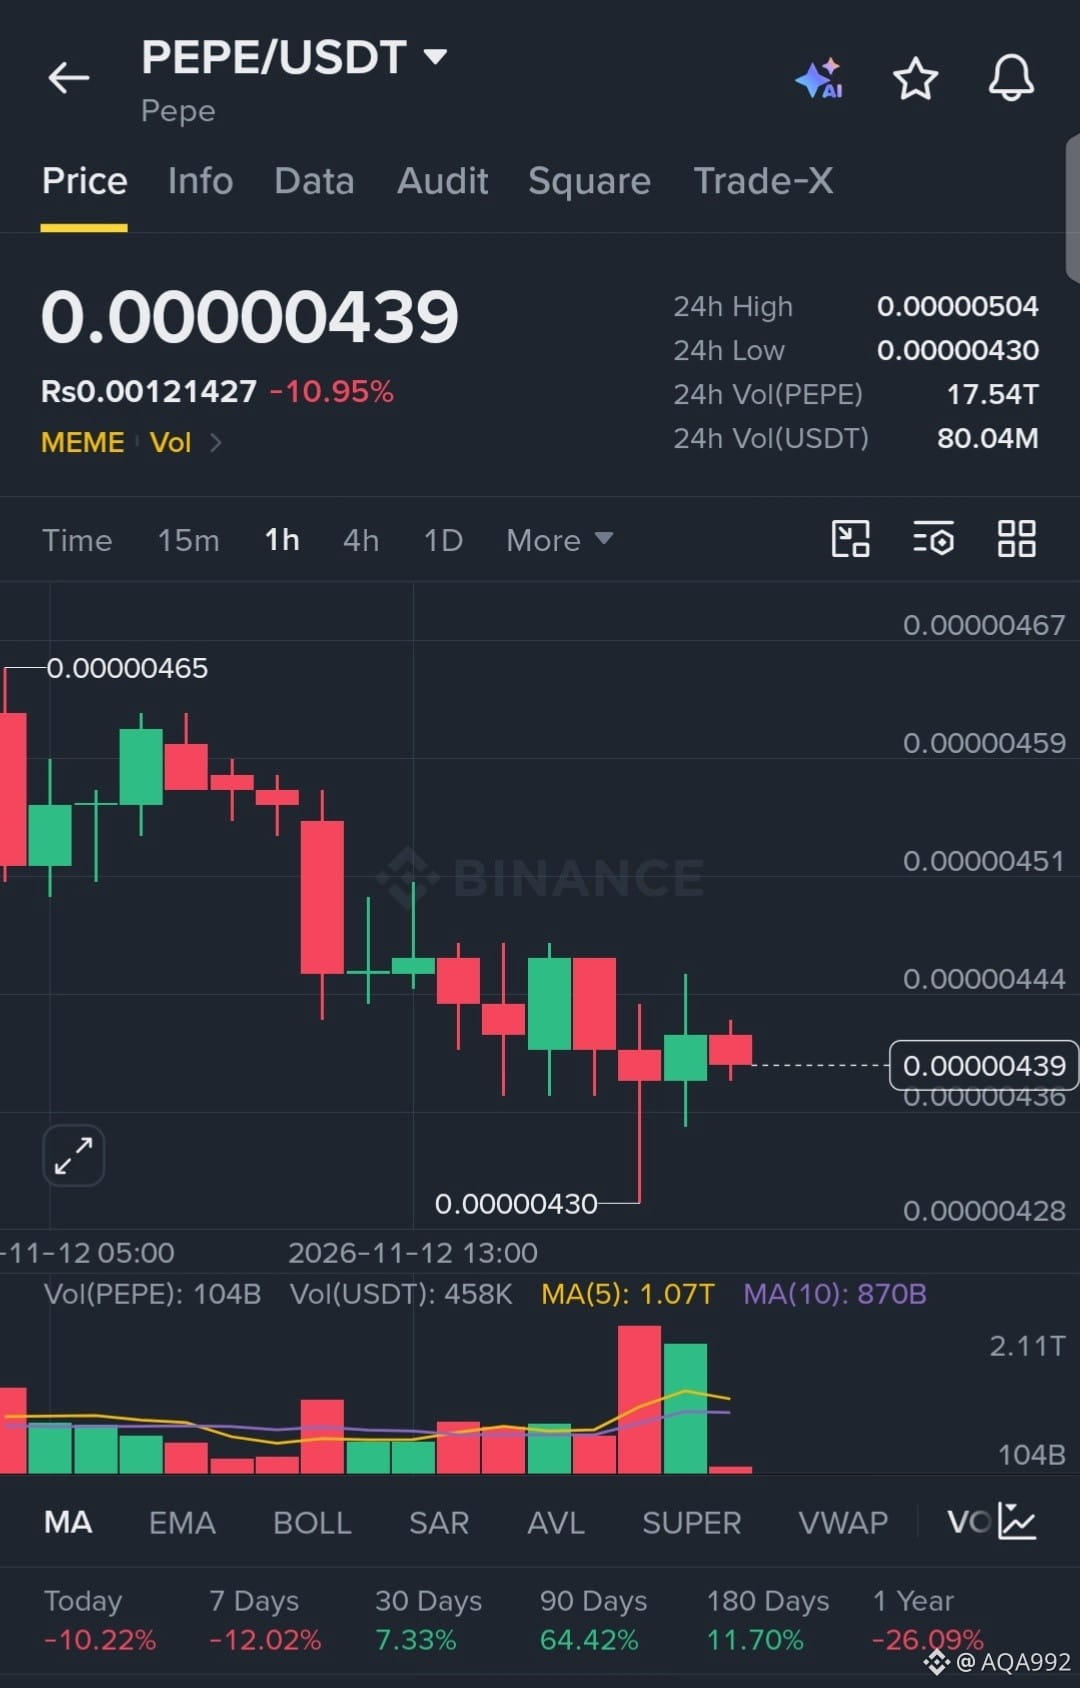
is bleeding aggressively, printing relentless lower highs as sellers smash through support. The 1H chart shows heavy distribution with zero buyer absorption, indicating intense bearish momentum driving a clean continuation short.
EP: 0.00000439
TP: 0.00000428, 0.00000415, 0.00000400
SL: 0.00000455
$PEPE
#HuangExitNvidiaStrategyInFocus
#AnthropicRejectsIPODelayValuationinQuestion
#CoreWeaveJumps10%On168%RevenueGrowth
#MSCIRemovalMayCurbStrategy’sBitcoinBuying
#TradFiForBeginners
{spot}(PEPEUSDT)
$PEPE
is bleeding aggressively, printing relentless lower highs as sellers smash through support. The 1H chart shows heavy distribution with zero buyer absorption, indicating intense bearish momentum driving a clean continuation short.
EP: 0.00000439
TP: 0.00000428, 0.00000415, 0.00000400
SL: 0.00000455
$PEPE
#HuangExitNvidiaStrategyInFocus
#AnthropicRejectsIPODelayValuationinQuestion
#CoreWeaveJumps10%On168%RevenueGrowth
#MSCIRemovalMayCurbStrategy’sBitcoinBuying
#TradFiForBeginners
is bleeding aggressively, printing relentless lower highs as sellers smash through support. The 1H chart shows heavy distribution with zero buyer absorption, indicating intense bearish momentum driving a clean continuation short.
EP: 0.00000439
TP: 0.00000428, 0.00000415, 0.00000400
SL: 0.00000455
$PEPE
#HuangExitNvidiaStrategyInFocus
#AnthropicRejectsIPODelayValuationinQuestion
#CoreWeaveJumps10%On168%RevenueGrowth
#MSCIRemovalMayCurbStrategy’sBitcoinBuying
#TradFiForBeginners
10
·
--
Падение
$MSFTB
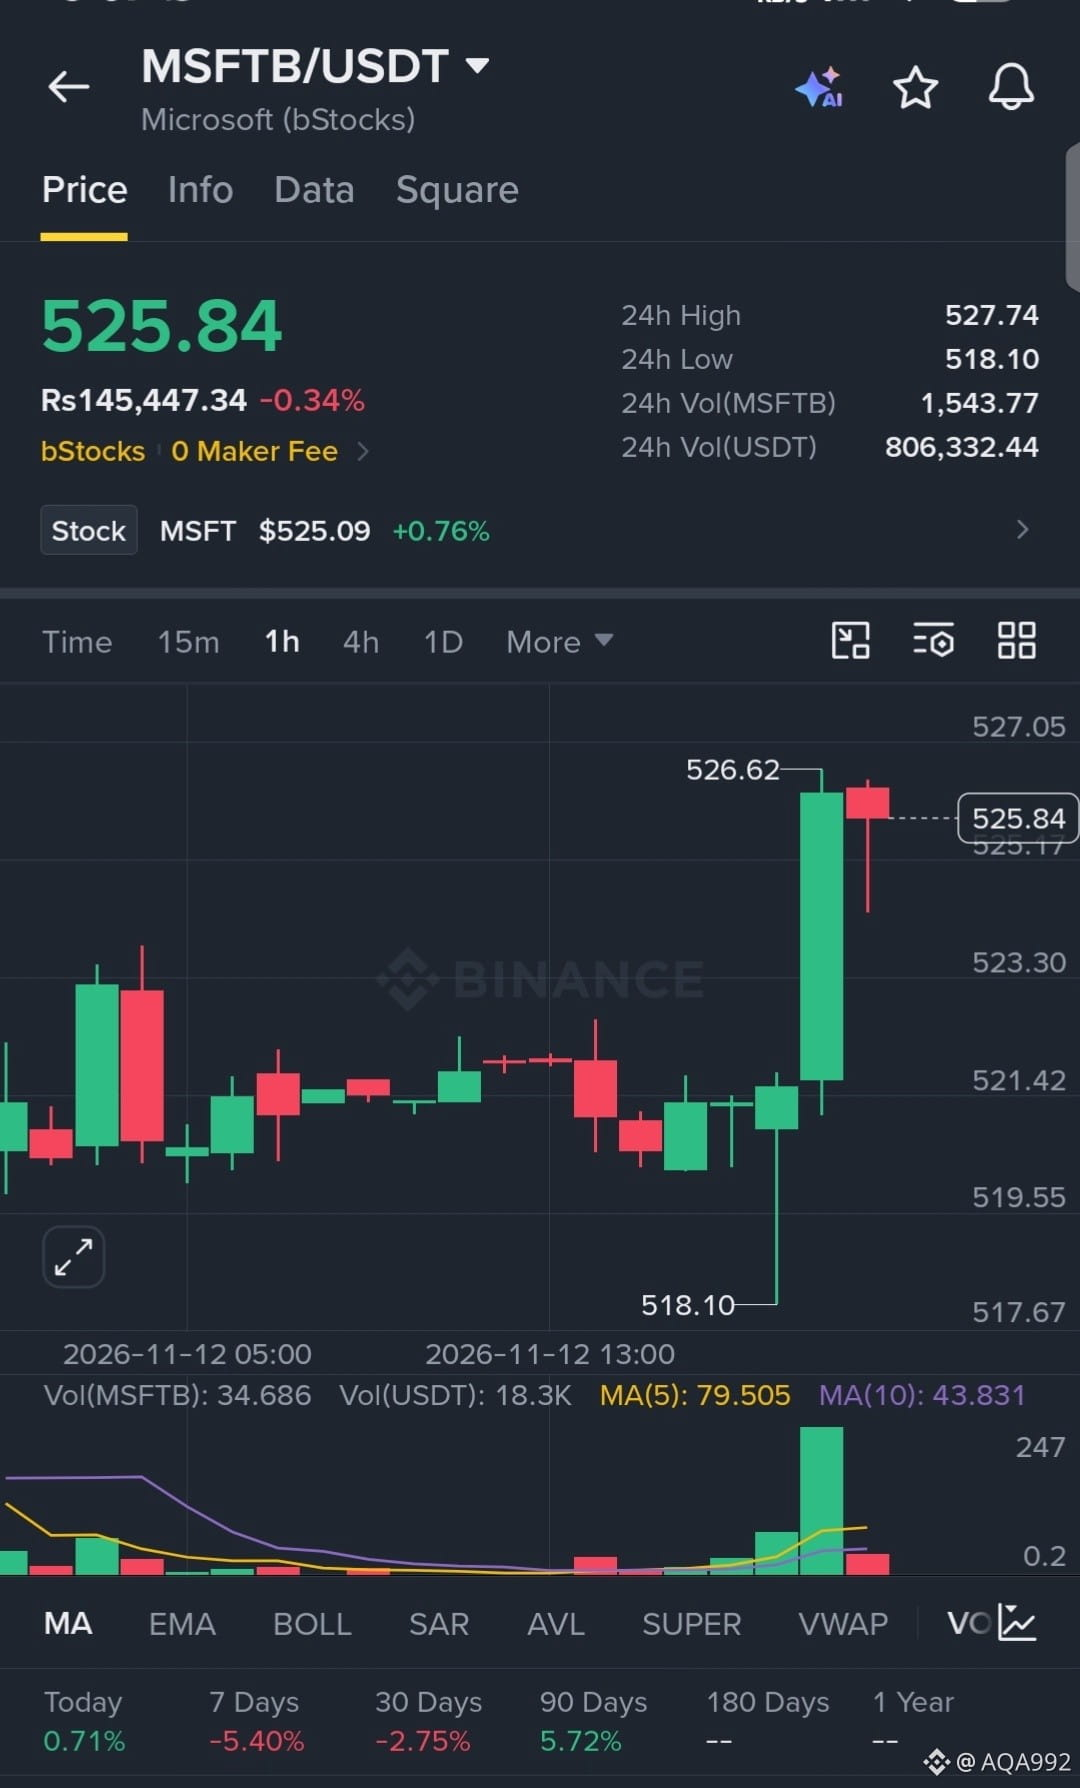
has aggressively swept downside liquidity, printing a sharp capitulation wick to 518.10 before staging a violent V-shaped reversal. The 1H chart shows a massive surge in buy volume reclaiming the local range, signaling heavy momentum for a swift continuation push toward the local high.
EP: 525.84
TP: 531.00, 538.50, 546.00
SL: 517.50
$MSFTB
#HuangExitNvidiaStrategyInFocus
#AnthropicRejectsIPODelayValuationinQuestion
#ChipStocksExtendLossesAfterNvidiaCEOChange
#MSCIRemovalMayCurbStrategy’sBitcoinBuying
#TradFiForBeginners
{spot}(MSFTBUSDT)
$MSFTB
has aggressively swept downside liquidity, printing a sharp capitulation wick to 518.10 before staging a violent V-shaped reversal. The 1H chart shows a massive surge in buy volume reclaiming the local range, signaling heavy momentum for a swift continuation push toward the local high.
EP: 525.84
TP: 531.00, 538.50, 546.00
SL: 517.50
$MSFTB
#HuangExitNvidiaStrategyInFocus
#AnthropicRejectsIPODelayValuationinQuestion
#ChipStocksExtendLossesAfterNvidiaCEOChange
#MSCIRemovalMayCurbStrategy’sBitcoinBuying
#TradFiForBeginners
has aggressively swept downside liquidity, printing a sharp capitulation wick to 518.10 before staging a violent V-shaped reversal. The 1H chart shows a massive surge in buy volume reclaiming the local range, signaling heavy momentum for a swift continuation push toward the local high.
EP: 525.84
TP: 531.00, 538.50, 546.00
SL: 517.50
$MSFTB
#HuangExitNvidiaStrategyInFocus
#AnthropicRejectsIPODelayValuationinQuestion
#ChipStocksExtendLossesAfterNvidiaCEOChange
#MSCIRemovalMayCurbStrategy’sBitcoinBuying
#TradFiForBeginners
5
·
--
Рост
$KITE
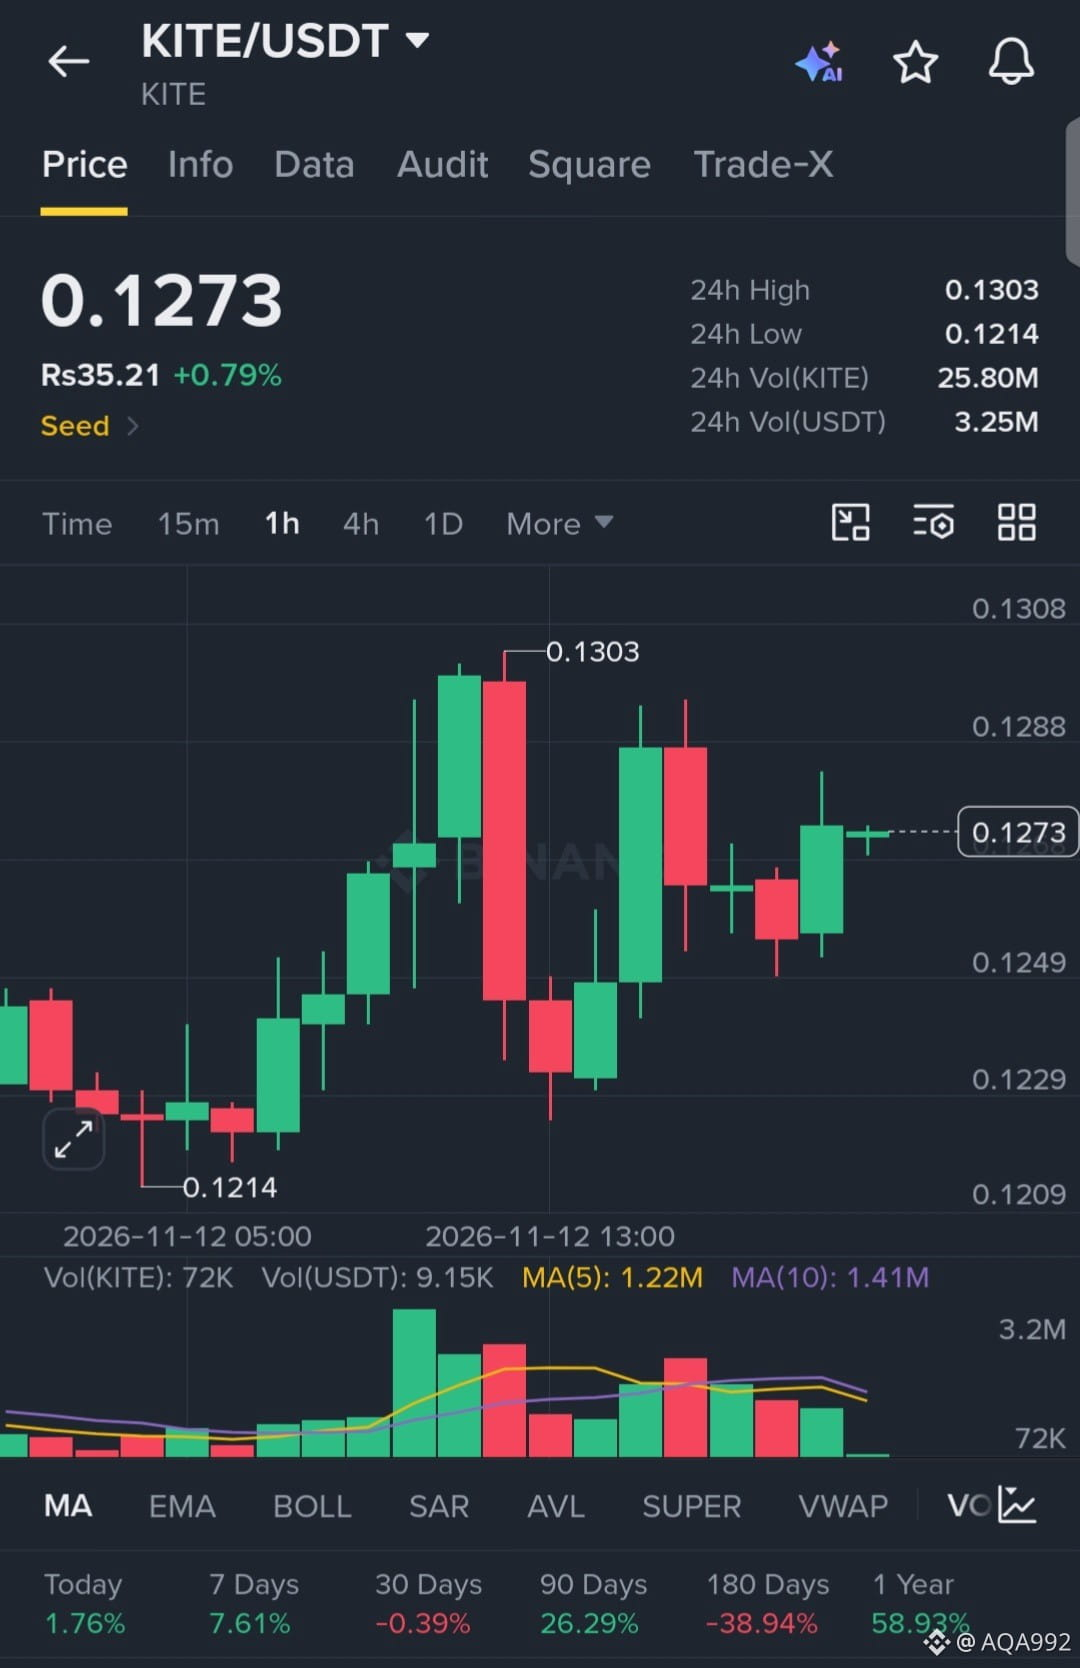
is showing intense volatility and aggressive liquidity sweeps, violently rejecting the 0.1214 low to establish a higher-low structure. The 1H chart reveals heavy buyer absorption on dips with volume expanding, signaling coiled momentum ready to smash through local resistance.
EP: 0.1273
TP: 0.1305, 0.1340, 0.1390
SL: 0.1210
$KITE
#HuangExitNvidiaStrategyInFocus
#AnthropicRejectsIPODelayValuationinQuestion #ChipStocksExtendLossesAfterNvidiaCEOChange
#CoreWeaveJumps10%On168%RevenueGrowth
#TradFiForBeginners
{future}(KITEUSDT)
$KITE
is showing intense volatility and aggressive liquidity sweeps, violently rejecting the 0.1214 low to establish a higher-low structure. The 1H chart reveals heavy buyer absorption on dips with volume expanding, signaling coiled momentum ready to smash through local resistance.
EP: 0.1273
TP: 0.1305, 0.1340, 0.1390
SL: 0.1210
$KITE
#HuangExitNvidiaStrategyInFocus
#AnthropicRejectsIPODelayValuationinQuestion #ChipStocksExtendLossesAfterNvidiaCEOChange
#CoreWeaveJumps10%On168%RevenueGrowth
#TradFiForBeginners
is showing intense volatility and aggressive liquidity sweeps, violently rejecting the 0.1214 low to establish a higher-low structure. The 1H chart reveals heavy buyer absorption on dips with volume expanding, signaling coiled momentum ready to smash through local resistance.
EP: 0.1273
TP: 0.1305, 0.1340, 0.1390
SL: 0.1210
$KITE
#HuangExitNvidiaStrategyInFocus
#AnthropicRejectsIPODelayValuationinQuestion #ChipStocksExtendLossesAfterNvidiaCEOChange
#CoreWeaveJumps10%On168%RevenueGrowth
#TradFiForBeginners
3
·
--
Падение
$TQQQB
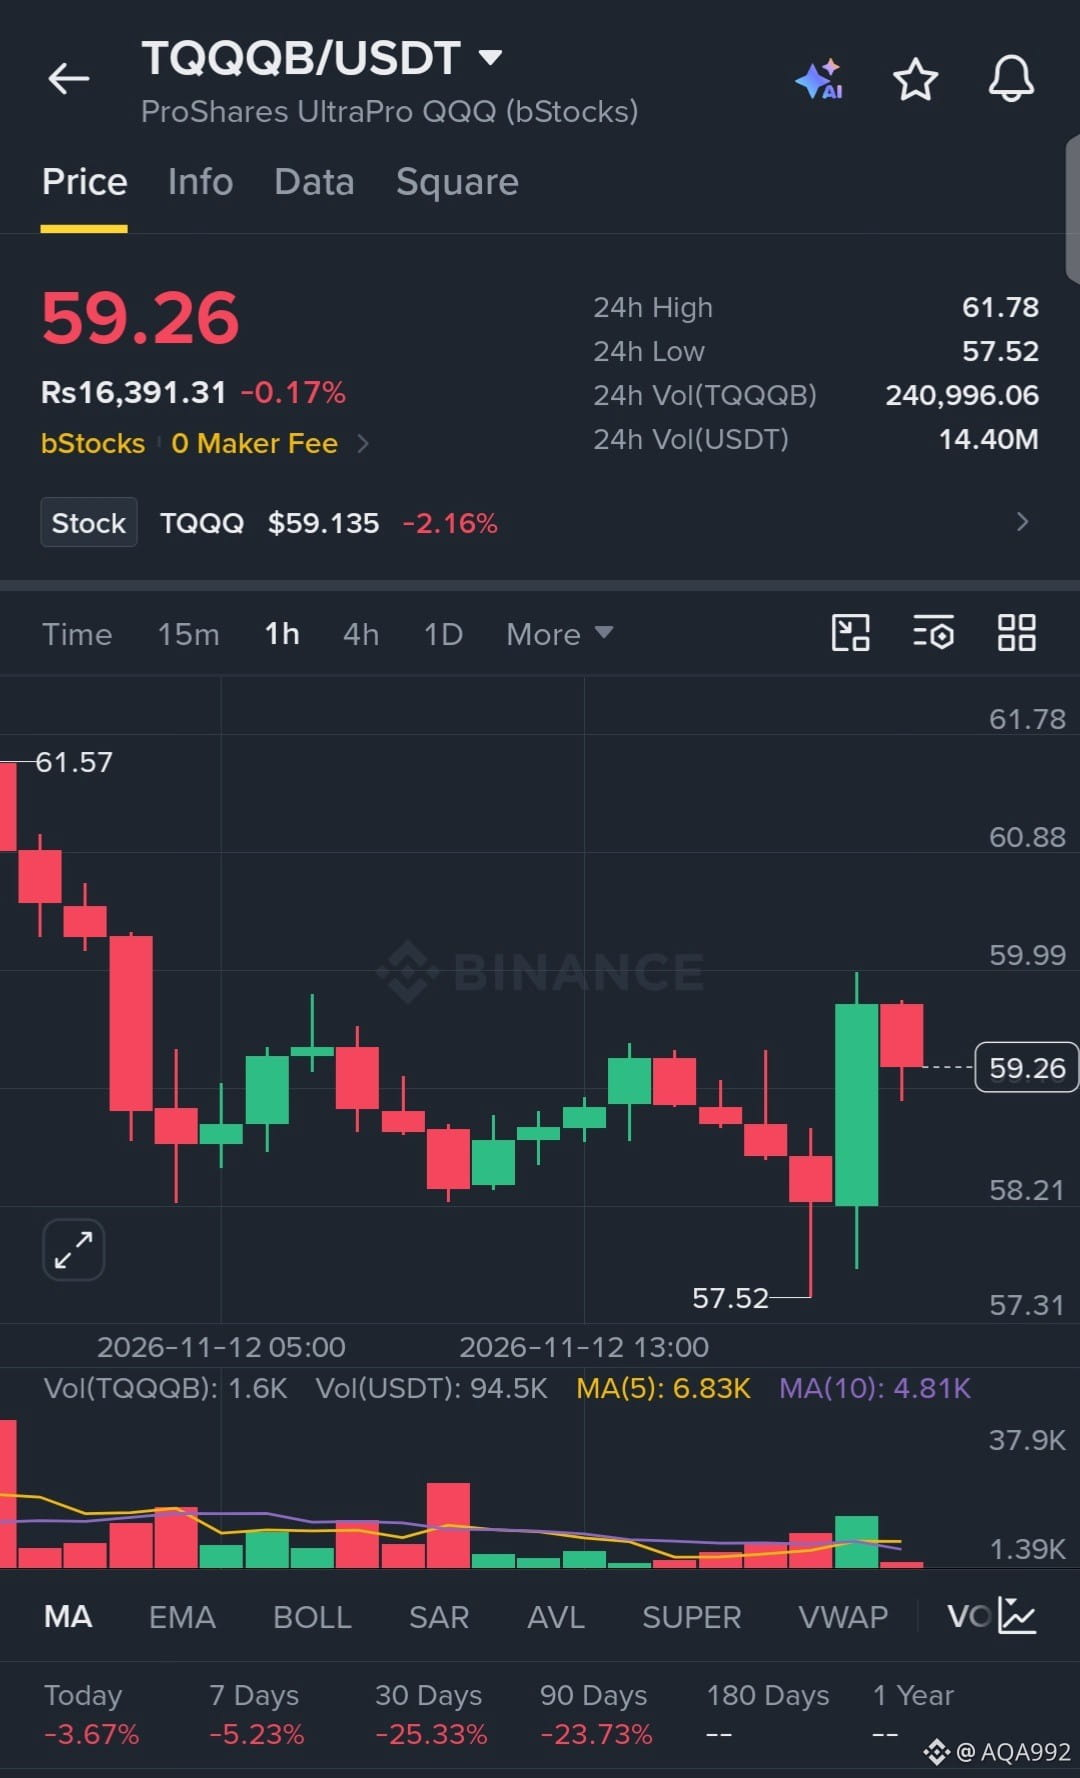
has aggressively swept downside liquidity, printing a sharp capitulation wick to 57.52 before staging a violent V-shaped reversal. The 1H chart shows intense buyer absorption with volume expanding as the price reclaims the local range, signaling heavy momentum for a swift relief rally.
EP: 59.26
TP: 60.80, 61.80, 63.00
SL: 57.20
$TQQQB
#HuangExitNvidiaStrategyInFocus
#ChipStocksExtendLossesAfterNvidiaCEOChange
#AnthropicRejectsIPODelayValuationinQuestion
#CoreWeaveJumps10%On168%RevenueGrowth
#MSCIRemovalMayCurbStrategy’sBitcoinBuying
{spot}(TQQQBUSDT)
$TQQQB
has aggressively swept downside liquidity, printing a sharp capitulation wick to 57.52 before staging a violent V-shaped reversal. The 1H chart shows intense buyer absorption with volume expanding as the price reclaims the local range, signaling heavy momentum for a swift relief rally.
EP: 59.26
TP: 60.80, 61.80, 63.00
SL: 57.20
$TQQQB
#HuangExitNvidiaStrategyInFocus
#ChipStocksExtendLossesAfterNvidiaCEOChange
#AnthropicRejectsIPODelayValuationinQuestion
#CoreWeaveJumps10%On168%RevenueGrowth
#MSCIRemovalMayCurbStrategy’sBitcoinBuying
has aggressively swept downside liquidity, printing a sharp capitulation wick to 57.52 before staging a violent V-shaped reversal. The 1H chart shows intense buyer absorption with volume expanding as the price reclaims the local range, signaling heavy momentum for a swift relief rally.
EP: 59.26
TP: 60.80, 61.80, 63.00
SL: 57.20
$TQQQB
#HuangExitNvidiaStrategyInFocus
#ChipStocksExtendLossesAfterNvidiaCEOChange
#AnthropicRejectsIPODelayValuationinQuestion
#CoreWeaveJumps10%On168%RevenueGrowth
#MSCIRemovalMayCurbStrategy’sBitcoinBuying
2
·
--
Падение
$TRX
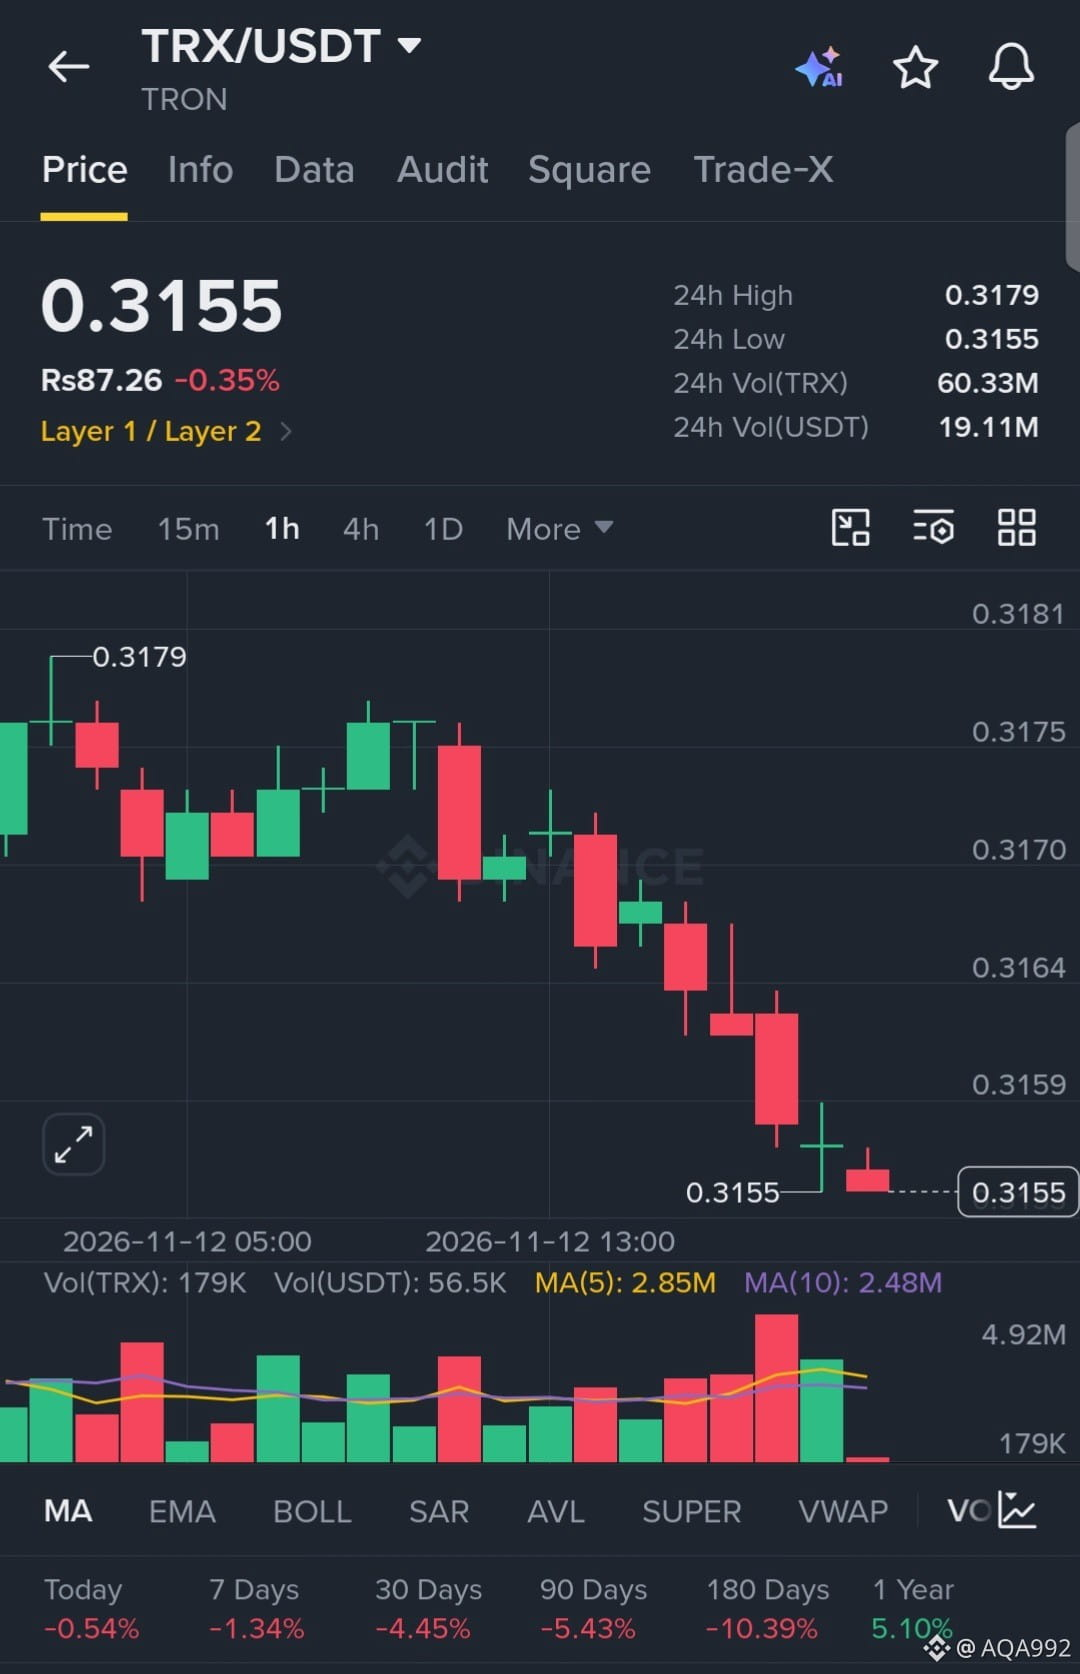
is bleeding aggressively, printing relentless lower highs as sellers smash through local support. The 1H chart shows steady distribution with absolutely zero signs of buyer absorption, indicating heavy bearish momentum driving a clean continuation short.
EP: 0.3155
TP: 0.3130, 0.3105, 0.3080
SL: 0.3190
$TRX
#HuangExitNvidiaStrategyInFocus
#ChipStocksExtendLossesAfterNvidiaCEOChange
#AnthropicRejectsIPODelayValuationinQuestion
#MSCIRemovalMayCurbStrategy’sBitcoinBuying
#TradFiForBeginners
{future}(TRXUSDT)
$TRX
is bleeding aggressively, printing relentless lower highs as sellers smash through local support. The 1H chart shows steady distribution with absolutely zero signs of buyer absorption, indicating heavy bearish momentum driving a clean continuation short.
EP: 0.3155
TP: 0.3130, 0.3105, 0.3080
SL: 0.3190
$TRX
#HuangExitNvidiaStrategyInFocus
#ChipStocksExtendLossesAfterNvidiaCEOChange
#AnthropicRejectsIPODelayValuationinQuestion
#MSCIRemovalMayCurbStrategy’sBitcoinBuying
#TradFiForBeginners
is bleeding aggressively, printing relentless lower highs as sellers smash through local support. The 1H chart shows steady distribution with absolutely zero signs of buyer absorption, indicating heavy bearish momentum driving a clean continuation short.
EP: 0.3155
TP: 0.3130, 0.3105, 0.3080
SL: 0.3190
$TRX
#HuangExitNvidiaStrategyInFocus
#ChipStocksExtendLossesAfterNvidiaCEOChange
#AnthropicRejectsIPODelayValuationinQuestion
#MSCIRemovalMayCurbStrategy’sBitcoinBuying
#TradFiForBeginners
7
·
--
Рост
$SOXLB
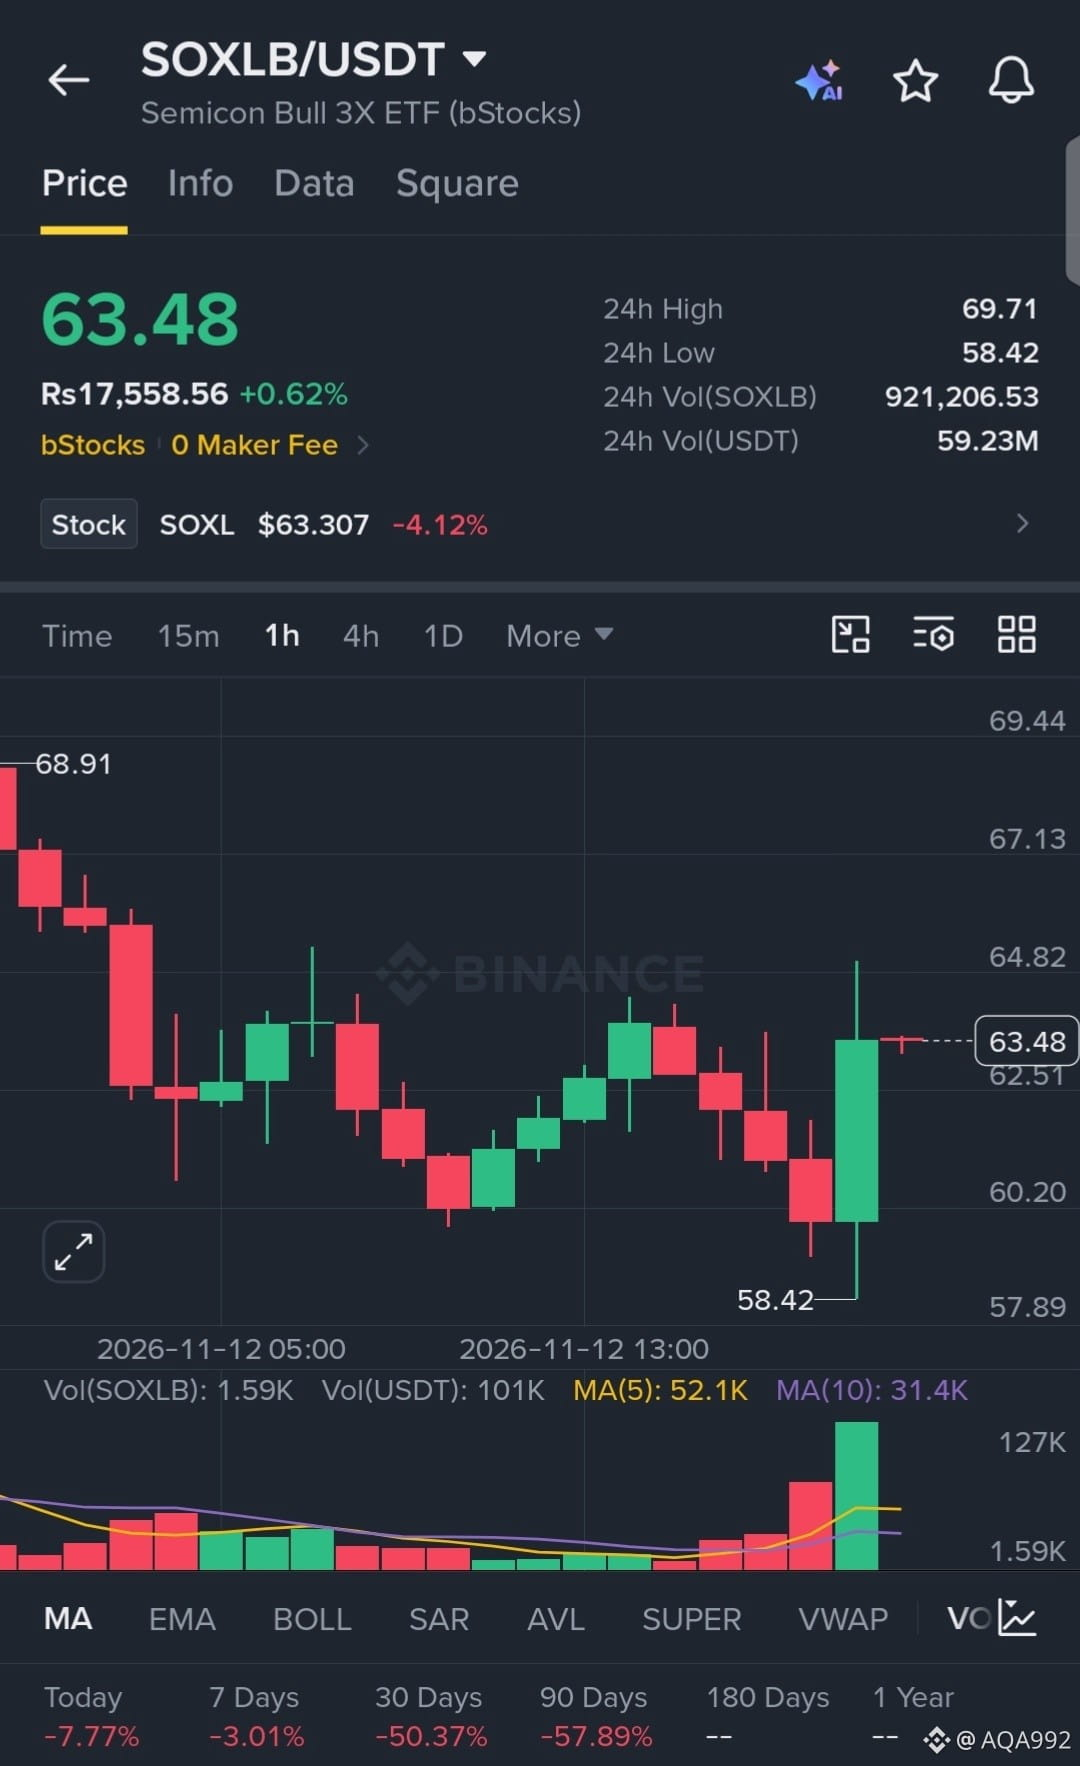
has aggressively swept downside liquidity, printing a sharp capitulation wick to 58.42 before staging a violent V-shaped reversal. The 1H chart shows a massive surge in buy volume reclaiming the local range, signaling intense momentum for a swift relief rally.
EP: 63.48
TP: 65.50, 68.00, 70.50
SL: 58.00
$SOXLB
#HuangExitNvidiaStrategyInFocus
#ChipStocksExtendLossesAfterNvidiaCEOChange
#AnthropicRejectsIPODelayValuationinQuestion
#CoreWeaveJumps10%On168%RevenueGrowth
#MSCIRemovalMayCurbStrategy’sBitcoinBuying
{spot}(SOXLBUSDT)
$SOXLB
has aggressively swept downside liquidity, printing a sharp capitulation wick to 58.42 before staging a violent V-shaped reversal. The 1H chart shows a massive surge in buy volume reclaiming the local range, signaling intense momentum for a swift relief rally.
EP: 63.48
TP: 65.50, 68.00, 70.50
SL: 58.00
$SOXLB
#HuangExitNvidiaStrategyInFocus
#ChipStocksExtendLossesAfterNvidiaCEOChange
#AnthropicRejectsIPODelayValuationinQuestion
#CoreWeaveJumps10%On168%RevenueGrowth
#MSCIRemovalMayCurbStrategy’sBitcoinBuying
has aggressively swept downside liquidity, printing a sharp capitulation wick to 58.42 before staging a violent V-shaped reversal. The 1H chart shows a massive surge in buy volume reclaiming the local range, signaling intense momentum for a swift relief rally.
EP: 63.48
TP: 65.50, 68.00, 70.50
SL: 58.00
$SOXLB
#HuangExitNvidiaStrategyInFocus
#ChipStocksExtendLossesAfterNvidiaCEOChange
#AnthropicRejectsIPODelayValuationinQuestion
#CoreWeaveJumps10%On168%RevenueGrowth
#MSCIRemovalMayCurbStrategy’sBitcoinBuying
6
·
--
Падение
$KAVA
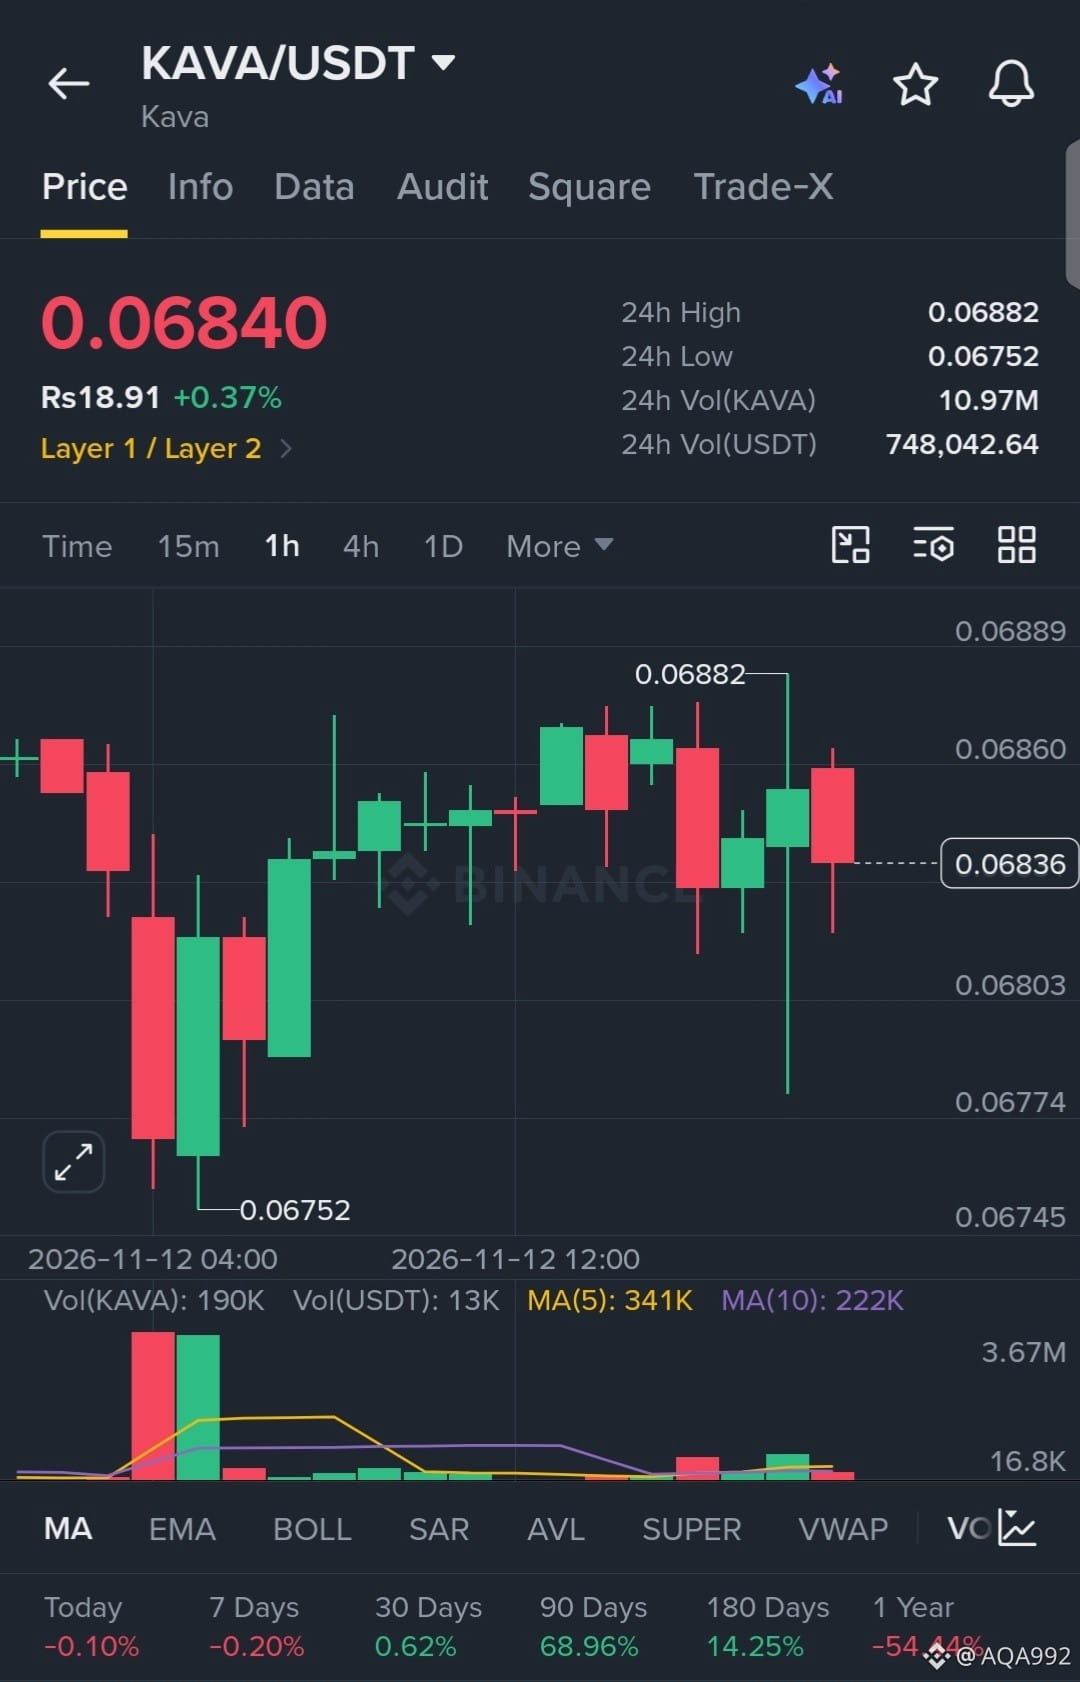
is compressing tightly near local highs, aggressively defending the 0.0680 support zone after a sharp liquidity sweep. The 1H chart reveals intense buyer absorption on every dip, signaling heavy accumulation and coiled momentum ready to break the 0.06882 resistance.
EP: 0.06840
TP: 0.06950, 0.07050, 0.07200
SL: 0.06720
$KAVA
#HuangExitNvidiaStrategyInFocus
#ChipStocksExtendLossesAfterNvidiaCEOChange
#AnthropicRejectsIPODelayValuationinQuestion
#CoreWeaveJumps10%On168%RevenueGrowth
#MSCIRemovalMayCurbStrategy’sBitcoinBuying
{future}(KAVAUSDT)
$KAVA
is compressing tightly near local highs, aggressively defending the 0.0680 support zone after a sharp liquidity sweep. The 1H chart reveals intense buyer absorption on every dip, signaling heavy accumulation and coiled momentum ready to break the 0.06882 resistance.
EP: 0.06840
TP: 0.06950, 0.07050, 0.07200
SL: 0.06720
$KAVA
#HuangExitNvidiaStrategyInFocus
#ChipStocksExtendLossesAfterNvidiaCEOChange
#AnthropicRejectsIPODelayValuationinQuestion
#CoreWeaveJumps10%On168%RevenueGrowth
#MSCIRemovalMayCurbStrategy’sBitcoinBuying
is compressing tightly near local highs, aggressively defending the 0.0680 support zone after a sharp liquidity sweep. The 1H chart reveals intense buyer absorption on every dip, signaling heavy accumulation and coiled momentum ready to break the 0.06882 resistance.
EP: 0.06840
TP: 0.06950, 0.07050, 0.07200
SL: 0.06720
$KAVA
#HuangExitNvidiaStrategyInFocus
#ChipStocksExtendLossesAfterNvidiaCEOChange
#AnthropicRejectsIPODelayValuationinQuestion
#CoreWeaveJumps10%On168%RevenueGrowth
#MSCIRemovalMayCurbStrategy’sBitcoinBuying
7
·
--
Рост
$AAPLB
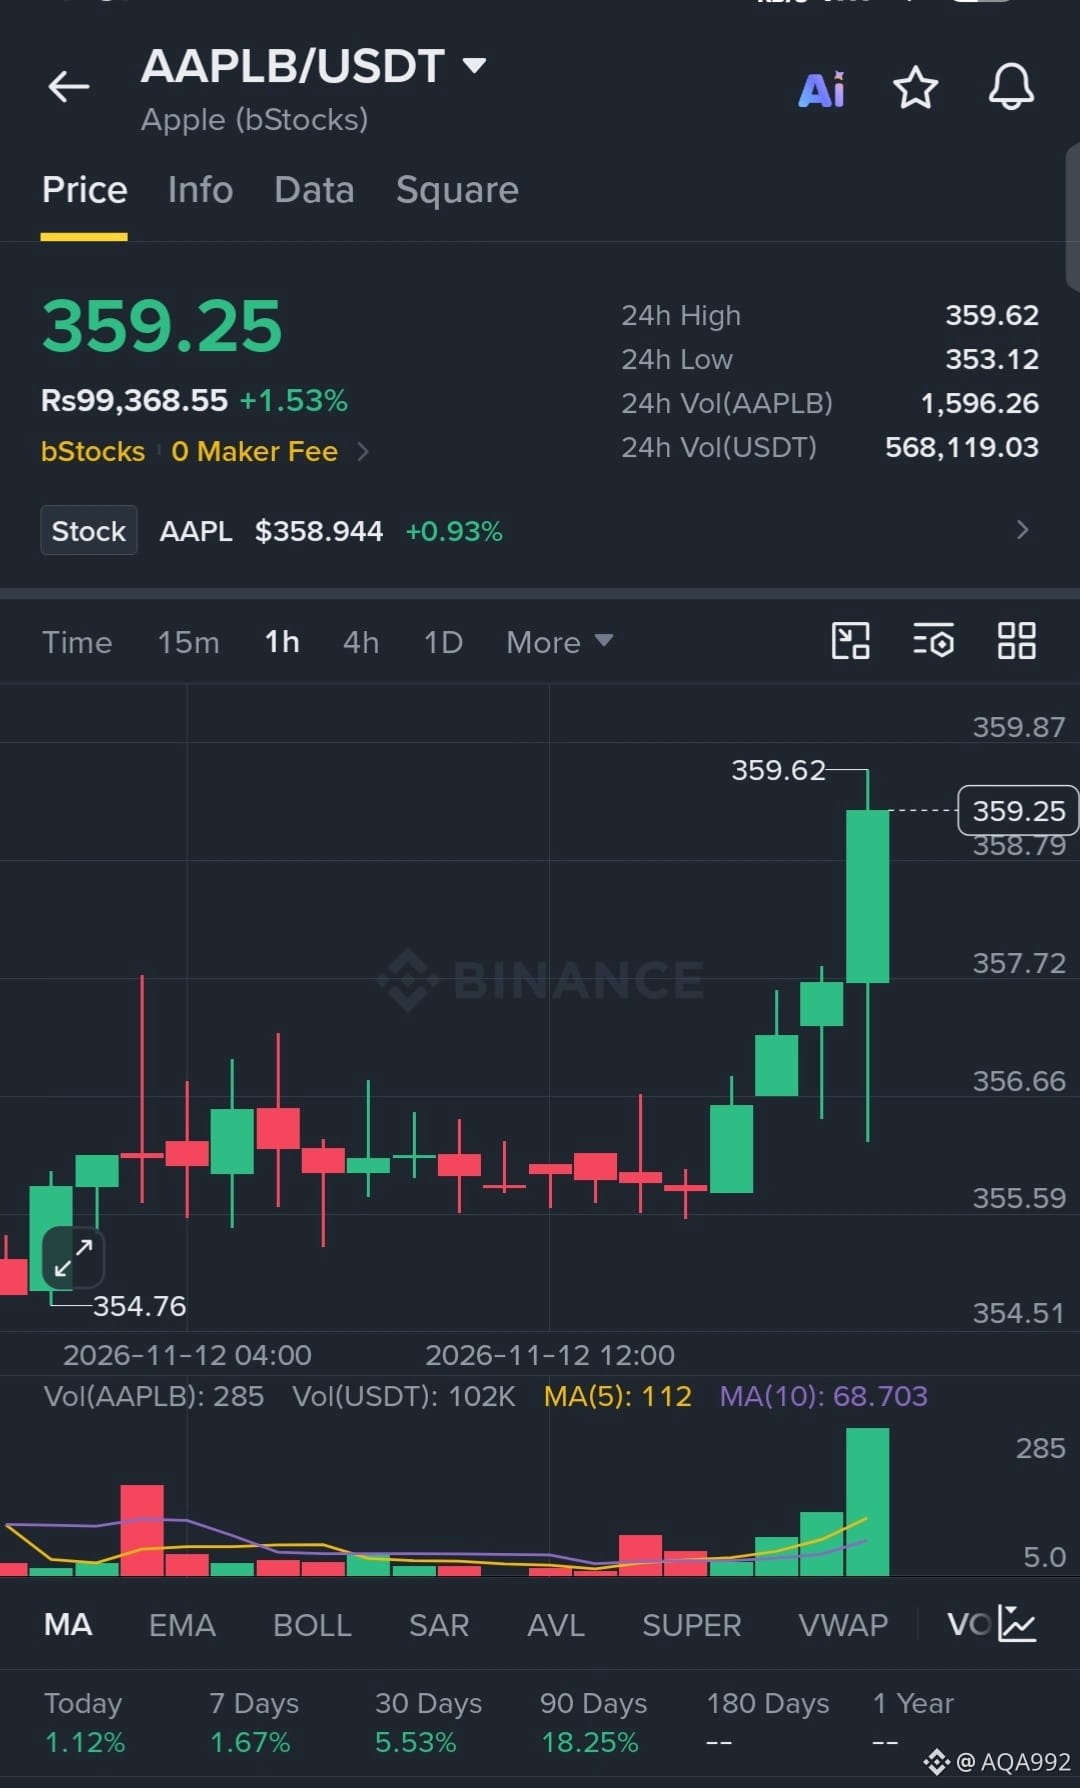
is demonstrating textbook bullish continuation, establishing a strong sequence of higher lows and breaking local resistance with a surge in volume. The 1H chart shows aggressive buyer absorption on every dip, signaling intense momentum ready to shatter the immediate high at 359.62.
EP: 359.25
TP: 362.50, 366.00, 370.00
SL: 353.50
$AAPLB
#HuangExitNvidiaStrategyInFocus
#ChipStocksExtendLossesAfterNvidiaCEOChange
#AnthropicRejectsIPODelayValuationinQuestion
#CoreWeaveJumps10%On168%RevenueGrowth
#MSCIRemovalMayCurbStrategy’sBitcoinBuying
{spot}(AAPLBUSDT)
$AAPLB
is demonstrating textbook bullish continuation, establishing a strong sequence of higher lows and breaking local resistance with a surge in volume. The 1H chart shows aggressive buyer absorption on every dip, signaling intense momentum ready to shatter the immediate high at 359.62.
EP: 359.25
TP: 362.50, 366.00, 370.00
SL: 353.50
$AAPLB
#HuangExitNvidiaStrategyInFocus
#ChipStocksExtendLossesAfterNvidiaCEOChange
#AnthropicRejectsIPODelayValuationinQuestion
#CoreWeaveJumps10%On168%RevenueGrowth
#MSCIRemovalMayCurbStrategy’sBitcoinBuying
is demonstrating textbook bullish continuation, establishing a strong sequence of higher lows and breaking local resistance with a surge in volume. The 1H chart shows aggressive buyer absorption on every dip, signaling intense momentum ready to shatter the immediate high at 359.62.
EP: 359.25
TP: 362.50, 366.00, 370.00
SL: 353.50
$AAPLB
#HuangExitNvidiaStrategyInFocus
#ChipStocksExtendLossesAfterNvidiaCEOChange
#AnthropicRejectsIPODelayValuationinQuestion
#CoreWeaveJumps10%On168%RevenueGrowth
#MSCIRemovalMayCurbStrategy’sBitcoinBuying
5
·
--
Рост
$AVGOB
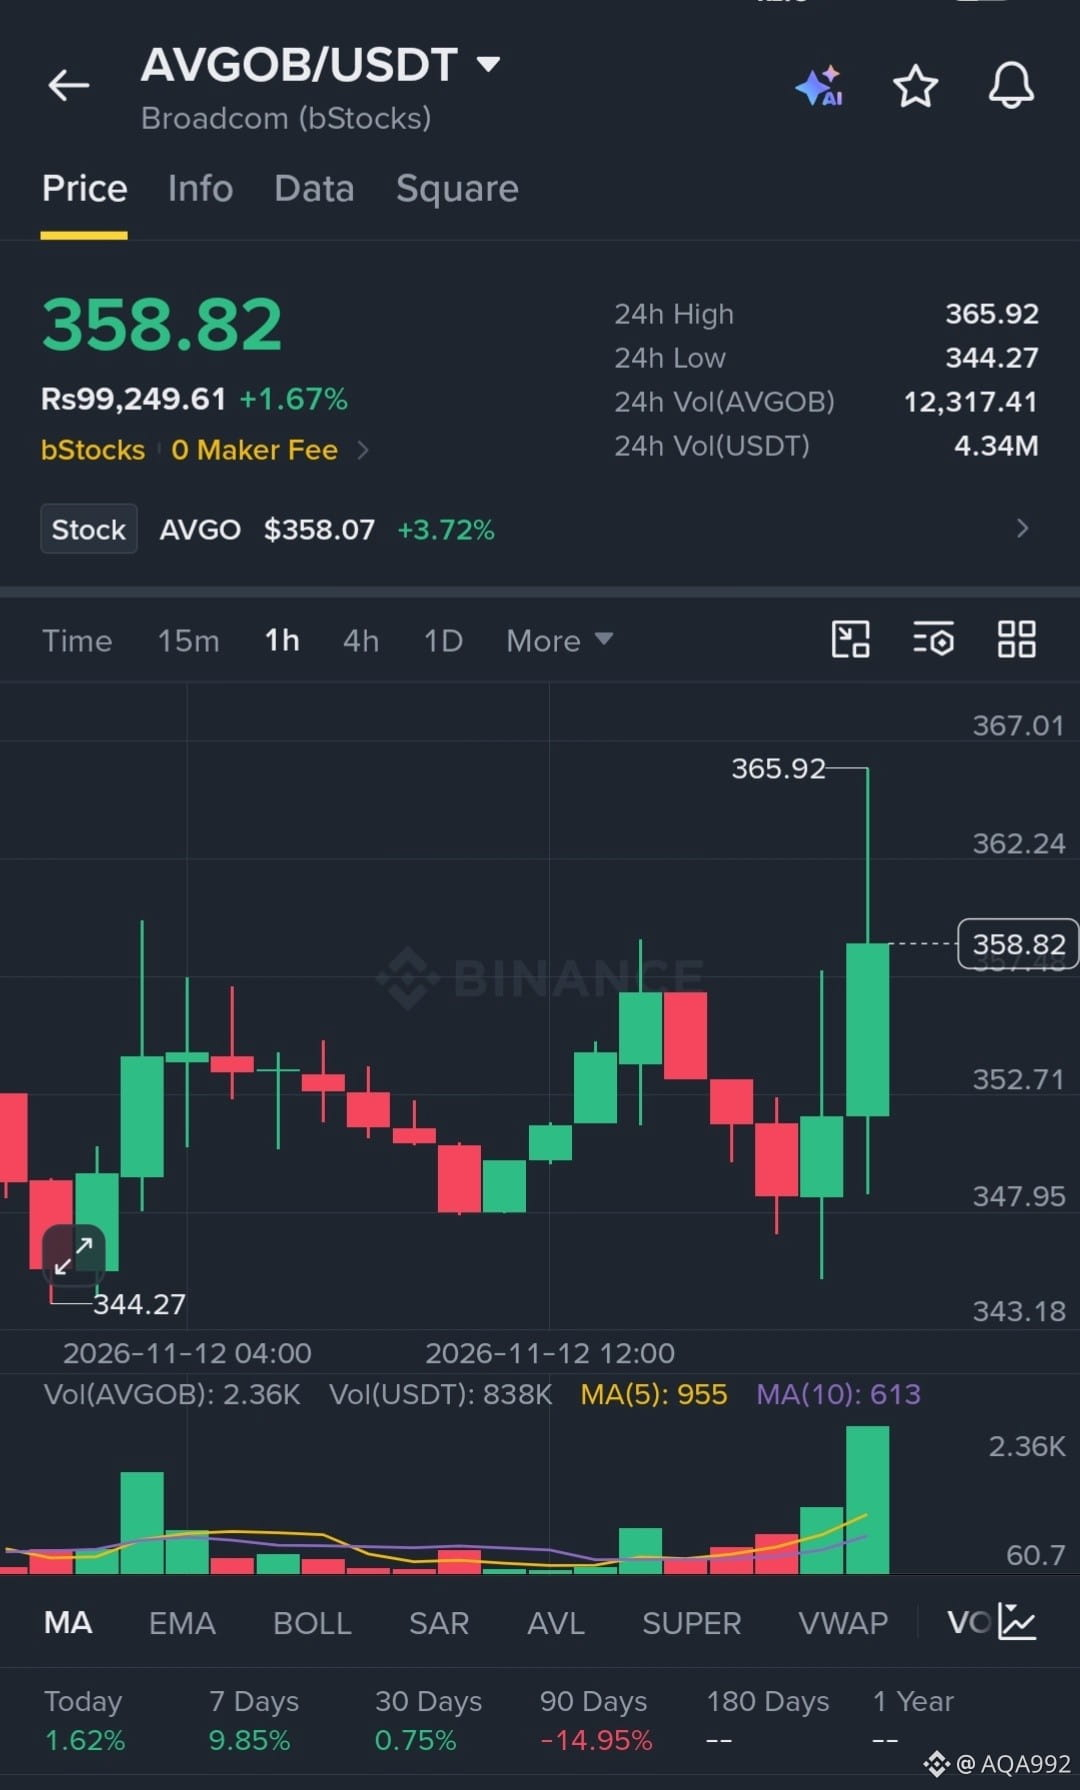
is showing strong bullish structure, aggressively defending the recent breakout zone after a sharp liquidity sweep to 344.27. The 1H chart reveals heavy volume absorption on dips and a rejection of the local high at 365.92, signaling coiled momentum ready for a continuation breakout.
EP: 358.82
TP: 366.00, 374.50, 385.00
SL: 346.00
$AVGOB
#HuangExitNvidiaStrategyInFocus
#ChipStocksExtendLossesAfterNvidiaCEOChange
#AnthropicRejectsIPODelayValuationinQuestion
#MSCIRemovalMayCurbStrategy’sBitcoinBuying
#TradFiForBeginners
{spot}(AVGOBUSDT)
$AVGOB
is showing strong bullish structure, aggressively defending the recent breakout zone after a sharp liquidity sweep to 344.27. The 1H chart reveals heavy volume absorption on dips and a rejection of the local high at 365.92, signaling coiled momentum ready for a continuation breakout.
EP: 358.82
TP: 366.00, 374.50, 385.00
SL: 346.00
$AVGOB
#HuangExitNvidiaStrategyInFocus
#ChipStocksExtendLossesAfterNvidiaCEOChange
#AnthropicRejectsIPODelayValuationinQuestion
#MSCIRemovalMayCurbStrategy’sBitcoinBuying
#TradFiForBeginners
is showing strong bullish structure, aggressively defending the recent breakout zone after a sharp liquidity sweep to 344.27. The 1H chart reveals heavy volume absorption on dips and a rejection of the local high at 365.92, signaling coiled momentum ready for a continuation breakout.
EP: 358.82
TP: 366.00, 374.50, 385.00
SL: 346.00
$AVGOB
#HuangExitNvidiaStrategyInFocus
#ChipStocksExtendLossesAfterNvidiaCEOChange
#AnthropicRejectsIPODelayValuationinQuestion
#MSCIRemovalMayCurbStrategy’sBitcoinBuying
#TradFiForBeginners
3
·
--
Рост
$AMZNB
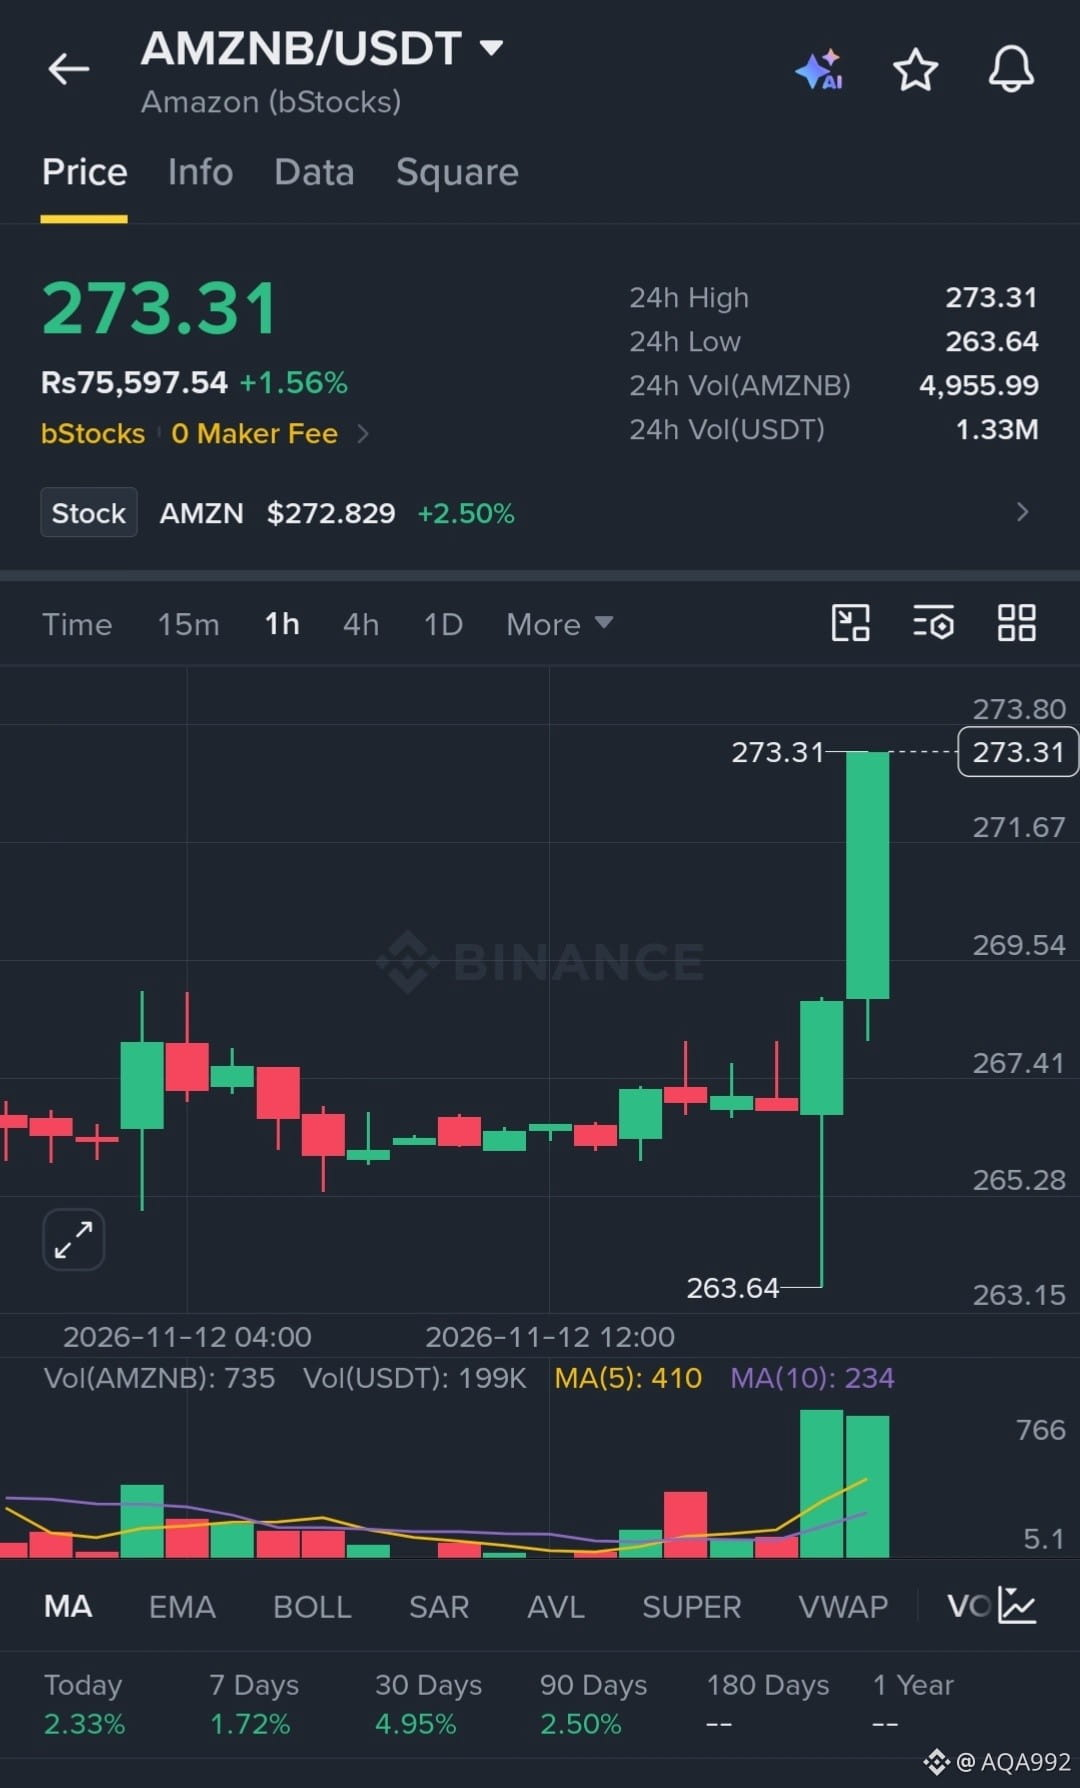
has ignited a violent bullish breakout, aggressively clearing local resistance with a massive, high-conviction volume spike. The 1H chart shows absolute buyer dominance, establishing a sharp V-shaped recovery from the 263.64 low. Momentum is fully primed for immediate continuation into price discovery.
EP: 273.31
TP: 278.00, 284.50, 292.00
SL: 265.00
$AMZNB
#HuangExitNvidiaStrategyInFocus
#ChipStocksExtendLossesAfterNvidiaCEOChange
#AnthropicRejectsIPODelayValuationinQuestion
#CoreWeaveJumps10%On168%RevenueGrowth
#TradFiForBeginners
{spot}(AMZNBUSDT)
$AMZNB
has ignited a violent bullish breakout, aggressively clearing local resistance with a massive, high-conviction volume spike. The 1H chart shows absolute buyer dominance, establishing a sharp V-shaped recovery from the 263.64 low. Momentum is fully primed for immediate continuation into price discovery.
EP: 273.31
TP: 278.00, 284.50, 292.00
SL: 265.00
$AMZNB
#HuangExitNvidiaStrategyInFocus
#ChipStocksExtendLossesAfterNvidiaCEOChange
#AnthropicRejectsIPODelayValuationinQuestion
#CoreWeaveJumps10%On168%RevenueGrowth
#TradFiForBeginners
has ignited a violent bullish breakout, aggressively clearing local resistance with a massive, high-conviction volume spike. The 1H chart shows absolute buyer dominance, establishing a sharp V-shaped recovery from the 263.64 low. Momentum is fully primed for immediate continuation into price discovery.
EP: 273.31
TP: 278.00, 284.50, 292.00
SL: 265.00
$AMZNB
#HuangExitNvidiaStrategyInFocus
#ChipStocksExtendLossesAfterNvidiaCEOChange
#AnthropicRejectsIPODelayValuationinQuestion
#CoreWeaveJumps10%On168%RevenueGrowth
#TradFiForBeginners
4
·
--
Рост
$GOOGLB
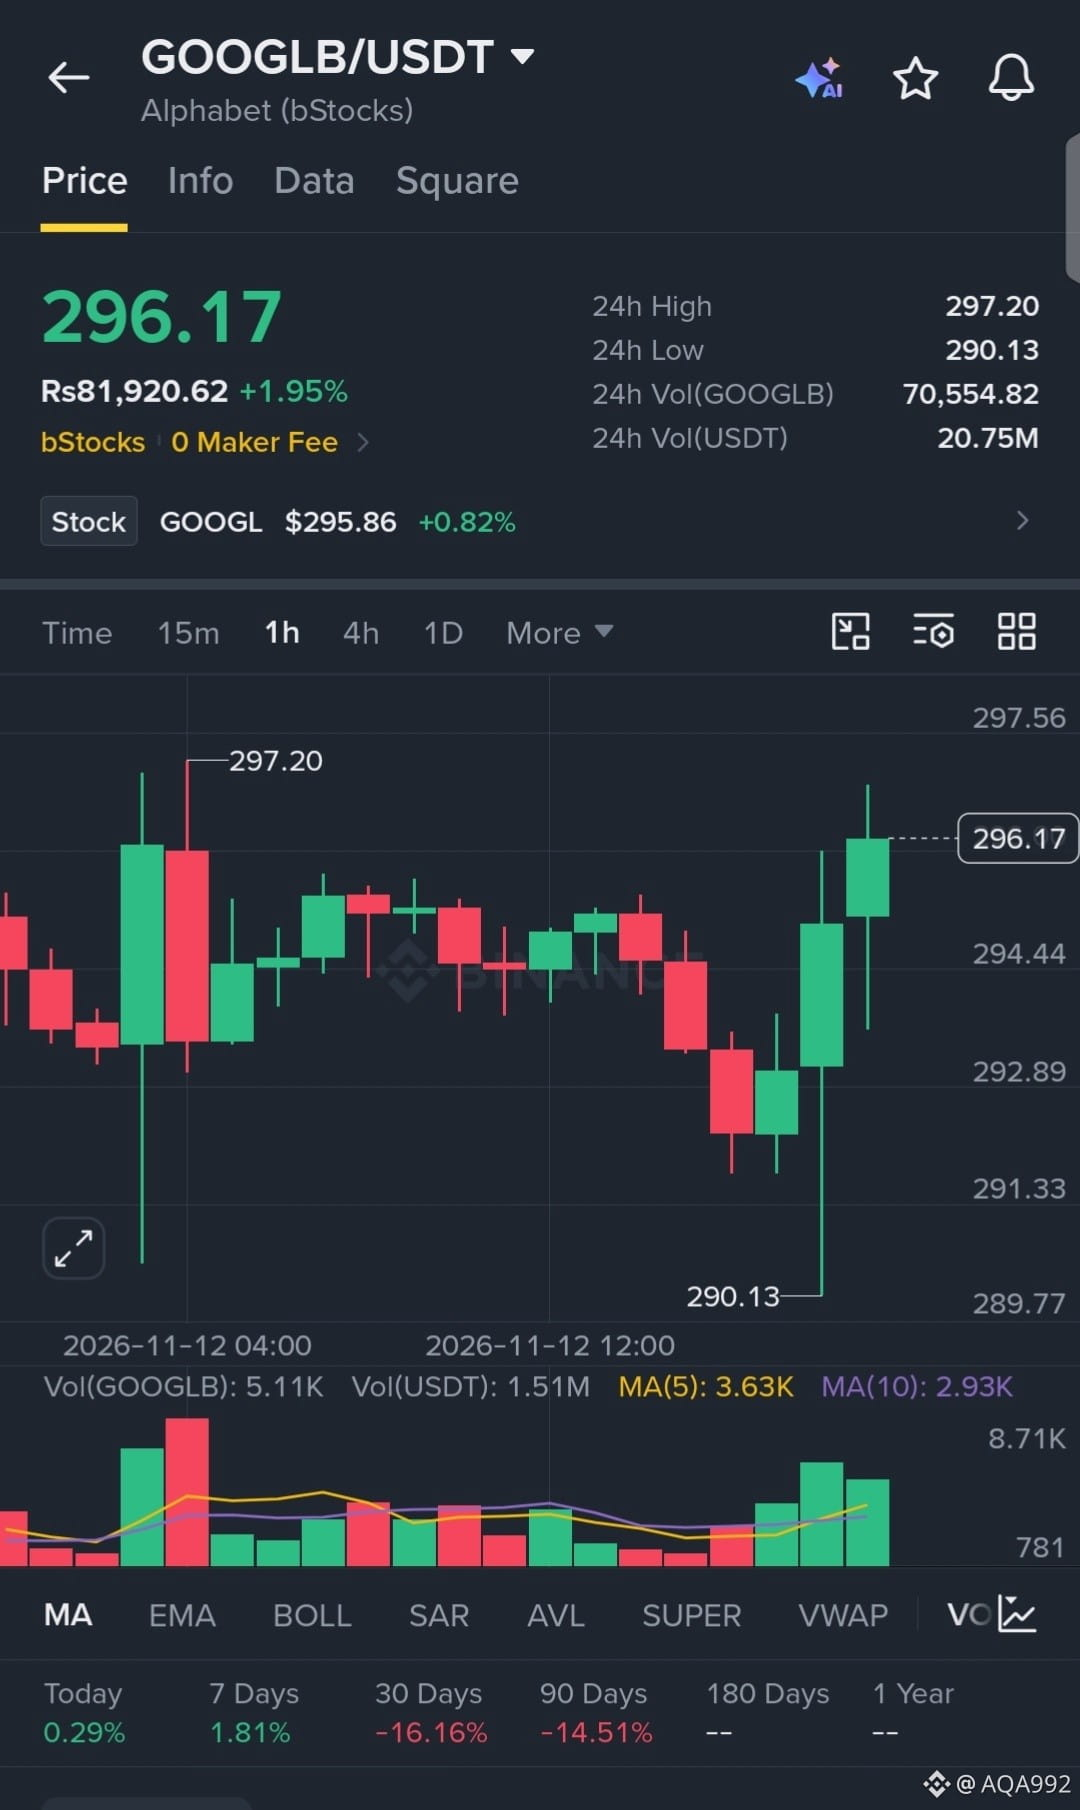
has aggressively swept downside liquidity, printing a sharp capitulation wick to 290.13 before staging a violent V-shaped reversal. The 1H chart shows immediate buyer absorption with a surge in volume reclaiming the local range, signaling intense momentum for a continuation push toward previous highs.
EP: 296.17
TP: 300.00, 305.50, 312.00
SL: 289.00
$GOOGLB
#HuangExitNvidiaStrategyInFocus
#ChipStocksExtendLossesAfterNvidiaCEOChange
#AnthropicRejectsIPODelayValuationinQuestion
#CoreWeaveJumps10%On168%RevenueGrowth
#MSCIRemovalMayCurbStrategy’sBitcoinBuying
{spot}(GOOGLBUSDT)
$GOOGLB
has aggressively swept downside liquidity, printing a sharp capitulation wick to 290.13 before staging a violent V-shaped reversal. The 1H chart shows immediate buyer absorption with a surge in volume reclaiming the local range, signaling intense momentum for a continuation push toward previous highs.
EP: 296.17
TP: 300.00, 305.50, 312.00
SL: 289.00
$GOOGLB
#HuangExitNvidiaStrategyInFocus
#ChipStocksExtendLossesAfterNvidiaCEOChange
#AnthropicRejectsIPODelayValuationinQuestion
#CoreWeaveJumps10%On168%RevenueGrowth
#MSCIRemovalMayCurbStrategy’sBitcoinBuying
has aggressively swept downside liquidity, printing a sharp capitulation wick to 290.13 before staging a violent V-shaped reversal. The 1H chart shows immediate buyer absorption with a surge in volume reclaiming the local range, signaling intense momentum for a continuation push toward previous highs.
EP: 296.17
TP: 300.00, 305.50, 312.00
SL: 289.00
$GOOGLB
#HuangExitNvidiaStrategyInFocus
#ChipStocksExtendLossesAfterNvidiaCEOChange
#AnthropicRejectsIPODelayValuationinQuestion
#CoreWeaveJumps10%On168%RevenueGrowth
#MSCIRemovalMayCurbStrategy’sBitcoinBuying
2
·
--
Падение
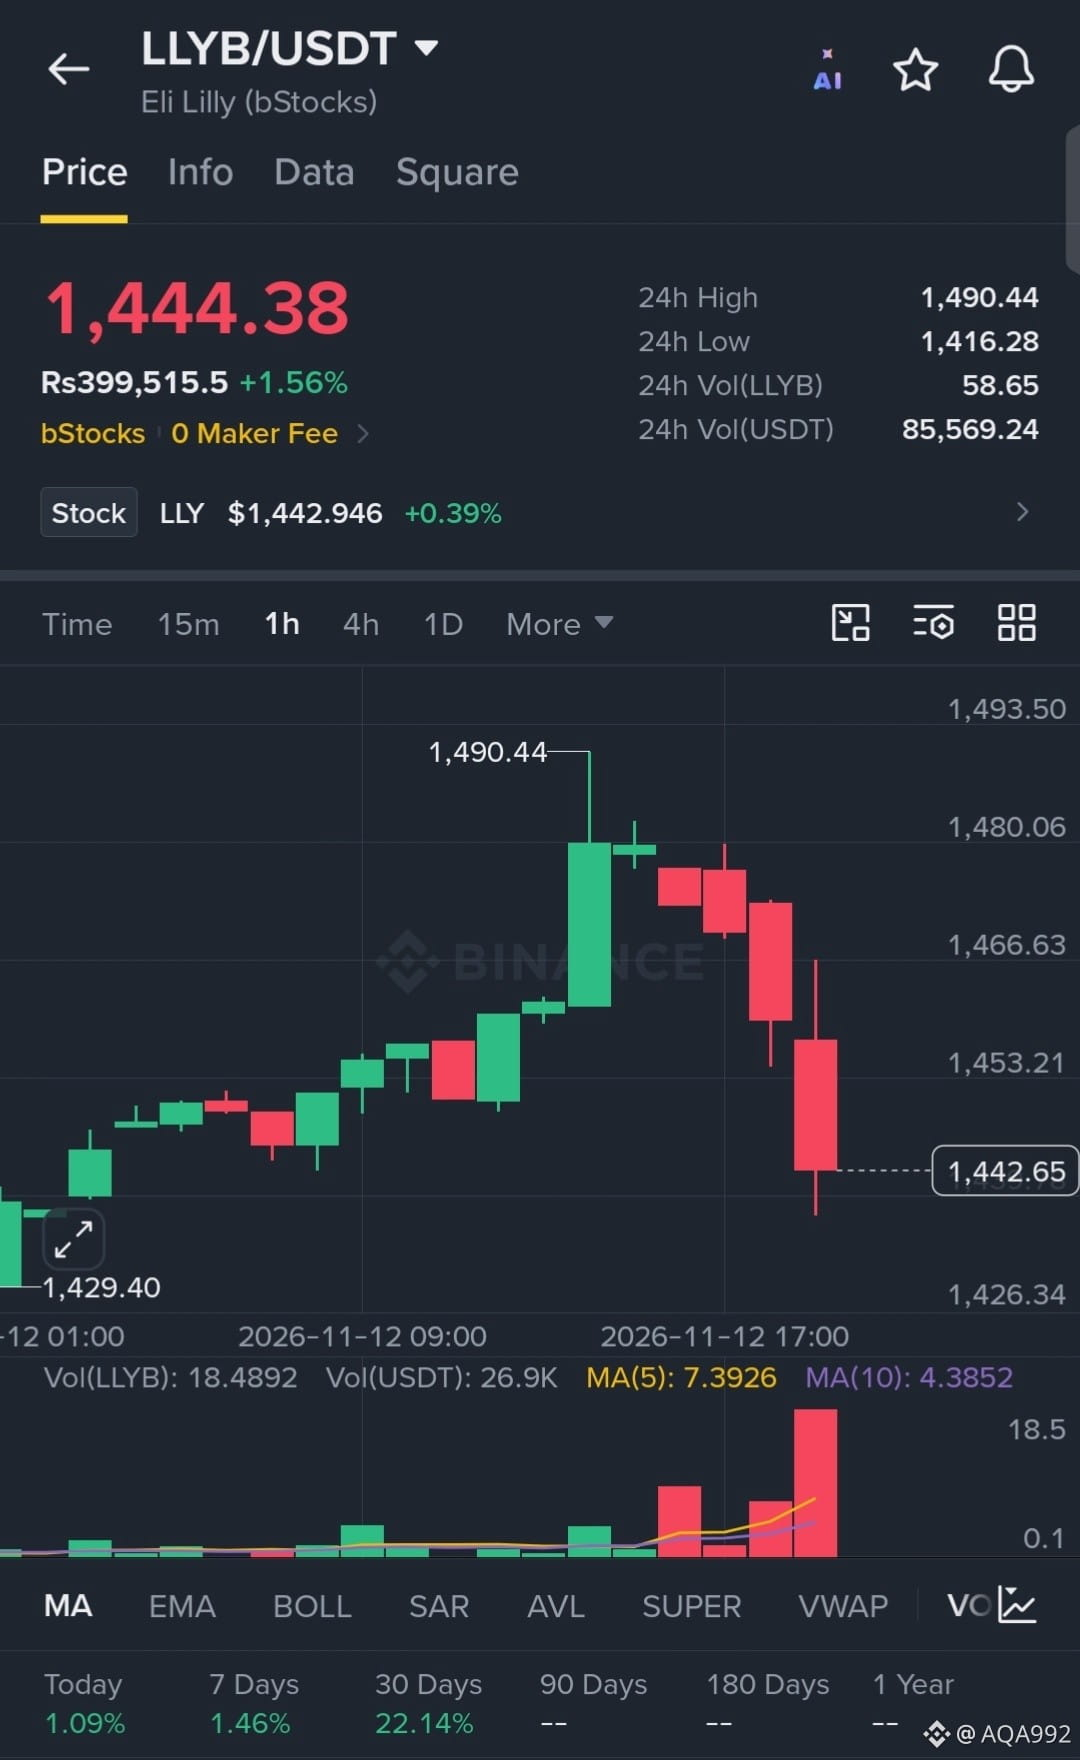
$LLYB
has aggressively rejected the 1,490 local high, triggering a sharp cascade of selling pressure with expanding volume. The 1H chart shows heavy distribution and a clear breakdown of market structure, signaling intense bearish momentum driving toward lower support levels.
EP: 1444.38
TP: 1425.00, 1410.00, 1395.00
SL: 1478.00
$LLYB
#HuangExitNvidiaStrategyInFocus
#ChipStocksExtendLossesAfterNvidiaCEOChange
#AnthropicRejectsIPODelayValuationinQuestion
#CoreWeaveJumps10%On168%RevenueGrowth
#MSCIRemovalMayCurbStrategy’sBitcoinBuying
{spot}(LLYBUSDT)
$LLYB
has aggressively rejected the 1,490 local high, triggering a sharp cascade of selling pressure with expanding volume. The 1H chart shows heavy distribution and a clear breakdown of market structure, signaling intense bearish momentum driving toward lower support levels.
EP: 1444.38
TP: 1425.00, 1410.00, 1395.00
SL: 1478.00
$LLYB
#HuangExitNvidiaStrategyInFocus
#ChipStocksExtendLossesAfterNvidiaCEOChange
#AnthropicRejectsIPODelayValuationinQuestion
#CoreWeaveJumps10%On168%RevenueGrowth
#MSCIRemovalMayCurbStrategy’sBitcoinBuying
has aggressively rejected the 1,490 local high, triggering a sharp cascade of selling pressure with expanding volume. The 1H chart shows heavy distribution and a clear breakdown of market structure, signaling intense bearish momentum driving toward lower support levels.
EP: 1444.38
TP: 1425.00, 1410.00, 1395.00
SL: 1478.00
$LLYB
#HuangExitNvidiaStrategyInFocus
#ChipStocksExtendLossesAfterNvidiaCEOChange
#AnthropicRejectsIPODelayValuationinQuestion
#CoreWeaveJumps10%On168%RevenueGrowth
#MSCIRemovalMayCurbStrategy’sBitcoinBuying
4
·
--
Рост
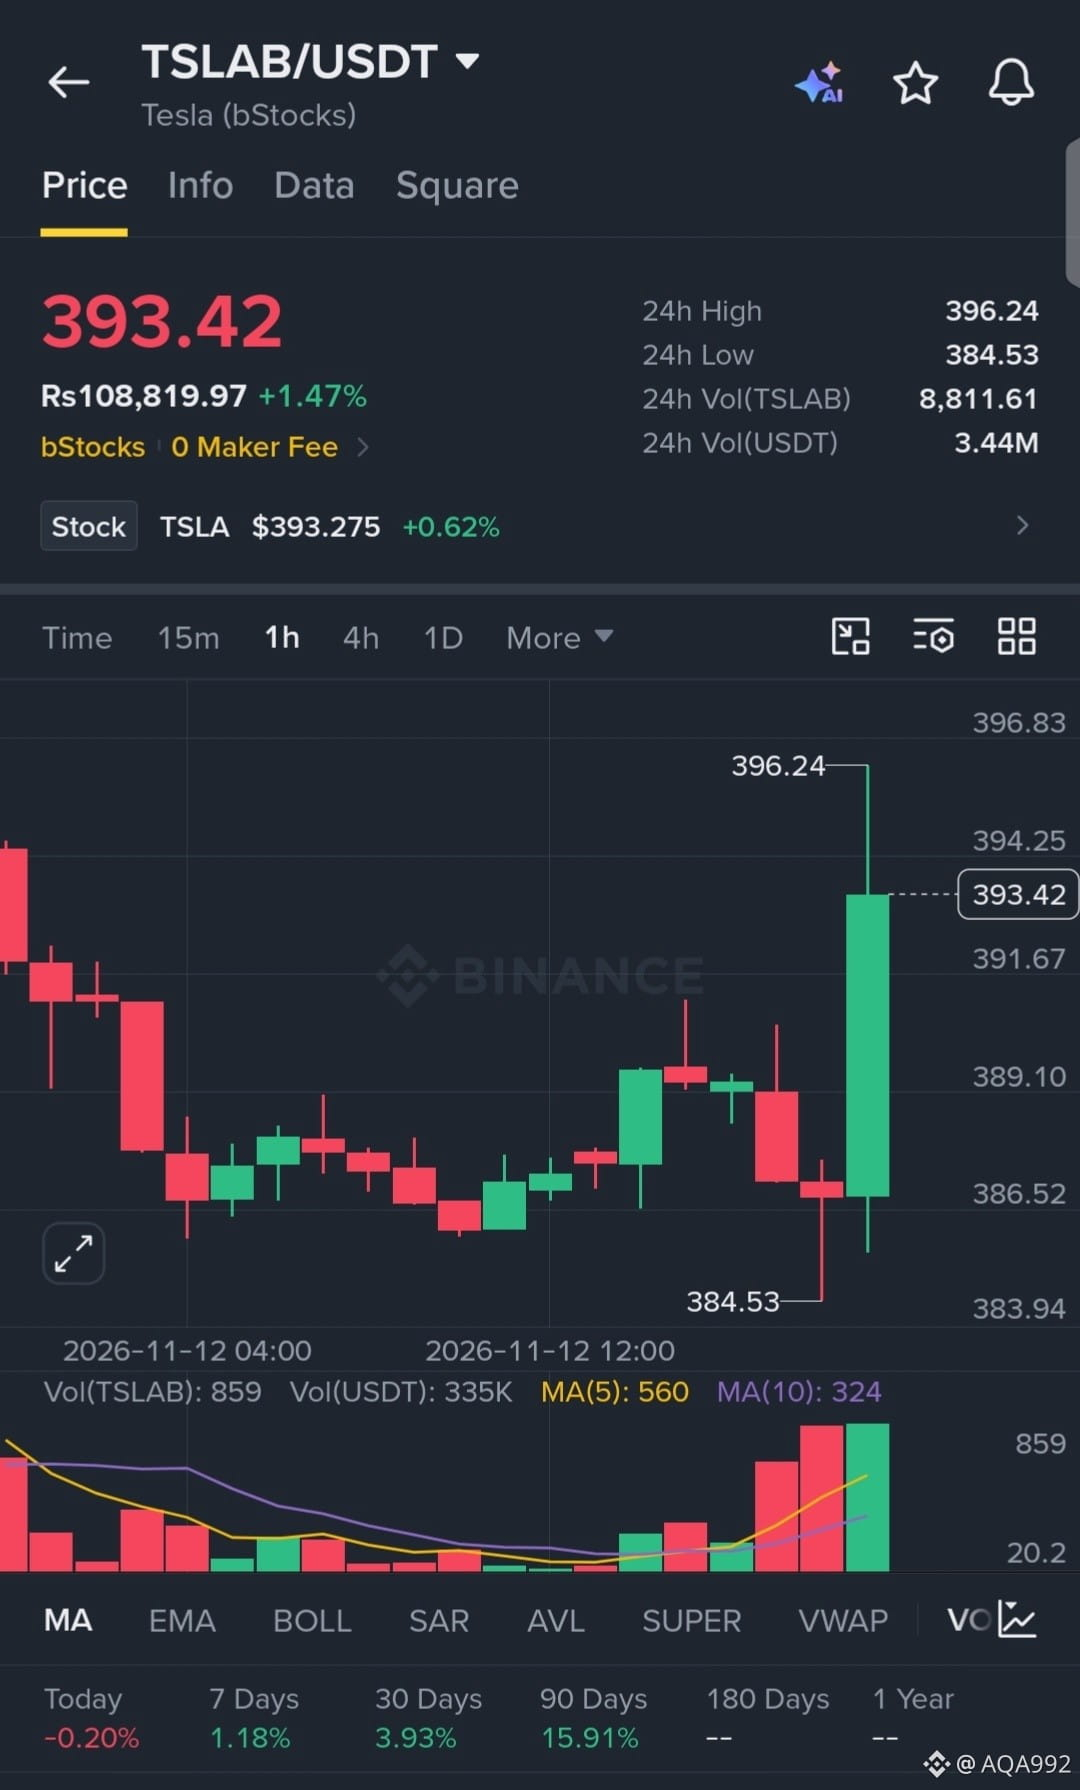
$TSLAB
has aggressively swept downside liquidity, printing a sharp capitulation wick to 384.53 before staging a violent V-shaped reversal. The 1H chart shows a massive surge in buy volume reclaiming the local range, signaling intense momentum for a swift continuation rally.
EP: 393.42
TP: 400.00, 407.50, 415.00
SL: 382.00
$TSLAB
#HuangExitNvidiaStrategyInFocus
#ChipStocksExtendLossesAfterNvidiaCEOChange
#AnthropicRejectsIPODelayValuationinQuestion
#CoreWeaveJumps10%On168%RevenueGrowth
#MSCIRemovalMayCurbStrategy’sBitcoinBuying
{spot}(TSLABUSDT)
$TSLAB
has aggressively swept downside liquidity, printing a sharp capitulation wick to 384.53 before staging a violent V-shaped reversal. The 1H chart shows a massive surge in buy volume reclaiming the local range, signaling intense momentum for a swift continuation rally.
EP: 393.42
TP: 400.00, 407.50, 415.00
SL: 382.00
$TSLAB
#HuangExitNvidiaStrategyInFocus
#ChipStocksExtendLossesAfterNvidiaCEOChange
#AnthropicRejectsIPODelayValuationinQuestion
#CoreWeaveJumps10%On168%RevenueGrowth
#MSCIRemovalMayCurbStrategy’sBitcoinBuying
has aggressively swept downside liquidity, printing a sharp capitulation wick to 384.53 before staging a violent V-shaped reversal. The 1H chart shows a massive surge in buy volume reclaiming the local range, signaling intense momentum for a swift continuation rally.
EP: 393.42
TP: 400.00, 407.50, 415.00
SL: 382.00
$TSLAB
#HuangExitNvidiaStrategyInFocus
#ChipStocksExtendLossesAfterNvidiaCEOChange
#AnthropicRejectsIPODelayValuationinQuestion
#CoreWeaveJumps10%On168%RevenueGrowth
#MSCIRemovalMayCurbStrategy’sBitcoinBuying
4
·
--
Рост
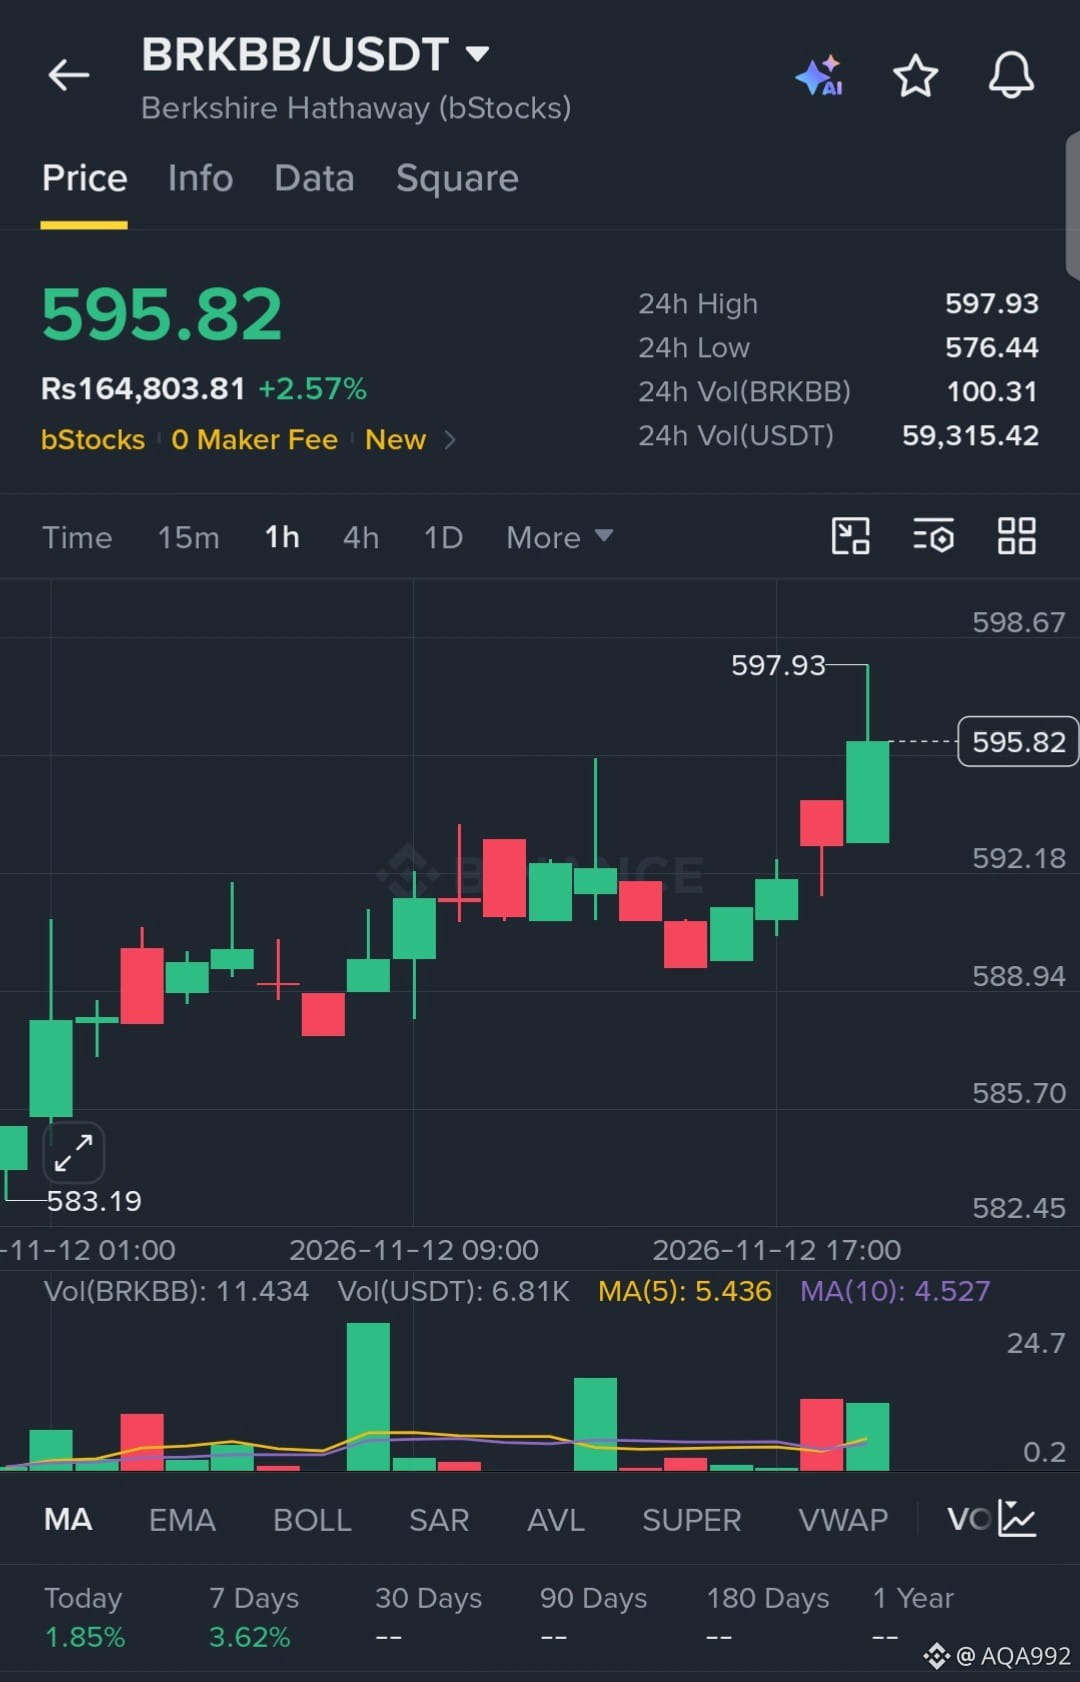
$BRKBB
is maintaining a relentless bullish structure, printing consecutive higher lows and pressing hard against local resistance at 597.93. The 1H chart shows steady volume accumulation with zero signs of heavy selling pressure, indicating a highly coiled setup ready for a breakout continuation.
EP: 595.82
TP: 602.00, 610.00, 620.00
SL: 584.00
$BRKBB
#HuangExitNvidiaStrategyInFocus
#ChipStocksExtendLossesAfterNvidiaCEOChange
#AnthropicRejectsIPODelayValuationinQuestion
#CoreWeaveJumps10%On168%RevenueGrowth
#MSCIRemovalMayCurbStrategy’sBitcoinBuying
{spot}(BRKBBUSDT)
$BRKBB
is maintaining a relentless bullish structure, printing consecutive higher lows and pressing hard against local resistance at 597.93. The 1H chart shows steady volume accumulation with zero signs of heavy selling pressure, indicating a highly coiled setup ready for a breakout continuation.
EP: 595.82
TP: 602.00, 610.00, 620.00
SL: 584.00
$BRKBB
#HuangExitNvidiaStrategyInFocus
#ChipStocksExtendLossesAfterNvidiaCEOChange
#AnthropicRejectsIPODelayValuationinQuestion
#CoreWeaveJumps10%On168%RevenueGrowth
#MSCIRemovalMayCurbStrategy’sBitcoinBuying
is maintaining a relentless bullish structure, printing consecutive higher lows and pressing hard against local resistance at 597.93. The 1H chart shows steady volume accumulation with zero signs of heavy selling pressure, indicating a highly coiled setup ready for a breakout continuation.
EP: 595.82
TP: 602.00, 610.00, 620.00
SL: 584.00
$BRKBB
#HuangExitNvidiaStrategyInFocus
#ChipStocksExtendLossesAfterNvidiaCEOChange
#AnthropicRejectsIPODelayValuationinQuestion
#CoreWeaveJumps10%On168%RevenueGrowth
#MSCIRemovalMayCurbStrategy’sBitcoinBuying
3
·
--
Рост
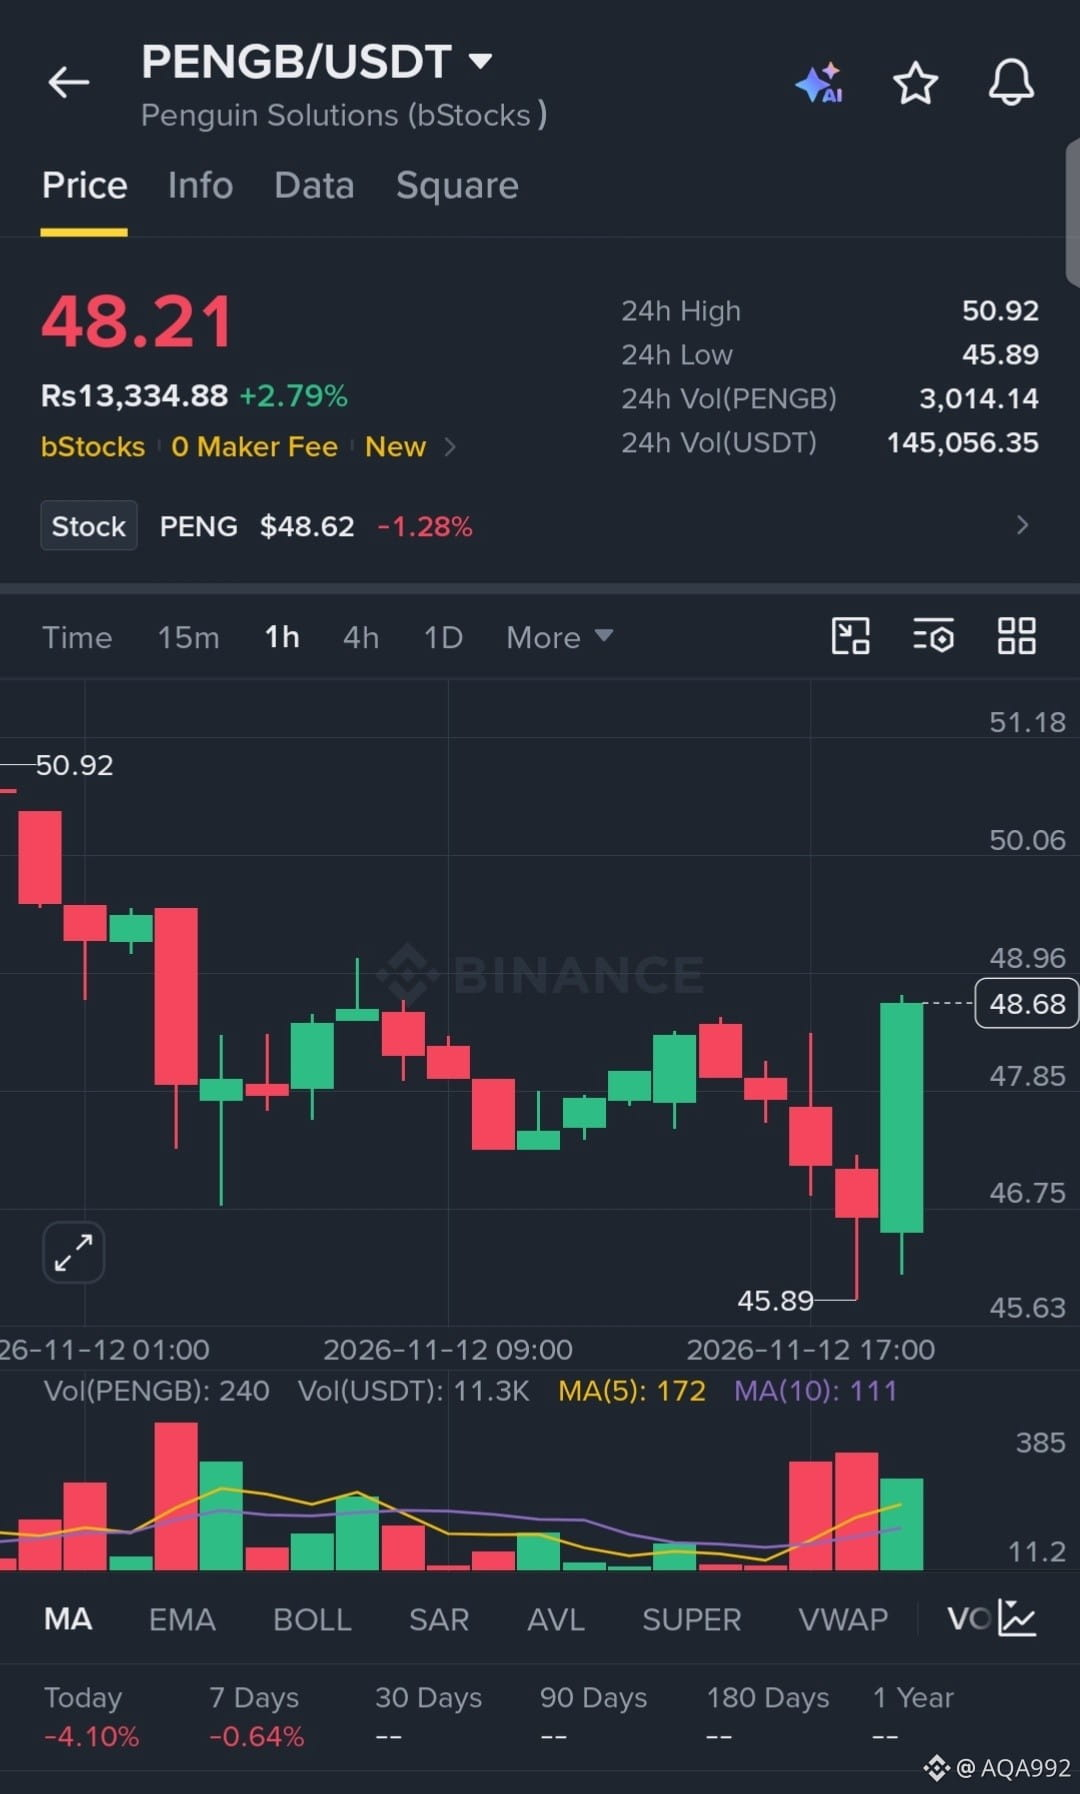
$PENGB
has aggressively swept downside liquidity, printing a sharp capitulation wick to 45.89 before staging a violent V-shaped reversal. The 1H chart shows a massive surge in buy volume reclaiming the local range, signaling intense momentum for a swift relief rally.
EP: 48.21
TP: 49.50, 50.90, 52.50
SL: 45.50
$PENGB
#HuangExitNvidiaStrategyInFocus
#ChipStocksExtendLossesAfterNvidiaCEOChange
#AnthropicRejectsIPODelayValuationinQuestion
#CoreWeaveJumps10%On168%RevenueGrowth
#MSCIRemovalMayCurbStrategy’sBitcoinBuying
{spot}(PENGBUSDT)
$PENGB
has aggressively swept downside liquidity, printing a sharp capitulation wick to 45.89 before staging a violent V-shaped reversal. The 1H chart shows a massive surge in buy volume reclaiming the local range, signaling intense momentum for a swift relief rally.
EP: 48.21
TP: 49.50, 50.90, 52.50
SL: 45.50
$PENGB
#HuangExitNvidiaStrategyInFocus
#ChipStocksExtendLossesAfterNvidiaCEOChange
#AnthropicRejectsIPODelayValuationinQuestion
#CoreWeaveJumps10%On168%RevenueGrowth
#MSCIRemovalMayCurbStrategy’sBitcoinBuying
has aggressively swept downside liquidity, printing a sharp capitulation wick to 45.89 before staging a violent V-shaped reversal. The 1H chart shows a massive surge in buy volume reclaiming the local range, signaling intense momentum for a swift relief rally.
EP: 48.21
TP: 49.50, 50.90, 52.50
SL: 45.50
$PENGB
#HuangExitNvidiaStrategyInFocus
#ChipStocksExtendLossesAfterNvidiaCEOChange
#AnthropicRejectsIPODelayValuationinQuestion
#CoreWeaveJumps10%On168%RevenueGrowth
#MSCIRemovalMayCurbStrategy’sBitcoinBuying
3
Войдите, чтобы посмотреть больше материала
Присоединяйтесь к пользователям криптовалют по всему миру на Binance Square
⚡️ Получайте новейшую и полезную информацию о криптоактивах.
💬 Нам доверяет крупнейшая в мире криптобиржа.
👍 Получите достоверные аналитические данные от верифицированных создателей контента.
Эл. почта/номер телефона
В тренде
WhatWillDriveCryptoandStocks’NextRebound?
Просмотров: 48,801
685 обсуждают
Bitcoin Slips Below $70,000 as Dollar Index Hits 19-Month High
Binance News
·Лайков: 16
·Просмотров: 35.5k
Anthropic’s6xIPODemandSignalsPotentialRecordRaise
Просмотров: 15,919
334 обсуждают
USCryptoETFsLose$1.48BInFiveDays
Просмотров: 72
2 обсуждают