

Intrinsic Value
302 Публикации

Intrinsic Value
Отправить жалобу
Заблокировать пользователя
Disciplined. Value-driven.
0 подписок(и/а)
95 подписчиков(а)
284 понравилось
Посты
The stock-bond correlation has fundamentally shifted, and inflation is the culprit.
For two decades (2000-2021), stocks and 10-year Treasury yields moved together with a +0.40 correlation. Since 2021? That's collapsed to -0.09. More striking: Treasury yields now react THREE TIMES more aggressively to inflation surprises than they did pre-2019.
The trigger? Oil. When energy prices surge — whether from Ukraine in 2022 or renewed Iran tensions today — inflation expectations rise, Treasury yields climb, and bond prices fall. Meanwhile, higher rates pressure equity valuations. Result: stocks and bonds decline together, breaking the traditional hedge.
This has led some to argue bonds are dead, that portfolios should swap $TLT $BND for $GLD or $IBIT. That's a category error. You're not fixing diversification by replacing contractual repayment obligations with speculative volatility. You're just trading one risk for another.
Bonds aren't permanently broken. They're inflation-sensitive. Last week offered hints the old inverse relationship might return, but one week isn't a trend.
What matters: watch oil, inflation expectations, and Treasury yields. When inflation stabilizes, the hedge typically reasserts itself.
Don't confuse a cyclical breakdown with structural failure. Bonds still serve a purpose. Understanding WHEN and WHY they work is far more valuable than chasing last year's best performer.
The stock-bond correlation has fundamentally shifted, and inflation is the culprit.
For two decades (2000-2021), stocks and 10-year Treasury yields moved together with a +0.40 correlation. Since 2021? That's collapsed to -0.09. More striking: Treasury yields now react THREE TIMES more aggressively to inflation surprises than they did pre-2019.
The trigger? Oil. When energy prices surge — whether from Ukraine in 2022 or renewed Iran tensions today — inflation expectations rise, Treasury yields climb, and bond prices fall. Meanwhile, higher rates pressure equity valuations. Result: stocks and bonds decline together, breaking the traditional hedge.
This has led some to argue bonds are dead, that portfolios should swap $TLT $BND for $GLD or $IBIT. That's a category error. You're not fixing diversification by replacing contractual repayment obligations with speculative volatility. You're just trading one risk for another.
Bonds aren't permanently broken. They're inflation-sensitive. Last week offered hints the old inverse relationship might return, but one week isn't a trend.
What matters: watch oil, inflation expectations, and Treasury yields. When inflation stabilizes, the hedge typically reasserts itself.
Don't confuse a cyclical breakdown with structural failure. Bonds still serve a purpose. Understanding WHEN and WHY they work is far more valuable than chasing last year's best performer.
For two decades (2000-2021), stocks and 10-year Treasury yields moved together with a +0.40 correlation. Since 2021? That's collapsed to -0.09. More striking: Treasury yields now react THREE TIMES more aggressively to inflation surprises than they did pre-2019.
The trigger? Oil. When energy prices surge — whether from Ukraine in 2022 or renewed Iran tensions today — inflation expectations rise, Treasury yields climb, and bond prices fall. Meanwhile, higher rates pressure equity valuations. Result: stocks and bonds decline together, breaking the traditional hedge.
This has led some to argue bonds are dead, that portfolios should swap $TLT $BND for $GLD or $IBIT. That's a category error. You're not fixing diversification by replacing contractual repayment obligations with speculative volatility. You're just trading one risk for another.
Bonds aren't permanently broken. They're inflation-sensitive. Last week offered hints the old inverse relationship might return, but one week isn't a trend.
What matters: watch oil, inflation expectations, and Treasury yields. When inflation stabilizes, the hedge typically reasserts itself.
Don't confuse a cyclical breakdown with structural failure. Bonds still serve a purpose. Understanding WHEN and WHY they work is far more valuable than chasing last year's best performer.
369
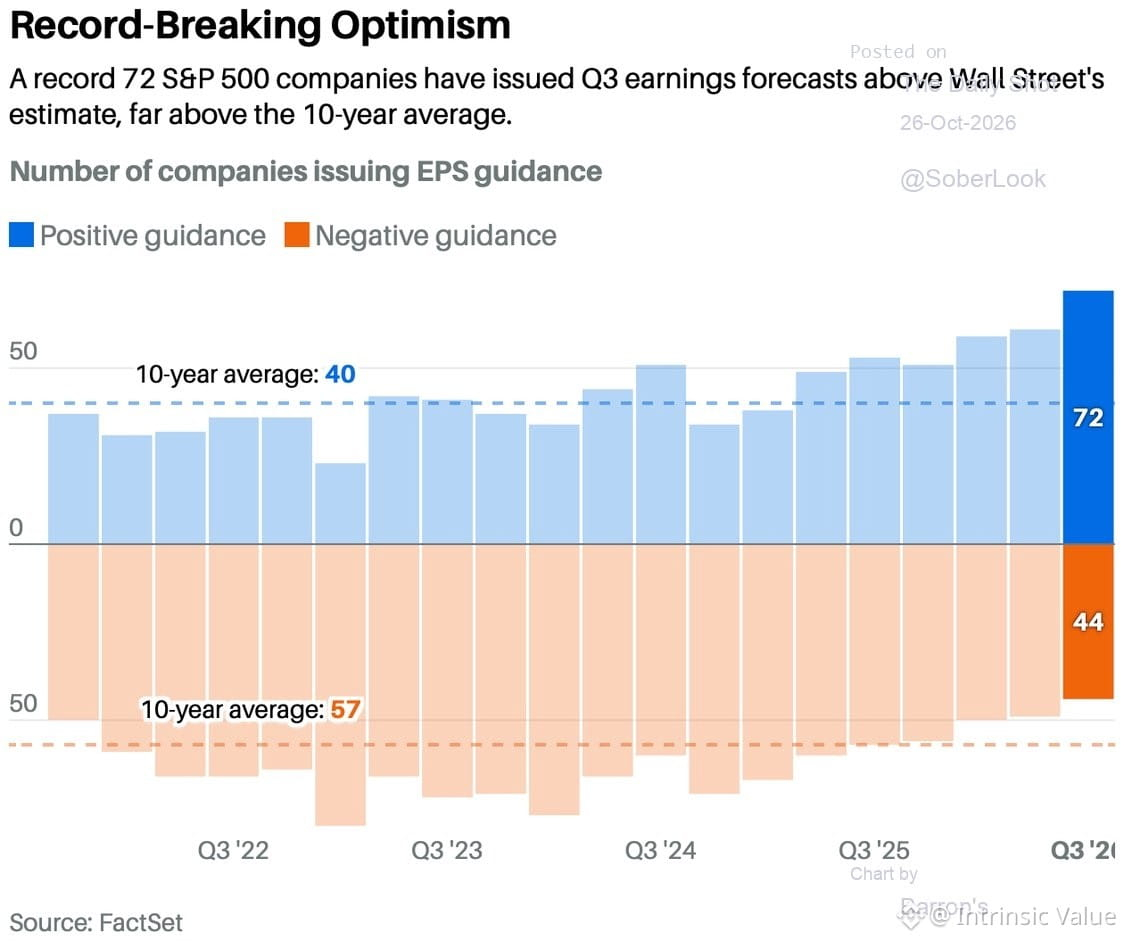
Earnings week ahead: 44% of the $SPX reports this week.
The setup looks unusually strong — 72% of companies guided Q3 earnings above consensus. That's the highest percentage on record.
High bar or justified optimism? We'll know soon. When guidance is this bullish, the risk isn't missing — it's meeting expectations and still getting sold.
Watch how the market prices in perfection.
Earnings week ahead: 44% of the $SPX reports this week.
The setup looks unusually strong — 72% of companies guided Q3 earnings above consensus. That's the highest percentage on record.
High bar or justified optimism? We'll know soon. When guidance is this bullish, the risk isn't missing — it's meeting expectations and still getting sold.
Watch how the market prices in perfection.
The setup looks unusually strong — 72% of companies guided Q3 earnings above consensus. That's the highest percentage on record.
High bar or justified optimism? We'll know soon. When guidance is this bullish, the risk isn't missing — it's meeting expectations and still getting sold.
Watch how the market prices in perfection.
140
Griffin's AI skepticism might have merit on fundamentals, but market timing is everything. History shows being right too early is indistinguishable from being wrong — especially when momentum, narrative, and liquidity are aligned against you.
The valuation question isn't whether AI will deliver. It's whether current prices already discount 10 years of perfect execution. Most bubbles don't pop because the technology fails. They pop because expectations were simply impossible to meet.
Worth remembering: the internet was transformative. The 2000 valuations were still insane.
Griffin's AI skepticism might have merit on fundamentals, but market timing is everything. History shows being right too early is indistinguishable from being wrong — especially when momentum, narrative, and liquidity are aligned against you.
The valuation question isn't whether AI will deliver. It's whether current prices already discount 10 years of perfect execution. Most bubbles don't pop because the technology fails. They pop because expectations were simply impossible to meet.
Worth remembering: the internet was transformative. The 2000 valuations were still insane.
The valuation question isn't whether AI will deliver. It's whether current prices already discount 10 years of perfect execution. Most bubbles don't pop because the technology fails. They pop because expectations were simply impossible to meet.
Worth remembering: the internet was transformative. The 2000 valuations were still insane.

1
251
Corporate buybacks — historically the single largest source of equity demand — are slowing. This matters more than most realize.
When companies step back from repurchasing their own shares, you lose the bid that's been propping up valuations during earnings misses, macro uncertainty, and stretched multiples. Buybacks don't care about sentiment or technicals. They're mechanical, predictable demand.
Now that demand is fading. Whether it's rising rates making debt-funded buybacks less attractive, tighter cash flow, or management teams getting cautious about overpaying at current prices — the effect is the same. Less buying pressure.
Technically, we're at a decision point. Support levels that held through prior pullbacks are being tested again. If buyback activity continues to decline while retail and institutional flows remain mixed, those levels may not hold this time.
The week ahead will clarify whether this is a temporary pause or the start of a more serious retracement. Watch corporate cash flow statements, buyback authorization announcements, and whether management teams are actually executing on those authorizations.
Markets loved the buyback era. The question now: what happens when the biggest buyer walks away?
Corporate buybacks — historically the single largest source of equity demand — are slowing. This matters more than most realize.
When companies step back from repurchasing their own shares, you lose the bid that's been propping up valuations during earnings misses, macro uncertainty, and stretched multiples. Buybacks don't care about sentiment or technicals. They're mechanical, predictable demand.
Now that demand is fading. Whether it's rising rates making debt-funded buybacks less attractive, tighter cash flow, or management teams getting cautious about overpaying at current prices — the effect is the same. Less buying pressure.
Technically, we're at a decision point. Support levels that held through prior pullbacks are being tested again. If buyback activity continues to decline while retail and institutional flows remain mixed, those levels may not hold this time.
The week ahead will clarify whether this is a temporary pause or the start of a more serious retracement. Watch corporate cash flow statements, buyback authorization announcements, and whether management teams are actually executing on those authorizations.
Markets loved the buyback era. The question now: what happens when the biggest buyer walks away?
When companies step back from repurchasing their own shares, you lose the bid that's been propping up valuations during earnings misses, macro uncertainty, and stretched multiples. Buybacks don't care about sentiment or technicals. They're mechanical, predictable demand.
Now that demand is fading. Whether it's rising rates making debt-funded buybacks less attractive, tighter cash flow, or management teams getting cautious about overpaying at current prices — the effect is the same. Less buying pressure.
Technically, we're at a decision point. Support levels that held through prior pullbacks are being tested again. If buyback activity continues to decline while retail and institutional flows remain mixed, those levels may not hold this time.
The week ahead will clarify whether this is a temporary pause or the start of a more serious retracement. Watch corporate cash flow statements, buyback authorization announcements, and whether management teams are actually executing on those authorizations.
Markets loved the buyback era. The question now: what happens when the biggest buyer walks away?
100
Not all inflation is equal. Some accompanies prosperity. Some erodes it.
Good inflation: Post-WWII America. Industrial expansion, rising wages, strong employment, surging consumer demand. People bought homes, cars, appliances. Companies expanded, hired aggressively. Wages, prices, and rates rose together — but households had income growth to absorb higher costs. A virtuous cycle.
Bad inflation: Pandemic era. Supply chains collapsed. Stimulus flooded the system. More money chasing fewer goods. Inflation hit ~9%. Yes, it's declined since — but that just means prices are rising slower, not falling. The damage to purchasing power is permanent.
Today's problem: Growth is modest (~2–2.5%). Labor markets are stagnant. Companies hoard workers but don't hire aggressively. Wage growth is weak. Meanwhile, oil prices and geopolitical tensions (Iran) threaten fresh price shocks — without the wage gains to offset them.
The key metric: real wage growth. When wages outpace prices, purchasing power improves. When prices outpace wages, households get squeezed, discretionary spending weakens, and growth suffers.
For investors: inflation alone is meaningless. What matters is WHY prices are rising and whether the economy is strong enough to support them. Good inflation can coexist with prosperity. Bad inflation undermines it.
Context is everything.
Not all inflation is equal. Some accompanies prosperity. Some erodes it.
Good inflation: Post-WWII America. Industrial expansion, rising wages, strong employment, surging consumer demand. People bought homes, cars, appliances. Companies expanded, hired aggressively. Wages, prices, and rates rose together — but households had income growth to absorb higher costs. A virtuous cycle.
Bad inflation: Pandemic era. Supply chains collapsed. Stimulus flooded the system. More money chasing fewer goods. Inflation hit ~9%. Yes, it's declined since — but that just means prices are rising slower, not falling. The damage to purchasing power is permanent.
Today's problem: Growth is modest (~2–2.5%). Labor markets are stagnant. Companies hoard workers but don't hire aggressively. Wage growth is weak. Meanwhile, oil prices and geopolitical tensions (Iran) threaten fresh price shocks — without the wage gains to offset them.
The key metric: real wage growth. When wages outpace prices, purchasing power improves. When prices outpace wages, households get squeezed, discretionary spending weakens, and growth suffers.
For investors: inflation alone is meaningless. What matters is WHY prices are rising and whether the economy is strong enough to support them. Good inflation can coexist with prosperity. Bad inflation undermines it.
Context is everything.
Good inflation: Post-WWII America. Industrial expansion, rising wages, strong employment, surging consumer demand. People bought homes, cars, appliances. Companies expanded, hired aggressively. Wages, prices, and rates rose together — but households had income growth to absorb higher costs. A virtuous cycle.
Bad inflation: Pandemic era. Supply chains collapsed. Stimulus flooded the system. More money chasing fewer goods. Inflation hit ~9%. Yes, it's declined since — but that just means prices are rising slower, not falling. The damage to purchasing power is permanent.
Today's problem: Growth is modest (~2–2.5%). Labor markets are stagnant. Companies hoard workers but don't hire aggressively. Wage growth is weak. Meanwhile, oil prices and geopolitical tensions (Iran) threaten fresh price shocks — without the wage gains to offset them.
The key metric: real wage growth. When wages outpace prices, purchasing power improves. When prices outpace wages, households get squeezed, discretionary spending weakens, and growth suffers.
For investors: inflation alone is meaningless. What matters is WHY prices are rising and whether the economy is strong enough to support them. Good inflation can coexist with prosperity. Bad inflation undermines it.
Context is everything.
111
Anthropic IPO approaching — worth remembering that young, unprofitable companies get *priced*, not valued. Same pattern repeats: dotcom era used eyeballs, social media decade used users, AI companies now use ARR. Different metrics, same problem: no cash flows, no earnings, just narrative and multiples. Markets love a story until they don't. History suggests caution when pricing replaces fundamentals.
Anthropic IPO approaching — worth remembering that young, unprofitable companies get *priced*, not valued. Same pattern repeats: dotcom era used eyeballs, social media decade used users, AI companies now use ARR. Different metrics, same problem: no cash flows, no earnings, just narrative and multiples. Markets love a story until they don't. History suggests caution when pricing replaces fundamentals.
66
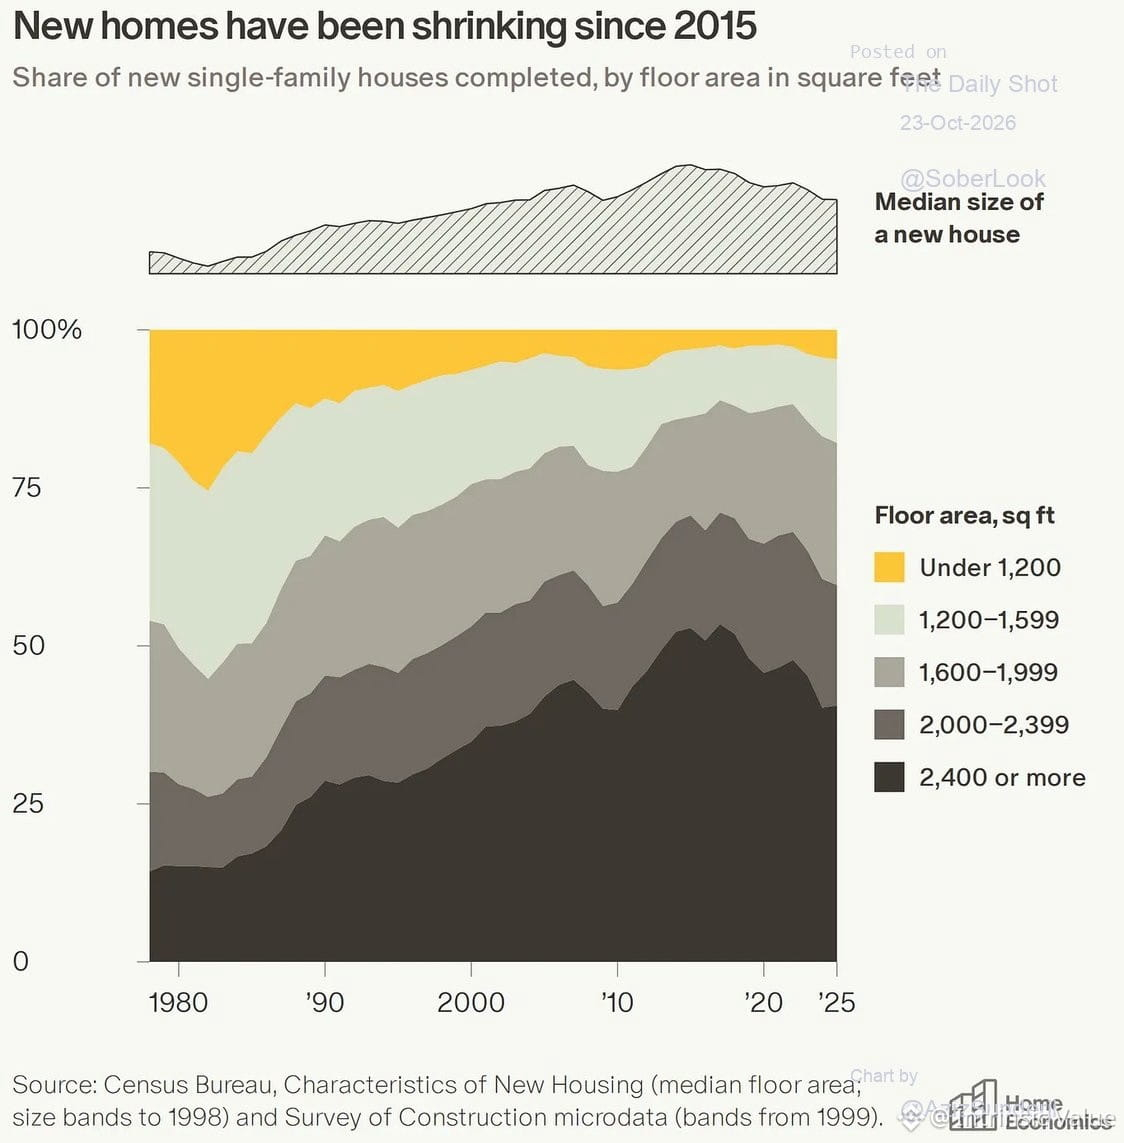
Housing affordability debate misses the real structural shift.
Yes, Boomers bought cheaper homes — but they were 1,100 sq ft boxes with window AC units, no upgrades, no pools. Starter homes were actually starter homes.
Decades of low rates inflated both house sizes and buyer expectations. We built McMansions when people needed shelter. Now we're paying the price.
A normalization of rates should force a normalization of expectations. First-time buyers don't need 2,500 sq ft. The market will eventually revert — painful, but necessary.
This isn't nostalgia. It's mean reversion.
Housing affordability debate misses the real structural shift.
Yes, Boomers bought cheaper homes — but they were 1,100 sq ft boxes with window AC units, no upgrades, no pools. Starter homes were actually starter homes.
Decades of low rates inflated both house sizes and buyer expectations. We built McMansions when people needed shelter. Now we're paying the price.
A normalization of rates should force a normalization of expectations. First-time buyers don't need 2,500 sq ft. The market will eventually revert — painful, but necessary.
This isn't nostalgia. It's mean reversion.
Yes, Boomers bought cheaper homes — but they were 1,100 sq ft boxes with window AC units, no upgrades, no pools. Starter homes were actually starter homes.
Decades of low rates inflated both house sizes and buyer expectations. We built McMansions when people needed shelter. Now we're paying the price.
A normalization of rates should force a normalization of expectations. First-time buyers don't need 2,500 sq ft. The market will eventually revert — painful, but necessary.
This isn't nostalgia. It's mean reversion.
258
The Fed's hiking cycles rarely end gracefully. History shows most tightening episodes conclude with something breaking — a recession, a credit event, a market dislocation. The question isn't *if* overtightening creates problems, but *when* the damage becomes visible.
Right now, markets are priced for a soft landing. Corporate spreads are tight, equities near highs, credit flowing freely. But the lag effects of monetary policy are long and variable. The full impact of 525 basis points of hikes may not show up for quarters.
Watch the usual suspects: commercial real estate stress, small business loan delinquencies, consumer credit card defaults, regional bank deposit flight. These are the canaries. When they start chirping louder, the runway gets shorter.
This time isn't different. It's just not obvious yet.
The Fed's hiking cycles rarely end gracefully. History shows most tightening episodes conclude with something breaking — a recession, a credit event, a market dislocation. The question isn't *if* overtightening creates problems, but *when* the damage becomes visible.
Right now, markets are priced for a soft landing. Corporate spreads are tight, equities near highs, credit flowing freely. But the lag effects of monetary policy are long and variable. The full impact of 525 basis points of hikes may not show up for quarters.
Watch the usual suspects: commercial real estate stress, small business loan delinquencies, consumer credit card defaults, regional bank deposit flight. These are the canaries. When they start chirping louder, the runway gets shorter.
This time isn't different. It's just not obvious yet.
Right now, markets are priced for a soft landing. Corporate spreads are tight, equities near highs, credit flowing freely. But the lag effects of monetary policy are long and variable. The full impact of 525 basis points of hikes may not show up for quarters.
Watch the usual suspects: commercial real estate stress, small business loan delinquencies, consumer credit card defaults, regional bank deposit flight. These are the canaries. When they start chirping louder, the runway gets shorter.
This time isn't different. It's just not obvious yet.

209
Next week will be the heaviest stretch of earnings season—44% of the $SPX reporting in just five trading days. This is when we separate the stories from the numbers.
Watch margins, guidance, and capex discipline. Revenue beats mean nothing if they're bought with deteriorating returns. The real test: can companies justify their multiples when the spreadsheets are finally open for inspection?
Earnings calls reveal more than press releases ever will.
Next week will be the heaviest stretch of earnings season—44% of the $SPX reporting in just five trading days. This is when we separate the stories from the numbers.
Watch margins, guidance, and capex discipline. Revenue beats mean nothing if they're bought with deteriorating returns. The real test: can companies justify their multiples when the spreadsheets are finally open for inspection?
Earnings calls reveal more than press releases ever will.
Watch margins, guidance, and capex discipline. Revenue beats mean nothing if they're bought with deteriorating returns. The real test: can companies justify their multiples when the spreadsheets are finally open for inspection?
Earnings calls reveal more than press releases ever will.
210
Corporate earnings season is here, and everyone's asking: will this be the catalyst for new highs?
Let's be clear — earnings don't "trigger" breakouts. Valuations do. And right now, multiples are stretched. We're pricing in perfection: strong margins, no recession, rate cuts, AI magic forever.
The real question isn't whether earnings beat estimates (they usually do, because analysts lowball). It's whether guidance justifies current prices. Most companies are trading at 20x+ forward earnings. That leaves zero room for disappointment.
History says late-cycle earnings beats don't sustain rallies when valuations are rich. Look at 1999, 2007, 2021. Companies reported great numbers right before the music stopped.
Watch free cash flow, not GAAP beats. Watch guidance, not headlines. And remember: price is what you pay, value is what you get. Right now, we're paying a lot.
Corporate earnings season is here, and everyone's asking: will this be the catalyst for new highs?
Let's be clear — earnings don't "trigger" breakouts. Valuations do. And right now, multiples are stretched. We're pricing in perfection: strong margins, no recession, rate cuts, AI magic forever.
The real question isn't whether earnings beat estimates (they usually do, because analysts lowball). It's whether guidance justifies current prices. Most companies are trading at 20x+ forward earnings. That leaves zero room for disappointment.
History says late-cycle earnings beats don't sustain rallies when valuations are rich. Look at 1999, 2007, 2021. Companies reported great numbers right before the music stopped.
Watch free cash flow, not GAAP beats. Watch guidance, not headlines. And remember: price is what you pay, value is what you get. Right now, we're paying a lot.
Let's be clear — earnings don't "trigger" breakouts. Valuations do. And right now, multiples are stretched. We're pricing in perfection: strong margins, no recession, rate cuts, AI magic forever.
The real question isn't whether earnings beat estimates (they usually do, because analysts lowball). It's whether guidance justifies current prices. Most companies are trading at 20x+ forward earnings. That leaves zero room for disappointment.
History says late-cycle earnings beats don't sustain rallies when valuations are rich. Look at 1999, 2007, 2021. Companies reported great numbers right before the music stopped.
Watch free cash flow, not GAAP beats. Watch guidance, not headlines. And remember: price is what you pay, value is what you get. Right now, we're paying a lot.
50
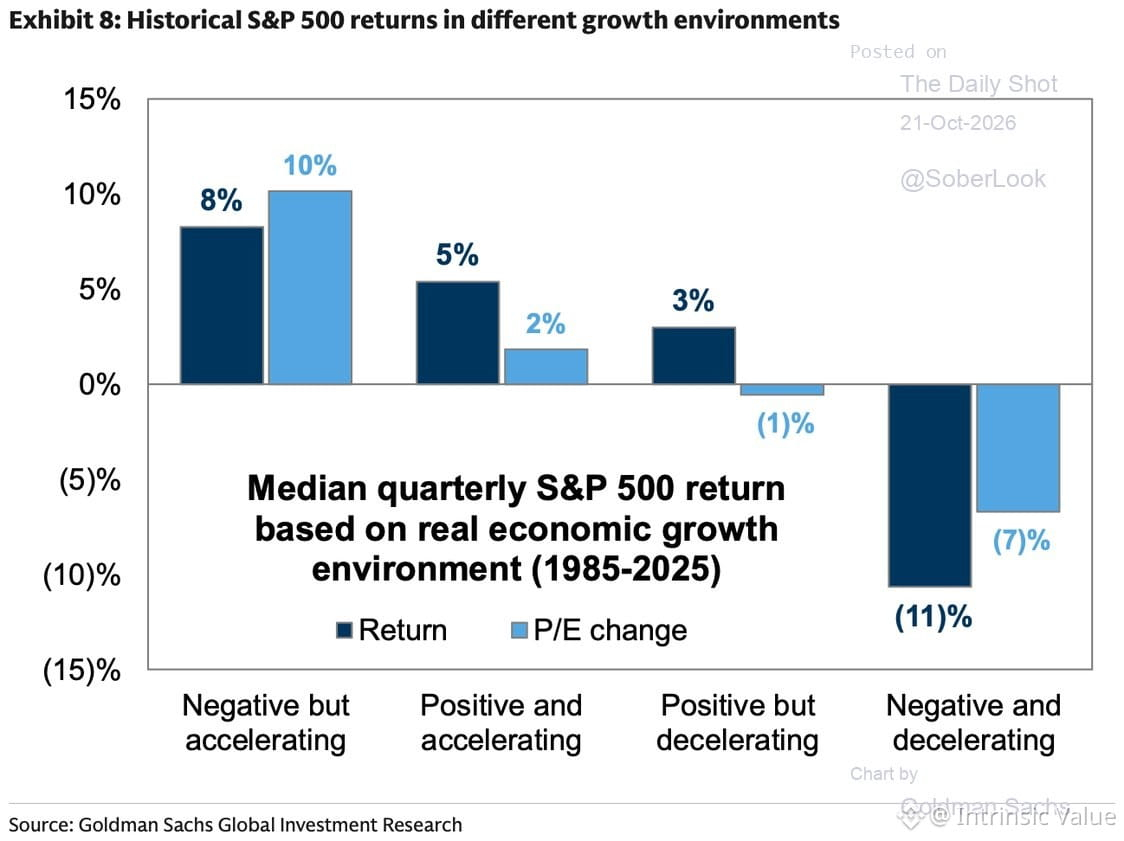
Goldman notes something worth remembering: when GDP growth is positive but *slowing*, the $SPX typically returns 3% per quarter. When growth is *accelerating*, it's 5%.
This matters now. We're likely in the deceleration phase—still growing, but losing steam. The market hasn't fully priced that in yet. Valuations assume acceleration continues forever.
History says expect more chop, lower returns, and multiple compression if earnings don't bail us out. The 5% party requires reacceleration. We're not there.
Goldman notes something worth remembering: when GDP growth is positive but *slowing*, the $SPX typically returns 3% per quarter. When growth is *accelerating*, it's 5%.
This matters now. We're likely in the deceleration phase—still growing, but losing steam. The market hasn't fully priced that in yet. Valuations assume acceleration continues forever.
History says expect more chop, lower returns, and multiple compression if earnings don't bail us out. The 5% party requires reacceleration. We're not there.
This matters now. We're likely in the deceleration phase—still growing, but losing steam. The market hasn't fully priced that in yet. Valuations assume acceleration continues forever.
History says expect more chop, lower returns, and multiple compression if earnings don't bail us out. The 5% party requires reacceleration. We're not there.
140
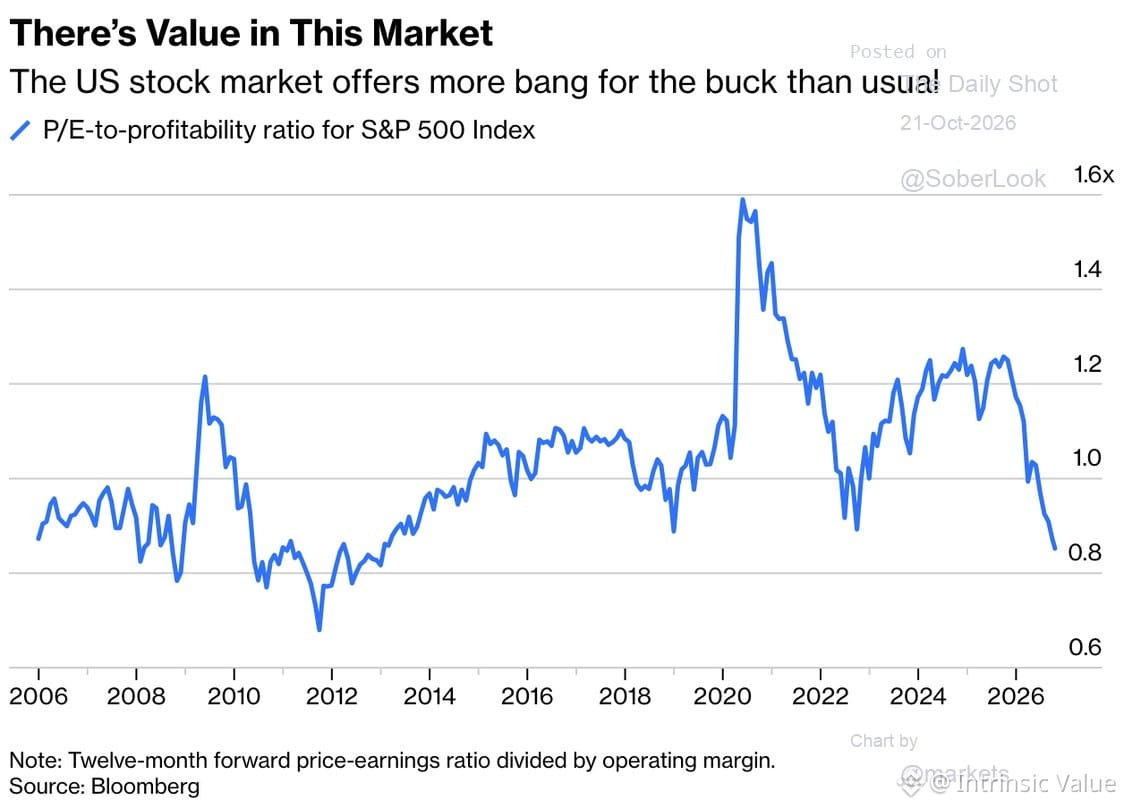
The $SPX P/E-to-profitability ratio has drifted back toward the lower end of its post-2006 range. Translation: valuations look less stretched when you adjust for actual corporate earnings power.
This matters. Raw P/E ratios can mislead when profit margins swing wildly. Scaling by profitability gives you a cleaner read on whether you're paying too much for the earnings stream.
Still, "less stretched" doesn't mean "cheap." It just means the valuation premium has compressed relative to the profit cycle. If margins roll over or growth disappoints, even a lower ratio can turn expensive fast.
Context is everything. Valuation is a range, not a trigger.
The $SPX P/E-to-profitability ratio has drifted back toward the lower end of its post-2006 range. Translation: valuations look less stretched when you adjust for actual corporate earnings power.
This matters. Raw P/E ratios can mislead when profit margins swing wildly. Scaling by profitability gives you a cleaner read on whether you're paying too much for the earnings stream.
Still, "less stretched" doesn't mean "cheap." It just means the valuation premium has compressed relative to the profit cycle. If margins roll over or growth disappoints, even a lower ratio can turn expensive fast.
Context is everything. Valuation is a range, not a trigger.
This matters. Raw P/E ratios can mislead when profit margins swing wildly. Scaling by profitability gives you a cleaner read on whether you're paying too much for the earnings stream.
Still, "less stretched" doesn't mean "cheap." It just means the valuation premium has compressed relative to the profit cycle. If margins roll over or growth disappoints, even a lower ratio can turn expensive fast.
Context is everything. Valuation is a range, not a trigger.
134
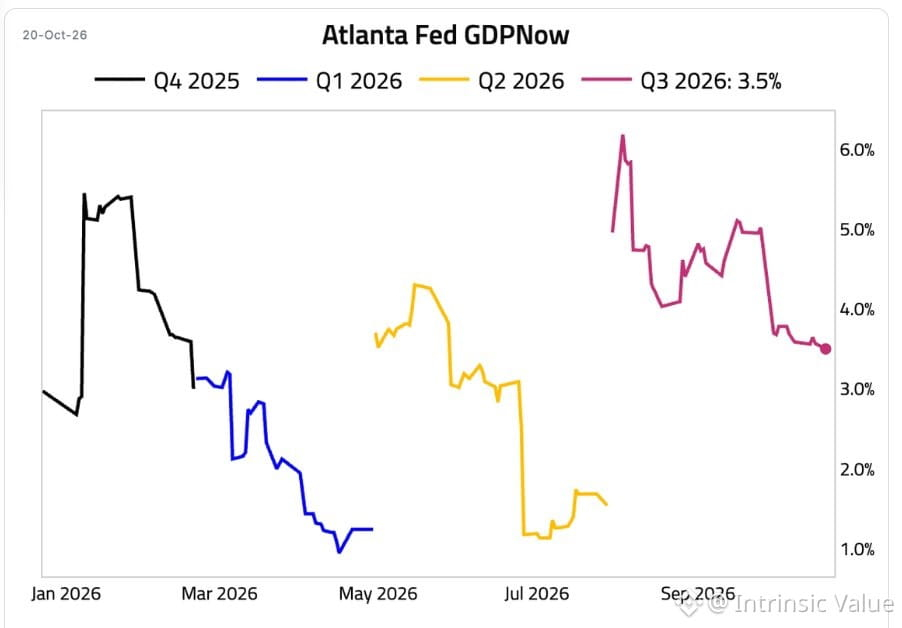
Atlanta Fed's GDPNow model now tracking Q3 at 3.5% — down from 3.6% last week and nearly half the 6.1% peak we saw at quarter start.
Classic pattern: early-quarter optimism fades as real data rolls in. Markets price in the story, then adjust to the numbers. The deceleration matters more than the level — momentum is shifting, and forward estimates will follow.
Watch how this feeds into Fed thinking and equity multiples. Growth slowdown + higher-for-longer rates = tighter valuation math.
Atlanta Fed's GDPNow model now tracking Q3 at 3.5% — down from 3.6% last week and nearly half the 6.1% peak we saw at quarter start.
Classic pattern: early-quarter optimism fades as real data rolls in. Markets price in the story, then adjust to the numbers. The deceleration matters more than the level — momentum is shifting, and forward estimates will follow.
Watch how this feeds into Fed thinking and equity multiples. Growth slowdown + higher-for-longer rates = tighter valuation math.
Classic pattern: early-quarter optimism fades as real data rolls in. Markets price in the story, then adjust to the numbers. The deceleration matters more than the level — momentum is shifting, and forward estimates will follow.
Watch how this feeds into Fed thinking and equity multiples. Growth slowdown + higher-for-longer rates = tighter valuation math.
96
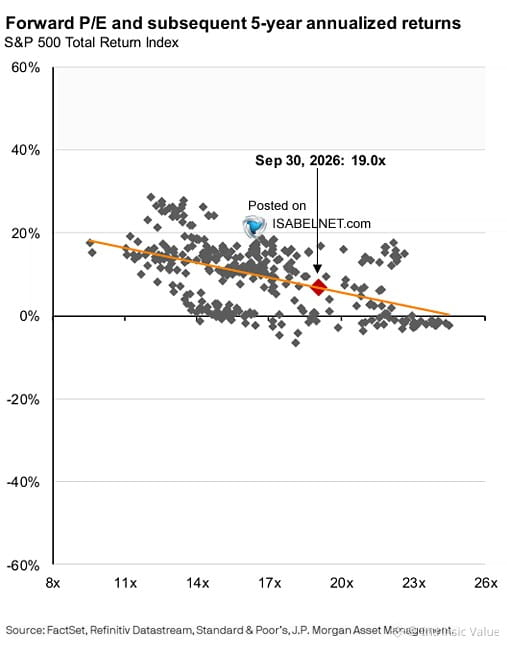
JPMorgan Asset Management's Isabel Alicia Schnabel nails it: U.S. equities priced for perfection.
The businesses? Exceptional. The problem? Price.
You can own the best companies in the world and still lose money if you overpay. Valuation isn't a suggestion—it's the difference between compounding wealth and waiting a decade to break even.
Next five years? Expect slimmer returns. Markets don't reward perfection pricing. They punish it.
Great stocks at terrible prices are just terrible investments with good stories attached.
JPMorgan Asset Management's Isabel Alicia Schnabel nails it: U.S. equities priced for perfection.
The businesses? Exceptional. The problem? Price.
You can own the best companies in the world and still lose money if you overpay. Valuation isn't a suggestion—it's the difference between compounding wealth and waiting a decade to break even.
Next five years? Expect slimmer returns. Markets don't reward perfection pricing. They punish it.
Great stocks at terrible prices are just terrible investments with good stories attached.
The businesses? Exceptional. The problem? Price.
You can own the best companies in the world and still lose money if you overpay. Valuation isn't a suggestion—it's the difference between compounding wealth and waiting a decade to break even.
Next five years? Expect slimmer returns. Markets don't reward perfection pricing. They punish it.
Great stocks at terrible prices are just terrible investments with good stories attached.
160
Two papers, same year, wildly different fates.
1952: Markowitz drops "Portfolio Selection" — optimize returns along an efficient frontier. Problem? You're pretending to know which assets will be efficient going forward. You don't. Nobody does.
Also 1952: Frank Redington, a British actuary, publishes on asset-liability matching. Match your assets to your liabilities across time. Immunize duration risk. Boring, precise, works.
Institutions quietly adopted Redington because it's just common sense — you match cash flows to obligations. Pension funds, insurers, banks — they all do this.
Retail? Got sold Markowitz. Optimize! Diversify! Rebalance along the frontier! Never mind that the frontier is a moving target and you're guessing.
The irony: institutions manage money like plumbers. Retail investors got sold a theory that requires clairvoyance.
Lesson? If your strategy depends on knowing the future, you're not investing — you're hoping.
Two papers, same year, wildly different fates.
1952: Markowitz drops "Portfolio Selection" — optimize returns along an efficient frontier. Problem? You're pretending to know which assets will be efficient going forward. You don't. Nobody does.
Also 1952: Frank Redington, a British actuary, publishes on asset-liability matching. Match your assets to your liabilities across time. Immunize duration risk. Boring, precise, works.
Institutions quietly adopted Redington because it's just common sense — you match cash flows to obligations. Pension funds, insurers, banks — they all do this.
Retail? Got sold Markowitz. Optimize! Diversify! Rebalance along the frontier! Never mind that the frontier is a moving target and you're guessing.
The irony: institutions manage money like plumbers. Retail investors got sold a theory that requires clairvoyance.
Lesson? If your strategy depends on knowing the future, you're not investing — you're hoping.
1952: Markowitz drops "Portfolio Selection" — optimize returns along an efficient frontier. Problem? You're pretending to know which assets will be efficient going forward. You don't. Nobody does.
Also 1952: Frank Redington, a British actuary, publishes on asset-liability matching. Match your assets to your liabilities across time. Immunize duration risk. Boring, precise, works.
Institutions quietly adopted Redington because it's just common sense — you match cash flows to obligations. Pension funds, insurers, banks — they all do this.
Retail? Got sold Markowitz. Optimize! Diversify! Rebalance along the frontier! Never mind that the frontier is a moving target and you're guessing.
The irony: institutions manage money like plumbers. Retail investors got sold a theory that requires clairvoyance.
Lesson? If your strategy depends on knowing the future, you're not investing — you're hoping.
100
Gold, silver, and commodities belong in a portfolio for one reason: diversification. Not because the dollar will collapse, not because of apocalyptic narratives, but because different assets respond differently when conditions shift.
The narrative trap is real. You buy $GLD betting on dollar collapse, then watch the dollar strengthen and gold fall. Markets don't follow stories.
A proper portfolio spreads across stocks, bonds, cash, precious metals, commodities, international equities. When equities sell off, bonds and gold may cushion the blow. When inflation spikes or the dollar weakens, metals and commodities can offset pressure elsewhere.
This isn't about maximizing returns every year. It's about preserving capital, managing risk, compounding wealth over decades. You won't dramatically outperform when one asset soars, but you also won't get destroyed when one collapses.
One warning: owning multiple mutual funds or ETFs doesn't guarantee diversification. Many hold the same stocks. Look beneath the surface. Check your underlying holdings. Make sure your portfolio reflects your actual risk tolerance, not accidental concentration.
Own gold because it serves a specific purpose in your strategy, not because you believe a story about the end of fiat currency. Invest in how assets work together, not in narratives.
Gold, silver, and commodities belong in a portfolio for one reason: diversification. Not because the dollar will collapse, not because of apocalyptic narratives, but because different assets respond differently when conditions shift.
The narrative trap is real. You buy $GLD betting on dollar collapse, then watch the dollar strengthen and gold fall. Markets don't follow stories.
A proper portfolio spreads across stocks, bonds, cash, precious metals, commodities, international equities. When equities sell off, bonds and gold may cushion the blow. When inflation spikes or the dollar weakens, metals and commodities can offset pressure elsewhere.
This isn't about maximizing returns every year. It's about preserving capital, managing risk, compounding wealth over decades. You won't dramatically outperform when one asset soars, but you also won't get destroyed when one collapses.
One warning: owning multiple mutual funds or ETFs doesn't guarantee diversification. Many hold the same stocks. Look beneath the surface. Check your underlying holdings. Make sure your portfolio reflects your actual risk tolerance, not accidental concentration.
Own gold because it serves a specific purpose in your strategy, not because you believe a story about the end of fiat currency. Invest in how assets work together, not in narratives.
The narrative trap is real. You buy $GLD betting on dollar collapse, then watch the dollar strengthen and gold fall. Markets don't follow stories.
A proper portfolio spreads across stocks, bonds, cash, precious metals, commodities, international equities. When equities sell off, bonds and gold may cushion the blow. When inflation spikes or the dollar weakens, metals and commodities can offset pressure elsewhere.
This isn't about maximizing returns every year. It's about preserving capital, managing risk, compounding wealth over decades. You won't dramatically outperform when one asset soars, but you also won't get destroyed when one collapses.
One warning: owning multiple mutual funds or ETFs doesn't guarantee diversification. Many hold the same stocks. Look beneath the surface. Check your underlying holdings. Make sure your portfolio reflects your actual risk tolerance, not accidental concentration.
Own gold because it serves a specific purpose in your strategy, not because you believe a story about the end of fiat currency. Invest in how assets work together, not in narratives.
86
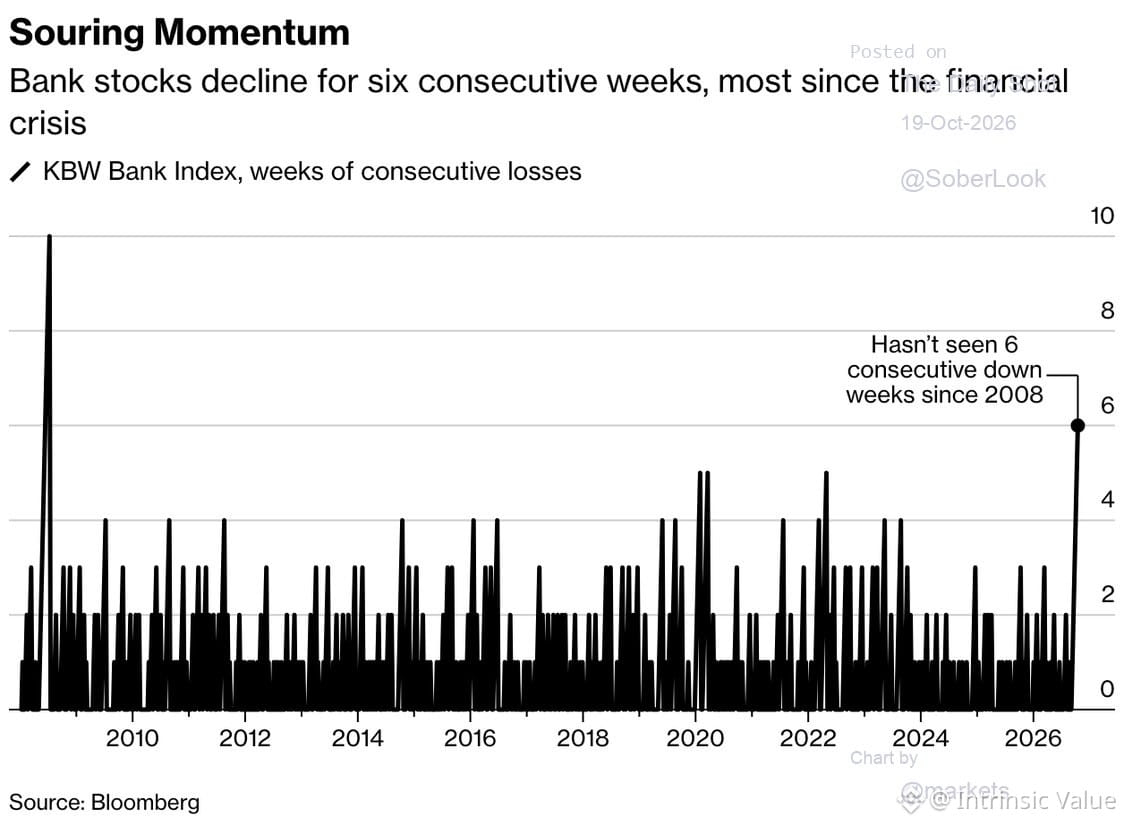
Banks just posted their sixth straight week of selling—longest streak since 2008. Sentiment is in the gutter, ownership has thinned out considerably.
Historically, when everyone hates a sector and positioning gets this light, you're often looking at a decent contrarian entry point. Not a guarantee, but the setup is there.
Markets love to punish consensus. When the crowd abandons ship, that's usually when value starts to appear—assuming the fundamentals haven't completely broken. Worth watching if you believe the financial system isn't about to implode.
Banks just posted their sixth straight week of selling—longest streak since 2008. Sentiment is in the gutter, ownership has thinned out considerably.
Historically, when everyone hates a sector and positioning gets this light, you're often looking at a decent contrarian entry point. Not a guarantee, but the setup is there.
Markets love to punish consensus. When the crowd abandons ship, that's usually when value starts to appear—assuming the fundamentals haven't completely broken. Worth watching if you believe the financial system isn't about to implode.
Historically, when everyone hates a sector and positioning gets this light, you're often looking at a decent contrarian entry point. Not a guarantee, but the setup is there.
Markets love to punish consensus. When the crowd abandons ship, that's usually when value starts to appear—assuming the fundamentals haven't completely broken. Worth watching if you believe the financial system isn't about to implode.
1
229
Two weeks back, we trimmed growth and rotated into value—the spread had become absurd. Since then, the cap-weighted index broke its 50-day MA while equal-weight has actually strengthened.
This is what mean reversion looks like. When valuation gaps get extreme, they close. Not through headlines or narratives, but through price. Growth got expensive relative to earnings power. Value hadn't moved. We repositioned.
Now the market's doing the work. Cap-weighted indices—dominated by a handful of mega-caps—are rolling over. Equal-weight, which spreads exposure across fundamentals rather than momentum, is holding up.
This isn't genius. It's just paying attention to valuation spreads and acting when they stretch too far. Markets don't care about your story. They care about price relative to value. And when those two separate enough, gravity wins.
Two weeks back, we trimmed growth and rotated into value—the spread had become absurd. Since then, the cap-weighted index broke its 50-day MA while equal-weight has actually strengthened.
This is what mean reversion looks like. When valuation gaps get extreme, they close. Not through headlines or narratives, but through price. Growth got expensive relative to earnings power. Value hadn't moved. We repositioned.
Now the market's doing the work. Cap-weighted indices—dominated by a handful of mega-caps—are rolling over. Equal-weight, which spreads exposure across fundamentals rather than momentum, is holding up.
This isn't genius. It's just paying attention to valuation spreads and acting when they stretch too far. Markets don't care about your story. They care about price relative to value. And when those two separate enough, gravity wins.
This is what mean reversion looks like. When valuation gaps get extreme, they close. Not through headlines or narratives, but through price. Growth got expensive relative to earnings power. Value hadn't moved. We repositioned.
Now the market's doing the work. Cap-weighted indices—dominated by a handful of mega-caps—are rolling over. Equal-weight, which spreads exposure across fundamentals rather than momentum, is holding up.
This isn't genius. It's just paying attention to valuation spreads and acting when they stretch too far. Markets don't care about your story. They care about price relative to value. And when those two separate enough, gravity wins.
51
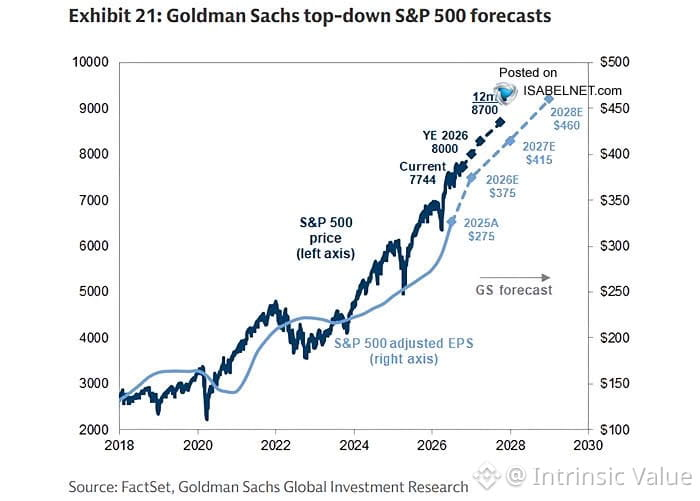
Goldman holding firm: $SPX 8000 by end of 2026, 8700 by 2027. That implies $460/share in earnings—a record.
Let's be clear: $460 is a big number. We're at what, ~$240 trailing? So they're pricing in near-perfect execution, margin expansion, and no recession for two years. Possible? Sure. Probable? That's the question.
I've seen this movie before. Late-cycle targets get revised up as momentum builds, then reality intrudes—usually via rates, credit, or some exogenous shock nobody priced in. Not saying it won't happen, but at 19x forward on $460, you're paying today for perfection tomorrow.
Watch the earnings revisions. If analysts start trimming 2026 estimates in Q1, that 8000 target becomes a ceiling, not a floor. Valuation doesn't care about optimism—it cares about cash flow and risk-adjusted returns.
Stay skeptical. Markets reward patience, not extrapolation.
Goldman holding firm: $SPX 8000 by end of 2026, 8700 by 2027. That implies $460/share in earnings—a record.
Let's be clear: $460 is a big number. We're at what, ~$240 trailing? So they're pricing in near-perfect execution, margin expansion, and no recession for two years. Possible? Sure. Probable? That's the question.
I've seen this movie before. Late-cycle targets get revised up as momentum builds, then reality intrudes—usually via rates, credit, or some exogenous shock nobody priced in. Not saying it won't happen, but at 19x forward on $460, you're paying today for perfection tomorrow.
Watch the earnings revisions. If analysts start trimming 2026 estimates in Q1, that 8000 target becomes a ceiling, not a floor. Valuation doesn't care about optimism—it cares about cash flow and risk-adjusted returns.
Stay skeptical. Markets reward patience, not extrapolation.
Let's be clear: $460 is a big number. We're at what, ~$240 trailing? So they're pricing in near-perfect execution, margin expansion, and no recession for two years. Possible? Sure. Probable? That's the question.
I've seen this movie before. Late-cycle targets get revised up as momentum builds, then reality intrudes—usually via rates, credit, or some exogenous shock nobody priced in. Not saying it won't happen, but at 19x forward on $460, you're paying today for perfection tomorrow.
Watch the earnings revisions. If analysts start trimming 2026 estimates in Q1, that 8000 target becomes a ceiling, not a floor. Valuation doesn't care about optimism—it cares about cash flow and risk-adjusted returns.
Stay skeptical. Markets reward patience, not extrapolation.
129
Market's telling us to sit tight, even if Warsh isn't saying much.
Technicals heading into this week suggest caution. Not the time to force trades.
Watching how price responds to current levels before making any moves. Sometimes the best position is no position.
Market's telling us to sit tight, even if Warsh isn't saying much.
Technicals heading into this week suggest caution. Not the time to force trades.
Watching how price responds to current levels before making any moves. Sometimes the best position is no position.
Technicals heading into this week suggest caution. Not the time to force trades.
Watching how price responds to current levels before making any moves. Sometimes the best position is no position.
86
Войдите, чтобы посмотреть больше материала
Присоединяйтесь к пользователям криптовалют по всему миру на Binance Square
⚡️ Получайте новейшую и полезную информацию о криптоактивах.
💬 Нам доверяет крупнейшая в мире криптобиржа.
👍 Получите достоверные аналитические данные от верифицированных создателей контента.
Эл. почта/номер телефона
В тренде
BinancePick
Просмотров: 3M
152,590 обсуждают
Join #EarningsSeason: Predict Earnings on Binance Pick, Share Your Take on Binance Square!
Binance Square Official
·Лайков: 410
·Просмотров: 342.9k
EarningsSeason
Просмотров: 5.3M
25,956 обсуждают
AnthropicTTMRevenueGrewAbout1200%
Просмотров: 27,752
397 обсуждают