
Ibrina_ETH
8.8k Публикации

Ibrina_ETH
 Square Verified
Отправить жалобу
Заблокировать пользователя
Binance Square Creator | Crypto Researcher | Market Analyst | 24/7 Crypto Trader | Web3 & DeFi Insights
Открытая сделка
Трейдер с регулярными сделками
2.2 г
31 подписок(и/а)
37.5K+ подписчиков(а)
49.7K+ понравилось
Посты
Портфель
Все
Цитирования
Видео
Активно
PINNED
·
--
Рост
🚨 BREAKING
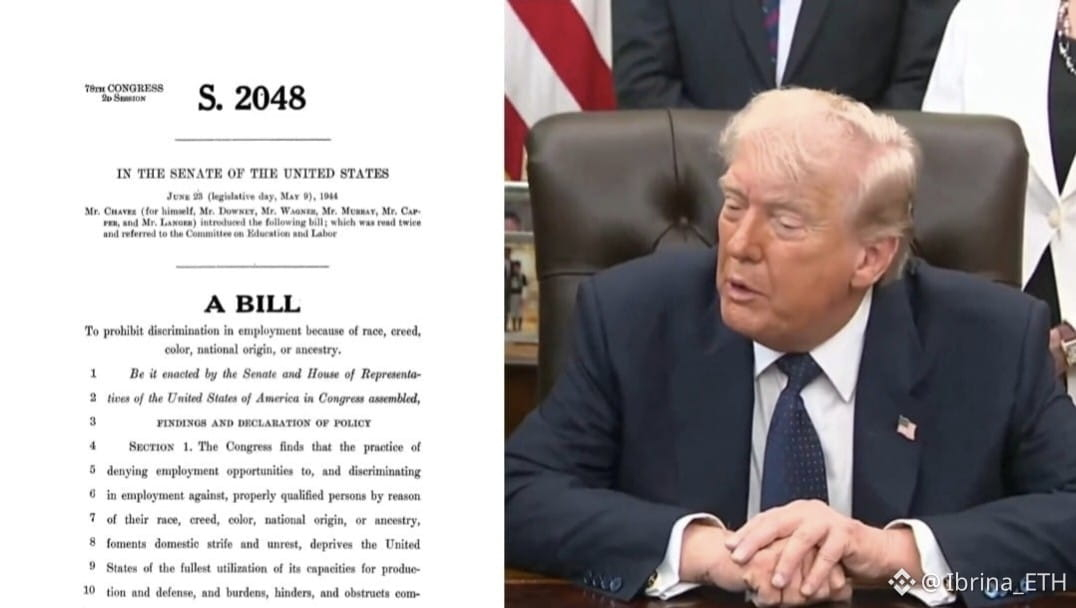
🇺🇸 The U.S. Senate's schedule currently doesn't include a vote on the Crypto CLARITY Act.
Here's why the market is watching:
📈 If it passes, many expect it could be a major bullish catalyst for Bitcoin.
📉 If it fails or gets pushed back, sentiment could turn negative across the crypto market.
Right now, Kalshi is pricing just a 33% chance that the bill gets approved this year.
Remember: 60 Senate votes are needed for it to pass.
For now, this isn't looking like good news for crypto.
$BICO $VIC
#BREAKING #news #TRUMP
🚨 BREAKING
🇺🇸 The U.S. Senate's schedule currently doesn't include a vote on the Crypto CLARITY Act.
Here's why the market is watching:
📈 If it passes, many expect it could be a major bullish catalyst for Bitcoin.
📉 If it fails or gets pushed back, sentiment could turn negative across the crypto market.
Right now, Kalshi is pricing just a 33% chance that the bill gets approved this year.
Remember: 60 Senate votes are needed for it to pass.
For now, this isn't looking like good news for crypto.
$BICO $VIC
#BREAKING #news #TRUMP
🇺🇸 The U.S. Senate's schedule currently doesn't include a vote on the Crypto CLARITY Act.
Here's why the market is watching:
📈 If it passes, many expect it could be a major bullish catalyst for Bitcoin.
📉 If it fails or gets pushed back, sentiment could turn negative across the crypto market.
Right now, Kalshi is pricing just a 33% chance that the bill gets approved this year.
Remember: 60 Senate votes are needed for it to pass.
For now, this isn't looking like good news for crypto.
$BICO $VIC
#BREAKING #news #TRUMP
21
1
91
133.1k
·
--
Статья
BNB (BNB) Buyers Are Attempting a Bounce, But the Bigger Trend Remains WeakBNB is showing some buying interest after dropping sharply toward $503.75, but I don't think the latest bounce is enough to change the overall direction yet. Price has climbed back to $539.30, and buyers are trying to stabilise the market after heavy selling. What interests me is that the bounce is happening while price remains below several important moving averages. This creates an interesting situation: short-term momentum is improving, but the broader structure is still bearish.
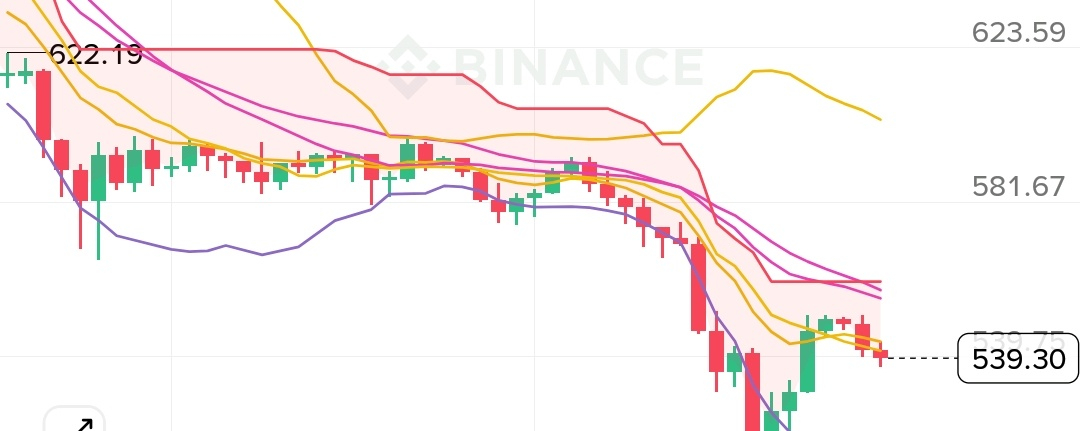
On my 4-hour $BNB chart, price is $539.30, up 2.22%, with a visible 24-hour high of $551.13 and low of $519.11. EMA9 is $543.82, EMA21 is $555.56 and EMA200 is $656.91. Supertrend is also above price at $560.11. The Bollinger middle line is $557.78, while the lower band is $511.51. Price is trading below these major resistance levels and slightly below VWAP at $541.32. RSI is 36.94, showing relatively weak momentum. MACD histogram has turned slightly positive at 0.64, but both MACD lines remain negative. Volume is 12.3K, below MA5 and MA10. So, I see some improvement, but not strong buying confirmation.
The latest November 22 market data puts BNB around $540.49, with a market capitalisation near $70.96 billion, circulating supply of approximately 131.51 million and a maximum supply target of 100 million under the burn mechanism. The live quote is slightly different from my screenshot.
BNB is the native asset of BNB Chain, supporting transaction fees, staking, governance and applications across BNB Smart Chain, opBNB and Greenfield. Its importance comes from actual ecosystem usage, including DeFi, payments and decentralised applications. BNB also has a supply-reduction mechanism through quarterly Auto-Burns and real-time fee burns. The latest 37th quarterly burn removed approximately 1.646 million BNB in October 2026. However, reduced supply alone cannot guarantee price growth; demand and network activity still matter.
The wider market is also important. Bitcoin recently rebounded above $60,000 after falling toward $55,251, but broader risk sentiment remains fragile. A stronger dollar and higher real yields have been putting pressure on crypto assets. If BTC struggles again, BNB could also find it difficult to sustain its bounce. Reuters +1
For the bullish scenario, a strong 4-hour close above $555.56, followed by a successful retest, would be my confirmation. Entry: $554–$558 after confirmation. SL: around $541. TP1: $560.11; TP2: $581.67. These levels align with Supertrend and visible chart resistance. A failed reclaim and return below $541 would weaken this setup.
For the bearish scenario, if BNB rejects $551–$555 and loses $519.11 on a 4-hour close, I would wait for a failed retest before considering a short. Entry: $518–$521. SL: around $542. TP1: $511.51; TP2: $503.75. These levels mark the lower Bollinger Band and recent swing low. A sustained reclaim above $555.56 would invalidate this bearish idea.
Personally, I'm not rushing into BNB here. I'm watching whether buyers can reclaim $555.56 with stronger volume or whether sellers push price back toward $519.11. I'll keep my risk around 0.5–1% per trade and avoid excessive leverage. What makes this setup interesting to me is the possibility of short-term momentum improving while the larger trend remains under pressure. I want to see actual confirmation before deciding which side deserves my attention.
BNB (BNB) Buyers Are Attempting a Bounce, But the Bigger Trend Remains Weak
BNB is showing some buying interest after dropping sharply toward $503.75, but I don't think the latest bounce is enough to change the overall direction yet. Price has climbed back to $539.30, and buyers are trying to stabilise the market after heavy selling. What interests me is that the bounce is happening while price remains below several important moving averages. This creates an interesting situation: short-term momentum is improving, but the broader structure is still bearish.
On my 4-hour $BNB chart, price is $539.30, up 2.22%, with a visible 24-hour high of $551.13 and low of $519.11. EMA9 is $543.82, EMA21 is $555.56 and EMA200 is $656.91. Supertrend is also above price at $560.11. The Bollinger middle line is $557.78, while the lower band is $511.51. Price is trading below these major resistance levels and slightly below VWAP at $541.32. RSI is 36.94, showing relatively weak momentum. MACD histogram has turned slightly positive at 0.64, but both MACD lines remain negative. Volume is 12.3K, below MA5 and MA10. So, I see some improvement, but not strong buying confirmation.
The latest November 22 market data puts BNB around $540.49, with a market capitalisation near $70.96 billion, circulating supply of approximately 131.51 million and a maximum supply target of 100 million under the burn mechanism. The live quote is slightly different from my screenshot.
BNB is the native asset of BNB Chain, supporting transaction fees, staking, governance and applications across BNB Smart Chain, opBNB and Greenfield. Its importance comes from actual ecosystem usage, including DeFi, payments and decentralised applications. BNB also has a supply-reduction mechanism through quarterly Auto-Burns and real-time fee burns. The latest 37th quarterly burn removed approximately 1.646 million BNB in October 2026. However, reduced supply alone cannot guarantee price growth; demand and network activity still matter.
The wider market is also important. Bitcoin recently rebounded above $60,000 after falling toward $55,251, but broader risk sentiment remains fragile. A stronger dollar and higher real yields have been putting pressure on crypto assets. If BTC struggles again, BNB could also find it difficult to sustain its bounce. Reuters +1
For the bullish scenario, a strong 4-hour close above $555.56, followed by a successful retest, would be my confirmation. Entry: $554–$558 after confirmation. SL: around $541. TP1: $560.11; TP2: $581.67. These levels align with Supertrend and visible chart resistance. A failed reclaim and return below $541 would weaken this setup.
For the bearish scenario, if BNB rejects $551–$555 and loses $519.11 on a 4-hour close, I would wait for a failed retest before considering a short. Entry: $518–$521. SL: around $542. TP1: $511.51; TP2: $503.75. These levels mark the lower Bollinger Band and recent swing low. A sustained reclaim above $555.56 would invalidate this bearish idea.
Personally, I'm not rushing into BNB here. I'm watching whether buyers can reclaim $555.56 with stronger volume or whether sellers push price back toward $519.11. I'll keep my risk around 0.5–1% per trade and avoid excessive leverage. What makes this setup interesting to me is the possibility of short-term momentum improving while the larger trend remains under pressure. I want to see actual confirmation before deciding which side deserves my attention.
On my 4-hour $BNB chart, price is $539.30, up 2.22%, with a visible 24-hour high of $551.13 and low of $519.11. EMA9 is $543.82, EMA21 is $555.56 and EMA200 is $656.91. Supertrend is also above price at $560.11. The Bollinger middle line is $557.78, while the lower band is $511.51. Price is trading below these major resistance levels and slightly below VWAP at $541.32. RSI is 36.94, showing relatively weak momentum. MACD histogram has turned slightly positive at 0.64, but both MACD lines remain negative. Volume is 12.3K, below MA5 and MA10. So, I see some improvement, but not strong buying confirmation.
The latest November 22 market data puts BNB around $540.49, with a market capitalisation near $70.96 billion, circulating supply of approximately 131.51 million and a maximum supply target of 100 million under the burn mechanism. The live quote is slightly different from my screenshot.
BNB is the native asset of BNB Chain, supporting transaction fees, staking, governance and applications across BNB Smart Chain, opBNB and Greenfield. Its importance comes from actual ecosystem usage, including DeFi, payments and decentralised applications. BNB also has a supply-reduction mechanism through quarterly Auto-Burns and real-time fee burns. The latest 37th quarterly burn removed approximately 1.646 million BNB in October 2026. However, reduced supply alone cannot guarantee price growth; demand and network activity still matter.
The wider market is also important. Bitcoin recently rebounded above $60,000 after falling toward $55,251, but broader risk sentiment remains fragile. A stronger dollar and higher real yields have been putting pressure on crypto assets. If BTC struggles again, BNB could also find it difficult to sustain its bounce. Reuters +1
For the bullish scenario, a strong 4-hour close above $555.56, followed by a successful retest, would be my confirmation. Entry: $554–$558 after confirmation. SL: around $541. TP1: $560.11; TP2: $581.67. These levels align with Supertrend and visible chart resistance. A failed reclaim and return below $541 would weaken this setup.
For the bearish scenario, if BNB rejects $551–$555 and loses $519.11 on a 4-hour close, I would wait for a failed retest before considering a short. Entry: $518–$521. SL: around $542. TP1: $511.51; TP2: $503.75. These levels mark the lower Bollinger Band and recent swing low. A sustained reclaim above $555.56 would invalidate this bearish idea.
Personally, I'm not rushing into BNB here. I'm watching whether buyers can reclaim $555.56 with stronger volume or whether sellers push price back toward $519.11. I'll keep my risk around 0.5–1% per trade and avoid excessive leverage. What makes this setup interesting to me is the possibility of short-term momentum improving while the larger trend remains under pressure. I want to see actual confirmation before deciding which side deserves my attention.
193
·
--
Bitcoin (BTC) A Strong Bounce From $55,120, But the Bigger Trend Is Still WeakBitcoin is showing some buying interest after a sharp decline, but I don't think the latest bounce is enough to change the overall market picture. Price dropped from the $66,138 region toward $55,120 before buyers stepped in and pushed it back to $59,324. What makes this move interesting is that the recovery has brought price closer to $60,000, but sellers are still defending higher levels. For me, this is an attempt to stabilise after heavy selling, not a confirmed trend reversal.
On my 4-hour BTC/USDT chart, price is $59,324.1, up 5.36%, with a visible 24-hour high of $61,000 and low of $55,120. The moving averages are still above price: MA7 at $59,344.7, MA14 at $59,640.6 and MA28 at $61,590.4. The Bollinger middle line is $60,666.5, while the upper and lower bands are $64,765.0 and $56,568.1. Price is struggling around the shorter moving averages and remains below the middle band. RSI is 39.07, showing that momentum is still relatively weak. MACD histogram has turned positive at 156.0, but DIF and DEA remain negative. This suggests selling pressure is easing, although buyers haven't established control yet.
The latest market data on November 22 puts BTC around $59,460, with a market capitalisation of approximately $1.19 trillion, 24-hour trading volume near $56.24 billion and circulating supply of 20.115 million BTC against its fixed maximum of 21 million. The live quote is close to my screenshot, although the percentage change differs because the snapshots were taken at different times. Bitcoin is still down significantly over the past week, so I wouldn't ignore the broader weakness just because buyers have stepped in. CoinMarketCap +1
Bitcoin's fundamentals remain centred around its role as a decentralised monetary network. It uses proof-of-work to secure transactions without depending on a central authority. Its 21 million supply cap and scheduled halvings make its issuance predictable. Around 95.8% of the maximum supply is already circulating, and the next halving is expected in 2028. There are no traditional token unlocks or staking emissions; miners receive newly issued BTC and transaction fees for securing the network.
The macro environment is also worth watching. Recent selling has been linked to rising borrowing costs, a stronger dollar, higher real yields and weakness in technology stocks. Reuters reported that Bitcoin rebounded above $59,000 after briefly falling near $55,251. This tells me the market is experiencing considerable volatility, and broader risk sentiment could influence whether this bounce continues. Reuters
For the chart, I'm watching $60,666 first, followed by $61,590. These are important because they align with the Bollinger middle line and MA28. RSI at 39.07 remains below neutral, while MACD's positive histogram suggests selling momentum is easing. However, price still needs to reclaim resistance before I become more confident.
Bullish scenario: A strong 4-hour close above $61,590, followed by a successful retest, would be my confirmation. Entry: $61,500–$61,800 after confirmation. SL: around $60,250. TP1: $64,765; TP2: $66,138. The targets align with the upper Bollinger Band and previous swing resistance. A failed reclaim and sustained move below $60,250 would weaken this setup.
Bearish scenario: If BTC rejects the $60,666–$61,590 area and loses $59,344 on a 4-hour close, I would wait for a failed retest before considering a short. Entry: $59,200–$59,400. SL: around $60,700. TP1: $56,568; TP2: $55,120. These levels matter because they mark the lower Bollinger Band and recent swing low. A sustained reclaim above $60,700 would invalidate this bearish idea.
Personally, I'm not rushing into either direction. I'm keeping my risk around 0.5–1% per trade and waiting for price confirmation. What makes this setup interesting to me is the difference between improving short-term momentum and the still-weak overall structure. I want to see whether buyers can reclaim $61,590 with proper volume or whether this bounce loses strength. Until then, I'd rather be patient than mistake a temporary bounce for a genuine change in Bitcoin's trend. $BTC
Bitcoin (BTC) A Strong Bounce From $55,120, But the Bigger Trend Is Still Weak
Bitcoin is showing some buying interest after a sharp decline, but I don't think the latest bounce is enough to change the overall market picture. Price dropped from the $66,138 region toward $55,120 before buyers stepped in and pushed it back to $59,324. What makes this move interesting is that the recovery has brought price closer to $60,000, but sellers are still defending higher levels. For me, this is an attempt to stabilise after heavy selling, not a confirmed trend reversal.
On my 4-hour BTC/USDT chart, price is $59,324.1, up 5.36%, with a visible 24-hour high of $61,000 and low of $55,120. The moving averages are still above price: MA7 at $59,344.7, MA14 at $59,640.6 and MA28 at $61,590.4. The Bollinger middle line is $60,666.5, while the upper and lower bands are $64,765.0 and $56,568.1. Price is struggling around the shorter moving averages and remains below the middle band. RSI is 39.07, showing that momentum is still relatively weak. MACD histogram has turned positive at 156.0, but DIF and DEA remain negative. This suggests selling pressure is easing, although buyers haven't established control yet.
The latest market data on November 22 puts BTC around $59,460, with a market capitalisation of approximately $1.19 trillion, 24-hour trading volume near $56.24 billion and circulating supply of 20.115 million BTC against its fixed maximum of 21 million. The live quote is close to my screenshot, although the percentage change differs because the snapshots were taken at different times. Bitcoin is still down significantly over the past week, so I wouldn't ignore the broader weakness just because buyers have stepped in. CoinMarketCap +1
Bitcoin's fundamentals remain centred around its role as a decentralised monetary network. It uses proof-of-work to secure transactions without depending on a central authority. Its 21 million supply cap and scheduled halvings make its issuance predictable. Around 95.8% of the maximum supply is already circulating, and the next halving is expected in 2028. There are no traditional token unlocks or staking emissions; miners receive newly issued BTC and transaction fees for securing the network.
The macro environment is also worth watching. Recent selling has been linked to rising borrowing costs, a stronger dollar, higher real yields and weakness in technology stocks. Reuters reported that Bitcoin rebounded above $59,000 after briefly falling near $55,251. This tells me the market is experiencing considerable volatility, and broader risk sentiment could influence whether this bounce continues. Reuters
For the chart, I'm watching $60,666 first, followed by $61,590. These are important because they align with the Bollinger middle line and MA28. RSI at 39.07 remains below neutral, while MACD's positive histogram suggests selling momentum is easing. However, price still needs to reclaim resistance before I become more confident.
Bullish scenario: A strong 4-hour close above $61,590, followed by a successful retest, would be my confirmation. Entry: $61,500–$61,800 after confirmation. SL: around $60,250. TP1: $64,765; TP2: $66,138. The targets align with the upper Bollinger Band and previous swing resistance. A failed reclaim and sustained move below $60,250 would weaken this setup.
Bearish scenario: If BTC rejects the $60,666–$61,590 area and loses $59,344 on a 4-hour close, I would wait for a failed retest before considering a short. Entry: $59,200–$59,400. SL: around $60,700. TP1: $56,568; TP2: $55,120. These levels matter because they mark the lower Bollinger Band and recent swing low. A sustained reclaim above $60,700 would invalidate this bearish idea.
Personally, I'm not rushing into either direction. I'm keeping my risk around 0.5–1% per trade and waiting for price confirmation. What makes this setup interesting to me is the difference between improving short-term momentum and the still-weak overall structure. I want to see whether buyers can reclaim $61,590 with proper volume or whether this bounce loses strength. Until then, I'd rather be patient than mistake a temporary bounce for a genuine change in Bitcoin's trend. $BTC
On my 4-hour BTC/USDT chart, price is $59,324.1, up 5.36%, with a visible 24-hour high of $61,000 and low of $55,120. The moving averages are still above price: MA7 at $59,344.7, MA14 at $59,640.6 and MA28 at $61,590.4. The Bollinger middle line is $60,666.5, while the upper and lower bands are $64,765.0 and $56,568.1. Price is struggling around the shorter moving averages and remains below the middle band. RSI is 39.07, showing that momentum is still relatively weak. MACD histogram has turned positive at 156.0, but DIF and DEA remain negative. This suggests selling pressure is easing, although buyers haven't established control yet.
The latest market data on November 22 puts BTC around $59,460, with a market capitalisation of approximately $1.19 trillion, 24-hour trading volume near $56.24 billion and circulating supply of 20.115 million BTC against its fixed maximum of 21 million. The live quote is close to my screenshot, although the percentage change differs because the snapshots were taken at different times. Bitcoin is still down significantly over the past week, so I wouldn't ignore the broader weakness just because buyers have stepped in. CoinMarketCap +1
Bitcoin's fundamentals remain centred around its role as a decentralised monetary network. It uses proof-of-work to secure transactions without depending on a central authority. Its 21 million supply cap and scheduled halvings make its issuance predictable. Around 95.8% of the maximum supply is already circulating, and the next halving is expected in 2028. There are no traditional token unlocks or staking emissions; miners receive newly issued BTC and transaction fees for securing the network.
The macro environment is also worth watching. Recent selling has been linked to rising borrowing costs, a stronger dollar, higher real yields and weakness in technology stocks. Reuters reported that Bitcoin rebounded above $59,000 after briefly falling near $55,251. This tells me the market is experiencing considerable volatility, and broader risk sentiment could influence whether this bounce continues. Reuters
For the chart, I'm watching $60,666 first, followed by $61,590. These are important because they align with the Bollinger middle line and MA28. RSI at 39.07 remains below neutral, while MACD's positive histogram suggests selling momentum is easing. However, price still needs to reclaim resistance before I become more confident.
Bullish scenario: A strong 4-hour close above $61,590, followed by a successful retest, would be my confirmation. Entry: $61,500–$61,800 after confirmation. SL: around $60,250. TP1: $64,765; TP2: $66,138. The targets align with the upper Bollinger Band and previous swing resistance. A failed reclaim and sustained move below $60,250 would weaken this setup.
Bearish scenario: If BTC rejects the $60,666–$61,590 area and loses $59,344 on a 4-hour close, I would wait for a failed retest before considering a short. Entry: $59,200–$59,400. SL: around $60,700. TP1: $56,568; TP2: $55,120. These levels matter because they mark the lower Bollinger Band and recent swing low. A sustained reclaim above $60,700 would invalidate this bearish idea.
Personally, I'm not rushing into either direction. I'm keeping my risk around 0.5–1% per trade and waiting for price confirmation. What makes this setup interesting to me is the difference between improving short-term momentum and the still-weak overall structure. I want to see whether buyers can reclaim $61,590 with proper volume or whether this bounce loses strength. Until then, I'd rather be patient than mistake a temporary bounce for a genuine change in Bitcoin's trend. $BTC
1
1
1.1k
·
--
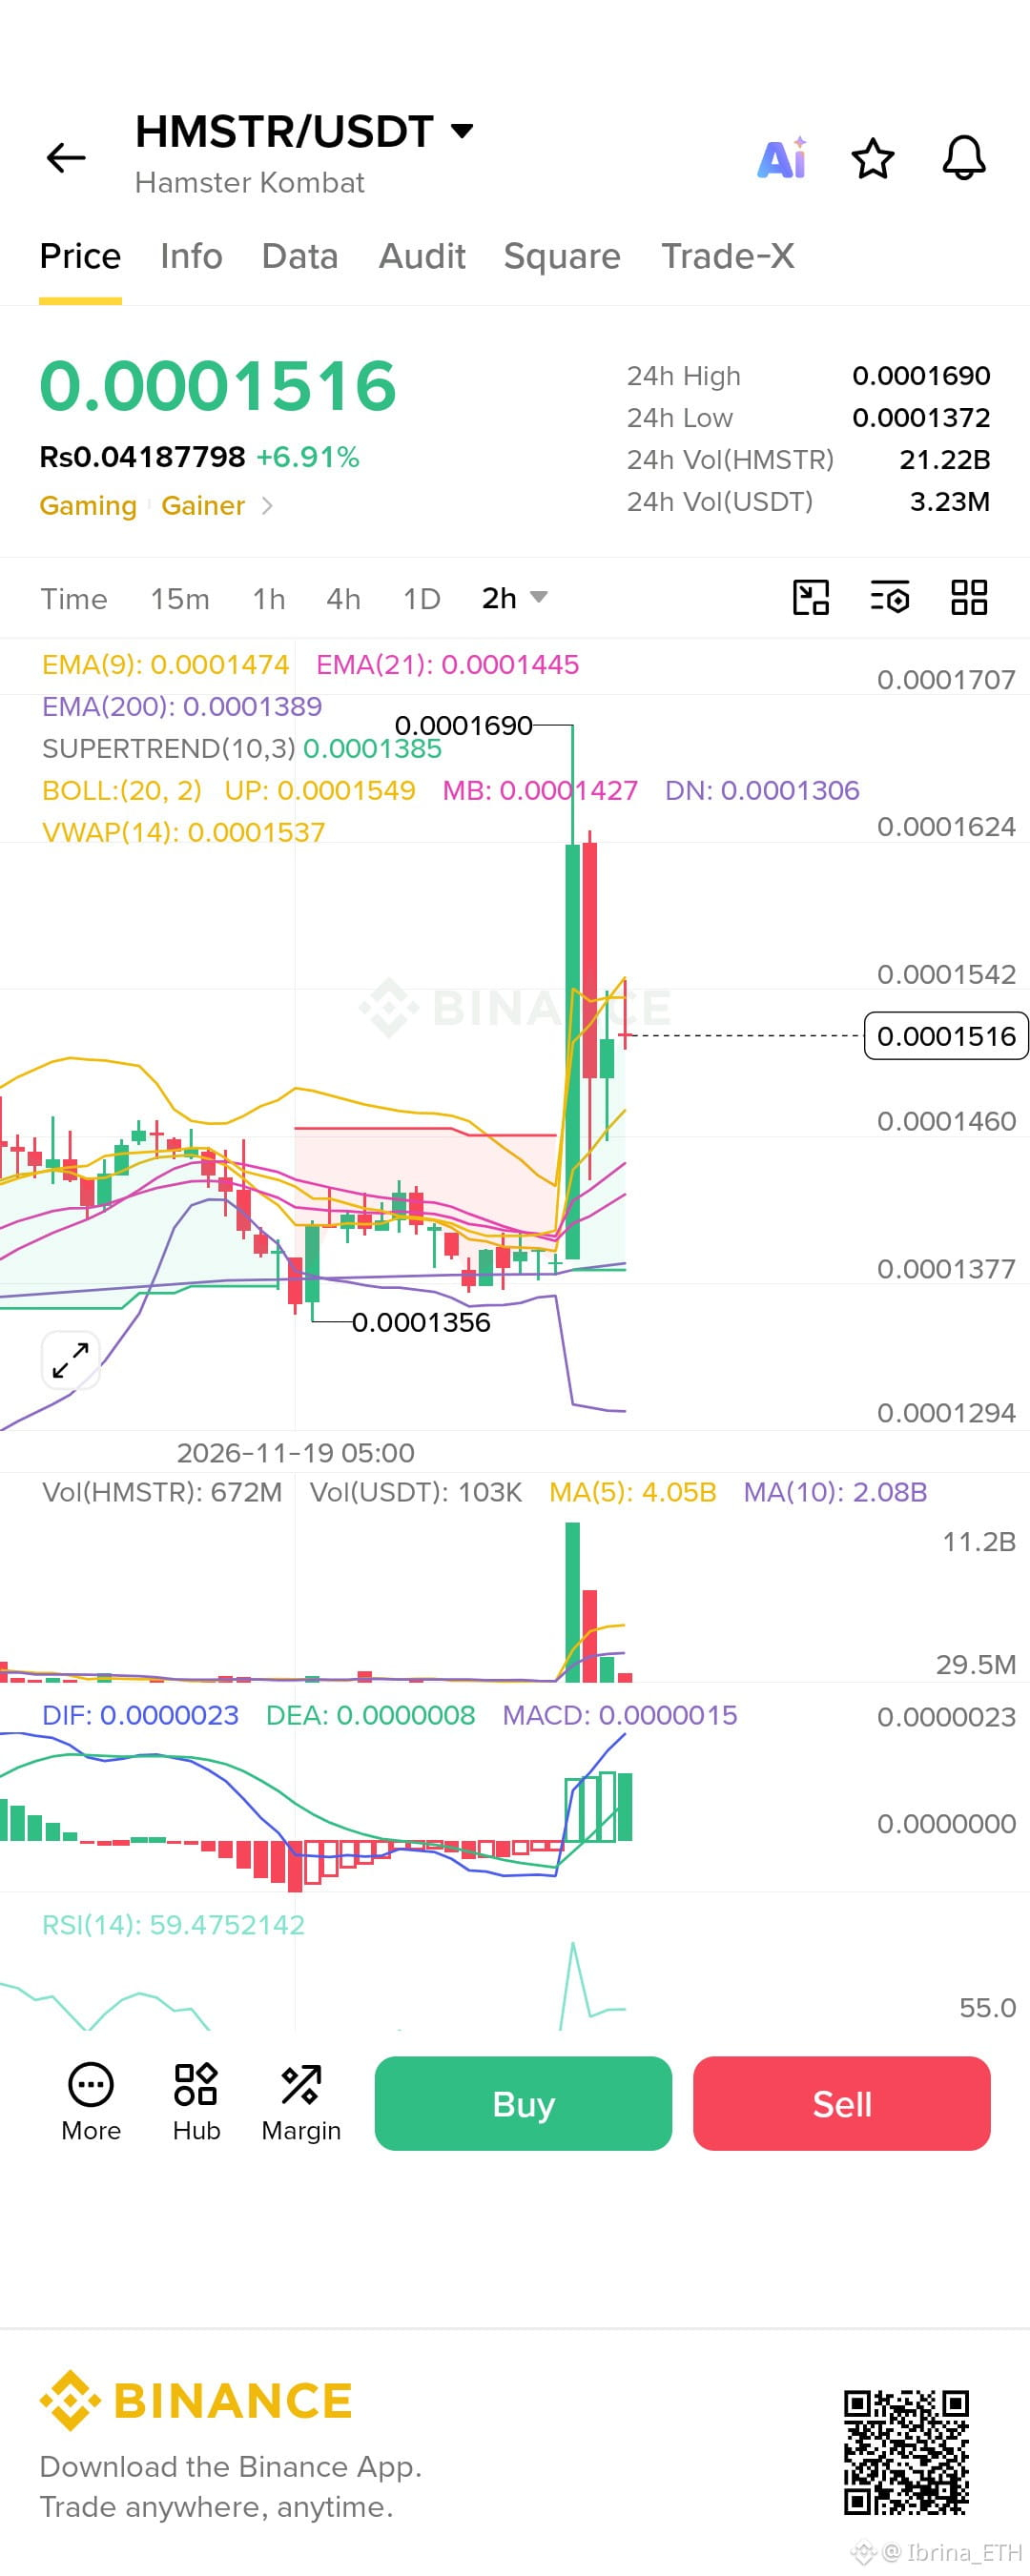
$HMSTR is finally showing some signs of life, and the latest 2H candle is definitely worth watching. Price has pushed higher with a noticeable increase in volume, while EMA 9 and EMA 21 are showing a bullish structure. MACD has flipped positive, and RSI around 59 still leaves some room for momentum.
Personally, I see two possible opportunities here. The first is a healthy pullback toward 0.0001470–0.0001450, where buyers could potentially step in. The second is a confirmed breakout above 0.0001549, followed by a successful retest. Upside levels to watch are 0.0001624 and 0.0001690. If the bullish structure holds, these levels become interesting targets. However, losing 0.0001420 would weaken this setup.
One thing I've learned from trading is that a good opportunity doesn't need to be chased. Let price come to your levels, wait for confirmation, and never risk more than you can afford to lose. Protecting capital is just as important as making profits.
Bullish, but patient. Let's see what the next 2H candles bring. 📈
{future}(HMSTRUSDT)
$HMSTR is finally showing some signs of life, and the latest 2H candle is definitely worth watching. Price has pushed higher with a noticeable increase in volume, while EMA 9 and EMA 21 are showing a bullish structure. MACD has flipped positive, and RSI around 59 still leaves some room for momentum.
Personally, I see two possible opportunities here. The first is a healthy pullback toward 0.0001470–0.0001450, where buyers could potentially step in. The second is a confirmed breakout above 0.0001549, followed by a successful retest. Upside levels to watch are 0.0001624 and 0.0001690. If the bullish structure holds, these levels become interesting targets. However, losing 0.0001420 would weaken this setup.
One thing I've learned from trading is that a good opportunity doesn't need to be chased. Let price come to your levels, wait for confirmation, and never risk more than you can afford to lose. Protecting capital is just as important as making profits.
Bullish, but patient. Let's see what the next 2H candles bring. 📈
Personally, I see two possible opportunities here. The first is a healthy pullback toward 0.0001470–0.0001450, where buyers could potentially step in. The second is a confirmed breakout above 0.0001549, followed by a successful retest. Upside levels to watch are 0.0001624 and 0.0001690. If the bullish structure holds, these levels become interesting targets. However, losing 0.0001420 would weaken this setup.
One thing I've learned from trading is that a good opportunity doesn't need to be chased. Let price come to your levels, wait for confirmation, and never risk more than you can afford to lose. Protecting capital is just as important as making profits.
Bullish, but patient. Let's see what the next 2H candles bring. 📈
1
1
807
·
--
$DOGE Bears Still Have Control! Can Buyers Stage a Recovery?
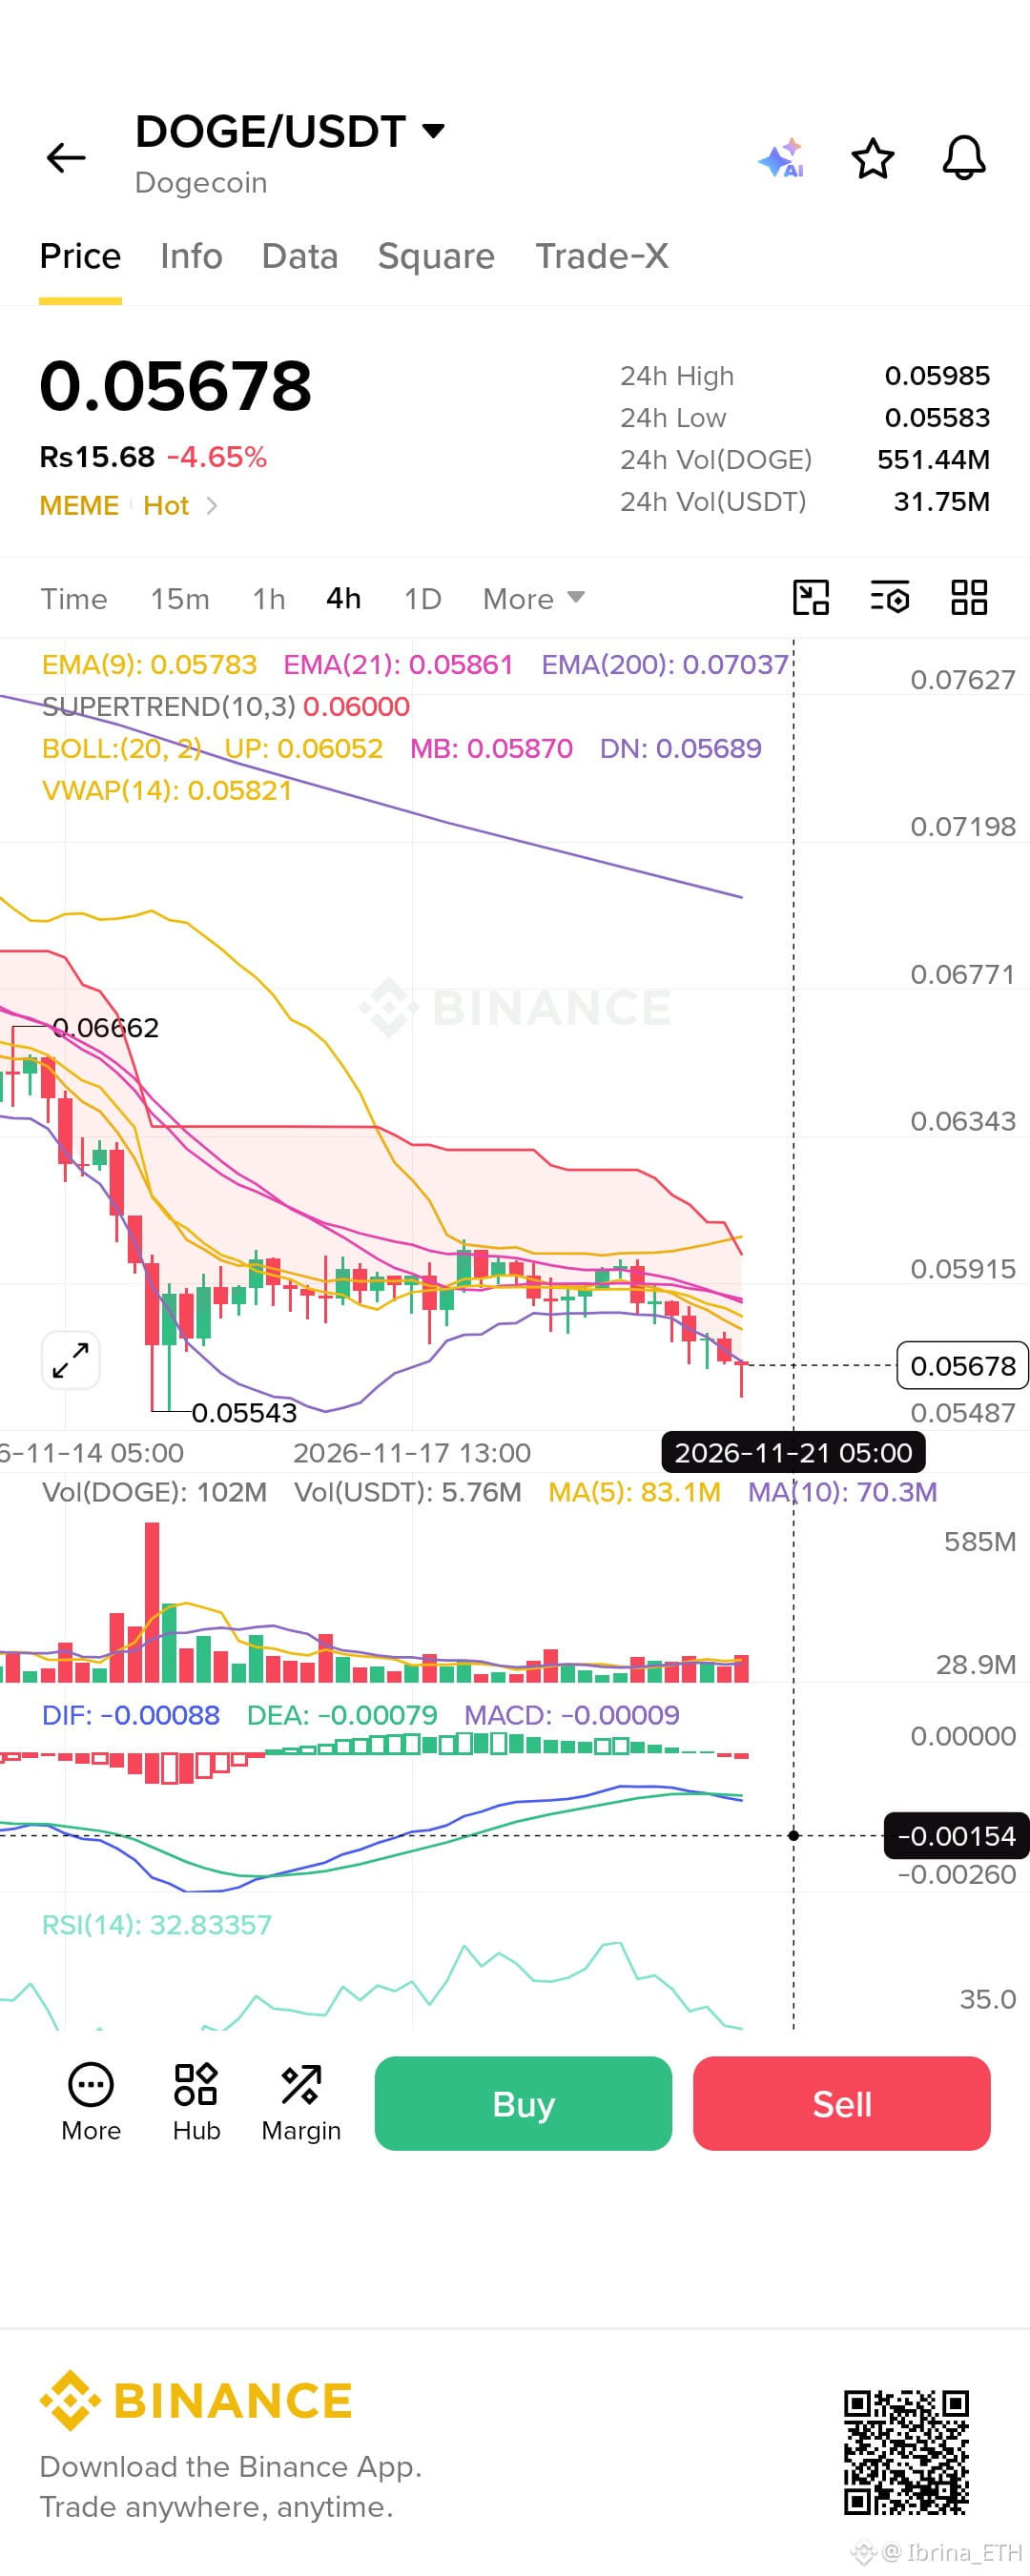
Looking at the 4H chart, DOGE is trading at $0.05678, down 4.65%. Sellers remain in control after pushing price down from $0.06662. Buyers are struggling to recover, and the overall structure remains weak.
EMA 9: $0.05783 | EMA 21: $0.05861 | EMA 200: $0.07037. Price is below all three. RSI is 32.83, showing weak momentum. MACD is negative at -0.00009. Bollinger middle band is $0.05870, while the lower band is $0.05689. Supertrend at $0.06000 remains bearish.
Support: $0.05583 and $0.05543. Resistance: $0.05783, $0.05870 and $0.06000. A breakdown below support could bring further selling.
TRADE SETUPS
Bullish: Entry after reclaiming $0.05870. SL: $0.05680. Targets: $0.05915, $0.06000, $0.06052. Bearish: Rejection around $0.05783–$0.05870. SL: $0.06010. Targets: $0.05600, $0.05543, $0.05487. Wait for confirmation.
Volume is 102M DOGE, above MA(5) at 83.1M and MA(10) at 70.3M. Participation is increasing, but price weakness suggests sellers remain active. RSI is approaching oversold territory, but no confirmed reversal yet. MACD remains negative, keeping bearish momentum in focus.
MY PLAN & RISK MANAGEMENT
Personally, I would wait rather than catch a falling knife. I want to see buyers reclaim $0.05870 before considering a long. I would risk only 0.5–1% of capital, use a strict stop-loss and avoid excessive leverage.
My current bias is BEARISH. DOGE needs to reclaim $0.05870 to improve its structure. Otherwise, $0.05543 remains an important downside level.
What is your view? Are buyers preparing a comeback, or will bears push DOGE lower? 👇
$DOGE
{future}(DOGEUSDT)
$DOGE Bears Still Have Control! Can Buyers Stage a Recovery?
Looking at the 4H chart, DOGE is trading at $0.05678, down 4.65%. Sellers remain in control after pushing price down from $0.06662. Buyers are struggling to recover, and the overall structure remains weak.
EMA 9: $0.05783 | EMA 21: $0.05861 | EMA 200: $0.07037. Price is below all three. RSI is 32.83, showing weak momentum. MACD is negative at -0.00009. Bollinger middle band is $0.05870, while the lower band is $0.05689. Supertrend at $0.06000 remains bearish.
Support: $0.05583 and $0.05543. Resistance: $0.05783, $0.05870 and $0.06000. A breakdown below support could bring further selling.
TRADE SETUPS
Bullish: Entry after reclaiming $0.05870. SL: $0.05680. Targets: $0.05915, $0.06000, $0.06052. Bearish: Rejection around $0.05783–$0.05870. SL: $0.06010. Targets: $0.05600, $0.05543, $0.05487. Wait for confirmation.
Volume is 102M DOGE, above MA(5) at 83.1M and MA(10) at 70.3M. Participation is increasing, but price weakness suggests sellers remain active. RSI is approaching oversold territory, but no confirmed reversal yet. MACD remains negative, keeping bearish momentum in focus.
MY PLAN & RISK MANAGEMENT
Personally, I would wait rather than catch a falling knife. I want to see buyers reclaim $0.05870 before considering a long. I would risk only 0.5–1% of capital, use a strict stop-loss and avoid excessive leverage.
My current bias is BEARISH. DOGE needs to reclaim $0.05870 to improve its structure. Otherwise, $0.05543 remains an important downside level.
What is your view? Are buyers preparing a comeback, or will bears push DOGE lower? 👇
$DOGE
Looking at the 4H chart, DOGE is trading at $0.05678, down 4.65%. Sellers remain in control after pushing price down from $0.06662. Buyers are struggling to recover, and the overall structure remains weak.
EMA 9: $0.05783 | EMA 21: $0.05861 | EMA 200: $0.07037. Price is below all three. RSI is 32.83, showing weak momentum. MACD is negative at -0.00009. Bollinger middle band is $0.05870, while the lower band is $0.05689. Supertrend at $0.06000 remains bearish.
Support: $0.05583 and $0.05543. Resistance: $0.05783, $0.05870 and $0.06000. A breakdown below support could bring further selling.
TRADE SETUPS
Bullish: Entry after reclaiming $0.05870. SL: $0.05680. Targets: $0.05915, $0.06000, $0.06052. Bearish: Rejection around $0.05783–$0.05870. SL: $0.06010. Targets: $0.05600, $0.05543, $0.05487. Wait for confirmation.
Volume is 102M DOGE, above MA(5) at 83.1M and MA(10) at 70.3M. Participation is increasing, but price weakness suggests sellers remain active. RSI is approaching oversold territory, but no confirmed reversal yet. MACD remains negative, keeping bearish momentum in focus.
MY PLAN & RISK MANAGEMENT
Personally, I would wait rather than catch a falling knife. I want to see buyers reclaim $0.05870 before considering a long. I would risk only 0.5–1% of capital, use a strict stop-loss and avoid excessive leverage.
My current bias is BEARISH. DOGE needs to reclaim $0.05870 to improve its structure. Otherwise, $0.05543 remains an important downside level.
What is your view? Are buyers preparing a comeback, or will bears push DOGE lower? 👇
$DOGE
1
424
·
--
💔 I SOLD MY GOLD CHAIN TO INVEST IN CRYPTO… AND LOST ALMOST EVERYTHING.
In 2025, I made a life-changing decision.
I sold my gold chain and invested the money in Ethereum ( $ETH ) . I thought crypto could change my life and future.
But the market had different plans.
Instead of profits, I faced heavy losses. My investment slowly disappeared, and I felt I had nothing left.
That experience taught me something important:
The market doesn't care about your emotions, dreams, or sacrifices. It rewards patience, discipline, and risk management.
I'm still learning and analyzing charts. I don't want anyone to repeat my mistakes.
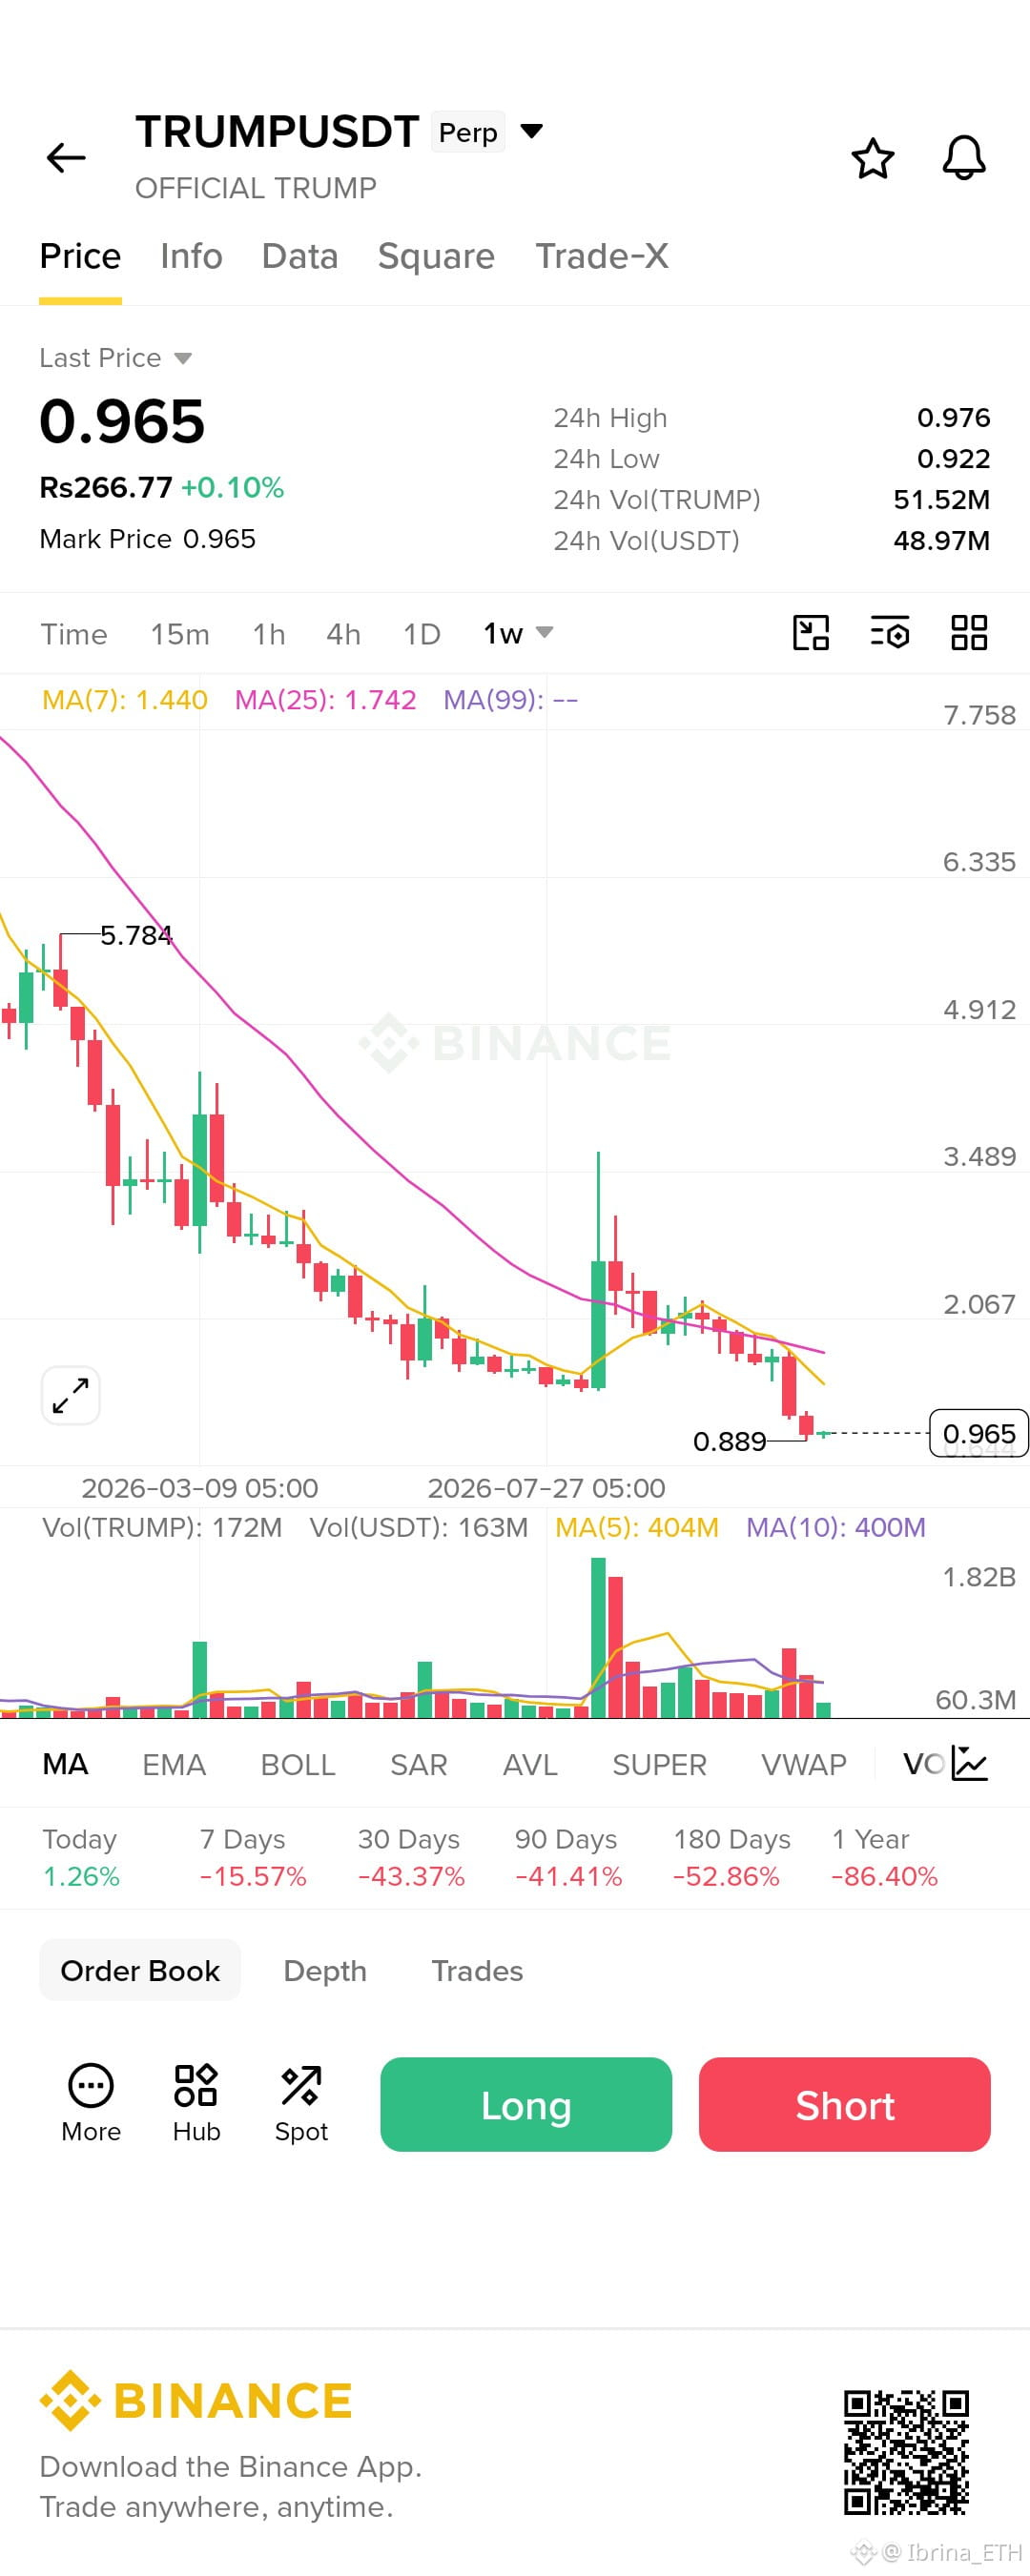
Now, let's look at $TRUMP (OFFICIAL TRUMP).
TECHNICAL ANALYSIS – WEEKLY TIMEFRAME
Current Price: $0.965
- MA(7): $1.440
- MA(25): $1.742
- 24H High: $0.976
- 24H Low: $0.922
- Recent Swing Low: $0.889
🔴 Market Structure: BEARISH
TRUMPUSDT is bearish on the weekly timeframe.
Price is below MA(7) and MA(25); sellers remain in control.
KEY SUPPORT LEVELS
- $0.922 – Short-term support
- $0.889 – Major visible support
- A weekly break below $0.889 could increase selling pressure.
KEY RESISTANCE LEVELS
- $1.000 – Psychological resistance
- $1.440 – MA(7) resistance
- $1.742 – MA(25) resistance
POSSIBLE TRADING SIGNALS
LONG SETUP:
Wait for a breakout above $1.00 and a confirmed retest. A move to $1.44 is possible with bullish momentum.
SHORT SETUP:
If price is rejected near $1.00, bearish continuation is possible. A break below $0.889 could bring further downside.
These are conditional setups, not confirmed entry signals. Wait for confirmation and use a stop-loss.
MY FINAL THOUGHT:
I lost money chasing dreams. Protecting capital matters more than chasing profits.
Don't trade emotionally. Trade with a plan.
What do you think about TRUMPUSDT? Will we see a recovery, or another move down?
Share your analysis below!
DISCLAIMER: This post is for educational and informational purposes only, Not any financial advice. DYOR and trade at your own risk.
💔 I SOLD MY GOLD CHAIN TO INVEST IN CRYPTO… AND LOST ALMOST EVERYTHING.
In 2025, I made a life-changing decision.
I sold my gold chain and invested the money in Ethereum ( $ETH ) . I thought crypto could change my life and future.
But the market had different plans.
Instead of profits, I faced heavy losses. My investment slowly disappeared, and I felt I had nothing left.
That experience taught me something important:
The market doesn't care about your emotions, dreams, or sacrifices. It rewards patience, discipline, and risk management.
I'm still learning and analyzing charts. I don't want anyone to repeat my mistakes.
Now, let's look at $TRUMP (OFFICIAL TRUMP).
TECHNICAL ANALYSIS – WEEKLY TIMEFRAME
Current Price: $0.965
- MA(7): $1.440
- MA(25): $1.742
- 24H High: $0.976
- 24H Low: $0.922
- Recent Swing Low: $0.889
🔴 Market Structure: BEARISH
TRUMPUSDT is bearish on the weekly timeframe.
Price is below MA(7) and MA(25); sellers remain in control.
KEY SUPPORT LEVELS
- $0.922 – Short-term support
- $0.889 – Major visible support
- A weekly break below $0.889 could increase selling pressure.
KEY RESISTANCE LEVELS
- $1.000 – Psychological resistance
- $1.440 – MA(7) resistance
- $1.742 – MA(25) resistance
POSSIBLE TRADING SIGNALS
LONG SETUP:
Wait for a breakout above $1.00 and a confirmed retest. A move to $1.44 is possible with bullish momentum.
SHORT SETUP:
If price is rejected near $1.00, bearish continuation is possible. A break below $0.889 could bring further downside.
These are conditional setups, not confirmed entry signals. Wait for confirmation and use a stop-loss.
MY FINAL THOUGHT:
I lost money chasing dreams. Protecting capital matters more than chasing profits.
Don't trade emotionally. Trade with a plan.
What do you think about TRUMPUSDT? Will we see a recovery, or another move down?
Share your analysis below!
DISCLAIMER: This post is for educational and informational purposes only, Not any financial advice. DYOR and trade at your own risk.
In 2025, I made a life-changing decision.
I sold my gold chain and invested the money in Ethereum ( $ETH ) . I thought crypto could change my life and future.
But the market had different plans.
Instead of profits, I faced heavy losses. My investment slowly disappeared, and I felt I had nothing left.
That experience taught me something important:
The market doesn't care about your emotions, dreams, or sacrifices. It rewards patience, discipline, and risk management.
I'm still learning and analyzing charts. I don't want anyone to repeat my mistakes.
Now, let's look at $TRUMP (OFFICIAL TRUMP).
TECHNICAL ANALYSIS – WEEKLY TIMEFRAME
Current Price: $0.965
- MA(7): $1.440
- MA(25): $1.742
- 24H High: $0.976
- 24H Low: $0.922
- Recent Swing Low: $0.889
🔴 Market Structure: BEARISH
TRUMPUSDT is bearish on the weekly timeframe.
Price is below MA(7) and MA(25); sellers remain in control.
KEY SUPPORT LEVELS
- $0.922 – Short-term support
- $0.889 – Major visible support
- A weekly break below $0.889 could increase selling pressure.
KEY RESISTANCE LEVELS
- $1.000 – Psychological resistance
- $1.440 – MA(7) resistance
- $1.742 – MA(25) resistance
POSSIBLE TRADING SIGNALS
LONG SETUP:
Wait for a breakout above $1.00 and a confirmed retest. A move to $1.44 is possible with bullish momentum.
SHORT SETUP:
If price is rejected near $1.00, bearish continuation is possible. A break below $0.889 could bring further downside.
These are conditional setups, not confirmed entry signals. Wait for confirmation and use a stop-loss.
MY FINAL THOUGHT:
I lost money chasing dreams. Protecting capital matters more than chasing profits.
Don't trade emotionally. Trade with a plan.
What do you think about TRUMPUSDT? Will we see a recovery, or another move down?
Share your analysis below!
DISCLAIMER: This post is for educational and informational purposes only, Not any financial advice. DYOR and trade at your own risk.
425
·
--
Статья
HYPE After a $60M Long Flush: Bottom or First Wave?Hey guys, Saturday night was a full-on bloodbath for $HYPE longs. Around $60.3M got liquidated on Hyperliquid in a single day, 99.7% of it longs, and that’s the biggest number for this token in at least a year. A lot of people went to bed with 20x and woke up with a very expensive lesson 😅
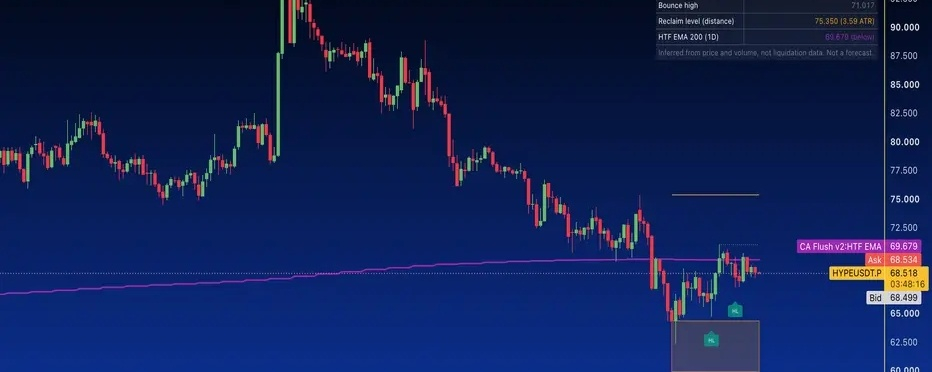
You can see the whole thing in one 4H candle on my chart: a wick all the way down to $59.89 and then a close back at $64.34 like nothing even happened. And before anyone says Hyperliquid is cooked, this really doesn’t look like a Hyperliquid problem.
The whole market dumped with $BTC under $65K, while the platform had its highest fees since October and kept buying back HYPE, so honestly the exchange was the only one having a good weekend.
I threw a little script on the chart to measure that candle, and yeah, it’s pretty much textbook forced selling getting soaked up: 2.51 ATR range, almost 80% of it wick, and about 1.6x normal volume. Price hasn’t gone back into that orange box since, and we’ve already got two higher lows in the mid-$60s, so the bottom case is looking better than I thought it would.
The annoying bit is that the bounce got stuck at $71.02, right around the daily 200 EMA at $69.68. If we get a 4H close above $75.35, the last swing high before the dump, I’m happy calling Saturday the low. If HYPE loses those higher lows and closes back under $59.89 instead, then that was just round one, and there’s not a lot on this chart below $60 to catch it.
So I’m kinda leaning bottom, but I’m not jumping in until $71 breaks, especially with the Fed minutes coming out later today. I’ve watched enough people get liquidated this week already, no need to sign up as the next one lol. Where do you think HYPE breaks first, $71 or $64? 👀
Disclaimer: Just my own read of the chart, not financial advice. Manage your risk, keep position size sensible, and be ready for the market to do something else entirely.
HYPE After a $60M Long Flush: Bottom or First Wave?
Hey guys, Saturday night was a full-on bloodbath for $HYPE longs. Around $60.3M got liquidated on Hyperliquid in a single day, 99.7% of it longs, and that’s the biggest number for this token in at least a year. A lot of people went to bed with 20x and woke up with a very expensive lesson 😅
You can see the whole thing in one 4H candle on my chart: a wick all the way down to $59.89 and then a close back at $64.34 like nothing even happened. And before anyone says Hyperliquid is cooked, this really doesn’t look like a Hyperliquid problem.
The whole market dumped with $BTC under $65K, while the platform had its highest fees since October and kept buying back HYPE, so honestly the exchange was the only one having a good weekend.
I threw a little script on the chart to measure that candle, and yeah, it’s pretty much textbook forced selling getting soaked up: 2.51 ATR range, almost 80% of it wick, and about 1.6x normal volume. Price hasn’t gone back into that orange box since, and we’ve already got two higher lows in the mid-$60s, so the bottom case is looking better than I thought it would.
The annoying bit is that the bounce got stuck at $71.02, right around the daily 200 EMA at $69.68. If we get a 4H close above $75.35, the last swing high before the dump, I’m happy calling Saturday the low. If HYPE loses those higher lows and closes back under $59.89 instead, then that was just round one, and there’s not a lot on this chart below $60 to catch it.
So I’m kinda leaning bottom, but I’m not jumping in until $71 breaks, especially with the Fed minutes coming out later today. I’ve watched enough people get liquidated this week already, no need to sign up as the next one lol. Where do you think HYPE breaks first, $71 or $64? 👀
Disclaimer: Just my own read of the chart, not financial advice. Manage your risk, keep position size sensible, and be ready for the market to do something else entirely.
You can see the whole thing in one 4H candle on my chart: a wick all the way down to $59.89 and then a close back at $64.34 like nothing even happened. And before anyone says Hyperliquid is cooked, this really doesn’t look like a Hyperliquid problem.
The whole market dumped with $BTC under $65K, while the platform had its highest fees since October and kept buying back HYPE, so honestly the exchange was the only one having a good weekend.
I threw a little script on the chart to measure that candle, and yeah, it’s pretty much textbook forced selling getting soaked up: 2.51 ATR range, almost 80% of it wick, and about 1.6x normal volume. Price hasn’t gone back into that orange box since, and we’ve already got two higher lows in the mid-$60s, so the bottom case is looking better than I thought it would.
The annoying bit is that the bounce got stuck at $71.02, right around the daily 200 EMA at $69.68. If we get a 4H close above $75.35, the last swing high before the dump, I’m happy calling Saturday the low. If HYPE loses those higher lows and closes back under $59.89 instead, then that was just round one, and there’s not a lot on this chart below $60 to catch it.
So I’m kinda leaning bottom, but I’m not jumping in until $71 breaks, especially with the Fed minutes coming out later today. I’ve watched enough people get liquidated this week already, no need to sign up as the next one lol. Where do you think HYPE breaks first, $71 or $64? 👀
Disclaimer: Just my own read of the chart, not financial advice. Manage your risk, keep position size sensible, and be ready for the market to do something else entirely.
1
451
·
--
🚨 Precious metals just took a massive hit!
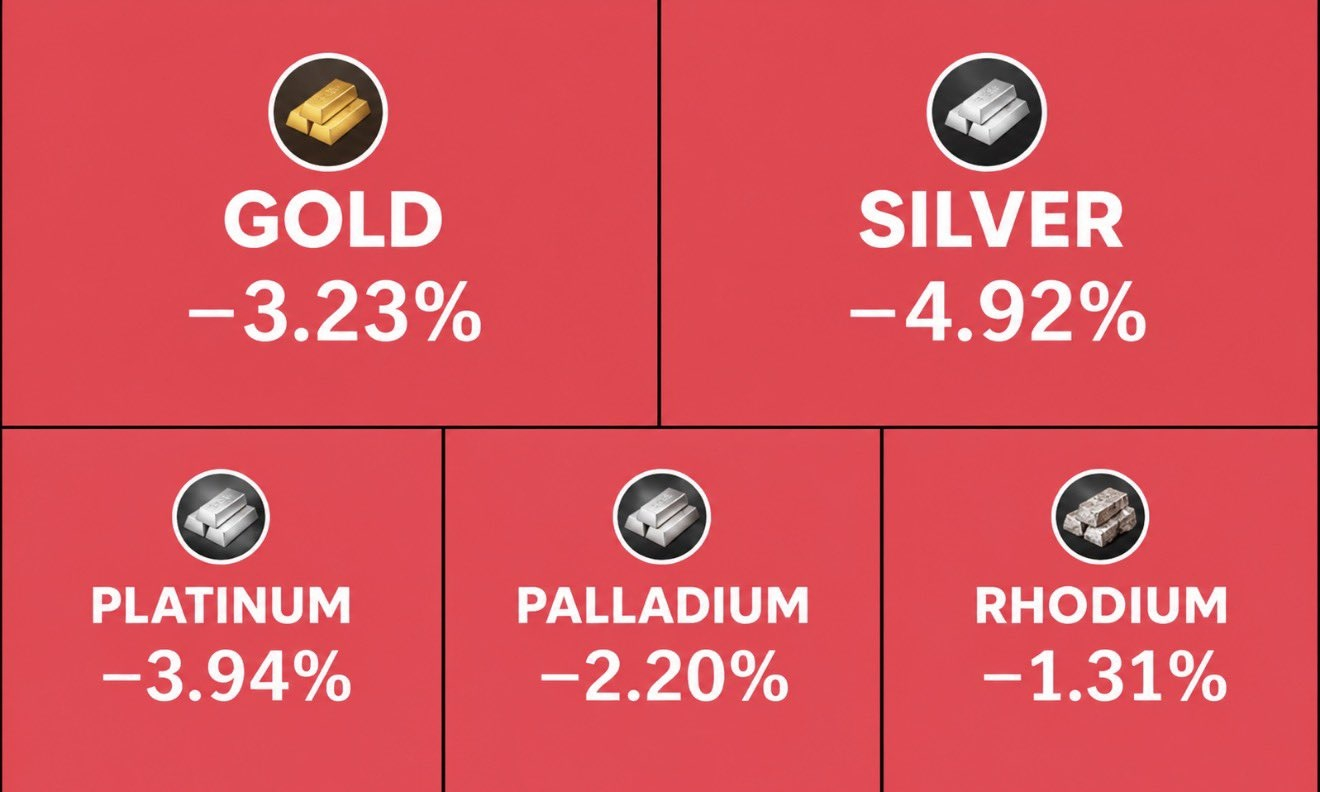
Gold and silver reportedly lost around $1.4 trillion in market value in just 24 hours.
To put that into perspective, that’s more than the entire market cap of Bitcoin.
A staggering sell-off in a single day. The precious metals market is seeing some serious volatility right now. 📉
$XAU
{future}(XAGUSDT)
$BTC
{future}(BTCUSDT)
$XAG
{future}(XAUUSDT)
🚨 Precious metals just took a massive hit!
Gold and silver reportedly lost around $1.4 trillion in market value in just 24 hours.
To put that into perspective, that’s more than the entire market cap of Bitcoin.
A staggering sell-off in a single day. The precious metals market is seeing some serious volatility right now. 📉
$XAU
$BTC
$XAG
Gold and silver reportedly lost around $1.4 trillion in market value in just 24 hours.
To put that into perspective, that’s more than the entire market cap of Bitcoin.
A staggering sell-off in a single day. The precious metals market is seeing some serious volatility right now. 📉
$XAU
$BTC
$XAG
374
·
--
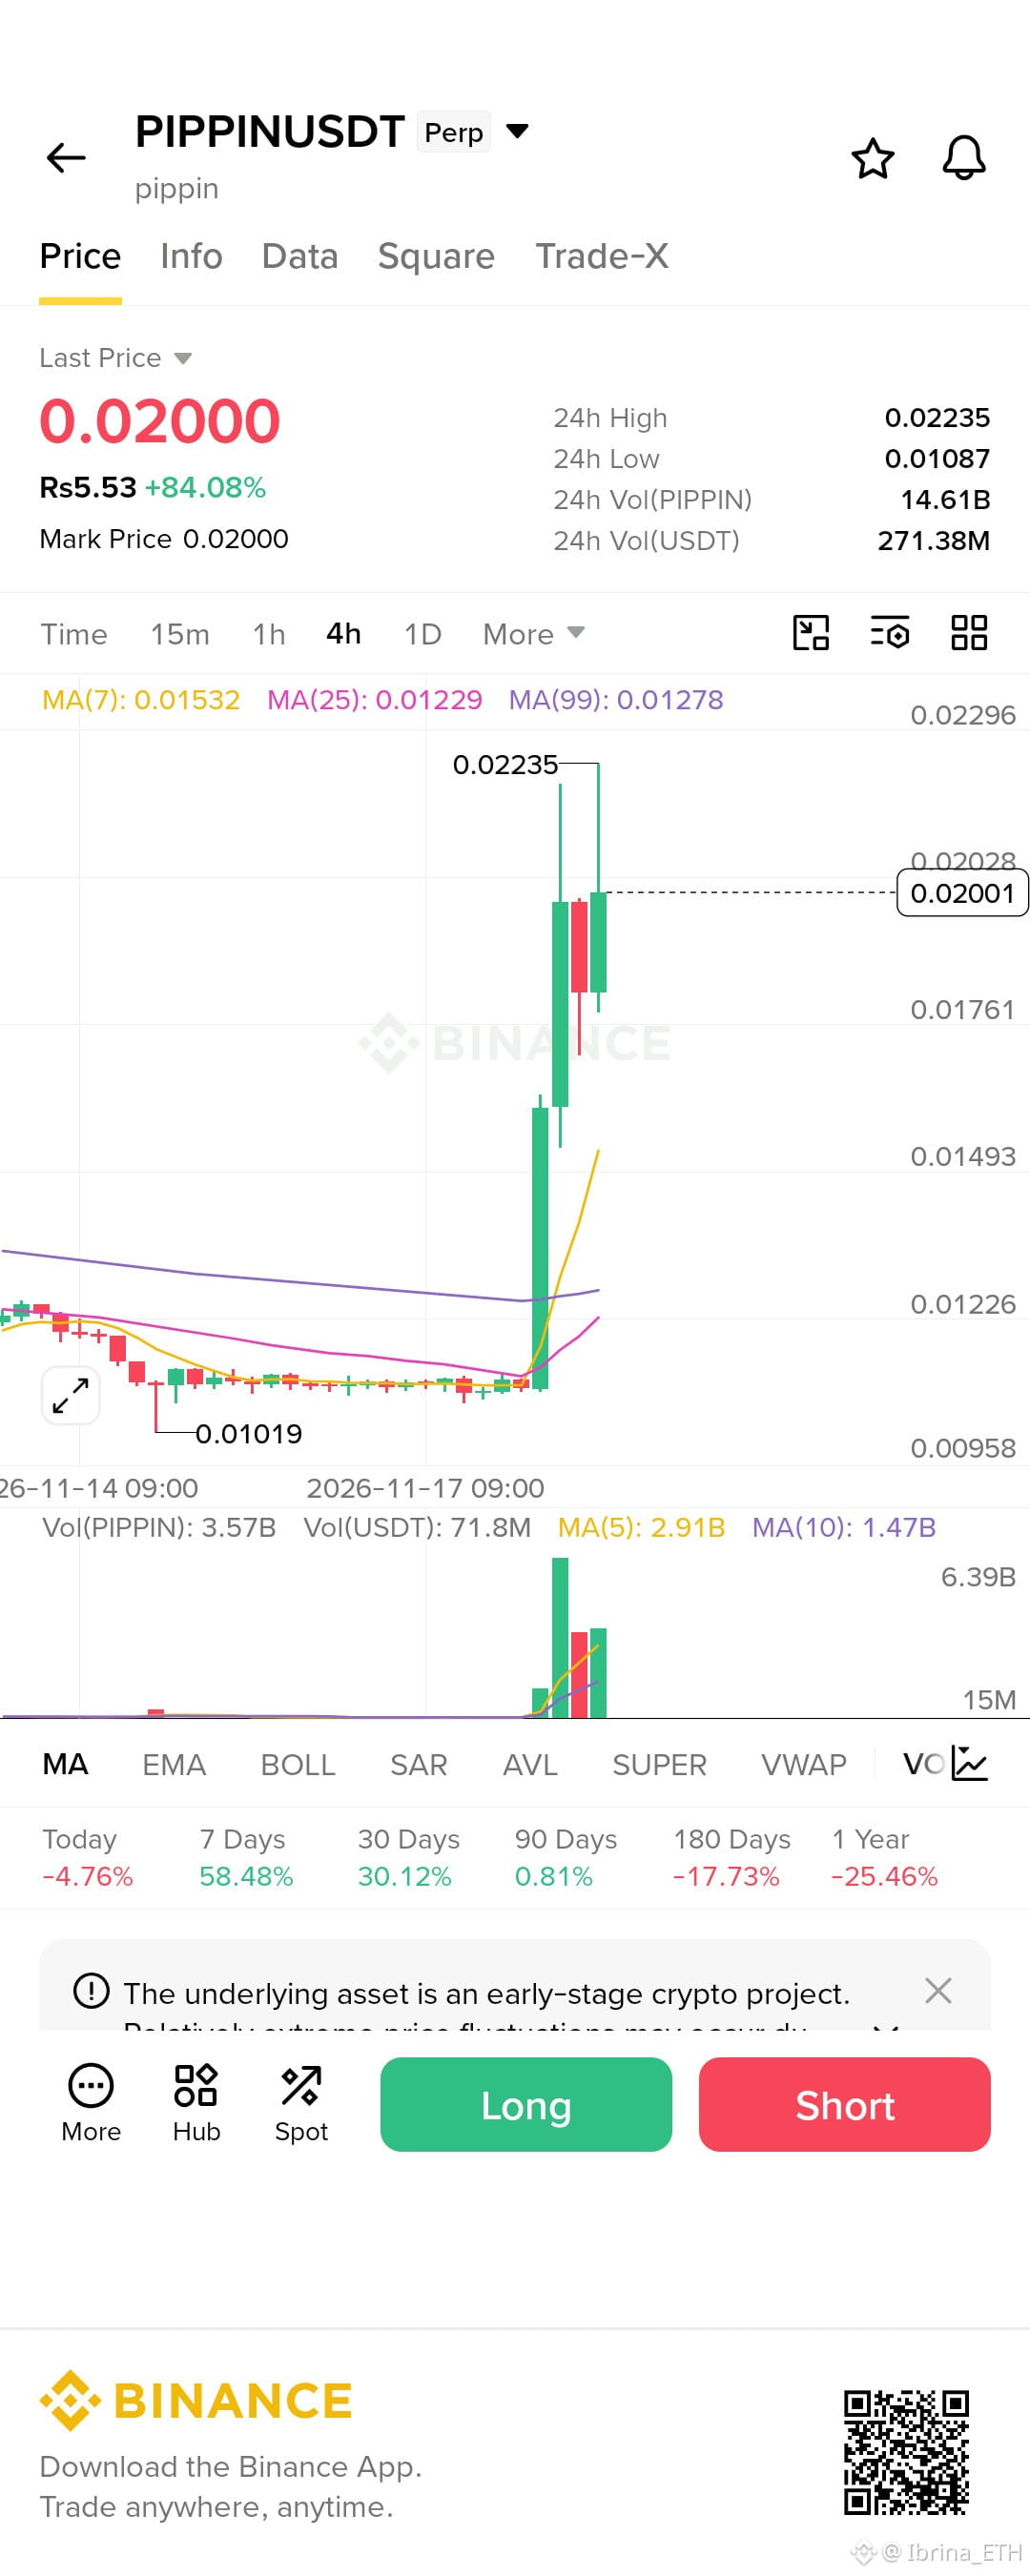
$PIPPIN is showing explosive bullish momentum on the 4H chart, currently trading around $0.02000, up 84.08% in 24 hours. Buyers have taken control after a strong breakout from the $0.0110 area. However, after such a sharp rally, a healthy pullback would not be surprising.
Technical Analysis: MA(7) is $0.01532, MA(25) $0.01229, and MA(99) $0.01278. Price is above all three averages, supporting a bullish trend. Volume has also increased significantly, confirming strong participation.
Key Levels: Immediate support: $0.01761. Major support: $0.01532. Resistance: $0.02028–$0.02235.
Bullish Scenario:
Entry: $0.01760–$0.01820
Confirmation: 4H candle holds above $0.01761.
Stop-Loss: $0.01490
TP1: $0.02028
TP2: $0.02235
TP3: $0.02300
Bearish Scenario:
Entry: $0.01750–$0.01700 after a confirmed breakdown and failed retest.
Confirmation: 4H candle closes below $0.01761.
Stop-Loss: $0.01830
TP1: $0.01532
TP2: $0.01278
TP3: $0.01100
My Plan: I would avoid chasing this pump and wait for a retest with strong buying volume. RSI and MACD are not displayed, so momentum confirmation is still needed. Risk only 0.5–1% per trade and avoid excessive leverage.
Overall Bias: BULLISH, but volatility is extremely high.
Do you think PIPPIN can break $0.02235, or is a correction coming first?
$PIPPIN
{future}(PIPPINUSDT)
$PIPPIN is showing explosive bullish momentum on the 4H chart, currently trading around $0.02000, up 84.08% in 24 hours. Buyers have taken control after a strong breakout from the $0.0110 area. However, after such a sharp rally, a healthy pullback would not be surprising.
Technical Analysis: MA(7) is $0.01532, MA(25) $0.01229, and MA(99) $0.01278. Price is above all three averages, supporting a bullish trend. Volume has also increased significantly, confirming strong participation.
Key Levels: Immediate support: $0.01761. Major support: $0.01532. Resistance: $0.02028–$0.02235.
Bullish Scenario:
Entry: $0.01760–$0.01820
Confirmation: 4H candle holds above $0.01761.
Stop-Loss: $0.01490
TP1: $0.02028
TP2: $0.02235
TP3: $0.02300
Bearish Scenario:
Entry: $0.01750–$0.01700 after a confirmed breakdown and failed retest.
Confirmation: 4H candle closes below $0.01761.
Stop-Loss: $0.01830
TP1: $0.01532
TP2: $0.01278
TP3: $0.01100
My Plan: I would avoid chasing this pump and wait for a retest with strong buying volume. RSI and MACD are not displayed, so momentum confirmation is still needed. Risk only 0.5–1% per trade and avoid excessive leverage.
Overall Bias: BULLISH, but volatility is extremely high.
Do you think PIPPIN can break $0.02235, or is a correction coming first?
$PIPPIN
Technical Analysis: MA(7) is $0.01532, MA(25) $0.01229, and MA(99) $0.01278. Price is above all three averages, supporting a bullish trend. Volume has also increased significantly, confirming strong participation.
Key Levels: Immediate support: $0.01761. Major support: $0.01532. Resistance: $0.02028–$0.02235.
Bullish Scenario:
Entry: $0.01760–$0.01820
Confirmation: 4H candle holds above $0.01761.
Stop-Loss: $0.01490
TP1: $0.02028
TP2: $0.02235
TP3: $0.02300
Bearish Scenario:
Entry: $0.01750–$0.01700 after a confirmed breakdown and failed retest.
Confirmation: 4H candle closes below $0.01761.
Stop-Loss: $0.01830
TP1: $0.01532
TP2: $0.01278
TP3: $0.01100
My Plan: I would avoid chasing this pump and wait for a retest with strong buying volume. RSI and MACD are not displayed, so momentum confirmation is still needed. Risk only 0.5–1% per trade and avoid excessive leverage.
Overall Bias: BULLISH, but volatility is extremely high.
Do you think PIPPIN can break $0.02235, or is a correction coming first?
$PIPPIN

536
·
--
🚨 The Fed is raising some serious concerns about the AI boom, and honestly, this is something investors should be paying attention to.
The latest FOMC minutes reveal growing worries about how much debt is building up behind the AI industry and what could happen if these massive investments don't deliver the returns everyone is expecting.
Here's what stands out:
• AI companies are taking on huge amounts of debt through complicated financial arrangements that aren't always easy to track.
• Hedge funds are using significant leverage, which could force them to sell assets quickly if markets start falling.
• Stock valuations are already extremely high, leaving plenty of room for a painful correction.
• Banks could have more exposure to risky private credit funds than investors realize.
• If forced selling begins, losses could spread across the wider financial system rather than staying limited to technology stocks.
And the timing makes things even more concerning.
The Fed estimates inflation at 3.6%, while almost all officials expect further rate increases.
Some policymakers have even discussed the possibility of raising rates by more than 25 basis points in December.
Think about what that means for companies that are already borrowing heavily to fund their AI ambitions.
Higher interest rates make borrowing more expensive, put pressure on cash flow, and make it harder for highly leveraged businesses to justify their massive spending.
The bigger concern isn't simply that AI stocks could fall.
It's what happens if the entire financial system has become too dependent on the success of the AI boom.
Because if expectations don't match reality, the consequences could reach much further than Silicon Valley or Wall Street.
The AI revolution may be real, but that doesn't mean every investment behind it is safe. And history has shown us what happens when too much debt meets unrealistic expectations.
$PIPPIN $MMT
🚨 The Fed is raising some serious concerns about the AI boom, and honestly, this is something investors should be paying attention to.
The latest FOMC minutes reveal growing worries about how much debt is building up behind the AI industry and what could happen if these massive investments don't deliver the returns everyone is expecting.
Here's what stands out:
• AI companies are taking on huge amounts of debt through complicated financial arrangements that aren't always easy to track.
• Hedge funds are using significant leverage, which could force them to sell assets quickly if markets start falling.
• Stock valuations are already extremely high, leaving plenty of room for a painful correction.
• Banks could have more exposure to risky private credit funds than investors realize.
• If forced selling begins, losses could spread across the wider financial system rather than staying limited to technology stocks.
And the timing makes things even more concerning.
The Fed estimates inflation at 3.6%, while almost all officials expect further rate increases.
Some policymakers have even discussed the possibility of raising rates by more than 25 basis points in December.
Think about what that means for companies that are already borrowing heavily to fund their AI ambitions.
Higher interest rates make borrowing more expensive, put pressure on cash flow, and make it harder for highly leveraged businesses to justify their massive spending.
The bigger concern isn't simply that AI stocks could fall.
It's what happens if the entire financial system has become too dependent on the success of the AI boom.
Because if expectations don't match reality, the consequences could reach much further than Silicon Valley or Wall Street.
The AI revolution may be real, but that doesn't mean every investment behind it is safe. And history has shown us what happens when too much debt meets unrealistic expectations.
$PIPPIN $MMT
The latest FOMC minutes reveal growing worries about how much debt is building up behind the AI industry and what could happen if these massive investments don't deliver the returns everyone is expecting.
Here's what stands out:
• AI companies are taking on huge amounts of debt through complicated financial arrangements that aren't always easy to track.
• Hedge funds are using significant leverage, which could force them to sell assets quickly if markets start falling.
• Stock valuations are already extremely high, leaving plenty of room for a painful correction.
• Banks could have more exposure to risky private credit funds than investors realize.
• If forced selling begins, losses could spread across the wider financial system rather than staying limited to technology stocks.
And the timing makes things even more concerning.
The Fed estimates inflation at 3.6%, while almost all officials expect further rate increases.
Some policymakers have even discussed the possibility of raising rates by more than 25 basis points in December.
Think about what that means for companies that are already borrowing heavily to fund their AI ambitions.
Higher interest rates make borrowing more expensive, put pressure on cash flow, and make it harder for highly leveraged businesses to justify their massive spending.
The bigger concern isn't simply that AI stocks could fall.
It's what happens if the entire financial system has become too dependent on the success of the AI boom.
Because if expectations don't match reality, the consequences could reach much further than Silicon Valley or Wall Street.
The AI revolution may be real, but that doesn't mean every investment behind it is safe. And history has shown us what happens when too much debt meets unrealistic expectations.
$PIPPIN $MMT
2
214
·
--
Honestly, it feels good to be part of something where your efforts as a creator are recognized.
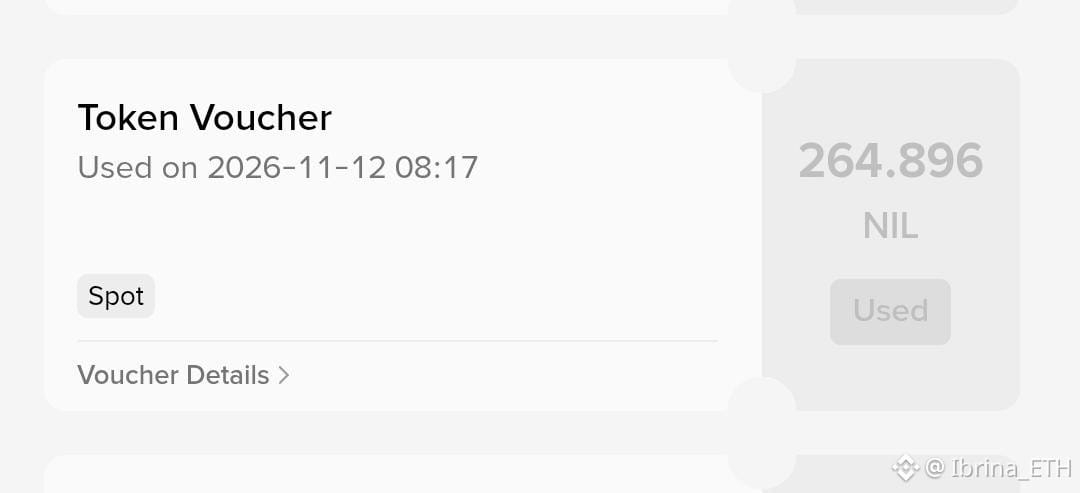
On November 12, I received a message from the NIL Creator Campaign team confirming that the campaign rewards had been distributed through Rewards Hub.
For me, it wasn't just about the rewards. It was also about being part of the campaign, creating content, sharing ideas, and experiencing the creator community.
I'm grateful for this opportunity and happy to have been part of it.
A big thank you to everyone behind the campaign. Looking forward to what's next! 🤝
#BinanceSquare #creatorpad #Binance
Honestly, it feels good to be part of something where your efforts as a creator are recognized.
On November 12, I received a message from the NIL Creator Campaign team confirming that the campaign rewards had been distributed through Rewards Hub.
For me, it wasn't just about the rewards. It was also about being part of the campaign, creating content, sharing ideas, and experiencing the creator community.
I'm grateful for this opportunity and happy to have been part of it.
A big thank you to everyone behind the campaign. Looking forward to what's next! 🤝
#BinanceSquare #creatorpad #Binance
On November 12, I received a message from the NIL Creator Campaign team confirming that the campaign rewards had been distributed through Rewards Hub.
For me, it wasn't just about the rewards. It was also about being part of the campaign, creating content, sharing ideas, and experiencing the creator community.
I'm grateful for this opportunity and happy to have been part of it.
A big thank you to everyone behind the campaign. Looking forward to what's next! 🤝
#BinanceSquare #creatorpad #Binance

1
2
220
·
--
🚨 BREAKING: Trump's reported $113M Bitcoin investment is raising some serious questions.
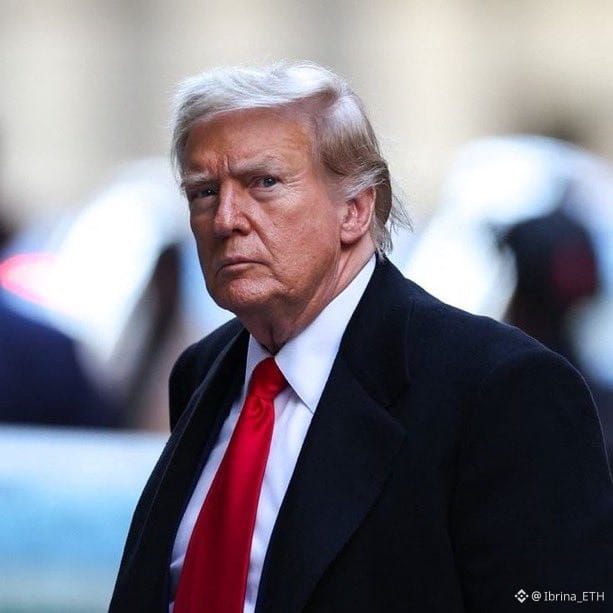
Reports claim that President Donald Trump bought around $113 million worth of Bitcoin in Q3.
But here's what has people talking...
Trump and his family's businesses have faced questions over the timing of some major investments and business moves.
Now, with such a huge amount of money reportedly going into Bitcoin, people are asking whether this was simply a big investment or whether someone had information about the market before everyone else.
Let's be clear: there is no proof of insider trading based on this claim alone.
But the timing is enough to raise questions, especially when we're talking about a sitting US president and investments worth millions.
Was this just a smart bet on Bitcoin, or is there more to the story?
One thing is certain: people deserve transparency when money, power, and politics come together. 👀
$INIT $BTC $TRUMP
#BREAKING #bitcoin #DonaldTrump #USPolitics #CryptoNews
{future}(TRUMPUSDT)
🚨 BREAKING: Trump's reported $113M Bitcoin investment is raising some serious questions.
Reports claim that President Donald Trump bought around $113 million worth of Bitcoin in Q3.
But here's what has people talking...
Trump and his family's businesses have faced questions over the timing of some major investments and business moves.
Now, with such a huge amount of money reportedly going into Bitcoin, people are asking whether this was simply a big investment or whether someone had information about the market before everyone else.
Let's be clear: there is no proof of insider trading based on this claim alone.
But the timing is enough to raise questions, especially when we're talking about a sitting US president and investments worth millions.
Was this just a smart bet on Bitcoin, or is there more to the story?
One thing is certain: people deserve transparency when money, power, and politics come together. 👀
$INIT $BTC $TRUMP
#BREAKING #bitcoin #DonaldTrump #USPolitics #CryptoNews
Reports claim that President Donald Trump bought around $113 million worth of Bitcoin in Q3.
But here's what has people talking...
Trump and his family's businesses have faced questions over the timing of some major investments and business moves.
Now, with such a huge amount of money reportedly going into Bitcoin, people are asking whether this was simply a big investment or whether someone had information about the market before everyone else.
Let's be clear: there is no proof of insider trading based on this claim alone.
But the timing is enough to raise questions, especially when we're talking about a sitting US president and investments worth millions.
Was this just a smart bet on Bitcoin, or is there more to the story?
One thing is certain: people deserve transparency when money, power, and politics come together. 👀
$INIT $BTC $TRUMP
#BREAKING #bitcoin #DonaldTrump #USPolitics #CryptoNews

1
2
1.1k
·
--
Рост
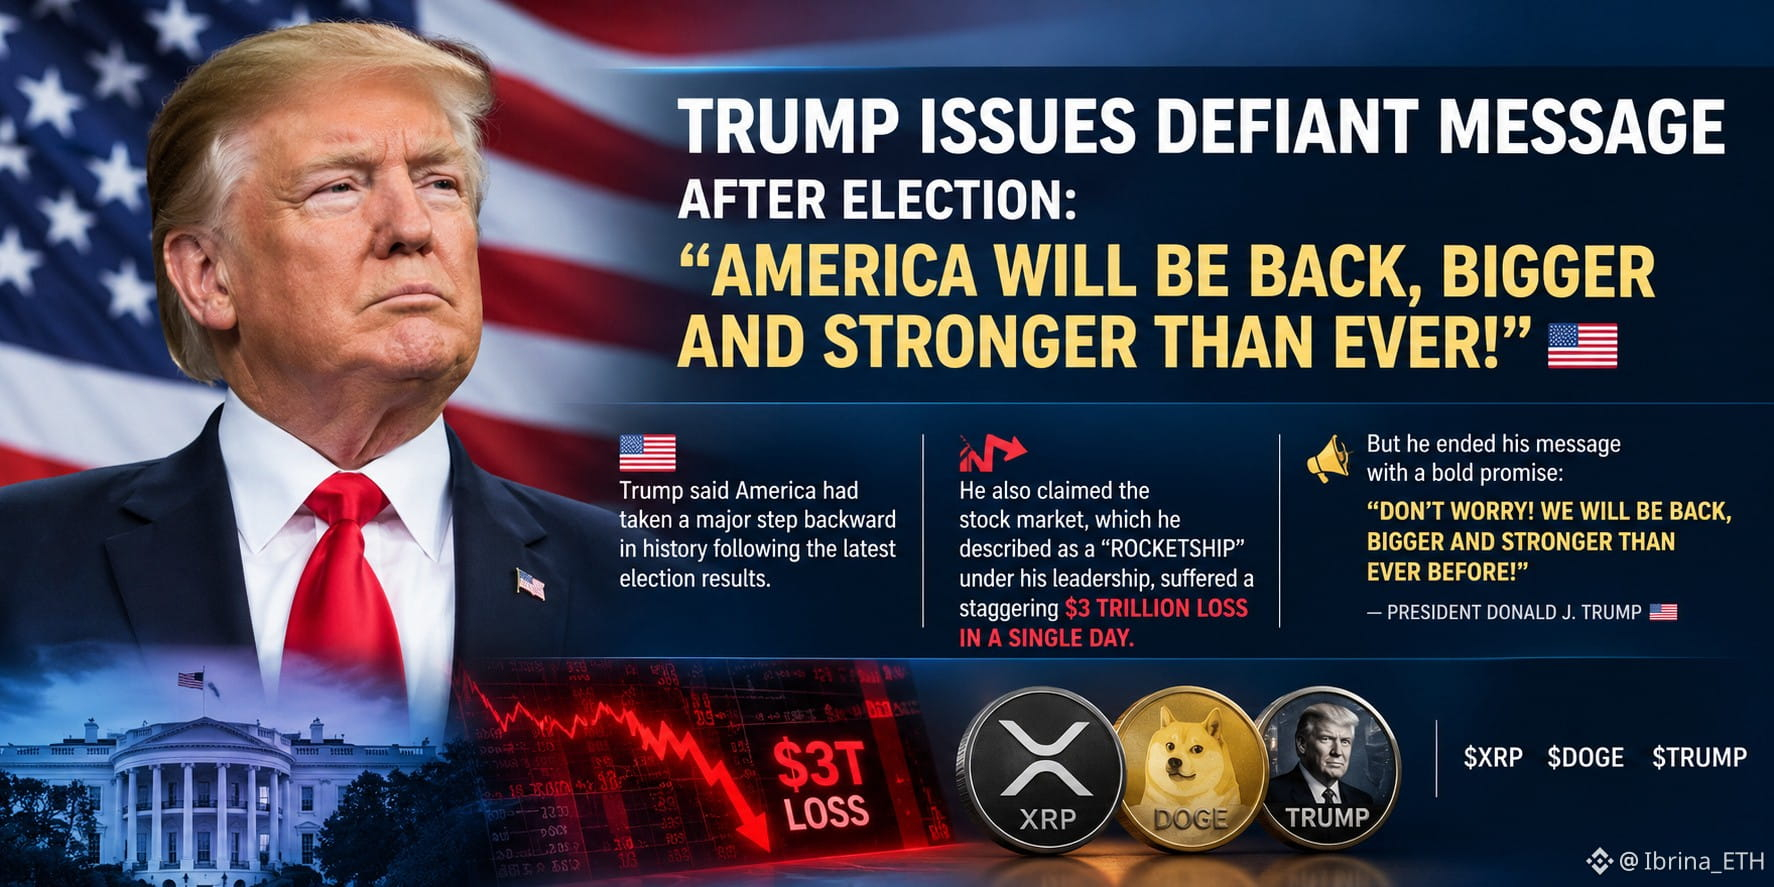
Trump has responded defiantly following the latest election results, saying that America may have taken a step backward, but this is far from the end.
He also pointed to the stock market, claiming it suffered a massive $3 trillion loss in a single day, despite what he described as a strong run under his leadership.
Still, his message ended on a determined note, making it clear that he isn't giving up.
“Don't worry! America will be back, bigger and stronger than ever before!”
A message of confidence, resilience, and a promise to keep fighting for the future. 🇺🇸
$XRP $JCT $TRUMP
#BREAKING #news #TRUMP
Trump has responded defiantly following the latest election results, saying that America may have taken a step backward, but this is far from the end.
He also pointed to the stock market, claiming it suffered a massive $3 trillion loss in a single day, despite what he described as a strong run under his leadership.
Still, his message ended on a determined note, making it clear that he isn't giving up.
“Don't worry! America will be back, bigger and stronger than ever before!”
A message of confidence, resilience, and a promise to keep fighting for the future. 🇺🇸
$XRP $JCT $TRUMP
#BREAKING #news #TRUMP
He also pointed to the stock market, claiming it suffered a massive $3 trillion loss in a single day, despite what he described as a strong run under his leadership.
Still, his message ended on a determined note, making it clear that he isn't giving up.
“Don't worry! America will be back, bigger and stronger than ever before!”
A message of confidence, resilience, and a promise to keep fighting for the future. 🇺🇸
$XRP $JCT $TRUMP
#BREAKING #news #TRUMP
1
1.1k
·
--
Рост
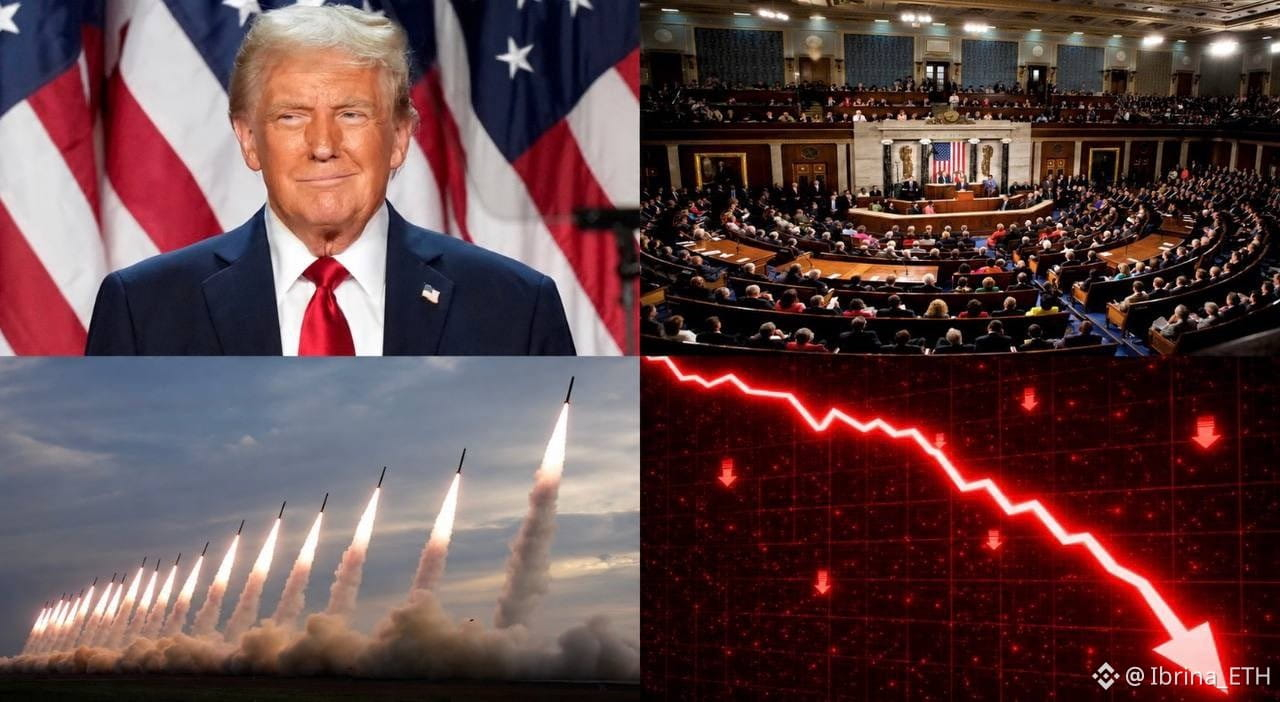
November 3 could bring more than just a political shake-up. It could become a major turning point for financial markets, and I think investors should be paying close attention.
The U.S. midterm elections are approaching, with prediction markets reportedly giving Democrats around a 70% chance of controlling both chambers of Congress. But the bigger question is what that outcome could mean for three important sectors.
First, AI stocks. Growing concerns about excessive AI spending, market valuations, and a proposed rejection of government bailouts could add further pressure to an already fragile sector.
Second, crypto. The CLARITY Act remains an important piece of legislation for the industry. Political changes in Congress could make negotiations more complicated, creating additional uncertainty around the regulatory future of digital assets.
Third, oil and geopolitics. Reports of possible renewed tensions involving Iran are another risk worth watching. Any escalation could disrupt energy supplies, push oil prices higher, and bring fresh inflation concerns.
What interests me most is how these three developments could connect. Political decisions, AI investment sentiment, crypto regulation, and energy prices may all influence the same market environment.
I'm not looking to predict the election outcome. I'm watching how markets react, where capital flows, and which sectors show strength or weakness once the uncertainty starts clearing.
Sometimes the biggest market moves come not from the event itself, but from how investors respond to the result.
$ARIA $IDOL $TRUMP
#BREAKING #news #TRUMP
November 3 could bring more than just a political shake-up. It could become a major turning point for financial markets, and I think investors should be paying close attention.
The U.S. midterm elections are approaching, with prediction markets reportedly giving Democrats around a 70% chance of controlling both chambers of Congress. But the bigger question is what that outcome could mean for three important sectors.
First, AI stocks. Growing concerns about excessive AI spending, market valuations, and a proposed rejection of government bailouts could add further pressure to an already fragile sector.
Second, crypto. The CLARITY Act remains an important piece of legislation for the industry. Political changes in Congress could make negotiations more complicated, creating additional uncertainty around the regulatory future of digital assets.
Third, oil and geopolitics. Reports of possible renewed tensions involving Iran are another risk worth watching. Any escalation could disrupt energy supplies, push oil prices higher, and bring fresh inflation concerns.
What interests me most is how these three developments could connect. Political decisions, AI investment sentiment, crypto regulation, and energy prices may all influence the same market environment.
I'm not looking to predict the election outcome. I'm watching how markets react, where capital flows, and which sectors show strength or weakness once the uncertainty starts clearing.
Sometimes the biggest market moves come not from the event itself, but from how investors respond to the result.
$ARIA $IDOL $TRUMP
#BREAKING #news #TRUMP
The U.S. midterm elections are approaching, with prediction markets reportedly giving Democrats around a 70% chance of controlling both chambers of Congress. But the bigger question is what that outcome could mean for three important sectors.
First, AI stocks. Growing concerns about excessive AI spending, market valuations, and a proposed rejection of government bailouts could add further pressure to an already fragile sector.
Second, crypto. The CLARITY Act remains an important piece of legislation for the industry. Political changes in Congress could make negotiations more complicated, creating additional uncertainty around the regulatory future of digital assets.
Third, oil and geopolitics. Reports of possible renewed tensions involving Iran are another risk worth watching. Any escalation could disrupt energy supplies, push oil prices higher, and bring fresh inflation concerns.
What interests me most is how these three developments could connect. Political decisions, AI investment sentiment, crypto regulation, and energy prices may all influence the same market environment.
I'm not looking to predict the election outcome. I'm watching how markets react, where capital flows, and which sectors show strength or weakness once the uncertainty starts clearing.
Sometimes the biggest market moves come not from the event itself, but from how investors respond to the result.
$ARIA $IDOL $TRUMP
#BREAKING #news #TRUMP
484
·
--
Рост
🚨 October 29 could become one of the most significant security events in crypto history.
Binance has reported an estimated $6.3 billion impact from a major security incident, potentially making it the largest crypto theft ever reported. Bitcoin briefly dropped below $77,000, while billions in market value disappeared as fear spread across the market.
What makes this situation even more serious is the scale of the response. Tether froze approximately $1.56 billion in related assets, Circle froze around $823 million, and Binance reported that roughly $3 billion had been frozen on-chain.
Binance says customer funds are safe and that it will cover all losses using its SAFU fund and company resources. Deposits and withdrawals were temporarily suspended while security checks and recovery efforts continued.
But I think the bigger lesson here goes beyond price action. Even the world's largest exchange isn't immune to security failures. Trust, transparency and asset protection matter just as much as liquidity and trading volume.
Bitcoin's resilience will be worth watching, but one relatively limited price reaction doesn't mean the risk is over. The real test now is whether Binance can fully restore confidence and demonstrate that customer assets remain protected.
For me, this is a reminder that security is one of crypto's biggest fundamentals.
$BTC $PARTI $BNB
#Binance #CryptoSecurity #safu
🚨 October 29 could become one of the most significant security events in crypto history.
Binance has reported an estimated $6.3 billion impact from a major security incident, potentially making it the largest crypto theft ever reported. Bitcoin briefly dropped below $77,000, while billions in market value disappeared as fear spread across the market.
What makes this situation even more serious is the scale of the response. Tether froze approximately $1.56 billion in related assets, Circle froze around $823 million, and Binance reported that roughly $3 billion had been frozen on-chain.
Binance says customer funds are safe and that it will cover all losses using its SAFU fund and company resources. Deposits and withdrawals were temporarily suspended while security checks and recovery efforts continued.
But I think the bigger lesson here goes beyond price action. Even the world's largest exchange isn't immune to security failures. Trust, transparency and asset protection matter just as much as liquidity and trading volume.
Bitcoin's resilience will be worth watching, but one relatively limited price reaction doesn't mean the risk is over. The real test now is whether Binance can fully restore confidence and demonstrate that customer assets remain protected.
For me, this is a reminder that security is one of crypto's biggest fundamentals.
$BTC $PARTI $BNB
#Binance #CryptoSecurity #safu
Binance has reported an estimated $6.3 billion impact from a major security incident, potentially making it the largest crypto theft ever reported. Bitcoin briefly dropped below $77,000, while billions in market value disappeared as fear spread across the market.
What makes this situation even more serious is the scale of the response. Tether froze approximately $1.56 billion in related assets, Circle froze around $823 million, and Binance reported that roughly $3 billion had been frozen on-chain.
Binance says customer funds are safe and that it will cover all losses using its SAFU fund and company resources. Deposits and withdrawals were temporarily suspended while security checks and recovery efforts continued.
But I think the bigger lesson here goes beyond price action. Even the world's largest exchange isn't immune to security failures. Trust, transparency and asset protection matter just as much as liquidity and trading volume.
Bitcoin's resilience will be worth watching, but one relatively limited price reaction doesn't mean the risk is over. The real test now is whether Binance can fully restore confidence and demonstrate that customer assets remain protected.
For me, this is a reminder that security is one of crypto's biggest fundamentals.
$BTC $PARTI $BNB
#Binance #CryptoSecurity #safu

2
405
·
--
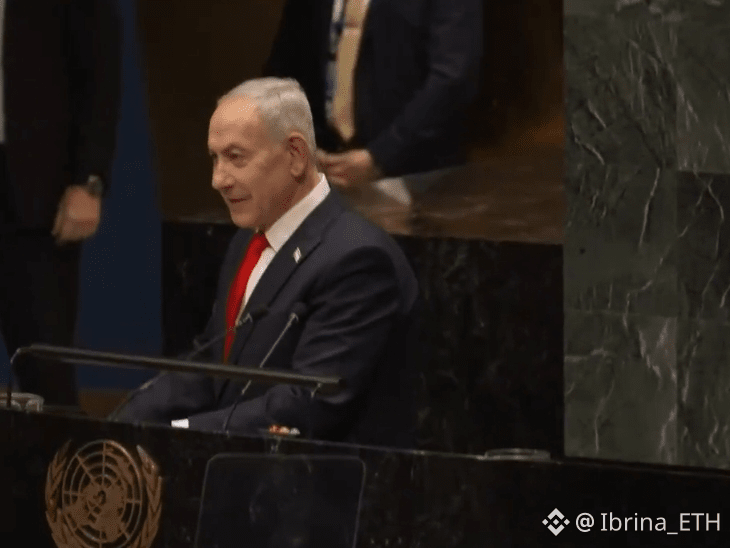
🚨 ISRAEL’S ELECTION COULD MATTER FAR BEYOND ISRAEL.
With tensions between Israel and Iran still in focus, the election outcome could influence how markets price the next phase of the conflict.
Here’s what I’m watching:
🇮🇱 If Netanyahu loses: Markets may start pricing in hopes of de-escalation. Oil could come under pressure, while stocks and crypto could benefit from improving risk sentiment.
🇮🇱 If Netanyahu wins: If investors interpret the result as a sign of continued confrontation, oil could move higher and risk assets could face renewed selling pressure.
But there’s a catch: the election result alone won’t determine the market’s direction. What matters is whether it changes the actual risk of military escalation, oil supply disruptions, or the chances of diplomatic progress.
For crypto, I’ll be watching Bitcoin’s reaction alongside crude oil and broader market sentiment. A headline-driven rally can reverse quickly if tensions rise again.
The real question isn’t just who wins the election it’s what happens next.
Stay focused on the facts, manage risk, and don’t trade headlines blindly.
$AIN $SNDK $BTC
#BREAKING #bitcoin
{future}(BTCUSDT)
🚨 ISRAEL’S ELECTION COULD MATTER FAR BEYOND ISRAEL.
With tensions between Israel and Iran still in focus, the election outcome could influence how markets price the next phase of the conflict.
Here’s what I’m watching:
🇮🇱 If Netanyahu loses: Markets may start pricing in hopes of de-escalation. Oil could come under pressure, while stocks and crypto could benefit from improving risk sentiment.
🇮🇱 If Netanyahu wins: If investors interpret the result as a sign of continued confrontation, oil could move higher and risk assets could face renewed selling pressure.
But there’s a catch: the election result alone won’t determine the market’s direction. What matters is whether it changes the actual risk of military escalation, oil supply disruptions, or the chances of diplomatic progress.
For crypto, I’ll be watching Bitcoin’s reaction alongside crude oil and broader market sentiment. A headline-driven rally can reverse quickly if tensions rise again.
The real question isn’t just who wins the election it’s what happens next.
Stay focused on the facts, manage risk, and don’t trade headlines blindly.
$AIN $SNDK $BTC
#BREAKING #bitcoin
With tensions between Israel and Iran still in focus, the election outcome could influence how markets price the next phase of the conflict.
Here’s what I’m watching:
🇮🇱 If Netanyahu loses: Markets may start pricing in hopes of de-escalation. Oil could come under pressure, while stocks and crypto could benefit from improving risk sentiment.
🇮🇱 If Netanyahu wins: If investors interpret the result as a sign of continued confrontation, oil could move higher and risk assets could face renewed selling pressure.
But there’s a catch: the election result alone won’t determine the market’s direction. What matters is whether it changes the actual risk of military escalation, oil supply disruptions, or the chances of diplomatic progress.
For crypto, I’ll be watching Bitcoin’s reaction alongside crude oil and broader market sentiment. A headline-driven rally can reverse quickly if tensions rise again.
The real question isn’t just who wins the election it’s what happens next.
Stay focused on the facts, manage risk, and don’t trade headlines blindly.
$AIN $SNDK $BTC
#BREAKING #bitcoin
1
928
·
--
🚨 $ETH THE RECOVERY IS FACING RESISTANCE
ETH is trading around $2,350 on the 1H chart after bouncing from $2,281. The recovery was strong initially, but price has now pulled back from the $2,366 area, and sellers are starting to show up again.
The 7 MA is near $2,359.85, the 25 MA is around $2,352.89, and the 99 MA sits much higher at $2,404.94. Price is struggling around the short-term averages and remains below the 99 MA, so I’m not calling this a bullish reversal yet.
My trade plan 👇
📍 Long entry: $2,335–$2,345, if support holds and buyers confirm
🟢 Support: $2,335, $2,305, $2,281
🔴 Resistance: $2,353–$2,367, $2,397, $2,405
🛑 Stop-loss: $2,318
🎯 Target 1: $2,367
🎯 Target 2: $2,397
🎯 Target 3: $2,405, if momentum continues
What I’m watching:
If ETH holds $2,335 and reclaims $2,367, buyers could push toward $2,397–$2,405.
But if $2,335 breaks, I’d expect another test of $2,305. Losing $2,281 would weaken the recovery further.
Risk-to-reward: From a $2,340 entry with a $2,318 stop, the approximate ratios are 1:1.2 to Target 1, 1:2.6 to Target 2, and 1:3 to Target 3, before fees and slippage.
Risk management: I’d risk no more than 1% of my trading capital and size the position according to the stop-loss distance.
Invalidation: A move below $2,318 invalidates this particular long setup.
For now, I want to see ETH reclaim resistance before getting confident. If support fails, I’d rather stay patient than force a long.
Based on the provided 1H chart. Levels are planning scenarios, not guaranteed outcomes. DYOR Not financial advice.
{future}(ETHUSDT)
🚨 $ETH THE RECOVERY IS FACING RESISTANCE
ETH is trading around $2,350 on the 1H chart after bouncing from $2,281. The recovery was strong initially, but price has now pulled back from the $2,366 area, and sellers are starting to show up again.
The 7 MA is near $2,359.85, the 25 MA is around $2,352.89, and the 99 MA sits much higher at $2,404.94. Price is struggling around the short-term averages and remains below the 99 MA, so I’m not calling this a bullish reversal yet.
My trade plan 👇
📍 Long entry: $2,335–$2,345, if support holds and buyers confirm
🟢 Support: $2,335, $2,305, $2,281
🔴 Resistance: $2,353–$2,367, $2,397, $2,405
🛑 Stop-loss: $2,318
🎯 Target 1: $2,367
🎯 Target 2: $2,397
🎯 Target 3: $2,405, if momentum continues
What I’m watching:
If ETH holds $2,335 and reclaims $2,367, buyers could push toward $2,397–$2,405.
But if $2,335 breaks, I’d expect another test of $2,305. Losing $2,281 would weaken the recovery further.
Risk-to-reward: From a $2,340 entry with a $2,318 stop, the approximate ratios are 1:1.2 to Target 1, 1:2.6 to Target 2, and 1:3 to Target 3, before fees and slippage.
Risk management: I’d risk no more than 1% of my trading capital and size the position according to the stop-loss distance.
Invalidation: A move below $2,318 invalidates this particular long setup.
For now, I want to see ETH reclaim resistance before getting confident. If support fails, I’d rather stay patient than force a long.
Based on the provided 1H chart. Levels are planning scenarios, not guaranteed outcomes. DYOR Not financial advice.
ETH is trading around $2,350 on the 1H chart after bouncing from $2,281. The recovery was strong initially, but price has now pulled back from the $2,366 area, and sellers are starting to show up again.
The 7 MA is near $2,359.85, the 25 MA is around $2,352.89, and the 99 MA sits much higher at $2,404.94. Price is struggling around the short-term averages and remains below the 99 MA, so I’m not calling this a bullish reversal yet.
My trade plan 👇
📍 Long entry: $2,335–$2,345, if support holds and buyers confirm
🟢 Support: $2,335, $2,305, $2,281
🔴 Resistance: $2,353–$2,367, $2,397, $2,405
🛑 Stop-loss: $2,318
🎯 Target 1: $2,367
🎯 Target 2: $2,397
🎯 Target 3: $2,405, if momentum continues
What I’m watching:
If ETH holds $2,335 and reclaims $2,367, buyers could push toward $2,397–$2,405.
But if $2,335 breaks, I’d expect another test of $2,305. Losing $2,281 would weaken the recovery further.
Risk-to-reward: From a $2,340 entry with a $2,318 stop, the approximate ratios are 1:1.2 to Target 1, 1:2.6 to Target 2, and 1:3 to Target 3, before fees and slippage.
Risk management: I’d risk no more than 1% of my trading capital and size the position according to the stop-loss distance.
Invalidation: A move below $2,318 invalidates this particular long setup.
For now, I want to see ETH reclaim resistance before getting confident. If support fails, I’d rather stay patient than force a long.
Based on the provided 1H chart. Levels are planning scenarios, not guaranteed outcomes. DYOR Not financial advice.
357
·
--
🚨 A CRITICAL WEEK IS COMING FOR GLOBAL MARKETS.
The next 5 days could bring serious volatility across stocks, gold, oil, and crypto.
Here’s what traders need to watch
MONDAY: U.S. markets reopen after Trump's warning of another strike on Iran. Brent crude oil is already near $117.
TUESDAY: Jobs, housing, and consumer confidence data.
WEDNESDAY: Fed rate decision and Kevin Warsh’s press conference. The key question: could higher rates stay for longer?
🔥 THURSDAY: U.S. GDP and PCE inflation data. Any upside surprise could fuel inflation fears.
🇯🇵 FRIDAY: Japan’s unemployment data and U.S. wage inflation figures.
WHY IT MATTERS:
Oil prices are rising, inflation risks remain, and concerns over AI spending are adding pressure.
If inflation comes in hotter than expected and the Fed takes a more hawkish stance, risk assets could face another wave of selling.
For crypto traders, the next move may depend on inflation, Fed guidance, and geopolitical headlines.
Stay alert. Manage risk. Don't let volatility make your decisions for you.
One week. Major catalysts. No room for blind bets.
$JCT $TRUMP
#BREAKING #news #TRUMP
🚨 A CRITICAL WEEK IS COMING FOR GLOBAL MARKETS.
The next 5 days could bring serious volatility across stocks, gold, oil, and crypto.
Here’s what traders need to watch
MONDAY: U.S. markets reopen after Trump's warning of another strike on Iran. Brent crude oil is already near $117.
TUESDAY: Jobs, housing, and consumer confidence data.
WEDNESDAY: Fed rate decision and Kevin Warsh’s press conference. The key question: could higher rates stay for longer?
🔥 THURSDAY: U.S. GDP and PCE inflation data. Any upside surprise could fuel inflation fears.
🇯🇵 FRIDAY: Japan’s unemployment data and U.S. wage inflation figures.
WHY IT MATTERS:
Oil prices are rising, inflation risks remain, and concerns over AI spending are adding pressure.
If inflation comes in hotter than expected and the Fed takes a more hawkish stance, risk assets could face another wave of selling.
For crypto traders, the next move may depend on inflation, Fed guidance, and geopolitical headlines.
Stay alert. Manage risk. Don't let volatility make your decisions for you.
One week. Major catalysts. No room for blind bets.
$JCT $TRUMP
#BREAKING #news #TRUMP
The next 5 days could bring serious volatility across stocks, gold, oil, and crypto.
Here’s what traders need to watch
MONDAY: U.S. markets reopen after Trump's warning of another strike on Iran. Brent crude oil is already near $117.
TUESDAY: Jobs, housing, and consumer confidence data.
WEDNESDAY: Fed rate decision and Kevin Warsh’s press conference. The key question: could higher rates stay for longer?
🔥 THURSDAY: U.S. GDP and PCE inflation data. Any upside surprise could fuel inflation fears.
🇯🇵 FRIDAY: Japan’s unemployment data and U.S. wage inflation figures.
WHY IT MATTERS:
Oil prices are rising, inflation risks remain, and concerns over AI spending are adding pressure.
If inflation comes in hotter than expected and the Fed takes a more hawkish stance, risk assets could face another wave of selling.
For crypto traders, the next move may depend on inflation, Fed guidance, and geopolitical headlines.
Stay alert. Manage risk. Don't let volatility make your decisions for you.
One week. Major catalysts. No room for blind bets.
$JCT $TRUMP
#BREAKING #news #TRUMP
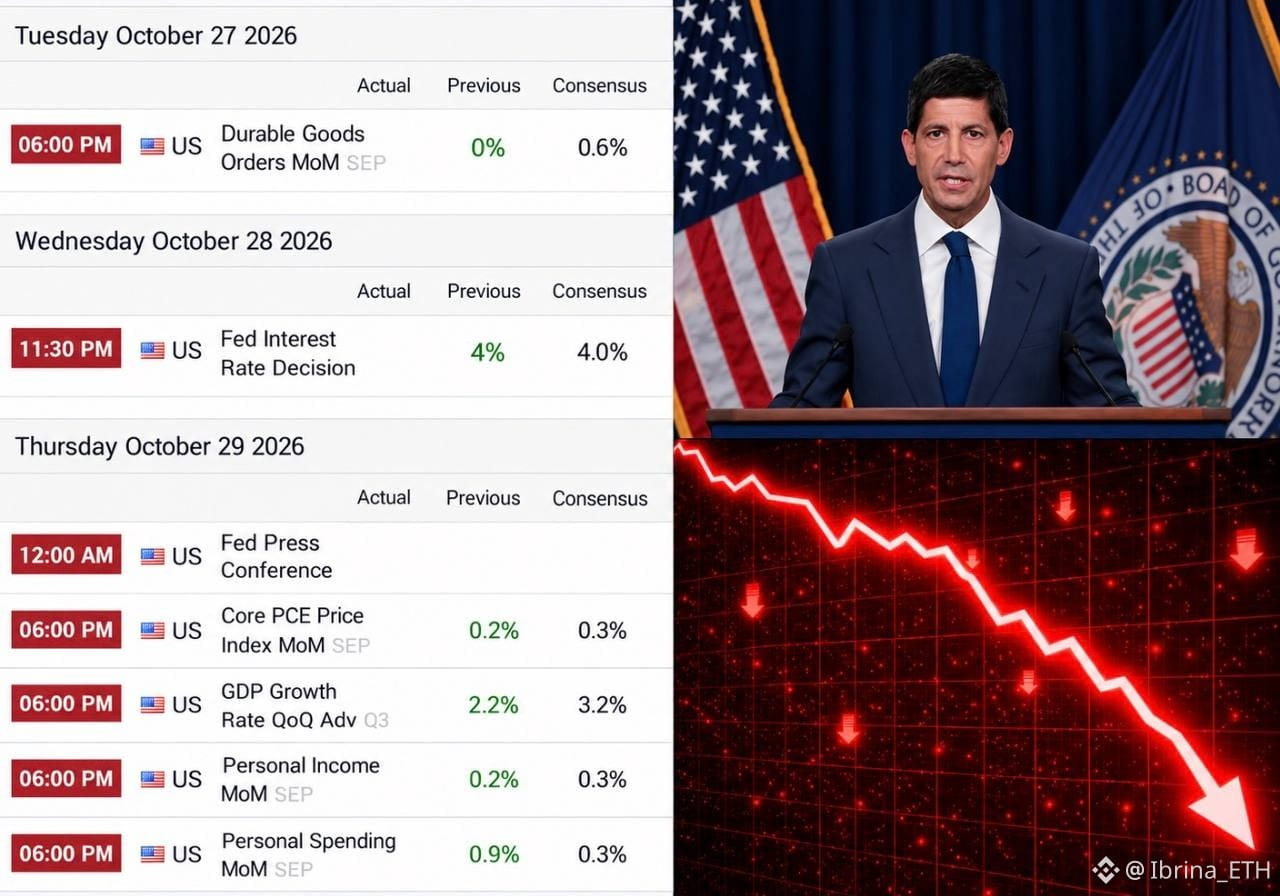
248
·
--
🚨 Trump is reportedly preparing a plan to crack down on crypto scammers targeting Americans.
Crypto was built on the idea of financial freedom, but scammers continue to exploit that freedom to steal people's hard-earned money.
Fake investment platforms, phishing attacks, and fraudulent schemes have damaged trust in the industry and left many investors with painful losses.
If this plan leads to stronger enforcement and real consequences for fraudsters, it could be a meaningful step toward making the crypto space safer.
But the real question is: What actions will the administration actually take, and how far will this crackdown go?
The industry doesn't just need promises. It needs effective enforcement, better investor protection, and accountability for those who use crypto to commit fraud.
Protecting users is essential for building long-term trust and bringing more people into the market.
Until then, stay alert. Verify platforms before investing, never trust guaranteed returns, and think twice before sending funds to anyone.
Crypto needs innovation, but it also needs accountability. 🔒🇺🇸
$JCT $ORDER $TRUMP
#BREAKING #news #TRUMP
🚨 Trump is reportedly preparing a plan to crack down on crypto scammers targeting Americans.
Crypto was built on the idea of financial freedom, but scammers continue to exploit that freedom to steal people's hard-earned money.
Fake investment platforms, phishing attacks, and fraudulent schemes have damaged trust in the industry and left many investors with painful losses.
If this plan leads to stronger enforcement and real consequences for fraudsters, it could be a meaningful step toward making the crypto space safer.
But the real question is: What actions will the administration actually take, and how far will this crackdown go?
The industry doesn't just need promises. It needs effective enforcement, better investor protection, and accountability for those who use crypto to commit fraud.
Protecting users is essential for building long-term trust and bringing more people into the market.
Until then, stay alert. Verify platforms before investing, never trust guaranteed returns, and think twice before sending funds to anyone.
Crypto needs innovation, but it also needs accountability. 🔒🇺🇸
$JCT $ORDER $TRUMP
#BREAKING #news #TRUMP
Crypto was built on the idea of financial freedom, but scammers continue to exploit that freedom to steal people's hard-earned money.
Fake investment platforms, phishing attacks, and fraudulent schemes have damaged trust in the industry and left many investors with painful losses.
If this plan leads to stronger enforcement and real consequences for fraudsters, it could be a meaningful step toward making the crypto space safer.
But the real question is: What actions will the administration actually take, and how far will this crackdown go?
The industry doesn't just need promises. It needs effective enforcement, better investor protection, and accountability for those who use crypto to commit fraud.
Protecting users is essential for building long-term trust and bringing more people into the market.
Until then, stay alert. Verify platforms before investing, never trust guaranteed returns, and think twice before sending funds to anyone.
Crypto needs innovation, but it also needs accountability. 🔒🇺🇸
$JCT $ORDER $TRUMP
#BREAKING #news #TRUMP
1
851
·
--
FUCKTOBER STRIKES AGAIN: $220M LIQUIDATED IN 15 MINUTES!
🚨BREAKING🚨
$BTC below $80,000
$ETH below $2,350
$SOL below $100
$XRP below $1.30
$220 MILLION in longs liquidated in just 15 minutes.
All of this came right after reports that the US military is fully prepared to attack Iran.
OCTOBER TURNED INTO FUCKTOBER.
$ORDER
#BREAKING #news
FUCKTOBER STRIKES AGAIN: $220M LIQUIDATED IN 15 MINUTES!
🚨BREAKING🚨
$BTC below $80,000
$ETH below $2,350
$SOL below $100
$XRP below $1.30
$220 MILLION in longs liquidated in just 15 minutes.
All of this came right after reports that the US military is fully prepared to attack Iran.
OCTOBER TURNED INTO FUCKTOBER.
$ORDER
#BREAKING #news
🚨BREAKING🚨
$BTC below $80,000
$ETH below $2,350
$SOL below $100
$XRP below $1.30
$220 MILLION in longs liquidated in just 15 minutes.
All of this came right after reports that the US military is fully prepared to attack Iran.
OCTOBER TURNED INTO FUCKTOBER.
$ORDER
#BREAKING #news
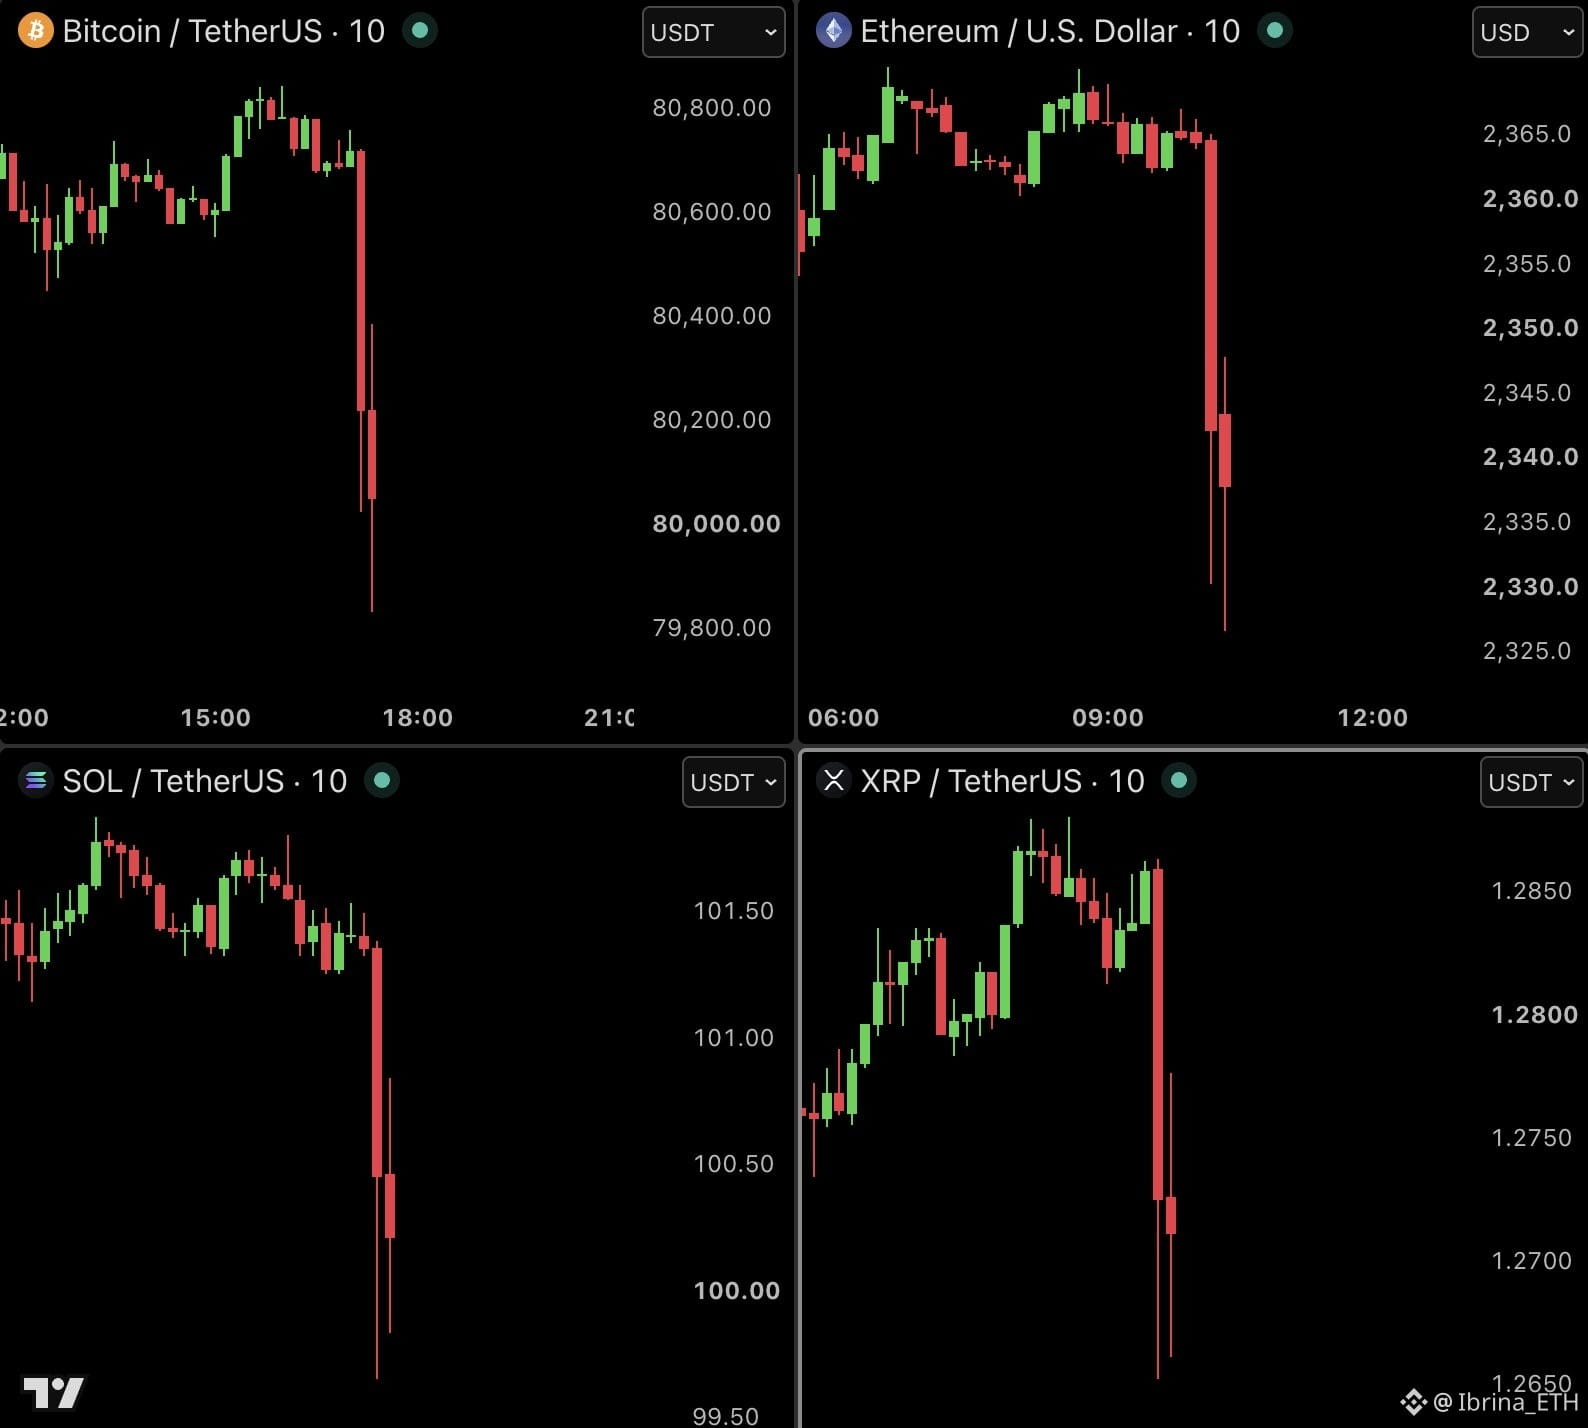
1
188
Войдите, чтобы посмотреть больше материала
Присоединяйтесь к пользователям криптовалют по всему миру на Binance Square
⚡️ Получайте новейшую и полезную информацию о криптоактивах.
💬 Нам доверяет крупнейшая в мире криптобиржа.
👍 Получите достоверные аналитические данные от верифицированных создателей контента.
Эл. почта/номер телефона
В тренде
BTCReboundsAbove$60KAmidWhaleDipBuying
Просмотров: 34,591
201 обсуждают
Abraxas Capital, Other Whales Buy the BTC Dip as Bitcoin Briefly Reclaims $60,000
Binance News
·Лайков: 31
·Просмотров: 49.2k
SolanaSets2027RoadmapToDoubleComputeCapacity
Просмотров: 18,264
490 обсуждают
CaliforniaNvidiaProbeExaminesPotentialCriminalViolations
Просмотров: 5,205
66 обсуждают