Binance Square
iamcryptoprince
21 Публикации

iamcryptoprince

Let's trade
0 подписок(и/а)
1 подписчиков(а)
1 понравилось
Посты
PINNED
·
--
Статья
Learn 11 indicators1st = RSI Rsi shows strength of price movement. Setting Set RSI to 7 14 20 (for all charts) Signals : (14 and 20 is for understanding and longterm.RSI 7 is enough for daytrading) 1 : Short trade 3 and 15 mint charts 2 : Med trade 1 hour 4 hour 1 day charts 3 : Long trade week month charts Use : Buy near 7 in RSI 7 and sell near 70 to 90 or as per market situation. 2nd = EMA/MA EMA shows trend direction. Setting : Set EMA or MA to 7 50 200 400 (for all charts) Signals : (Usually 7 and 50 are enough for understanding,daytrading and mid term trading,check if candles are below or above,if below EMA then market may go down.If above then market may go up) Use : 1 : Short trade 7 2 : Med trade 50 3 : Long trade 200 400 3rd = Boll BOLL is a volatility indicator and It has 3 lines. Lines : Middle line: moving average (usually 20 SMA) Upper band: middle + volatility Lower band: middle − volatility Use : Price near upper band → overbought (may drop) Price near lower band → oversold (may rise) Bands widen → high volatility Bands tight → market is calm, breakout coming Used for spotting trend strength + entry/exit timing. Settings (Use default for all type of charts. Length: 20 Source: Close Std Dev: 2 4rth = SAR SAR shows trend direction and it's dots appear above or below price Signals : Dots below price → uptrend (buy pressure) Dots above price → downtrend (sell pressure) Dot flips → possible trend change Use: Good for entry/exit timing, especially in trending markets. Settings (Use default for all charts) Step: 0.02 Maximum: 0.2 5th = AVL AVL shows average trading volume over time and helps confirm strength of price moves. Signals : Volume above line = real movement, below = weak movement. Breakout + high volume above AVL → strong buy signal Setting (Use default for all charts) 6th = Super Super shows trend direction using ATR (volatility) Signals : Line below price (green) → BUY trend Line above price (red) → SELL trend Flip = possible trend change Use : Follow trend only.Its good for entry/exit in strong moves but avoid in sideways market. Setting (Use default) 7th = MACD MACD shows momentum + trend strength Main parts : 1 : MACD line 2 : Signal line 3 : Histogram (bars) Signals: MACD crosses above signal → BUY MACD crosses below signal → SELL Histogram growing → strong trend Histogram shrinking → weak trend / reversal coming Settings (Use default): Fast Length: 12 Slow Length: 26 Signal Smoothing: 9 8th = KDJ KDJ shows overbought / oversold + momentum Lines : K line = fast D line = slow J line = strongest signal (moves fastest) Signals : K crosses above D → BUY K crosses below D → SELL J above 100 → overbought J below 0 → oversold Use : Good for short-term entries, but avoid alone in sideways market. Setting (Use default) K period: 9 D period: 3 J period: 3 9th = OBV OBV shows volume flow (buying vs selling pressure) Signals : OBV rising → buying pressure (bullish) OBV falling → selling pressure (bearish) Price up + OBV up → strong trend Price up + OBV flat/down → weak move (fake breakout risk) Use : Confirm trend strength,not for entry alone. Setting (Use default) 10th = WR Williams %R shows overbought / oversold levels (momentum) Signals : Above -20 → overbought (sell zone) Below -80 → oversold (buy zone) Moving up from -80 → possible buy Moving down from -20 → possible sell Settings (Use default) Period: 14 11th = Stockrsi Stockrsi shows overbought / oversold condition. Signals : Above 70 → overbought (sell zone) Below 30 → oversold (buy zone) 50 line → trend strength (above = bullish, below = bearish) Use : Best for confirming entries, not alone for trading. Setting (Use default) Period: 14 If anything is missing inform me and i 'll add it.thank you #iamcryptoprince

Learn 11 indicators

1st = RSI
Rsi shows strength of price movement.
Setting
Set RSI to
7
14
20
(for all charts)
Signals :
(14 and 20 is for understanding and longterm.RSI 7 is enough for daytrading)
1 : Short trade 3 and 15 mint charts
2 : Med trade 1 hour 4 hour 1 day charts
3 : Long trade week month charts
Use :
Buy near 7 in RSI 7 and sell near 70 to 90 or as per market situation.
2nd = EMA/MA
EMA shows trend direction.
Setting :
Set EMA or MA to
7
50
200
400
(for all charts)
Signals :
(Usually 7 and 50 are enough for understanding,daytrading and mid term trading,check if candles are below or above,if below EMA then market may go down.If above then market may go up)
Use :
1 : Short trade 7
2 : Med trade 50
3 : Long trade 200 400
3rd = Boll
BOLL is a volatility indicator and It has 3 lines.
Lines :
Middle line: moving average (usually 20 SMA)
Upper band: middle + volatility
Lower band: middle − volatility
Use :
Price near upper band → overbought (may drop)
Price near lower band → oversold (may rise)
Bands widen → high volatility
Bands tight → market is calm, breakout coming
Used for spotting trend strength + entry/exit timing.
Settings (Use default for all type of charts.
Length: 20
Source: Close
Std Dev: 2
4rth = SAR
SAR shows trend direction and it's dots appear above or below price
Signals :
Dots below price → uptrend (buy pressure)
Dots above price → downtrend (sell pressure)
Dot flips → possible trend change
Use:
Good for entry/exit timing, especially in trending markets.
Settings (Use default for all charts)
Step: 0.02
Maximum: 0.2
5th = AVL
AVL shows average trading volume over time and helps confirm strength of price moves.
Signals :
Volume above line = real movement, below = weak movement.
Breakout + high volume above AVL → strong buy signal
Setting (Use default for all charts)
6th = Super
Super shows trend direction using ATR (volatility)
Signals :
Line below price (green) → BUY trend
Line above price (red) → SELL trend
Flip = possible trend change
Use :
Follow trend only.Its good for entry/exit in strong moves but avoid in sideways market.
Setting (Use default)
7th = MACD
MACD shows momentum + trend strength
Main parts :
1 : MACD line
2 : Signal line
3 : Histogram (bars)
Signals:
MACD crosses above signal → BUY
MACD crosses below signal → SELL
Histogram growing → strong trend
Histogram shrinking → weak trend / reversal coming
Settings (Use default):
Fast Length: 12
Slow Length: 26
Signal Smoothing: 9
8th = KDJ
KDJ shows overbought / oversold + momentum
Lines :
K line = fast
D line = slow
J line = strongest signal (moves fastest)
Signals :
K crosses above D → BUY
K crosses below D → SELL
J above 100 → overbought
J below 0 → oversold
Use :
Good for short-term entries, but avoid alone in sideways market.
Setting (Use default)
K period: 9
D period: 3
J period: 3
9th = OBV
OBV shows volume flow (buying vs selling pressure)
Signals :
OBV rising → buying pressure (bullish)
OBV falling → selling pressure (bearish)
Price up + OBV up → strong trend
Price up + OBV flat/down → weak move (fake breakout risk)
Use :
Confirm trend strength,not for entry alone.
Setting (Use default)
10th = WR
Williams %R shows overbought / oversold levels (momentum)
Signals :
Above -20 → overbought (sell zone)
Below -80 → oversold (buy zone)
Moving up from -80 → possible buy
Moving down from -20 → possible sell
Settings (Use default)
Period: 14
11th = Stockrsi
Stockrsi shows overbought / oversold condition.
Signals :
Above 70 → overbought (sell zone)
Below 30 → oversold (buy zone)
50 line → trend strength (above = bullish, below = bearish)
Use :
Best for confirming entries, not alone for trading.
Setting (Use default)
Period: 14
If anything is missing inform me and i 'll add it.thank you
#iamcryptoprince
·
--
Рост
Sol signal Support: 100–102 Resistance: 110 Next resistance: 114–115 Buy = 102.25 to 103.50 Sell = 110.20 If $SOL breaks out 111 then sell accordingly to next resistance. #iamcryptoprince {spot}(SOLUSDT)

Sol signal

Support: 100–102
Resistance: 110
Next resistance: 114–115

Buy = 102.25 to 103.50
Sell = 110.20

If $SOL breaks out 111 then sell accordingly to next resistance.

#iamcryptoprince
Статья
Portfolio managementHow to Invest from 100 to 10,000 dollars. Rules : 1 = Don't invest in every coin. 2 = Don't go for more than 5 coins. 3 = Plan DCA. 4 = Maximum entry in any coin should be 500. 5 = Do day trading and longterm together. 6 = Always buy at support or after breakout confirmation. 7 = No future trading in this setup is explained. 8 = Sell on small profits again and again. Let's start : Use atleast 5 planned entries so you always have capital available if the price hits lowest. 1 = Starting with 100 dollars? Pick 1 coin 20 × 5 = 100 Total 100 Entries look small but they worth it,you ll never get stuck,always buy at support only. 2 = Starting with 1000 dollars? Pick 1 coin 100 × 10 = 1000 Total 1000 Let's take example of sol coin,you buy it at 97 and it drops to 93 so you buy again at 93 and it goes up to 95 so your average buying price is 95 now,take 100 dollars first entry out and now buying rate is 95 for first entry so you can place maximum sell limit for it and wait for next bottom,you still have 9 entries left for big instant dumps,that's the proper way of day trading and long term holding. 3 = Starting with 2000 dollars? Pick 2 coins 100 × 10 = 1000 100 × 10 = 1000 Total 2000 Or pick 1 coin. 200 × 10 = 2000 Total 2000 In this budget either you can pick two coins or double the investment ratio to 200 dollars for 1 coin. (Double better) 4 = Starting with 5000 dollars? Same rule like 2000 dollars,either pick 5 coins or increase the invest to 500 for 2 coin as per your choice. ( I shall increase ammount). Pick 5 coins 200 × 5 = 1000 200 × 5 = 1000 200 × 5 = 1000 200 × 5 = 1000 200 × 5 = 1000 Total 5000 Or pick 2 coins 500 × 5 = 2,500 500 × 5 = 2500 Total 5000 Or pick 1 coin only 500 × 10 = 5000 Total 5000 Always remember rule no.4 5 = Starting with 10000 dollars? In this budget you can pick 4 coins and remember that the maximum entry is 500. 500 × 5 = 2500 500 × 5 = 2500 500 × 5 = 2500 500 × 5 = 2500 Total 10000 Or pick 1 coin again (much better). 500 × 20 = 10000 Total 10000 I know you are not going to do this but still guiding you. Reasons : Nobody knows the exact bottom and If you put everything in at once and the coin drops, you have no capital left to buy at better prices. With 5 to 10 planned entries, you can build your position gradually and keep cash available for deeper dips. Your first entry gets you into the market.Your next entries allow you to buy lower.Your final entries give you more flexibility if the market falls further.The goal is to catch good bottom with maximum returns of day trading.The goal is to control your capital and avoid putting everything into one price. Invest patiently. Keep capital available. Don’t chase the market,you'll get coin on your desired price eventually it's my 5 years experience. #iamcryptoprince

Portfolio management

How to Invest from 100 to 10,000 dollars.
Rules :
1 = Don't invest in every coin.
2 = Don't go for more than 5 coins.
3 = Plan DCA.
4 = Maximum entry in any coin should be 500.
5 = Do day trading and longterm together.
6 = Always buy at support or after breakout confirmation.
7 = No future trading in this setup is explained.
8 = Sell on small profits again and again.
Let's start :
Use atleast 5 planned entries so you always have capital available if the price hits lowest.
1 = Starting with 100 dollars?
Pick 1 coin
20 × 5 = 100
Total 100
Entries look small but they worth it,you ll never get stuck,always buy at support only.
2 = Starting with 1000 dollars?
Pick 1 coin
100 × 10 = 1000
Total 1000
Let's take example of sol coin,you buy it at 97 and it drops to 93 so you buy again at 93 and it goes up to 95 so your average buying price is 95 now,take 100 dollars first entry out and now buying rate is 95 for first entry so you can place maximum sell limit for it and wait for next bottom,you still have 9 entries left for big instant dumps,that's the proper way of day trading and long term holding.
3 = Starting with 2000 dollars?
Pick 2 coins
100 × 10 = 1000
100 × 10 = 1000
Total 2000
Or pick 1 coin.
200 × 10 = 2000
Total 2000
In this budget either you can pick two coins or double the investment ratio to 200 dollars for 1 coin. (Double better)
4 = Starting with 5000 dollars?
Same rule like 2000 dollars,either pick 5 coins or increase the invest to 500 for 2 coin as per your choice. ( I shall increase ammount).
Pick 5 coins
200 × 5 = 1000
200 × 5 = 1000
200 × 5 = 1000
200 × 5 = 1000
200 × 5 = 1000
Total 5000
Or pick 2 coins
500 × 5 = 2,500
500 × 5 = 2500
Total 5000
Or pick 1 coin only
500 × 10 = 5000
Total 5000
Always remember rule no.4
5 = Starting with 10000 dollars?
In this budget you can pick 4 coins and remember that the maximum entry is 500.
500 × 5 = 2500
500 × 5 = 2500
500 × 5 = 2500
500 × 5 = 2500
Total 10000
Or pick 1 coin again (much better).
500 × 20 = 10000
Total 10000
I know you are not going to do this but still guiding you.
Reasons :
Nobody knows the exact bottom and If you put everything in at once and the coin drops, you have no capital left to buy at better prices. With 5 to 10 planned entries, you can build your position gradually and keep cash available for deeper dips.
Your first entry gets you into the market.Your next entries allow you to buy lower.Your final entries give you more flexibility if the market falls further.The goal is to catch good bottom with maximum returns of day trading.The goal is to control your capital and avoid putting everything into one price.
Invest patiently. Keep capital available. Don’t chase the market,you'll get coin on your desired price eventually it's my 5 years experience.
#iamcryptoprince
·
--
Падение
Sol update SOL is still showing weakness around 96.38. Support = 95.30 and 93.64 Resistance = 97.25 then 98.74 then 103.08 For now, I’m waiting for 93.60 . I’d rather buy a stronger dip or wait for SOL to reclaim $97.25 with confirmation than chase the current price. Patience is better than forcing an entry. #iamcryptoprince
Sol update

SOL is still showing weakness around 96.38.

Support = 95.30 and 93.64
Resistance = 97.25 then 98.74 then 103.08

For now, I’m waiting for 93.60 . I’d rather buy a stronger dip or wait for SOL to reclaim $97.25 with confirmation than chase the current price. Patience is better than forcing an entry.

#iamcryptoprince
·
--
Падение
Bitcoin update BTC is around 79570, Btc price surge was too quick this week and can be considered as a bull trap easily so Resistance: 80000 → 82850 Support: 78208 → 73206 → 71817 → 67701 If $BTC breaks and holds above 80000, Then 82850 will be next but if it gets rejected here, the first deeper correction could take BTC toward 73206 and 71817 and if 71817 breaks too then 67701 becomes the next major support. The reaction around 80000–82850 should be very important for the next move. #iamcryptoprince
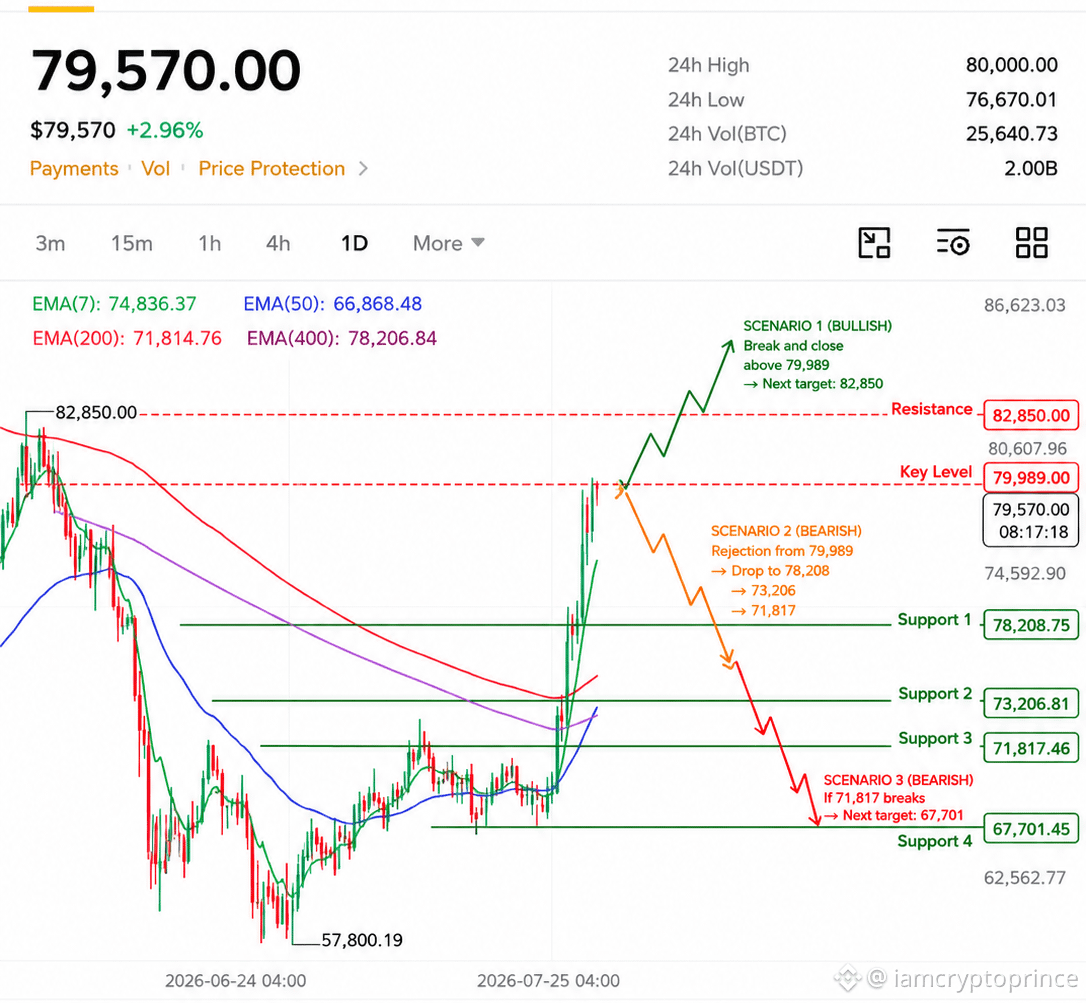
Bitcoin update

BTC is around 79570, Btc price surge was too quick this week and can be considered as a bull trap easily so

Resistance: 80000 → 82850
Support: 78208 → 73206 → 71817 → 67701

If $BTC breaks and holds above 80000, Then 82850 will be next but if it gets rejected here, the first deeper correction could take BTC toward 73206 and 71817 and if 71817 breaks too then 67701 becomes the next major support.

The reaction around 80000–82850 should be very important for the next move.

#iamcryptoprince
·
--
Рост
Sol update and signal Support = 90, then 88–89 Resistance = 95–97, then 100–102 Buy price = 89 to 93 Sell price = 97 to 102 (as per market condition) If BTC holds above $75.5K, SOL could recover toward resistance and will cross 100 again. If BTC loses it again, $SOL may test the lower support. The trend isn’t dead. #iamcryptoprince
Sol update and signal

Support = 90, then 88–89
Resistance = 95–97, then 100–102

Buy price = 89 to 93
Sell price = 97 to 102 (as per market condition)

If BTC holds above $75.5K, SOL could recover toward resistance and will cross 100 again. If BTC loses it again, $SOL may test the lower support.

The trend isn’t dead.

#iamcryptoprince
·
--
Рост
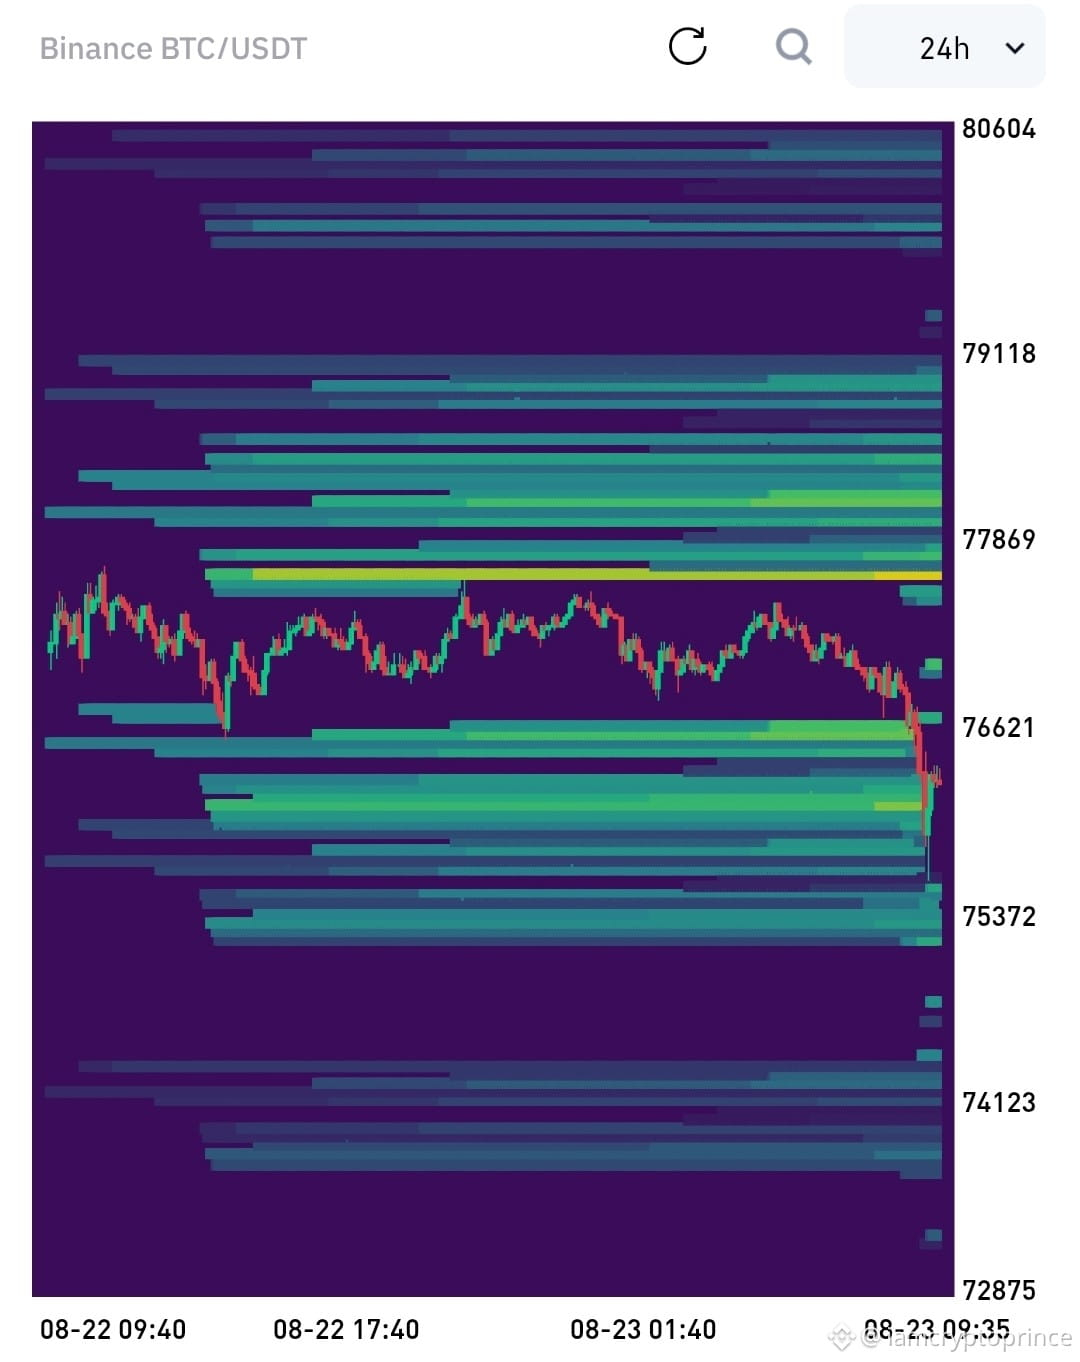
Bitcoin update As expected in my previous post $BTC 75,500 liquidity was taken, and btc is now around 76,200 after dipping. What next: If 75,500 holds = likely bounce toward 77,500 → 78,500 75,500 breaks strongly = next downside target around 74,000 → 73,000 If BTC reclaims 77,500, the liquidity above 79,000–80,000 becomes the bigger target. The 75.5K sweep looks more like a liquidity grab than a full trend reversal,and i think next target is 77500 #iamcryptoprince
Bitcoin update

As expected in my previous post $BTC 75,500 liquidity was taken, and btc is now around 76,200 after dipping.

What next:

If 75,500 holds = likely bounce toward 77,500 → 78,500

75,500 breaks strongly = next downside target around 74,000 → 73,000

If BTC reclaims 77,500, the liquidity above 79,000–80,000 becomes the bigger target.

The 75.5K sweep looks more like a liquidity grab than a full trend reversal,and i think next target is 77500

#iamcryptoprince
·
--
Падение
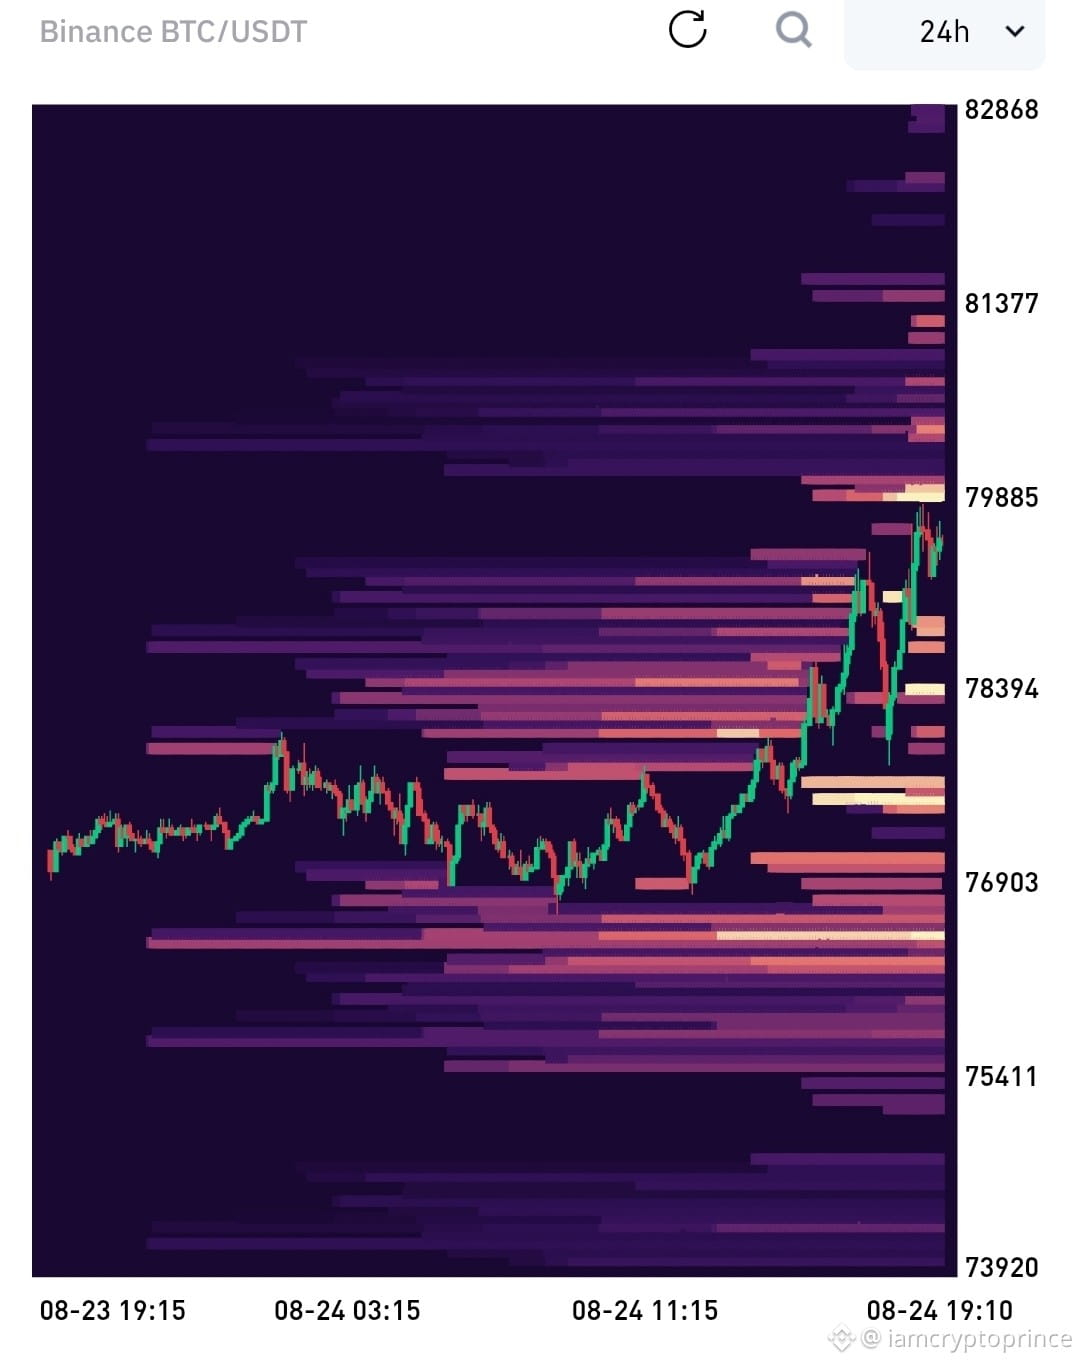
Bitcoin update $BTC went up almost nonstop for the past 5 days, so this correction was expected. But honestly, I feel like the correction might not be deep enough yet. I’m watching the 76K–75K area first. If that breaks, 73K–74K could be the next important zone. A drop toward 70K–72K would be a much stronger reset. If BTC holds around 77K and quickly gets back above 79K–80K, then this might have just been a small pause. Personally, I’d prefer BTC to have a proper correction,stabilize,and then continue higher instead of pumping straight up. #iamcryptoprince
Bitcoin update

$BTC went up almost nonstop for the past 5 days, so this correction was expected. But honestly, I feel like the correction might not be deep enough yet.

I’m watching the 76K–75K area first. If that breaks, 73K–74K could be the next important zone. A drop toward 70K–72K would be a much stronger reset.

If BTC holds around 77K and quickly gets back above 79K–80K, then this might have just been a small pause.

Personally, I’d prefer BTC to have a proper correction,stabilize,and then continue higher instead of pumping straight up.

#iamcryptoprince
·
--
Падение
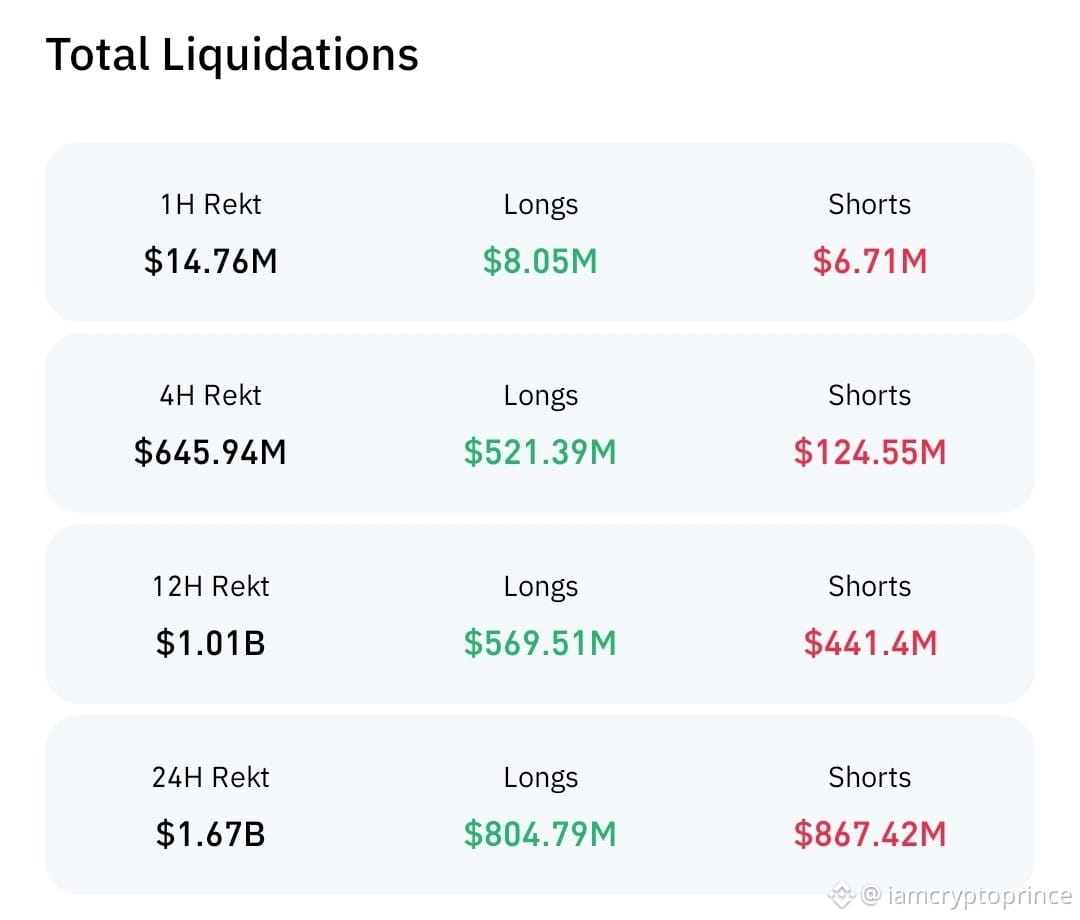
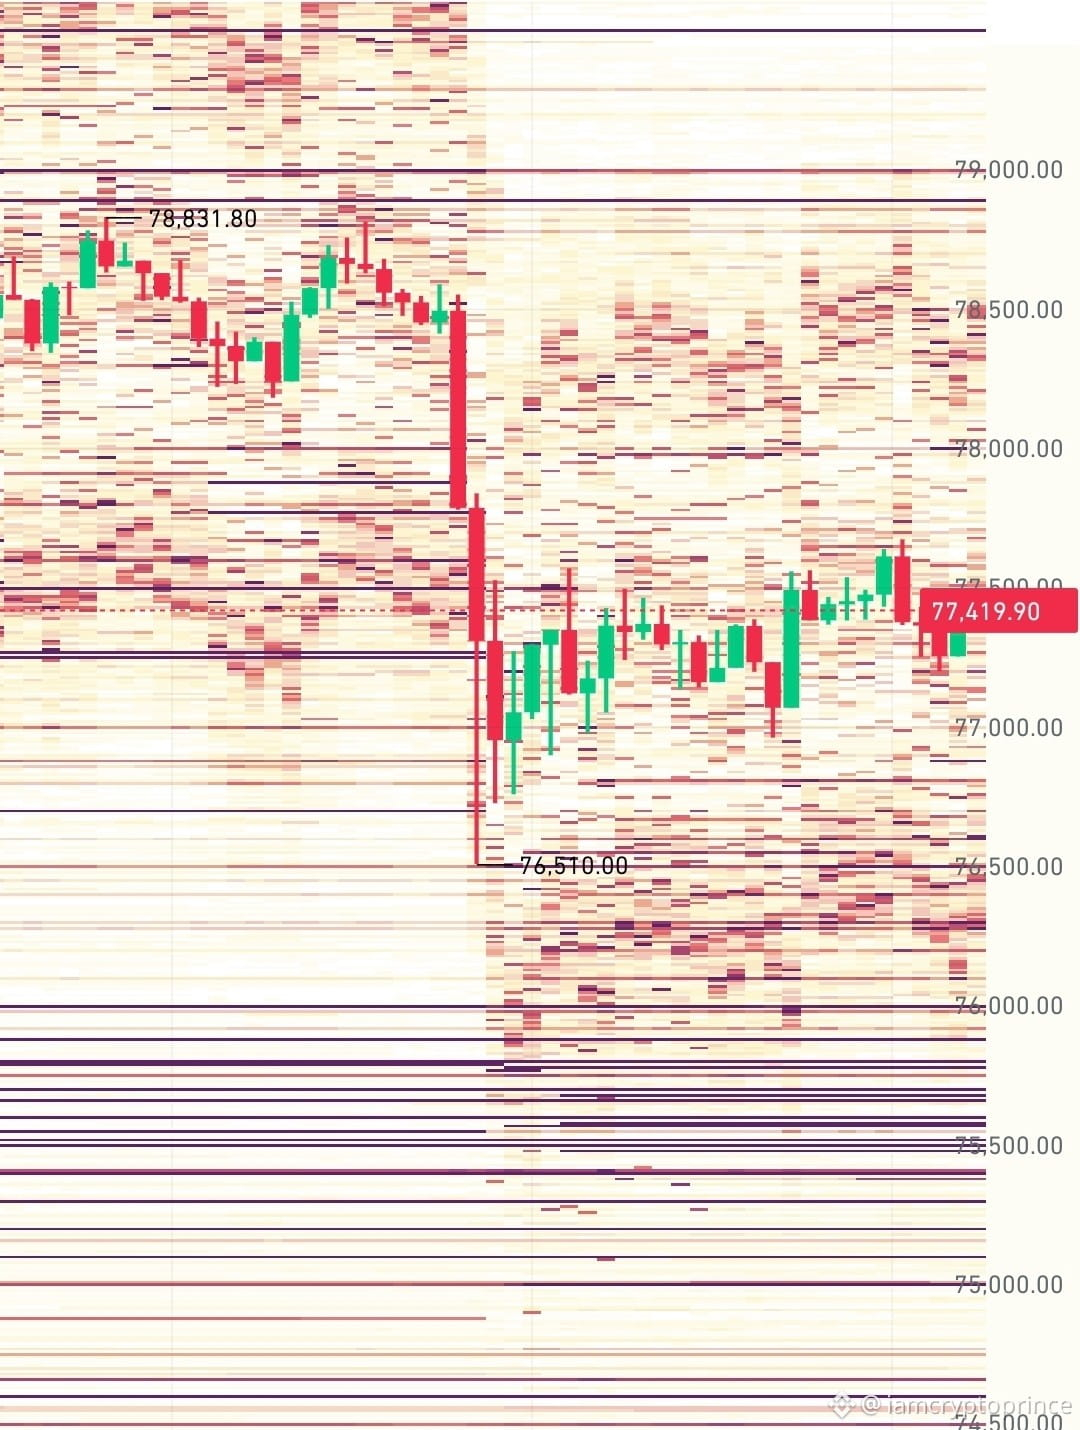
Past 24 hours liquidations In past 24 hours 290 traders were liquidated and total liquidations comes in at 1.72 billion dollars. The largest single liquidation value was 25 million dollars. In past 4 hours total liquidations were almost 700 million dollars. Which one will be next in your opinion? 75500 or 79000 $BTC @iamcryptoprince
Past 24 hours liquidations

In past 24 hours 290 traders were liquidated and total liquidations comes in at 1.72 billion dollars. The largest single liquidation value was 25 million dollars.

In past 4 hours total liquidations were almost 700 million dollars.

Which one will be next in your opinion?
75500 or 79000
$BTC
@iamcryptoprince
·
--
Падение
Big market news this week: 29 July – U.S. Fed interest rate decision. 30 July – U.S. inflation and GDP data. 31 July – Employment and consumer confidence data. This week could bring big moves in crypto so take trades by keeping these dates in mind. #iamcryptoprince
Big market news this week:

29 July – U.S. Fed interest rate decision.

30 July – U.S. inflation and GDP data.

31 July – Employment and consumer confidence data.

This week could bring big moves in crypto so take trades by keeping these dates in mind.
#iamcryptoprince
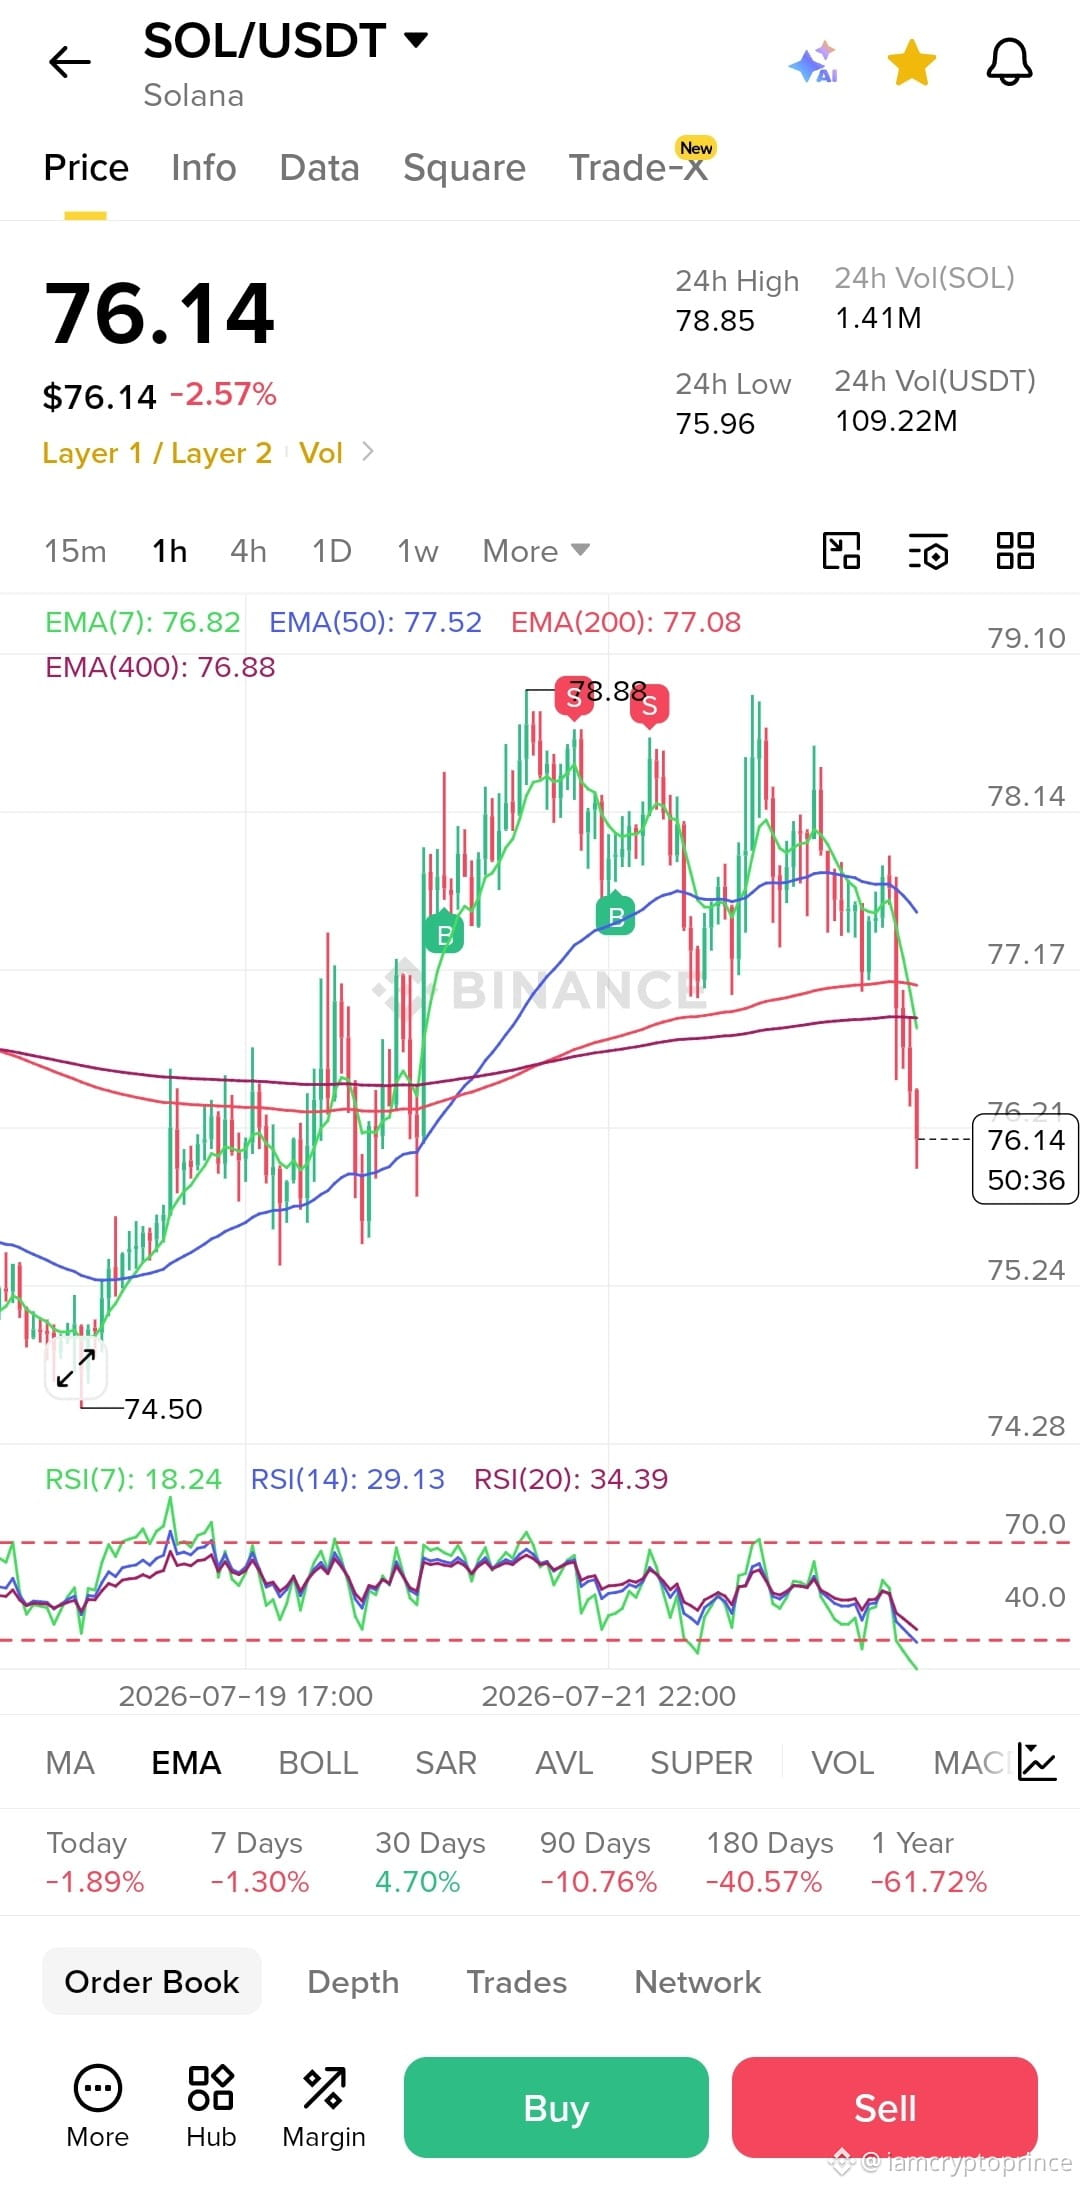
$SOL Sol is currently bearish and it’s between support and resistance. Supports : 1 = $76.50 — immediate support (current area) 2 = $75.20–75.50 — stronger support / possible buy zone 3 = $74.50 — major support Resistance : 1 = $77.10–77.60 — first resistance (need to reclaim) 2 = $78.50–78.80 — strong resistance / recent high Buy sell targets : Entry 1 (safer) : $75.20–75.50 after a bounce confirmation Sell targets : $77.60 (first target) $78.50–78.80 (main target) Entry 2 (breakout) : Above $77.60–77.80 Sell targets : $78.50 $79.50–80.00 if momentum continues As i am posting it has already broken its support of 76.50 so waiting for next target now.hope it helps you #iamcryptoprince
$SOL Sol is currently bearish and it’s between support and resistance.

Supports :

1 = $76.50 — immediate support (current area)

2 = $75.20–75.50 — stronger support / possible buy zone

3 = $74.50 — major support

Resistance :

1 = $77.10–77.60 — first resistance (need to reclaim)

2 = $78.50–78.80 — strong resistance / recent high

Buy sell targets :

Entry 1 (safer) :

$75.20–75.50 after a bounce confirmation

Sell targets :

$77.60 (first target)

$78.50–78.80 (main target)

Entry 2 (breakout) :

Above $77.60–77.80

Sell targets :

$78.50

$79.50–80.00 if momentum continues

As i am posting it has already broken its support of 76.50 so waiting for next target now.hope it helps you
#iamcryptoprince
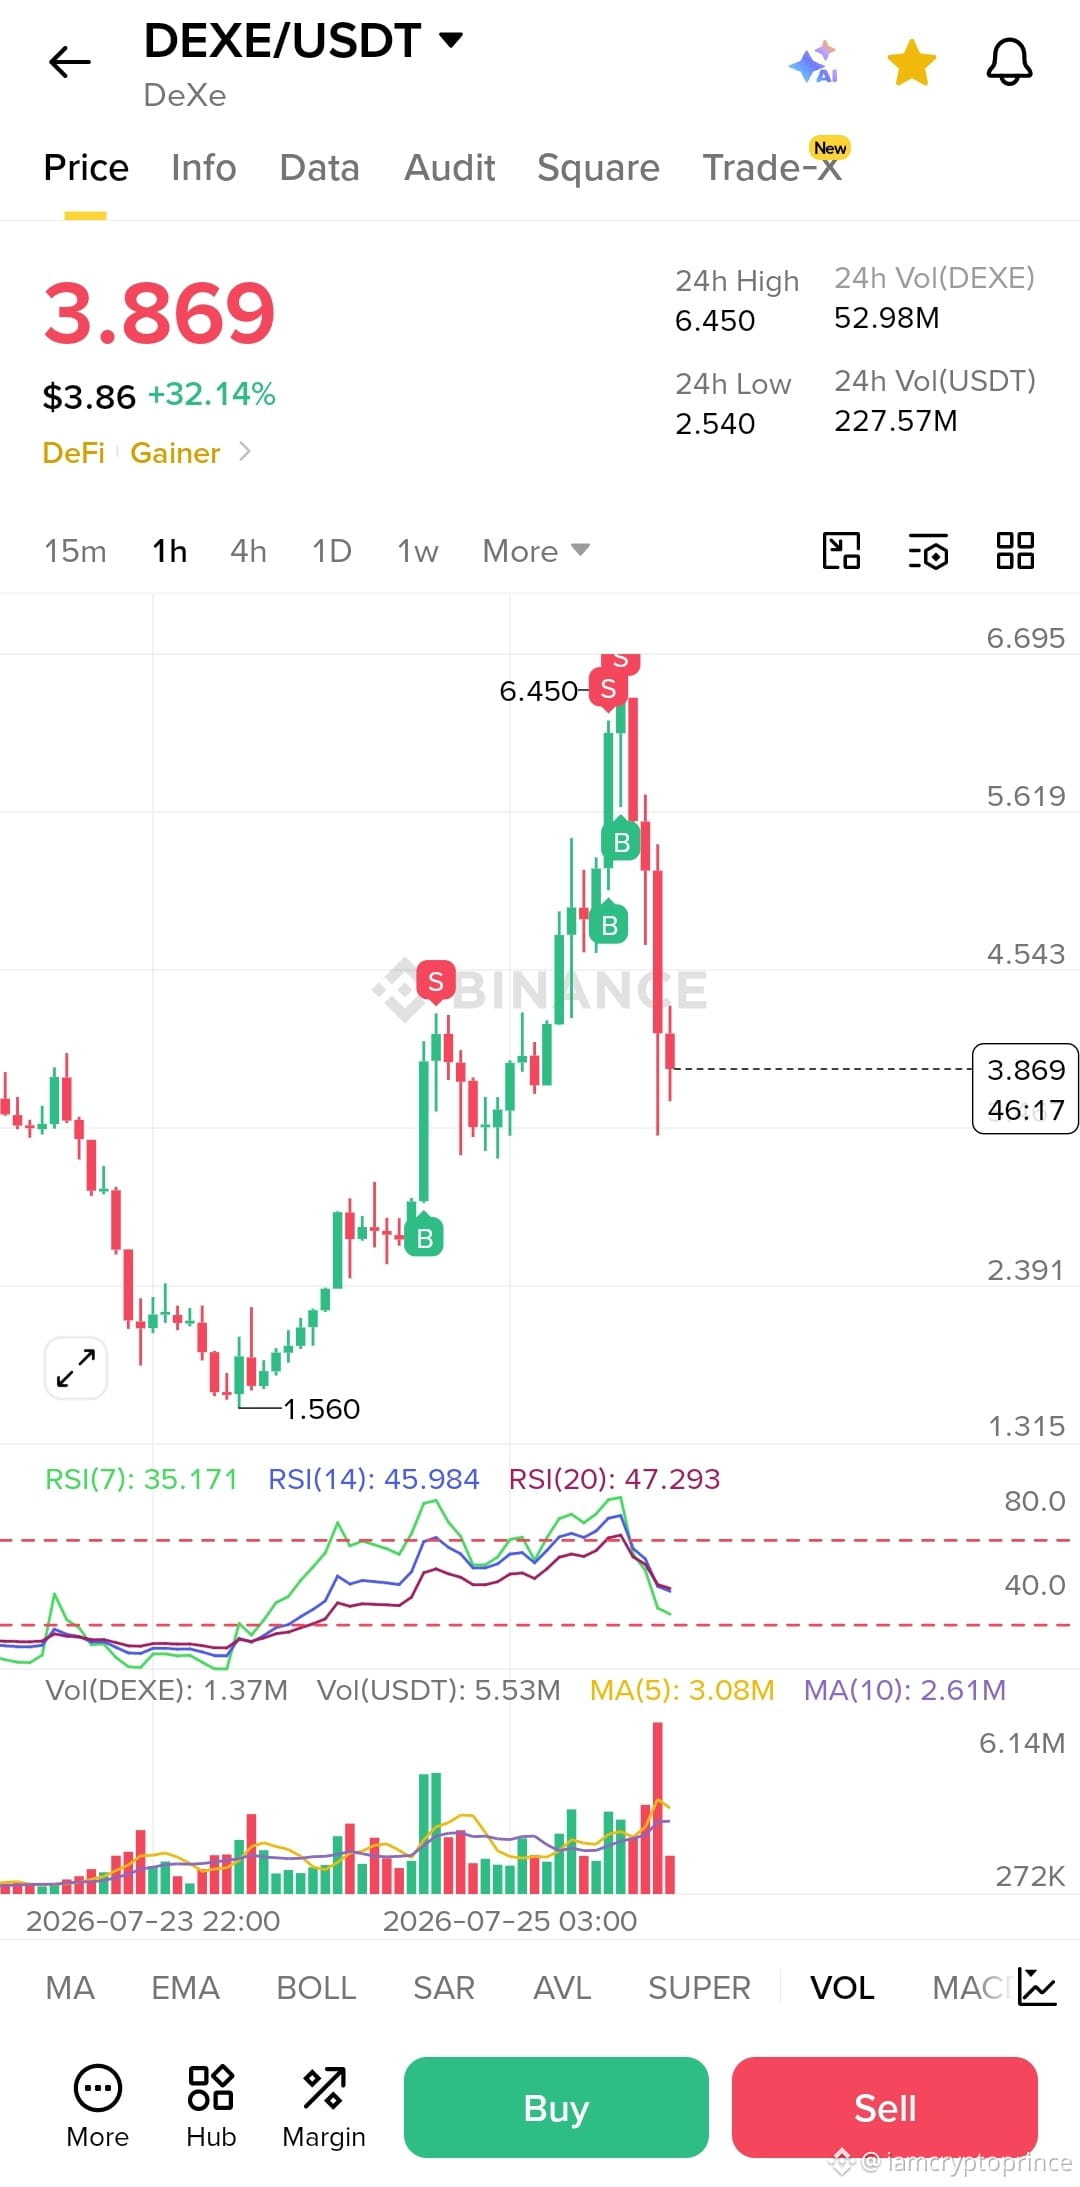
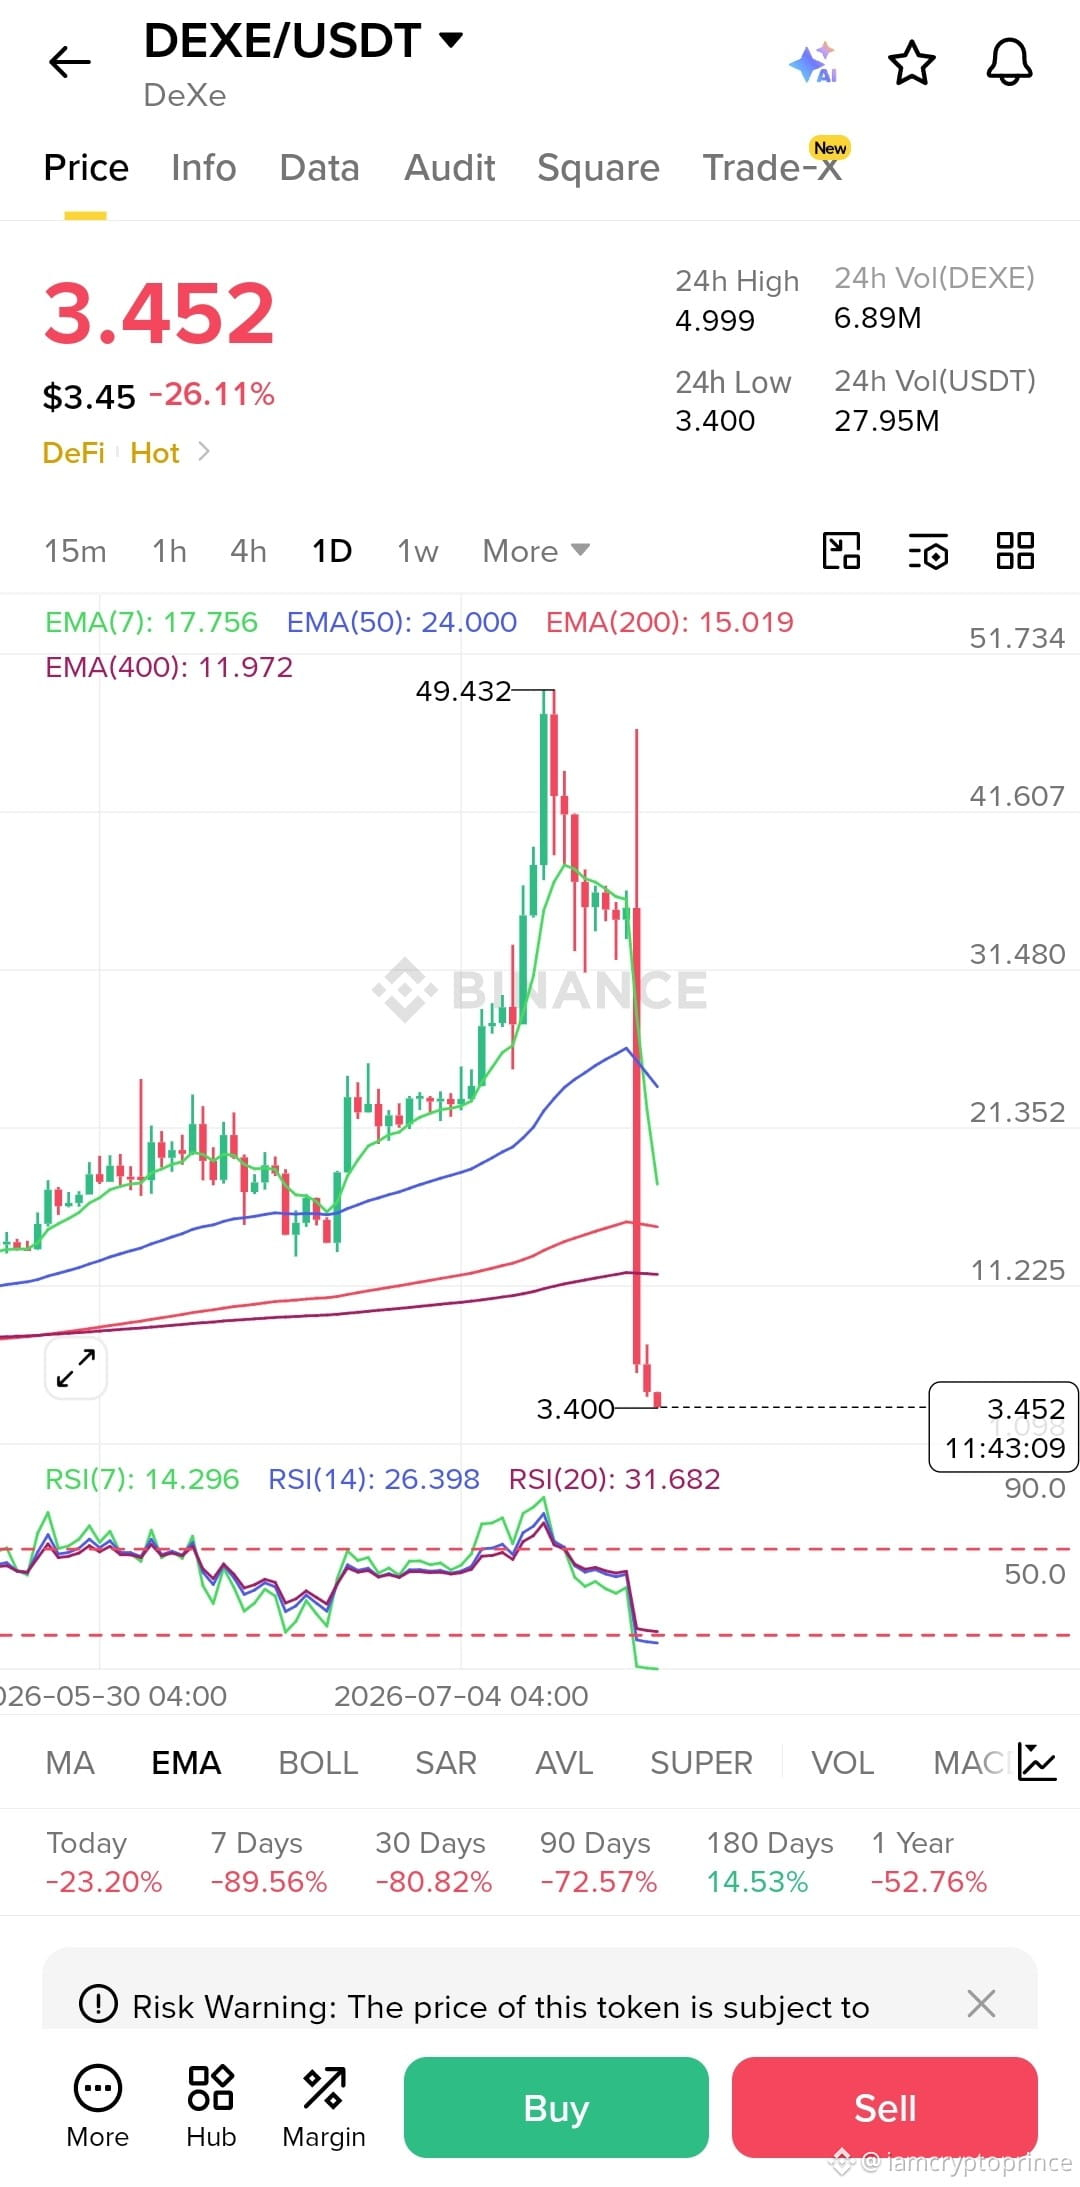
$DEXE DEXE Crash: What should holders do next? The recent DEXE crash shocked many traders. What likely happened? The crash appears to be driven by whales taking profit after a strong rally of more than 20× in a few months,which may have triggered the initial sell-off. The selling pressure caused panic, long liquidations, and accelerated the decline. So far, there is no confirmed evidence of a hack or blockchain failure. Market situation: 1 - Price dropped from around 46.93 to 3.50, losing more than 90%. 2 - All major EMAs (7, 50, 200, 400) are above the price, showing a bearish trend. 3 - RSI is near oversold levels, but oversold does not guarantee an immediate recovery. 4 - Current sideways movement around the lows shows buyers are still weak. For holders in loss: 1 = Avoid emotional panic selling. 2 = Don't chase every small bounce. 3 = Don't do DCA without confirmation. Wait for a proper base formation with higher highs and higher lows. A short-term bounce is possible, but buying now carries high risk until the chart shows signs of recovery and confidence returns. #iamcryptoprince
$DEXE DEXE Crash: What should holders do next?

The recent DEXE crash shocked many traders. What likely happened?

The crash appears to be driven by whales taking profit after a strong rally of more than 20× in a few months,which may have triggered the initial sell-off. The selling pressure caused panic, long liquidations, and accelerated the decline.
So far, there is no confirmed evidence of a hack or blockchain failure.

Market situation:

1 - Price dropped from around 46.93 to 3.50, losing more than 90%.
2 - All major EMAs (7, 50, 200, 400) are above the price, showing a bearish trend.
3 - RSI is near oversold levels, but oversold does not guarantee an immediate recovery.
4 - Current sideways movement around the lows shows buyers are still weak.

For holders in loss:

1 = Avoid emotional panic selling.
2 = Don't chase every small bounce.
3 = Don't do DCA without confirmation. Wait for a proper base formation with higher highs and higher lows.

A short-term bounce is possible, but buying now carries high risk until the chart shows signs of recovery and confidence returns.
#iamcryptoprince
Войдите, чтобы посмотреть больше материала
Присоединяйтесь к пользователям криптовалют по всему миру на Binance Square
⚡️ Получайте новейшую и полезную информацию о криптоактивах.
💬 Нам доверяет крупнейшая в мире криптобиржа.
👍 Получите достоверные аналитические данные от верифицированных создателей контента.
Эл. почта/номер телефона
Структура веб-страницы
Настройки cookie
Правила и условия платформы