

Hazel Ali
91 Публикации

Hazel Ali
Отправить жалобу
Заблокировать пользователя
1 подписок(и/а)
36 подписчиков(а)
131 понравилось
Посты
·
--
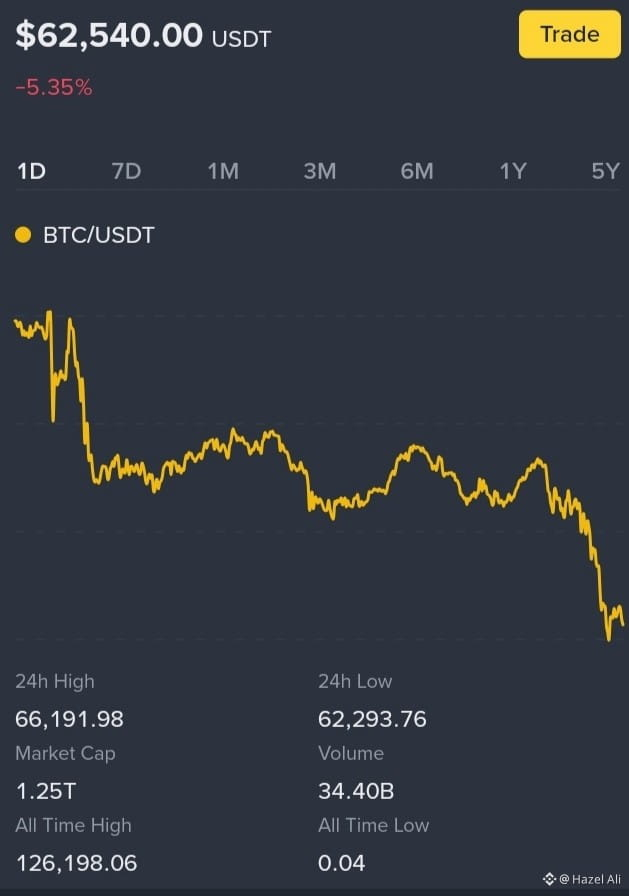
BTC is currently trading at $62,538.44, down about 5.4% over the last 24 hours. The 24h open was $66,104.00, with a high of $66,191.98 and a low of $62,293.76.
Quick take:
Short-term momentum: bearish, since price is sitting near the daily low
Key resistance: around $66.2k
Key support: around $62.3k
If BTC loses that support cleanly, traders usually watch for further downside continuation
If it reclaims the open area near $66.1k, that would be a stronger recovery signal
BTC is currently trading at $62,538.44, down about 5.4% over the last 24 hours. The 24h open was $66,104.00, with a high of $66,191.98 and a low of $62,293.76.
Quick take:
Short-term momentum: bearish, since price is sitting near the daily low
Key resistance: around $66.2k
Key support: around $62.3k
If BTC loses that support cleanly, traders usually watch for further downside continuation
If it reclaims the open area near $66.1k, that would be a stronger recovery signal
Quick take:
Short-term momentum: bearish, since price is sitting near the daily low
Key resistance: around $66.2k
Key support: around $62.3k
If BTC loses that support cleanly, traders usually watch for further downside continuation
If it reclaims the open area near $66.1k, that would be a stronger recovery signal
79
·
--
All Eyes on Warsh — The Rate Hold Is Certain, but the Dot Plot, the Tone, and What He Says About OilAccording to CoinMarketCap data, the global cryptocurrency market cap now stands at $2.23T, down by 1.62% over the last 24 hours.
Bitcoin (BTC) traded between $64,833 and $66,818 over the past 24 hours. As of 09:30 AM (UTC) today, BTC is trading at $64,888, down by 1.84%.
Most major cryptocurrencies by market cap are trading mixed. Market outperformers include D, MBOX, and HIGH, up by 62%, 32%, and 28%, respectively.
All Eyes on Warsh — The Rate Hold Is Certain, but the Dot Plot, the Tone, and What He Says About Oil Could Move Bitcoin More Than the Decision Itself
Kevin Warsh chairs his first FOMC meeting today at 2 p.m. ET with a hold at 3.50%–3.75% fully priced — but almost everything else is in play. The dot plot's direction, whether rate-cut language survives the statement, and how explicitly Warsh acknowledges oil's collapse to $75 following the Iran peace deal will carry more market weight than the rate decision itself. Bitcoin trades near $65,000, up 6% on the week, but pulling back modestly in pre-FOMC positioning.
Beneath the macro surface, every historical on-chain bottom signal is flashing simultaneously — Sharpe ratio at -20, RHODL rolling over, 259,000 BTC accumulated since June 5 — while altcoin spot selling just hit a five-year extreme. Russia is adding USDC to its approved crypto trading list, and the Iran deal's formal Geneva signing is scheduled for Friday — on a US federal holiday when markets are closed.
Warsh's Fed Debut: Rates Hold but the Real Question Is What He Says — and Whether He Can Balance Trump, Inflation, and Fed Independence
Key Takeaways:
Hold at 3.50%–3.75% is a near-certainty; the market-moving variables are the dot plot direction, forward guidance language, and Warsh's press conference tone — BofA's fund manager survey shows 55% expect a hawkish hold, 33% a more relaxed stance
The committee Warsh inherits is more hawkish than his own reputation: May CPI at 4.2% (3-year high), PPI up 6.5%, core inflation near 3%, inflation above the 2% target for more than five years, jobs market beating expectations at 172,000 vs 85,000 forecast
Dot plot risk: March's median showed one cut in 2026; most analysts expect Wednesday to shift to no cuts, with several members potentially projecting two hikes — Capital Economics calls two "insurance hikes" now "more likely than not" in December and early 2027
The Iran deal variable: Brent at ~$75 returns to pre-conflict levels and is mechanically disinflationary — but former Philadelphia Fed president Harker cautions: "Even if we get back to what it was before the war, we still had inflation running above 2%"
Warsh's core dilemma: sound too dovish and reignite Fed independence concerns; sound too hawkish and contradict Trump's rate-cut expectations; say too little and produce confusion — all three paths carry distinct market risks
K33's Vetle Lunde: "With BTC's 30-day correlation to the S&P 500 near 0.6, any shift in Fed communication could have an outsized impact on BTC, which tends to be particularly sensitive to macro developments during bear markets"
Summary:
Today's FOMC is the most consequential scheduled event for crypto markets since the start of the correction cycle — not because of what rates will do (nothing), but because of what Warsh's first communication tells markets about the path for the rest of 2026. A dot plot acknowledging oil's collapse and signaling fewer hikes than the December odds currently price would validate the recovery thesis and Kendrick's bottom call. A dot plot clustering around two hikes with hawkish press conference language would test the $63,000–$65,000 support zone that has formed since the bounce from $59,375. The window is narrow between sounding too dovish (independence concerns) and too hawkish (killing the recovery) — navigating it cleanly is Warsh's first real test as chairman.
"This Is Not a Dip" — Altcoin Selling Pressure Just Hit a Five-Year Extreme, CryptoQuant Data Shows
Key Takeaways:
CryptoQuant's cumulative buy/sell volume differential for altcoins (excluding BTC and ETH) has reached its deepest negative reading since data tracking began in 2020 — 15 consecutive months of sustained net selling on spot exchanges
The trend started from near-neutral in early 2025 — through the bull market, through Bitcoin's October ATH near $126,000, and through the subsequent 50% correction; the selling predates the bear phase and has only deepened
This week's altcoin recoveries (Bittensor +31.9%, NEAR +22.2%, XRP +8% above $1.20, UNI +20% on Standard Chartered's $100-by-2030 target) occurred against a backdrop of five-year structural net selling — explaining why moves are uneven and catalyst-dependent rather than broad-based
Contrarian read: five-year extremes in flow indicators historically mark exhaustion points — the sellers who were going to sell have largely sold; the missing ingredient is a sustained macro catalyst to shift the demand side
Summary:
Fifteen months of uninterrupted net altcoin selling — through a bull market, an all-time high, and a 50% correction — is structural, not cyclical. The five-year extreme is simultaneously the most bearish framing (capital has rotated away from altcoins potentially permanently toward Bitcoin, AI equities, and other assets) and the most contrarian (sellers are exhausted, any sustained macro catalyst could trigger a sharp reversal from maximum pessimism). This week's individual altcoin surges on specific catalysts show the bid exists — it just requires a specific reason to show up, not a general improvement in sentiment. A dovish FOMC tone or confirmed Iran deal could provide that reason at scale.
Bitcoin's On-Chain Signals Are Flashing Every Historical Bottom Indicator — But the Floor Forms Months Before the Launch
Key Takeaways:
Bitcoin's Sharpe ratio hit -20 on June 11 — the precise level seen at the 2015, 2018-19, and 2022-23 cycle bottoms; historically, this reading marked the beginning of a 3-to-5-month basing period, not an immediate launch
The RHODL Ratio is beginning to roll over from its peak — the same pattern that emerged at both the 2015 and 2022 cycle bottoms, signaling that long-term holders are reasserting dominance over short-term capital and the heaviest forced selling may be behind
Accumulator wallets took in ~125,000 BTC in the first half of June alone; exchange reserves fell ~80,000 BTC since February to ~2.71 million; whales pulled more than 11,000 BTC off exchanges in the past day specifically
Bitcoin's Binance order book buy/sell imbalance has surged to its highest level since at least February 2024 — passive buy orders stacking up more aggressively relative to sell orders, signaling renewed demand willing to absorb available supply
ETF flows: two positive sessions in the past three days ($10M Tuesday, $86M Friday), IBIT adding $150M+ over four consecutive days — but still tracking toward a sixth consecutive week of net outflows at $54M in the red so far this week
Summary:
The convergence of every major historical bottom signal simultaneously is remarkable — but the key historical lesson is that -20 Sharpe ratio and RHODL rollovers mark the beginning of base formation, not the launch. Three to five months of basing followed prior instances before durable recoveries began. This week's macro-driven recovery from $59,375 to $65,000+ is consistent with that pattern: the floor is forming, the on-chain demand footprint is real, and the macro headwind (oil, Iran) is reversing. What hasn't happened yet is the sustained ETF inflow return and the $83,000 reclaim that Standard Chartered's Kendrick identified as necessary to formally invalidate the lower-highs downtrend. Today's FOMC is the next macro test of whether the basing phase extends or accelerates.
Russia to Add USDC to Approved Crypto Trading List, Deputy Finance Minister Says
Key Takeaways:
Russia plans to add USDC to its approved crypto trading list alongside USDT, Bitcoin, and Ethereum, per Deputy Finance Minister Ivan Chebeskov — despite the Russian central bank previously indicating no further tokens would be added for now
Russia may also allow smaller fiat-backed stablecoins from "friendly" jurisdictions, including ruble stablecoins and UAE dirham stablecoins — expanding the framework beyond US dollar-denominated assets
Non-professional investors would receive legal access to crypto for the first time, with an annual investment cap of 300,000 rubles; eligibility requirements include an average market cap above 5 trillion rubles over two years
Russia's crypto regulatory bill must pass before July 1 — a hard legislative deadline that is approaching rapidly; USDC inclusion represents a notable decision given its US-domiciled issuer and Western sanctions framework context
Summary:
Russia including USDC — a Circle-issued, US-regulated stablecoin — alongside USDT in its approved trading list is a notable policy signal in a sanctions context. It suggests Moscow is prioritizing stablecoin market liquidity and retail accessibility over geopolitical optics, at least in the digital asset space. The ruble and dirham stablecoin provisions reflect Russia's broader strategy of building financial infrastructure that operates outside the dollar system while still benefiting from dollar-equivalent liquidity through USDT and USDC. With the July 1 deadline for the crypto regulatory bill approaching, Russia is moving faster toward formal crypto market structure than many Western observers have tracked — and the scale of retail participation enabled by 300,000-ruble annual caps would add meaningful new demand to global crypto markets if implemented.
Wall Street Edges Higher Ahead of Warsh's Fed Debut — A Hold Is Certain, but Everything Else Is Not
Key Takeaways:
Dow and S&P 500 futures rose 0.1%, Nasdaq 100 +0.2% Wednesday morning — measured moves reflecting a market holding its breath rather than making directional bets ahead of 2 p.m. ET
Stocks lost Monday's momentum on Tuesday as residual uncertainty around Friday's Geneva signing tempered optimism; two prior ceasefires collapsed entirely after generating rallies — traders are waiting for confirmed signatures
Bloomberg published the full 14-point MOU text Tuesday evening — giving markets their first detailed look at provisions around Hormuz reopening, nuclear talks framework, and the 60-day sanctions/reconstruction negotiation timeline
Friday's Geneva signing is scheduled for Juneteenth — a US federal holiday; US equity markets will be closed when the most consequential geopolitical event of the month either holds or falls apart
Scaramucci (Skybridge): "market apathy is a potential opportunity" — expects Bitcoin to begin rallying late 2026 into early 2027, aligning with Armstrong's four-year halving cycle framework projecting a potential bottom around September–October 2026
Summary:
The market's measured pre-FOMC positioning — modest gains, no bold directional bets — reflects hard-won discipline from a correction cycle where premature optimism on Iran has been punished repeatedly. Traders have learned to wait for confirmed signatures, not just headlines. The Friday Geneva signing on a US holiday introduces an unusual liquidity wrinkle: if the deal holds, the market's first full reaction will come Monday; if it collapses, crypto markets will be among the first to respond in thin weekend trading. That asymmetry — closed equity markets on the signing day — makes the weekend session particularly important for price discovery regardless of outcome.
Market movers:
NVDAB: $208.75 (-1.50%)
SPCXB: $207.94 (-2.53%)
TSLAB: $404.09 (-0.08%)
MUB: $1060.56 (-5.50%)
SNDKB: $2046.37 (-4.62%)
ETH: $1775.04 (-0.89%)
BNB: $602.51 (-2.20%)
XRP: $1.1968 (-3.33%)
SOL: $72.53 (-3.23%)
TRX: $0.3198 (+0.69%)
All Eyes on Warsh — The Rate Hold Is Certain, but the Dot Plot, the Tone, and What He Says About Oil
According to CoinMarketCap data, the global cryptocurrency market cap now stands at $2.23T, down by 1.62% over the last 24 hours.
Bitcoin (BTC) traded between $64,833 and $66,818 over the past 24 hours. As of 09:30 AM (UTC) today, BTC is trading at $64,888, down by 1.84%.
Most major cryptocurrencies by market cap are trading mixed. Market outperformers include D, MBOX, and HIGH, up by 62%, 32%, and 28%, respectively.
All Eyes on Warsh — The Rate Hold Is Certain, but the Dot Plot, the Tone, and What He Says About Oil Could Move Bitcoin More Than the Decision Itself
Kevin Warsh chairs his first FOMC meeting today at 2 p.m. ET with a hold at 3.50%–3.75% fully priced — but almost everything else is in play. The dot plot's direction, whether rate-cut language survives the statement, and how explicitly Warsh acknowledges oil's collapse to $75 following the Iran peace deal will carry more market weight than the rate decision itself. Bitcoin trades near $65,000, up 6% on the week, but pulling back modestly in pre-FOMC positioning.
Beneath the macro surface, every historical on-chain bottom signal is flashing simultaneously — Sharpe ratio at -20, RHODL rolling over, 259,000 BTC accumulated since June 5 — while altcoin spot selling just hit a five-year extreme. Russia is adding USDC to its approved crypto trading list, and the Iran deal's formal Geneva signing is scheduled for Friday — on a US federal holiday when markets are closed.
Warsh's Fed Debut: Rates Hold but the Real Question Is What He Says — and Whether He Can Balance Trump, Inflation, and Fed Independence
Key Takeaways:
Hold at 3.50%–3.75% is a near-certainty; the market-moving variables are the dot plot direction, forward guidance language, and Warsh's press conference tone — BofA's fund manager survey shows 55% expect a hawkish hold, 33% a more relaxed stance
The committee Warsh inherits is more hawkish than his own reputation: May CPI at 4.2% (3-year high), PPI up 6.5%, core inflation near 3%, inflation above the 2% target for more than five years, jobs market beating expectations at 172,000 vs 85,000 forecast
Dot plot risk: March's median showed one cut in 2026; most analysts expect Wednesday to shift to no cuts, with several members potentially projecting two hikes — Capital Economics calls two "insurance hikes" now "more likely than not" in December and early 2027
The Iran deal variable: Brent at ~$75 returns to pre-conflict levels and is mechanically disinflationary — but former Philadelphia Fed president Harker cautions: "Even if we get back to what it was before the war, we still had inflation running above 2%"
Warsh's core dilemma: sound too dovish and reignite Fed independence concerns; sound too hawkish and contradict Trump's rate-cut expectations; say too little and produce confusion — all three paths carry distinct market risks
K33's Vetle Lunde: "With BTC's 30-day correlation to the S&P 500 near 0.6, any shift in Fed communication could have an outsized impact on BTC, which tends to be particularly sensitive to macro developments during bear markets"
Summary:
Today's FOMC is the most consequential scheduled event for crypto markets since the start of the correction cycle — not because of what rates will do (nothing), but because of what Warsh's first communication tells markets about the path for the rest of 2026. A dot plot acknowledging oil's collapse and signaling fewer hikes than the December odds currently price would validate the recovery thesis and Kendrick's bottom call. A dot plot clustering around two hikes with hawkish press conference language would test the $63,000–$65,000 support zone that has formed since the bounce from $59,375. The window is narrow between sounding too dovish (independence concerns) and too hawkish (killing the recovery) — navigating it cleanly is Warsh's first real test as chairman.
"This Is Not a Dip" — Altcoin Selling Pressure Just Hit a Five-Year Extreme, CryptoQuant Data Shows
Key Takeaways:
CryptoQuant's cumulative buy/sell volume differential for altcoins (excluding BTC and ETH) has reached its deepest negative reading since data tracking began in 2020 — 15 consecutive months of sustained net selling on spot exchanges
The trend started from near-neutral in early 2025 — through the bull market, through Bitcoin's October ATH near $126,000, and through the subsequent 50% correction; the selling predates the bear phase and has only deepened
This week's altcoin recoveries (Bittensor +31.9%, NEAR +22.2%, XRP +8% above $1.20, UNI +20% on Standard Chartered's $100-by-2030 target) occurred against a backdrop of five-year structural net selling — explaining why moves are uneven and catalyst-dependent rather than broad-based
Contrarian read: five-year extremes in flow indicators historically mark exhaustion points — the sellers who were going to sell have largely sold; the missing ingredient is a sustained macro catalyst to shift the demand side
Summary:
Fifteen months of uninterrupted net altcoin selling — through a bull market, an all-time high, and a 50% correction — is structural, not cyclical. The five-year extreme is simultaneously the most bearish framing (capital has rotated away from altcoins potentially permanently toward Bitcoin, AI equities, and other assets) and the most contrarian (sellers are exhausted, any sustained macro catalyst could trigger a sharp reversal from maximum pessimism). This week's individual altcoin surges on specific catalysts show the bid exists — it just requires a specific reason to show up, not a general improvement in sentiment. A dovish FOMC tone or confirmed Iran deal could provide that reason at scale.
Bitcoin's On-Chain Signals Are Flashing Every Historical Bottom Indicator — But the Floor Forms Months Before the Launch
Key Takeaways:
Bitcoin's Sharpe ratio hit -20 on June 11 — the precise level seen at the 2015, 2018-19, and 2022-23 cycle bottoms; historically, this reading marked the beginning of a 3-to-5-month basing period, not an immediate launch
The RHODL Ratio is beginning to roll over from its peak — the same pattern that emerged at both the 2015 and 2022 cycle bottoms, signaling that long-term holders are reasserting dominance over short-term capital and the heaviest forced selling may be behind
Accumulator wallets took in ~125,000 BTC in the first half of June alone; exchange reserves fell ~80,000 BTC since February to ~2.71 million; whales pulled more than 11,000 BTC off exchanges in the past day specifically
Bitcoin's Binance order book buy/sell imbalance has surged to its highest level since at least February 2024 — passive buy orders stacking up more aggressively relative to sell orders, signaling renewed demand willing to absorb available supply
ETF flows: two positive sessions in the past three days ($10M Tuesday, $86M Friday), IBIT adding $150M+ over four consecutive days — but still tracking toward a sixth consecutive week of net outflows at $54M in the red so far this week
Summary:
The convergence of every major historical bottom signal simultaneously is remarkable — but the key historical lesson is that -20 Sharpe ratio and RHODL rollovers mark the beginning of base formation, not the launch. Three to five months of basing followed prior instances before durable recoveries began. This week's macro-driven recovery from $59,375 to $65,000+ is consistent with that pattern: the floor is forming, the on-chain demand footprint is real, and the macro headwind (oil, Iran) is reversing. What hasn't happened yet is the sustained ETF inflow return and the $83,000 reclaim that Standard Chartered's Kendrick identified as necessary to formally invalidate the lower-highs downtrend. Today's FOMC is the next macro test of whether the basing phase extends or accelerates.
Russia to Add USDC to Approved Crypto Trading List, Deputy Finance Minister Says
Key Takeaways:
Russia plans to add USDC to its approved crypto trading list alongside USDT, Bitcoin, and Ethereum, per Deputy Finance Minister Ivan Chebeskov — despite the Russian central bank previously indicating no further tokens would be added for now
Russia may also allow smaller fiat-backed stablecoins from "friendly" jurisdictions, including ruble stablecoins and UAE dirham stablecoins — expanding the framework beyond US dollar-denominated assets
Non-professional investors would receive legal access to crypto for the first time, with an annual investment cap of 300,000 rubles; eligibility requirements include an average market cap above 5 trillion rubles over two years
Russia's crypto regulatory bill must pass before July 1 — a hard legislative deadline that is approaching rapidly; USDC inclusion represents a notable decision given its US-domiciled issuer and Western sanctions framework context
Summary:
Russia including USDC — a Circle-issued, US-regulated stablecoin — alongside USDT in its approved trading list is a notable policy signal in a sanctions context. It suggests Moscow is prioritizing stablecoin market liquidity and retail accessibility over geopolitical optics, at least in the digital asset space. The ruble and dirham stablecoin provisions reflect Russia's broader strategy of building financial infrastructure that operates outside the dollar system while still benefiting from dollar-equivalent liquidity through USDT and USDC. With the July 1 deadline for the crypto regulatory bill approaching, Russia is moving faster toward formal crypto market structure than many Western observers have tracked — and the scale of retail participation enabled by 300,000-ruble annual caps would add meaningful new demand to global crypto markets if implemented.
Wall Street Edges Higher Ahead of Warsh's Fed Debut — A Hold Is Certain, but Everything Else Is Not
Key Takeaways:
Dow and S&P 500 futures rose 0.1%, Nasdaq 100 +0.2% Wednesday morning — measured moves reflecting a market holding its breath rather than making directional bets ahead of 2 p.m. ET
Stocks lost Monday's momentum on Tuesday as residual uncertainty around Friday's Geneva signing tempered optimism; two prior ceasefires collapsed entirely after generating rallies — traders are waiting for confirmed signatures
Bloomberg published the full 14-point MOU text Tuesday evening — giving markets their first detailed look at provisions around Hormuz reopening, nuclear talks framework, and the 60-day sanctions/reconstruction negotiation timeline
Friday's Geneva signing is scheduled for Juneteenth — a US federal holiday; US equity markets will be closed when the most consequential geopolitical event of the month either holds or falls apart
Scaramucci (Skybridge): "market apathy is a potential opportunity" — expects Bitcoin to begin rallying late 2026 into early 2027, aligning with Armstrong's four-year halving cycle framework projecting a potential bottom around September–October 2026
Summary:
The market's measured pre-FOMC positioning — modest gains, no bold directional bets — reflects hard-won discipline from a correction cycle where premature optimism on Iran has been punished repeatedly. Traders have learned to wait for confirmed signatures, not just headlines. The Friday Geneva signing on a US holiday introduces an unusual liquidity wrinkle: if the deal holds, the market's first full reaction will come Monday; if it collapses, crypto markets will be among the first to respond in thin weekend trading. That asymmetry — closed equity markets on the signing day — makes the weekend session particularly important for price discovery regardless of outcome.
Market movers:
NVDAB: $208.75 (-1.50%)
SPCXB: $207.94 (-2.53%)
TSLAB: $404.09 (-0.08%)
MUB: $1060.56 (-5.50%)
SNDKB: $2046.37 (-4.62%)
ETH: $1775.04 (-0.89%)
BNB: $602.51 (-2.20%)
XRP: $1.1968 (-3.33%)
SOL: $72.53 (-3.23%)
TRX: $0.3198 (+0.69%)
Bitcoin (BTC) traded between $64,833 and $66,818 over the past 24 hours. As of 09:30 AM (UTC) today, BTC is trading at $64,888, down by 1.84%.
Most major cryptocurrencies by market cap are trading mixed. Market outperformers include D, MBOX, and HIGH, up by 62%, 32%, and 28%, respectively.
All Eyes on Warsh — The Rate Hold Is Certain, but the Dot Plot, the Tone, and What He Says About Oil Could Move Bitcoin More Than the Decision Itself
Kevin Warsh chairs his first FOMC meeting today at 2 p.m. ET with a hold at 3.50%–3.75% fully priced — but almost everything else is in play. The dot plot's direction, whether rate-cut language survives the statement, and how explicitly Warsh acknowledges oil's collapse to $75 following the Iran peace deal will carry more market weight than the rate decision itself. Bitcoin trades near $65,000, up 6% on the week, but pulling back modestly in pre-FOMC positioning.
Beneath the macro surface, every historical on-chain bottom signal is flashing simultaneously — Sharpe ratio at -20, RHODL rolling over, 259,000 BTC accumulated since June 5 — while altcoin spot selling just hit a five-year extreme. Russia is adding USDC to its approved crypto trading list, and the Iran deal's formal Geneva signing is scheduled for Friday — on a US federal holiday when markets are closed.
Warsh's Fed Debut: Rates Hold but the Real Question Is What He Says — and Whether He Can Balance Trump, Inflation, and Fed Independence
Key Takeaways:
Hold at 3.50%–3.75% is a near-certainty; the market-moving variables are the dot plot direction, forward guidance language, and Warsh's press conference tone — BofA's fund manager survey shows 55% expect a hawkish hold, 33% a more relaxed stance
The committee Warsh inherits is more hawkish than his own reputation: May CPI at 4.2% (3-year high), PPI up 6.5%, core inflation near 3%, inflation above the 2% target for more than five years, jobs market beating expectations at 172,000 vs 85,000 forecast
Dot plot risk: March's median showed one cut in 2026; most analysts expect Wednesday to shift to no cuts, with several members potentially projecting two hikes — Capital Economics calls two "insurance hikes" now "more likely than not" in December and early 2027
The Iran deal variable: Brent at ~$75 returns to pre-conflict levels and is mechanically disinflationary — but former Philadelphia Fed president Harker cautions: "Even if we get back to what it was before the war, we still had inflation running above 2%"
Warsh's core dilemma: sound too dovish and reignite Fed independence concerns; sound too hawkish and contradict Trump's rate-cut expectations; say too little and produce confusion — all three paths carry distinct market risks
K33's Vetle Lunde: "With BTC's 30-day correlation to the S&P 500 near 0.6, any shift in Fed communication could have an outsized impact on BTC, which tends to be particularly sensitive to macro developments during bear markets"
Summary:
Today's FOMC is the most consequential scheduled event for crypto markets since the start of the correction cycle — not because of what rates will do (nothing), but because of what Warsh's first communication tells markets about the path for the rest of 2026. A dot plot acknowledging oil's collapse and signaling fewer hikes than the December odds currently price would validate the recovery thesis and Kendrick's bottom call. A dot plot clustering around two hikes with hawkish press conference language would test the $63,000–$65,000 support zone that has formed since the bounce from $59,375. The window is narrow between sounding too dovish (independence concerns) and too hawkish (killing the recovery) — navigating it cleanly is Warsh's first real test as chairman.
"This Is Not a Dip" — Altcoin Selling Pressure Just Hit a Five-Year Extreme, CryptoQuant Data Shows
Key Takeaways:
CryptoQuant's cumulative buy/sell volume differential for altcoins (excluding BTC and ETH) has reached its deepest negative reading since data tracking began in 2020 — 15 consecutive months of sustained net selling on spot exchanges
The trend started from near-neutral in early 2025 — through the bull market, through Bitcoin's October ATH near $126,000, and through the subsequent 50% correction; the selling predates the bear phase and has only deepened
This week's altcoin recoveries (Bittensor +31.9%, NEAR +22.2%, XRP +8% above $1.20, UNI +20% on Standard Chartered's $100-by-2030 target) occurred against a backdrop of five-year structural net selling — explaining why moves are uneven and catalyst-dependent rather than broad-based
Contrarian read: five-year extremes in flow indicators historically mark exhaustion points — the sellers who were going to sell have largely sold; the missing ingredient is a sustained macro catalyst to shift the demand side
Summary:
Fifteen months of uninterrupted net altcoin selling — through a bull market, an all-time high, and a 50% correction — is structural, not cyclical. The five-year extreme is simultaneously the most bearish framing (capital has rotated away from altcoins potentially permanently toward Bitcoin, AI equities, and other assets) and the most contrarian (sellers are exhausted, any sustained macro catalyst could trigger a sharp reversal from maximum pessimism). This week's individual altcoin surges on specific catalysts show the bid exists — it just requires a specific reason to show up, not a general improvement in sentiment. A dovish FOMC tone or confirmed Iran deal could provide that reason at scale.
Bitcoin's On-Chain Signals Are Flashing Every Historical Bottom Indicator — But the Floor Forms Months Before the Launch
Key Takeaways:
Bitcoin's Sharpe ratio hit -20 on June 11 — the precise level seen at the 2015, 2018-19, and 2022-23 cycle bottoms; historically, this reading marked the beginning of a 3-to-5-month basing period, not an immediate launch
The RHODL Ratio is beginning to roll over from its peak — the same pattern that emerged at both the 2015 and 2022 cycle bottoms, signaling that long-term holders are reasserting dominance over short-term capital and the heaviest forced selling may be behind
Accumulator wallets took in ~125,000 BTC in the first half of June alone; exchange reserves fell ~80,000 BTC since February to ~2.71 million; whales pulled more than 11,000 BTC off exchanges in the past day specifically
Bitcoin's Binance order book buy/sell imbalance has surged to its highest level since at least February 2024 — passive buy orders stacking up more aggressively relative to sell orders, signaling renewed demand willing to absorb available supply
ETF flows: two positive sessions in the past three days ($10M Tuesday, $86M Friday), IBIT adding $150M+ over four consecutive days — but still tracking toward a sixth consecutive week of net outflows at $54M in the red so far this week
Summary:
The convergence of every major historical bottom signal simultaneously is remarkable — but the key historical lesson is that -20 Sharpe ratio and RHODL rollovers mark the beginning of base formation, not the launch. Three to five months of basing followed prior instances before durable recoveries began. This week's macro-driven recovery from $59,375 to $65,000+ is consistent with that pattern: the floor is forming, the on-chain demand footprint is real, and the macro headwind (oil, Iran) is reversing. What hasn't happened yet is the sustained ETF inflow return and the $83,000 reclaim that Standard Chartered's Kendrick identified as necessary to formally invalidate the lower-highs downtrend. Today's FOMC is the next macro test of whether the basing phase extends or accelerates.
Russia to Add USDC to Approved Crypto Trading List, Deputy Finance Minister Says
Key Takeaways:
Russia plans to add USDC to its approved crypto trading list alongside USDT, Bitcoin, and Ethereum, per Deputy Finance Minister Ivan Chebeskov — despite the Russian central bank previously indicating no further tokens would be added for now
Russia may also allow smaller fiat-backed stablecoins from "friendly" jurisdictions, including ruble stablecoins and UAE dirham stablecoins — expanding the framework beyond US dollar-denominated assets
Non-professional investors would receive legal access to crypto for the first time, with an annual investment cap of 300,000 rubles; eligibility requirements include an average market cap above 5 trillion rubles over two years
Russia's crypto regulatory bill must pass before July 1 — a hard legislative deadline that is approaching rapidly; USDC inclusion represents a notable decision given its US-domiciled issuer and Western sanctions framework context
Summary:
Russia including USDC — a Circle-issued, US-regulated stablecoin — alongside USDT in its approved trading list is a notable policy signal in a sanctions context. It suggests Moscow is prioritizing stablecoin market liquidity and retail accessibility over geopolitical optics, at least in the digital asset space. The ruble and dirham stablecoin provisions reflect Russia's broader strategy of building financial infrastructure that operates outside the dollar system while still benefiting from dollar-equivalent liquidity through USDT and USDC. With the July 1 deadline for the crypto regulatory bill approaching, Russia is moving faster toward formal crypto market structure than many Western observers have tracked — and the scale of retail participation enabled by 300,000-ruble annual caps would add meaningful new demand to global crypto markets if implemented.
Wall Street Edges Higher Ahead of Warsh's Fed Debut — A Hold Is Certain, but Everything Else Is Not
Key Takeaways:
Dow and S&P 500 futures rose 0.1%, Nasdaq 100 +0.2% Wednesday morning — measured moves reflecting a market holding its breath rather than making directional bets ahead of 2 p.m. ET
Stocks lost Monday's momentum on Tuesday as residual uncertainty around Friday's Geneva signing tempered optimism; two prior ceasefires collapsed entirely after generating rallies — traders are waiting for confirmed signatures
Bloomberg published the full 14-point MOU text Tuesday evening — giving markets their first detailed look at provisions around Hormuz reopening, nuclear talks framework, and the 60-day sanctions/reconstruction negotiation timeline
Friday's Geneva signing is scheduled for Juneteenth — a US federal holiday; US equity markets will be closed when the most consequential geopolitical event of the month either holds or falls apart
Scaramucci (Skybridge): "market apathy is a potential opportunity" — expects Bitcoin to begin rallying late 2026 into early 2027, aligning with Armstrong's four-year halving cycle framework projecting a potential bottom around September–October 2026
Summary:
The market's measured pre-FOMC positioning — modest gains, no bold directional bets — reflects hard-won discipline from a correction cycle where premature optimism on Iran has been punished repeatedly. Traders have learned to wait for confirmed signatures, not just headlines. The Friday Geneva signing on a US holiday introduces an unusual liquidity wrinkle: if the deal holds, the market's first full reaction will come Monday; if it collapses, crypto markets will be among the first to respond in thin weekend trading. That asymmetry — closed equity markets on the signing day — makes the weekend session particularly important for price discovery regardless of outcome.
Market movers:
NVDAB: $208.75 (-1.50%)
SPCXB: $207.94 (-2.53%)
TSLAB: $404.09 (-0.08%)
MUB: $1060.56 (-5.50%)
SNDKB: $2046.37 (-4.62%)
ETH: $1775.04 (-0.89%)
BNB: $602.51 (-2.20%)
XRP: $1.1968 (-3.33%)
SOL: $72.53 (-3.23%)
TRX: $0.3198 (+0.69%)
70
·
--
📢 Binance Will Delist COS, D, HIGH, MBOX on 2026-06-19
Binance will delist and cease trading on all spot trading pairs for the following token(s) at 2026-06-19 03:00 (UTC):
- Contentos (COS)
- Dar Open Network (D)
- Highstreet (HIGH)
- MOBOX (MBOX)
$COS
{spot}(COSUSDT)
$HIGH
{future}(HIGHUSDT)
$MBOX
{future}(MBOXUSDT)
📢 Binance Will Delist COS, D, HIGH, MBOX on 2026-06-19
Binance will delist and cease trading on all spot trading pairs for the following token(s) at 2026-06-19 03:00 (UTC):
- Contentos (COS)
- Dar Open Network (D)
- Highstreet (HIGH)
- MOBOX (MBOX)
$COS
$HIGH
$MBOX
Binance will delist and cease trading on all spot trading pairs for the following token(s) at 2026-06-19 03:00 (UTC):
- Contentos (COS)
- Dar Open Network (D)
- Highstreet (HIGH)
- MOBOX (MBOX)
$COS
$HIGH
$MBOX

75
·
--
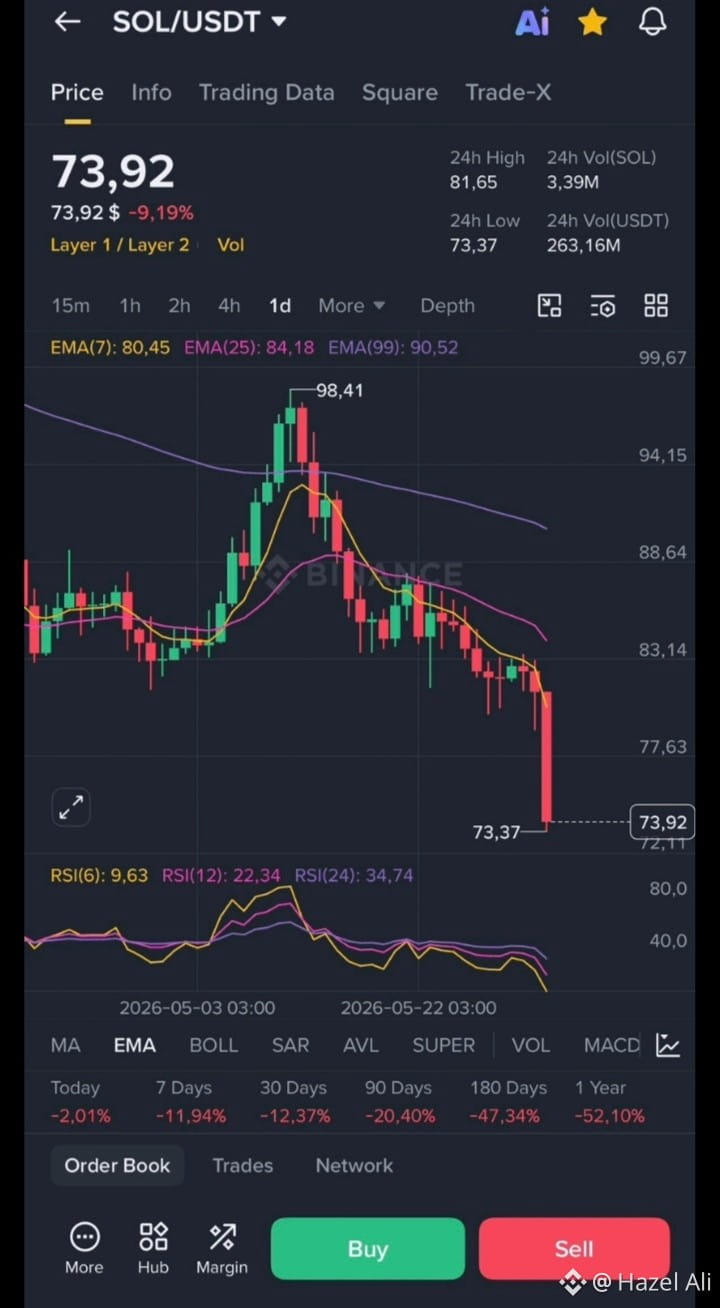
$SOL is extremely oversold, let wait for it's come back
$SOL is extremely oversold, let wait for it's come back
59
·
--
Падение
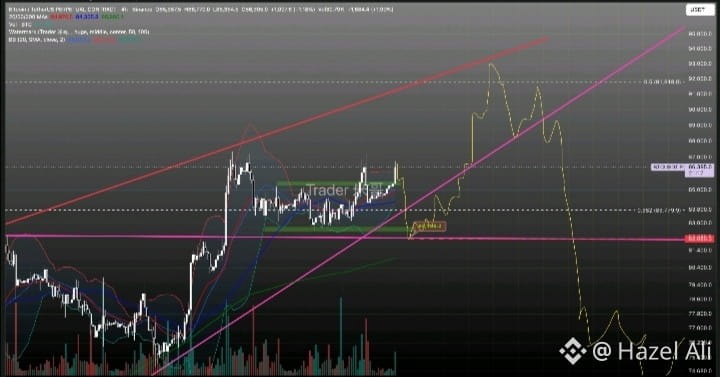
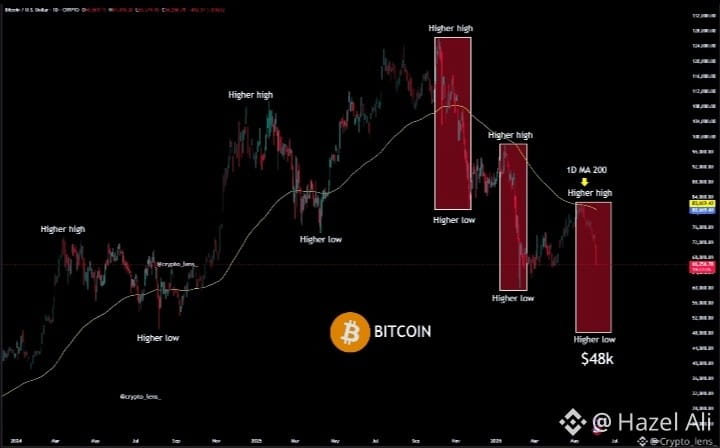
$BTC is following the same bear cycle pattern as before. History is repeating.
If this plays out, $BTC could drop to $48,000 in June.
Save this chart — you'll see why later.
Not financial advice
$BTC is following the same bear cycle pattern as before. History is repeating.
If this plays out, $BTC could drop to $48,000 in June.
Save this chart — you'll see why later.
Not financial advice
If this plays out, $BTC could drop to $48,000 in June.
Save this chart — you'll see why later.
Not financial advice
94
·
--
Падение
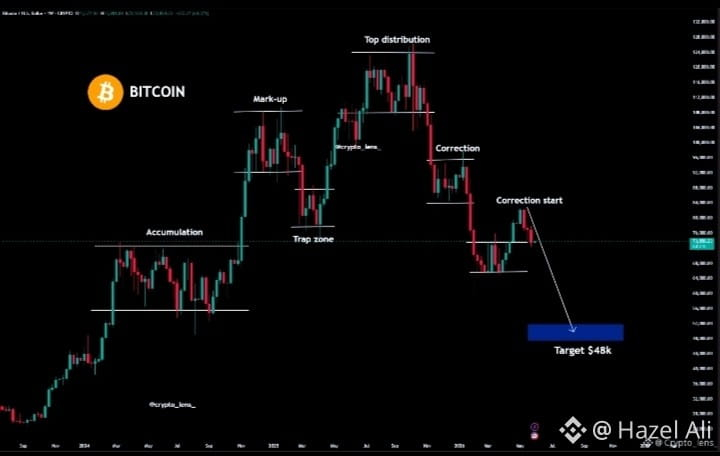
$BTC last fake rally is over. Now the real panic selling begins.
For the record, I was the only one who correctly predicted the $16,000 bottom three years ago and the $126,000 top last October.
If you missed those, don't worry. I'll call the next bottom too.
Turn on notifications. When the real bottom arrives, I'll announce it here publicly — like I always do.
$BTC
$BTC last fake rally is over. Now the real panic selling begins.
For the record, I was the only one who correctly predicted the $16,000 bottom three years ago and the $126,000 top last October.
If you missed those, don't worry. I'll call the next bottom too.
Turn on notifications. When the real bottom arrives, I'll announce it here publicly — like I always do.
$BTC
For the record, I was the only one who correctly predicted the $16,000 bottom three years ago and the $126,000 top last October.
If you missed those, don't worry. I'll call the next bottom too.
Turn on notifications. When the real bottom arrives, I'll announce it here publicly — like I always do.
$BTC
114
·
--
Падение
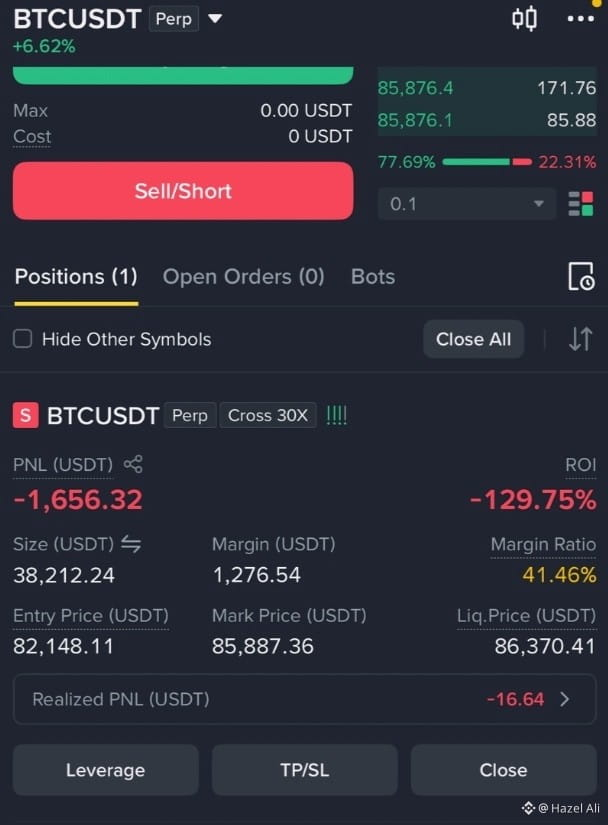
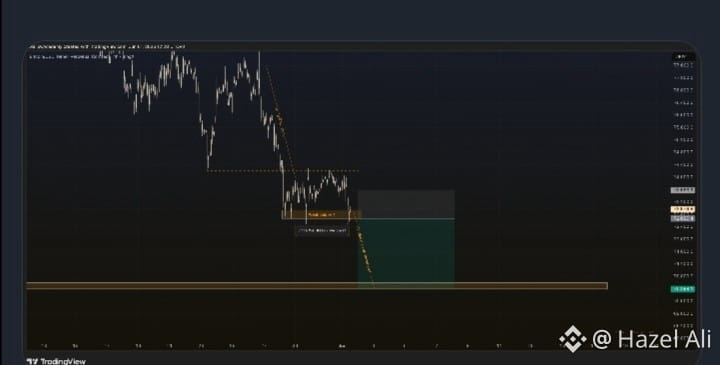
$BTC started the week with strong downside pressure, setting up a good momentum opportunity for us.
After the initial drop, price made a small correction — and what we're now seeing could be our favorite pattern: a failed double bottom.
We're waiting for a break of that support level. Once it breaks, we go short!
$BTC started the week with strong downside pressure, setting up a good momentum opportunity for us.
After the initial drop, price made a small correction — and what we're now seeing could be our favorite pattern: a failed double bottom.
We're waiting for a break of that support level. Once it breaks, we go short!
After the initial drop, price made a small correction — and what we're now seeing could be our favorite pattern: a failed double bottom.
We're waiting for a break of that support level. Once it breaks, we go short!
65
·
--
$BNB surged 12% on US-Iran optimism, while $BTC ETFs saw $1.42B in outflows, dragging $BTC to ~$72,500. Ethereum fell below $2,000. The UK sanctioned crypto exchange HTX over Russia ties. Coinbase launched regulated crypto futures in the US, and hackers stole $293M from KelpDAO
$BNB surged 12% on US-Iran optimism, while $BTC ETFs saw $1.42B in outflows, dragging $BTC to ~$72,500. Ethereum fell below $2,000. The UK sanctioned crypto exchange HTX over Russia ties. Coinbase launched regulated crypto futures in the US, and hackers stole $293M from KelpDAO
95
·
--
JPMorgan: DeFi Bridge Security Concerns Hinder Institutional Adoption JPMorgan analysts have highlighted that security issues with DeFi bridges are impeding institutional adoption, with eight significant DeFi bridge attacks in 2026 resulting in $328.6 million in losses. This emphasizes the critical need for improved security infrastructure to foster greater mainstream engagement in decentralized finance.$GUA $FIDA
JPMorgan: DeFi Bridge Security Concerns Hinder Institutional Adoption JPMorgan analysts have highlighted that security issues with DeFi bridges are impeding institutional adoption, with eight significant DeFi bridge attacks in 2026 resulting in $328.6 million in losses. This emphasizes the critical need for improved security infrastructure to foster greater mainstream engagement in decentralized finance.$GUA $FIDA
43
·
--
THORChain Exploit Drains $10.7 Million Due to Node Operator THORChain reported that a malicious node operator exploited a GG20 threshold signature flaw, resulting in a loss of approximately $10.7 million from one of its vaults. The platform has released a recovery plan to mitigate the impact and is undertaking steps to prevent future incidents.$ETH $XRP
THORChain Exploit Drains $10.7 Million Due to Node Operator THORChain reported that a malicious node operator exploited a GG20 threshold signature flaw, resulting in a loss of approximately $10.7 million from one of its vaults. The platform has released a recovery plan to mitigate the impact and is undertaking steps to prevent future incidents.$ETH $XRP
64
·
--
Stripe Launches Stablecoin Blockchain Amid Agentic Economy Shift Stripe has introduced a stablecoin-focused blockchain and a protocol for machine-to-machine payments, signaling a major move in the evolving agentic economy and stablecoin utility. This development could significantly impact how digital payments are processed and integrated into broader economic systems.
$BTC
Stripe Launches Stablecoin Blockchain Amid Agentic Economy Shift Stripe has introduced a stablecoin-focused blockchain and a protocol for machine-to-machine payments, signaling a major move in the evolving agentic economy and stablecoin utility. This development could significantly impact how digital payments are processed and integrated into broader economic systems.
$BTC
$BTC
90
·
--
Bitcoin's market capitalization has reached approximately $1.617 trillion, surpassing Tesla's valuation of $1.608 trillion, elevating Bitcoin to the 12th position in global asset market value rankings. This milestone highlights Bitcoin's growing significance in the global financial landscape.$BTC
{spot}(BTCUSDT)
Bitcoin's market capitalization has reached approximately $1.617 trillion, surpassing Tesla's valuation of $1.608 trillion, elevating Bitcoin to the 12th position in global asset market value rankings. This milestone highlights Bitcoin's growing significance in the global financial landscape.$BTC
83
·
--
$RAVE is trying to wake up again, but liquidity is very thin. That's why it fails to hold momentum.
When a coin loses its liquidity, structure, and interest, it's usually dead. RAVE has all these qualities — and it's also one of the biggest projects on the list of scam tokens.
$RAVE is trying to wake up again, but liquidity is very thin. That's why it fails to hold momentum.
When a coin loses its liquidity, structure, and interest, it's usually dead. RAVE has all these qualities — and it's also one of the biggest projects on the list of scam tokens.
When a coin loses its liquidity, structure, and interest, it's usually dead. RAVE has all these qualities — and it's also one of the biggest projects on the list of scam tokens.
49
·
--
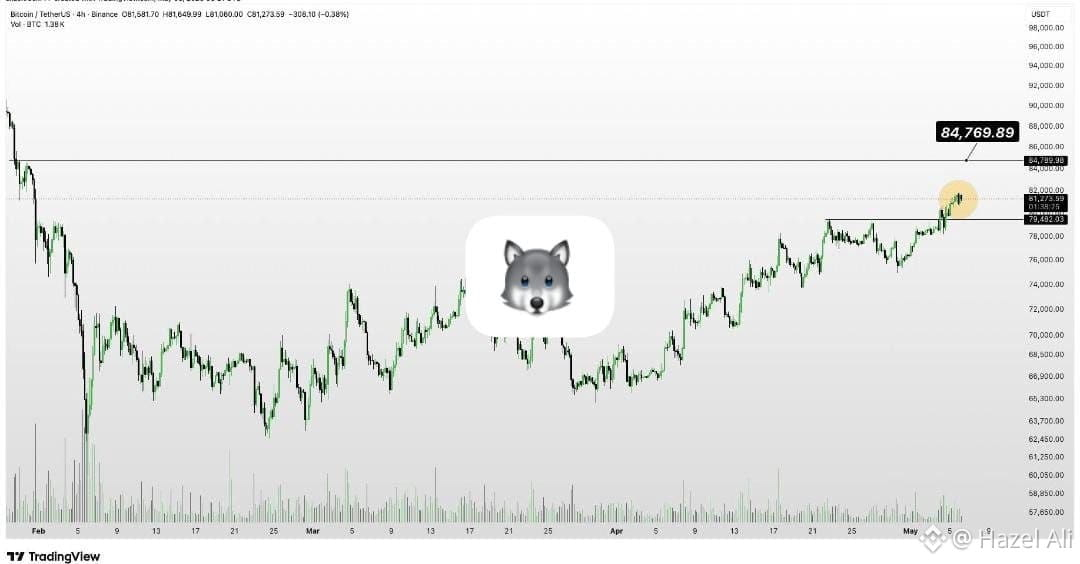
$BTC don’t have any resistance till $84.7K zone 🔥
$BTC don’t have any resistance till $84.7K zone 🔥
67
·
--
Arthur Hayes said at Conference 2026 that as many as 99% of altcoins could eventually become worthless, comparing that kind of shakeout to the normal turnover seen in the S&P 500. He added that even if this happens, it wouldn’t mean the crypto industry is finished.
$BTC
{spot}(BTCUSDT)
$ETH
{spot}(ETHUSDT)
Arthur Hayes said at Conference 2026 that as many as 99% of altcoins could eventually become worthless, comparing that kind of shakeout to the normal turnover seen in the S&P 500. He added that even if this happens, it wouldn’t mean the crypto industry is finished.
$BTC
$ETH
$BTC
$ETH
67
·
--
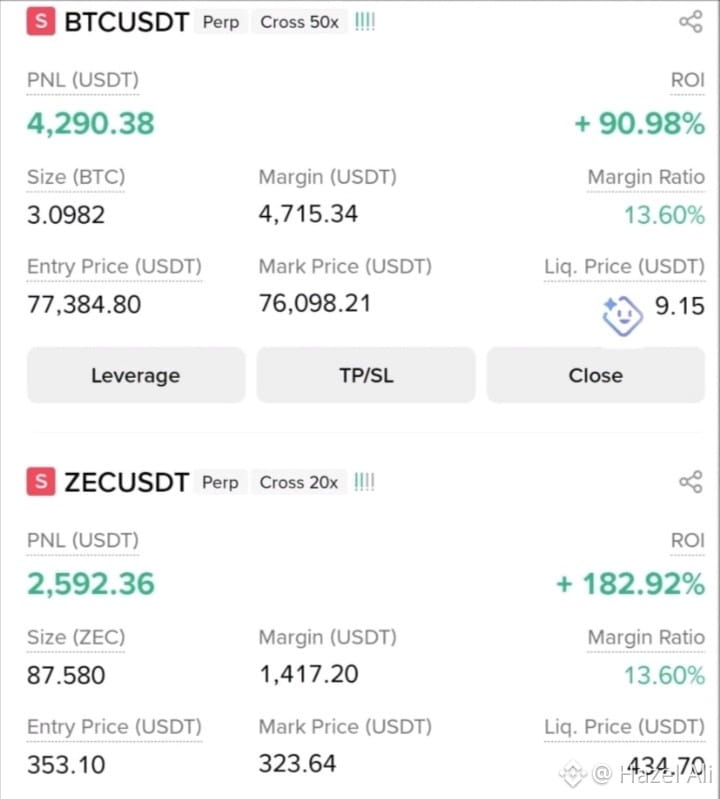
$RAVE trading volume appears organic and is going up. However, there's still a risk of a sudden sell-off that could trap you in the position forever.
Be careful, everyone. Trade responsibly — this moves fast in both directions ✨
Note: Not financial advice.
$RAVE trading volume appears organic and is going up. However, there's still a risk of a sudden sell-off that could trap you in the position forever.
Be careful, everyone. Trade responsibly — this moves fast in both directions ✨
Note: Not financial advice.
Be careful, everyone. Trade responsibly — this moves fast in both directions ✨
Note: Not financial advice.
57
·
--
Падение
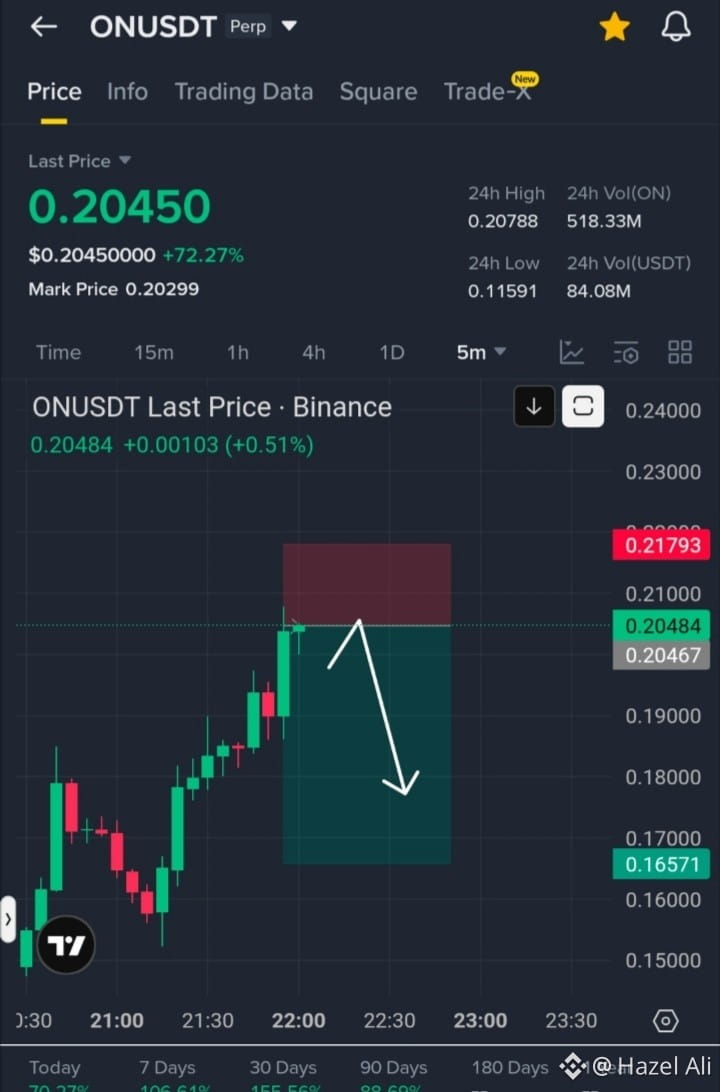
This $ON coin’s volume is dropping, which suggests a potential dump from here. I’m opening a short position on $ON.
Stop Loss: 0.23
Take Profit: 0.16
Trade here: 🔥
This $ON coin’s volume is dropping, which suggests a potential dump from here. I’m opening a short position on $ON .
Stop Loss: 0.23
Take Profit: 0.16
Trade here: 🔥
Stop Loss: 0.23
Take Profit: 0.16
Trade here: 🔥
1
1
257
Войдите, чтобы посмотреть больше материала
Присоединяйтесь к пользователям криптовалют по всему миру на Binance Square
⚡️ Получайте новейшую и полезную информацию о криптоактивах.
💬 Нам доверяет крупнейшая в мире криптобиржа.
👍 Получите достоверные аналитические данные от верифицированных создателей контента.
Эл. почта/номер телефона